Embed Size (px)
Citation preview
International Journal of Research and Review
Vol.8; Issue: 1; January 2021
Website: www.ijrrjournal.com
Research Paper E-ISSN: 2349-9788; P-ISSN: 2454-2237
International Journal of Research and Review (ijrrjournal.com) 546
Vol.8; Issue: 1; January 2021
PDCA - Eight Steps Implementation to Increasing
Productivity in the Production of Compound Tread
Off Road TBR
Lathif Hanafi Fadli1, Rosalendro Eddy Nugroho
2
1Postgraduate Student, Magister Manajemen, Universitas Mercu Buana, Jakarta, Indonesia.
2Postgraduate Lecturer, Magister Manajemen, Universitas Mercu Buana, Jakarta, Indonesia.
Corresponding Author: Lathif Hanafi Fadli
ABSTRACT
This study aims to implement the PDCA-eight
steps to improve the productivity of the Tread
Off Road TBR compound at Tire Manufacturer.
Implementation begins with determining the
theme of improvement with Pareto diagram
tools to select production machines for
improvement. The second step, set the target of
improvement with histogram data. The third
step, use a checksheet to find all possible causes
during the observation and divide it into 4
categories: Man, Machine, Material & Method.
The fourth step is to analyze the root of the
problem using the fishbone diagram. The fifth
and sixth steps, Plan & implement Corrective
Actions using the 5W + 1H method. The
seventh stage, evaluation of the results using the
Pareto diagram for productivity and SPC for
evaluation of compound quality. The Pareto
diagram shows an increase in productivity of
31.15% and quality is maintained with an
average CPK of 2.33. The last stage is to
standardize and determine the next plan. The
results of the implementation in this study
indicate that this implementation can increase
production productivity.
Keywords: PDCA, Productivity, Quality, Pareto,
Compound, Improvement, SPC.
INTRODUCTION
Indonesia is one of the countries that
are members of the Group of Twenty, which
is a forum that aims to gather the economic
strength of developed and developing
countries so that world economic growth is
stable (G20 Foundation, 2017). In 2018,
Indonesia was ranked fourth among the G20
countries with an economic growth of
5.17%. The manufacturing industry sector is
one of the contributors to national economic
growth. According to the Badan Pusat
Statistik Indonesia website, the
manufacturing industry in that year was able
to contribute 20% to the National Gross
Domestic Product (GDP). This is
inseparable from small, medium and large
companies, both state-owned and private
companies that can compete in the era of
globalization so that they will participate in
advancing the nation.
Productivity is one aspect that makes
companies have the opportunity to compete.
With the development of technology and
information, companies are required to
continue to increase productivity and make
efficient use of available resources.
Tire manufacturer is a company
engaged in the automotive sub-sector and its
components. Tire manufacturer produces
various types of tires for vehicles, such as
cars, motorbikes, buses, internal and
industrial tires. Tires consist of 85%
compound and other supporting materials.
Each tire has its own specifications
according to its function and requires a
different compound.
Throughout 2019, the Mixing Center
Plant as a compound producer at Tire
Manufacturer met compound request to the
PCR Plant by 96%, fulfillment of compound

Lathif Hanafi Fadli et.al. PDCA - eight steps implementation to increasing productivity in the production of
compound tread off road TBR.
International Journal of Research and Review (ijrrjournal.com) 547
Vol.8; Issue: 1; January 2021
requests to the MC Tire plant at 95%,
fulfillment of BIAS Plant compound
requests reaching 95%, and fulfill
compound requests to Flap Plant reaches
98%. However, the fulfillment of the
request for compound TBR Plant did not
meet the company's target, which was only
92% of the company's target of 95%. Based
on PPC department data, the lowest TBR
compound productivity is Compound Tread,
with a productivity of 1,220 tons / hour.
To be able to meet the demand for
TBR Plant, it is necessary to improve
productivity. Kaizen is one of the
management strategies to improve
productivity. One of the main steps of
kaizen is continuous improvement, which is
continuous improvement to continuously
optimize the resources used, both in raw
materials, machines, human resources,
processes and the environment. In its
implementation, continuous improvement
has various methods or procedures, one of
which is The Deming Cycle or PDCA (Plan
Do Check Action).
Carrying out continuous
improvement with the PDCA cycle, there
are various methods. One of the basic
methods of implementing the PDCA cycle
is to use the Eight Steps and Seven Tools.
The use of that can help build a framework
of thought and run systematically so that
continuous improvements can be made.
LITERATURE REVIEW
Productivity
Productivity is the relationship
between input and output in a production
system (Heizer, 2014). Productivity
becomes an index that measures the output
of goods or services compared to inputs
consisting of labor, raw materials, energy
and other resources used to produce output
(Stevenson and Chuong, 2014). The general
concept of productivity is a comparison
between output and input per time.
(1)
Productivity consists of two
dimensions, the first is the dimension
related to achievement, quality, quantity and
time. And the second dimension is
efficiency in the effort to realize the use or
implementation of the work.
Productivity and production are
different things, but in a productivity effort
there are components in the form of
production, quality performance and
quantity. Productivity is a combination of
effectiveness and efficiency. So that in
measuring productivity it can be formulated:
Productivity =
(2)
PDCA (Plan, Do, Check, Action)
Continuous improvement or
"Kaizen" is a process of continuous
improvement with the aim of increasing
output, both in terms of quality and
productivity (Santos Barbosa et al, 2019).
With a predetermined time and consistent
process, Kaizen will achieve goals with big
results.
The PDCA (Plan Do Check Action)
cycle is the first step in implementing
Kaizen so that continuous improvement can
be carried out (Darmawan, 2018) . The
PDCA cycle is one of the tools to achieve
quality control and productivity, both in
improving and increasing standards, the
most important concepts in Kaizen. PDCA
consists of four words, namely "Plan, Do,
Check, Act" (Arturo et al, 2018). The
PDCA cycle is a cycle in the problem-
solving process by performing four
repetitive steps that are often used in quality
control
The stages of the PDCA cycle can
be divided into eight (Chauhan et al, 2014).
The “Plan” consists of 5 stages, consisting
of (1) Determining a Theme for
Improvement based on Problem
Identification. (2) Setting Improvement
Targets. (3) Seeking All Possible Causes.
(4) Analyzing the Root Cause of the
Problem. (5) Planning Corrective Actions.
Lathif Hanafi Fadli et.al. PDCA - eight steps implementation to increasing productivity in the production of
compound tread off road TBR.
International Journal of Research and Review (ijrrjournal.com) 548
Vol.8; Issue: 1; January 2021
The” Do” stage is (6) Implement
Improvement. The “Check” stage is (7)
Evaluation of Results. And the last stage is
“Action” which consists of steps (8)
Standardization and Further Plans.
The eight-step PDCA cycle
implementation uses seven tools to simplify
implementation at each step. The seven
tools referred to are (1) scatter diagrams, (2)
Checksheets, (3) Histograms, (4) Pareto, (5)
Causal diagrams, (6) Control Charts, (7)
flow charts.
Step 1 Problem Identification and Theme
Determination
Identification begins with analyzing
each element using the SIPOC diagram:
Supplier-Input-Process-Output-Customers.
Problems will be raised as a theme, themes
are matters relating to quality and
productivity issues that exist in the
organization or company. Determining the
theme is both related to and in line with
management policies or targets and is
sustainable with supporting data. To choose
the priority of the fault, the tool that will be
used is the Pareto diagram. Heizer and
Render (2014) say that the Pareto Diagram
(Pareto Analysis) is a method of error, the
problem of defects to help focus attention
on problem solving efforts.
Step 2 Setting Targets
The goals of the PDCA activities
should be set with targets. Targets consist of
SMART criteria, Targets must be Specific,
Measurable, Achievable, have clear
Reasons and within a specified Timeframe.
Step 3 Look for All Possible Causes
The search for causes begins with
data collection, data analysis, observation
and documentation of possible causes of
problems in existing conditions. The results
of data collection and processing and
observations can be grouped into
controllable factors known as 4M: Man,
Method, Material, Machine. The tool used
in this step is a checksheet during field
observations.
Step 4 Analyze the Root Cause of the
Problem
Problems can be identified because
they cause symptoms, but these symptoms
are not the cause. Symptoms arise for a
reason. Using the "why" method which is
repeated to the root of the problem, so that
the solution to the problem that will be
taken can be right on target and have a big
effect on the results of the improvement.
The tool used in finding the root of the
problem is a fish bone diagram. Each
fishbone in the diagram represents a
possible source of error. This diagram is
useful for showing the main factors that
affect quality and have an effect on the
problem to be improved. (Heizer dan
Render, 2014)
Step 5 Planning Corrective Action
Determination of steps in the
improvement planning based on the results
of the root cause analysis that has been
obtained. Elimination of root causes is
focused on the scope of responsibility of the
department in the organization (controllable
causes) and it is better to be able to
anticipate uncontrollable but predictable
causes. Complete corrective action planning
can use the 5W2H1T table. The 5W2H1T
table consists of What, Why, When, Who,
Where, How, How Much & Target.
Step 6 Implement Improvement
Implementing improvements
requires a commitment from the
organization or company to be able to
eliminate the root of the problem identified
in the previous step. Recording the
implementation of improvements are also
conducted with respect to the technical and
systematic improvement, the results
achieved, and the person in charge of
implementation of improvements. So that
identification of the causes of deviations if
they do not reach the target will be easily
detected and corrected.

Lathif Hanafi Fadli et.al. PDCA - eight steps implementation to increasing productivity in the production of
compound tread off road TBR.
International Journal of Research and Review (ijrrjournal.com) 549
Vol.8; Issue: 1; January 2021
Step 7 Evaluating the Improvement
Results
After pelaksanaann improvement
over a certain period, conducted the review
and improvement of evaluation of the
results of the implementation of the targets
set. The tool used for quality evaluation is a
control chart or SPC, while for achieving
productivity targets using a pareto diagram.
According to Stevenson and Chuong (2014),
a control chart is a tool used to monitor and
evaluate an activity / process running well
in accordance with the expected quality
graphically.
Step 8 Standardize Improvement and
Determine Next Improvement Plan
Standardization aims to maintain and
control the results of improvements.
Standardization also aims so that mistakes
do not repeat themselves or cause the same
problem. The determination of the next
theme can be related to the previous theme
which has not been effective and efficient,
or it can start with new quality problems
according to the needs of the organization or
company.
RESEARCH METHODS
The type of research that will be
used is quantitative research and the
research design used in this research is
descriptive. This research variable consists
of several dimensions for the causative
factors in conducting this research and in
terms of indicators to determine the items to
be improved.
Table 1 Operational Definition
Research variable Dimensions Indicator Data source
Productivity Compound Tread Off
Road TBR
Product productivity Number of products with time used in the production process (Tonnes / Hour)
Production Report for PPC (Production Planning Control) Department &
Technical Departments
Product Finish Total production of Compound Tread Off Road TBR (kg)
PPC (Production Planning Control) Department Production Report
Cause Factors: Man,
Material, Machine,
Method
Human Error, Material Condition,
Machine Improvement, Parameter Setting,
Training, Process Improvement
Reports and interviews of QC (Quality
Control) department, Technical
Department & Engineering Department
Quality Compound
Tread Off Road TBR
Product quality Physical Properties Compound (Company
Standard
Technical Department & Quality
Assurance Department
Source : Tire Manufacturer
In Table 1, it describes the variables
consisting of several dimensions for the
causative factors in conducting this research
and in terms of indicators to find out which
items will be improved. In this study, the
subject population who will implement the
PDCA-Eight Steps is the employees who
make policy and implement improvements
in the production process. And the
population of the object of this research is
all compound products produced by the
Plant Mixing Center at Tire Manufacturer.
Samples from the subjects of this
study are the entire population who carry
out, so it is called saturated samples. As for
the sample object in this study, the product
will be applied by PDCA-Eight steps using
purposive sampling with the criteria (1)
Compound Tread Off TBR produced on the
most machine production lines with
production data during the period January
2019 to August 2020. (2) Compound Tread
Off TBR which is produced under the
supervision of the technical department and
the Quality Control department.
The data collection method used in
this research is using primary and secondary
data. Primary data obtained from the main
source, namely by conducting field studies
to companies or observative directly. The
data needed to help the analysis process by
interviewing operators in each existing
process by looking at man, machine,
material & method factors. Primary data
was also obtained through discussions,
namely exchanging thoughts, ideas and
opinions from discussion participants with
the Technical Dept. QC Dept, Production
Dept., Engineering Dept. relating to data
and information required in the problem
solving process. Secondary data used in this
study are divided into 2. (1) Document

Lathif Hanafi Fadli et.al. PDCA - eight steps implementation to increasing productivity in the production of
compound tread off road TBR.
International Journal of Research and Review (ijrrjournal.com) 550
Vol.8; Issue: 1; January 2021
Study: Document study is carried out by
collecting data sourced from documents
from the Production, Quality Control,
Technical, Engineering, and Laboratory
departments regarding quality standards of
production output and production machine
processes. (2) Study / Literature Study: A
literature study is conducted to obtain data
collected by experts or other parties by
studying books, articles and other data
sources.
RESULT AND DISCUSSION
Before starting to improve
productivity, it is necessary to identify using
the SIPOC (Supplier, Input, Process, Output
& Customer) diagram in order to identify
each element in the PDCA implementation
project - Eight Steps before running.
Table 2 Diagram of SIPOC Production Process for Compound Off Road Tread TBR
Supplier Input Process Output Customer
Warehouse Department Chemical Raw Materials
Mixing
Compound Off Road Tread TBR
TBR Plant
Natural Rubber
Filler
Utility Department Electricity
Steam
Production Department Mixing Machines
Operator
Source: Results of secondary data processing from Tire Manufacturer (2020)
The SIPOC diagram in table 2
illustrates the production process and
displays the elements involved in the
production process. The following is the
SIPOC table for the TBR Compound Off
Road Tread Production Process.
Plan (Planning)
(1) Determine the Theme of Improvement
based on Problem Identification :
Compound Tread Off Road TBR throughout
2018 was produced as many as 1177
batches. Where in the production process
using several machines, including MCG 4,
MCG 6, MCG 8, MCG 10, MCG 11, &
MCG 15. While in the Final Batch process,
using MCA 2 and MCA 3 machines. To be
more specific in improving productivity,
then use the Pareto diagram to see the
priority of the machine to be improved.
Source: Results of secondary data processing from Tire Manufacturer (2020)
Figure 1. Pareto Diagram of Compound Production Machine
Based on the results of the analysis
using the Pareto diagram in Figure 1, the
compound Tread Off Road TBR at
Masterbatch 1 to Masterbatch 4 stages is
mostly produced in MCG10 machines, and
at the Final Batch stage it is produced the

Lathif Hanafi Fadli et.al. PDCA - eight steps implementation to increasing productivity in the production of
compound tread off road TBR.
International Journal of Research and Review (ijrrjournal.com) 551
Vol.8; Issue: 1; January 2021
most in MCA 3. So the theme of
improvement in the implementation of
PDCA - Eight The step is "Increasing the
Productivity of Compound Tread Off Road
TBR on production machines Masterbatch 1
- Masterbatch 4 in MCG 10 and Final Batch
in MCA 3".
(2) Setting Improvement Targets :
Improvement target refers to compounds
that have the same number of production
processes but have the highest productivity.
The target for improving the productivity of
the Tread Off Road TBR compound refers
to the Rim Chafter compound of 1.596 tons
/ hour or an increase of 30.85%. The target
is then submitted to the mixing technical
manager as the improvement team's advisor
for approval.
(3) Seeking All Possible Causes. The
causes that may decrease productivity are
divided into 4, which are known as 4M,
namely Machine, Method, Material, & Man.
Team Improvement analyzes by means of
direct observation in the field and observing
the data obtained from the machine to know
the impact of each factor that makes the
productivity of the Tread Off Road TBR
compound lower than the other compounds.
From the results of direct observation in the
field and data obtained from the machine,
the following results were obtained.
Machine (Machine). Analysis of existing
conditions is carried out by visiting the
production process field to see the actual
condition of the machine and compared with
the specifications. The review is carried out
using a Check Sheet so that the
specifications can be recorded in detail and
nothing is missed.
Table 3 Results of field observations on the production process
Parameter Masterbatch 1 Masterbatch 2
Specification Actual Status Specification Actual Status
Rotor Speed 40 - 50 RPM 40 - 50 RPM OK 30-35 RPM 30-35 RPM OK
Ram Pressure 45 ± 7 N / cm² 43 N / cm² OK 45 ± 7 N / cm² 43 N / cm² OK
Mixing Time 40 '' - 125 ℃ - 165 ℃ 40 '' - 125 ℃ - 165 ℃ OK 40 '' - 160 ℃ 40 '' - 160 ℃ OK
Dump Temp. 165 + 10 ℃ 166 won OK 160 + 10 ℃ 167 ℃ OK
Cooling Chamber 40-60 ℃ 51 ℃ OK 40-60 53 ℃ OK
Parameter Masterbatch 3 Masterbatch 4
Specification Actual Status Specification Actual Status
Rotor Speed 25 - 35 RPM 25 - 35 RPM OK 25-30 RPM 25-30 RPM OK
Ram Pressure 45 ± 7 N / cm² 43 N / cm² OK 45 ± 7 N / cm² 43 N / cm² OK
Mixing Time 30 '' - 125 ℃ - 145 ℃ 30 '' - 125 ℃ - 145 ℃ OK 40 '' - 145 ℃ 40 '' - 145 ℃ OK
Dump Temp. 145 + 10 ℃ 147 ℃ OK 145 + 10 ℃ 146 ℃ OK
Cooling Chamber 40-60 ℃ 52 ℃ OK 40-60 ℃ 53 ℃ OK
Parameter Final Batch
Specification Actual Status
Rotor Speed 20 RPM 20 RPM OK
Ram Pressure 45 ± 7 N / cm² 47 N / cm² OK
Mixing Time 60 '' - 60 '' - 110 ℃ 60 '' - 60 '' - 110 ℃ OK
Dump Temp. 110 + 10 ℃ 113 ℃ OK
Cooling Chamber 40-60 ℃ 56 ℃ OK
Source: Primary data processing results (2020)
Table 3 is the check sheet results
from field observations. In the speed
parameter checksheet, the specifications
require that the machine is at RPM 40-50 on
masterbatch 1, RPM 30-35 on masterbatch
2, RPM 25-35 on masterbatch 3, RPM 25-
30 on masterbatch 4 and RPM 20 on the
finalbatch. From the observations it was
found that the machine can meet all
specifications and was given OK status.
Then in the Ram Pressure parameter,
from masterbatch 1 to 4 and the final batch
specifications require that Ram Pressure be
able to press 45 N / cm² with a lower limit
pressure tolerance of 38 N / cm² and an
upper limit pressure tolerance of 52 N / cm².
On masterbatch 1 to masterbatch 4, Ram
Pressure at the time of observation showed
the number 43 N / cm², indicating that the
machine's Ram Pressure still met

Lathif Hanafi Fadli et.al. PDCA - eight steps implementation to increasing productivity in the production of
compound tread off road TBR.
International Journal of Research and Review (ijrrjournal.com) 552
Vol.8; Issue: 1; January 2021
specifications, so it was marked OK on the
status.
In the mixing time machine
parameter, the comparison between the
mixing time process specification and the
actual process that occurs on the machine
during production shows no difference, both
in masterbatch 1 to masterbatch 4 and in the
final batch. So that the status label is written
OK.
In the Dump Temperature
parameter, the specifications for
masterbatch 1 are 165 + 10 ℃ and when the
actual observation shows the temperature is
166 oC, then the observation checksheet
status is given an OK mark. In masterbatch
2, the specification shows 160 + 10 ℃ and
when the observation is at 167 ℃, because
the temperature value is still within
tolerance, it is declared OK. In masterbatch
3 and 4, the production process specification
requires that the dump temperature be 145 +
10 ℃. And at the time of field observation,
the masterbatch 3 shows the dump
temperature is 147 ℃ and the mastebatch 4
shows the temperature is 146 ℃. The
temperature is still within specification
tolerance, so it is marked OK on the status
checksheet. In the final batch, the dump
temperature specification is at 110 + 10 ℃,
and at the time of field observation it shows
a temperature of 113 oC and is still within
specification tolerance, so the status on the
checksheet is filled with OK.
In the cooling chamber machine
parameters, masterbatch 1 to masterbatch 4
and the final batch have the same
specifications, which are vulnerable to
temperatures of 40-60 oC. From the
observations, it was found that at
masterbatch 1, the temperature of the
coolong chamber was 51oC, and the
masterbatch 2, 3, 4 and the final batch were
at 53oC, 52
oC, 53
oC, 56
oC, respectively.
From the results of these observations, all
cooling chamber parameters were declared
OK.
From the results of the above
observations, all parameters meet the
predetermined specifications. So that there
is no cause from the machine category that
causes productivity to decrease.
Man (Human)
In the production process for MCG
10 and MCA 3 machines, the APS system -
Automatic Process System is used. Where
the production process from entering the
material and mixing process occurs
automatically, so there is no interference
from the production operator. The
production operator is only tasked with
preparing the material before entering the
machine, making configurations in selecting
the compound process method that has been
provided, and operating the machine by
simply pressing the start button. The
production process will run according to a
predetermined program until the end. If
there are obstacles in material preparation, it
is not included in the production cycle time.
Due to the cycletime of production, a type
of compound is calculated starting from
when the operator presses the start button
(when all the materials are ready) until the
compound is finished processing.
Material
Each type of compound has its own
role in the part of the tire. So that in
production, each compound also consists of
various types of materials that vary
depending on its function. This can also
affect the production process, where the
compound material for Tread Off Road
TBR consists of 100% natural rubber,
carbon and other supporting chemicals.
Where in the compound production process
with a composition of 100% natural rubber,
it takes a longer process than synthetic
rubber.
Method (Method)
In the Tread Off Road TBR
compound production process, there is a
repetitive process, namely Masterbatch 2
and Masterbatch 4. Where in that process,
there is a process that is only carried out by
the mixing process without adding any
material. It is intended that the process of

Lathif Hanafi Fadli et.al. PDCA - eight steps implementation to increasing productivity in the production of
compound tread off road TBR.
International Journal of Research and Review (ijrrjournal.com) 553
Vol.8; Issue: 1; January 2021
mixing natural rubber with filler is
maximized, both carbon and silica. But
ideally, this should be done after the
composition of the filer and rubber material
has been mixed. In Masterbatch 2, it can be
said that it is not optimal because in
Masterbatch 3 the production process still
adds fillers - silica and chemicals to the
compound. In masterbatch 4, the mixing
process was also carried out without adding
any material. This is because the silica
mixing in the Masterbatch 3 stage is not
optimal. Besides that, The remill process in
Masterbatch 4 also helps the Final Batch
process for better mixing of chemicals. Both
processes make the productivity of the
Tread Off Road TBR compound low,
because it requires a process that takes
longer. Table 4 describes the production
process and the order of the materials used.
Table 4. Stages of the compound production process for Tread
Off Road TBR and Material used
Process Stages Material
Masterbatch 1 Natural Rubber
Carbon Black
Chemical Package MB1
Masterbatch 2 Product Masterbatch 1
Masterbatch 3 Product Masterbatch 2
Silica
Chemical Package MB3
Masterbatch 4 Product Masterbatch 3
Final Batch Product Masterbatch 4
Chemical Package Final Batch
Source: Results of secondary data processing (2020)
(4) Analyzing the Root Cause of the
Problem: Search for the root cause of the
problem can be done using a cause - effect
diagram (Fishbone Chart Diagram) by using
the question "why" until the root of the
problem is found.
Source: Results of primary data processing (2020)
Figure 2. Fishbone diagram of low TBR Compound Tread Off Road productivity
The fishbone diagram is formed
based on an analysis of existing conditions
and is shaped to resemble a fish bone to find
out the root cause from the problem. From
the fishbone diagram in Figure 3, it is found
that the root cause of the low TBR Tread
Off Road compound productivity has 3 root
problems. First, in the MB1 process the use
of engine speed is too fast, the carbon
injection process is at once, the dump temp
is still low and can still be maximized.
Second, in the MB3 process, the engine
speed is too high & the dump temperature
can still be maximized and the third is the
use of natural rubber with a 100%
composition.
(5) Planning Corrective Actions: Solutions
are sought for the main problems found at
the stage of analyzing the root cause of the
problem using the 5W + 1H tool which is
described as follows:

Lathif Hanafi Fadli et.al. PDCA - eight steps implementation to increasing productivity in the production of
compound tread off road TBR.
International Journal of Research and Review (ijrrjournal.com) 554
Vol.8; Issue: 1; January 2021
Table 5 Corrective Action Planning
No. What Why How Where, When,
Who
Root of the problem Improvement Plan Cause Improvement
Activities
PIC, Place,
Time
1 In MB1, the use of engine RPM is too fast, carbon
injection process at once,
dump temp. Can still be maximized
Optimizing the Masterbatch 1 process and eliminating the
remill process stage
(Masterbatch 2)
The mixing that was not optimal resulted in
an additional process in
Masterbatch 2
Modify the Masterbatch 1
process & validate
the final product
Technical Staff Dept. MCG 10,
MCA 3, 21 June
2019
2 On MB3, Engine RPM Too
high & temperature dump
can still be maximized
Optimizing the Masterbatch
3 & Final Batch process and
eliminating the remill process stage (Masterbatch
4)
The mixing that is not
optimal has resulted in
an additional process in Masterbatch 4
Modify the
Masterbatch 3
process & validate the final product
Technical Staff
Dept. MCG 10,
MCA 3, 21 June 2019
Source: Primary data processing results (2020)
Table 5 describes the improvement
plan using the details of 5W1H. The root of
the problem in the material factor,which is
the use of 100% natural rubber, no
corrective action is taken. This is because
the replacement of natural rubber material
will have a significant impact on the tire
quality products.
Do (Implementation)
(6) Implement the improvements: The
improvement will be carried out according
to the plan. The first modification is to
change the production process at the
Masterbatch 1 stage with changes in Carbon
Injection divided into 2, changing the speed
from 50-40 RPM to 45 RPM, Swipe Ram
Up Down Movement to 3x and eliminating
the Maserbatch 2 process.Then doing a
production test with process modification
until the Final Batch stage. Then the final
batch product will be tested for the quality
of the Physical Properties Compound. The
second modification is combining the first
modification process and combining by
making changes to the Masterbatch 3 and
Final Batch processes with changes in the
Speed MB 3 rotor from 35-25 RPM to 45-
20 RPM, Changing the Final MB Speed
from 20 RPM to 20-18 RPM, Changes
Dump Temperature MB3 from 145oC to
155oC, changing Final Dump Temperature
MB from 110oC to 115
oC, changing Swipe
Ram Up Down Final MB to three times and
eliminating the masterbatch process 4. Then
the Compound Tread Off Road TBR was
produced again with that process. Then the
products from the Final Batch will be tested
for the quality of the Physical Properties
Compound. Comparasion the modification
are described in detail in tabel 6.
Tabel 6. comparison between the Regular process, Modification 1 and Modification 2
Parameter Masterbatch 1 Process Spesification Masterbatch 2 Process Spesification
Regular Modification 1 Modification 2 Regular Modification 1 Modification 2
Rotor Speed 40 - 50 RPM 45 RPM 45 RPM 30 - 35 RPM Skip the
process of Masterbatch 2
Skip the process
of Masterbatch 2 Ram Pressure 45±7 N/cm² 45±7 N/cm² 45±7 N/cm² 45±7 N/cm²
Mixing Time 40'' - 125℃ - 165 ℃
40'' - 35'' - 35'' – 165℃
40'' - 35'' - 35'' – 165℃
40'' - 160 ℃
Dump Temp. 165 + 10 ℃ 165 + 10 ℃ 165 + 10 ℃ 160 + 10 ℃
Carbon Inject All at once divided into two
stages
divided into two
stages
No Carbon
Ram Press
Swipe
2x 3x 3x 1x
Parameter Masterbatch 3 Process Spesification Masterbatch 4 Process Spesification
Regular Modification 1 Modification 2 Regular Modification 1 Modification 2
Rotor Speed 25 - 35 RPM 25 - 35 RPM 45 - 20 RPM 25-30 RPM 25-30 RPM Skip the process of
Masterbatch 4 Ram Pressure 45±7 N/cm² 45±7 N/cm² 45±7 N/cm² 45±7 N/cm² 45±7 N/cm²
Mixing Time 30'' - 125℃ -
145 ℃
30'' - 125℃ -
145 ℃
40'' – 40'' / 140℃ -
155 ℃
40'' - 145 ℃ 40'' - 145 ℃
Dump Temp. 145 + 10 ℃ 145 + 10 ℃ 165 + 10 ℃ 145 + 10 ℃ 145 + 10 ℃
Ram Press
Swipe
2x 2x 3x 1x 1x

Lathif Hanafi Fadli et.al. PDCA - eight steps implementation to increasing productivity in the production of
compound tread off road TBR.
International Journal of Research and Review (ijrrjournal.com) 555
Vol.8; Issue: 1; January 2021
Table 6 continued
Parameter Final Batch Process Spesification
Regular Modification 1 Modification 2
Rotor Speed 20 RPM 20 RPM 20-18 RPM
Ram Pressure 45±7 N/cm² 45±7 N/cm² 45±7 N/cm²
Mixing Time 60'' - 60'' - 110 ℃ 60'' - 60'' - 110 ℃ 40'' - 40'' - 30'' - 115 ℃
Dump Temp. 110 + 10 ℃ 110 + 10 ℃ 115 + 10 ℃
Ram Press Swipe 2x 2x 3x
Source: Primary data processing results (2020)
The systematics and implementation of productivity improvements are described in
detail in table 7.
Table 7 Technical Implementation of Compound Tread Off Road TBR Productivity Improvement
Root Cause Improvement Technical
Improvement
Systematics of Improvement PIC, Place,
Time
The process of
mixing Carbon
with rubber in Masterbatch 1 has
not been optimal
Optimizing the
Masterbatch 1 process
and eliminating the remill process stage
(Masterbatch 2)
Modify the process
on Masterbatch 1 and
proceed to Masterbatch 3, 4 &
Final Batch.
Perform a production scale test
Observing the process & sampling
Conduct quality test for compound products Perform advanced validation for modified
processes.
Technical
Staff Dept.
MCG10 & MCA3 June
2019
The mixing process of Silica with MB2
product in
Masterbatch 3 is not optimal
Optimizing the Masterbatch 3 & Final
Batch process and
eliminating the remill process stage
(Masterbatch 4)
Modify the process on Masterbatch 3 &
Final Batch
Test To test the production scale Observing the process & sampling
Conduct quality test for compound products
Perform advanced validation for modified processes.
Technical Staff
Dept.MCG10
& MCA3 July 2019
Source: Primary data processing results (2020)
The improvement is carried out by
means of the improvement team from the
technical department to test the production
process directly. To be able to know the
comparison of productivity & quality of the
resulting compound, the improvement team
conducted a production process test using
the regular production process, modification
1 and modification 2 at a time, so as to
minimize the variables that affect product
results. Each production process consists of
6 batches of Final Mixing which are then
reviewed for productivity and quality.
From the results of the production
test between the regular process,
modification 1 and modification 2, the
productivity data for each process are
obtained as follows:
Figure 4. Pareto diagram of productivity improvement result, Source: Results of secondary data processing (2020)
Figure 4 illustrates the comparison
of the results of the production test using the
regular process, the productivity is 1.22
tonnes / hour, while the production using
modification process 1 increases the
productivity to 1.44 tonnes / hour, and for
production using modification process 2 the
productivity reaches 1.6 tonnes / hour. The
target of productivity improvement is 1.596
tons / hour, so that the modification process
2 meets the predetermined target.
Compound product must meet the standards

Lathif Hanafi Fadli et.al. PDCA - eight steps implementation to increasing productivity in the production of
compound tread off road TBR.
International Journal of Research and Review (ijrrjournal.com) 556
Vol.8; Issue: 1; January 2021
of the Physical Properties Compound which
consists of Hardness, Modulus 300,
Elongation Break and Specific gravity. SPC
is used to evaluate the quality of the three
processes as shown in Figure 5.
Source: Results of secondary data processing (2020)
Figure 5. Comparison of the quality of the compound
From the SPC graph in Figure 5
shows that all processes produce products
that meet standards. From the calculation of
Cpk on SPC, it was found that the compund
produced by modification process 2 had a
higher average value (2.4) compared to the
regular process (1.6) and modification
process 1 (2.1). Based on quality and
productivity considerations, modification
process 2 was chosen to be the solution to
the problem of low compound tread
productivity. The modification process 2 is
then applied to the production process to
undergo production scale trials.
Check (Implementation Evaluation)
(7) Evaluating the results of the
improvements: Evaluation of the results of
repairs is done by comparing the conditions
before and after improvement, by reviewing
the productivity of compound making and
the quality of the compound. The following
is a graph of the comparison histogram
productivity before and after the
improvement.
Source: Results of secondary data processing (2020)
Figure 6. Productivity comparison after modification process 2
is implemented
From Figure 6, the graph illustrates
that the productivity of the Tread Off Road
TBR compound reaches 1,600 tons / hour.
This indicates that productivity has
increased by 0.1600 tons / hour or an
increase of 31.15% which was originally
only 1.220 tons / hour. The increase in

Lathif Hanafi Fadli et.al. PDCA - eight steps implementation to increasing productivity in the production of
compound tread off road TBR.
International Journal of Research and Review (ijrrjournal.com) 557
Vol.8; Issue: 1; January 2021
productivity has exceeded the target of
improvement, which is 1.596 tons / hour. In
terms of quality, comparison evaluation
between before and after using control
charts.
Source: Results of secondary data processing (2020)
Figure 7. Quality Compound before and after improvement use modification 2 implemented
Table 7 Description of Quality Comparison Statistics Before (Bef) and After (Aft) Repair
STATISTICAL DESCRIPTION Hardness Modulus EB TS SPGR
Bef Aft Bef Aft Bef Aft Bef Aft Bef Aft
Number of samples (n) 2 2 2 2 2 2 2 2 2 2
Number of sub groups (N) 11 24 11 24 11 24 11 24 11 24
3. Lower Std. Limit 59 59 91 91 510 510 245 245 1,122 1,122
4. Upper Std. Limit 65 65 123 123 0 0 0 0 1,142 1,142
5. Average ( ) 62.01 62.89 104.73 102.92 600.01 646.26 260.81 279.03 1.13 1.13
6. Maximum 63.4 64.3 116.0 116.0 639.9 680.0 281.0 303.0 1,1 1,1
7. Minimum 60.5 60.0 94.5 93.5 562.8 608.0 246.0 252.5 1,1 1,1
8. ange Average ( ) 0.62 0.65 2.91 4.17 16.35 9.98 6.28 6.55 0.00 0.00
. td. Dev. ( / d2) 0.55 0.58 2.58 3.69 14.50 8.85 5,57 5.81 0.00 0.00
td. Dev. (σ n - 1) 0.93 1.09 5,52 5.46 19.96 18.04 8.93 11.99 0.00 0.00
Capability Index (Cp) 1.82 1.72 2.07 1.44 0.00 0.00 0.00 0.00 1.88 2.20
CPU 1.82 1.21 2.36 1.81 0.00 0.00 0.00 0.00 2.87 2.63
Cpl 1.83 2.24 1.77 1.08 2.07 5.13 0.95 1.95 0.89 1.77
Process Capability (Cpk) 1.82 1.21 1.77 1.08 2.07 5.13 0.95 1.95 0.89 1.77
Average Cpk Before (Bef) (1.82 + 1.77 +2.07 + 0.95 + 0.89): 5 = 1.50
Average Cpk After (Aft) (1.21 + 1.77 + 5.13 + 1.95 + 1.77): 5 = 2.23
C + A2 63.17 64.12 110.20 110.75 630.76 665.02 272.62 291.35 1.13 1.13
C 62.01 62.89 104.73 102.92 600.01 646.26 260.81 279.03 1.13 1.13
C - A2 60.85 61.66 99.26 95.08 569.27 627.50 249.00 266.71 1.12 1.13
Outspec (NG) 0 0 0 0 0 0 0 0 0 0
% NG 0.00% 0.00% 0.00% 0.00% 0.00% 0.00% 0.00% 0.00% 0.00% 0.00%
Source: Results of secondary data processing (2020)
The SPC graph in Figure 7 shows
the quality of the TBR Tread Off Road
compound after improvement is not much
different from before the improvement. This
indicates that the implementation of
productivity improvements does not change
the quality of the Tread Off Road TBR
compound product. The control limit line is

Lathif Hanafi Fadli et.al. PDCA - eight steps implementation to increasing productivity in the production of
compound tread off road TBR.
International Journal of Research and Review (ijrrjournal.com) 558
Vol.8; Issue: 1; January 2021
still within the company standard, which
indicates that even though the results are
unstable, they are still in the company
standard. This can also be seen from table 7
where the mean value of Cpk from the five
test items of the product produced after
improvement is greater (2.23 points) than
before the improvement (1.5 point). From
these results, it can be said that the process
of improvement results in products that are
more in accordance with the standards given
by the company.
With the optimization of the process
in the compound production of Tread Off
Road TBR from 5 production stages to 3
production stages, there is a change in
production costs. Due to the reduced stages,
the production costs are also reduced. Based
on calculations from the PPIC (Production
Planning & Inventory Control) department,
the improvements that have been made can
save production overhead costs by 41.06%.
Act (Follow up)
(8) Standardize Solutions & Further
improvement plans: Standardization is
carried out by changing the specification of
the Tread Off Road TBR compound
production process using 5 stages in each
machine, with the production process of
Tread Off Road TBR compound
modification using 3 stages. The
implementation of improvements is stated in
the technical department document with a
change in the 5-stage production process
specification with revision number 07 /
01R01 to a 3-stage production process
specification with revision number 07 /
02R02.
Source: Results of secondary data processing (2020)
Figure 8. The six compounds with the lowest productivity
After standardization, the next step
is to plan for further improvements. The
next improvement, referring to the
background related to productivity in figure
6, is to increase the productivity of the BEC
compound which has a productivity of
1.327 tons / hour.
CONCLUSIONS AND SUGGESTIONS
CONCLUSION
Based on the implementation that
has been done, it can be concluded:
1. The factor that causes low productivity
in the Compound Off Road Tread TBR
Plant product at the Mixing Plant is that
there is a production process that has not
been optimal at Masterbatch 1 and
Masterbatch 3 in mixing natural rubber
with filler compound, which causes
additional remill stages in Masterbatch 2
and Masterbatch 4.
2. Implementation of improvements to
increase the productivity of the Off
Road Tread TBR Plant compound at the
Mixing Center Plant using the PDCA-
Eight Steps method running
systematically using 7 tools and
successfully increasing productivity by
Lathif Hanafi Fadli et.al. PDCA - eight steps implementation to increasing productivity in the production of
compound tread off road TBR.
International Journal of Research and Review (ijrrjournal.com) 559
Vol.8; Issue: 1; January 2021
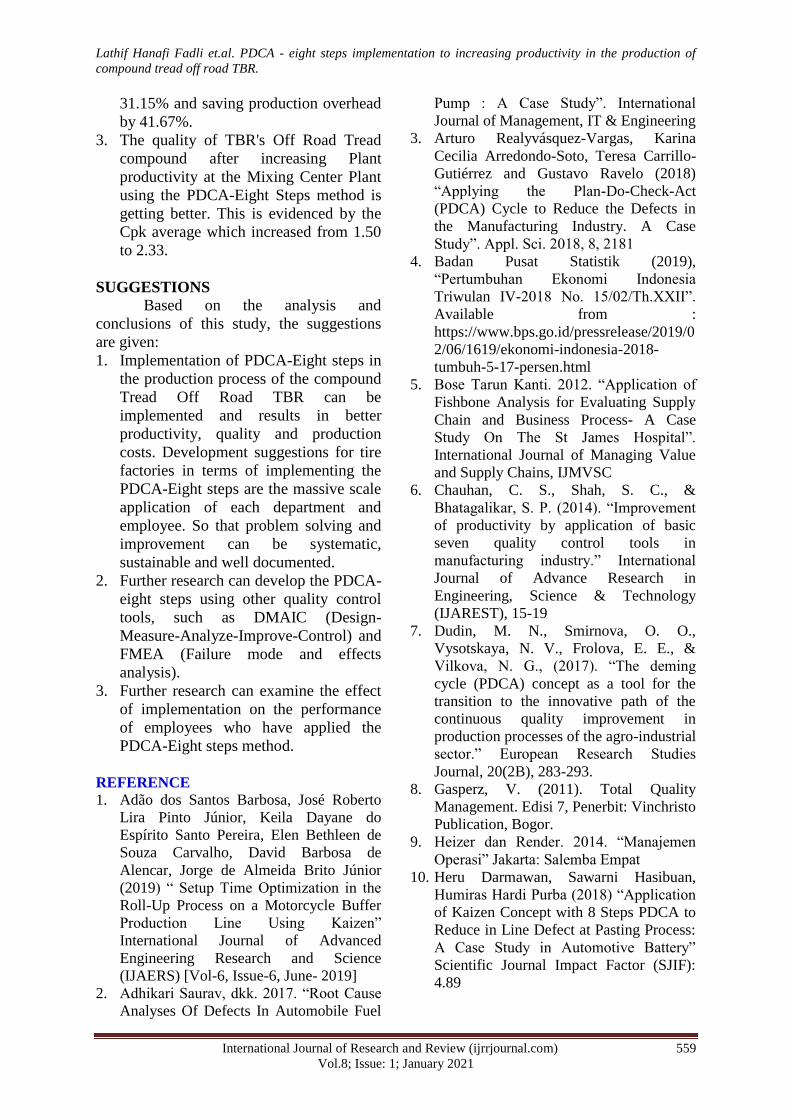
31.15% and saving production overhead
by 41.67%.
3. The quality of TBR's Off Road Tread
compound after increasing Plant
productivity at the Mixing Center Plant
using the PDCA-Eight Steps method is
getting better. This is evidenced by the
Cpk average which increased from 1.50
to 2.33.
SUGGESTIONS
Based on the analysis and
conclusions of this study, the suggestions
are given:
1. Implementation of PDCA-Eight steps in
the production process of the compound
Tread Off Road TBR can be
implemented and results in better
productivity, quality and production
costs. Development suggestions for tire
factories in terms of implementing the
PDCA-Eight steps are the massive scale
application of each department and
employee. So that problem solving and
improvement can be systematic,
sustainable and well documented.
2. Further research can develop the PDCA-
eight steps using other quality control
tools, such as DMAIC (Design-
Measure-Analyze-Improve-Control) and
FMEA (Failure mode and effects
analysis).
3. Further research can examine the effect
of implementation on the performance
of employees who have applied the
PDCA-Eight steps method.
REFERENCE
1. Adão dos Santos Barbosa, José Roberto
Lira Pinto Júnior, Keila Dayane do
Espírito Santo Pereira, Elen Bethleen de
Souza Carvalho, David Barbosa de
Alencar, Jorge de Almeida Brito Júnior
(2019) “ etup Time Optimization in the
Roll-Up Process on a Motorcycle Buffer
Production ine sing Kaizen”
International Journal of Advanced
Engineering Research and Science
(IJAERS) [Vol-6, Issue-6, June- 2019]
2. Adhikari aurav, dkk. 2017. “ oot Cause
Analyses Of Defects In Automobile Fuel
Pump : A Case tudy”. International
Journal of Management, IT & Engineering
3. Arturo Realyvásquez-Vargas, Karina
Cecilia Arredondo-Soto, Teresa Carrillo-
Gutiérrez and Gustavo Ravelo (2018)
“Applying the Plan-Do-Check-Act
(PDCA) Cycle to Reduce the Defects in
the Manufacturing Industry. A Case
tudy”. Appl. ci. 2018, 8, 2181
4. Badan Pusat Statistik (2019),
“Pertumbuhan Ekonomi Indonesia
Triwulan IV-2018 No. 15/02/Th. II”.
Available from :
https://www.bps.go.id/pressrelease/2019/0
2/06/1619/ekonomi-indonesia-2018-
tumbuh-5-17-persen.html
5. Bose Tarun Kanti. 2012. “Application of
Fishbone Analysis for Evaluating Supply
Chain and Business Process- A Case
tudy On The t James Hospital”.
International Journal of Managing Value
and Supply Chains, IJMVSC
6. Chauhan, C. S., Shah, S. C., &
Bhatagalikar, . P. (2014). “Improvement
of productivity by application of basic
seven quality control tools in
manufacturing industry.” International
Journal of Advance Research in
Engineering, Science & Technology
(IJAREST), 15-19
7. Dudin, M. N., Smirnova, O. O.,
Vysotskaya, N. V., Frolova, E. E., &
Vilkova, N. G., (2017). “The deming
cycle (PDCA) concept as a tool for the
transition to the innovative path of the
continuous quality improvement in
production processes of the agro-industrial
sector.” European esearch tudies
Journal, 20(2B), 283-293.
8. Gasperz, V. (2011). Total Quality
Management. Edisi 7, Penerbit: Vinchristo
Publication, Bogor.
9. Heizer dan ender. 2014. “Manajemen
Operasi” Jakarta: alemba Empat
10. Heru Darmawan, Sawarni Hasibuan,
Humiras Hardi Purba (2018) “Application
of Kaizen Concept with 8 Steps PDCA to
Reduce in Line Defect at Pasting Process:
A Case tudy in Automotive Battery”
Scientific Journal Impact Factor (SJIF):
4.89

Lathif Hanafi Fadli et.al. PDCA - eight steps implementation to increasing productivity in the production of
compound tread off road TBR.
International Journal of Research and Review (ijrrjournal.com) 560
Vol.8; Issue: 1; January 2021
11. Kumar Pavan, dkk. 2017.
“Implementation of 5S And Kobetsu
Kaizen (TPM Pillar) In A Manufacturing
Organization.” International esearch
Journal of Engineering and Technology,
IRJET.
12. Mahmoda azmah, dkk. 2017. “The
influence of lean six sigma and Kaizen to
reduce defect products in automotive
industry”. Journal of Emerging
Economies & Islamic Research, Jeei
13. Mahto Rajesh, Kumar Prakash. 2017.
“Kaizen For Quality And Performance
Improvement In Manufacturing Industry”.
International Journal Of Engineering
Sciences & Research Technology,
Endnote.
14. Stevenson, W.J., Chuong, S.C. 2014.
“Manajemen Operasi Perspektif Asia”,
Edisi 9, Jakarta: Salemba Empat
How to cite this article: Fadli LH, Nugroho
RE. PDCA - eight steps implementation to
increasing productivity in the production of
compound tread off road TBR. International
Journal of Research and Review. 2021; 8(1):
546-560.
******