Embed Size (px)
Citation preview
PCP Debugger Reference
TRACE32 Online Help
TRACE32 Directory
TRACE32 Index
TRACE32 Documents ......................................................................................................................
ICD In-Circuit Debugger ................................................................................................................
Processor Architecture Manuals ..............................................................................................
TriCore ......................................................................................................................................
PCP Debugger Reference .................................................................................................... 1
Warning .............................................................................................................................. 5
Introduction ....................................................................................................................... 6
Brief Overview of Documents for New Users 6
PCP Debugger Implementations 7
Example Scripts 7
Quick Start ......................................................................................................................... 8
Quick Start for OCDS-L1 Debugger 8
1. Prepare the Start 8
2.Configure the TriCore ICD for Debugging 8
3. Select the Device Prompt B: for the ICD Debugger 9
4. Select the CPU Type to load the CPU specific Settings 9
5. Enter Debug Mode 9
6. Load symbols for your Application Program 9
7. Write a Start-up Script 10
Quick Start for Tracing with OCDS-L2 Trace (Analyzer) 11
1. Prepare the Debugger 11
2. Connect the PreProcessor to the Trace Connector on the Target 11
3. Delegate Trace Control 11
4. Fine Tuning 11
5. Start and Stop Tracing 12
6. View the Results 12
Quick Start for Tracing with OCDS-L3 Trace (On-chip Trace) 13
1. Prepare the Debugger 13
2. Configure the On-chip Trace 13
5. Start and Stop Tracing 13
6. View the Results 13
OCDS-L1 Debugger ........................................................................................................... 14
Troubleshooting 14
PCP Debugger Reference 1 ©1989-2018 Lauterbach GmbH

SYStem.Up Errors 14
Memory Classes 15
Breakpoints 16
OCDS Trace ....................................................................................................................... 17
OCDS-L2 Flow Trace (Analyzer) 17
Supported Features 17
Trace Hardware 17
Troubleshooting for OCDS-L2 Trace 17
No Trace 17
Flow Errors 18
OCDS-L3 On-chip Trace 19
Supported Features 19
Trace Control 19
Additional information 19
Simple Trace Control ........................................................................................................ 20
Coupling of PCP and Host-core Debugger ..................................................................... 21
Modify TRACE32 configuration files 21
Start PowerView instances 21
Synchronous Break 21
Synchronous Step or Go 23
FAQ ..................................................................................................................................... 25
Commands ......................................................................................................................... 29
SYStem.CONFIG Configure debugger according to target topology 29
Daisy-chain Example 31
TapStates 32
SYStem.CONFIG.CORE Assign core to TRACE32 instance 33
SYStem.CONFIG PortSHaRing Control sharing of debug port with other tool 34
SYStem.CPU Select CPU 34
SYStem.CpuAccess Run-time CPU access (intrusive) 35
SYStem.JtagClock Set the JTAG frequency 36
SYStem.LOCK Tristate the JTAG port 37
SYStem.MemAccess Run-time memory access (non-intrusive) 38
SYStem.Mode Establish the communication with the CPU 39
SYStem.Option CPU specific commands 40
SYStem.Option BreakSignal Generate break signal 40
SYStem.Option CodeBASE PCODE base address 40
SYStem.Option CodeSIZE PCP PRAM size 40
SYStem.Option CPUREQ CPU request address 41
SYStem.Option DAC Disable all channels on break 41
SYStem.Option DIAG Diagnosis function 41
SYStem.Option DUALPORT Run-time memory access for all windows 42
SYStem.Option PramBASE PRAM base address 42
PCP Debugger Reference 2 ©1989-2018 Lauterbach GmbH
SYStem.Option PermanentBP Enable breakpoints when single stepping 42
SYStem.Option PSIZE PCP PRAM size 43
SYStem.Option RegBASE PCP configuration register base address 44
SYStem.Option SessKEYHIGH Key for unlocking on-chip trace memory 44
SYStem.Option SessKEYLOW Key for unlocking on-chip trace memory 44
SYStem.Option TB1766FIX Bug fix for some TC1766 TriBoards 45
CPU specific TriggerOnchip Commands ........................................................................ 46
Internal Break Bus (JTAG) 46
Trace Break Signals (OCDS-L2) 46
TrOnchip.BreakIN Connect break target PCP to BreakBus 47
TrOnchip.BreakOUT Connect break source PCP to BreakBus 47
TrOnchip.CONVert Not relevant for the PCP architecture 47
TrOnchip.RESet Reset settings for the on-chip trigger unit 47
TrOnchip.SusTarget Connect PCP to the suspend bus 48
CPU specific BenchMarkCounter Commands ................................................................ 49
BMC.<counter>.ATOB Advise counter to count within AB-range 49
JTAG Connector ................................................................................................................ 50
Trace Connector ................................................................................................................ 50
Support ............................................................................................................................... 51
Available Tools 51
Compilers 51
Target Operating Systems 51
3rd-Party Tool Integrations 52
Products ............................................................................................................................. 53
Product Information 53
Order Information 53
PCP Debugger Reference 3 ©1989-2018 Lauterbach GmbH

PCP Debugger Reference
Version 16-Nov-2018
PCP Debugger Reference 4 ©1989-2018 Lauterbach GmbH

Warning
WARNING: To prevent debugger and target from damage it is recommended to connect or disconnect the debug cable only while the target power is OFF.
Recommendation for the software start:
1. Disconnect the debug cable from the target while the target power is off.
2. Connect the host system, the TRACE32 hardware and the debug cable.
3. Power ON the TRACE32 hardware.
4. Start the TRACE32 software to load the debugger firmware.
5. Connect the debug cable to the target.
6. Switch the target power ON.
7. Configure your debugger e.g. via a start-up script.
Power down:
1. Switch off the target power.
2. Disconnect the debug cable from the target.
3. Close the TRACE32 software.
4. Power OFF the TRACE32 hardware.
PCP Debugger Reference 5 ©1989-2018 Lauterbach GmbH

Introduction
This document describes the processor specific settings and features for the ICD PCP and the Trace extensions.
Please keep in mind that only the Processor Architecture Manual (the document you are reading at the moment) is CPU specific, while all other parts of the online help are generic for all CPUs supported by Lauterbach. So if there are questions related to the CPU, the Processor Architecture Manual should be your first choice.
ICD PCP requires the ICD of the main core to be running and in SYStem.Mode Up. Currently PCP is only implemented in TriCore chips.
Brief Overview of Documents for New Users
Architecture-independent information:
• “Debugger Basics - Training” (training_debugger.pdf): Get familiar with the basic features of a TRACE32 debugger.
• “T32Start” (app_t32start.pdf): T32Start assists you in starting TRACE32 PowerView instances for different configurations of the debugger. T32Start is only available for Windows.
• “General Commands” (general_ref_<x>.pdf): Alphabetic list of debug commands.
Architecture-specific information:
• “Processor Architecture Manuals”: These manuals describe commands that are specific for the processor architecture supported by your debug cable. To access the manual for your processor architecture, proceed as follows:
- Choose Help menu > Processor Architecture Manual.
• “OS Awareness Manuals” (rtos_<os>.pdf): TRACE32 PowerView can be extended for operating system-aware debugging. The appropriate OS Awareness manual informs you how to enable the OS-aware debugging.
TriCore debugging:
• “TriCore Debugger and Trace” (debugger_tricore.pdf): General information about the ICD TriCore
PCP Debugger Reference 6 ©1989-2018 Lauterbach GmbH

PCP Debugger Implementations
Lauterbach has implemented two different approaches for a PCP debugger:
• Integrated PCP Debugger
The first approach was the Integrated or Internal PCP Debugger which is integrated into ICD TriCore. At that point of time it was technically the only solution, although it has various restrictions. For example an Inline Assembler, HLL support, source file listing or powerful trace analysis is not possible.
• External PCP Debugger
Various improvements of the PCP tool chain, such as a C/C++ compiler, the requirement of displaying source code or the integration of third-party tools as the VAST simulator required outsourcing of the PCP debugger into its own PowerView instance.
Example Scripts
In your TRACE32 installation directory there is a subdirectory ~~/demo/pcp/ where you will find example scripts and demo software:
Note that the Integrated PCP Debugger is discontinued but still available for compatibility reasons.
~~/demo/pcp/ Startup example explaining how to start a TRACE32 PowerView instance for TriCore and PCP including an example application.
PCP Debugger Reference 7 ©1989-2018 Lauterbach GmbH

Quick Start
This chapter helps you to prepare your Debugger for PCP. Depending on your application not all steps might be necessary. It is assumed that you are using a TC1766 B-Step on an Infineon TriBoard.
For some applications additional steps might be necessary that are not described here. See Example Scripts for more details.
Quick Start for OCDS-L1 Debugger
1. Prepare the Start
Connect the Debug Cable to your target. Check the orientation of the connector. Pin 1 of the debug cable is marked with a small triangle next to the nose of the target connector.
Power up your TRACE32 system (not necessary on PODPC).
Start a PowerView instance for the host-core (TriCore in this example) and for PCP (see also Coupling of PCP and Host-core Debugger):
• Start the TRACE32 Debugger Software for TriCore. Make sure the configuration file for the TriCore Instance (e.g. config_tricore.t32) contains the line CORE=1.
• Start the TRACE32 Debugger Software for PCP. Make sure the configuration file for the PCP Instance (e.g. config_pcp.t32) contains the line CORE=2.
Power up your Target.
2.Configure the TriCore ICD for Debugging
Refer to “TriCore Debugger and Trace” (debugger_tricore.pdf) for information on how to do this.
Since PCP needs to be initialized by the TriCore CPU, execute your application so that PCP code and data is loaded into PCPmemory. This is usually done by executing the TriCore startup code until the main label.
Remember that these steps have to be performed on the TriCore PowerView instance.
To prevent damage please take care to follow this sequence all the time you are preparing a start.
PCP Debugger Reference 8 ©1989-2018 Lauterbach GmbH

3. Select the Device Prompt B: for the ICD Debugger
On all TRACE32 tool configurations except for the emulator device B:: is already selected.
4. Select the CPU Type to load the CPU specific Settings
It is strongly recommended to select the specific CPU instead of PCP1 or PCP2 which are only dedicated for hardware configurations not known by TRACE32.
5. Enter Debug Mode
Reset CPU and enter debug mode. After this command is executed, it is possible to access memory and registers.
ICD PCP requires an ICD TriCore which is configured and up. SYStem.Mode Up will fail for PCP if ICD TriCore is in SYStem.Mode Down.
6. Load symbols for your Application Program
The options of the Data.LOAD command depend on the file format generated by the compiler. For information on the compiler options refer to the section Compiler. A detailed description of the Data.LOAD command is given in “General Commands Reference”.
Since the PCP code is normally loaded by the TriCore application only the symbols have to be loaded.
B::
SYStem.CPU TC1766
SYStem.Up
Data.LOAD.Elf myprog.elf /NoCODE /NOREG
; ELF specifies the format, myprog is the file name
PCP Debugger Reference 9 ©1989-2018 Lauterbach GmbH
7. Write a Start-up Script
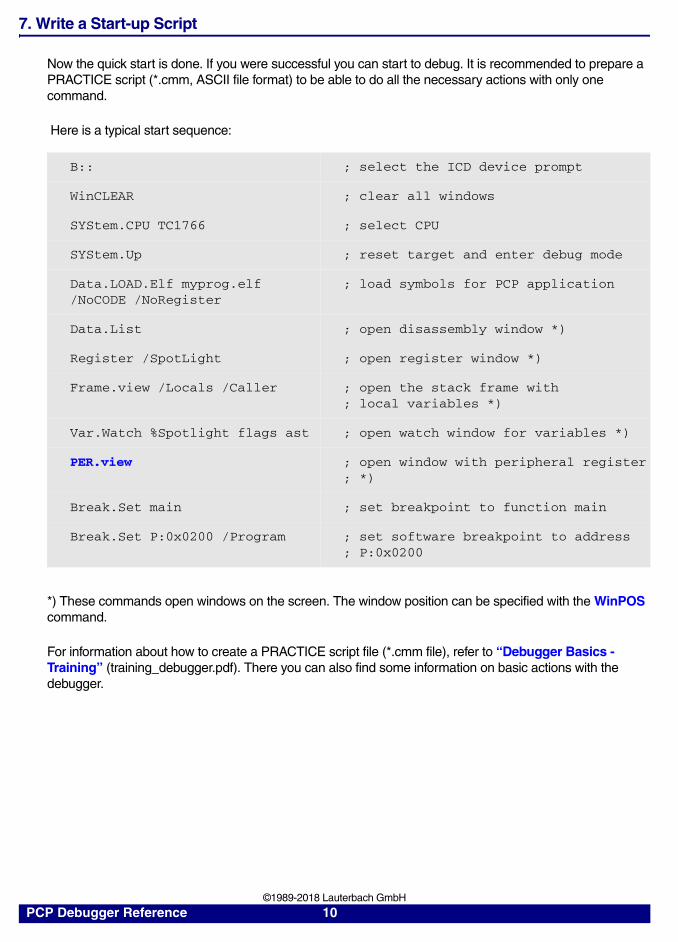
Now the quick start is done. If you were successful you can start to debug. It is recommended to prepare a PRACTICE script (*.cmm, ASCII file format) to be able to do all the necessary actions with only one command.
Here is a typical start sequence:
*) These commands open windows on the screen. The window position can be specified with the WinPOS command.
For information about how to create a PRACTICE script file (*.cmm file), refer to “Debugger Basics - Training” (training_debugger.pdf). There you can also find some information on basic actions with the debugger.
B:: ; select the ICD device prompt
WinCLEAR ; clear all windows
SYStem.CPU TC1766 ; select CPU
SYStem.Up ; reset target and enter debug mode
Data.LOAD.Elf myprog.elf/NoCODE /NoRegister
; load symbols for PCP application
Data.List ; open disassembly window *)
Register /SpotLight ; open register window *)
Frame.view /Locals /Caller ; open the stack frame with ; local variables *)
Var.Watch %Spotlight flags ast ; open watch window for variables *)
PER.view ; open window with peripheral register; *)
Break.Set main ; set breakpoint to function main
Break.Set P:0x0200 /Program ; set software breakpoint to address; P:0x0200
PCP Debugger Reference 10 ©1989-2018 Lauterbach GmbH

Quick Start for Tracing with OCDS-L2 Trace (Analyzer)
It is assumed that you are tracing a TC1766 B-Step on an Infineon TriBoard-TC1766.300 or above.
1. Prepare the Debugger
Load your application and prepare for debug. See “Quick Start for OCDS-L1 Debugger” for more details.
Make sure that the TriCore debugger is also prepared for debugging. If required by the target, it is especially necessary to set up the trace port correctly. It is recommends to set it up on ICD TriCore. See ”Quick Start for Tracing with OCDS-L2 Trace (Analyzer)” in “TriCore Debugger and Trace” (debugger_tricore.pdf) for more information on how to do this.
2. Connect the PreProcessor to the Trace Connector on the Target
Plug the PreProcessor into the trace connector on the target board. In case of an AMP40 connector you need to care for the correct orientation of the connector. Check for Pin 1.
3. Delegate Trace Control
With the ICD PCP, two PowerView instances are active which share the same trace module and the same pre-processor. By default, both instances try to control them which results in undefined behavior. Since the TriCore chip only outputs either TriCore or PCP trace data, the solution is to disable the unused trace.
To do so, change to the PowerView instance which should not record, and disable the Analyzer. E.g. if PCP should be traced, change to ICD TriCore and execute the following command:
Use Analyzer.OFF to re-enable the Analyzer.
4. Fine Tuning
The preprocessor uses a compression algorithm which affects the accuracy of the timestamp information. For improving the accuracy by the factor 4, specify the CPU clock frequency.
The trace is now configured.
Analyzer.DISable ; disables the Analyzer for the ICD where it is executed on
Analyzer.Clock 20.0MHz ; specify CPU clock
PCP Debugger Reference 11 ©1989-2018 Lauterbach GmbH
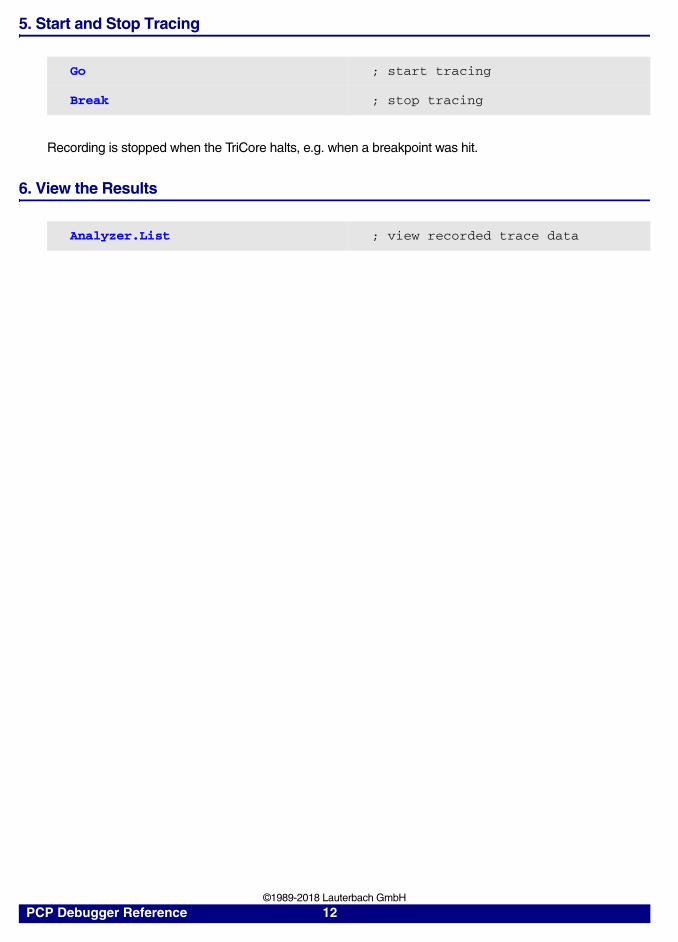
5. Start and Stop Tracing
Recording is stopped when the TriCore halts, e.g. when a breakpoint was hit.
6. View the Results
Go ; start tracing
Break ; stop tracing
Analyzer.List ; view recorded trace data
PCP Debugger Reference 12 ©1989-2018 Lauterbach GmbH

Quick Start for Tracing with OCDS-L3 Trace (On-chip Trace)
It is assumed that you are tracing a TC1766ED B-Step on an Infineon TriBoard-TC1766.
1. Prepare the Debugger
Load your application and prepare for debug. See “Quick Start for OCDS-L1 Debugger” for more details.
Make sure that the TriCore debugger is also prepared for debugging. See ”Quick Start for Tracing with OCDS-L3 Trace (Analyzer)” in “TriCore Debugger and Trace” (debugger_tricore.pdf) for more information on how to do this.
2. Configure the On-chip Trace
Specifies the size of the on-chip trace memory. The given value is auto corrected to possible sizes. Note that the size for ICD TriCore and ICD PCP is always the same.
5. Start and Stop Tracing
Note that tracing can also be stopped by a breakpoint.
6. View the Results
Onchip.SIZE 262144. ; select trace memory size
Go ; start tracing
Break ; stop tracing
Onchip.List ; view recorded trace data
PCP Debugger Reference 13 ©1989-2018 Lauterbach GmbH

OCDS-L1 Debugger
Troubleshooting
SYStem.Up Errors
The SYStem.Up command is the first command of a debug session where communication with the target is required. If you receive error messages while executing this command this may have the following reasons.
• ICD TriCore is not yet Up.
PCP Debugger Reference 14 ©1989-2018 Lauterbach GmbH

Memory Classes
The following memory classes are available:
Prepending an E as attribute to the memory class will make memory accesses possible even when the CPU is running. See SYStem.MemAccess and SYStem.CpuAccess for more information.
SYStem.Option DUALPORT will enable the runtime update of almost all windows, the memory class attribute E is not necessary. Although the core is not stopped for accessing the memory this can slow down program execution since the CPU and debugger both access the FPI bus.
Memory Class Description
P Program
D Data
EEC Emulation Memory on EEC. Only available on TriCore Emulation Devices for accessing the Emulation Extension Chip
FPI FPI Bus address space. Provides a view on the internal buses as seen by the debugger through the FPI bus. Some bus devices such as internal memories may have a different address mappings as usually. The debugger does not do any address remapping as the host CPU debugger does.
PCP Debugger Reference 15 ©1989-2018 Lauterbach GmbH

Breakpoints
PCP currently only supports software breakpoints. So only program breakpoints are possible. You can check your currently set breakpoints with the command Break.List .
Examples for Breakpoints
• Example for instruction breakpoint:
Break.Set P:0x01F8 /Program ; software breakpoint on instruction
PCP Debugger Reference 16 ©1989-2018 Lauterbach GmbH

OCDS Trace
OCDS-L2 Flow Trace (Analyzer)
Use Trace.METHOD Analyzer for selecting the Analyzer.
Supported Features
• Program Flow Trace for PCP
• Timestamps
Trace Hardware
The trace hardware for PCP is the very same as for TriCore. See the appropriate chapters in “TriCore Debugger and Trace” (debugger_tricore.pdf) for more information.
Troubleshooting for OCDS-L2 Trace
No Trace
There are different reasons possible:
• CPU trace port not mapped.
On many chips the trace port shares its functionality with another peripheral. In this case, one or more dedicated registers have to be set correctly. For TriCore, see also the demo scripts in the TRACE32 installation directory: ~~/demo/tricore/hardware/*.
• Reference voltage not set up correctly (new trace hardware only).
- Reference voltage pin on trace connector connected?
- Value set to the middle of the trace signal?
• Poor trace/clock signal (new trace hardware only).
Change termination setting.
Note that it is not possible to trace TriCore and PCP at the same time.
PCP Debugger Reference 17 ©1989-2018 Lauterbach GmbH

Flow Errors
There are different reasons possible:
• CPU trace port not mapped.
Mostly the trace port shares its functionality with another peripheral. In this case, one or more dedicated registers have to be set correctly. See the host CPU’s demo scripts.
• Reference voltage not set up correctly (new trace hardware only).
- Reference voltage pin on trace connector connected?
- Value set to the middle of the trace signal?
• Poor trace/clock signal (new trace hardware only).
Change termination setting.
• Setup/hold time violation.
- 3 ns setup / 1 ns hold time needed.
- sample point: falling edge.
• Code modification during runtime.
Self modifying code is not supported.
PCP Debugger Reference 18 ©1989-2018 Lauterbach GmbH
OCDS-L3 On-chip Trace
On-chip Tracing is only possible with an Infineon Emulation Device.
Use Trace.METHOD Onchip for selecting the on-chip trace.
Supported Features
• Program Flow Trace for PCP
• Data Trace for TriCore and PCP
• Ownership Trace for PCP
• Timestamps
• Simple Trace Control
Trace Control
The On-chip settings can be done with the Onchip commands, e.g. from the Onchip.view window. The settings affect both TriCore and PCP Trace.
The trace results for TriCore can be viewed in the TriCore PowerView instance, the trace results for PCP in the PCP PowerView instance.
To correlate TriCore and PCP trace records with the /Track option see the InterCom commands in “PowerView Command Reference” (ide_ref.pdf) commands.
Additional information
For additional information in OCDS-L3 trace see chapter OCDS-L3 On-chip Trace in “TriCore Debugger and Trace” (debugger_tricore.pdf).
A trace source can either be TriCore, PCP or both at the same time.It is not possible to enable a trace stream (e.g. Program Flow or Data Trace) for only one trace source when both are enabled.Tracing TriCore is set up in ICD TriCore.
Onchip.AutoArm has only an effect on TriCore and not on PCP. Always make sure that PCP is running when arming the trace.
PCP Debugger Reference 19 ©1989-2018 Lauterbach GmbH

Simple Trace Control
Simple Trace Control is currently not supported for PCP.
PCP Debugger Reference 20 ©1989-2018 Lauterbach GmbH

Coupling of PCP and Host-core Debugger
PCP is an Auxiliary Processing Unit, a sub-core which depends on the system it is implemented in. Currently it is included in chips with a TriCore CPU as host-core.
For each core in a multi-core scenario, an instance of the TRACE32 PowerView software has to be started although the low-level debug driver runs on the same Power Debug module. This chapter describes the necessary steps for configuring both PowerView instances via a config file. The Windows software “T32Start” (app_t32start.pdf) provides an easy way to configure this.
The following examples use the TriCore Debugger in case PCP is included within a TriCore chip. For more information on TRACE32 configuration files see chapter File config.t32 in “TRACE32 Installation Guide” (installation.pdf).
Modify TRACE32 configuration files
• Add the line CORE=1 to the TriCore configuration file (e.g. config_tricore.t32)
• Add the line CORE=2 to the PCP configuration file (e.g. config_pcp.t32)
This step has to be done only once.
Start PowerView instances
Always start the TriCore instance first and wait until it has started completely before starting the PCP instance:
• t32mtc.exe -c config_tricore.t32
• t32mpcp.exe -c config_pcp.t32
An optional startup script can be specified after the config file, separated by a comma:
• t32mtc.exe -c config_tricore.t32 -c start_tc.cmm
• t32mpcp.exe -c config_pcp.t32 -c start_pcp.cmm
Synchronous Break
TriCore and PCP can be programmed to break synchronously when a debug event happens on TriCore or PCP. By using the TrOnchip commands the break event can be distributed via a Break Bus:
PCP Debugger Reference 21 ©1989-2018 Lauterbach GmbH

Distribute Break Signal from PCP to TriCore
• PCP Debugger Instance
• TriCore Debugger Instance
Distribute Break Signal from TriCore to PCP
• TriCore Debugger Instance
• PCP Debugger Instance
TrOnchip.BreakOUT ENable ; enable PCP break signal generation
TrOnchip.BreakOUT BreakBus0 ; distribute PCP break signal on Break Bus 0
TrOnchip.BreakIN.TriCore BreakBus0 ; sense for break signal on Break Bus 0
TrOnchip.EXTernal ON ; halt when break signal is detected on Break Bus
Note that TrOnchip.EXTernal ON disables OCDS-L2 Break Actions. TriCore will stop instead of triggering the Break Action.
TrOnchip.BreakOUT.TriCore BreakBus1 ; distribute TriCore break signal on Break Bus 1
TrOnchip.BreakIN BreakBus1 ; sense for break signal on Break Bus 1
TrOnchip.BreakIN ENable ; halt when break signal is detected on Break Bus
Note that PCP will ignore the Break Signal in case it is currently in Idle Mode. In this case configure PCP as Suspend Target by TrOnchip.SuspTarget.PCP ON. As long as the suspend is active PCP will stop execution. On a suspended PCP, no Break, Step or Go command can be performed.
PCP Debugger Reference 22 ©1989-2018 Lauterbach GmbH

Synchronous Step or Go
The Debuggers of PCP and TriCore provide a mechanism to perform a synchronous start of both cores, e.g. for a Step or Go.
Setup Debugger communication via InterCom Interface
InterCom has to be enabled in the configuration file already:
• TriCore Debugger Instance:
• PCP Debugger Instance:
For more information on the InterCom Interface see chapter InterCom Interface in “TRACE32 Installation Guide” (installation.pdf).
IC=NETASSISTPORT=20000
IC=NETASSISTPORT=20001
PCP Debugger Reference 23 ©1989-2018 Lauterbach GmbH
Setup Synchronous MultiCore Start via InterCom Interface
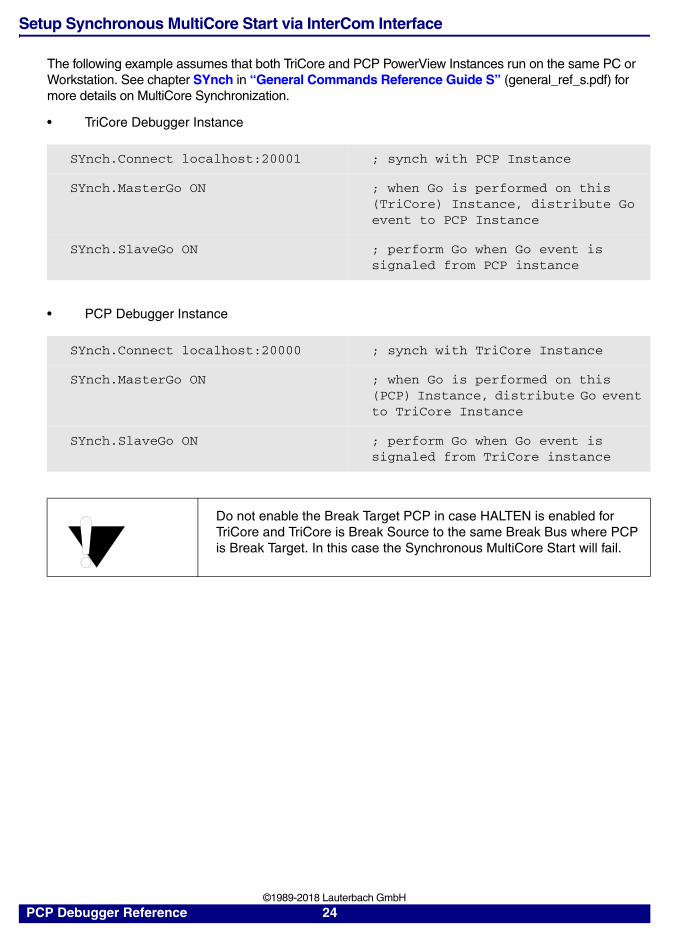
The following example assumes that both TriCore and PCP PowerView Instances run on the same PC or Workstation. See chapter SYnch in “General Commands Reference Guide S” (general_ref_s.pdf) for more details on MultiCore Synchronization.
• TriCore Debugger Instance
• PCP Debugger Instance
SYnch.Connect localhost:20001 ; synch with PCP Instance
SYnch.MasterGo ON ; when Go is performed on this (TriCore) Instance, distribute Go event to PCP Instance
SYnch.SlaveGo ON ; perform Go when Go event is signaled from PCP instance
SYnch.Connect localhost:20000 ; synch with TriCore Instance
SYnch.MasterGo ON ; when Go is performed on this (PCP) Instance, distribute Go event to TriCore Instance
SYnch.SlaveGo ON ; perform Go when Go event is signaled from TriCore instance
Do not enable the Break Target PCP in case HALTEN is enabled for TriCore and TriCore is Break Source to the same Break Bus where PCP is Break Target. In this case the Synchronous MultiCore Start will fail.
PCP Debugger Reference 24 ©1989-2018 Lauterbach GmbH

FAQ
Debugging via VPN
Ref: 0307
The debugger is accessed via Internet/VPN and the performance is very slow. What can be done to improve debug performance?
The main cause for bad debug performance via Internet or VPN are low data throughput and high latency. The ways to improve performance by the debugger are limited:
In PRACTICE scripts, use "SCREEN.OFF" at the beginning of the scriptand "SCREEN.ON" at the end. "SCREEN.OFF" will turn off screenupdates. Please note that if your program stops (e.g. on error) without exe-cuting "SCREEN.OFF", some windows will not be updated.
"SYStem.POLLING SLOW" will set a lower frequency for target statechecks (e.g. power, reset, jtag state). It will take longer for the debugger torecognize that the core stopped on a breakpoint.
"SETUP.URATE 1.s" will set the default update frequency ofData.List/Data.dump/Variable windows to 1 second (the slowest possiblesetting).
prevent unneeded memory accesses using "MAP.UPDATEONCE[address-range]" for RAM and "MAP.CONST [address--range]" forROM/FLASH. Address ranged with "MAP.UPDATEONCE" will read thespecified address range only once after the core stopped at a breakpoint ormanual break. "MAP.CONST" will read the specified address range onlyonce per SYStem.Mode command (e.g. SYStem.Up).
PCP Debugger Reference 25 ©1989-2018 Lauterbach GmbH

Setting a Software Breakpoint fails
Ref: 0276
What can be the reasons why setting a software breakpoint fails?
Setting a software breakpoint can fail when the target HW is not able to implement the wanted breakpoint. Possible reasons:
The wanted breakpoint needs special features that are only possible torealize by the trigger unit inside the controller.
Example: Read, write and access (Read/Write) breakpoints ("type" in Break.Set window). Breakpoints with checking in real-time for data-values ("Data"). Breakpoints with special features ("action") like TriggerTrace, TraceEnable, TraceOn/TraceOFF.
TRACE32 can not change the memory.Example: ROM and Flash when no preparation with FLASH.Create, FLASH.TARGET and FLASH.AUTO was made. All type of memory if the memory device is missing the necessary control signals like WriteEnable or settings of registers and SpecialFunctionRegisters (SFR).
Contrary settings in TRACE32.Like: MAP.BOnchip for this memory range. Break.SELect.<breakpoint-type> Onchip (HARD is only available for ICE and FIRE).
RTOS and MMU:If the memory can be changed by Data.Set but the breakpoint doesn't work it might be a problem of using an MMU on target when setting the breakpoint to a symbolic address that is different than the writable and intended memory location.
Break Bus commands not available
Ref: 0297
The TrOnchip window does not show the Break Bus settings are not available. When entering the commands the software reports they are locked.
The Break Bus is a feature of the chip where PCP is implemented in, so choose the correct CPU. If PCP is implemented in a TC1797, choose TC1797 as CPU. PCP1 and PCP2 are generic CPUs for chips not (yet) directly supported by the debugger. In this case more dedicated configuration has to be done, and certain features such as trace, MCBS or handling End-of-Init protection are not supported.
End-of-Init protection errors
Ref: 0296
The debugger reports various end-of-init protection error.
End-of-Init protection is a feature of the chip where PCP is implemented in, so choose the correct CPU. If PCP is implemented in a TC1797, choose TC1797 as CPU. PCP1 and PCP2 are generic CPUs for chips not (yet) directly supported by the debugger. In this case more dedicated configurations have to be done, and certain features such as trace, MCBS or handling End-of-Init protection are not supported.
PCP Debugger Reference 26 ©1989-2018 Lauterbach GmbH

register set undefined
Ref: 0295
After a SYStem.Up the register window shows "register set undefined".
Each PCP channel has its own set of registers. When PCP is stopped for debug, the contents of the registers are written back to PRAM where the debugger has access. When no channel has been running yet, the debugger does not know which register set to display. This also affects the Data.List window, because the PC is also unknown. However opening a Data.List window by specifying a dedicated address or label works, e.g. Data.List P:0x0000 or Data.List myChannel . A Step or Go is also not possible because the debugger does not know which channel to step or retrigger. For starting a certain channel an appropriate interrupt has to be generated manually.
PCP
Step or Go not possible after break
Ref: 0294
After breaking a PCP channel initially, it is not possible to step or resume a PCP channel. The PCP_ES register reports a DCR error.
For resuming PCP channel execution (e.g. for a Step or Go), the debugger retriggers the current PCP channel. If the channel is disabled, a DCR error occures (Disabled Channel Request error). Register R7, bit CEN holds the information whether a channel is enabled or disabled. Some compilers (e.g. TASKING 3.0) allow to use R7 as a general purpose register while PCP still evaluates R7.CEN. For TASKING 3.0 the usage of R7 as a general purpose register may be disabled by using the --preserve-r7-flags compiler switch.
PCP Debugger Reference 27 ©1989-2018 Lauterbach GmbH

PCP2
Channel ID is not traced, triggered or filtered correctly
Ref: 0347
When using MCDS on-chip trace, the PCP channel ID is traced incorrectly and any configured filters and triggers are not working correctly.
The MCDS on-chip trace and trigger logic derives the PCP channel ID from the CPPN (Current PCP Priority Number), which is part of the R6 Register. However, the application may use R6 as General Purpose Register, overwriting the CPPN bits with arbitrary data. So the MCDS receives and uses an invalid channel ID for generating triggers, filters and trace output. In case of the TASKING PCP C/C++ compiler, use the interrupt-enable compiler option for having the CPPN available in R6. This has the disadvantage that channels become interruptible. Channels can still be set non-interruptible via R7.IEN using the __ien(0) function in the respective channel. Command line switch:
--interrupt-enable
IDE menu entry:
Select Global Options "Channel Configuration".
Enable the option "Allow channel to be interruptible". Necessary application modification: Add the function qualifier __cppn() to your channel program function declaration to define the interrupt priority of an interruptible function:
void __interrupt( channel_number ) __cppn(CPPN) isr( void ){ ...}
See the TASKING PCP C/C++ compiler documentation for further information.
PCP Debugger Reference 28 ©1989-2018 Lauterbach GmbH

Commands
SYStem.CONFIG Configure debugger according to target topology
The four parameters IRPRE, IRPOST, DRPRE, DRPOST are required to inform the debugger about the TAP controller position in the JTAG chain, if there is more than one core in the JTAG chain (e.g. ARM + DSP). The information is required before the debugger can be activated e.g. by a SYStem.Up. See Daisy-chain Example.For some CPU selections (SYStem.CPU) the above setting might be automatically included, since the required system configuration of these CPUs is known.
TriState has to be used if several debuggers (“via separate cables”) are connected to a common JTAG port at the same time in order to ensure that always only one debugger drives the signal lines. TAPState and TCKLevel define the TAP state and TCK level which is selected when the debugger switches to tristate mode. Please note: nTRST must have a pull-up resistor on the target, TCK can have a pull-up or pull-down resistor, other trigger inputs need to be kept in inactive state.
Format: SYStem.CONFIG <parameter> <number_or_address>SYStem.MultiCore <parameter> <number_or_address> (deprecated)
<parameter>: CORE <core>
<parameter>:(JTAG):
DRPRE <bits>DRPOST <bits>IRPRE <bits>IRPOST <bits>TAPState <state>TCKLevel <level>TriState [ON | OFF]Slave [ON | OFF]
Multicore debugging is not supported for the DEBUG INTERFACE (LA-7701).
CORE For multicore debugging one TRACE32 GUI has to be started per core. To bundle several cores in one processor as required by the system this command has to be used to define core and processor coordinates within the system topology.Further information can be found in SYStem.CONFIG.CORE.
PCP Debugger Reference 29 ©1989-2018 Lauterbach GmbH

DRPRE (default: 0) <number> of TAPs in the JTAG chain between the core of interest and the TDO signal of the debugger. If each core in the system contributes only one TAP to the JTAG chain, DRPRE is the number of cores between the core of interest and the TDO signal of the debugger.
DRPOST (default: 0) <number> of TAPs in the JTAG chain between the TDI signal of the debugger and the core of interest. If each core in the system contributes only one TAP to the JTAG chain, DRPOST is the number of cores between the TDI signal of the debugger and the core of interest.
IRPRE (default: 0) <number> of instruction register bits in the JTAG chain between the core of interest and the TDO signal of the debugger. This is the sum of the instruction register length of all TAPs between the core of interest and the TDO signal of the debugger.
IRPOST (default: 0) <number> of instruction register bits in the JTAG chain between the TDI signal and the core of interest. This is the sum of the instruction register lengths of all TAPs between the TDI signal of the debugger and the core of interest.
TAPState (default: 7 = Select-DR-Scan) This is the state of the TAP controller when the debugger switches to tristate mode. All states of the JTAG TAP controller are selectable.
TCKLevel (default: 0) Level of TCK signal when all debuggers are tristated.
TriState (default: OFF) If several debuggers share the same debug port, this option is required. The debugger switches to tristate mode after each debug port access. Then other debuggers can access the port. JTAG: This option must be used, if the JTAG line of multiple debug boxes are connected by a JTAG joiner adapter to access a single JTAG chain.
Slave (default: OFF) If more than one debugger share the same debug port, all except one must have this option active.JTAG: Only one debugger - the “master” - is allowed to control the signals nTRST and nSRST (nRESET).
PCP Debugger Reference 30 ©1989-2018 Lauterbach GmbH

Daisy-chain Example
Below, configuration for core C.
Instruction register length of
• Core A: 3 bit
• Core B: 5 bit
• Core D: 6 bit
SYStem.CONFIG.IRPRE 6 ; IR Core D
SYStem.CONFIG.IRPOST 8 ; IR Core A + B
SYStem.CONFIG.DRPRE 1 ; DR Core D
SYStem.CONFIG.DRPOST 2 ; DR Core A + B
SYStem.CONFIG.CORE 0. 1. ; Target Core C is Core 0 in Chip 1
Core A Core B Core C Core D TDOTDI
Chip 0 Chip 1
PCP Debugger Reference 31 ©1989-2018 Lauterbach GmbH
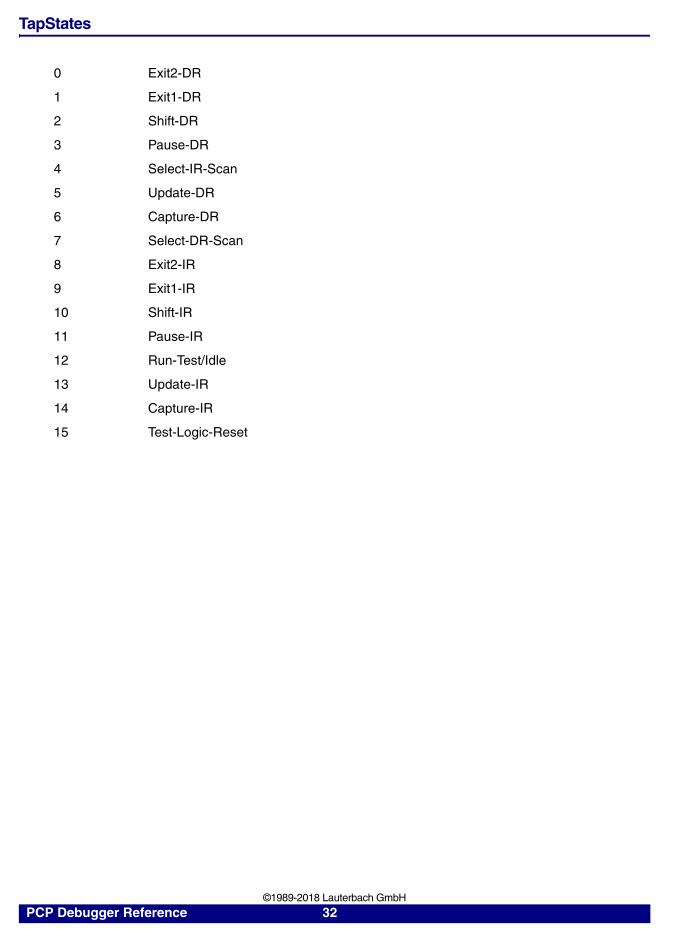
TapStates
0 Exit2-DR
1 Exit1-DR
2 Shift-DR
3 Pause-DR
4 Select-IR-Scan
5 Update-DR
6 Capture-DR
7 Select-DR-Scan
8 Exit2-IR
9 Exit1-IR
10 Shift-IR
11 Pause-IR
12 Run-Test/Idle
13 Update-IR
14 Capture-IR
15 Test-Logic-Reset
PCP Debugger Reference 32 ©1989-2018 Lauterbach GmbH
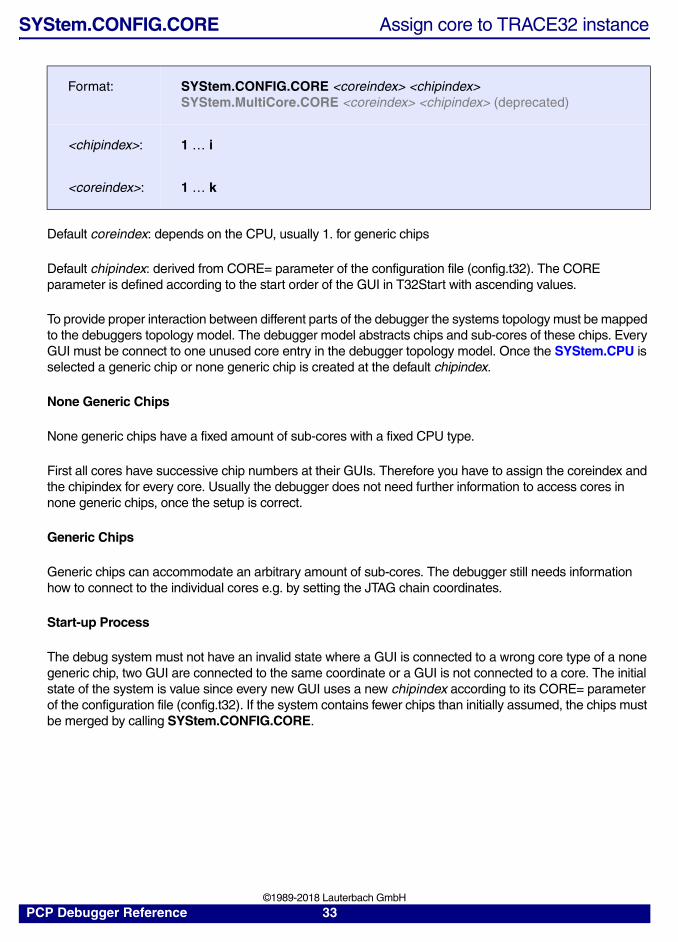
SYStem.CONFIG.CORE Assign core to TRACE32 instance
Default coreindex: depends on the CPU, usually 1. for generic chips
Default chipindex: derived from CORE= parameter of the configuration file (config.t32). The CORE parameter is defined according to the start order of the GUI in T32Start with ascending values.
To provide proper interaction between different parts of the debugger the systems topology must be mapped to the debuggers topology model. The debugger model abstracts chips and sub-cores of these chips. Every GUI must be connect to one unused core entry in the debugger topology model. Once the SYStem.CPU is selected a generic chip or none generic chip is created at the default chipindex.
None Generic Chips
None generic chips have a fixed amount of sub-cores with a fixed CPU type.
First all cores have successive chip numbers at their GUIs. Therefore you have to assign the coreindex and the chipindex for every core. Usually the debugger does not need further information to access cores in none generic chips, once the setup is correct.
Generic Chips
Generic chips can accommodate an arbitrary amount of sub-cores. The debugger still needs information how to connect to the individual cores e.g. by setting the JTAG chain coordinates.
Start-up Process
The debug system must not have an invalid state where a GUI is connected to a wrong core type of a none generic chip, two GUI are connected to the same coordinate or a GUI is not connected to a core. The initial state of the system is value since every new GUI uses a new chipindex according to its CORE= parameter of the configuration file (config.t32). If the system contains fewer chips than initially assumed, the chips must be merged by calling SYStem.CONFIG.CORE.
Format: SYStem.CONFIG.CORE <coreindex> <chipindex>SYStem.MultiCore.CORE <coreindex> <chipindex> (deprecated)
<chipindex>: 1 … i
<coreindex>: 1 … k
PCP Debugger Reference 33 ©1989-2018 Lauterbach GmbH

SYStem.CONFIG PortSHaRing Control sharing of debug port with other tool
Configure if the debug port is shared with another tool, e.g., an ETAS ETK.
The current setting can be obtained by the PORTSHARING() function, immediate detection can be performed using SYStem.DETECT PortSHaRing.
SYStem.CPU Select CPU
Default: TC1797.
Selects which PCP version to debug. It is possible either to select a generic PCP core or a specific chip where PCP is included in.
The recommended way is to select the appropriate chip, e.g. TriCore TC1797. The debugger knows the implementation details and configures all specific settings automatically.
Format: SYStem.CONFIG PortSHaRing [ON | OFF | Auto]
ON Request for access to the debug port and wait until the access is granted before communicating with the target.
OFF Communicate with the target without sending requests.
Auto Automatically detect a connected tool on next SYStem.Mode Up, SYStem.Mode Attach or SYStem.Mode Go. If a tool is detected switch to mode ON else switch to mode OFF.
Format: SYStem.CPU <cpu>
<cpu> For a list of supported CPUs, use the command SYStem.CPU * or refer to the chip search on the Lauterbach website.
NOTE: In case your device is listed on the website but not listed in the SYStem.CPU * list, you may require a software update. Please contact your responsible Lauterbach representative.
PCP Debugger Reference 34 ©1989-2018 Lauterbach GmbH

PCP1 and PCP2 are generic PCP cores. Implementation specific details, such as the base address for the PCP control registers, the base addresses for code and parameter memory, sizes, etc. have to be done manually. Note that special features such as on-chip trace or synchronization with the main core are not supported by the generic cores.
SYStem.CpuAccess Run-time CPU access (intrusive)
Default: Denied.
This option declares if an intrusive memory access can take place while the CPU is executing code. To perform this access, the debugger stops the CPU shortly, performs the access and then restarts the CPU.
The run-time memory access has to be activated for each window by using the memory class E: (e.g. Data.dump ED:0xA1000000) or by using the format option %E (e.g. Var.View %E var1).
Format: SYStem.CpuAccess <mode>
<mode>: Enable | Denied | Nonstop
Enable Stop the CPU shortly to perform a memory read or write while the program execution is running.Each short stop takes 1 … 100 ms depending on the speed of the debug interface and on the size of the read/write accesses required.
Denied No intrusive memory read or write is possible while the CPU is executing the program.
Nonstop The program execution can not be stopped and the real-time behavior of the CPU is not affected.Nonstop reduces the functionality of the debugger to:
• run-time access to memory and variables
• trace displayThe debugger inhibits the following:
• to stop the program execution
• all features of the debugger that are intrusive (e.g. spot break-points, performance analysis via StopAndGo, conditional break-points etc.)
PCP Debugger Reference 35 ©1989-2018 Lauterbach GmbH

SYStem.JtagClock Set the JTAG frequency
Default: 10.0 MHz.
Selects the frequency for the JTAG clock. This influences the speed of data transmission between target and debugger.
Not all values in between the frequency range can be generated by the debugger. The debugger will select and display the possible value if it can not generate the exact value.It is also possible to enter units, e.g. 10.0 MHz.
SYStem.JtagClock EXT is not supported by PCP.
SYStem.BdmClock is an obsolete alias for this command.
Format: SYStem.JtagClock <rate> SYStem.BdmClock
<rate>: 10000. … 50000000.
The JTAG clock must be lower or equal to the CPU clock. Otherwise JTAG communication will fail.
PCP Debugger Reference 36 ©1989-2018 Lauterbach GmbH

SYStem.LOCK Tristate the JTAG port
Default: OFF.
If the system is locked no access to the JTAG port will be performed by the debugger. While locked the JTAG connector of the debugger is tristated. The intention of the lock command is for example to give JTAG access to another tool. The process can also be automated, see SYStem.CONFIG TriState.
It must be ensured that the state of the TriCore JTAG state machine remains unchanged while the system is locked. To ensure correct hand over the options SYStem.CONFIG TAPState and SYStem.CONFIG TCKLevel must be set properly. They define the TAP state and TCK level which is selected when the debugger switches to tristate mode. Please note: nTRST must have a pull-up resistor on the target.
Format: SYStem.LOCK [ON | OFF]
There is a single cable contact on the casing of the debug cable which can be used to detect if the JTAG connector of the debugger is tristated. If tristated also this signal is tristated, otherwise it is pulled low.
PCP Debugger Reference 37 ©1989-2018 Lauterbach GmbH

SYStem.MemAccess Run-time memory access (non-intrusive)
Default: CPU
This option declares if and how a non-intrusive memory access can take place while the CPU is executing code. Although the CPU is not halted, run-time memory access creates an additional load on the processor’s internal data bus. The MemAccess mode is printed in the state line.
The run-time memory access has to be activated for each window by using the memory class E: (e.g. Data.dump ED:0xA1000000) or by using the format option %E (e.g. Var.View %E var1). It is also possible to enable non-intrusive memory access for all memory areas displayed by setting SYStem.Option DUALPORT ON.
Format: SYStem.MemAccess <mode>SYStem.ACCESS (deprecated)
<mode>: CPU | Denied
CPU The debugger performs non-intrusive memory accesses via the CPU internal buses (FPI Bus).
Denied Non-intrusive memory access is disabled while the CPU is executing code. Instead intrusive accesses can be configured with SYStem.CpuAccess.
PCP Debugger Reference 38 ©1989-2018 Lauterbach GmbH

SYStem.Mode Establish the communication with the CPU
Initial Mode: Down.
The SYStem Modes are not only commands to bring the debugger in a certain debug state, they also reflect the current debug state of the target. SYStem Modes Attach and Go are only transitional states which will result in an Up state on success. Any critical failure will transition the debug state to SYStem Mode Down immediately
The “Emulate” LED on the debug module is ON when the debug mode is active and the CPU is running.
Format: SYStem.Mode <mode>
<mode>: DownNoDebugGoAttachUp
Down Debug mode is not active. Default state and state after fatal errors.
NoDebug Debug mode is not active, debug port is tristate. In this mode PCP behaves as if the debugger is not connected.
Attach User program remains running (no reset) and the debug mode is activated. After this command the user program can be stopped with the break command or if any break condition occurs. The debugger should be in NoDebug mode when performing an Attach.
Go The CPU is running. Debug mode is active. After this command the CPU can be stopped with the break command or if any break condition occurs.
Up The CPU is not in reset but halted. Debug mode is active. In this mode the CPU can be started and stopped. This is the most typical way to activate debugging.
PCP Debugger Reference 39 ©1989-2018 Lauterbach GmbH

SYStem.Option CPU specific commands
The SYStem.Options are a class of architecture and CPU specific commands.
SYStem.Option BreakSignal Generate break signal
Default: ON.
When enabled, PCP generates a hardware signal on execution break. This signal can be made visible on the Debug Port (nBRKOUT pin), and it can be used to break other on-chip resources, e.g. the TriCore CPU.
See Coupling of PCP and Host-core Debugger and the TrOnchip commands for more information on how to distribute this signal.
SYStem.Option CodeBASE PCODE base address
Defines at which base address within the FPI bus the PCP instruction memory is located.
The use of this option is only required for the generic CPUs PCP1 and PCP2. For other CPUs it is already configured correctly.
SYStem.Option CodeSIZE PCP PRAM size
Defines the size of the instruction memory in bytes.
The use of this option is only required for the generic CPUs PCP1 and PCP2. For other CPUs it is already configured correctly.
Format: SYStem.Option BreakSignal [ON | OFF]
Format: SYStem.CodeBASE <address>
Format: SYStem.CodeSIZE <size>
PCP Debugger Reference 40 ©1989-2018 Lauterbach GmbH

SYStem.Option CPUREQ CPU request address
A PCP channel can only be started via a trigger from the CPU. This option defines the trigger register to use for. The address must be in FPI bus address space.
The use of this option is only required for the generic CPUs PCP1 and PCP2. For other CPUs it is already configured correctly.
SYStem.Option DAC Disable all channels on break
Default: ON
When enabled, the execution of all PCP channels is stopped if one channel is stopped by a break or breakpoint. DAC is for “Disable All Channels”.
SYStem.Option DIAG Diagnosis function
System Diagnosis functions. Execute only when demanded by Lauterbach support engineer. Functionality is undocumented, can change without any notice and may bring the debugger software into an unstable state. Do not use in script files.
Format: SYStem.CPUREQ <address>
Format: SYStem.Option DAC [ON | OFF]
Format: SYStem.Option DIAG [<value>] [<param>] [<param>] [<param>]
PCP Debugger Reference 41 ©1989-2018 Lauterbach GmbH

SYStem.Option DUALPORT Run-time memory access for all windows
Default: OFF.
Enable permanent non-intrusive memory access for all windows and memory accesses. Memory class E: does not have to be specified any more. This only works when SYStem.MemAccess is set to CPU.
SYStem.Option PramBASE PRAM base address
Defines at which base address within the FPI bus the PCP data memory is located.
The use of this option is only required for the generic CPUs PCP1 and PCP2. For other CPUs it is already configured correctly.
SYStem.Option PermanentBP Enable breakpoints when single stepping
Default: On.
The generic, architecture-independent behavior of the TRACE32 PowerView software is that no breakpoints are set on the target while a single-step is performed.
Due to the special channel-based and interrupt-triggered design of the PCP architecture and its debug features, other channels might run invisibly before the single-step is executed. For enabling the user to catch such a channel execution this option instructs the debugger to set all breakpoints when a single-step is executed.
Format: SYStem.Option DUALPORT [ON | OFF]
When this option is enabled, no Data.dump or Data.List windows must be opened while programming the on-chip flash. Otherwise flash programming will fail.
Format: SYStem.PramBASE <address>
Format: SYStem.PermanentBP [ON | OFF]
PCP Debugger Reference 42 ©1989-2018 Lauterbach GmbH

SYStem.Option PSIZE PCP PRAM size
Defines the size of the data memory in bytes.
The use of this option is only required for the generic CPUs PCP1 and PCP2. For other CPUs it is already configured correctly.
Format: SYStem.PramSIZE <size>
PCP Debugger Reference 43 ©1989-2018 Lauterbach GmbH

SYStem.Option RegBASE PCP configuration register base address
Defines at which base address within the FPI bus the PCP Register Module is located. Note that with PCP Registers the PCP Configuration Registers are referred, and not the PCP Core registers.
The use of this option is only required for the generic CPUs PCP1 and PCP2. For other CPUs it is already configured correctly.
SYStem.Option SessKEYHIGH Key for unlocking on-chip trace memory
Default: 0x00000000.
Specify the upper 32 bit of a key to unlock the On-chip Trace Memory. This may be necessary when another tool or the boot loader has locked the memory. If such a tool is not used, the default is fine. This option is only applicable for Emulation Devices.
SYStem.Option SessKEYLOW Key for unlocking on-chip trace memory
Default: 0x00000000.
Specify the lower 32 bit of a key to unlock the On-chip Trace Memory. This may be necessary when another tool has locked the memory. If such a tool is not used, the default is fine. This option is only applicable for Emulation Devices.
Format: SYStem.RegBASE <address>
Format: SYStem.Option SKEYHIGH <value>
Format: SYStem.Option SKEYLOW <value>
PCP Debugger Reference 44 ©1989-2018 Lauterbach GmbH

SYStem.Option TB1766FIX Bug fix for some TC1766 TriBoards
Default: OFF.
Bug fix only required for some TriBoards TC1766. On those, two trace pins are swapped. The debugger switches these signals for a correct decoding.
Format: SYStem.Option TB1766FIX [ON | OFF]
PCP Debugger Reference 45 ©1989-2018 Lauterbach GmbH

CPU specific TriggerOnchip Commands
Internal Break Bus (JTAG)
PCP has no dedicated Break Buses, instead it is connected to the Break Buses of TriCore. Refer to “Internal Break Bus (JTAG)” in “TriCore Debugger and Trace” (debugger_tricore.pdf) for more details.
The Break Buses can be uses to distribute break signals from a Break Source to one or more Break Targets. For example TriCore can be stopped concurrently when PCP breaks.
Suspend Switch
PCP has no dedicated Suspend Switch or Suspend Bus. It can be connected to the TriCore Suspend Bus.Refer to “Internal Break Bus (JTAG)” in “TriCore Debugger and Trace” (debugger_tricore.pdf) for more details.
Trace Break Signals (OCDS-L2)
Trace Break Signals as known from TriCore are not available for PCP.
Note that the current PCP implementations do not react on a break signal in case their current state is idle. Then the break is ignored and new channels are triggered.In case PCP should only be prevented from triggering new channels Lauterbach recommends to suspend PCP instead.
Lauterbach recommends not to enable PCP to react on a signal from a Break Bus when PCP is programmed to be suspended when suspend bus is active. This can lead to unpredictable results.
PCP Debugger Reference 46 ©1989-2018 Lauterbach GmbH

TrOnchip.BreakIN Connect break target PCP to BreakBus
Default: DISable, BreakBus0.
When enabled, PCP reacts on a signal from the selected Break Bus.
TrOnchip.BreakOUT Connect break source PCP to BreakBus
Default: DISable, BreakBus0.
When enabled, PCP generates a break signal to the selected Break Bus.
TrOnchip.CONVert Not relevant for the PCP architecture
This command has no relevance for the PCP architecture.
TrOnchip.RESet Reset settings for the on-chip trigger unit
Resets the settings for the trigger on-chip unit to default.
Format: TrOnchip.BreakIN [ENable | DISable]TrOnchip.BreakIN [BreakBus0 | BreakBus1]
Format: TrOnchip.BreakOUT [ENable | DISable]TrOnchip.BreakOUT [BreakBus0 | BreakBus1]
Format: TrOnchip.CONVert [ON | OFF]
Format: TrOnchip.RESet
PCP Debugger Reference 47 ©1989-2018 Lauterbach GmbH

TrOnchip.SusTarget Connect PCP to the suspend bus
Default: DISable.
When enabled, PCP is suspended when the Suspend Bus gets active. The PCP pipeline gets stalled and no debug actions are possible.
Format: TrOnchip.SusTarget.PCP [ON | OFF]
PCP Debugger Reference 48 ©1989-2018 Lauterbach GmbH

CPU specific BenchMarkCounter Commands
The benchmark counters can be read at run-time.
For information about the architecture-independent BMC commands, refer to “BMC” (general_ref_b.pdf).
For information about architecture-specific BMC command(s), see command description(s) below.
BMC.<counter>.ATOB Advise counter to count within AB-range
Advise the counter to count the specified event only in AB-range. Alpha and Beta markers are used to specify the AB-range.
Example to measure the time used by the function sieve:
Format: BMC.<counter>.ATOB [ON | OFF]
BMC.<counter> ClockCylces ; <counter> counts clock cycles
BMC.CLOCK 450.Mhz ; core is running at 450.MHz
Break.Set sieve /Alpha ; set a marker Alpha to the entry ; of the function sieve
Break.Set V.END(sieve)-1 /Beta ; set a marker Beta to the exit ; of the function sieve
BMC.<counter>.ATOB ON ; advise <counter> to count only ; in AB-range
PCP Debugger Reference 49 ©1989-2018 Lauterbach GmbH

JTAG Connector
Debug access is always performed via the Debug Port of the main core debugger. Currently PCP is only implemented in the TriCore Architecture.
In case of TriCore, this is the JTAG connector. For detailed information see chapter JTAG Connector in “TriCore Debugger and Trace” (debugger_tricore.pdf) and “Application Note Debug Cable TriCore” (tricore_app_ocds.pdf).
Trace Connector
Off-chip Trace Data is always received via the Trace Port of the main core. Currently PCP is only implemented in the TriCore Architecture.
In case of TriCore, this is the OCDS-L2 connector. For detailed information see chapter Trace Connector in “TriCore Debugger and Trace” (debugger_tricore.pdf).
PCP Debugger Reference 50 ©1989-2018 Lauterbach GmbH

Support
Available Tools
Compilers
Target Operating Systems
Language Compiler Company Option Comment
C VX-PCP TASKING ELF/DWARF
PCP Debugger Reference 51 ©1989-2018 Lauterbach GmbH

3rd-Party Tool Integrations
CPU Tool Company Host
WINDOWS CE PLATF. BUILDER
- Windows
CODE::BLOCKS - -C++TEST - WindowsADENEO -X-TOOLS / X32 blue river software GmbH WindowsCODEWRIGHT Borland Software
CorporationWindows
CODE CONFIDENCE TOOLS
Code Confidence Ltd Windows
CODE CONFIDENCE TOOLS
Code Confidence Ltd Linux
EASYCODE EASYCODE GmbH WindowsECLIPSE Eclipse Foundation, Inc WindowsCHRONVIEW Inchron GmbH WindowsLDRA TOOL SUITE LDRA Technology, Inc. WindowsUML DEBUGGER LieberLieber Software
GmbHWindows
SIMULINK The MathWorks Inc. WindowsATTOL TOOLS MicroMax Inc. WindowsVISUAL BASIC INTERFACE
Microsoft Corporation Windows
LABVIEW NATIONAL INSTRUMENTS Corporation
Windows
TPT PikeTec GmbH WindowsCANTATA QA Systems Ltd WindowsRAPITIME Rapita Systems Ltd. WindowsRHAPSODY IN MICROC IBM Corp. WindowsRHAPSODY IN C++ IBM Corp. WindowsDA-C RistanCASE WindowsTRACEANALYZER Symtavision GmbH WindowsECU-TEST TraceTronic GmbH WindowsUNDODB Undo Software LinuxTA INSPECTOR Vector WindowsVECTORCAST UNIT TESTING
Vector Software Windows
VECTORCAST CODE COVERAGE
Vector Software Windows
PCP Debugger Reference 52 ©1989-2018 Lauterbach GmbH
Products
Product Information
PCP Debugger (OCDS-L1), Off-chip Trace (OCDS-L2) and On-chip Trace (OCDS-L3) is part of the main core debugger of the architecture it is included in. Currently PCP is only implemented in the TriCore Architecture.
For detailed Product Information on TriCore based products see chapter Product Information in “TriCore Debugger and Trace” (debugger_tricore.pdf)
Order Information
PCP Debugger (OCDS-L1), Off-chip Trace (OCDS-L2) and On-chip Trace (OCDS-L3) is part of the main core debugger of the architecture it is included in. Currently PCP is only implemented in the TriCore Architecture.
For detailed Order Information on TriCore based products see chapter Order Information in “TriCore Debugger and Trace” (debugger_tricore.pdf).
PCP Debugger Reference 53 ©1989-2018 Lauterbach GmbH


![SH2, SH3 and SH4 Debugger - Lauterbach · SH2, SH3 and SH4 Debugger 10 ©1989-2020 Lauterbach GmbH Enable 8-bit AUD Trace Interface of SH4-202 The CPUs AUD trace lines AUD[7..4] are](https://img.pdfslide.us/doc/110x75/5fb904018f400302fc36e759/sh2-sh3-and-sh4-debugger-lauterbach-sh2-sh3-and-sh4-debugger-10-1989-2020.jpg)