Embed Size (px)
Citation preview

PCMDI
Facilitating the Use of Satellite Observations for Evaluating CMIP5/IPCC Simulations
“Confronting Models with Observations”
Robert Ferraro, Duane Waliser, Joao Teixeira
Jet Propulsion Laboratory, California Institute of Technology, Pasadena, CA
Peter Gleckler, Karl Taylor
Program on Climate Modeling Diagnostics and Intercomparison (PCMDI), Livermore, CA
First Interaction meeting of the Climate Modelling User GroupECMWF
Reading, UKMarch 14 - 16
Copyright 2011 California Institute of Technology. All rights reserved.
PCMDI
IPCC Models: Global Average Precipitation
0.0
0.5
1.0
1.5
2.0
2.5
3.0
3.5
Prec
ipit
atio
n (m
m/d
ay)
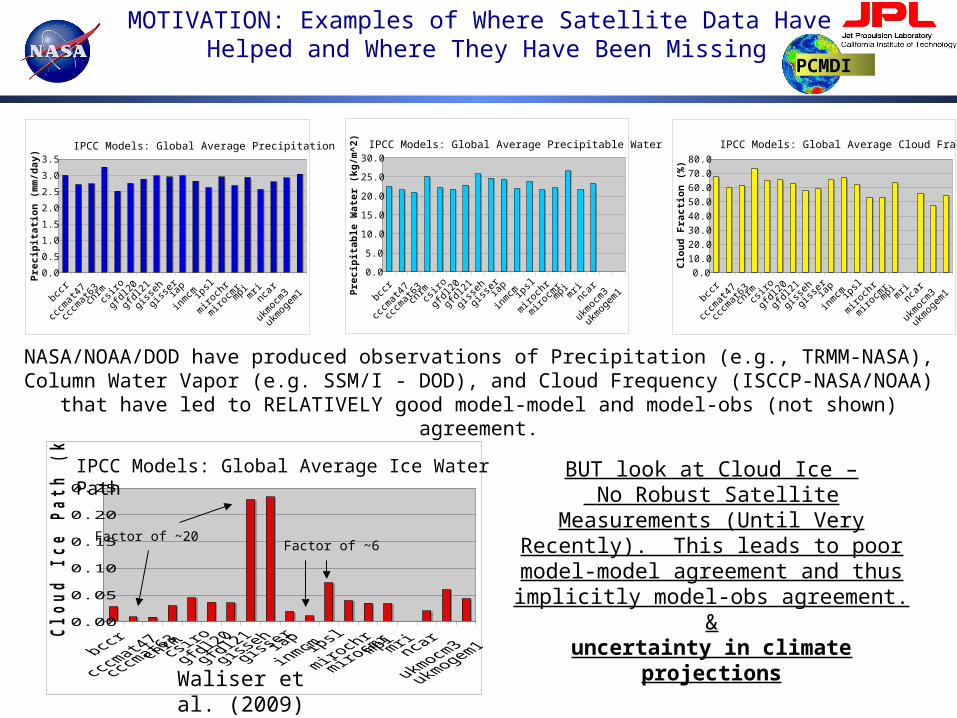
MOTIVATION: Examples of Where Satellite Data Have Helped and Where They Have Been Missing
IPCC Models: Global Average Precipitable Water
0.0
5.0
10.0
15.0
20.0
25.0
30.0
Prec
ipit
able
Wat
er (k
g/m
^2)
IPCC Models: Global Average Cloud Fraction
0.0
10.0
20.0
30.040.0
50.0
60.0
70.0
80.0
Clou
d Fr
acti
on (%
)
NASA/NOAA/DOD have produced observations of Precipitation (e.g., TRMM-NASA), Column Water Vapor (e.g. SSM/I - DOD), and Cloud Frequency (ISCCP-NASA/NOAA) that have led to
RELATIVELY good model-model and model-obs (not shown) agreement.
IPCC Models: Global Average Precipitation IPCC Models: Global Average Cloud FractionIPCC Models: Global Average Precipitable Water
IPCC Models: Global Average Ice Water Path
0.00
0.05
0.10
0.15
0.20
0.25
Clo
ud
Ice
Path
(kg
/m^
2)
Factor of ~20Factor of ~6
BUT look at Cloud Ice – No Robust Satellite Measurements (Until Very Recently). This leads to poor model-model agreement and
thus implicitly model-obs agreement.&
uncertainty in climate projections
IPCC Models: Global Average Ice Water Path
Waliser et al. (2009)

PCMDI
Mean Cloud IWP from 16 IPCC Contributions of 20th Century Climate : Color scale ~ log10:
We need to use our observations to reduce this uncertainty.
CloudSat Total IWP
CloudSat IWP Conditionally Filtered to better
Approximate/Validate GCM-modeled Cloud IWP
Waliser et al. 2009
MOTIVATION: Examples of Where Satellite Data Have Helped and Where They Have Been Missing
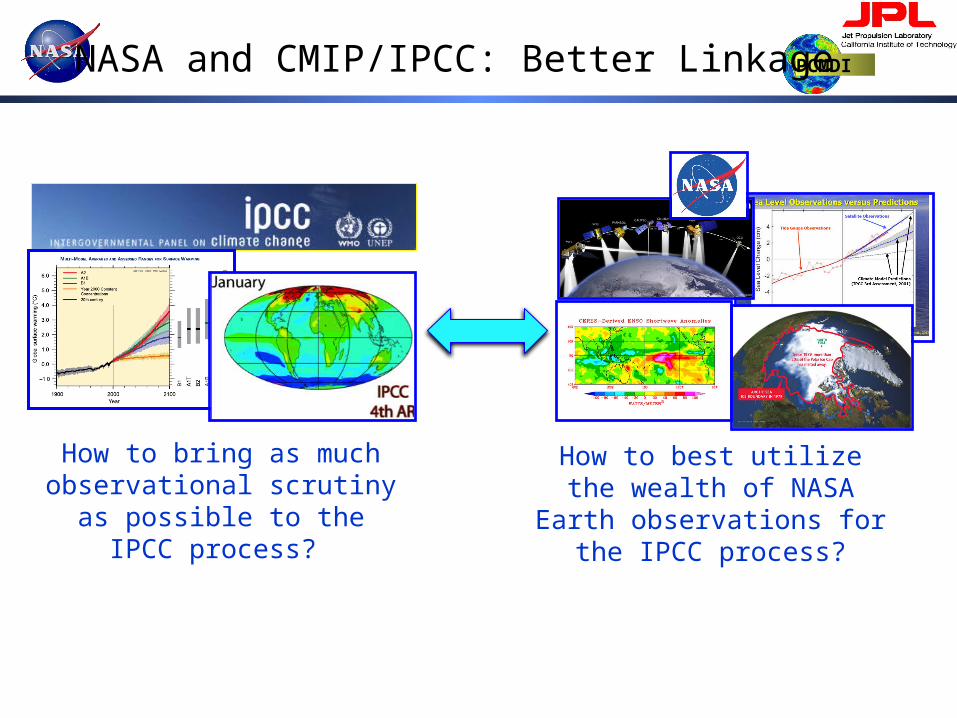
PCMDINASA and CMIP/IPCC: Better Linkage
How to bring as much observational scrutiny as
possible to the IPCC process?
How to best utilize the wealth of NASA Earth observations
for the IPCC process?
PCMDI
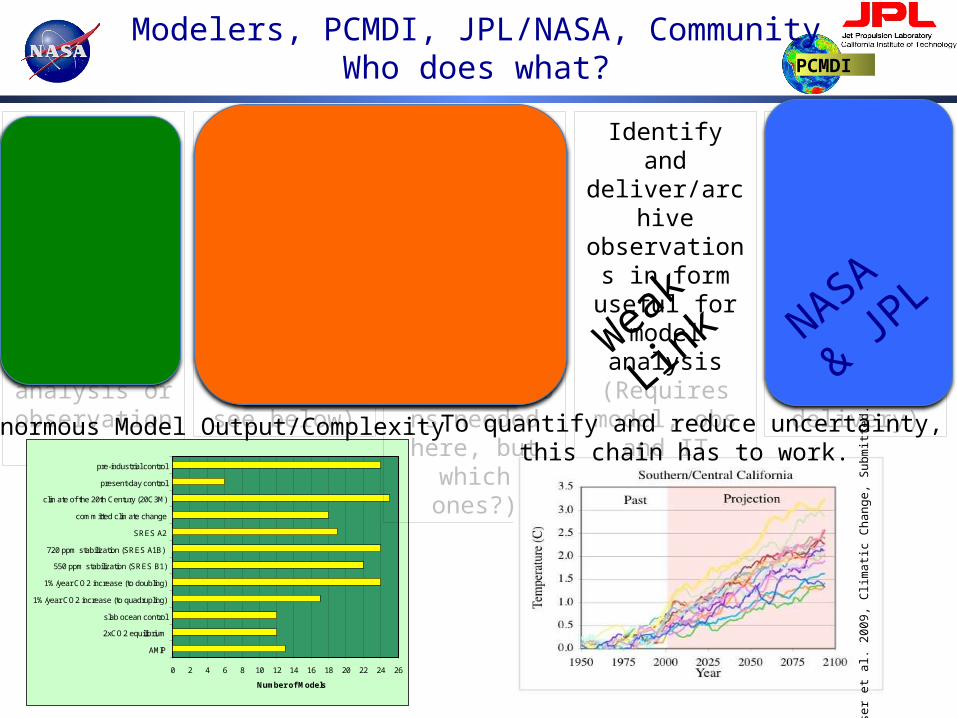
Modelers, PCMDI, JPL/NASA, CommunityWho does what?
Produce Simulations &
Projections(HUGE job;
focus on model development – not analysis or observations)
Model output archived in a
uniform fashion to facilitate
access and analysis. (Far from trivial – see below)
0 2 4 6 8 10 12 14 16 18 20 22 24 26
pre-industrial control
present-day control
climate of the 20th Century (20C3M)
committed climate change
SRES A2
720 ppm stabilization (SRES A1B)
550 ppm stabilization (SRES B1)
1%/year CO2 increase (to doubling)
1%/year CO2 increase (to quadrupling)
slab ocean control
2xCO2 equilibrium
AMIP
Number of Models
Sophisticated development
and application of model
diagnostics for evaluation
(Observations needed here,
but which ones?)
Identify and deliver/archive observations in form useful for model analysis
(Requires model, obs
and IT expertise)
Develop global observations relevant to
climate change research
(Focus on hardware, retrievals, delivery)PCMDINASA
& JPL
Modeling
Centers
Weak
Link
Enormous Model Output/Complexity To quantify and reduce uncertainty, this chain has to work.
Wa
lise
r e
t al
. 2
00
9, C
lima
tic C
ha
nge
, S
ubm
itted
.
PCMDI
6
What to do about the weak link?
Taylor et al (2009) have defined the protocol for the CMIP5 simulations that will be used for the next IPCC Assessment Report, AR5.
The protocol defines the scope of simulations that will be undertaken by the participating modeling groups.
For several of the prescribed retrospective simulations (e.g, decadal hindcasts, AMIP and 20th Century coupled simulations) observational data sets can be used to evaluate and diagnose the simulation outputs.
However, to date, the pertinent observational data sets to perform these particular evaluations have not been optimally identified and coordinated to readily enable their use in the context of CMIP5.
Observations may match model variablesbut usually differ in file format, metadata standard, and may have subtle
characteristics that are not obvious to the non-expert
Observational Scientists make datasets for process studies – not for model evaluation
PCMDI
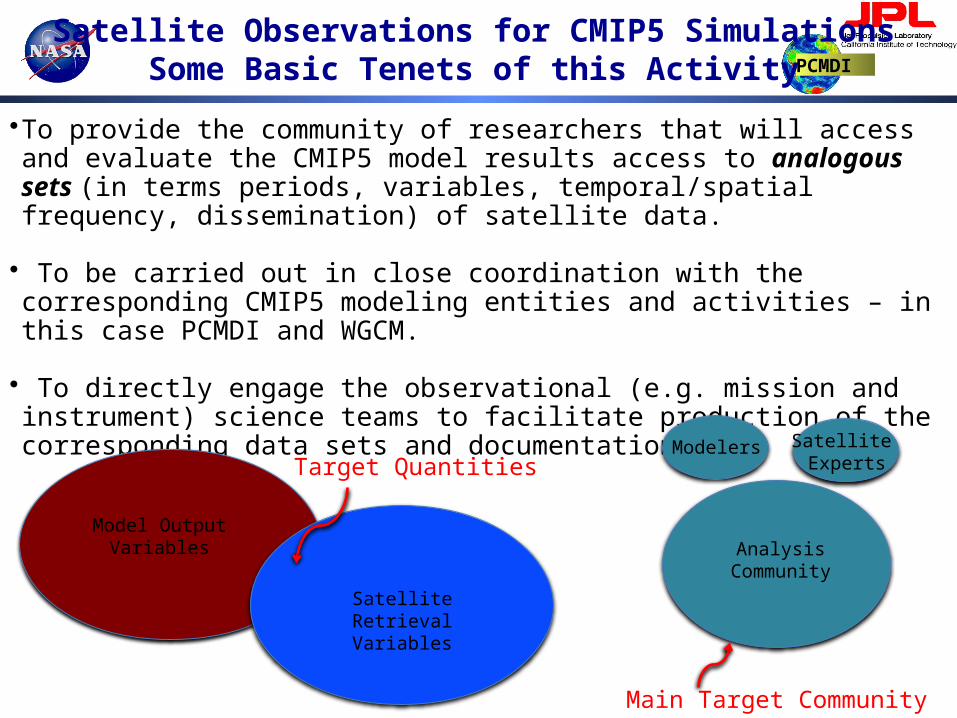
•To provide the community of researchers that will access and evaluate the CMIP5 model results access to analogous sets (in terms periods, variables, temporal/spatial frequency, dissemination) of satellite data.
• To be carried out in close coordination with the corresponding CMIP5 modeling entities and activities – in this case PCMDI and WGCM.
• To directly engage the observational (e.g. mission and instrument) science teams to facilitate production of the corresponding data sets and documentation.
Modelers Satellite Experts
AnalysisCommunity
Main Target Community
Model OutputVariables
Satellite RetrievalVariables
Target Quantities
Satellite Observations for CMIP5 SimulationsSome Basic Tenets of this Activity
PCMDI
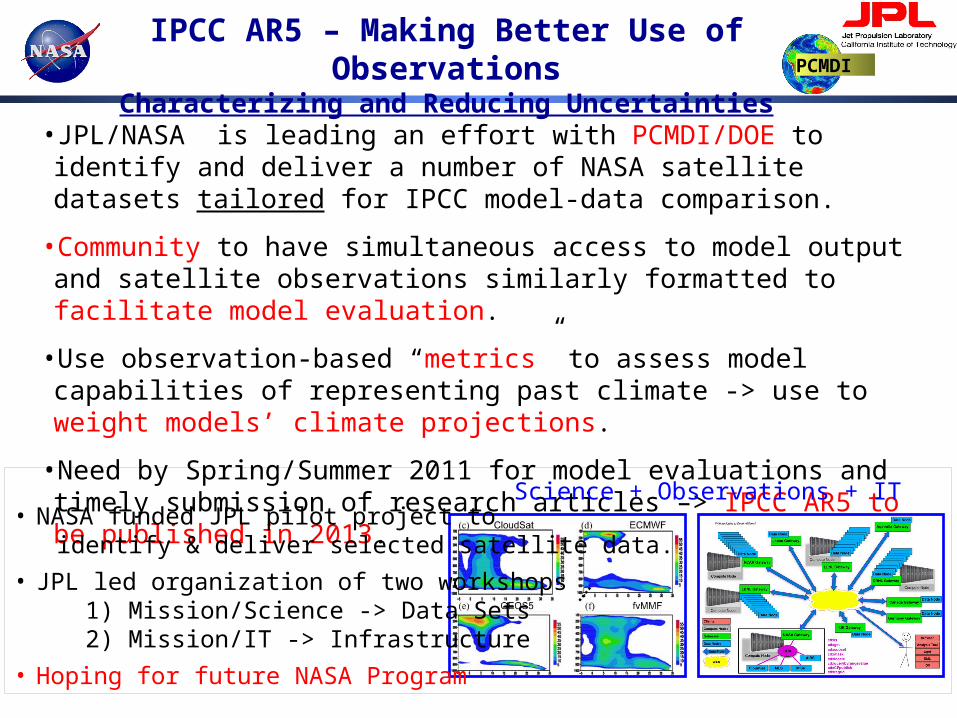
IPCC AR5 – Making Better Use of ObservationsCharacterizing and Reducing Uncertainties
•JPL/NASA is leading an effort with PCMDI/DOE to identify and deliver a number of NASA satellite datasets tailored for IPCC model-data comparison.
•Community to have simultaneous access to model output and satellite observations similarly formatted to facilitate model evaluation.
•Use observation-based “metrics” to assess model capabilities of representing past climate -> use to weight models’ climate projections.
•Need by Spring/Summer 2011 for model evaluations and timely submission of research articles –> IPCC AR5 to be published in 2013.
Science + Observations + IT• NASA funded JPL pilot project to identify & deliver selected satellite data.
• JPL led organization of two workshops 1) Mission/Science -> Data Sets 2) Mission/IT -> Infrastructure
• Hoping for future NASA Program
PCMDI
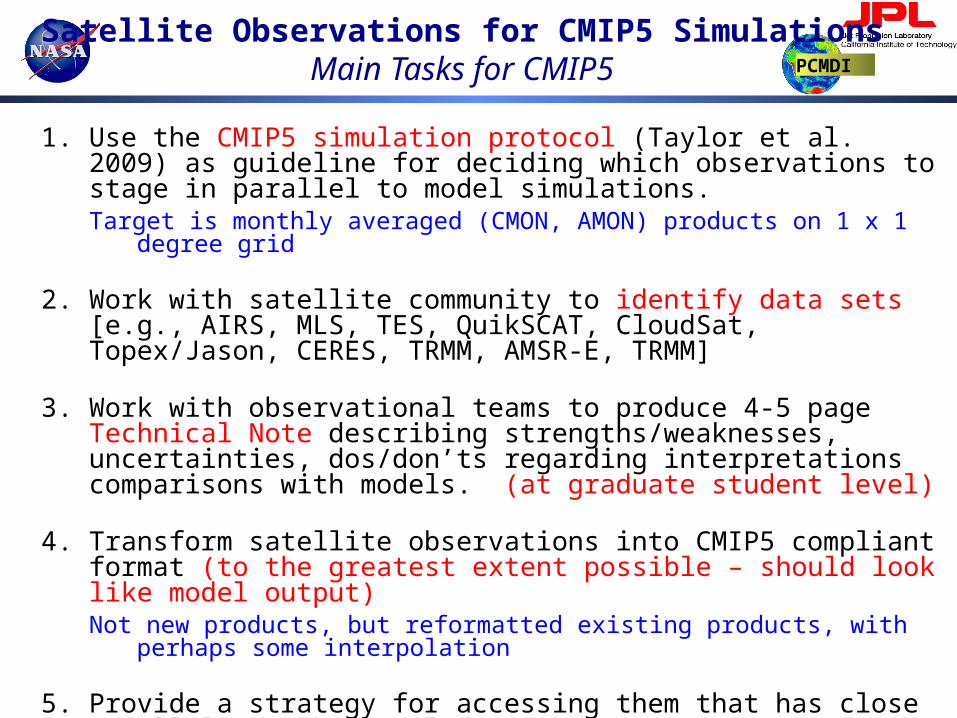
1. Use the CMIP5 simulation protocol (Taylor et al. 2009) as guideline for deciding which observations to stage in parallel to model simulations.Target is monthly averaged (CMON, AMON) products on 1 x 1 degree grid
2. Work with satellite community to identify data sets [e.g., AIRS, MLS, TES, QuikSCAT, CloudSat, Topex/Jason, CERES, TRMM, AMSR-E, TRMM]
3. Work with observational teams to produce 4-5 page Technical Note describing strengths/weaknesses, uncertainties, dos/don’ts regarding interpretations comparisons with models. (at graduate student level)
4. Transform satellite observations into CMIP5 compliant format (to the greatest extent possible – should look like model output)Not new products, but reformatted existing products, with perhaps some
interpolation
5. Provide a strategy for accessing them that has close parallels to the model data archive (e.g. ESG).
6. Advertise availability of observations for use in CMIP5 analysis.
Satellite Observations for CMIP5 SimulationsMain Tasks for CMIP5
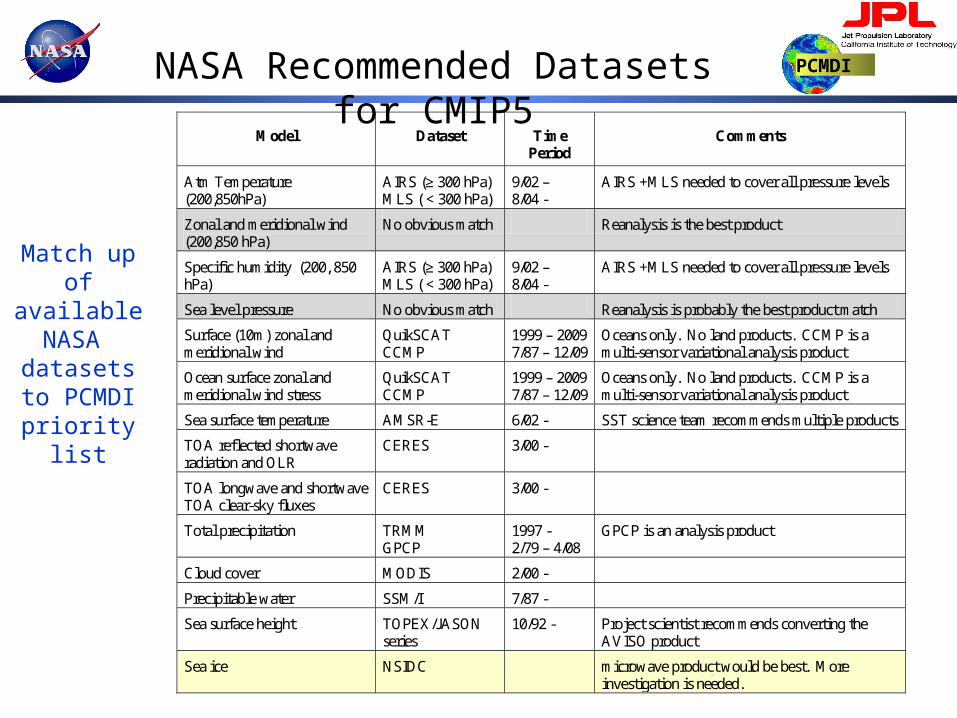
PCMDINASA Recommended Datasets for CMIP5
Match up of available NASA
datasets to PCMDI
priority list
10
Model Dataset Time Period
Comments
Atm Temperature (200,850hPa)
AIRS (≥ 300 hPa) MLS ( < 300 hPa)
9/02 – 8/04 -
AIRS +MLS needed to cover all pressure levels
Zonal and meridional wind (200,850 hPa)
No obvious match Reanalysis is the best product
Specific humidity (200, 850 hPa)
AIRS (≥ 300 hPa) MLS ( < 300 hPa)
9/02 – 8/04 -
AIRS +MLS needed to cover all pressure levels
Sea level pressure No obvious match Reanalysis is probably the best product match
Surface (10m) zonal and meridional wind
QuikSCAT CCMP
1999 – 2009 7/87 – 12/09
Oceans only. No land products. CCMP is a multi-sensor variational analysis product
Ocean surface zonal and meridional wind stress
QuikSCAT CCMP
1999 – 2009 7/87 – 12/09
Oceans only. No land products. CCMP is a multi-sensor variational analysis product
Sea surface temperature AMSR-E 6/02 - SST science team recommends multiple products
TOA reflected shortwave radiation and OLR
CERES 3/00 -
TOA longwave and shortwave TOA clear-sky fluxes
CERES 3/00 -
Total precipitation TRMM GPCP
1997 - 2/79 – 4/08
GPCP is an analysis product
Cloud cover MODIS 2/00 -
Precipitable water SSM/I 7/87 -
Sea surface height TOPEX/JASON series
10/92 - Project scientist recommends converting the AVISO product
Sea ice NSIDC microwave product would be best. More investigation is needed.
PCMDISatellite Observations for CMIP5 Simulations
“Technical Note”
Target audience is modeling community members who have little experience with NASA datasets
Content
Intent of the Document/POC
Data Field Description
Data Origin
Validation and Uncertainty Estimate
Considerations for Model – Observation Intercomparison
Instrument Overview
References
Revision History
Guidance documents (and project related stuff) posted at
http://oodt.jpl.nasa.gov/wiki/display/CLIMATE
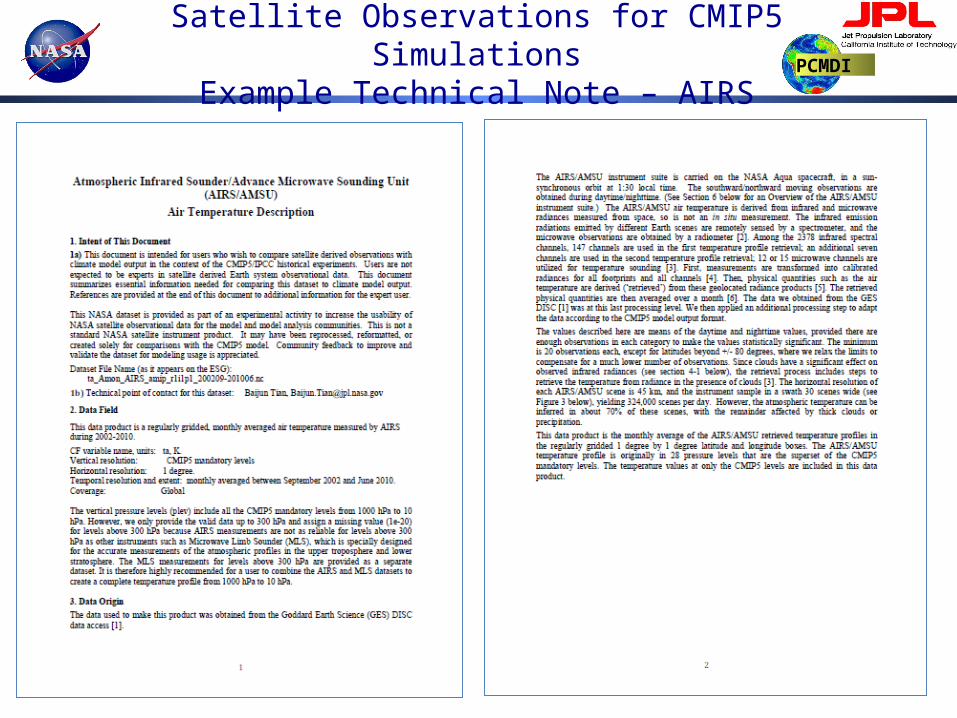
PCMDISatellite Observations for CMIP5 Simulations
Example Technical Note – AIRS
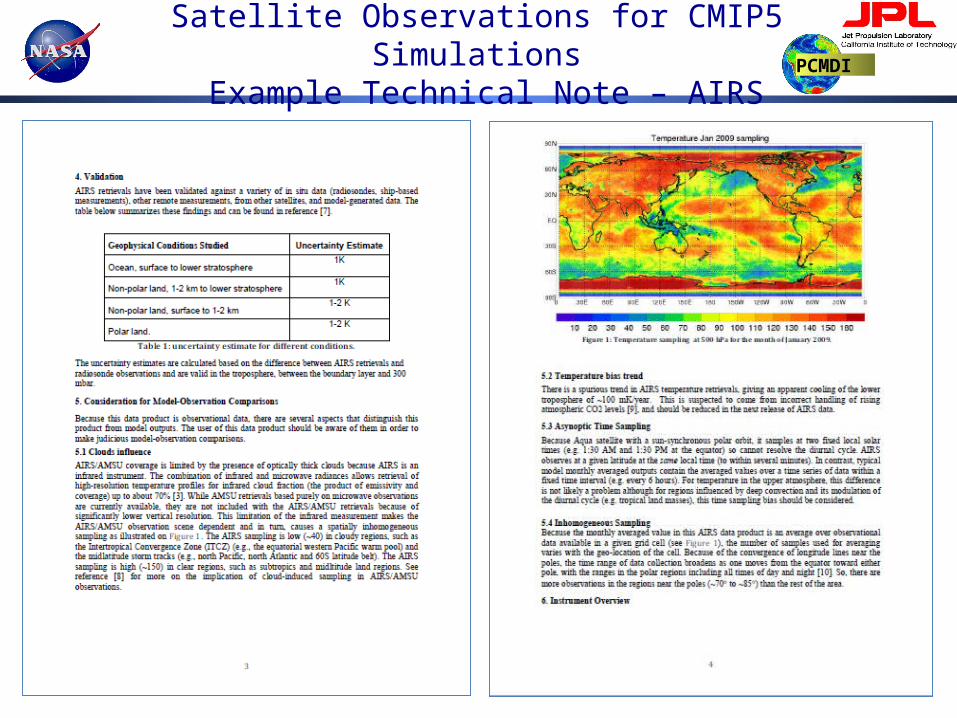
PCMDISatellite Observations for CMIP5 Simulations
Example Technical Note – AIRS

PCMDISatellite Observations for CMIP5 Simulations
Example Technical Note – AIRS
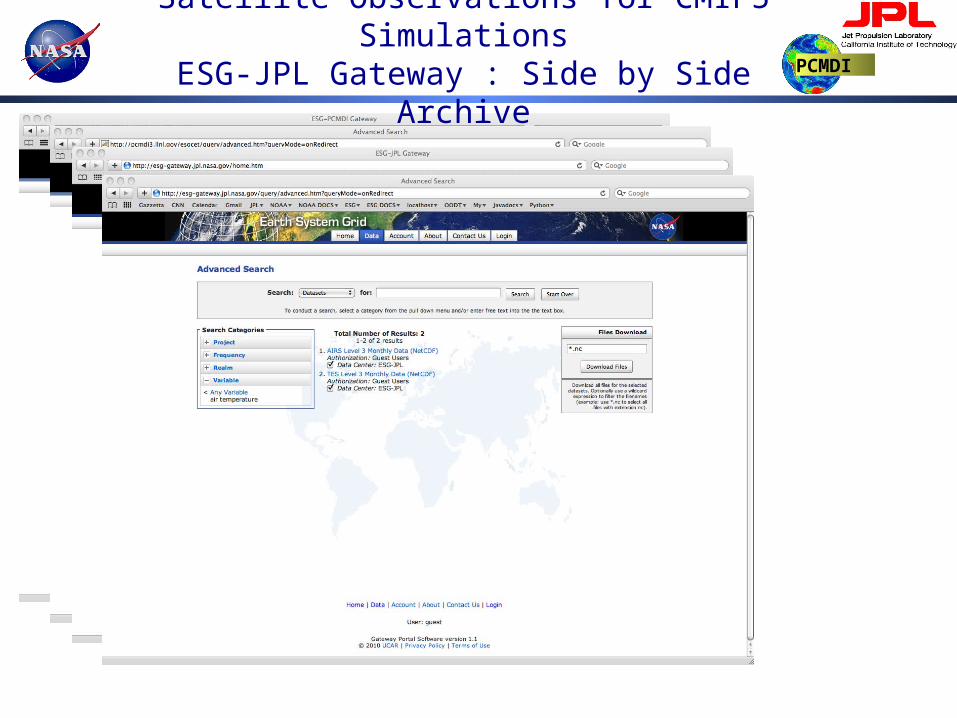
PCMDISatellite Observations for CMIP5 SimulationsESG-JPL Gateway : Side by Side Archive
PCMDI
IPCC AR5New Emphases, Opportunities, & Needs
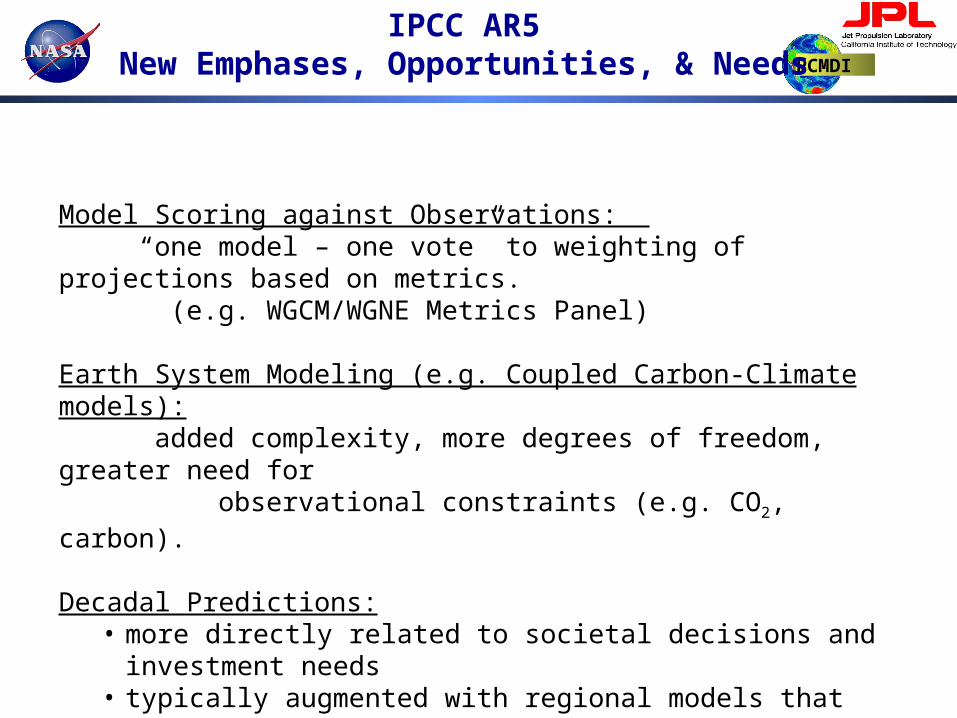
Model Scoring against Observations: “one model – one vote” to weighting of projections based on metrics. (e.g. WGCM/WGNE Metrics Panel)
Earth System Modeling (e.g. Coupled Carbon-Climate models): added complexity, more degrees of freedom, greater need for observational constraints (e.g. CO2, carbon).
Decadal Predictions:• more directly related to societal decisions and investment needs• typically augmented with regional models that provide
downscaling with added processes/realism.• such models need observational scrutiny too.
PCMDI
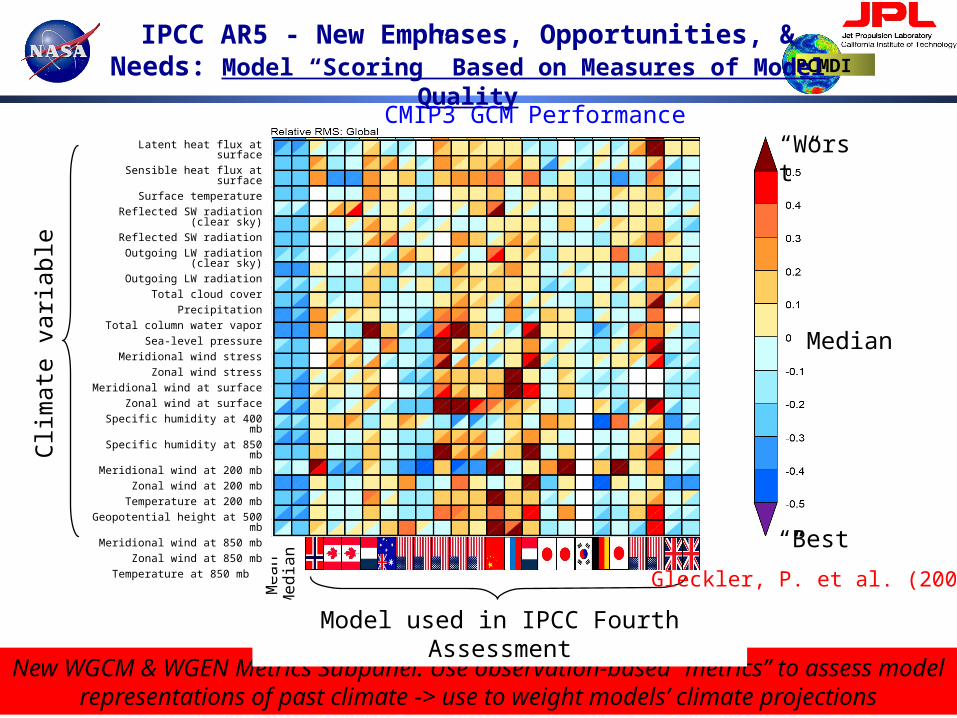
IPCC AR5 - New Emphases, Opportunities, & Needs: Model “Scoring” Based on Measures of Model Quality
New WGCM & WGEN Metrics Subpanel: Use observation-based “metrics” to assess model representations of past climate -> use to weight models’ climate projections
Me
an
Me
dia
n
Latent heat flux at surface
Sensible heat flux at surface
Surface temperature
Reflected SW radiation (clear sky)
Reflected SW radiation
Outgoing LW radiation (clear sky)
Outgoing LW radiation
Total cloud cover
Precipitation
Total column water vapor
Sea-level pressure
Meridional wind stress
Zonal wind stress
Meridional wind at surface
Zonal wind at surface
Specific humidity at 400 mb
Specific humidity at 850 mb
Meridional wind at 200 mb
Zonal wind at 200 mb
Temperature at 200 mb
Geopotential height at 500 mb
Meridional wind at 850 mb
Zonal wind at 850 mb
Temperature at 850 mb
“Worst”
“Best”
Clim
ate
varia
ble
Gleckler, P. et al. (2008)
Model used in IPCC Fourth Assessment
Median
CMIP3 GCM Performance
PCMDI
Pilot Project to establish a NASA-wide capability for the climate modeling community to support model-to-data intercomparison. This involves IT, satellite retrieval, data set, modeling and science expertise.
Longer TermProvide a science “bridge” between models and satellite observations to facilitate model improvement and reduce projection uncertainty. This is also a focus of the new JPL Center for Climate Science.
UltimatelyUtilize feedback/community collaboration to develop future climate-critical satellite missions. The modeling community has yet to be galvanized to provide feedback to the satellite-development community.
This project is on course to deliver NASA satellite data sets by the end of May for the evaluation of CMIP5 climate model archive and impact the IPCC AR5.
Satellite Observations for Climate ModelingSUMMARY