Embed Size (px)
Citation preview

Hydrogen Q1adsorption and desorption at thePt(110)-(1 ! 2) surface: experimental andtheoretical study
Sigrıdur Gudmundsdottir,a Egill Skulason,a Kees-Jan Weststrate,b Ludo Juurlinkb
and Hannes Jonsson*a
The interaction of hydrogen with the Pt(110)-(1 ! 2) surface is studied using temperature programmeddesorption (TPD) measurements and density functional theory (DFT) calculations. The ridges in this surfaceresemble edges between micro-facets of Pt nano-particle catalysts used for hydrogen evolution (HER) andhydrogen oxidation reactions (HOR). The binding energy and activation energy for desorption are found todepend strongly on hydrogen coverage. At low coverage, the strongest binding sites are found to be thelow coordination bridge sites at the edge and this is shown to agree well with the He-atom interaction andwork function change which have been reported previously. At higher hydrogen coverage, the highercoordination sites on the micro-facet and in the trough get populated. The simulated TPD spectra based onthe DFT results are in close agreement with our experimental spectra and provide microscopicinterpretation of the three measured peaks. The lowest temperature peak obtained from the surface withhighest hydrogen coverage does not correspond to desorption directly from the weakest binding sites, thetrough sites, but is due to desorption from the ridge sites, followed by subsequent, thermally activatedrearrangement of the H-adatoms. The reason is low catalytic activity of the Pt-atoms at the trough sites andlarge reduction in the binding energy at the ridge sites at high coverage. The intermediate temperaturepeak corresponds to desorption from the micro-facet. The highest temperature peak again corresponds todesorption from the ridge sites, giving rise to a re-entrant mechanism for the thermal desorption.
I. Introduction
The interaction of hydrogen with the surface of platinum metal isof fundamental importance to a wide range of technologiesincluding various catalytic reactions, electrolysis and hydrogen fuelcells. The metal is typically dispersed in small particles embeddedin a matrix. The trend is to make the particles smaller, even downto the nanoscale. For particles of FCC metals, the most commonfacets will be the low energy (111) and (100) facets.1 It has beensuggested that the catalytically active sites are steps on these facets2
or edges between the facets.3 The missing row reconstructedPt(110)-(1 ! 2) surface can be used as a periodic model of edgesites between (111) facets in theoretical calculations.4,5
The hydrogen evolution reaction (HER) and hydrogen oxidationreaction (HOR) are the key reactions in electrolysis of water and in
hydrogen fuel cells. There, solvated protons in the electrolyte andelectrons from the electrode form hydrogen molecules or themolecule dissociates into protons and electrons, respectively. Simu-lations have been used to model the interface between the electrolyteand the electrode with density functional theory.6–10 Minimumenergy path calculations for the transitions have shown that theTafel reaction (2H* o"> H2) is faster than the Heyrovsky reaction(H+ + e" + H* o"> H2) at U = 0 V vs. SHE on all transition metalsurfaces, for all the common facets, with and without defects.8 As aresult, it is not necessary to include the complicated electrochemicalinterface in calculations of the rate of HER and HOR for theseconditions, it is su!cient to focus on the formation of H2 fromadsorbed H-adatoms and dissociation of H2 to form two H-adatoms.
The (110) surface of platinum has a missing row reconstruc-tion, both the clean surface and the hydrogen covered surface.11,12
The interaction of hydrogen with this surface has been studiedextensively both experimentally and theoretically.8,13–18
Engstrom et al.16 carried out temperature programmeddesorption (TPD), LEED and work function measurements.Their two peak TPD spectra indicated two types of binding sites
Cite this: DOI: 10.1039/c3cp44503h
a Science Institute and Faculty of Physical Sciences, VR-III, University of Iceland,107 Reykjavık, Iceland
b Leiden Institute of Chemistry, Leiden University, P.O. Box 9502, 2300 RA Leiden,The Netherlands
Received 13th December 2012,Accepted 5th March 2013
DOI: 10.1039/c3cp44503h
www.rsc.org/pccp
This journal is #c the Owner Societies 2013 Phys. Chem. Chem. Phys., 2013, 00, 1–10 | 1
PCCP
PAPER

on the surface with desorption from the high temperature state, b2,described by first order Langmuir kinetics consistent with attractiveinteraction between H-adatoms while desorption from the lowertemperature state, b1, described by second order kinetics. The ratiobetween the integrated desorption corresponding to the two peaks,b2 :b1, was reported as 1 : 2. Consistent with the general trend forH-adatoms to prefer high coordination sites on metal surfaces, thiswas interpreted in terms of preferential binding to the trough siteswith subsequent binding to facet sites. A third peak in the TPDspectrum, labeled a, with integrated desorption similar to b2 hassince been identified after longer exposure to hydrogen gas.17
The assignment of the three peaks in the TPD to bindingsites on the surface has remained controversial. He-atomscattering experiments indicated that H-atoms first fill sitesassociated with the edge since a large increase in corrugation ofthe He–surface interaction potential was observed upon lowcoverage adsorption of hydrogen.19 This, however, remainedcontroversial18 and preference for trough sites continued to bewidely assumed. Results of DFT calculations have since shownclear preference for the low coordinated ridge sites.13,15 Thetrough sites have the weakest binding, weaker than sites on the(111) micro facets. It is tempting to assign the three peaks inthe TPD spectra to three binding sites on the surface: the bridgesite on the ridge (b2), the on-top site on the facet (b1) and thelong bridge site in the trough (a), see Minca et al.13 The bindingenergy and coverage ratio between these binding sites matchqualitatively the order of the TPD peaks and the integrateddesorption for each peak. But, unlike direct desorption ofatoms and intact molecules from surfaces, associativedesorption can involve an activation energy barrier and theinterpretation of TPD spectra is, therefore, not straightforward.
Previous theoretical calculations of hydrogen on Pt surfaceshave mostly focused on the binding energy at various sites andthe construction of potential energy surfaces for dynamicalcalculations of the dissociative adsorption on clean Pt surfaces.Here, we report results of calculations of the activation barrierfor hydrogen desorption and adsorption at the Pt(110)-(1 ! 2)surface as a function of coverage, ranging from zero to fullcoverage. Calculations of H-binding to the Pd(110)-(1 ! 2)surface are also presented for comparison. In addition, wereport measured TPD spectra of H2 desorption from thePt(110)-(1 ! 2) surface which has been designed to avoid H2
desorption from edges of the crystal, which can introduce othersites than those under investigation. With this setup, a hightemperature shoulder-free spectrum is observed. We give a newinterpretation of the experimental TPD spectra for the Pt(110)-(1 ! 2) surface (preliminary description of the simulationresults has been reported in ref. 20). The activation energybarriers obtained from the DFT calculations are used to simu-late TPD spectra using coupled kinetic equations and theresults show that the common way of assigning each peak ina TPD spectrum to a di"erent binding site on the surface doesnot accurately represent the mechanism of the associativedesorption process on this surface. Here, we give the morecomplete description of the calculations and present newexperimental measurements of the TPD spectrum.
II. Methodology
The density functional theory (DFT)21 calculations for the struc-ture relaxations and minimum energy path (MEP) calculationswere performed using the Vienna ab initio Simulation Package(VASP)22 using the RPBE functional approximation.23 Thed-band center calculations were performed using the Dacaposoftware24 with the same RPBE functional. In each case, theoptimized lattice constant was used, 4.011 Å in VASP and 4.020 Åin Dacapo. All calculations used a plane-wave basis to representvalence electrons and ultra-soft pseudopotentials25,26 to repre-sent the ionic cores. A plane wave cuto" of 33 Ry (450 eV) wasused in the VASP calculations and 26 Ry (354 eV) in the Dacapocalculations. Only insignificant di"erences were found betweenresults obtained from the two software packages.
The Pt(110)-(1 ! 2) system as well as the Pd(110)-(1 ! 2)system consist of most of the calculations of an eight layer thickperiodic (3! 2) model cell with one row of the top layer missing.The bottom four layers were kept frozen while the upper fourlayers were allowed to relax. The RPBE optimized lattice constantfor Pt was also used for the Pd surface calculations. A k-pointsampling of the 4 ! 4 ! 1 Monkhorst–Pack grid was used in allcalculations. The spacing between periodic images of the slabswas at least 10 Å. All configurations were optimized until atomicforces were less than 0.01 eV Å"1. Convergence tests for thek-point sampling were performed for the Pt(110)-(1 ! 2) where acomparison of 4 ! 4 ! 1 and 6 ! 6 ! 1 k-point sampling gave inall cases an energy di"erence of less than 0.01 eV.
The minimum energy paths (MEPs) for di"usion andadsorption–desorption of hydrogen were calculated using theclimbing image nudged elastic band (CI-NEB) method.27–29 Theactivation energy was calculated from the MEPs and ratesestimated using harmonic transition state theory. The workfunction was calculated as the di"erence between the electro-static potential in the central, vacuum region and the Fermilevel. The exchange–correlation potential was excluded fromthe potential since it decays rather slowly in the vacuum regionbut necessarily should go to zero in the vacuum where thecharge density goes to zero.
A home-built surface science system in Leiden was usedto experimentally study H2 desorption from the clean Pt(110)-(1 ! 2) surface. The system is equipped with a sputter iongun for sample cleaning, LEED optics (VG RVL900), and adi"erentially pumped quadrupole mass spectrometer (QMS,UTI 100c). The base pressure is lower than 5 ! 10"10 mbar.The sample is a 6 mm diameter and 1 mm thick Pt sample cutand polished to expose a (110) plane (by Surface PreparationLaboratories, Zaandam, The Netherlands). The sample iscooled through contact with a liquid N2 cryostat and heatedresistively using electrical current passing through the sample.The temperature is measured using a K-type thermocouple spotwelded to the crystal’s edge. The thermocouple is connected toa PID controller with an internal temperature reference(Eurotherm type 2416). The crystal was cleaned using repeated2 kV Ar+ sputtering and annealing cycles (1200 K) and LEEDused to verify surface order. The absence of residual carbon was
2 | Phys. Chem. Chem. Phys., 2013, 00, 1–10 This journal is #c the Owner Societies 2013
Paper PCCP

checked by adsorbing O2 and verifying that no CO or CO2
appeared in temperature-programmed desorption (TPD). ForTPD measurements, the sample was placed in front of a 2 mmdiameter hole at a distance of 2 mm of the di"erentiallypumped QMS. Using this approach, TPD measurements aremostly una"ected by desorption from heating wires and edgesof the sample. Exposures are reported in Langmuir (L = 1.3 !10"6 mbar s) and are based upon the pressure as measured byan uncalibrated nude ion gauge. The ramp rate for the TPDmeasurements was 3 K s"1.
III. ResultsA. Adsorption sites
The energy associated with the various binding sites on thesurface is strongly dependent on the H-atom coverage. Byadding the H-atoms to the surface one at a time, filling firstthe strongest binding sites and ending with the weakest ones,the energy per adatom can be calculated from the di"erentialadsorption energy
DEH$n% & E$n% " E$n" 1% " 1
2EH2
(1)
where n is the number of hydrogen atoms adsorbed on thesurface and E(n) is the total energy of the surface with n atomsadsorbed. The results are shown in Fig. 1. The hydrogen cover-age, yH, is defined as the ratio of the number of H-adatoms to thenumber of surface Pt-atoms, yH = n/Nsurf.
In an agreement with the results of Zhang et al.,13,15 we findthat the short bridge site on the ridge (R) is the strongestadsorption site at low coverage. The hydrogen adsorptionenergy on the ridge was calculated to be "0.28 eV H"1 whilethe adsorption energy at the FCC threefold hollow site of the
(111) micro facet and the long bridge in the trough were"0.23 eV H"1 and "0.06 eV H"1, respectively. Table 1 showsthe binding energy for all adsorption sites considered and Fig. 1shows the adsorption sites. When the ridge has been filled, thepreferred sites are the tilted on-top sites on the micro facets (F)followed by adsorption onto the long bridge sites in the trough(T). The filling of the trough sites forces the neighboringH-atoms to move from the on-top sites towards the HCPthreefold hollow sites on the (111) micro facet (F0).
As mentioned in the Introduction, it has frequentlybeen assumed that the strongest adsorption site on thePt(110)-(1 ! 2) surface is the highly coordinated troughsites16,18 or the three-fold hollow sites of the (111) microfacet,17,30 but the DFT calculations give strongest binding atthe ridge sites. In order to test this prediction of the DFTcalculations, we compare the calculated work function as afunction of coverage and He–surface interaction with pre-viously reported experimental measurements.
1. Work function change. Engstrom et al.16 reported mea-surements of the change in work function, Df, with hydrogencoverage. An initial rise in the work function occurred up to 1/3of relative coverage followed by a decrease with further adsorp-tion of hydrogen, as shown in Fig. 2. Later, Shern18 reportedwork function measurements obtained by MEM-LEED showingthe same trend and interpreted this to indicate adsorption intrough sites. The DFT calculated work function change asH-atoms are added to the ridge sites, however, reproduces theinitial rise measured by Engstrom et al. and Shern, followed bya decrease when hydrogen atoms are added to the facet sites, asshown in Fig. 2. The magnitude of the work function can,however, be quite sensitive to the functional used9 and theagreement here is only qualitative. The calculated work func-tion for the clean Pt(110)-(1 ! 2) surface is 0.4 eV smaller thanthat of the flat Pt(111) surface. Based on the jellium model, thePt(110)-(1 ! 2) surface can be expected to form a surface dipolewith the ridge Pt atoms being electron deficient because of thetendency to smooth out the electron density, the Smoluchowskie"ect.31 The surface dipole formed on the Pt(110)-(1 ! 2)surface then decreases the work function compared to that ofthe flat Pt(111) surface. Hydrogen atoms bound to the surfacehave a slightly negative charge, ca. "0.05 e, as determined byBader analysis,32,33 so a hydrogen adatom on top of the ridgedecreases the surface dipole and increases the work functiontowards that of the flat surface. The facet sites are positionedlower and have the opposite e"ect. Similar site dependence of
Fig. 1 Di!erential H-atom adsorption energy as a function of hydrogen cover-age for the Pt(110)-(1 ! 2) surface. The insets show the adsorption sites and theorder in which they get filled, first short bridge on the ridge (R), then tilted on-topon the micro facet (F), and finally the HCP hollow site (F0) and the long bridge sitein the trough (T). A strong attraction can be seen between the H-adatoms on theridge, while there is a weak repulsion on the micro facets and a strongerrepulsion in the trough.
Table 1 Binding energy of a single H-adatom on Pt(110)-(1! 2) and Pd(110)-(1! 2)on various surface sites, and at higher coverage for ridge sites where R, R2, and R3indicate 1/3, 2/3, and 3/3 filling of the sites
Sites DEH Pt(110) (eV) DEH Pd(110) (eV)
R "0.28 "0.22R2 "0.34 "0.18R3 "0.40 "0.16F "0.21 —F0 "0.14 "0.28FCC "0.23 "0.36
This journal is #c the Owner Societies 2013 Phys. Chem. Chem. Phys., 2013, 00, 1–10 | 3
PCCP Paper

the e"ect of adsorbates on work function has been reported byLeung et al. in studies of metal atom adsorption on tungstensurfaces.34
2. He–surface interaction. He-atom di"raction from H/Pt(110)-(2 ! 1) was measured by Kirsten et al.19 and analyzed to obtain thecorrugation of the He–surface interaction potential as a function ofH-atom coverage. The results showed strong variation, the corruga-tion increasing from 1.5 Å for a clean surface to 2.0 Å after fillingthe b2 state and then decreasing again to close to that of the cleansurface after filling also the b1 state. The initial increase incorrugation is a clear indication that the strongest binding sitesfor H-adatoms are associated with the ridge, but the exact locationof the site could not be determined from the He scattering data. Itwas suggested that the H-atoms are located in subsurface sitesunder the outermost Pt ridge atoms.19 Zhang et al.15 showed byLEED measurements that the filling of subsurface sites can beruled out because it would necessarily lead to large relaxation of thePt atoms but none was observed. We carried out DFT calculationsof a He atom at various positions above the surface and estimatedthe corrugation of the interaction potential corresponding tothe beam energy used in the experiments, 60 meV. Fig. 3 showsthe variation in the energy change when bringing a He-atomclose to the surface, both directly above the ridge and directlyabove the trough, for a clean surface, a surface with ridge sitesfilled and a surface with ridge and facet sites filled. The resultsshow the corrugation amplitude increasing from 1.5 Å to 2.1 Åwhen going from a clean surface to a surface with ridge sitesfilled, and then decreasing again down to 1.4 Å when the facetsites are filled with H-atoms. This is in excellent agreementwith the measurements of Kirsten et al. lending strong supportfor the results of the DFT calculations.
It should be noted that the corrugation of the He-surfacepotential at 60 meV energy is quite insensitive to the dispersion
interaction and can, therefore, be predicted quite well withDFT/GGA calculations even though the long range dispersioninteraction is not included at that level of theory.
3. Comparison with H/Pd(110)-(1 ! 2). The observed pre-ference of the H-atoms for the low coordinated ridge site is verydi"erent from the general trend for H-adatoms to prefer highcoordination sites. For comparison, we carried out some calcula-tions of H-adsorption on the Pd(110)-(1 ! 2) surface. Themissing row reconstructed Pd(110) surface is only metastablewhen it is clean, but becomes preferred after hydrogen has beenadded.12 The site preference of H-atoms is very di"erent forPd(110)-(1 ! 2) (Table 1). The short bridge sites on the ridge (R)are not the most stable sites on the Pd(110)-(1 ! 2) surface butrather the FCC three-fold hollow sites on the (111) micro-facet.Also, there is no attractive interaction between the neighboringhydrogen atoms at the ridge sites of the Pd surface as observedon the Pt surface. Instead a small repulsive interaction is found.It is clear that even though these two metals are similar in manyrespects, the di"erence in electronic structure (4d vs. 5d metals)leads to quite di"erent interaction with hydrogen.
B. Associative desorption
The interpretation of TPD data typically assumes that theweakest bound atoms desorb first as the temperature isincreased. However, based on our calculations of the activationenergy of hydrogen associative desorption from the threedi"erent binding sites of the Pt(110)-(1 ! 2) surface, shownin Fig. 4, that is not always the case. Other desorptionmechanisms with hydrogen desorbing from two di"erent typesof adsorption sites were also considered but gave higher barrierthan desorption from two ridges or two facet sites. The two
Fig. 2 Calculated (circles) and measured (squares)16 work function change vs.relative coverage of hydrogen on Pt(110)-(1 ! 2). The work function of a cleansurface is used as a reference state. The work function initially increases ashydrogen atoms adsorb onto the ridge because the slightly negative H-adatoms(with a charge of "0.05 e) partly cancel the positive charge at the ridge arisingfrom the Smoluchowski e!ect, thereby increasing the work function towards thatof the flat Pt(111) surface. Adsorption on the lower facet sites, however, leads toa decrease in the work function.
Fig. 3 Interaction energy of a He-atom with the Pt(110)-(1 ! 2) surface, clean(squares) and with H-atoms in the ridge sites (circles) and with H-atoms in bothridge and facet sites (diamonds). Filled symbols correspond to He-atomsapproaching the surface above a ridge site, while open symbols correspond toan approach above a trough site. The inset shows a side view of the surface andthe two approach directions. The inset table shows the calculated corrugationamplitude corresponding to 60 meV for the three configurations. The agreementwith the experimental He scattering results is excellent, verifying the sitepreference predicted by the DFT calculations.
4 | Phys. Chem. Chem. Phys., 2013, 00, 1–10 This journal is #c the Owner Societies 2013
Paper PCCP

crossings of the three desorption activation energy curves splitthe desorption mechanism into three coverage regions. At thehighest coverage, the desorption of H2 from the weakest boundH-adatoms in the trough with total binding energy of 0.15 eVinvolves a high activation energy barrier of 0.68 eV, while thedesorption of H2 formed from the more strongly bound H-ada-toms on the ridge, with a total binding energy of 0.24 eV, has anactivation barrier of 0.32 eV. This is in apparent contradictionto the so-called Brønsted–Evans–Polanyi (BEP) principle, whichsays that the activation energy is linearly related to the reactionenergy. The BEP principle has been shown to work well inheterogeneous catalysis when comparing processes with thesame mechanism and taking place at the same type of surfacesites.35 In the present case, however, the less stable final stateturns out to be kinetically preferred when comparing processestaking place at two di"erent surface sites – ridges and troughs.This shows how important it is to evaluate the activation energyrather than just the reaction energy in order to determine theactive site on a surface.
The reason the activation barrier for desorption from theweakly binding trough sites is so high is the low catalyticactivity of the highly coordinated underlying Pt atoms. TheMEP for the desorption from trough sites (T) is quite compli-cated (see Fig. 5). Surrounding H-atoms get shifted around tomake room for H–H bond formation at a facet Pt-atom. TheMEPs for desorption of H2 formed from trough (T), micro-facet(F0) and the ridge (R) H-atoms at full coverage are shown inFig. 6. Desorption at the ridge and at the trough leads tointermediate local minima on the MEP. They were foundduring the NEB calculation but subsequently refined by sepa-rate minimization of these configurations. For the trough
desorption, these local minima are due to rearrangement ofhydrogen atoms on the surface. However, the local minimum inthe MEP for desorption from ridge corresponds to a Kubascomplex36 where the nearly intact H2 molecule is bound as a ligandto a surface Pt atom. This complex is formed in the desorptionfrom ridge sites at all coverages. The H–H bond length is about0.9 Å, the height above the underlying Pt ridge atom 1.6–1.7 Å andbinding energy 0.04–0.24 eV depending on coverage. The H2
molecule is nearly a free rotor in the Kubas complex.Based on the NEB calculations, the desorption mechanism
first involves desorption from ridge sites, followed bydesorption from facet sites as well as from ridge sites as theyget refilled by di"usion from the facet and finally, at lowcoverage, again desorption from ridge sites. Fig. 7 shows theatom configuration along the MEPs obtained in the NEBcalculations for each coverage region. It has recently beenargued37 that the Pt(110)-(1 ! 2) surface is not a good modelfor an edge on a nano-particle but there it was assumed that theactive sites on the Pt(110)-(1 ! 2) surface are the trough sites.Our results show that this is not the case.
Fig. 4 Activation energy for desorption from five di!erent pairs of sites on thesurface as a function of coverage: the ridge (R, blue circles), the facet (F and F 0, redsquares), the trough (T, green triangles), the ridge and facet (RF, black squares)and facet and trough (FT, magenta squares) sites. The optimal desorptionmechanism changes with coverage: at high coverage desorption occurs fromthe strong adsorption sites on the ridge, at intermediate coverage from the siteson the micro-facet and at low coverage again from the ridge sites. At highcoverage, the less stable final state is kinetically preferred because of low catalyticactivity of the Pt-atoms at the trough sites.
Fig. 5 Atom configurations for desorption from ridge (R, blue), (111) microfacets (F0, red) and trough (T, green) of a fully covered surface. The surroundinghydrogen atoms (base color) are only shown in their initial relaxed positions.
Fig. 6 A comparison of the minimum energy paths (MEPs) for the desorptionfrom ridge (R, blue), (111) micro-facet (F 0, red) and trough (T, green) sites of a fullycovered surface. The configurations obtained in the NEB calculation are shown.The star indicates local minimum observed on the ridge MEPs found by aseparate relaxation. It corresponds to a Kubas complex with H–H bond lengthof 0.89 Å at a height 1.73 Å above the ridge Pt atom (bottom inset). The finalconfigurations for the three desorption processes are shown as insets to the right.The height of the H2 molecule in the final configurations is more than 4 Å abovethe underlying Pt-atoms.
This journal is #c the Owner Societies 2013 Phys. Chem. Chem. Phys., 2013, 00, 1–10 | 5
PCCP Paper

C. Surface di!usion
The question now arises how e!cient the surface di"usion is infilling the ridge sites after H2 molecules have desorbed at highcoverage. Fig. 8 shows MEPs for surface di"usion where
H-atoms refill the ridge sites. At high coverage, H-adatomsdi"use from the facet HCP sites (F0) to the ridge (R) and thentrough adatoms (T) di"use to the facet (F or F0). A maximumbarrier of 0.25 eV is obtained for these processes. At lowcoverage, the di"usion is easier as the facet (F) atoms candi"use to the ridge with a barrier of 0.1 eV. This low coveragevalue can be compared with the activation energy calculated fordi"usion on the Pt(111) surface, 0.04 eV, using the samefunctional.38 It is important to note here that refilling of theridge sites is not a concerted process with the desorption, butrather a separate, activated process. The di"usion paths arefairly long and the NEB calculations show these intermediatelocal minima with activation barriers in between. However,since the rate of the di"usion processes is higher than the rateof H2 desorption, the system will equilibrate and find thelowest energy configuration in between desorption events.
D. TPD modeling
To simulate the TPD spectra a simple model with coupleddi"erential equations was set up. A numerical solution of theequations giving the rate of desorption of H2 as a function oftemperature was obtained using a finite di"erence method.The H/Pt(110)-(1 ! 2) system was described by including threetypes of binding sites, ridges (R), facets (F) and troughs (T).Here, the F and F0 sites are treated as the same binding sitesince the di"erence in adsorption energy is small and theycannot both be occupied at the same time. Also, once hydrogenatoms adsorb on the T sites, neighboring F atoms are pushed toF0 sites. The model includes desorption from the R and F sitesas well as di"usion between the various binding sites. Theattractive interactions between the neighboring hydrogenatoms on the ridge lead to first order kinetics for the desorptionfrom the ridge. The experimentally observed shift in the b1 peakwith di"erent initial coverage has been interpreted to indicatesecond order kinetics.16 Hence, we describe desorption fromfacet sites with a second order rate equation. However, similarspectra are obtained when desorption from both types of sitesis described with first order rate equations. The shift in the b1
peak with coverage is then due to the strong coverage depen-dence of the activation energy barrier. The rate equations forhydrogen desorption are then
dyRdt& "2kR;H2
" kR;F! "
yR$t% ' kF;R2yF$t% (2)
dyFdt& "2kF;H2
yF$t% " kF;R " kF;T! "
yF$t%
' kR;F1
2yR$t% ' kT;F
1
2yT$t%
(3)
dyTdt& "kT;FyT$t% ' kF;T2yF$t%: (4)
Here, yi is the coverage of H-adatoms at binding sites of type iand the factors 2 and 1/2 in front of y come from the number ofadsorption sites of each type. kX,Y is the rate constant fortransition from initial state X to final state Y given by the
Fig. 7 Atom configurations along the MEP for the desorption mechanism withlowest activation energy in each of the three coverage intervals defined in Fig. 4:desorption from ridge sites (R) for coverage below 0.5 ML, from facet sites (F) forcoverage between 0.5 and 1 ML and again desorption from ridge sites (R) atcoverage above 1 ML. The surrounding hydrogen atoms (beige color) are onlyshown in their initial positions.
Fig. 8 Calculated minimum energy paths for H-atom di!usion toward thelowest energy configuration after desorption from ridge for (a) high coverageof 1.11 ML (red) and 0.89 ML (blue) and (b) low coverage of 0.44 ML (green) and0.22 ML (red). High coverage includes di!usion from the HCP sites (F) to the ridge(R) and then di!usion from the trough (T) to the facet (F or F) sites while at lowcoverage the di!usion is from the facet (F) to the ridge (R). Insets show the initialand final configurations for each MEP.
6 | Phys. Chem. Chem. Phys., 2013, 00, 1–10 This journal is #c the Owner Societies 2013
Paper PCCP
Arrhenius equation with pre-exponential n and activationenergy Ea
k(t,yR,yF,yT) = n e"Ea(yR,yF,yT)/kBt. (5)
The total desorption rate per surface site is then
r(t,t) = kR,H2(t)yR(t) + 2kF,H2
(t)yF(t). (6)
To simulate our TPD experiment we set t = t0 + at where t0 =135 K is the initial temperature and a = 3 K s"1 the heating rate.
A polynomial fit to the calculated activation energy curves inFig. 4 for ridge and facet desorption was made taking intoaccount interaction with the various types of neighbors,
Ea yR; yF; yT$ % & C 'X
i
aiyiR 'X
i
biyiF 'X
i
ciyiT (7)
where y is the hydrogen coverage at the various binding sites,and the constants C, ai, bi and ci CR, CF, ai, bi and ci have di"erentvalues for the two desorption sites, F and R, see Table 2.
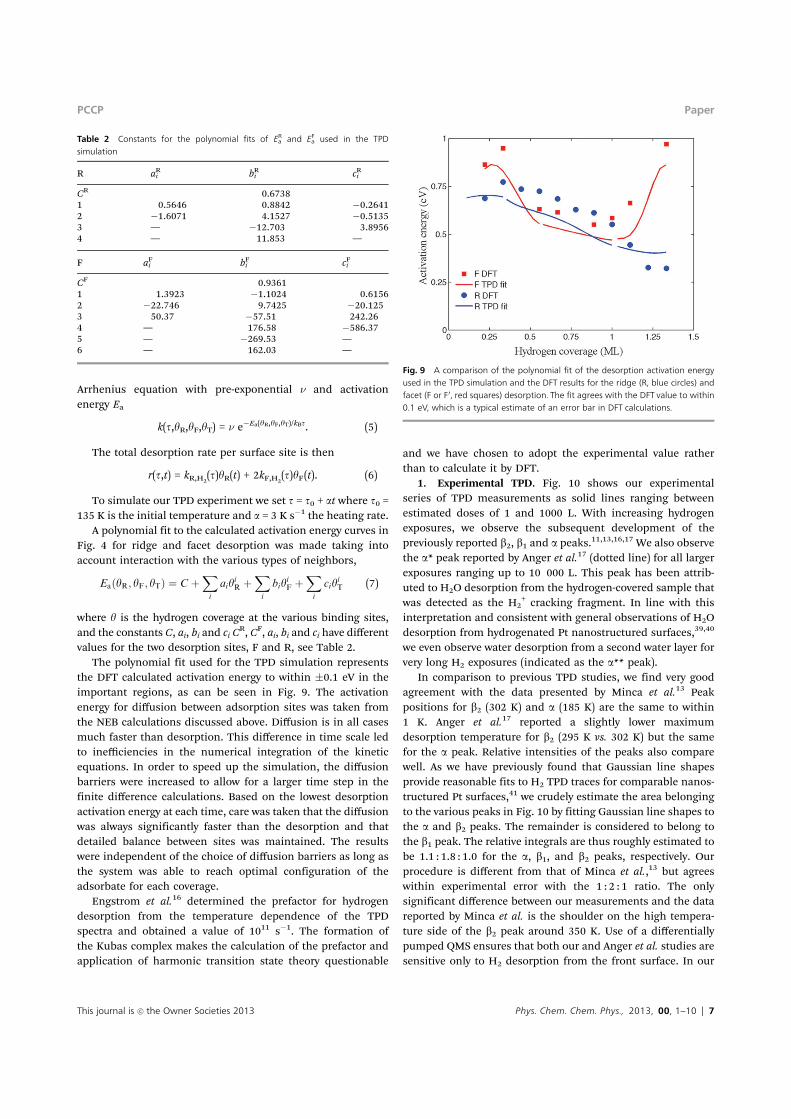
The polynomial fit used for the TPD simulation representsthe DFT calculated activation energy to within (0.1 eV in theimportant regions, as can be seen in Fig. 9. The activationenergy for di"usion between adsorption sites was taken fromthe NEB calculations discussed above. Di"usion is in all casesmuch faster than desorption. This di"erence in time scale ledto ine!ciencies in the numerical integration of the kineticequations. In order to speed up the simulation, the di"usionbarriers were increased to allow for a larger time step in thefinite di"erence calculations. Based on the lowest desorptionactivation energy at each time, care was taken that the di"usionwas always significantly faster than the desorption and thatdetailed balance between sites was maintained. The resultswere independent of the choice of di"usion barriers as long asthe system was able to reach optimal configuration of theadsorbate for each coverage.
Engstrom et al.16 determined the prefactor for hydrogendesorption from the temperature dependence of the TPDspectra and obtained a value of 1011 s"1. The formation ofthe Kubas complex makes the calculation of the prefactor andapplication of harmonic transition state theory questionable
and we have chosen to adopt the experimental value ratherthan to calculate it by DFT.
1. Experimental TPD. Fig. 10 shows our experimentalseries of TPD measurements as solid lines ranging betweenestimated doses of 1 and 1000 L. With increasing hydrogenexposures, we observe the subsequent development of thepreviously reported b2, b1 and a peaks.11,13,16,17 We also observethe a* peak reported by Anger et al.17 (dotted line) for all largerexposures ranging up to 10 000 L. This peak has been attrib-uted to H2O desorption from the hydrogen-covered sample thatwas detected as the H2
+ cracking fragment. In line with thisinterpretation and consistent with general observations of H2Odesorption from hydrogenated Pt nanostructured surfaces,39,40
we even observe water desorption from a second water layer forvery long H2 exposures (indicated as the a** peak).
In comparison to previous TPD studies, we find very goodagreement with the data presented by Minca et al.13 Peakpositions for b2 (302 K) and a (185 K) are the same to within1 K. Anger et al.17 reported a slightly lower maximumdesorption temperature for b2 (295 K vs. 302 K) but the samefor the a peak. Relative intensities of the peaks also comparewell. As we have previously found that Gaussian line shapesprovide reasonable fits to H2 TPD traces for comparable nanos-tructured Pt surfaces,41 we crudely estimate the area belongingto the various peaks in Fig. 10 by fitting Gaussian line shapes tothe a and b2 peaks. The remainder is considered to belong tothe b1 peak. The relative integrals are thus roughly estimated tobe 1.1 : 1.8 : 1.0 for the a, b1, and b2 peaks, respectively. Ourprocedure is di"erent from that of Minca et al.,13 but agreeswithin experimental error with the 1 : 2 : 1 ratio. The onlysignificant di"erence between our measurements and the datareported by Minca et al. is the shoulder on the high tempera-ture side of the b2 peak around 350 K. Use of a di"erentiallypumped QMS ensures that both our and Anger et al. studies aresensitive only to H2 desorption from the front surface. In our
Table 2 Constants for the polynomial fits of ERa and EF
a used in the TPDsimulation
R aRi bR
i cRi
CR 0.67381 0.5646 0.8842 "0.26412 "1.6071 4.1527 "0.51353 — "12.703 3.89564 — 11.853 —
F aFi bF
i cFi
CF 0.93611 1.3923 "1.1024 0.61562 "22.746 9.7425 "20.1253 50.37 "57.51 242.264 — 176.58 "586.375 — "269.53 —6 — 162.03 —
Fig. 9 A comparison of the polynomial fit of the desorption activation energyused in the TPD simulation and the DFT results for the ridge (R, blue circles) andfacet (F or F0, red squares) desorption. The fit agrees with the DFT value to within0.1 eV, which is a typical estimate of an error bar in DFT calculations.
This journal is #c the Owner Societies 2013 Phys. Chem. Chem. Phys., 2013, 00, 1–10 | 7
PCCP Paper
data, there is no high temperature shoulder. Desorption at350 K is characteristic of the (100) step type on Pt surfaces.40 Inthe study by Minca et al. the high temperature shoulder may,therefore, be caused by desorption from the crystal’s edgewhich is orthogonal to the (110) surface and likely contains ahigh number of such steps.
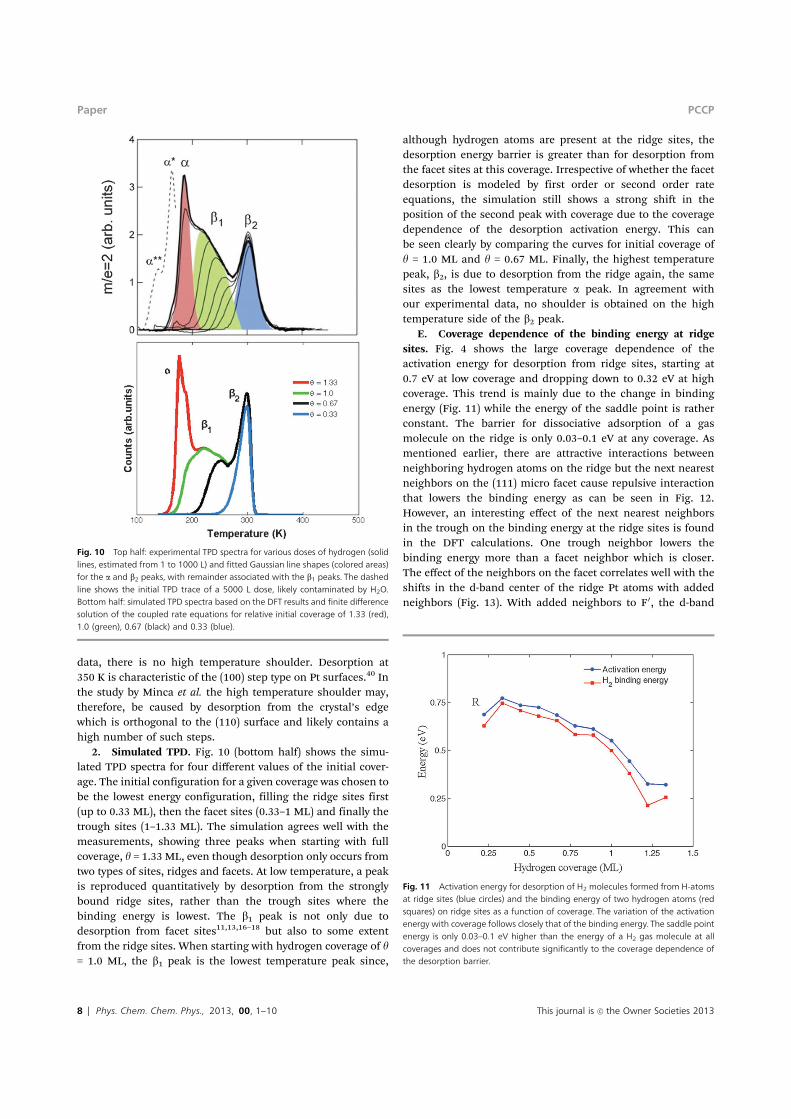
2. Simulated TPD. Fig. 10 (bottom half) shows the simu-lated TPD spectra for four di"erent values of the initial cover-age. The initial configuration for a given coverage was chosen tobe the lowest energy configuration, filling the ridge sites first(up to 0.33 ML), then the facet sites (0.33–1 ML) and finally thetrough sites (1–1.33 ML). The simulation agrees well with themeasurements, showing three peaks when starting with fullcoverage, y = 1.33 ML, even though desorption only occurs fromtwo types of sites, ridges and facets. At low temperature, a peakis reproduced quantitatively by desorption from the stronglybound ridge sites, rather than the trough sites where thebinding energy is lowest. The b1 peak is not only due todesorption from facet sites11,13,16–18 but also to some extentfrom the ridge sites. When starting with hydrogen coverage of y= 1.0 ML, the b1 peak is the lowest temperature peak since,
although hydrogen atoms are present at the ridge sites, thedesorption energy barrier is greater than for desorption fromthe facet sites at this coverage. Irrespective of whether the facetdesorption is modeled by first order or second order rateequations, the simulation still shows a strong shift in theposition of the second peak with coverage due to the coveragedependence of the desorption activation energy. This canbe seen clearly by comparing the curves for initial coverage ofy = 1.0 ML and y = 0.67 ML. Finally, the highest temperaturepeak, b2, is due to desorption from the ridge again, the samesites as the lowest temperature a peak. In agreement withour experimental data, no shoulder is obtained on the hightemperature side of the b2 peak.
E. Coverage dependence of the binding energy at ridgesites. Fig. 4 shows the large coverage dependence of theactivation energy for desorption from ridge sites, starting at0.7 eV at low coverage and dropping down to 0.32 eV at highcoverage. This trend is mainly due to the change in bindingenergy (Fig. 11) while the energy of the saddle point is ratherconstant. The barrier for dissociative adsorption of a gasmolecule on the ridge is only 0.03–0.1 eV at any coverage. Asmentioned earlier, there are attractive interactions betweenneighboring hydrogen atoms on the ridge but the next nearestneighbors on the (111) micro facet cause repulsive interactionthat lowers the binding energy as can be seen in Fig. 12.However, an interesting e"ect of the next nearest neighborsin the trough on the binding energy at the ridge sites is foundin the DFT calculations. One trough neighbor lowers thebinding energy more than a facet neighbor which is closer.The e"ect of the neighbors on the facet correlates well with theshifts in the d-band center of the ridge Pt atoms with addedneighbors (Fig. 13). With added neighbors to F0, the d-band
Fig. 10 Top half: experimental TPD spectra for various doses of hydrogen (solidlines, estimated from 1 to 1000 L) and fitted Gaussian line shapes (colored areas)for the a and b2 peaks, with remainder associated with the b1 peaks. The dashedline shows the initial TPD trace of a 5000 L dose, likely contaminated by H2O.Bottom half: simulated TPD spectra based on the DFT results and finite di!erencesolution of the coupled rate equations for relative initial coverage of 1.33 (red),1.0 (green), 0.67 (black) and 0.33 (blue).
Fig. 11 Activation energy for desorption of H2 molecules formed from H-atomsat ridge sites (blue circles) and the binding energy of two hydrogen atoms (redsquares) on ridge sites as a function of coverage. The variation of the activationenergy with coverage follows closely that of the binding energy. The saddle pointenergy is only 0.03–0.1 eV higher than the energy of a H2 gas molecule at allcoverages and does not contribute significantly to the coverage dependence ofthe desorption barrier.
8 | Phys. Chem. Chem. Phys., 2013, 00, 1–10 This journal is #c the Owner Societies 2013
Paper PCCP
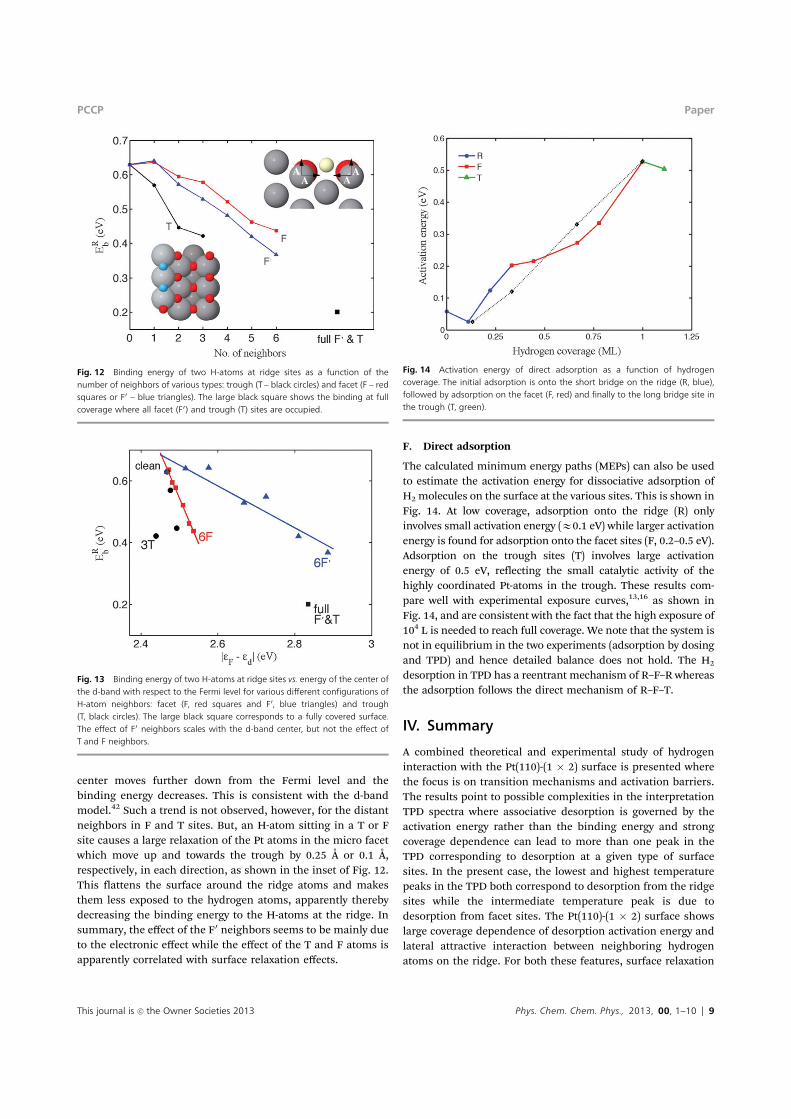
center moves further down from the Fermi level and thebinding energy decreases. This is consistent with the d-bandmodel.42 Such a trend is not observed, however, for the distantneighbors in F and T sites. But, an H-atom sitting in a T or Fsite causes a large relaxation of the Pt atoms in the micro facetwhich move up and towards the trough by 0.25 Å or 0.1 Å,respectively, in each direction, as shown in the inset of Fig. 12.This flattens the surface around the ridge atoms and makesthem less exposed to the hydrogen atoms, apparently therebydecreasing the binding energy to the H-atoms at the ridge. Insummary, the e"ect of the F0 neighbors seems to be mainly dueto the electronic e"ect while the e"ect of the T and F atoms isapparently correlated with surface relaxation e"ects.
F. Direct adsorption
The calculated minimum energy paths (MEPs) can also be usedto estimate the activation energy for dissociative adsorption ofH2 molecules on the surface at the various sites. This is shown inFig. 14. At low coverage, adsorption onto the ridge (R) onlyinvolves small activation energy (E0.1 eV) while larger activationenergy is found for adsorption onto the facet sites (F, 0.2–0.5 eV).Adsorption on the trough sites (T) involves large activationenergy of 0.5 eV, reflecting the small catalytic activity of thehighly coordinated Pt-atoms in the trough. These results com-pare well with experimental exposure curves,13,16 as shown inFig. 14, and are consistent with the fact that the high exposure of104 L is needed to reach full coverage. We note that the system isnot in equilibrium in the two experiments (adsorption by dosingand TPD) and hence detailed balance does not hold. The H2
desorption in TPD has a reentrant mechanism of R–F–R whereasthe adsorption follows the direct mechanism of R–F–T.
IV. Summary
A combined theoretical and experimental study of hydrogeninteraction with the Pt(110)-(1 ! 2) surface is presented wherethe focus is on transition mechanisms and activation barriers.The results point to possible complexities in the interpretationTPD spectra where associative desorption is governed by theactivation energy rather than the binding energy and strongcoverage dependence can lead to more than one peak in theTPD corresponding to desorption at a given type of surfacesites. In the present case, the lowest and highest temperaturepeaks in the TPD both correspond to desorption from the ridgesites while the intermediate temperature peak is due todesorption from facet sites. The Pt(110)-(1 ! 2) surface showslarge coverage dependence of desorption activation energy andlateral attractive interaction between neighboring hydrogenatoms on the ridge. For both these features, surface relaxation
Fig. 12 Binding energy of two H-atoms at ridge sites as a function of thenumber of neighbors of various types: trough (T – black circles) and facet (F – redsquares or F0 – blue triangles). The large black square shows the binding at fullcoverage where all facet (F0) and trough (T) sites are occupied.
Fig. 13 Binding energy of two H-atoms at ridge sites vs. energy of the center ofthe d-band with respect to the Fermi level for various di!erent configurations ofH-atom neighbors: facet (F, red squares and F 0, blue triangles) and trough(T, black circles). The large black square corresponds to a fully covered surface.The e!ect of F0 neighbors scales with the d-band center, but not the e!ect ofT and F neighbors.
Fig. 14 Activation energy of direct adsorption as a function of hydrogencoverage. The initial adsorption is onto the short bridge on the ridge (R, blue),followed by adsorption on the facet (F, red) and finally to the long bridge site inthe trough (T, green).
This journal is #c the Owner Societies 2013 Phys. Chem. Chem. Phys., 2013, 00, 1–10 | 9
PCCP Paper

plays an important role making it necessary to allow the firstfew surface layers to relax when calculating the interaction ofhydrogen with the surface. The results presented here can shedlight on the interaction of hydrogen with Pt nanoclusters sincethe ridges on the missing row surface mimic edges between(111) microfacets.
Acknowledgements
We thank Jean-Claude Berthet for help with the TPD modeling.This work was funded in part by the Eimskip Fund of theUniversity of Iceland and the Icelandic Research Fund.
References
1 C. R. Henry, Surf. Sci. Rep., 1998, 31, 231.2 S. Dahl, A. Logadottir, R. C. Egeberg, J. H. Larsen,
I. Chorkendor", E. Tornqvist and J. K. Nørskov, Phys. Rev.Lett., 1999, 83, 1814.
3 B. Hvolbaek, T. V. W. Janssens, B. C. Clausen, H. Falsig,C. H. Christensen and J. K. Nørskov, Nano Today, 2007,2, 14.
4 S. Gudmundsdottir, W. Tang, G. Henkelman, H. Jonssonand E. Skulason, J. Chem. Phys., 2012, 137, 164705.
5 E. Skulason, A. A. Faraj, L. Kristinsdottir, J. Hussain,S. Gudmundsdottir and H. Jonsson, Top. Catal., 2013.
6 E. Skulason, G. S. Karlberg, J. Rossmeisl, T. Bligaard,J. Greeley, H. Jonsson and J. K. Nørskov, Phys. Chem. Chem.Phys., 2007, 9, 3241.
7 J. Rossmeisl, E. Skulason, M. Bjorketun, V. Tripkovic andJ. Nørskov, Chem. Phys. Lett., 2008, 466, 68.
8 E. Skulason, V. Tripkovic, M. E. Bjorketun, S. Gudmundsdottir,G. S. Karlberg, J. Rossmeisl, T. Bligaard, H. Jonsson andJ. Nørskov, J. Phys. Chem. C, 2010, 114, 18182.
9 V. Tripkovic, M. E. Bjorketun, E. Skulason and J. Rossmeisl,Phys. Rev. B: Condens. Matter Mater. Phys., 2011, 84, 115452.
10 M. E. Bjorketun, V. Tripkovic, E. Skulason and J. Rossmeisl,Catal. Today, 2013, 202, 168.
11 C. Lu and R. I. Masel, J. Phys. Chem. B, 2001, 105, 9793.12 A. Nduwimana, X. G. Gong and X. Q. Wang, Appl. Surf. Sci.,
2003, 219, 129.13 M. Minca, S. Penner, T. Loerting, A. Menzel, E. Bertel,
R. Zucca and J. Redinger, Top. Catal., 2007, 46, 161.14 M. Minca, S. Penner, E. Dona, A. Menzel, E. Bertel, V. Brouet
and J. Redinger, New J. Phys., 2007, 9, 386.15 Z. Zhang, M. Minca, C. Deisl, T. Loerting, A. Menzel and
E. Bertel, Phys. Rev. B: Condens. Matter Mater. Phys., 2004,70, 121401.
16 J. R. Engstrom, W. Tsai and W. H. Weinberg, J. Chem. Phys.,1987, 87, 3104.
17 G. Anger, H. F. Berger, M. Luger, S. Feistritzer, A. Winklerand K. D. Rendulic, Surf. Sci., 1989, 219, L583.
18 C. S. Shern, Surf. Sci., 1992, 264, 171.19 E. Kirsten, G. Parschau, W. Stocker and K. H. Rieder, Surf.
Sci. Lett., 1990, 231, L183.20 S. Gudmundsdottir, E. Skulason and H. Jonsson, Phys. Rev.
Lett., 2012, 108, 156101.21 W. Kohn, Rev. Mod. Phys., 1998, 71, 1253.22 G. Kresse and J. Hafner, Phys. Rev. B: Condens. Matter Mater.
Phys., 1993, 47, 558.23 B. Hammer, L. B. Hansen and J. K. Nørskov, Phys. Rev. B:
Condens. Matter Mater. Phys., 1999, 46, 7413.24 Dacapo pseudopotential code. URL https://wiki.fysik.dtu.
dk/dacapo (Center for Atomic-scale Materials Physics,Technical University of Denmark, Kongens Lyngby, 2011).
25 D. Vanderbilt, Phys. Rev. B: Condens. Matter Mater. Phys.,1990, 41, 7892.
26 G. Kresse and J. Furthmuller, Phys. Rev. B: Condens. MatterMater. Phys., 1996, 54, 11169.
27 H. Jonsson, G. Mills and K. W. Jacobsen, in Classical andQuantum Dynamics in Condensed Phase Simulations,ed. B. J. Berne, G. Ciccotti and D. F. Coker, World Scientific,California, 1998, p. 385.
28 G. Henkelman, B. Uberuaga and H. Jonsson, J. Chem. Phys.,2000, 113, 9901.
29 G. Henkelman and H. Jonsson, J. Chem. Phys., 2000,113, 9978.
30 N. M. Markovic, B. N. Grgur and P. N. Ross, J. Phys. Chem. B,1997, 101, 5405.
31 R. Smoluchowski, Phys. Rev., 1941, 60, 661.32 R. Bader, Atoms in Molecules: A Quantum Theory, Oxford
University Press, New York, 1990.33 G. Henkelman, A. Arnaldsson and H. Jonsson, Comput.
Mater. Sci., 2006, 36, 354.34 T. C. Leung, C. L. Kao, W. S. Su, Y. J. Feng and C. T. Chan,
Phys. Rev. B: Condens. Matter Mater. Phys., 2003, 68, 195408.35 T. Bligaard, J. Nørskov, S. Dahl, J. Matthiesen,
C. Christensen and J. Sehested, J. Catal., 2004, 224, 206.36 G. Kubas, Metal hydrogen and [sigma]-bond complexes: structure,
theory and reactivity, Kluwer Academic, New York, 2001.37 F. Yang, Q. Zhang, Y. Liu and S. Chen, J. Phys. Chem. C,
2011, 115, 19311.38 L. Kristinsdottir and E. Skulason, Surf. Sci., 2012, 606, 1400.39 M. J. T. C. van der Niet, I. Dominicus, M. T. M. Koper and
L. B. F. Juurlink, Phys. Chem. Chem. Phys., 2008, 10, 7169.40 M. J. T. C. van der Niet, A. den Dunnen, M. T. M. Koper and
L. B. F. Juurlink, Phys. Rev. Lett., 2011, 107, 146103.41 M. J. T. C. van der Niet, A. den Dunnen, L. B. F. Juurlink and
M. T. M. Koper, J. Chem. Phys., 2010, 132, 174705.42 B. Hammer and J. K. Nørskov, Surf. Sci., 1995, 343, 211.
10 | Phys. Chem. Chem. Phys., 2013, 00, 1–10 This journal is #c the Owner Societies 2013
Paper PCCP