Embed Size (px)
Citation preview

Construction of a genetic toggleswitch in Escherichia coli
2014/15
School of Mathematical SciencesUniversity of Nottingham
Anna Papanicola, Giulia Del Panta, Safyan Khan,
Philippa Jordan
I have read and understood the School and University guidelines on plagiarism. I confirmthat this work is my own, apart from the acknowledged references.
1 Introduction
This paper presents the construction of a genetic toggle switch in Escherichia Coli andprovides a simple theory that predicts the conditions needed to achieve bistability. Es-cherichia Coli (E. Coli) is a gram negative, facultatively anaerobic, rod shaped bacteriumthat is commonly found in the lower intestine of warm blooded organisms. Its role is veryimportant in biological engineering and industrial microbiology due to the fact that it hasa long history of laboratory culture and is easy to manipulate. The toggle is constructedfrom two repressible Promoters arranged in a mutually inhibitory network and is flippedbetween stable states using transient chemical or thermal induction. Bistability is a veryimportant behaviour of biological systems. It appears in a wide range of systems; fromthe λ phage switch in bacteria to cellular signal transduction pathways in mammaliancells. This experiment was conducted because certain properties, such as multistabilityand oscillations, had not yet been demonstrated in networks of non-specialized regulatorycomponents but had been observed in specialized gene circuits. Such specialized genecircuits are the bacteriophage λ switch and the Cyanobacteria circadian oscillator.
It has been shown, using a reconstituted enzyme system, that non-linear mathematicscan predict qualitative behaviours of biochemical reaction networks. A practical theory ofenzyme regulatory networks has been developed much more than that of gene regulatorynetworks. Many physical and mathematical approaches have been used in the past but,due to the difficulty of testing predictions, theories have not been verified using experi-ments. In this paper, a synthetic and bistable gene circuit has been constructed with thehelp of a simple mathematical model. This report begins with a description of the toggleswitch design followed by a description of the experiment and its results. After this, themathematical model and the analysis of the experiment is given.
1
2 The Biological Model
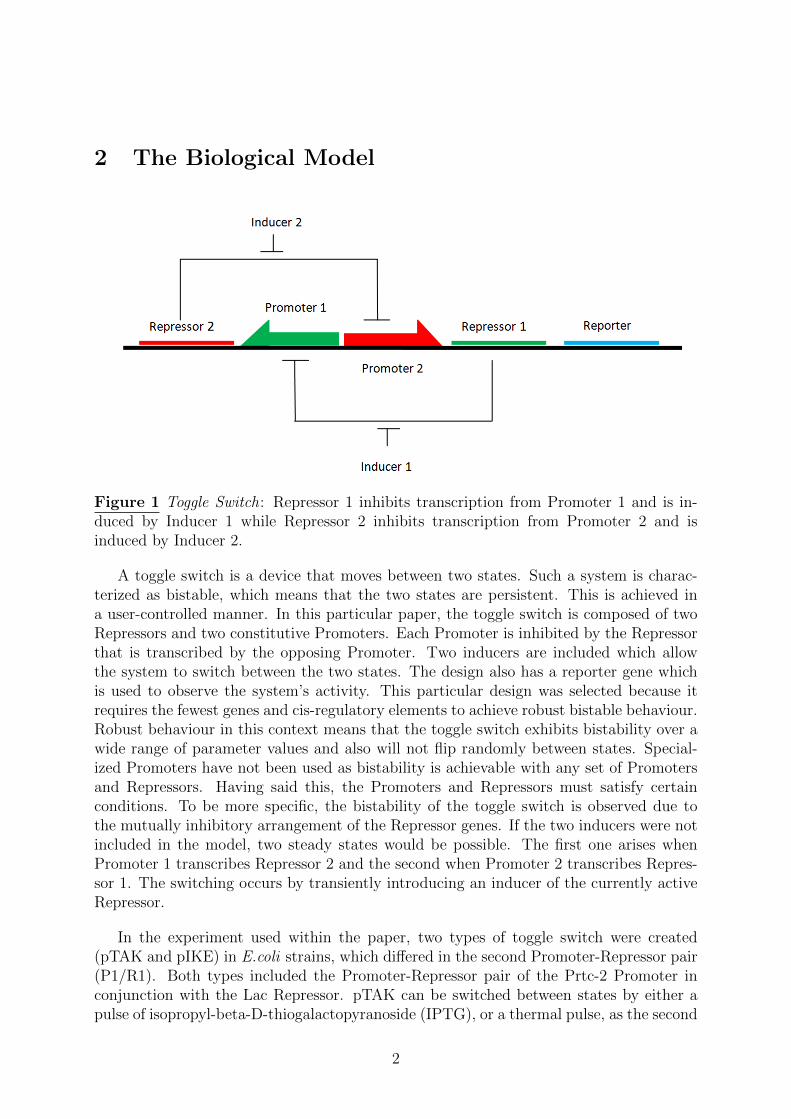
Figure 1 Toggle Switch: Repressor 1 inhibits transcription from Promoter 1 and is in-duced by Inducer 1 while Repressor 2 inhibits transcription from Promoter 2 and isinduced by Inducer 2.
A toggle switch is a device that moves between two states. Such a system is charac-terized as bistable, which means that the two states are persistent. This is achieved ina user-controlled manner. In this particular paper, the toggle switch is composed of twoRepressors and two constitutive Promoters. Each Promoter is inhibited by the Repressorthat is transcribed by the opposing Promoter. Two inducers are included which allowthe system to switch between the two states. The design also has a reporter gene whichis used to observe the system’s activity. This particular design was selected because itrequires the fewest genes and cis-regulatory elements to achieve robust bistable behaviour.Robust behaviour in this context means that the toggle switch exhibits bistability over awide range of parameter values and also will not flip randomly between states. Special-ized Promoters have not been used as bistability is achievable with any set of Promotersand Repressors. Having said this, the Promoters and Repressors must satisfy certainconditions. To be more specific, the bistability of the toggle switch is observed due tothe mutually inhibitory arrangement of the Repressor genes. If the two inducers were notincluded in the model, two steady states would be possible. The first one arises whenPromoter 1 transcribes Repressor 2 and the second when Promoter 2 transcribes Repres-sor 1. The switching occurs by transiently introducing an inducer of the currently activeRepressor.
In the experiment used within the paper, two types of toggle switch were created(pTAK and pIKE) in E.coli strains, which differed in the second Promoter-Repressor pair(P1/R1). Both types included the Promoter-Repressor pair of the Prtc-2 Promoter inconjunction with the Lac Repressor. pTAK can be switched between states by either apulse of isopropyl-beta-D-thiogalactopyranoside (IPTG), or a thermal pulse, as the second
2
Repressor is temperature sensitive. The second type of plasmids can be switched betweenstates by a pulse of IPTG or a pulse of anhydrotetracycline (aTc).
The high state is defined as when P2 (Prtc-2) is transcribed/P1 repressed, and theopposing state (low state) when P1 is transcribed/P2 repressed. When the switch is in astable position, addition of the inducer for the repressed Repressor causes transcriptionof the Repressor, until the originally active Repressor is repressed. In this manner theinducers allow the toggle to switch between the two stable states.
All toggles used the gfpmut3 gene, which was induced when the toggle was in the highstate, expressing a green fluorescent colour.
For example, the pTAK plasmids were grown for 6 hours with IPTG, thus repressingP1, entering the high state and inducing gfpmut3. Cells were then grown for further timewithout the presence of IPTG, and continued to remain in the same state. When grown ata higher temperature, P1 was transcribed and Prtc-2 repressed, thus the toggles switchedto the low state, and gfpmut3 expression was stopped. The pIKE plasmids again inducedgfpmut3 expression when grown with IPTG, but were switched back to the low stateafter been grown with aTc, rather than at a high temperature, due to the difference inthe second Repressor.
The experiment uses 6 variants of the toggle switch, 4 pTAK and 2 pIKE plasmids. Theplasmids within each class were varied by inserting RBS sequences of different strengthsinto the RBS1 site (see Figure 2). All plasmids demonstrated bistability except for oneof the pIKE plasmids (as shown in Figure 3). This was concluded as being most likelydue to the reduced efficiency of the Tet Repressor (R1 within pIKE plasmids), and couldbe fixed by reducing the strength of the P1 Promoter.
3
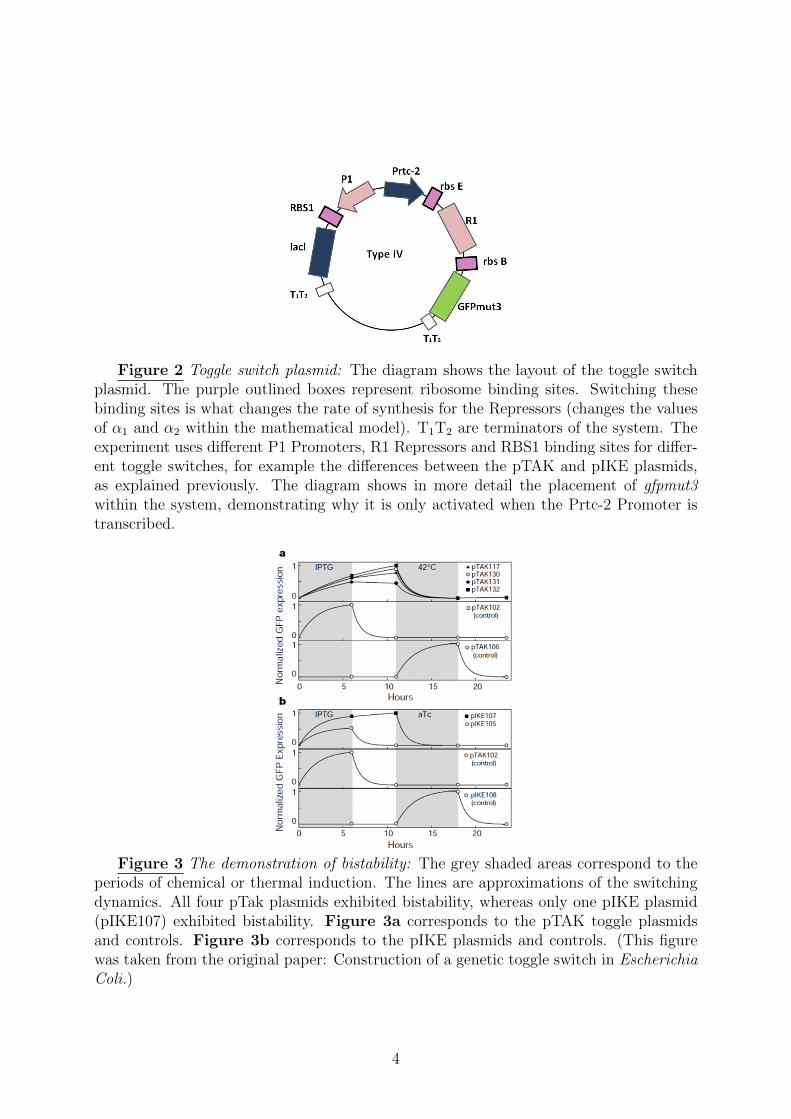
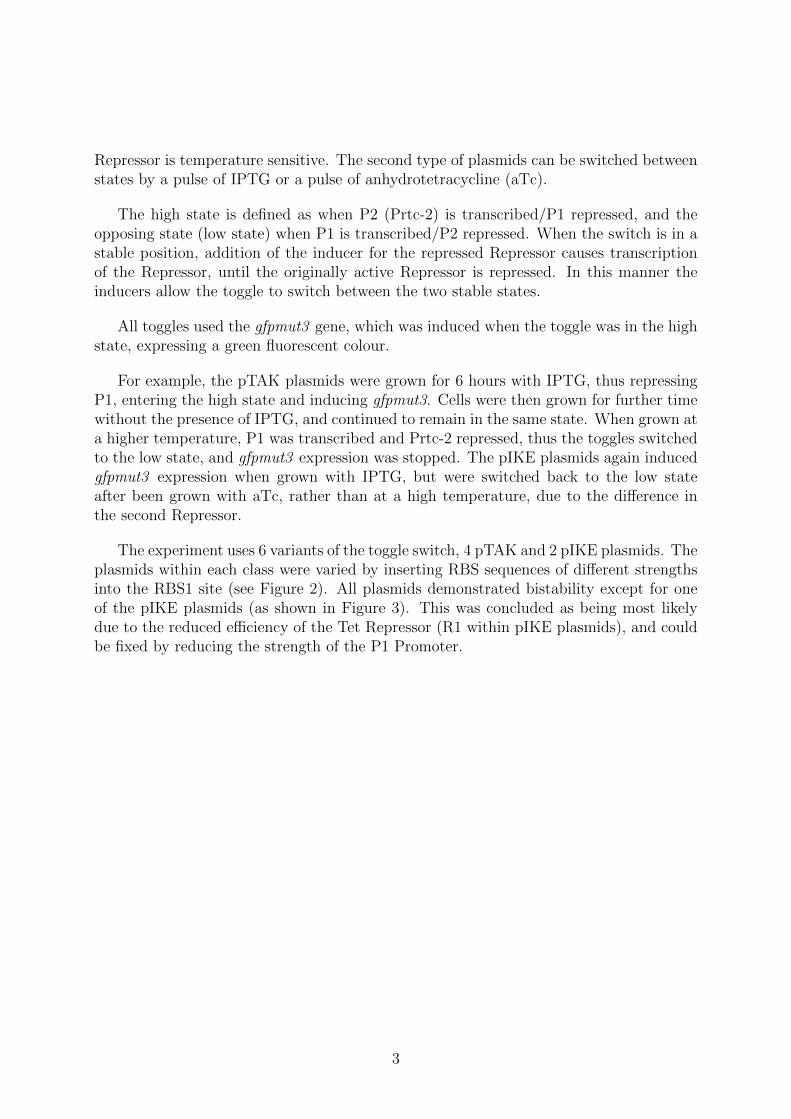
Figure 2 Toggle switch plasmid: The diagram shows the layout of the toggle switchplasmid. The purple outlined boxes represent ribosome binding sites. Switching thesebinding sites is what changes the rate of synthesis for the Repressors (changes the valuesof α1 and α2 within the mathematical model). T1T2 are terminators of the system. Theexperiment uses different P1 Promoters, R1 Repressors and RBS1 binding sites for differ-ent toggle switches, for example the differences between the pTAK and pIKE plasmids,as explained previously. The diagram shows in more detail the placement of gfpmut3within the system, demonstrating why it is only activated when the Prtc-2 Promoter istranscribed.
Figure 3 The demonstration of bistability: The grey shaded areas correspond to theperiods of chemical or thermal induction. The lines are approximations of the switchingdynamics. All four pTak plasmids exhibited bistability, whereas only one pIKE plasmid(pIKE107) exhibited bistability. Figure 3a corresponds to the pTAK toggle plasmidsand controls. Figure 3b corresponds to the pIKE plasmids and controls. (This figurewas taken from the original paper: Construction of a genetic toggle switch in EscherichiaColi.)
4

3 The Mathematical Model
The toggle switch and the conditions required for bistability can be understood using thefollowing dimensionless model for the network, which is composed of coupled ordinarydifferential equations (ODEs):
du
dt=
α1
1 + vβ− u
dv
dt=
α2
1 + uγ− v
where u and v are the concentrations of Repressor 1 and Repressor 2 respectively, α1
and α2 are the effective rates of synthesis of Repressor 1 and Repressor 2 respectively,β is the cooperativity of repression of Promoter 2 and γ is the cooperativity of repres-sion of Promoter 1.The model is derived from a biochemical rate equation formulationof gene expression. The first term in each equation represents the cooperative repressionof constitutively transcribed Promoters and the second term in each equation the degra-dation/dilution of the Repressors. The parameters α1 and α2 describe the total effectof RNA polymerase binding, open-complex formation, transcript elongation, transcripttermination, Repressor binding, ribosome binding and polypeptide elongation. β and γ,which describe cooperativity, can appear from the multimerization of the Repressor pro-teins and the cooperative binding of Repressor multimers to multiple operator sites in thePromoter.
The nullclines of the model are calculated by setting dudt
and dvdt
equal to zero:
α1
1 + vβ− u = 0
α2
1 + uγ− v = 0
This gives:
u =α1
1 + vβ, v =
α2
1 + uγ
5
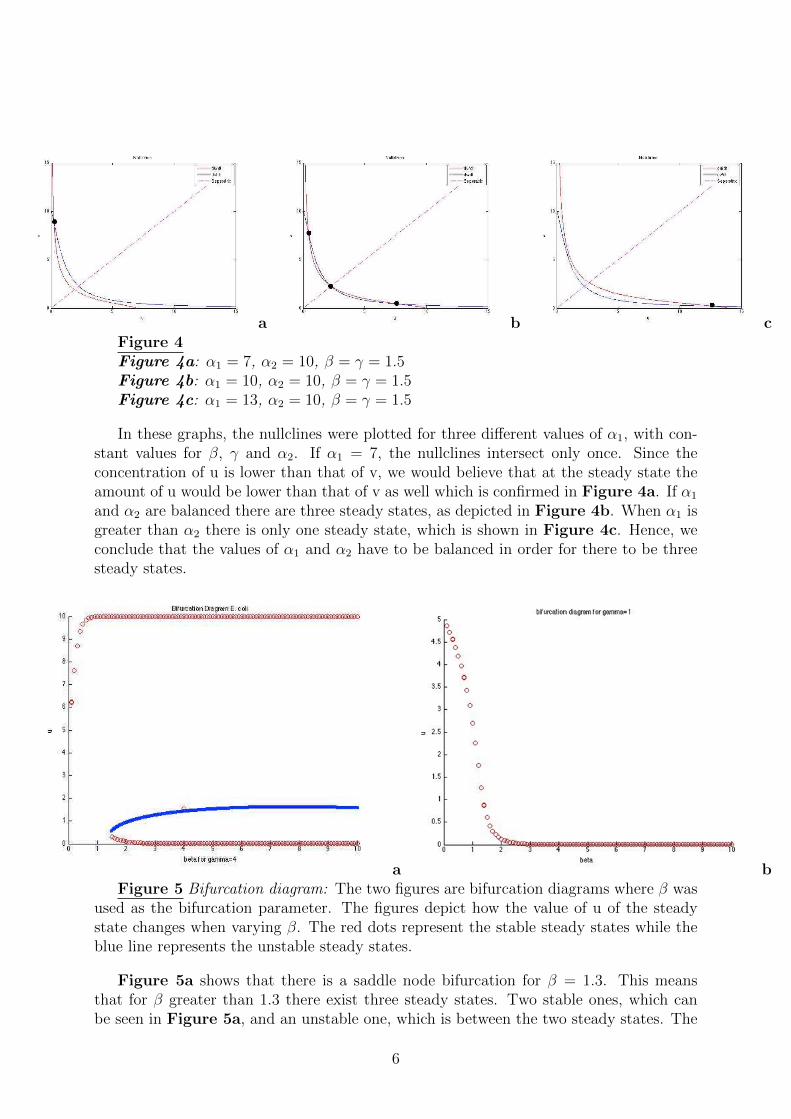
a b cFigure 4Figure 4a: α1 = 7, α2 = 10, β = γ = 1.5Figure 4b: α1 = 10, α2 = 10, β = γ = 1.5Figure 4c: α1 = 13, α2 = 10, β = γ = 1.5
In these graphs, the nullclines were plotted for three different values of α1, with con-stant values for β, γ and α2. If α1 = 7, the nullclines intersect only once. Since theconcentration of u is lower than that of v, we would believe that at the steady state theamount of u would be lower than that of v as well which is confirmed in Figure 4a. If α1
and α2 are balanced there are three steady states, as depicted in Figure 4b. When α1 isgreater than α2 there is only one steady state, which is shown in Figure 4c. Hence, weconclude that the values of α1 and α2 have to be balanced in order for there to be threesteady states.
a bFigure 5 Bifurcation diagram: The two figures are bifurcation diagrams where β was
used as the bifurcation parameter. The figures depict how the value of u of the steadystate changes when varying β. The red dots represent the stable steady states while theblue line represents the unstable steady states.
Figure 5a shows that there is a saddle node bifurcation for β = 1.3. This meansthat for β greater than 1.3 there exist three steady states. Two stable ones, which canbe seen in Figure 5a, and an unstable one, which is between the two steady states. The
6

unstable steady state is not a long term state of the model since almost every trajectorydiverges away from it. Very few initial conditions would lead to the unstable steady stateand since the initial conditions are randomly generated, it is highly unlikely that this willoccur. This is why the blue line was drawn in to represent the unstable steady states.
In Figure 5b γ is set to one. It can be seen from the graph that no matter whatvalue β is, there will always be just one steady state.
The bifurcation diagram also shows how robust the system is, i.e. how much themodel is affected by random fluctuations in the model. The closer the system gets to thebifurcation point, the less robust the system is. Thus, increasing β and γ increases thetolerance of the fluctuations of the steady states.
Hence, by analysing the bifurcation diagram, an important aspect of the model wasidentified: at least one of the two parameters β and γ has to be greater than 1.3 in orderfor there to be two stable steady states.
The Jacobian can be used to evaluate the stability of the steady states depending onour choices for the parameters. The general form of the Jacobian is the following:
J =
−1−α1βv
(β−1)
(1 + vβ)2
−α2γu(γ−1)
(1 + uγ)2−1
This is then calculated for specific values of α1, α2, β and γ.
For the remainder of the analysis we will be using α1 = α2 = 10, β = γ = 4 as thesevalues give the three steady states necessary for the toggle switch.
7
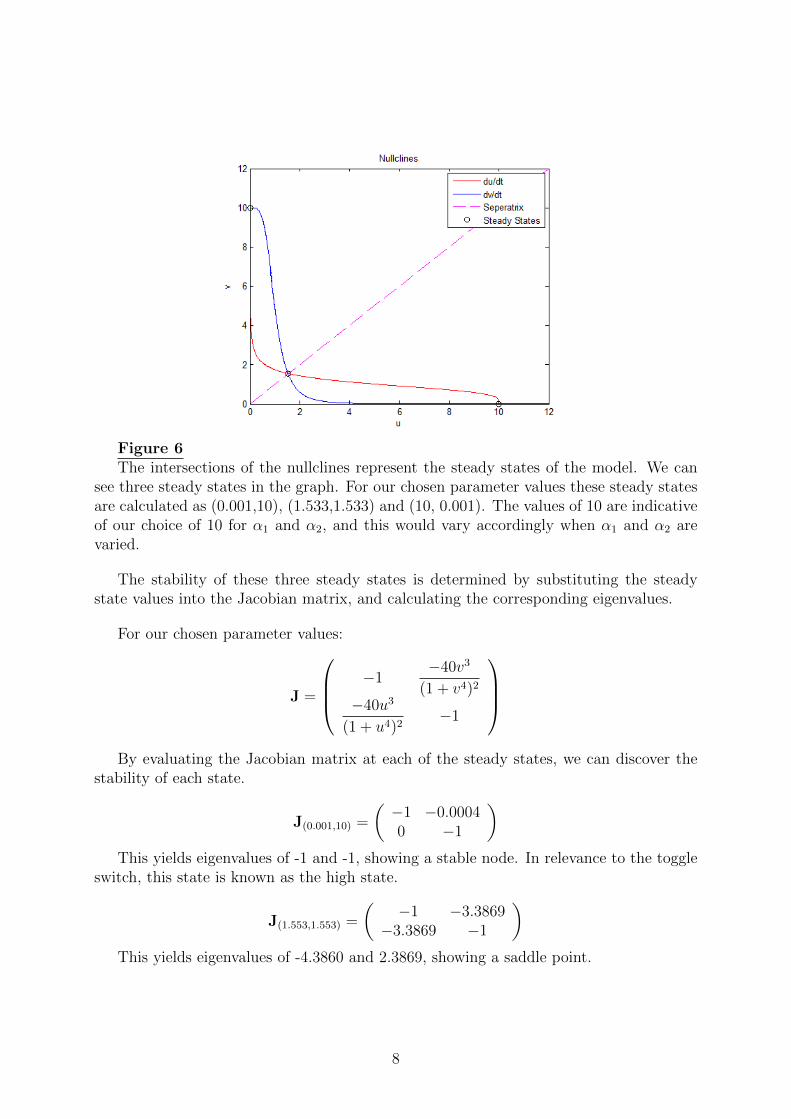
Figure 6The intersections of the nullclines represent the steady states of the model. We can
see three steady states in the graph. For our chosen parameter values these steady statesare calculated as (0.001,10), (1.533,1.533) and (10, 0.001). The values of 10 are indicativeof our choice of 10 for α1 and α2, and this would vary accordingly when α1 and α2 arevaried.
The stability of these three steady states is determined by substituting the steadystate values into the Jacobian matrix, and calculating the corresponding eigenvalues.
For our chosen parameter values:
J =
−1−40v3
(1 + v4)2
−40u3
(1 + u4)2−1
By evaluating the Jacobian matrix at each of the steady states, we can discover the
stability of each state.
J(0.001,10) =
(−1 −0.00040 −1
)This yields eigenvalues of -1 and -1, showing a stable node. In relevance to the toggle
switch, this state is known as the high state.
J(1.553,1.553) =
(−1 −3.3869
−3.3869 −1
)This yields eigenvalues of -4.3860 and 2.3869, showing a saddle point.
8
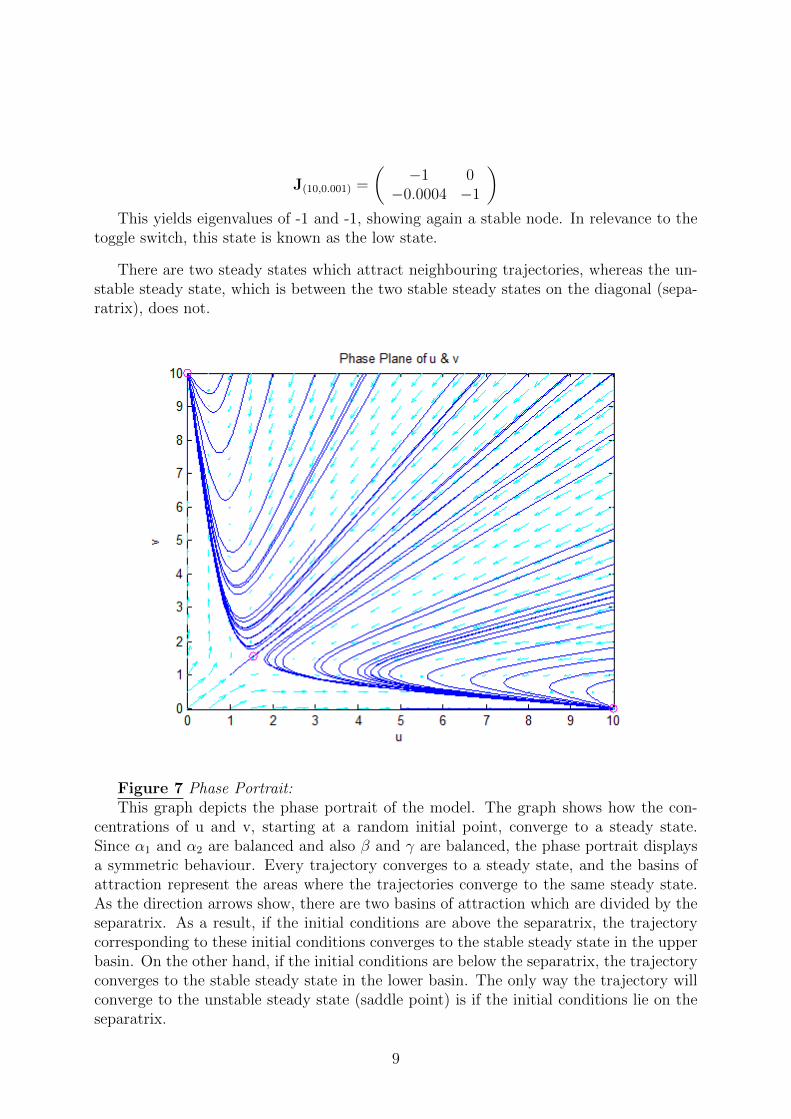
J(10,0.001) =
(−1 0
−0.0004 −1
)This yields eigenvalues of -1 and -1, showing again a stable node. In relevance to the
toggle switch, this state is known as the low state.
There are two steady states which attract neighbouring trajectories, whereas the un-stable steady state, which is between the two stable steady states on the diagonal (sepa-ratrix), does not.
Figure 7 Phase Portrait:This graph depicts the phase portrait of the model. The graph shows how the con-
centrations of u and v, starting at a random initial point, converge to a steady state.Since α1 and α2 are balanced and also β and γ are balanced, the phase portrait displaysa symmetric behaviour. Every trajectory converges to a steady state, and the basins ofattraction represent the areas where the trajectories converge to the same steady state.As the direction arrows show, there are two basins of attraction which are divided by theseparatrix. As a result, if the initial conditions are above the separatrix, the trajectorycorresponding to these initial conditions converges to the stable steady state in the upperbasin. On the other hand, if the initial conditions are below the separatrix, the trajectoryconverges to the stable steady state in the lower basin. The only way the trajectory willconverge to the unstable steady state (saddle point) is if the initial conditions lie on theseparatrix.
9

4 Conclusions
The genetic toggle switch that was constructed represents a very important departurefrom conventional genetic engineering. This is because this design mainly relied on themanipulation of network architecture instead of on the engineering of proteins and otherregulatory elements. The toggle theory and the experiment that was carried out seemto be in agreement. This suggests that theoretical design of complex and practical genenetworks is a realistic and achievable goal. The toggle switch, as a practical device, mayfind applications in gene therapy and biotechnology.
The Repressors and Promoters within the toggle switch need to be selected carefullyin order for the values of α1, α2, β, and γ to be the correct values. When α1 and α2 arebalanced, with either β and γ at a value of over 1.3, the model will have the bistabilitynecessary for the toggle switch to function as intended.
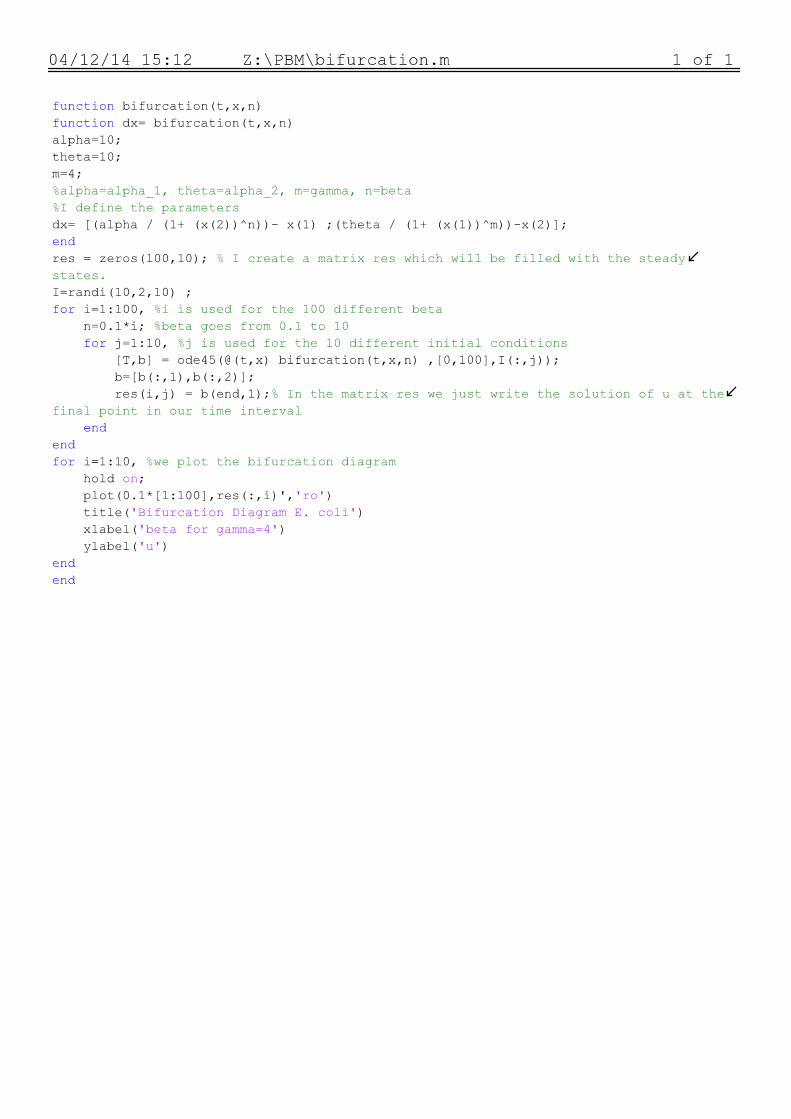
5 Appendix
Included are MATLAB script files used for plotting the nullclines, phase plane, and bi-furcation plots.
10

References
[1] Timothy S. Gardner, Charles R.Cantor and James J.Collins, “Construction of agenetic toggle swith in Escherichia coli”, Nature 403, 339–342 (2000).
[2] Enakshi Guru, Sanghamitra Chatterjee, “Study of Synthetic Biomolecular Networkin Escherichia Coli”, International Journal of Biophysics 3(1), 38–50 (2013).
[3] Tianhai Tian and Kevin Burrage, “Stochastic Models for Regulatory Networks ofthe Genetic Toggle Switch”, PNAS 103), 8372–8377 (2006).
[4] Brian Ingalls, “Mathematical Modelling in Systems Biology: An Introduction”,(2012), URL : http://www.math.uwaterloo.ca/ bingalls/MMSB/Notes.pdf
(cited on 30 November 2014).
[5] Website http://www.bio-physics.at/wiki/index.php?title=Genetic Switch,visited 23 November 2014.
[6] Website http://http://2013.igem.org/Team:Duke/Modeling/Kinetic Model,visited 23 November 2014.
[7] Website http://en.wikipedia.org/wiki/Escherichia coli, visited 25 November2014.
13