Embed Size (px)
Citation preview
Pavement Remaining Service Life for National Policy Analysis
National Pavement Management ConferenceNorfolk, VirginiaMay 6-9, 2007
Maks AlamBattelle

BUSINESS SENSITIVE
Project Goals
• Improved pavement performance models for HERS and NAPCOM– Improved models can be used to quantify pavement
remaining service life – Remaining life will be estimated based on terminal values
of distress/IRI as determined by FHWA for each pavement type, functional class, etc.
• Recommend HPMS (supporting database) + additional data requirements to be included in HPMS reassessment.

BUSINESS SENSITIVE
Project Goals (Continued)
1Current HERS
AASHTO Models(IRI, PSR)
2Calibrated IRI
•Climate•Improved IRI models•5 pavement types
3•IRI plus….•Rutting•Fatigue Crack•Slab cracking
4NCHRP 1-37AIRI + Distress
(Empirical Models)
IRI + Distress (M-E Models)
Performance Models & Algorithms

BUSINESS SENSITIVE
Project Goals (Continued)
• Improved pavement performance prediction
Dist
ress
/IRI/P
SR
Pavement Age, years100 Observed
Predicted by HERS/NAPCOM Observed Distress/IRI ±Bias

Remaining Service Life
• Defined for this project as the time in age or traffic applications from initial construction or reconstruction to first major rehabilitation
Initial ConstructionOr
Reconstruction
First MajorRehab
Dis
tress
/IRI
*Current
Distress/IRILevel
*
RL
Terminal Distress/IRI
Current Age

BUSINESS SENSITIVE
Status to Date
• White Papers, Technical Memos, & Steering Committee Meetings– (1) Pavement Performance Model Needs for Highway
Policy Analysis and Cost Allocation (HERS & HCAS)– (2) Development of Procedures and Criteria for Evaluating
Pavement Asset Management Systems for Use in HERS – (3) Survey Report on the Evaluation of State Highway
Agencies Pavement Management Systems– (4) April 2005: Nation-wide Pavement Steering Committee
Meeting
BUSINESS SENSITIVE
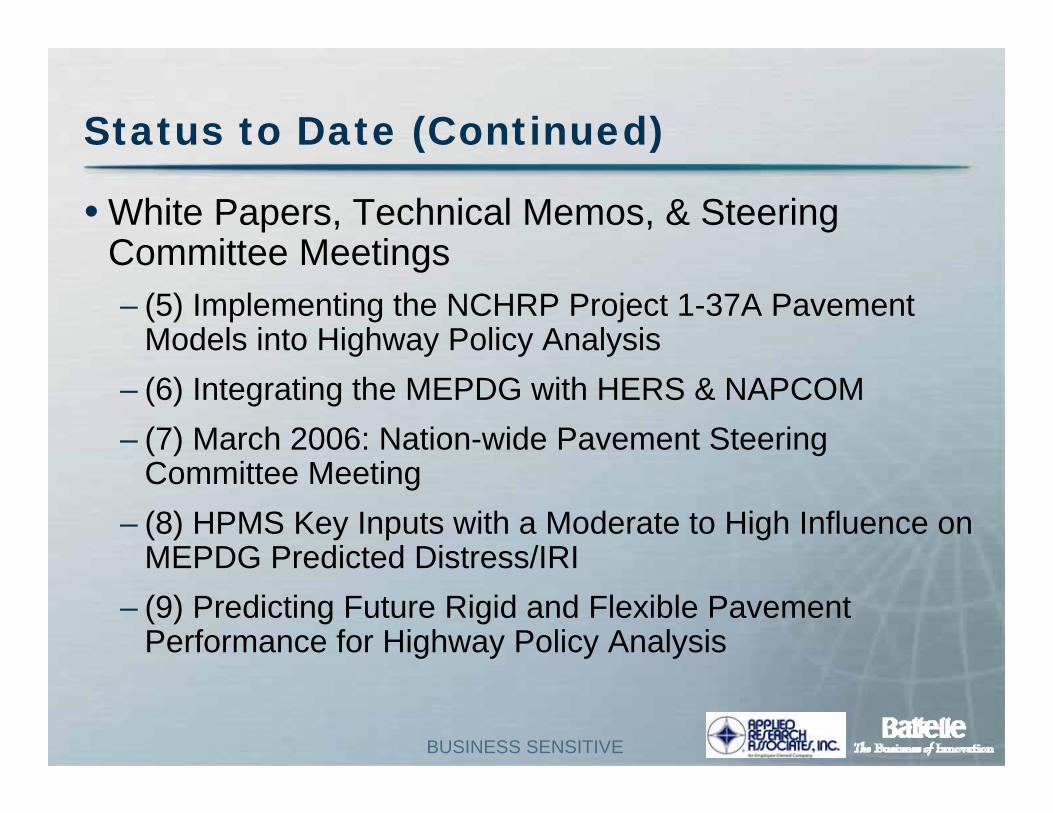
Status to Date (Continued)
• White Papers, Technical Memos, & Steering Committee Meetings– (5) Implementing the NCHRP Project 1-37A Pavement
Models into Highway Policy Analysis– (6) Integrating the MEPDG with HERS & NAPCOM– (7) March 2006: Nation-wide Pavement Steering
Committee Meeting – (8) HPMS Key Inputs with a Moderate to High Influence on
MEPDG Predicted Distress/IRI– (9) Predicting Future Rigid and Flexible Pavement
Performance for Highway Policy Analysis

BUSINESS SENSITIVE
Recommendation……
Adapt newly developed ME-PDG mechanistic-empirical pavement prediction models for use in HERS and NAPCOM
Developed under:NCHRP Project 1-37ANCHRP Project 1-40ANCHRP Project 1-40BNCHRP Project 1-40D

ME-PDG
•• MechanisticallyMechanistically calculate pavement response (i.e., stresses, strains, and deflections) due to:– Traffic loading– Environmental conditions
• Accumulate damagedamage over time•• EmpiricallyEmpirically relate damage over time to pavement
distresses (e.g., cracking, rutting, faulting)•• CalibrateCalibrate predictions to observed field performance
State-of-the-art (2006)
Current Practice (HERS, AASHTO 1993)
Empirical Mechanistic-Empirical Mechanistic

ME-PDGClimate
TrafficMaterials
Structure
DistressResponseTime
Damage
Damage Accumulation

BUSINESS SENSITIVE
ME-PDG Models Data Inputs
• Depending upon the choice of hierarchical approach of data input – may significantly increase the data collection burden to HPMS.
• M-E PDG offers wealth of default values that can significantly minimize the data collection burden to HPMS

BUSINESS SENSITIVE
ME-PDG Models Input Data Sensitivity on Prediction
• Sensitivity analysis– Determine ME-PDG inputs critical for predicting future
pavement performance– Determine additional inputs required for HPMS– Desired data required for modified ME-PDG models
provided to HPMS reassessment team

HPMS Data Items (Reassessment)
ModerateNo (State defaults)HMA gradation
Moderate to HighYesBase thickness
ModerateYesHMA binder type
Yes
Yes
Yes
YesYesYesYes
Availability in HPMS after
Reassessment
ModerateSubgrade type
Moderate to HighBase type
HighLatest asphalt overlay thickness
HighExisting asphalt layers thickness (incl. past overlays
HighLatest major rehabilitation dateHighOriginal construction dateHighPavement type
Impact on MEPDG Predicted
Distress/SmoothnessDesired Sensitive MEPDG
Inputs

HPMS Data Items (Reassessment)
HighYesPCC thicknessHighNoPCC CTEHighYesShoulder type and lane width
HighYes (default)PCC strengthHighYesJPCP joint spacingHighYesJPCP dowels?
-----YesFaulting, cracking, rutting, etc.YesYesYes
No
Availability in HPMS after
Reassessment
HighInitial and current IRIHighTruck vol. & compositionHighClimate
HighPCC permanent curl/warp
Impact on MEPDG Predicted
Distress/SmoothnessDesired Sensitive MEPDG
Inputs

BUSINESS SENSITIVE
Process of Developing New Simplified Performance Prediction Models for HERS
• ME-PDG includes very complex mechanistic based models that predicts pavement performance
• Distress/IRI models were calibrated with hundreds of actual pavement sections across North America (LTPP, MnROAD, AASHO, etc.)
• Simplified empirical models of key distress were derived based on outputs from the MEPDG
• These models are sufficiently accurate to meet the needs of HERS

BUSINESS SENSITIVE
Examples of Plots of Predicted vs. Measured Distresses for ME-PDG Models

BUSINESS SENSITIVE
Process of Developing New Simplified Performance Prediction Models for HERS
• Assemble matrix of pavement site/design properties etc., that represent HPMS conditions
• Populate the matrix with selected LTPP representative sections (over 200 sections identified)
• Develop M-E PDG input data for selected sections • Run ME-PDG and create database ME-PDG inputs
and predicted performance • Develop empirical distress prediction models

BUSINESS SENSITIVE
LTPP Sections Used for JPCP Performance Models Development

BUSINESS SENSITIVE
LTPP Climate Zones
W et- Nonfr eeze
D ry- Nonfr eeze
We t-Fr eeze
Dr y-Fr eeze

Example of Typical LTPP Pavement Section
3 to 6-in CTB
10-ft HMA Shoulder (Outer)
8 to 12-in PCC
4 to 10-in Crushed Agg. Base
12-ft Design Lane
12-ft Passing Lane
4-ft HMA Shoulder (Inner)
Subgrade (k-value = 100 to 400 psi/in)
DrivingDirection
BUSINESS SENSITIVE
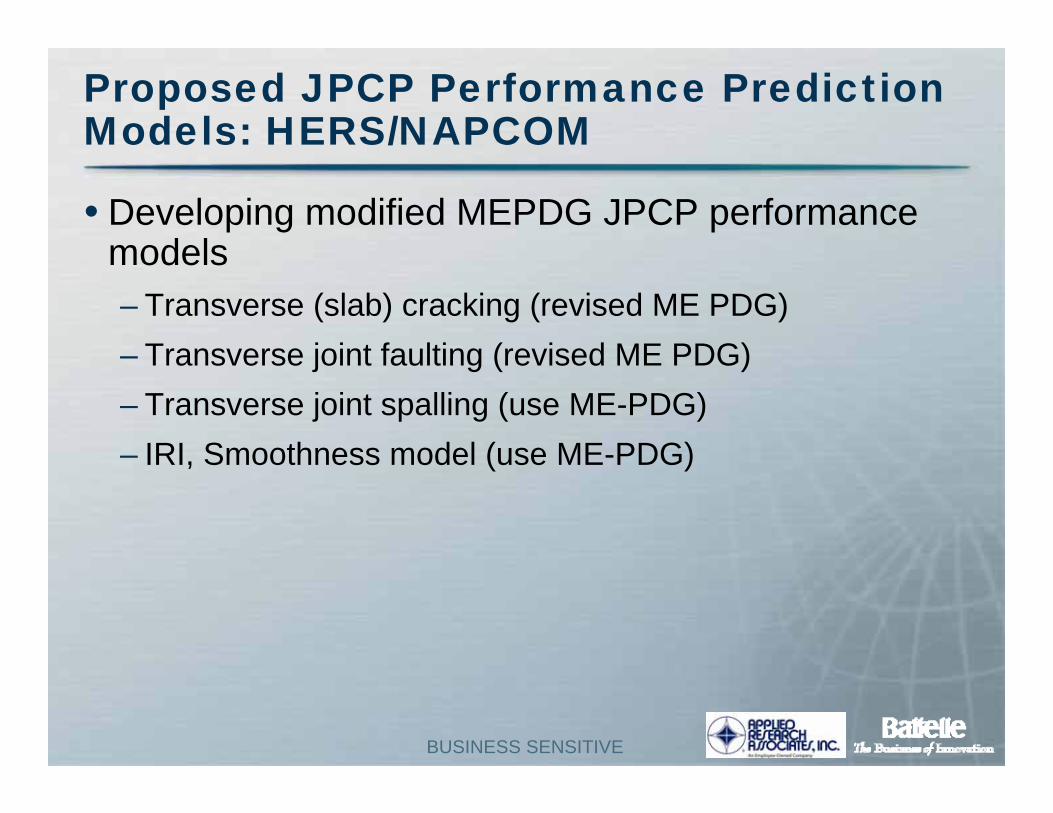
Proposed JPCP Performance Prediction Models: HERS/NAPCOM
• Developing modified MEPDG JPCP performance models– Transverse (slab) cracking (revised ME PDG)– Transverse joint faulting (revised ME PDG)– Transverse joint spalling (use ME-PDG)– IRI, Smoothness model (use ME-PDG)

BUSINESS SENSITIVE
Proposed HMA Performance Prediction Models: HERS/NAPCOM
• New empirical HMA & HMA/HMA models development– Alligator Cracking (revised ME-PDG)– Rutting (revised ME-PDG)– IRI (use ME-PDG)– Transverse Cracking (revised ME-PDG)
• New empirical composite pavement (reflection cracking) model development– Transverse/Reflection Cracking (use ME-PDG)

BUSINESS SENSITIVE
Transverse (Slab) Cracking
• New empirical model derived from ME-PDG outputs of pavements.
• Significant reduction of input data and “simple”model form for HERS/NAPCOM applications
• New empirical model is based on the following variables:–Slab thickness, joint spacing, base type, climate,
subgrade type, traffic, shoulder type, lane width, and PCC strength properties (defaults)
BUSINESS SENSITIVE
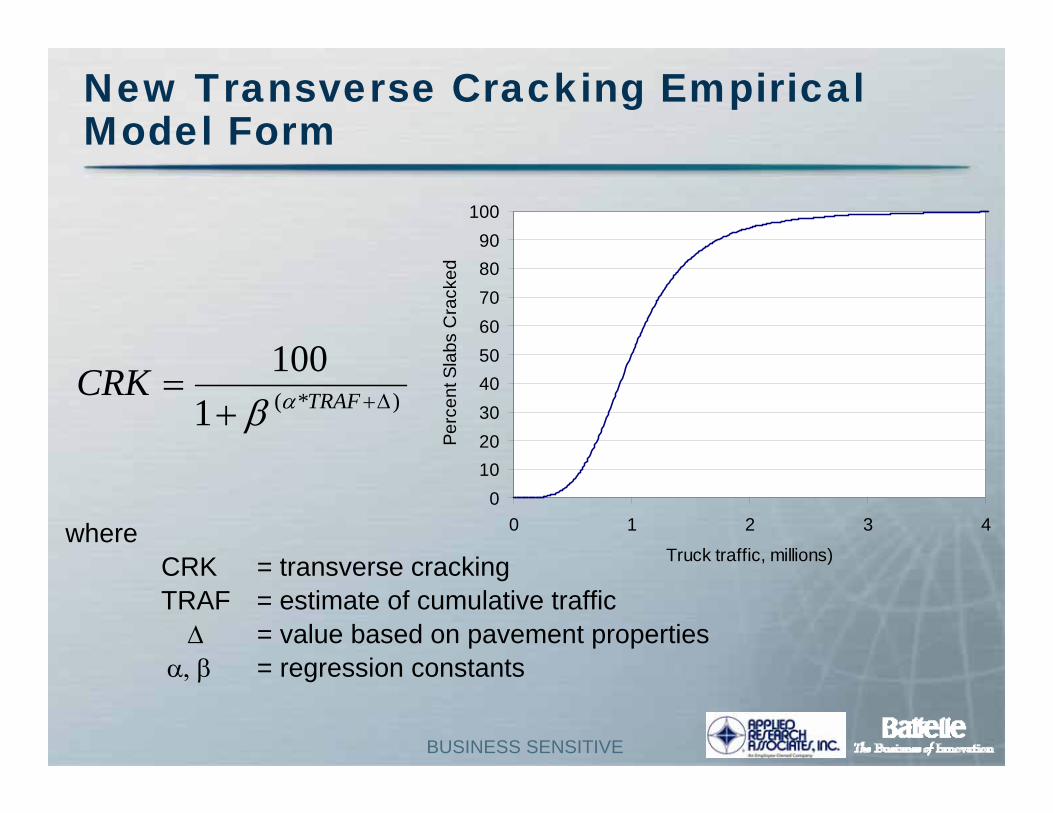
New Transverse Cracking Empirical Model Form
)*(1100
Δ++= TRAFCRK αβ
where CRK = transverse crackingTRAF = estimate of cumulative traffic
Δ = value based on pavement propertiesα, β = regression constants
0102030405060708090
100
0 1 2 3 4
Truck traffic, millions)
Perc
ent S
labs
Cra
cked

BUSINESS SENSITIVE
Transverse Cracking – Effect of Slab Thickness

BUSINESS SENSITIVE
Transverse Cracking – Effect of Joint Spacing
BUSINESS SENSITIVE
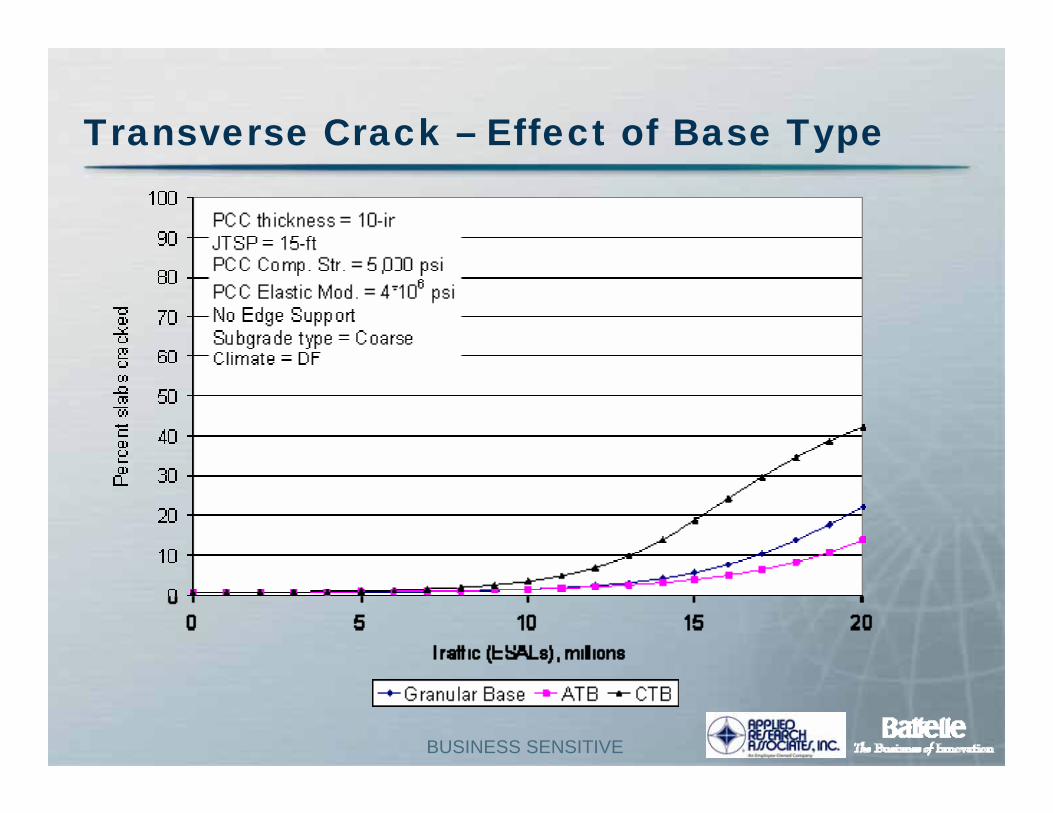
Transverse Crack – Effect of Base Type

BUSINESS SENSITIVE
Transverse Crack – Effect of Climate
0
10
20
30
40
50
60
70
80
90
100
0 5 10 15 20Traffic (ESALs), millions
Perc
ent s
labs
cra
cked
DF WF WNF DNF
PCC thickness = 10-inBase Type = GranularJTSP = 15-ftPCC Comp. Str. = 5,000 psiPCC Elastic Mod. = 4*106 psiNo Edge SupportSubgrade type = Coarse

BUSINESS SENSITIVE
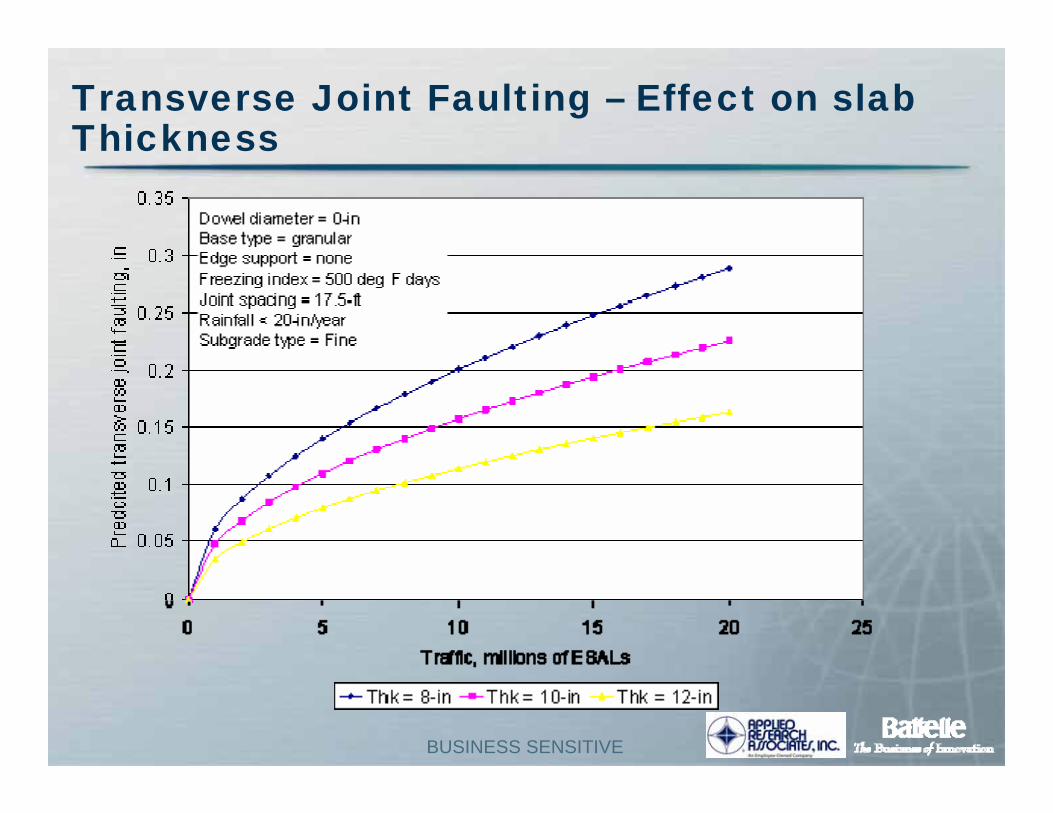
Transverse Joint Faulting
• New empirical model derived from ME-PDG outputs• Significant reduction of input data and “simple”
model form for HERS applications• New empirical model is a function of the following
variables:–Slab thickness, dowel size, joint spacing, base
type, climate, edge support, subgrade type, and truck volume & composition

New Transverse Joint Faulting Empirical Model Form
where FAULT = transverse joint faultingTRAF = estimate of cumulative traffic
γ = value based on pavement propertiesα, β = regression constants
0.0
0.1
0.2
0.3
0.4
0 5 10 15 20
Truck Traffic (millions)
Faul
ting,
in
FAULT = TRAFα(1-βDOWDIA)*γ

BUSINESS SENSITIVE
Transverse Joint Faulting –Effect on Dowels
BUSINESS SENSITIVE
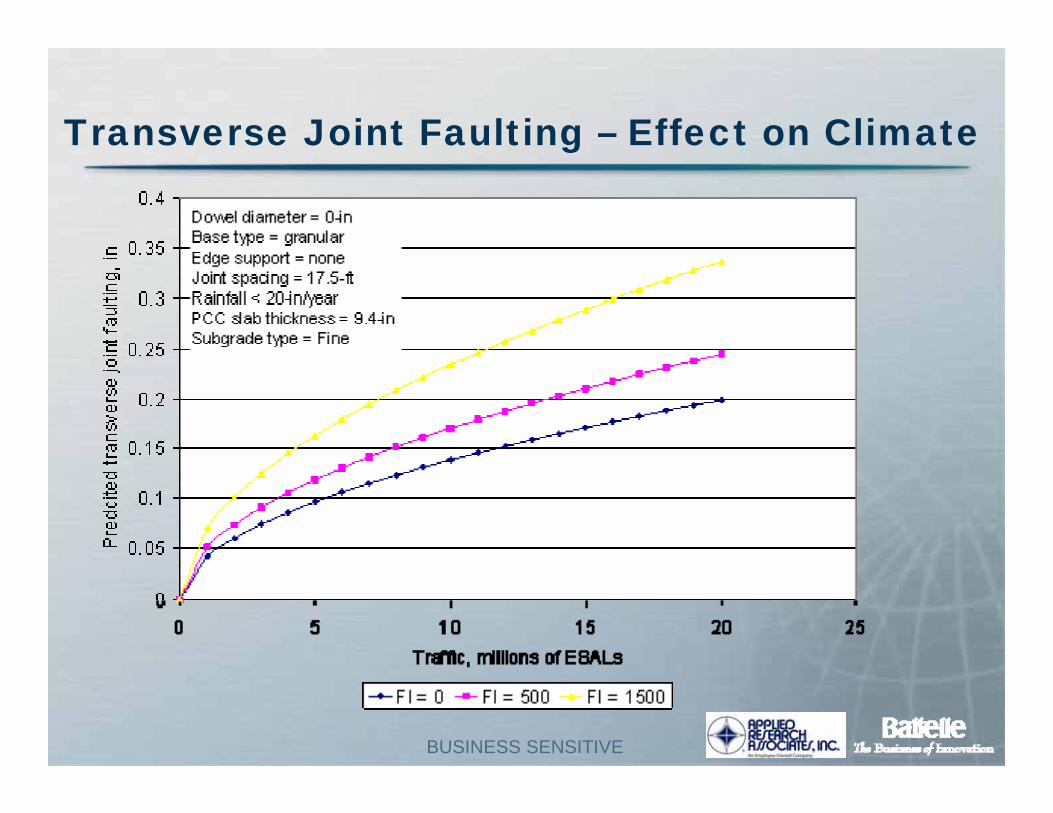
Transverse Joint Faulting – Effect on Climate
BUSINESS SENSITIVE
Transverse Joint Faulting – Effect on slab Thickness

BUSINESS SENSITIVE
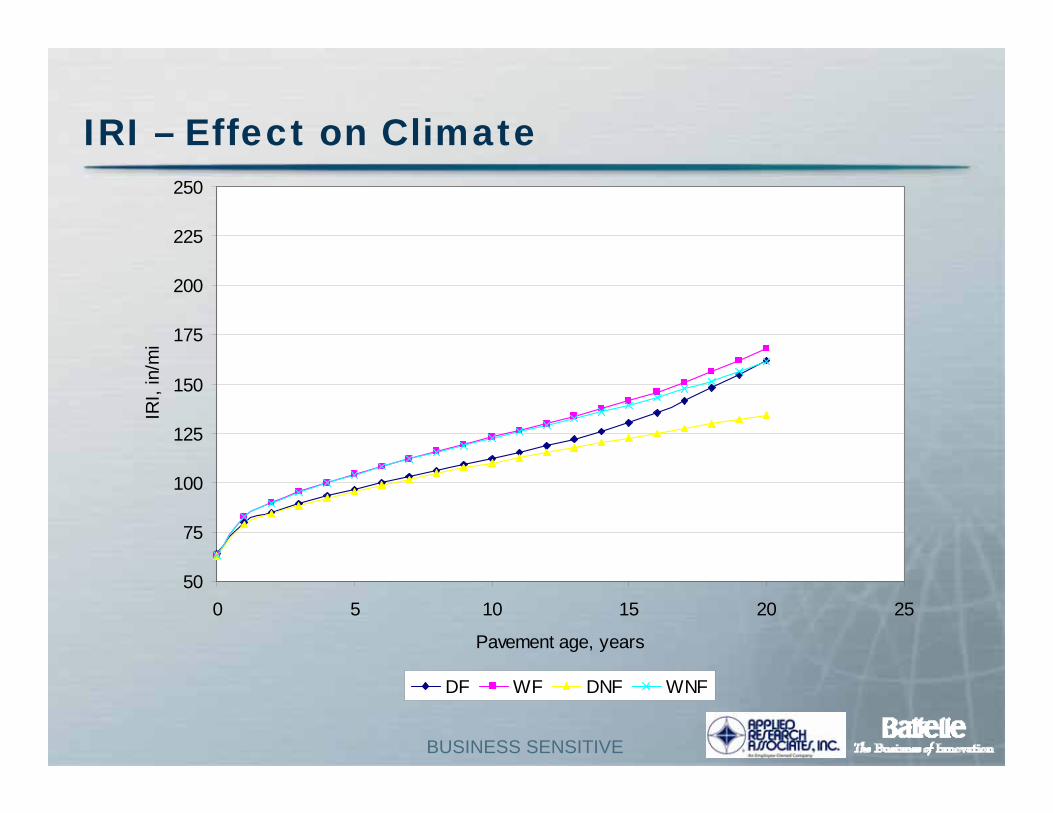
Smoothness Model (Identical to ME-PDG)
IRIa = IRII + 0.82*CRKa + 0.44*SPALLa+ 1.49*TFAULTa + 25.24*SF
WhereIRIa = IRI in forecast year “a”IRII = Initial pavement smoothness
CRKa = percent slabs with transverse crack in forecastyear “a”
TFAULTa = total joint faulting in forecast year “a”SPALLa = percentage of joints with spalling in forecast year
“a” – (predicted using existing MEPDG model)

BUSINESS SENSITIVE
IRI – Effect on Dowels
50
75
100
125
150
175
200
225
250
0 5 10 15 20 25
Pavement age, years
IRI,
in/m
i
Dow = 0-in Dow = 1.0-in Dow = 1.5-in

BUSINESS SENSITIVE
IRI – Effect on PCC Thickness
50
75
100
125
150
175
200
225
250
0 5 10 15 20 25
Pavement age, years
IRI,
in/m
i
Thk = 8-in Thk = 10-in Thk = 12-in
BUSINESS SENSITIVE
IRI – Effect on Climate
50
75
100
125
150
175
200
225
250
0 5 10 15 20 25
Pavement age, years
IRI,
in/m
i
DF WF DNF WNF

Remaining Service Life
• Defined for this project as the time in age or traffic applications from initial construction or reconstruction to first major rehabilitation
Initial ConstructionOr
Reconstruction
First MajorRehab
Dis
tress
/IRI
*Current
Distress/IRILevel
*
RL
Terminal Distress/IRI
Current Age

BUSINESS SENSITIVE
Applying New Empirical Models to Determine Remaining Life-Proposed
• Step 1: Assemble HPMS project input data– Traffic, climate, design, materials, current distress/IRI, etc.
• Step 2: Predict future pavement distress/IRI– Slab cracking, faulting, spalling, & IRI
• Step 3: Adjust predicted distress/IRI with current distress/IRI in HPMS
*
Adjusted Prediction
New ModelsPrediction

BUSINESS SENSITIVE
Applying Modified MEPDG JPCP Performance Models to Determine RL
• Step 4: Compare future predictions with FHWA terminal distress/IRI values
• Step 5: Determine time from initial construction or reconstruction to first major rehab. triggered by excessive levels of faulting, cracking, and IRI
• Step 6: Determine current pavement age or traffic applied since initial construction or reconstruction

BUSINESS SENSITIVE
Estimate of Remaining Life
Initial ConstructionOr
Reconstruction
First MajorRehab
Dis
tress
/IRI
*Current
Distress/IRILevel
*
RL
Terminal Distress/IRI
Current Age
Adjusted New Empirical Models
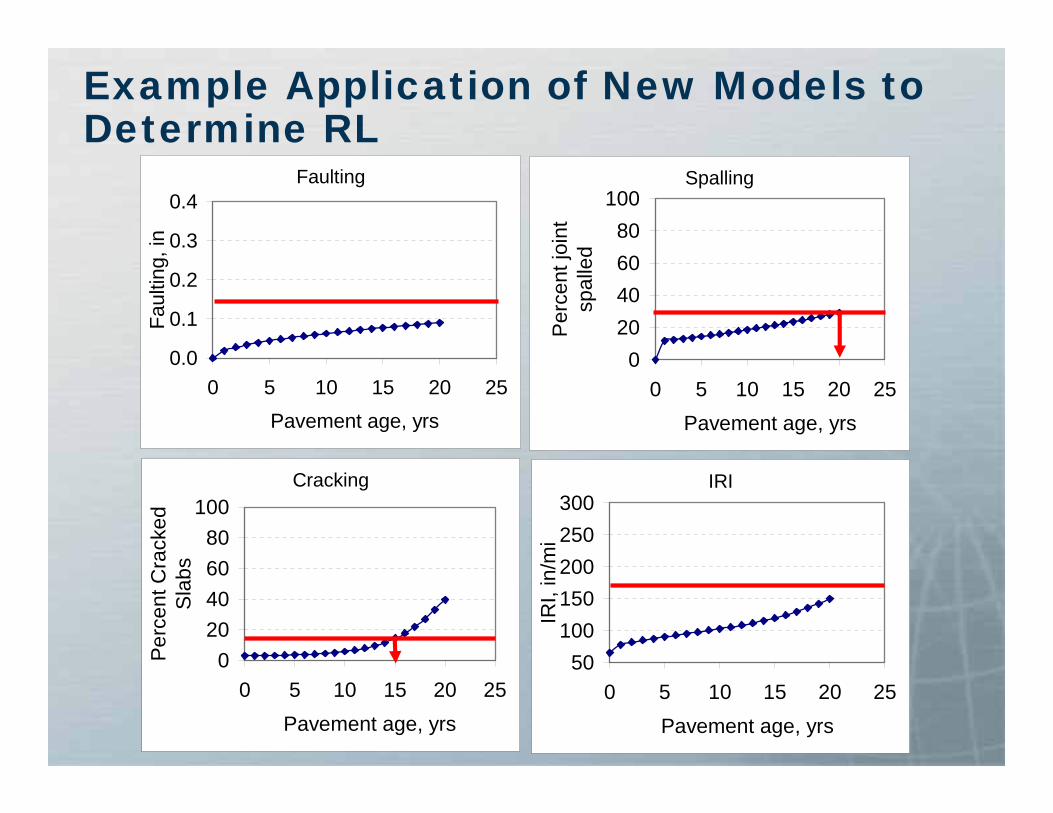
Example Application of New Models to Determine RL
Cracking
020406080
100
0 5 10 15 20 25Pavement age, yrs
Perc
ent C
rack
ed
Sla
bsFaulting
0.0
0.1
0.2
0.3
0.4
0 5 10 15 20 25Pavement age, yrs
Faul
ting,
in
IRI
50100150200250300
0 5 10 15 20 25Pavement age, yrs
IRI,
in/m
i
Spalling
020406080
100
0 5 10 15 20 25Pavement age, yrs
Per
cent
join
t sp
alle
d

BUSINESS SENSITIVE
Example Application to Determine RL
• Current age = 10 years
• Critical distress is slab cracking– Remaining life based on rehabilitation triggered by
excessive cracking is 5 years
10+20Faulting1020Spalling
10+20IRI
15
Predicted Life (Age in Years)
5Cracking
Remaining Life(Age in Years)
Desired Sensitive MEPDG Inputs
BUSINESS SENSITIVE
Feasible Rehabilitation Treatments
• For excessive cracking a structural improvement will be needed (e.g., thick overlay or reconstruct)
• If excessive faulting were the problem, diamond grinding would be a cost-effective solution

BUSINESS SENSITIVE
Thank-You
• Any questions?