Embed Size (px)
Citation preview
City of Watertown, SD Pavement Management Analysis Report
May 2017
City of Watertown Attn.: Steven Gramm, P.E., SD DOT Planning Engineer
700 E. Broadway Avenue Pierre, SD 57501
IMS Infrastructure Management Services 1820 West Drake Drive, Suite 104, Tempe, AZ 85283
Phone: (480) 839-4347, Fax: (480) 839-4348 www.ims-rst.com
IMS Infrastructure Management Services Watertown_Report_Rev 2 Page i
I. DISCLAIMERS
The following statements are disclaimers regarding funding of FHWA, USDOT, and SDDOT assignments:
FHWA Funding Disclaimer:
“The preparation of this report has been financed in part through grant(s) from the Federal Highway Administration and Federal Transit Administration, U.S. Department of Transportation, under the State Planning and Research Program, Section 505 of Title 23, U.S. Code. The contents of this report do not necessarily reflect the official views or policy of the U.S. Department of Transportation."
SDDOT SPR for Local Agencies Funding Disclaimer:
“The preparation of this report has been financed through the South Dakota Department of Transportation’s SPR Funding for Local Agencies program. The contents and recommendations of this report do not necessarily reflect official views, policy, or endorsement of the South Dakota Department of Transportation."
SDDOT Title VI statement:
The South Dakota Department of Transportation provides services without regard to race, color, gender, religion, national origin, age, or disability, according to provisions contained in SDCL 20-13, Title VI of the Civil Rights Act of 1964, the Rehabilitation Act of 1973, as amended, the Americans With Disabilities Act of 1990 and Executive Order 12898, Federal Actions to address Environmental Justice in Minority Populations, 1994. To request additional information on the SDDOT’s Title VI/Nondiscrimination policy or the file a discrimination complaint, please contact the Department’s Civil Rights Office at 605-773-3540."
IMS Infrastructure Management Services Watertown_Report_Rev 2 Page ii
TABLE OF CONTENTS
I. DISCLAIMERS I
TABLE OF CONTENTS II
1.0 PROJECT DESCRIPTION 1
1.1 Principles of Pavement Management 1
1.2 The Pavement Management Process 4
1.3 Functional Class Review 7
1.4 Assembly of Data Into Projects 9
1.5 Understanding the Pavement Condidtion Index Score 10
2.0 ROADWAY NETWORK CONDITION AND FINDINGS 18
2.1 Roadway Network Size 18
2.2 Network Present Condition 19 2.3 Structural and Load Associated Distress Analysis 23
2.4 Condition By Functional Classification 27
2.5 Evaluating Quality of the Network and Reconstruction Backlog 27
3.0 REHABILITATION PLAN AND BUDGET DEVELOPMENT 29
3.1 Key Analysis Set Points 29
3.2 Fix All and Annual Estimates 33
3.3 Network Budget Analysis Models 34
3.4 Watertown Comparison to Other Agencies 38
3.5 Selection Summary and Post Rehabilitation Condition 40 3.6 Network Recommendations and Comments 42
APPENDED REPORTS Following Page 42
Appendix A Street Inventory and Condition Summary, Sorted by Street Name
Appendix B $2.4M/year Rehab Plan by Segment
Appendix C $2.4M/year Rehab Plan by Year
Appendix D Method and Assumption Document
APPENDED MAPS Located on Thumb Drive
Functional Classification Designation
Pavement Condition Index and Rating by Segment Using PCI
Pavement Condition Index and Rating by Segment Using Descriptive Terms
Five Year Post Rehabilitation Plan for $2.4M Budget Post Rehabs PCI Maps
IMS Infrastructure Management Services Watertown_Report_Rev 2 Page iii
Abbreviationor Acronym Definition
$k Dollars in thousands ($,000)$M Dollars in millions
%SP Percent Spreadability - component of deflection analysisAC Asphalt Concrete - asphalt streets, f lexible pavements, also know n as ACPACP Asphalt Concrete Pavement - asphalt streets, f lexible pavements, also know n as ACART Arterial roadw ay functional classif ication
ASTM American Society of Testing MethodsAvg AverageBCI Base Curvature Index - component of deflection analysisBrk BreakCAL Coarse Aggregate LossCDV Corrected Deduct Value - part of the ASTM D6433 PCI calculationCOL Collector roadw ay functional classif icationCrk Crack
DeflCON Deflection Condition - structural load analysis based on traff ic loading and deflectionDMD Dynamic Maximum Deflection - temperature corrected deflection
Dvdd Slab Divided SlabDynaCON Dynamic Condition - structural layer analysisft or FT Foot
ft2 or FT2 Square footFunCL Functional Classif icationFWD Falling w eight deflectometerGCI Gravel Condition IndexGFP Good - Fair - PoorGIS Geographic Information System
GISID GIS segment identif ication numberH&V Horizontal and VerticalIRI International Roughness IndexJt Joint
L&T Longitudinal and TransverseLAD Load associated distressLOC Local roadw ay functional classif ication - same as RESLOG Lip of Gutter
m Metre or meterM Moderatem2 square metre or square meter
MART Major arterial roadw ay functional classif icationMax Maximum
MaxDV Maximum Deduct ValueMCOL Major collector roadw ay functional classif ication
mi or Mi MileMin Minimum
MnART Minor arterial roadw ay functional classif icationMnCOL Minor collector roadw ay functional classif icationMOD ModerateNLAD Non-load associated distressOCI Overall condition index, also know n as PCIOlay OverlayPART Primary arterial roadw ay functional classif ication
Pavetype Pavement TypePCC Portland Cement Concrete - concrete streetsPCI Pavement Condition Index - generic term for OCIR&R Remove and replace
RART Rural arterial roadw ay functional classif icationPWF Priority Weighting Factor
Recon ReconstructionRehab RehabilitationRES Local roadw ay functional classif ication - same as LOC
RI or RCI Roughness IndexS Strong
SART Secondary arterial roadw ay functional classif icationSCI Surface Curvature Index - componenent of deflection analysisSDI Surface Distress IndexSI Structural Index
STA Station or chainageSurf Trtmt Surface Treatment
TDV Total Deduct ValueW Weak
IMS Infrastructure Management Services Watertown_Report_Rev 2 Page 1
1.0 PROJECT DESCRIPTION
1.1 PRINCIPLES OF PAVEMENT MANAGEMENT
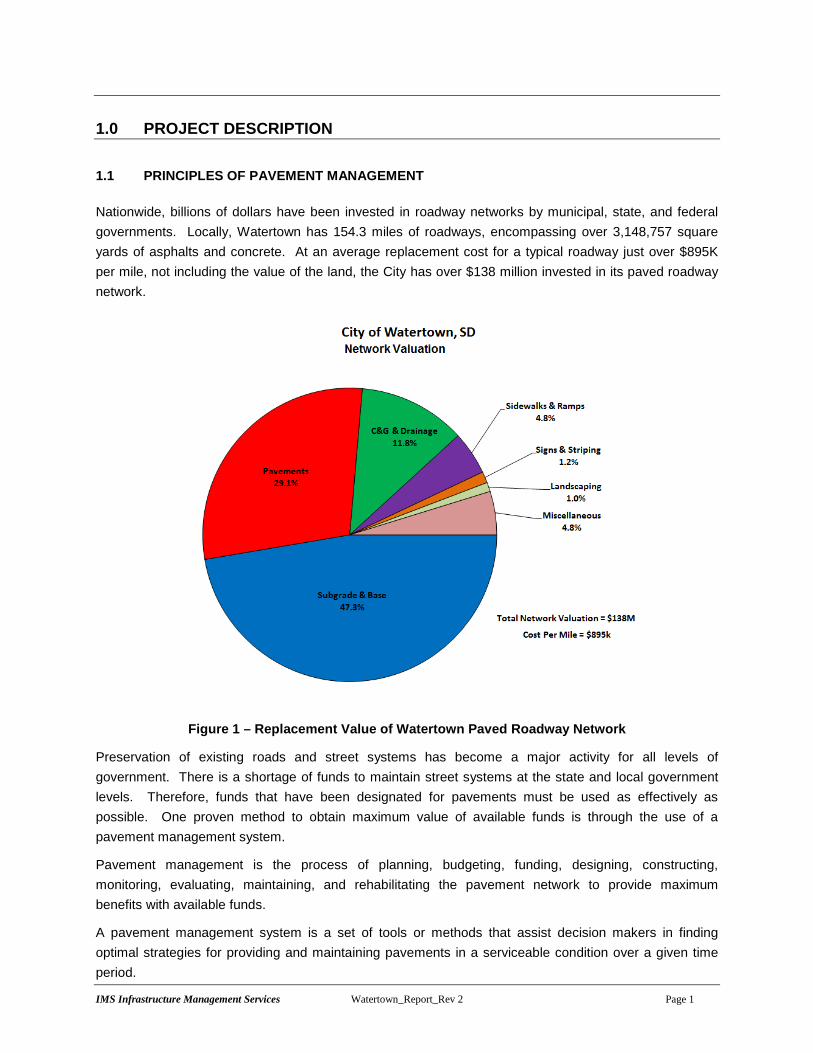
Nationwide, billions of dollars have been invested in roadway networks by municipal, state, and federal governments. Locally, Watertown has 154.3 miles of roadways, encompassing over 3,148,757 square yards of asphalts and concrete. At an average replacement cost for a typical roadway just over $895K per mile, not including the value of the land, the City has over $138 million invested in its paved roadway network.
Figure 1 – Replacement Value of Watertown Paved Roadway Network
Preservation of existing roads and street systems has become a major activity for all levels of government. There is a shortage of funds to maintain street systems at the state and local government levels. Therefore, funds that have been designated for pavements must be used as effectively as possible. One proven method to obtain maximum value of available funds is through the use of a pavement management system.
Pavement management is the process of planning, budgeting, funding, designing, constructing, monitoring, evaluating, maintaining, and rehabilitating the pavement network to provide maximum benefits with available funds.
A pavement management system is a set of tools or methods that assist decision makers in finding optimal strategies for providing and maintaining pavements in a serviceable condition over a given time period.
IMS Infrastructure Management Services Watertown_Report_Rev 2 Page 2
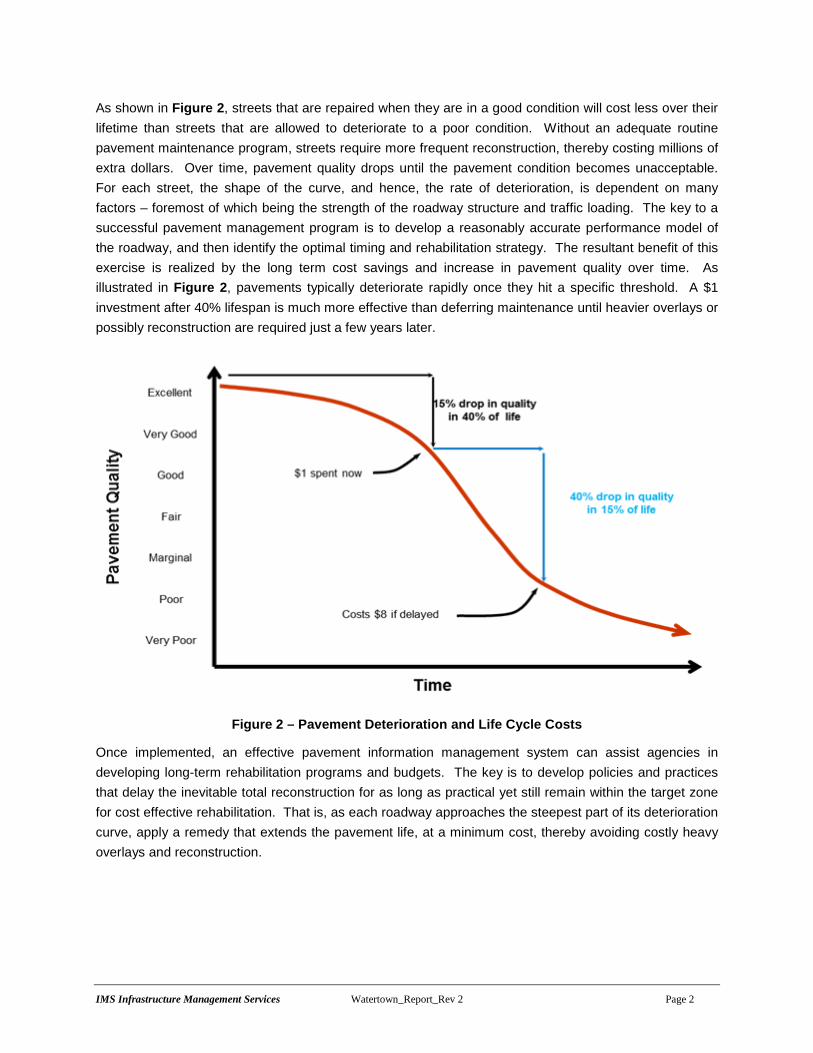
As shown in Figure 2, streets that are repaired when they are in a good condition will cost less over their lifetime than streets that are allowed to deteriorate to a poor condition. Without an adequate routine pavement maintenance program, streets require more frequent reconstruction, thereby costing millions of extra dollars. Over time, pavement quality drops until the pavement condition becomes unacceptable. For each street, the shape of the curve, and hence, the rate of deterioration, is dependent on many factors – foremost of which being the strength of the roadway structure and traffic loading. The key to a successful pavement management program is to develop a reasonably accurate performance model of the roadway, and then identify the optimal timing and rehabilitation strategy. The resultant benefit of this exercise is realized by the long term cost savings and increase in pavement quality over time. As illustrated in Figure 2, pavements typically deteriorate rapidly once they hit a specific threshold. A $1 investment after 40% lifespan is much more effective than deferring maintenance until heavier overlays or possibly reconstruction are required just a few years later.
Figure 2 – Pavement Deterioration and Life Cycle Costs
Once implemented, an effective pavement information management system can assist agencies in developing long-term rehabilitation programs and budgets. The key is to develop policies and practices that delay the inevitable total reconstruction for as long as practical yet still remain within the target zone for cost effective rehabilitation. That is, as each roadway approaches the steepest part of its deterioration curve, apply a remedy that extends the pavement life, at a minimum cost, thereby avoiding costly heavy overlays and reconstruction.
IMS Infrastructure Management Services Watertown_Report_Rev 2 Page 3
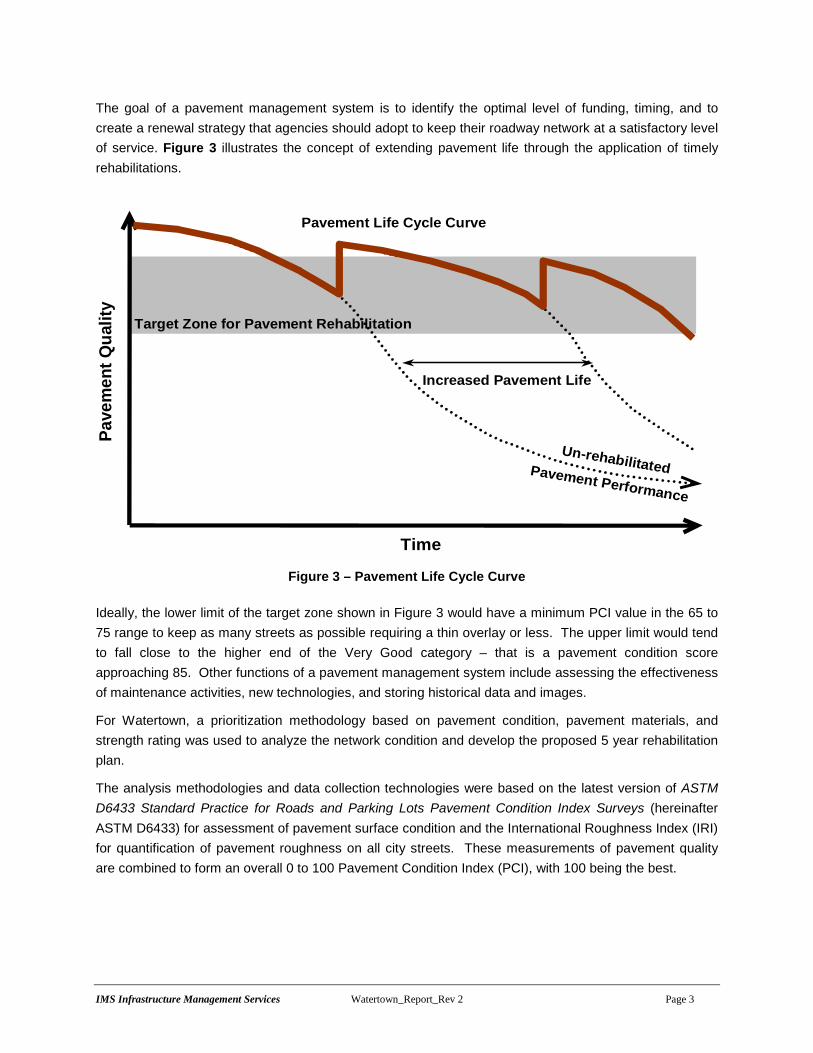
The goal of a pavement management system is to identify the optimal level of funding, timing, and to create a renewal strategy that agencies should adopt to keep their roadway network at a satisfactory level of service. Figure 3 illustrates the concept of extending pavement life through the application of timely rehabilitations.
Figure 3 – Pavement Life Cycle Curve
Ideally, the lower limit of the target zone shown in Figure 3 would have a minimum PCI value in the 65 to 75 range to keep as many streets as possible requiring a thin overlay or less. The upper limit would tend to fall close to the higher end of the Very Good category – that is a pavement condition score approaching 85. Other functions of a pavement management system include assessing the effectiveness of maintenance activities, new technologies, and storing historical data and images.
For Watertown, a prioritization methodology based on pavement condition, pavement materials, and strength rating was used to analyze the network condition and develop the proposed 5 year rehabilitation plan.
The analysis methodologies and data collection technologies were based on the latest version of ASTM D6433 Standard Practice for Roads and Parking Lots Pavement Condition Index Surveys (hereinafter ASTM D6433) for assessment of pavement surface condition and the International Roughness Index (IRI) for quantification of pavement roughness on all city streets. These measurements of pavement quality are combined to form an overall 0 to 100 Pavement Condition Index (PCI), with 100 being the best.
Time
Pave
men
t Qua
lity
Target Zone for Pavement Rehabilitation
Un-rehabilitatedPavement Performance
Pavement Life Cycle Curve
Increased Pavement Life
IMS Infrastructure Management Services Watertown_Report_Rev 2 Page 4
1.2 THE PAVEMENT MANAGEMENT PROCESS
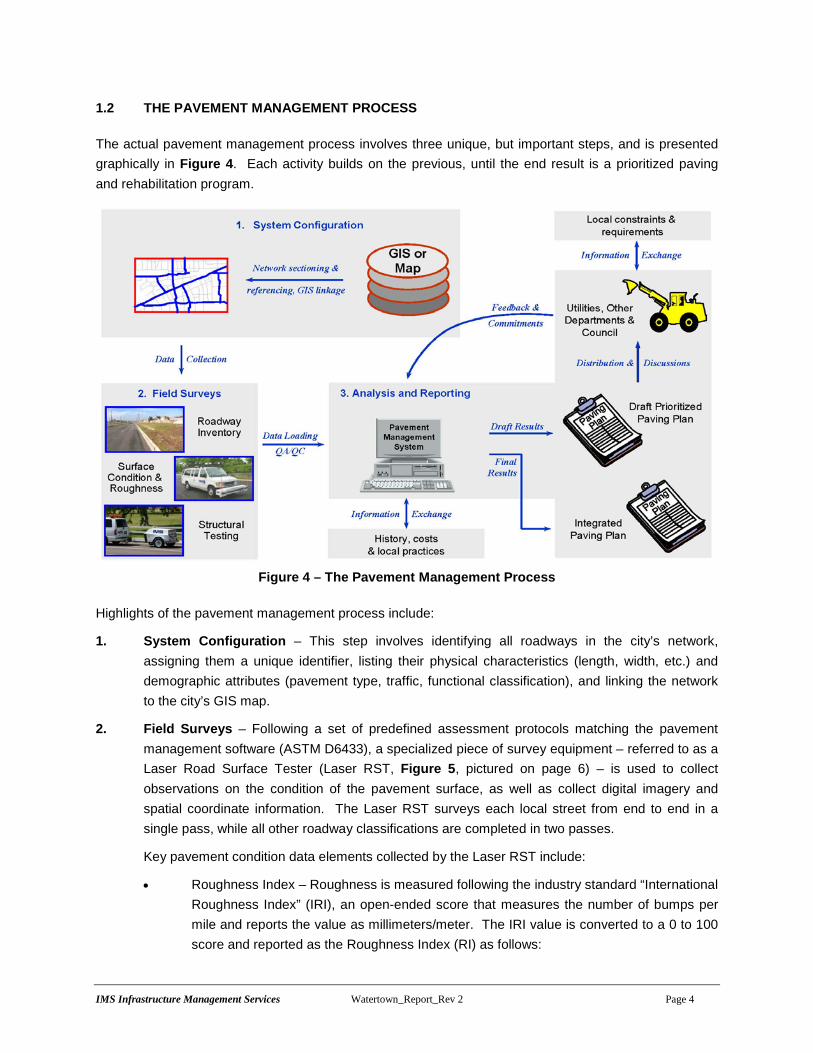
The actual pavement management process involves three unique, but important steps, and is presented graphically in Figure 4. Each activity builds on the previous, until the end result is a prioritized paving and rehabilitation program.
Figure 4 – The Pavement Management Process
Highlights of the pavement management process include:
1. System Configuration – This step involves identifying all roadways in the city’s network, assigning them a unique identifier, listing their physical characteristics (length, width, etc.) and demographic attributes (pavement type, traffic, functional classification), and linking the network to the city’s GIS map.
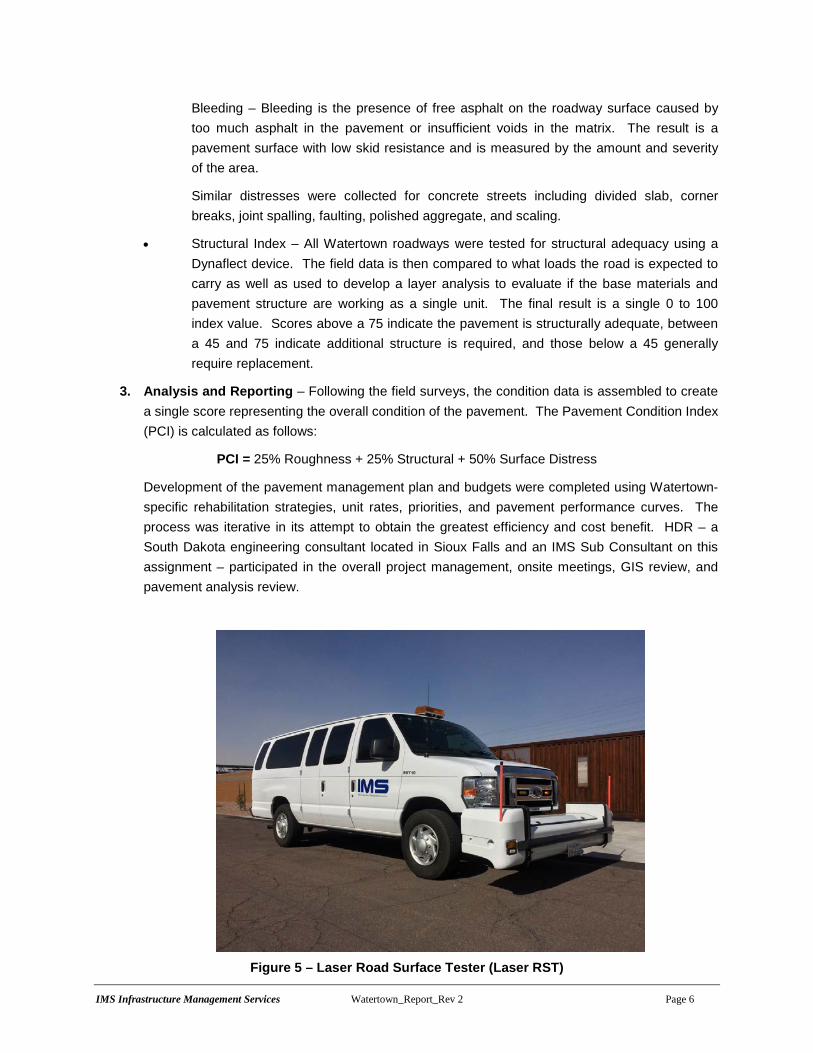
2. Field Surveys – Following a set of predefined assessment protocols matching the pavement management software (ASTM D6433), a specialized piece of survey equipment – referred to as a Laser Road Surface Tester (Laser RST, Figure 5, pictured on page 6) – is used to collect observations on the condition of the pavement surface, as well as collect digital imagery and spatial coordinate information. The Laser RST surveys each local street from end to end in a single pass, while all other roadway classifications are completed in two passes.
Key pavement condition data elements collected by the Laser RST include:
• Roughness Index – Roughness is measured following the industry standard “International Roughness Index” (IRI), an open-ended score that measures the number of bumps per mile and reports the value as millimeters/meter. The IRI value is converted to a 0 to 100 score and reported as the Roughness Index (RI) as follows:
IMS Infrastructure Management Services Watertown_Report_Rev 2 Page 5
RI = (12.5 – 3.5 x ln(IRI)) x 10
where ln(IRI) is the natural logarithm of IRI.
In common terms, a newer street would have a Roughness Index above 85, while one due for an overlay would be in the range 45 to 75. Failed streets typically have roughness values below 45.
• Surface Distress Index – The Laser RST collects surface distress observations based on the extent and severity of distresses encountered along the length of the roadway following ASTM D6433 protocols for asphalt and concrete pavements. The surface distress condition (cracking, potholes, raveling, and the like) is considered by the traveling public to be the most important aspect in assessing the overall pavement condition.
Presented on a 0 to 100 scale, the Surface Distress Index (SDI) is an aggregation of the observed pavement defects. Within the SDI, not all distresses are weighted equally. Certain load associated distresses (caused by traffic loading), such as rutting or alligator cracking on asphalt streets, or divided slab on concrete streets, have a much higher impact on the surface distress index than non-load associated distresses such as raveling or patching. Even at low extents and moderate severity – less than 10% of the total area – load associated distresses can drop the SDI considerably. ASTM D6433 also has algorithms within it to correct for multiple or overlapping distresses within a segment.
For this project, extent and severity observations were collected, processed, and loaded into the pavement management software. Within the software, the following distresses, listed in order from greatest to lowest impact, are presented as a 0 to 10 rating for review and reporting:
Alligator Cracking – Alligator cracking is quantified by the severity of the failure and number of square feet. Even at low extents, this can have a large impact on the condition score as this distress represents a failure of the underlying base materials.
Wheel Path Rutting – Starting at a minimum depth of ¼ inch, wheel path ruts are quantified by their depth and the number of square feet encountered. Like alligator cracking, low densities of rutting can have a large impact on the final condition score.
Longitudinal, Transverse, Block (Map), and Edge Cracks – These are quantified by their length and width. Longitudinal cracks that intertwine are the start of alligator cracking.
Patching – Patching is quantified by the extent and quality of patches. When the majority of a roadway surface is covered by a patch, such as a large utility replacement, the rating of the patch is minimized. All potholes are rated as patches.
Distortions – All uneven pavement surfaces such as depressions, bumps, sags, swells, heaves, and corrugations are included as distortions and are quantified by the severity and extent of the affected area.
Raveling – Raveling is the loss of fine aggregate materials on the pavement surface and is measured by the severity and number of square feet affected.
IMS Infrastructure Management Services Watertown_Report_Rev 2 Page 6
Bleeding – Bleeding is the presence of free asphalt on the roadway surface caused by too much asphalt in the pavement or insufficient voids in the matrix. The result is a pavement surface with low skid resistance and is measured by the amount and severity of the area.
Similar distresses were collected for concrete streets including divided slab, corner breaks, joint spalling, faulting, polished aggregate, and scaling.
• Structural Index – All Watertown roadways were tested for structural adequacy using a Dynaflect device. The field data is then compared to what loads the road is expected to carry as well as used to develop a layer analysis to evaluate if the base materials and pavement structure are working as a single unit. The final result is a single 0 to 100 index value. Scores above a 75 indicate the pavement is structurally adequate, between a 45 and 75 indicate additional structure is required, and those below a 45 generally require replacement.
3. Analysis and Reporting – Following the field surveys, the condition data is assembled to create a single score representing the overall condition of the pavement. The Pavement Condition Index (PCI) is calculated as follows:
PCI = 25% Roughness + 25% Structural + 50% Surface Distress
Development of the pavement management plan and budgets were completed using Watertown-specific rehabilitation strategies, unit rates, priorities, and pavement performance curves. The process was iterative in its attempt to obtain the greatest efficiency and cost benefit. HDR – a South Dakota engineering consultant located in Sioux Falls and an IMS Sub Consultant on this assignment – participated in the overall project management, onsite meetings, GIS review, and pavement analysis review.
Figure 5 – Laser Road Surface Tester (Laser RST)
IMS Infrastructure Management Services Watertown_Report_Rev 2 Page 7
1.3 FUNCTIONAL CLASS REVIEW
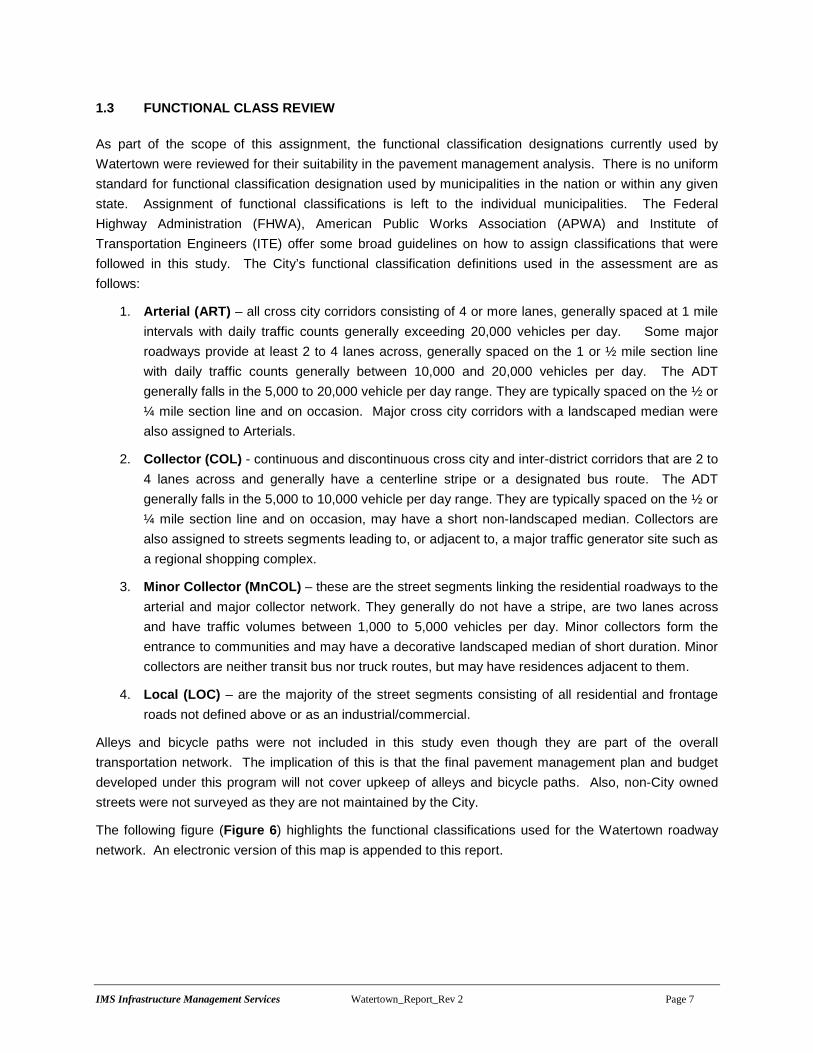
As part of the scope of this assignment, the functional classification designations currently used by Watertown were reviewed for their suitability in the pavement management analysis. There is no uniform standard for functional classification designation used by municipalities in the nation or within any given state. Assignment of functional classifications is left to the individual municipalities. The Federal Highway Administration (FHWA), American Public Works Association (APWA) and Institute of Transportation Engineers (ITE) offer some broad guidelines on how to assign classifications that were followed in this study. The City’s functional classification definitions used in the assessment are as follows:
1. Arterial (ART) – all cross city corridors consisting of 4 or more lanes, generally spaced at 1 mile intervals with daily traffic counts generally exceeding 20,000 vehicles per day. Some major roadways provide at least 2 to 4 lanes across, generally spaced on the 1 or ½ mile section line with daily traffic counts generally between 10,000 and 20,000 vehicles per day. The ADT generally falls in the 5,000 to 20,000 vehicle per day range. They are typically spaced on the ½ or ¼ mile section line and on occasion. Major cross city corridors with a landscaped median were also assigned to Arterials.
2. Collector (COL) - continuous and discontinuous cross city and inter-district corridors that are 2 to 4 lanes across and generally have a centerline stripe or a designated bus route. The ADT generally falls in the 5,000 to 10,000 vehicle per day range. They are typically spaced on the ½ or ¼ mile section line and on occasion, may have a short non-landscaped median. Collectors are also assigned to streets segments leading to, or adjacent to, a major traffic generator site such as a regional shopping complex.
3. Minor Collector (MnCOL) – these are the street segments linking the residential roadways to the arterial and major collector network. They generally do not have a stripe, are two lanes across and have traffic volumes between 1,000 to 5,000 vehicles per day. Minor collectors form the entrance to communities and may have a decorative landscaped median of short duration. Minor collectors are neither transit bus nor truck routes, but may have residences adjacent to them.
4. Local (LOC) – are the majority of the street segments consisting of all residential and frontage roads not defined above or as an industrial/commercial.
Alleys and bicycle paths were not included in this study even though they are part of the overall transportation network. The implication of this is that the final pavement management plan and budget developed under this program will not cover upkeep of alleys and bicycle paths. Also, non-City owned streets were not surveyed as they are not maintained by the City.
The following figure (Figure 6) highlights the functional classifications used for the Watertown roadway network. An electronic version of this map is appended to this report.
IMS Infrastructure Management Services Watertown_Report_Rev 2 Page 8
Figure 6 – Watertown Functional Classification Designation
IMS Infrastructure Management Services Watertown_Report_Rev 2 Page 9
1.4 ASSEMBLY OF DATA INTO PROJECTS
Watertown’s GIS was used as the basis for segmenting the roadway network on a block-by-block basis. Each segment was assigned a unique identifier referred to as a GISID, establishing a one-to-one relationship between the GIS and the street inventory. The segments form the basic building blocks of the pavement management system and are where all attribute and condition data are stored.
The centerline segments were aggregated together within the pavement management system to form logical projects that the analysis and rehabilitation program are developed against.
In general:
• Arterial projects run from major intersection to major intersection up to 1 mile in length.
• Similar to arterials, collector streets within a neighborhood were aggregated together to form a single project where practical.
• Local streets within a single neighborhood were aggregated together so long as their combined length was less than 1 mile.
Segments were joined only when the pavement condition and functional classification were homogeneous in nature such that when joined they have a relatively uniform condition that may be rehabilitated using a single strategy. Side Street rehabilitation approach was created by aggregating like segments to form a homogeneous project, typically ½ to 1 mile in length. All projects stay on a single street and do not cross a major roadway.
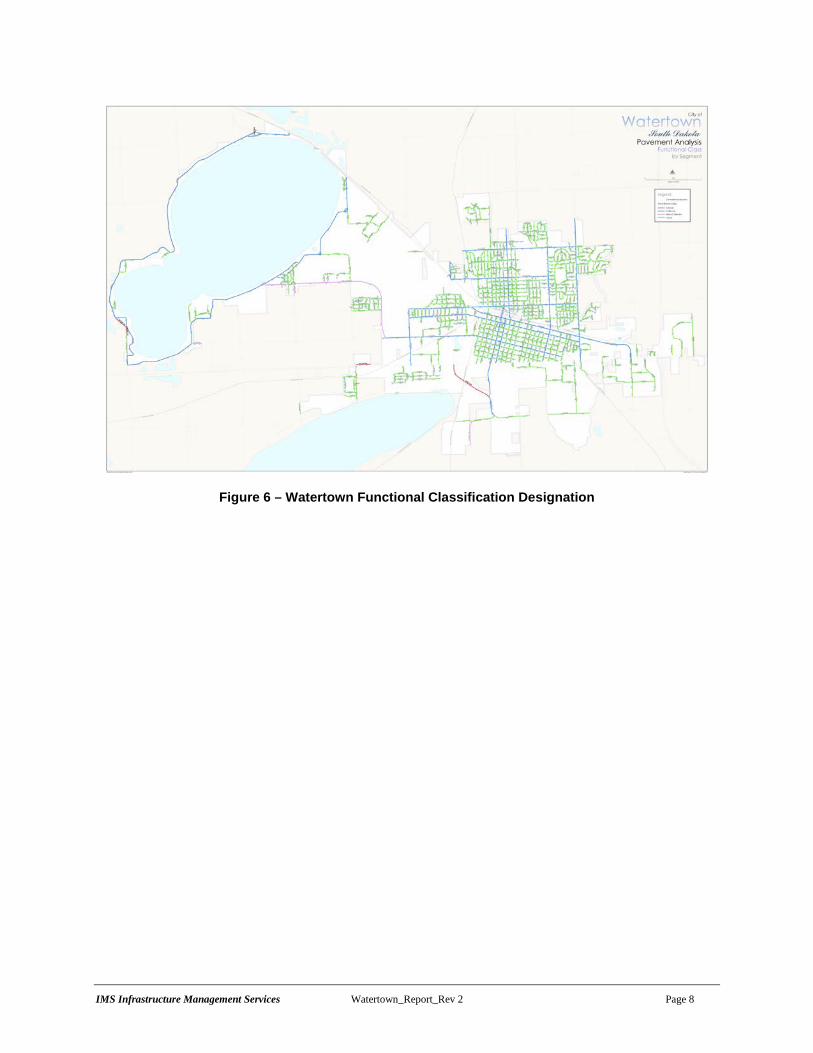
The following (Figure 7) highlights the projects used for the analysis. An electronic version of this map is appended to this report.
Figure 7 – Watertown Assembled Projects by Condition Rating
IMS Infrastructure Management Services Watertown_Report_Rev 2 Page 10
1.5 UNDERSTANDING THE PAVEMENT CONDIDTION INDEX SCORE
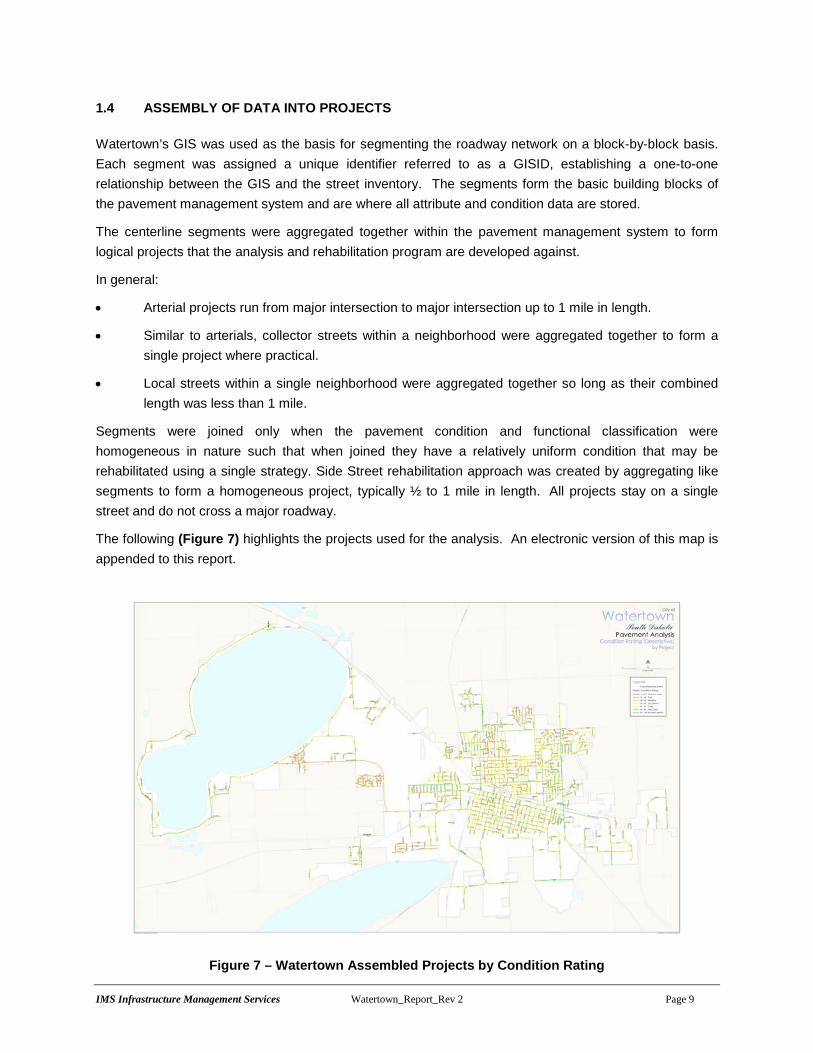
The following illustration, Figure 8, compares the Pavement Condition Index (PCI) to commonly used descriptive terms. The divisions between the terms are not fixed, but are meant to reflect common perceptions of condition.
Figure 8 – Understanding the Pavement Condition Index (PCI) Score
The general idea of what these condition levels mean with respect to remaining life and typical rehabilitation actions is included in the following table:
PCI Range
Description
Relative Remaining Life
Definition
85 – 100 Excellent 15 to 25 Years Like new condition – little to no maintenance required when new; routine maintenance such as crack and joint sealing.
70 – 85 Very Good 12 to 20 Years Routine maintenance such as patching and crack sealing with surface treatments such as seal coats or slurries.
60 – 70 Good 10 to 15 Years Heavier surface treatments and thin overlays. Localized panel replacements.
40 – 60 Fair to Marginal 7 to 12 Years Heavy surface-based inlays or overlays with localized repairs. Moderate to extensive panel replacements.
25 – 40 Poor 5 to 10 Years Sections will require very thick overlays, surface replacement, base reconstruction, and possible subgrade stabilization.
0 – 25 Very Poor 0 to 5 Years High percentage of full reconstruction.
IMS Infrastructure Management Services Watertown_Report_Rev 2 Page 11
The images presented below provide a sampling of the Watertown streets that fall into the various condition categories with a discussion of potential rehabilitation strategies.
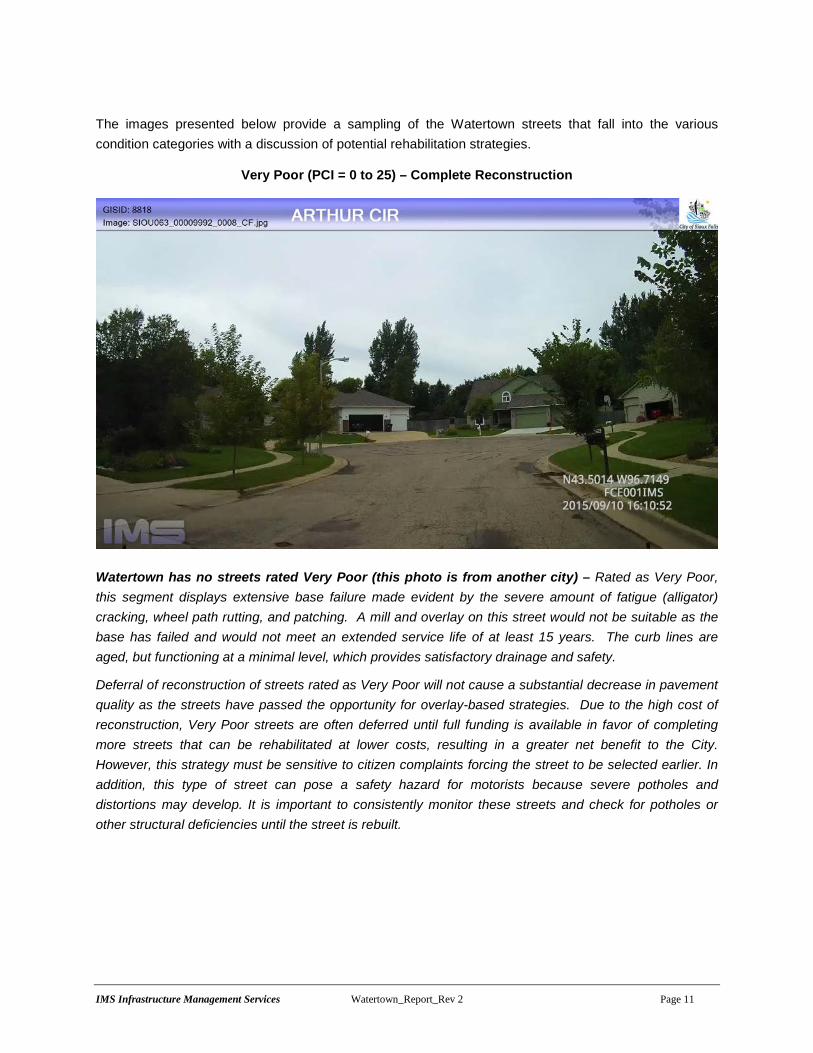
Very Poor (PCI = 0 to 25) – Complete Reconstruction
Watertown has no streets rated Very Poor (this photo is from another city) – Rated as Very Poor, this segment displays extensive base failure made evident by the severe amount of fatigue (alligator) cracking, wheel path rutting, and patching. A mill and overlay on this street would not be suitable as the base has failed and would not meet an extended service life of at least 15 years. The curb lines are aged, but functioning at a minimal level, which provides satisfactory drainage and safety.
Deferral of reconstruction of streets rated as Very Poor will not cause a substantial decrease in pavement quality as the streets have passed the opportunity for overlay-based strategies. Due to the high cost of reconstruction, Very Poor streets are often deferred until full funding is available in favor of completing more streets that can be rehabilitated at lower costs, resulting in a greater net benefit to the City. However, this strategy must be sensitive to citizen complaints forcing the street to be selected earlier. In addition, this type of street can pose a safety hazard for motorists because severe potholes and distortions may develop. It is important to consistently monitor these streets and check for potholes or other structural deficiencies until the street is rebuilt.
IMS Infrastructure Management Services Watertown_Report_Rev 2 Page 12
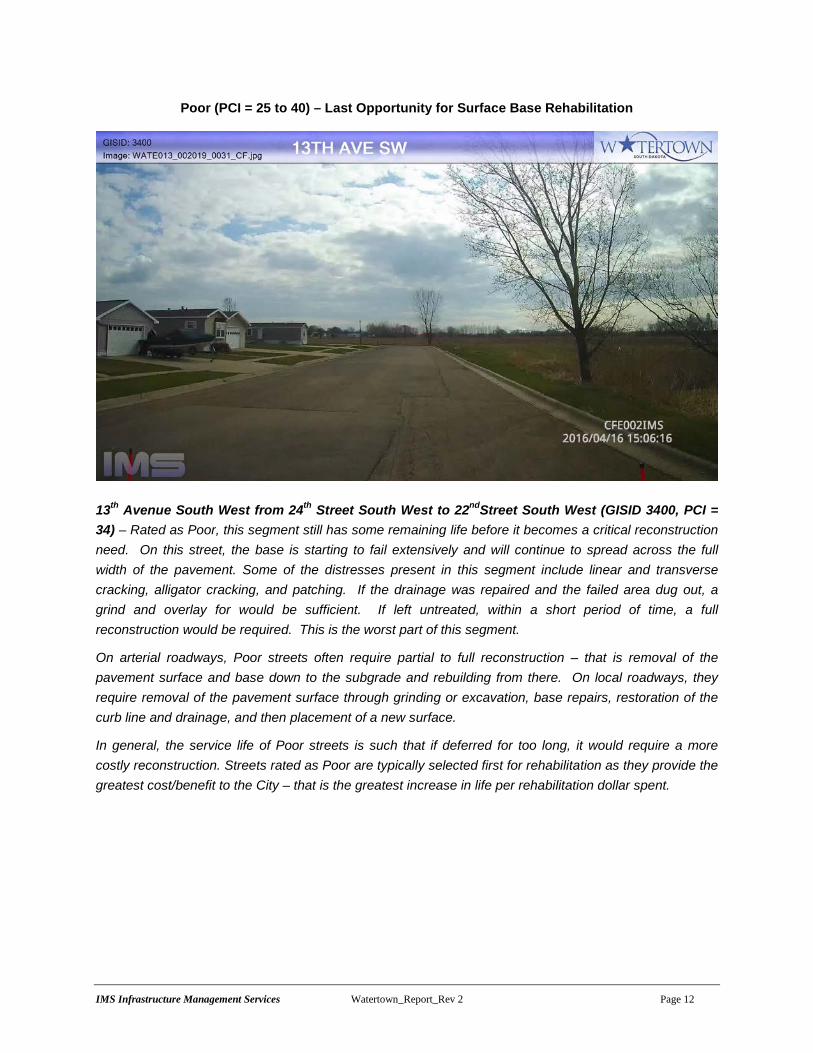
Poor (PCI = 25 to 40) – Last Opportunity for Surface Base Rehabilitation
13th Avenue South West from 24th Street South West to 22ndStreet South West (GISID 3400, PCI = 34) – Rated as Poor, this segment still has some remaining life before it becomes a critical reconstruction need. On this street, the base is starting to fail extensively and will continue to spread across the full width of the pavement. Some of the distresses present in this segment include linear and transverse cracking, alligator cracking, and patching. If the drainage was repaired and the failed area dug out, a grind and overlay for would be sufficient. If left untreated, within a short period of time, a full reconstruction would be required. This is the worst part of this segment.
On arterial roadways, Poor streets often require partial to full reconstruction – that is removal of the pavement surface and base down to the subgrade and rebuilding from there. On local roadways, they require removal of the pavement surface through grinding or excavation, base repairs, restoration of the curb line and drainage, and then placement of a new surface.
In general, the service life of Poor streets is such that if deferred for too long, it would require a more costly reconstruction. Streets rated as Poor are typically selected first for rehabilitation as they provide the greatest cost/benefit to the City – that is the greatest increase in life per rehabilitation dollar spent.
IMS Infrastructure Management Services Watertown_Report_Rev 2 Page 13
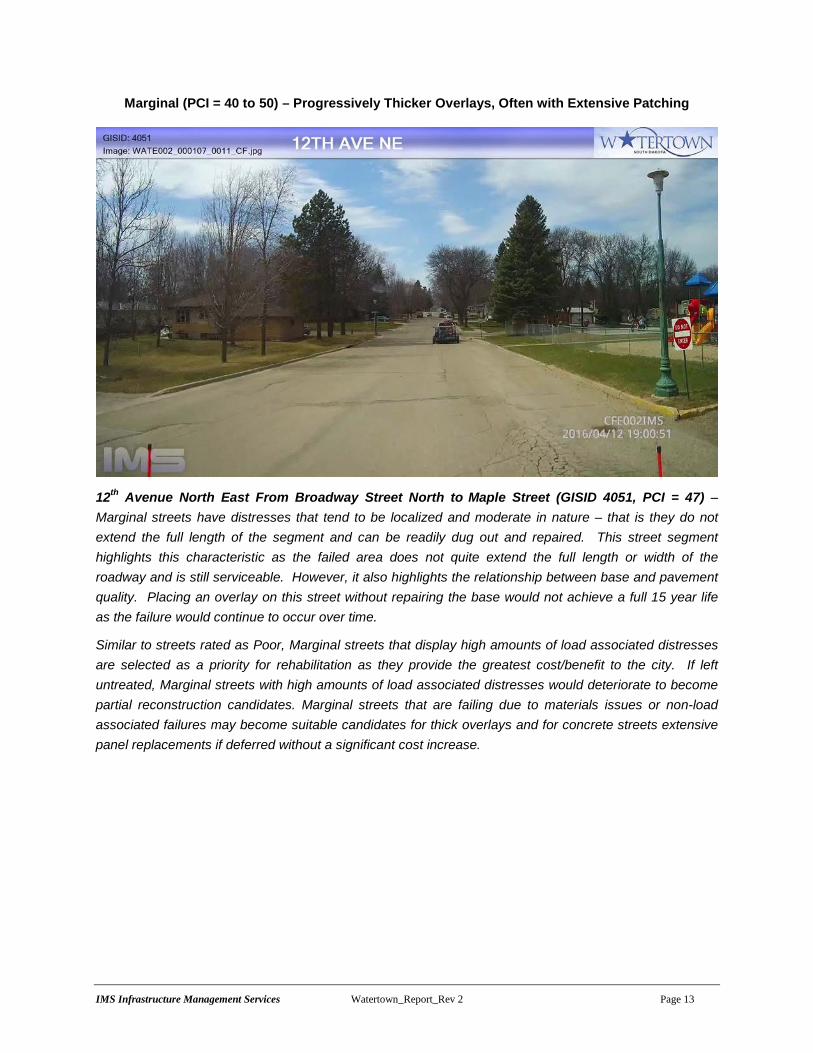
Marginal (PCI = 40 to 50) – Progressively Thicker Overlays, Often with Extensive Patching
12th Avenue North East From Broadway Street North to Maple Street (GISID 4051, PCI = 47) – Marginal streets have distresses that tend to be localized and moderate in nature – that is they do not extend the full length of the segment and can be readily dug out and repaired. This street segment highlights this characteristic as the failed area does not quite extend the full length or width of the roadway and is still serviceable. However, it also highlights the relationship between base and pavement quality. Placing an overlay on this street without repairing the base would not achieve a full 15 year life as the failure would continue to occur over time.
Similar to streets rated as Poor, Marginal streets that display high amounts of load associated distresses are selected as a priority for rehabilitation as they provide the greatest cost/benefit to the city. If left untreated, Marginal streets with high amounts of load associated distresses would deteriorate to become partial reconstruction candidates. Marginal streets that are failing due to materials issues or non-load associated failures may become suitable candidates for thick overlays and for concrete streets extensive panel replacements if deferred without a significant cost increase.
IMS Infrastructure Management Services Watertown_Report_Rev 2 Page 14
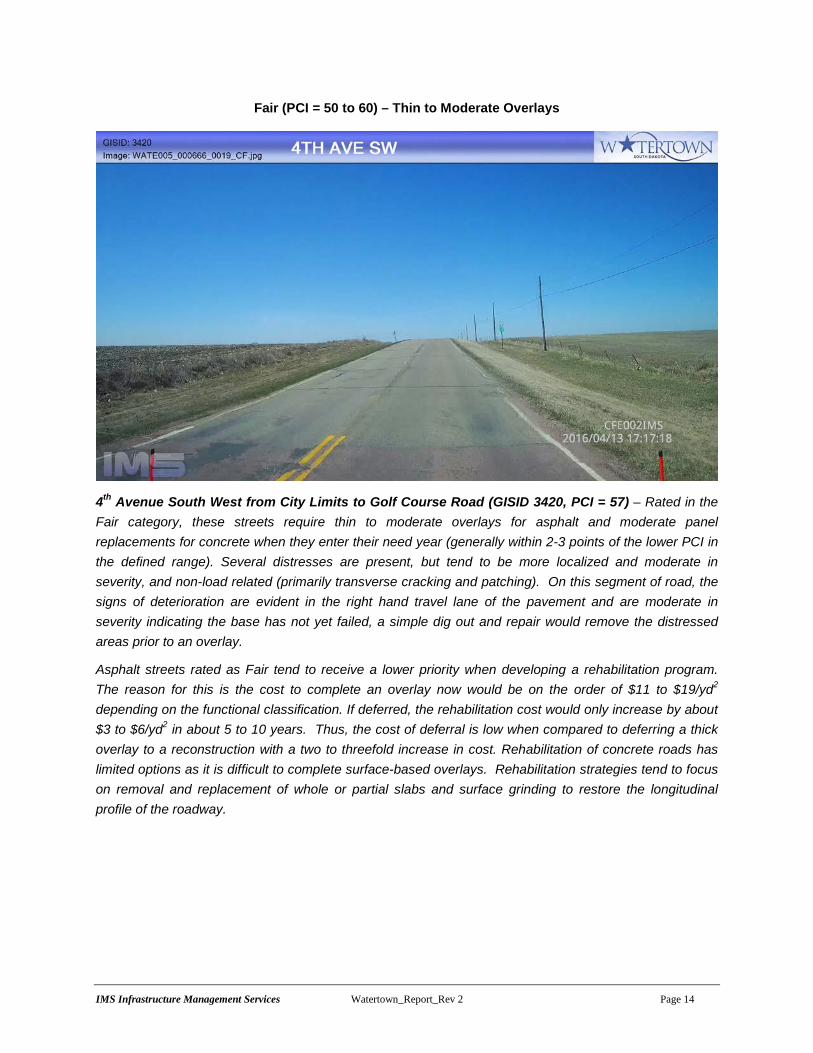
Fair (PCI = 50 to 60) – Thin to Moderate Overlays
4th Avenue South West from City Limits to Golf Course Road (GISID 3420, PCI = 57) – Rated in the Fair category, these streets require thin to moderate overlays for asphalt and moderate panel replacements for concrete when they enter their need year (generally within 2-3 points of the lower PCI in the defined range). Several distresses are present, but tend to be more localized and moderate in severity, and non-load related (primarily transverse cracking and patching). On this segment of road, the signs of deterioration are evident in the right hand travel lane of the pavement and are moderate in severity indicating the base has not yet failed, a simple dig out and repair would remove the distressed areas prior to an overlay.
Asphalt streets rated as Fair tend to receive a lower priority when developing a rehabilitation program. The reason for this is the cost to complete an overlay now would be on the order of $11 to $19/yd2 depending on the functional classification. If deferred, the rehabilitation cost would only increase by about $3 to $6/yd2 in about 5 to 10 years. Thus, the cost of deferral is low when compared to deferring a thick overlay to a reconstruction with a two to threefold increase in cost. Rehabilitation of concrete roads has limited options as it is difficult to complete surface-based overlays. Rehabilitation strategies tend to focus on removal and replacement of whole or partial slabs and surface grinding to restore the longitudinal profile of the roadway.
IMS Infrastructure Management Services Watertown_Report_Rev 2 Page 15
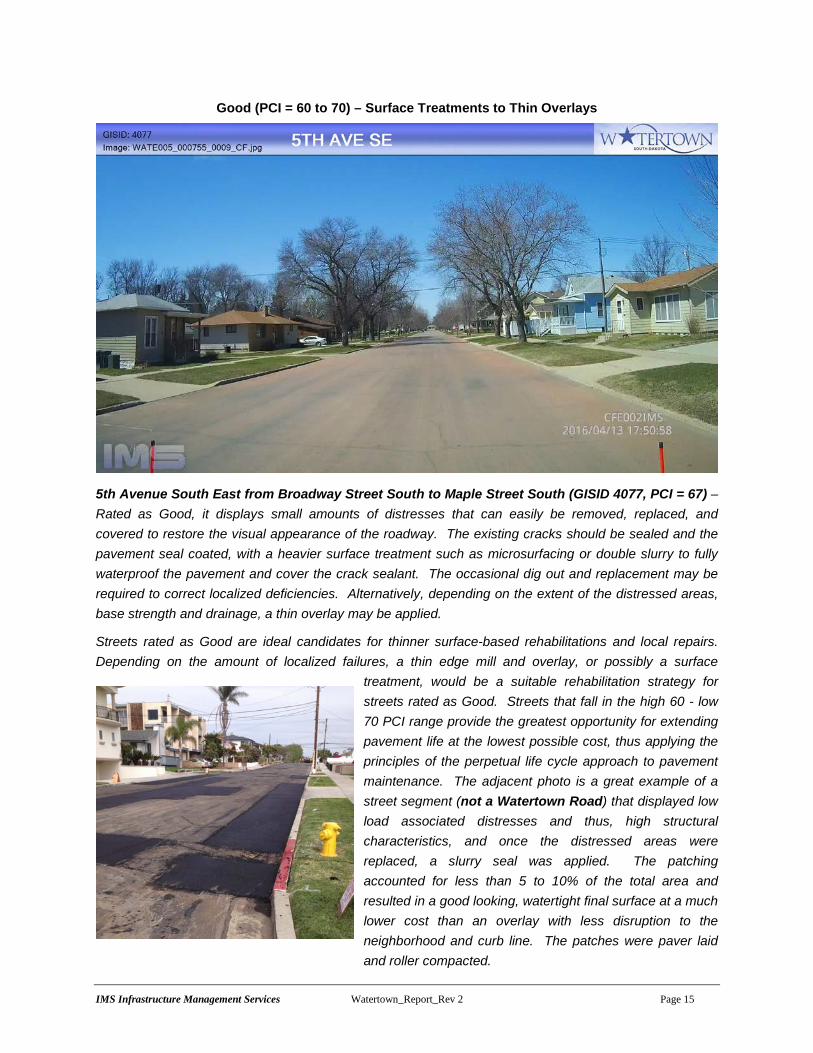
Good (PCI = 60 to 70) – Surface Treatments to Thin Overlays
5th Avenue South East from Broadway Street South to Maple Street South (GISID 4077, PCI = 67) – Rated as Good, it displays small amounts of distresses that can easily be removed, replaced, and covered to restore the visual appearance of the roadway. The existing cracks should be sealed and the pavement seal coated, with a heavier surface treatment such as microsurfacing or double slurry to fully waterproof the pavement and cover the crack sealant. The occasional dig out and replacement may be required to correct localized deficiencies. Alternatively, depending on the extent of the distressed areas, base strength and drainage, a thin overlay may be applied.
Streets rated as Good are ideal candidates for thinner surface-based rehabilitations and local repairs. Depending on the amount of localized failures, a thin edge mill and overlay, or possibly a surface
treatment, would be a suitable rehabilitation strategy for streets rated as Good. Streets that fall in the high 60 - low 70 PCI range provide the greatest opportunity for extending pavement life at the lowest possible cost, thus applying the principles of the perpetual life cycle approach to pavement maintenance. The adjacent photo is a great example of a street segment (not a Watertown Road) that displayed low load associated distresses and thus, high structural characteristics, and once the distressed areas were replaced, a slurry seal was applied. The patching accounted for less than 5 to 10% of the total area and resulted in a good looking, watertight final surface at a much lower cost than an overlay with less disruption to the neighborhood and curb line. The patches were paver laid and roller compacted.
IMS Infrastructure Management Services Watertown_Report_Rev 2 Page 16
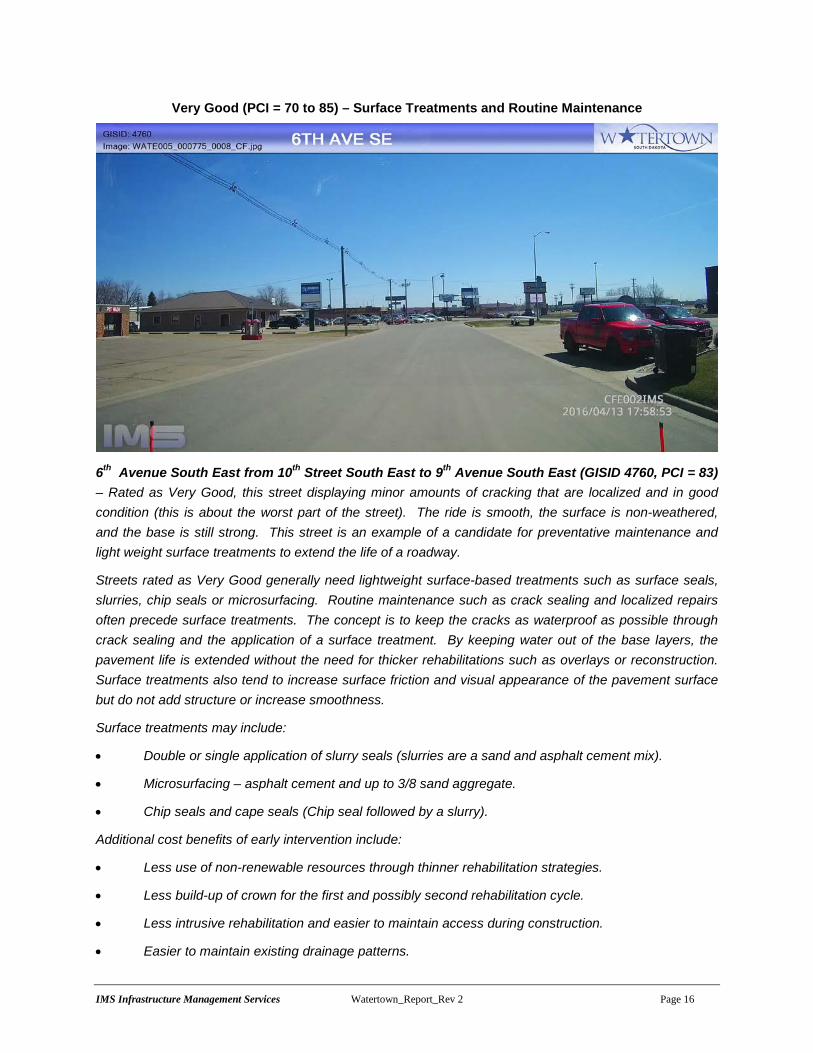
Very Good (PCI = 70 to 85) – Surface Treatments and Routine Maintenance
6th Avenue South East from 10th Street South East to 9th Avenue South East (GISID 4760, PCI = 83) – Rated as Very Good, this street displaying minor amounts of cracking that are localized and in good condition (this is about the worst part of the street). The ride is smooth, the surface is non-weathered, and the base is still strong. This street is an example of a candidate for preventative maintenance and light weight surface treatments to extend the life of a roadway.
Streets rated as Very Good generally need lightweight surface-based treatments such as surface seals, slurries, chip seals or microsurfacing. Routine maintenance such as crack sealing and localized repairs often precede surface treatments. The concept is to keep the cracks as waterproof as possible through crack sealing and the application of a surface treatment. By keeping water out of the base layers, the pavement life is extended without the need for thicker rehabilitations such as overlays or reconstruction. Surface treatments also tend to increase surface friction and visual appearance of the pavement surface but do not add structure or increase smoothness.
Surface treatments may include:
• Double or single application of slurry seals (slurries are a sand and asphalt cement mix).
• Microsurfacing – asphalt cement and up to 3/8 sand aggregate.
• Chip seals and cape seals (Chip seal followed by a slurry).
Additional cost benefits of early intervention include:
• Less use of non-renewable resources through thinner rehabilitation strategies.
• Less build-up of crown for the first and possibly second rehabilitation cycle.
• Less intrusive rehabilitation and easier to maintain access during construction.
• Easier to maintain existing drainage patterns.
IMS Infrastructure Management Services Watertown_Report_Rev 2 Page 17
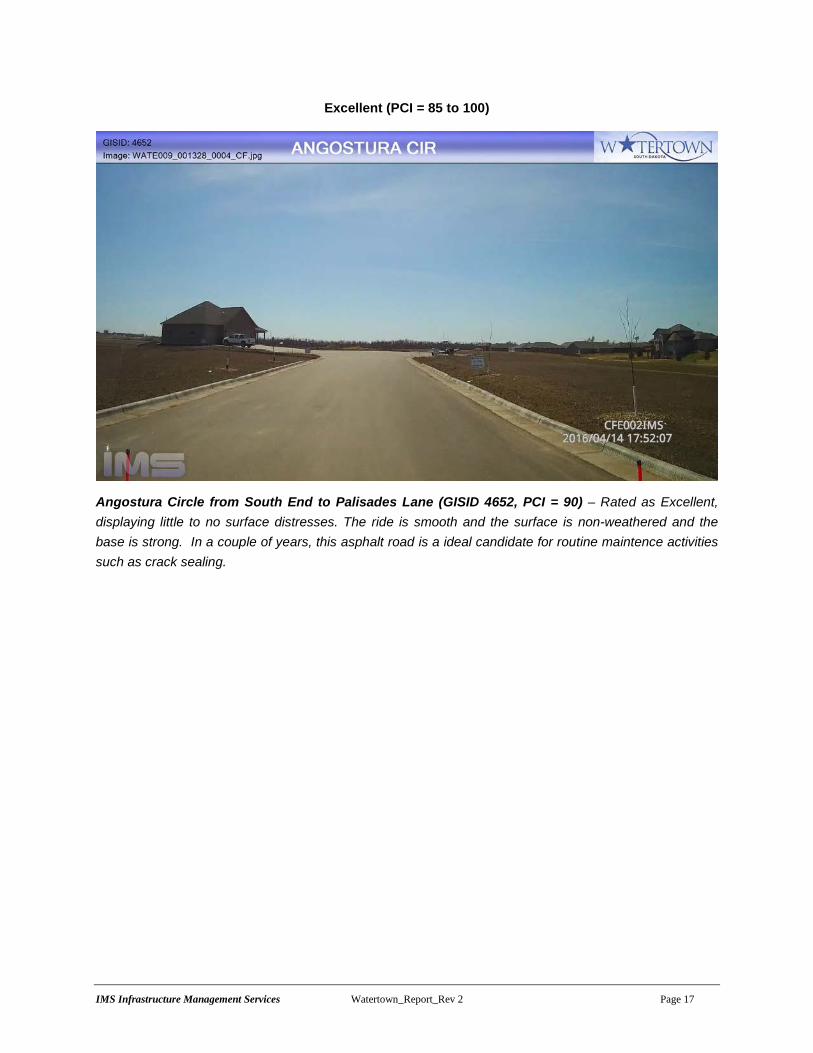
Excellent (PCI = 85 to 100)
Angostura Circle from South End to Palisades Lane (GISID 4652, PCI = 90) – Rated as Excellent, displaying little to no surface distresses. The ride is smooth and the surface is non-weathered and the base is strong. In a couple of years, this asphalt road is a ideal candidate for routine maintence activities such as crack sealing.
IMS Infrastructure Management Services Watertown_Report_Rev 2 Page 18
2.0 ROADWAY NETWORK CONDITION AND FINDINGS
2.1 ROADWAY NETWORK SIZE
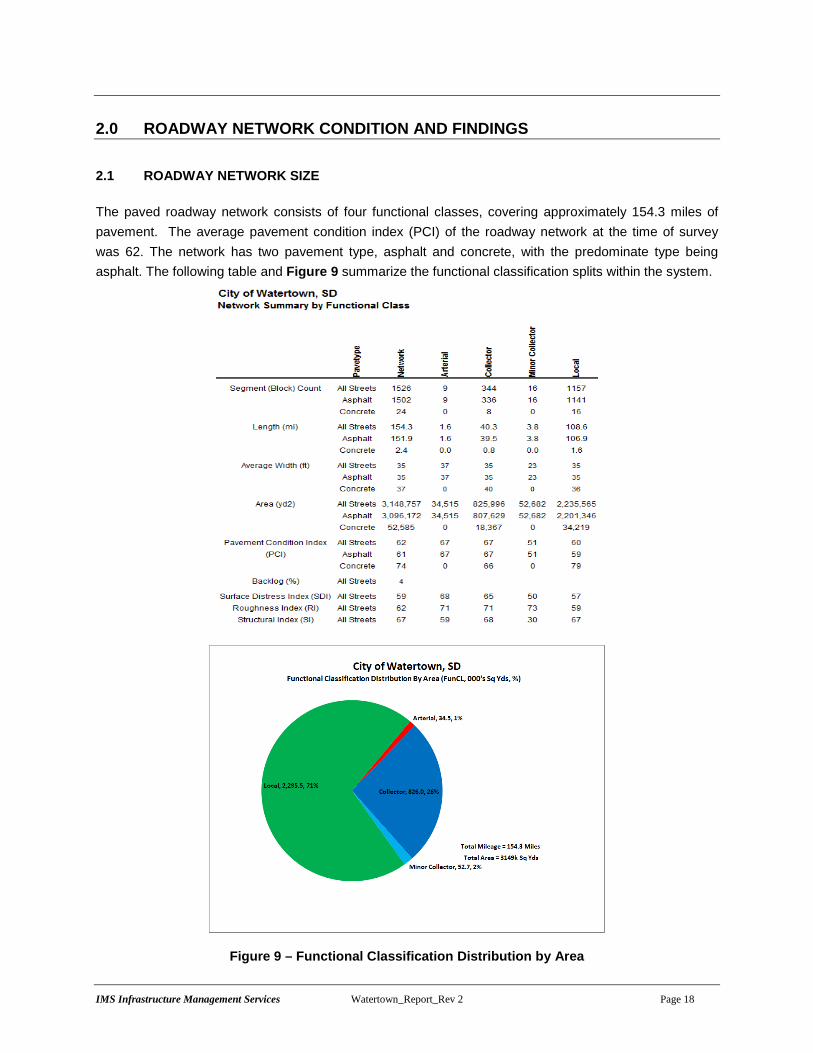
The paved roadway network consists of four functional classes, covering approximately 154.3 miles of pavement. The average pavement condition index (PCI) of the roadway network at the time of survey was 62. The network has two pavement type, asphalt and concrete, with the predominate type being asphalt. The following table and Figure 9 summarize the functional classification splits within the system.
Figure 9 – Functional Classification Distribution by Area
IMS Infrastructure Management Services Watertown_Report_Rev 2 Page 19
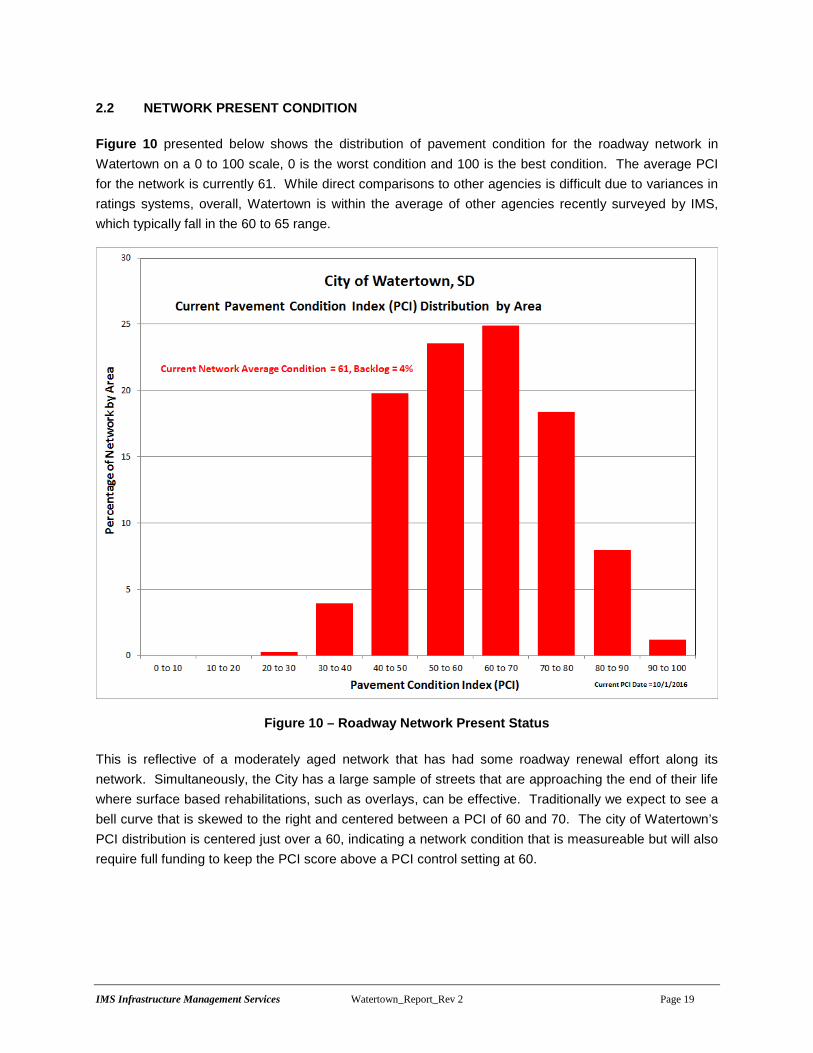
2.2 NETWORK PRESENT CONDITION
Figure 10 presented below shows the distribution of pavement condition for the roadway network in Watertown on a 0 to 100 scale, 0 is the worst condition and 100 is the best condition. The average PCI for the network is currently 61. While direct comparisons to other agencies is difficult due to variances in ratings systems, overall, Watertown is within the average of other agencies recently surveyed by IMS, which typically fall in the 60 to 65 range.
Figure 10 – Roadway Network Present Status
This is reflective of a moderately aged network that has had some roadway renewal effort along its network. Simultaneously, the City has a large sample of streets that are approaching the end of their life where surface based rehabilitations, such as overlays, can be effective. Traditionally we expect to see a bell curve that is skewed to the right and centered between a PCI of 60 and 70. The city of Watertown’s PCI distribution is centered just over a 60, indicating a network condition that is measureable but will also require full funding to keep the PCI score above a PCI control setting at 60.
IMS Infrastructure Management Services Watertown_Report_Rev 2 Page 20
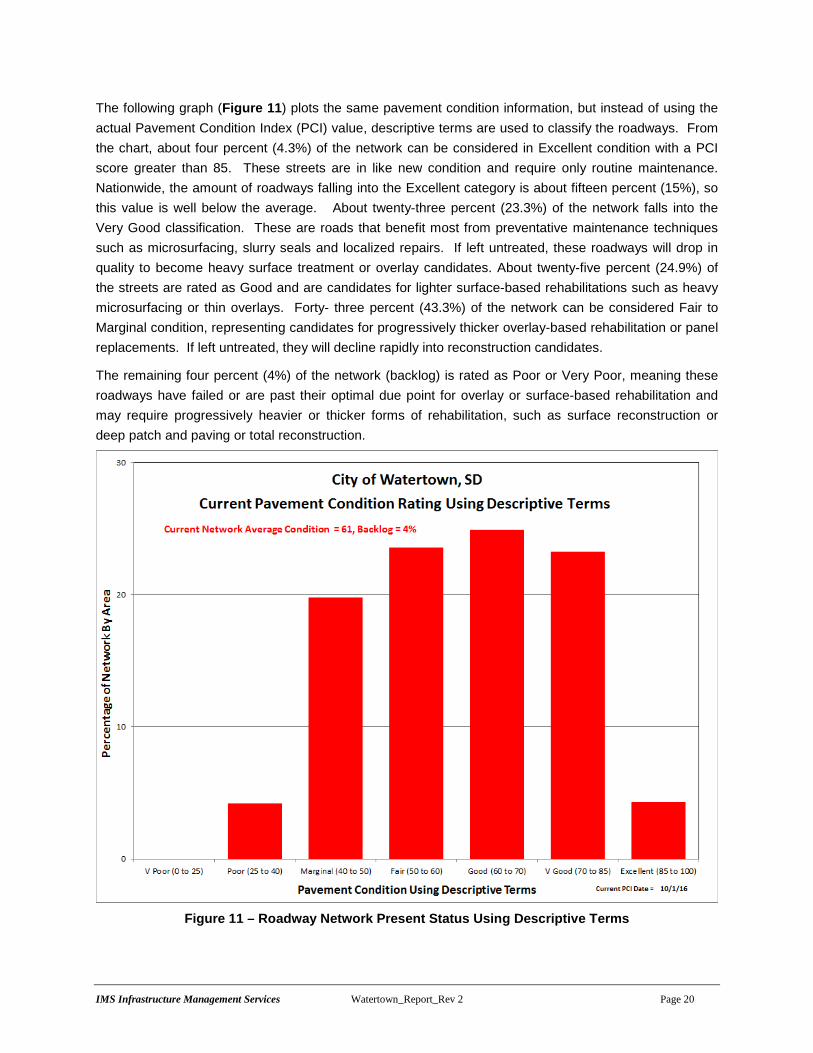
The following graph (Figure 11) plots the same pavement condition information, but instead of using the actual Pavement Condition Index (PCI) value, descriptive terms are used to classify the roadways. From the chart, about four percent (4.3%) of the network can be considered in Excellent condition with a PCI score greater than 85. These streets are in like new condition and require only routine maintenance. Nationwide, the amount of roadways falling into the Excellent category is about fifteen percent (15%), so this value is well below the average. About twenty-three percent (23.3%) of the network falls into the Very Good classification. These are roads that benefit most from preventative maintenance techniques such as microsurfacing, slurry seals and localized repairs. If left untreated, these roadways will drop in quality to become heavy surface treatment or overlay candidates. About twenty-five percent (24.9%) of the streets are rated as Good and are candidates for lighter surface-based rehabilitations such as heavy microsurfacing or thin overlays. Forty- three percent (43.3%) of the network can be considered Fair to Marginal condition, representing candidates for progressively thicker overlay-based rehabilitation or panel replacements. If left untreated, they will decline rapidly into reconstruction candidates.
The remaining four percent (4%) of the network (backlog) is rated as Poor or Very Poor, meaning these roadways have failed or are past their optimal due point for overlay or surface-based rehabilitation and may require progressively heavier or thicker forms of rehabilitation, such as surface reconstruction or deep patch and paving or total reconstruction.
Figure 11 – Roadway Network Present Status Using Descriptive Terms
IMS Infrastructure Management Services Watertown_Report_Rev 2 Page 21
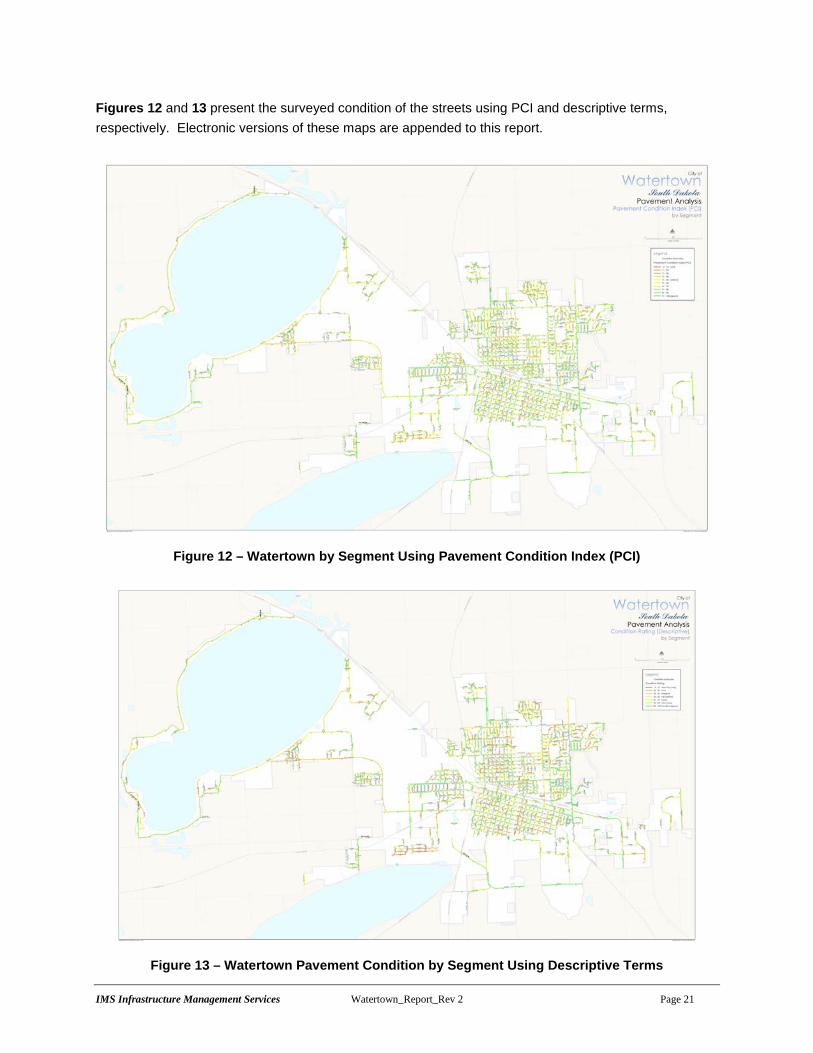
Figures 12 and 13 present the surveyed condition of the streets using PCI and descriptive terms, respectively. Electronic versions of these maps are appended to this report.
Figure 12 – Watertown by Segment Using Pavement Condition Index (PCI)
Figure 13 – Watertown Pavement Condition by Segment Using Descriptive Terms

IMS Infrastructure Management Services Watertown_Report_Rev 2 Page 22
The role of the street network as a factor in the City’s well-being cannot be overstated. In simplest of terms, roadways form the economic backbone of a community. They provide the means for goods to be exchanged, commerce to flourish, and commercial enterprises to generate revenue. As such, they are an investment to be maintained.
The overall condition of an agency’s infrastructure and transportation network is a key indicator of economic prosperity. Roadway networks in general are one of the most important and dynamic sectors in the global economy, having a strong influence on not only the economic well-being of a community, but a strong impact on quality of life. Well-maintained road networks experience multiple socioeconomic benefits through greater labor market opportunities and decreasing income gap. As a crucial link between producers and their markets, quality road networks ensure straightforward access to goods and drive global and local economies. Likewise, higher network quality has a strong correlation to improvements in household consumption and income. Roads also act as a key element to social cohesion by acting as a median for integration of bordering regions (Gertler). This social integration promotes a decreased gap in income along with diversity and a greater sense of community that can play a large role in decreasing rates of poverty (Amparo).
Conversely, deterioration of roads can have adverse effects on a community and may bring about important and unanticipated welfare effects that governments should be aware of when cutting transportation budgets (Gertler). Poor road conditions increase fuel and tire consumption while shortening intervals between vehicle repair and maintenance. In turn, these roads result in delayed or more expensive deliveries for businesses and consumers (Economic Dependence on Good Roads). Economic effects of poor road networks, such as time consuming and costly rehabilitation, can be reduced if a proactive maintenance approach is successfully implemented.
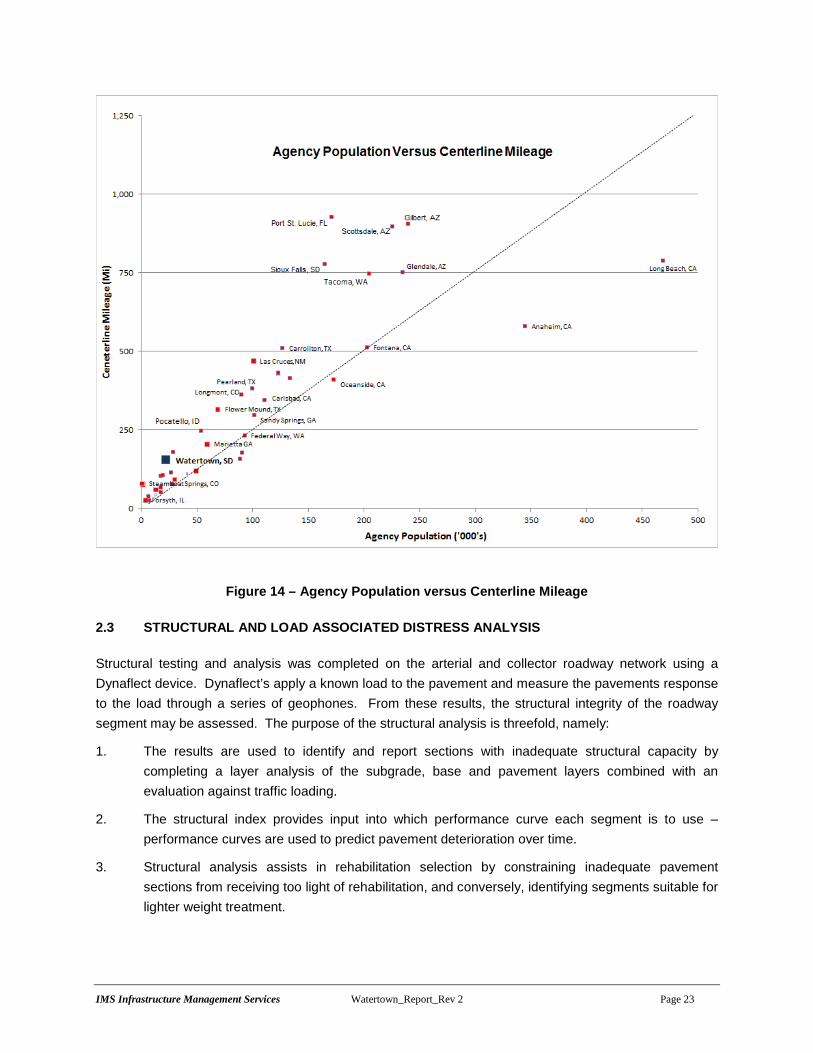
Watertown has a centerline mileage to population ratio that is above the average trend of agencies recently surveyed by IMS. When the centerline mileage is out of proportion to the population, an increased burden is placed on rate payers to maintain the network. The following plot (Figure 14) presents a comparison of population versus centerline mileage of several recent surveys. As can be seen, Watertown falls above the trend line for centerline mileage.
One other aspect of the City’s network that should be noted is the average width of the pavements. While the center line length to population ratio is slightly higher than the expected norms, the average width falls in with the average range of other agencies recently surveyed by IMS at 35 ft. Typical average widths fall in the 34 to 37 foot range, so Watertown is within the average range. While not directly related to pavement condition, a higher average road width does contribute to higher than average rehabilitation costs associated with the square yardage of the pavements.
Approximately 50% of the Watertown road network falls under the Good to Very Good categories, while the amount of Very Poor to Poor streets is minimal. The primary concern for the long term health of Watertown’s roadway network from a pavement management perspective is to improve the current network profile in two key areas – that is reduce the amount of streets rated at marginal or below, while simultaneously preventing any further slide in PCI. The City must be continually working on preserving streets with high condition scores in order to prevent them from dropping into heavier rehabilitation categories and at the same time be judicious in selecting specific streets for rehabilitation before they become total reconstructs.
IMS Infrastructure Management Services Watertown_Report_Rev 2 Page 23
Figure 14 – Agency Population versus Centerline Mileage
2.3 STRUCTURAL AND LOAD ASSOCIATED DISTRESS ANALYSIS
Structural testing and analysis was completed on the arterial and collector roadway network using a Dynaflect device. Dynaflect’s apply a known load to the pavement and measure the pavements response to the load through a series of geophones. From these results, the structural integrity of the roadway segment may be assessed. The purpose of the structural analysis is threefold, namely:
1. The results are used to identify and report sections with inadequate structural capacity by completing a layer analysis of the subgrade, base and pavement layers combined with an evaluation against traffic loading.
2. The structural index provides input into which performance curve each segment is to use – performance curves are used to predict pavement deterioration over time.
3. Structural analysis assists in rehabilitation selection by constraining inadequate pavement sections from receiving too light of rehabilitation, and conversely, identifying segments suitable for lighter weight treatment.

IMS Infrastructure Management Services Watertown_Report_Rev 2 Page 24
Figure 15 presents the structural adequacy of the roadway network against its average pavement condition, with each marker representing one segment of roadway. The diagonal black line in the plot provides an indication of roadway segments that are performing above structural expectations and those that do not provide full structural benefits over the life of the pavement. The structural score factors into the overall condition index and, it also aids in the selection of appropriate rehabilitation strategies by restricting the ability to apply too thin of an overlay on a weak pavement section.
Figure 15 – Structural Adequacy of the Roadway Network
The horizontal green dashed lines highlight the Structural Index ranges used as selection criteria during the budget analysis. The structural adequacy of a road is expressed as a 0 to 100 score with several key ranges: roadways with a Structural Index greater than 75 are deemed to be structurally adequate for the loading and may be treated with lightweight surface treatments or thin overlays; those between 45 and 75 typically reflect roads that require additional pavement thickness; and scores below 45 typically require reconstruction and/or increased base and pavement thickness. It should be noted that two segments can have similar PCI values yet have differing subgrade ratings based on their testing results. Once they enter the rehabilitation planning, the Structural Index value would also ensure a thicker overlay or additional localized repairs are applied to the street segment with the lower SI score.
IMS Infrastructure Management Services Watertown_Report_Rev 2 Page 25
The primary areas of concern are the street segments that have a high pavement condition score (greater than 75), yet exhibit low structural characteristics (weak to moderate pavement strengths). When an overlay is to be applied, project level testing and design should be completed to ensure their structural integrity is restored. The second area of concern is the shortened pavement life due to low structural capacity – these are segments with a lower Structural Index score than PCI score. The cause of this issue can generally be traced back to three primary sources:
• Incorporation of streets into the network that were never designed to carry heavy loads resulting in premature failure. This is common in rapidly expanding agencies that annex county roads.
• Too thin of structural cross section on overlays – this is often caused by the use of standard designs that simply result in inadequate structural capacities. A firm understanding of subgrade and base conditions combined with a qualified structural design typically results in a thicker cross section being specified, but increases the pavement life considerably.
• Increase traffic loading beyond initial design limits, combined with ever-increasing truck weights and tire pressures. Heavier garbage and recycling trucks, along with increased transit bus size can dramatically alter pavement quality in a very short period of time.
While structural testing was performed on all Watertown roadways, we also analyze the types of distresses that have caused the PCI score to drop. Surface distresses may be categorized into two classifications – load associated distresses (LAD) and non-load associated distresses (NLAD). Load associated distresses are those that are directly related to traffic loading and structural capacity such alligator cracking and rutting. Non-load associated distresses are those that result from materials or environmental issues including shrinkage (transverse) cracking, bleeding and raveling. Generally, load associated distresses affect the overall condition score more than non-load associated distresses – as is the case in Watertown. For asphalt streets, roadways were classified as Weak, Moderate, or Strong based upon the structural condition assessment.
Weak pavements are those with a high ratio of load associated distresses compared to their PCI score and generally require increased pavement thickness to achieve long-term pavement life. Strong pavements are those that have a low LADD to PCI ratio and have suitable structural capacity to accept lightweight surface treatments with minimal preparation. Moderate pavements are those that require localized rehabilitation and/or increased thickness to achieve full pavement life. These are pavements that are starting to display structural and base failures such as rutting or alligator cracking.
IMS Infrastructure Management Services Watertown_Report_Rev 2 Page 26
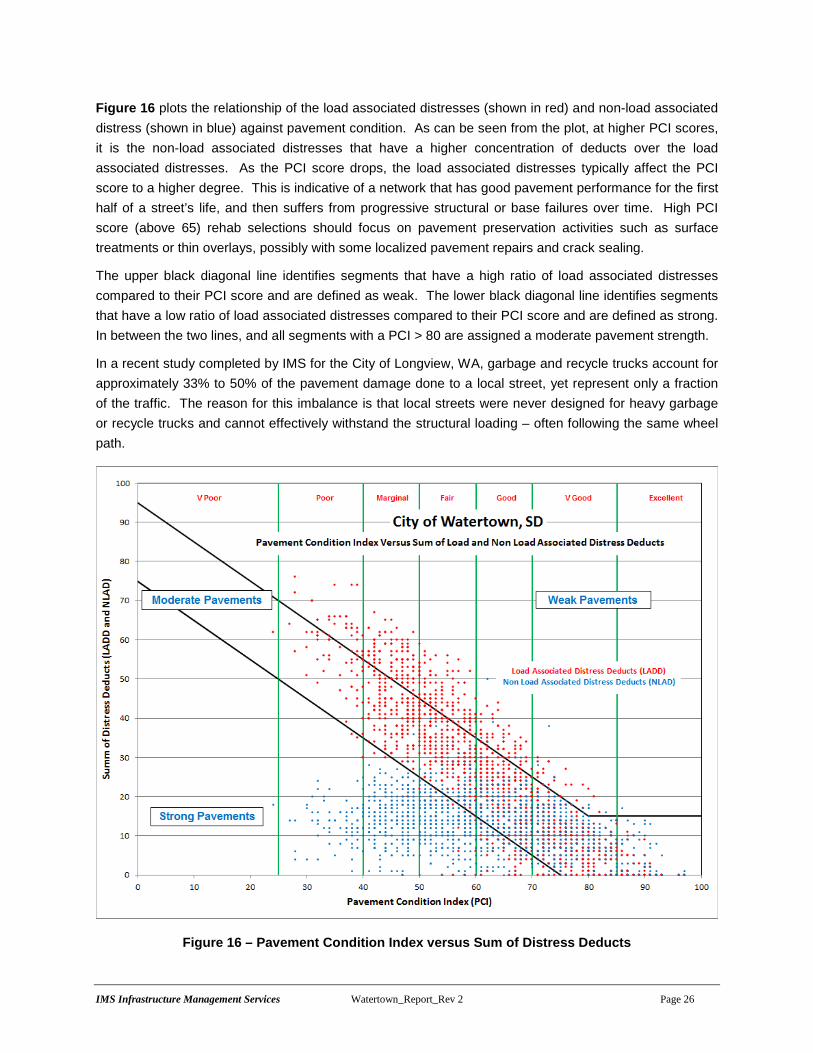
Figure 16 plots the relationship of the load associated distresses (shown in red) and non-load associated distress (shown in blue) against pavement condition. As can be seen from the plot, at higher PCI scores, it is the non-load associated distresses that have a higher concentration of deducts over the load associated distresses. As the PCI score drops, the load associated distresses typically affect the PCI score to a higher degree. This is indicative of a network that has good pavement performance for the first half of a street’s life, and then suffers from progressive structural or base failures over time. High PCI score (above 65) rehab selections should focus on pavement preservation activities such as surface treatments or thin overlays, possibly with some localized pavement repairs and crack sealing.
The upper black diagonal line identifies segments that have a high ratio of load associated distresses compared to their PCI score and are defined as weak. The lower black diagonal line identifies segments that have a low ratio of load associated distresses compared to their PCI score and are defined as strong. In between the two lines, and all segments with a PCI > 80 are assigned a moderate pavement strength.
In a recent study completed by IMS for the City of Longview, WA, garbage and recycle trucks account for approximately 33% to 50% of the pavement damage done to a local street, yet represent only a fraction of the traffic. The reason for this imbalance is that local streets were never designed for heavy garbage or recycle trucks and cannot effectively withstand the structural loading – often following the same wheel path.
Figure 16 – Pavement Condition Index versus Sum of Distress Deducts
IMS Infrastructure Management Services Watertown_Report_Rev 2 Page 27
2.4 CONDITION BY FUNCTIONAL CLASSIFICATION
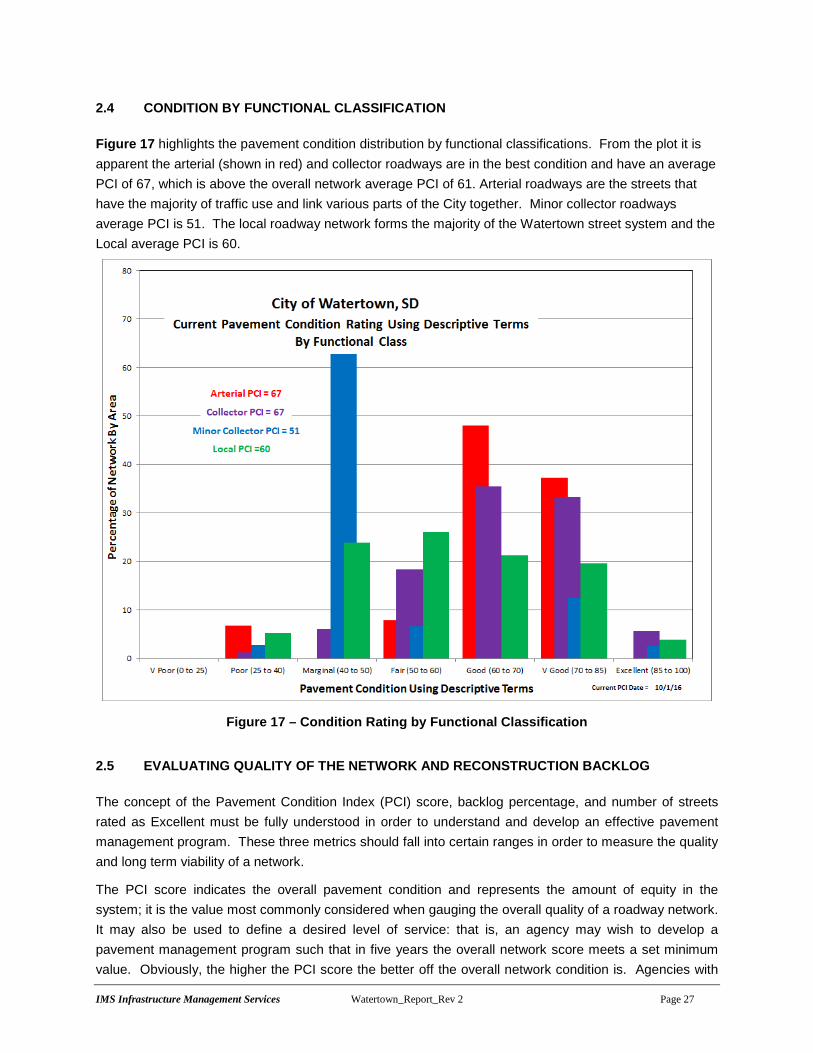
Figure 17 highlights the pavement condition distribution by functional classifications. From the plot it is apparent the arterial (shown in red) and collector roadways are in the best condition and have an average PCI of 67, which is above the overall network average PCI of 61. Arterial roadways are the streets that have the majority of traffic use and link various parts of the City together. Minor collector roadways average PCI is 51. The local roadway network forms the majority of the Watertown street system and the Local average PCI is 60.
Figure 17 – Condition Rating by Functional Classification
2.5 EVALUATING QUALITY OF THE NETWORK AND RECONSTRUCTION BACKLOG
The concept of the Pavement Condition Index (PCI) score, backlog percentage, and number of streets rated as Excellent must be fully understood in order to understand and develop an effective pavement management program. These three metrics should fall into certain ranges in order to measure the quality and long term viability of a network.
The PCI score indicates the overall pavement condition and represents the amount of equity in the system; it is the value most commonly considered when gauging the overall quality of a roadway network. It may also be used to define a desired level of service: that is, an agency may wish to develop a pavement management program such that in five years the overall network score meets a set minimum value. Obviously, the higher the PCI score the better off the overall network condition is. Agencies with
IMS Infrastructure Management Services Watertown_Report_Rev 2 Page 28
an average PCI score above 80 (when considering surface distress, roughness and possibly strength) are rare and found only in a few select communities. Less than 1 in 20 communities surveyed by IMS have that high of a condition average. Averages between 65 and 80 are indicative of either newer networks, or ones that have an ongoing pavement rehabilitation program and tend to be fully funded. Scores between 60 and 65 are common and represent a reasonable average providing a satisfactory balance between levels of service and funding, and when taken with the other two metrics may represent a well-managed and funded network. A minimum score of 60 means that overall the network falls at the lower end of the range where light weight surface treatments and thin overlays are the standard rehabilitation practice. Below a 60 means an agency has to rely on more costly rehabilitations and reconstructions to address condition issues.
At the upper end of the condition scale, a minimum of 15% of the network should be rated as Excellent. Generally, at or above 15%, means that a noticeable percentage of the roadway network is in like new condition, requiring only routine maintenance. While higher percentages of streets rated as Excellent are certainly desirable, the annual cost to maintain this rate is often cost prohibitive. Below 15% means the agency is struggling to effectively rehabilitate their network on an annual basis.
Backlog roadways are those that have dropped sufficiently in quality to the point where surface based rehabilitation efforts would no longer prove to be cost effective. These roadways are rated Poor or Very Poor and will require either partial or total reconstruction. Backlog is expressed as the percentage of roads requiring reconstruction as compared to the network totals.
It is the backlog, however, that defines the amount of legacy work an agency is facing and is willing to accept in the future. It is the combination of the three metrics that presents the true picture of the condition of a roadway network, and conversely defines improvement goals.
Generally, a backlog of 10% to 15% of the overall network is considered manageable from a funding point of view with 12% being a realistic target. Backlog rates below 10%, again are certainly desirable, but financially unachievable for a large percentage of agencies. Backlogs approaching 20% or more tend to become unmanageable, unless aggressively checked through larger rehabilitation programs, and will grow at an alarming rate. At about 20% backlog, the rate of decrease in average condition, and hence growth in backlog, exceeds most agencies ability to arrest the decline and address the large volumes of streets in need of rehabilitation. Basically, at 20% a tipping point has been met and the backlog tends to increase faster than an agency’s ability to reconstruct their streets.
Watertown met two out of three of the minimum metrics for evaluating the quality of its roadway network. Watertown’s average overall pavement condition is within the recommended target zone of 60 to 65 with an average of 61. The number of streets rated as Excellent is below the minimum target of 15% at 4%.
The backlog amount was 4%, which is well below the maximum recommended target of 10%-12%.
IMS Infrastructure Management Services Watertown_Report_Rev 2 Page 29
3.0 REHABILITATION PLAN AND BUDGET DEVELOPMENT
3.1 KEY ANALYSIS SET POINTS
Pavement management analysis requires user inputs in order to complete its condition forecasting and prioritization. A series of operating parameters were developed in order to develop an efficient program that is tailored to the City’s needs.
Some of the highlights include:
• Pavement performance curves are used to predict future pavement condition. Asphalt streets are classified as weak, moderate, or strong, and then assigned the appropriate pavement performance curve based on their functional classification to use in the analysis.
• The shape of performance curves reflect the concept of deferred maintenance and salvage life. Instead of dropping to an absolute PCI value of 0 after 40 years of service, the curves are designed to become asymptotic to the age axis and have a whole life of approximately 50 to 60 years depending on pavement type. This indicates the concept that once a street deteriorates past a specific threshold – about a PCI of 20, age becomes less important in rehabilitation selection.
• Priority ranking – analysis uses prioritization for rehab candidate selection. It is designed to capture as many segments in their need year based on the incremental cost of deferral. The higher the functional classification of a street, the higher priority a segment is given.
Pavement Performance Curves
The basic shape of the asphalt performance curves follows traditional sigmoidal deterioration models such as those contained in MicroPAVER and other commonly used pavement management applications. The curves are constructed such that a typical overlay following new pavement construction does not occur until 20 to 30 years have passed, and full reconstruction does not occur until 40 to 65 years have passed or the street has a PCI below 10. Each street is assigned a curve based on its pavement type, functional classification, and pavement strength as determined in Section 2. The curves assume an ultimate life between 60 and 100 years and are designed to be asymptotic to the X-axis (Time) to reflect the salvage value of the pavement once it has reached the end of its service life with a PCI less than 10.
It is important to recognize that even though all streets fall into specific rating categories (as highlighted by the horizontal black dotted lines in Figure 18 and their respective rehabilitation strategies), it is not until a street falls to within a few points of the lower end of the range that it will become a critical need selected for rehabilitation.

IMS Infrastructure Management Services Watertown_Report_Rev 2 Page 30
Figure 18– Asphalt (ACP) and Concrete (PCC) Performance Curves
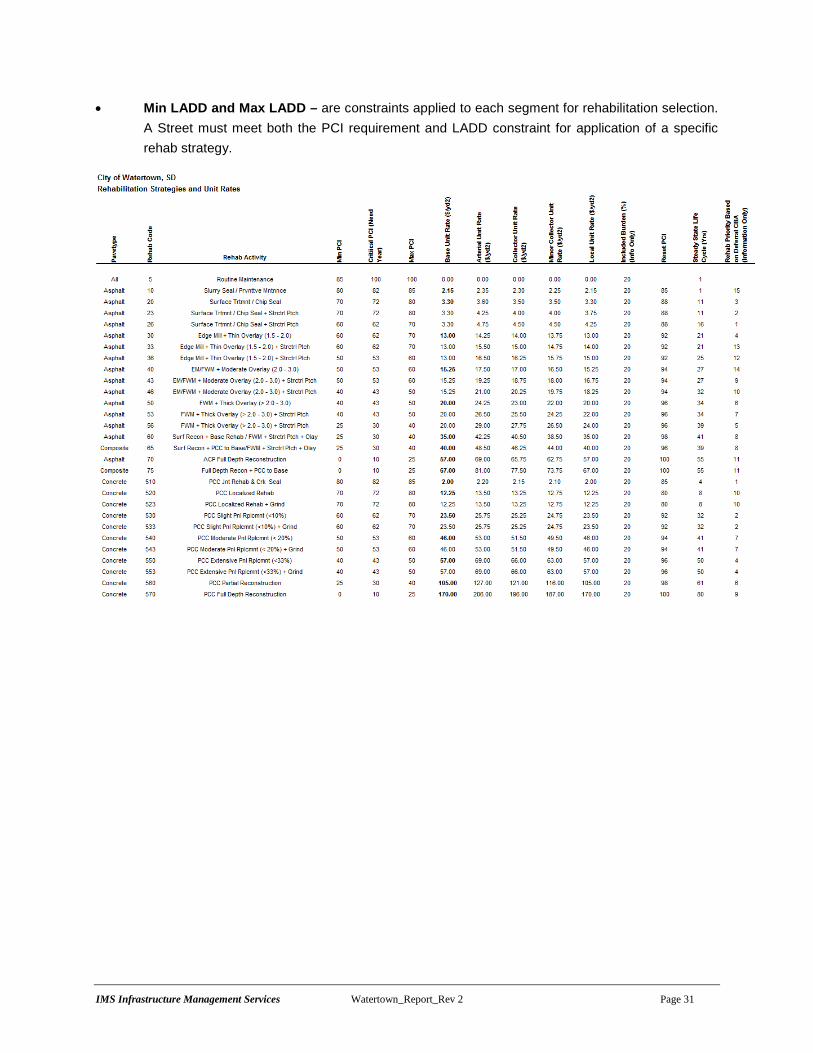
Rehabilitation Strategies and Unit Rates
The rehab strategies and unit rates used in the pavement analysis can be found in the table on the following page. Some important parameters include:
• Rehab Code and Activity – The assigned identifier and name to each rehabilitation strategy. The term “RR” refers to remove and replace – that is, structural patching. When this term is present, additional funds have been assigned to the strategy to allow for an increased amount of preparation work and patching. The relative terms of thin, moderate and thick are used to describe the overlay thickness. This is to facilitate consistency in the naming convention, but does not imply the same material thickness has to be used for each functional classification.
• Unit Rates – The rehab costs are presented on a per square yard basis for each pavement type, functional class, and rehab activity combination. The rates were developed using typical national averages for similar activities and adjusted for Watertown’s location and unique conditions. Rates include a burden for miscellaneous activities (such as striping removal or loop detector replacement), traffic control and engineering inspection. Costs for peripheral concrete rehab and drainage activities are not included in the unit rates.
• Min PCI, Critical PCI, Max PCI, and PCI Reset – These define the Pavement Condition Index (PCI) range applicable to the rehab selection. The Critical PCI defines when a segment is in its need year and is deemed to be critical, otherwise if deferred, the street declines in PCI past the point which the rehabilitation is no longer appropriate. PCI Reset is the applied Post-Rehab PCI.
IMS Infrastructure Management Services Watertown_Report_Rev 2 Page 31
• Min LADD and Max LADD – are constraints applied to each segment for rehabilitation selection. A Street must meet both the PCI requirement and LADD constraint for application of a specific rehab strategy.

IMS Infrastructure Management Services Watertown_Report_Rev 2 Page 32
Figure 19 graphically presents the application of pavement rehabilitations for asphalt streets by PCI and Structural Index (SI). The Rehab numbers are simply placeholders that separate each rehabilitation project. For example, Rehab 43 is an Mod Olay, Mod is short for Moderate and Olay is a contraction for overlay.
Unit rates increase slightly between functional classes to reflect increase costs in pavement thickness, traffic control, and striping. Rehabs 26 and 30 share the same rehab location, and is an example of where the lighter of the two options (rehab 26 – surface treatment) may be suitable in place of an overlay.
Figure 19 – Asphalt (ACP) Rehabilitation Strategies
IMS Infrastructure Management Services Watertown_Report_Rev 2 Page 33
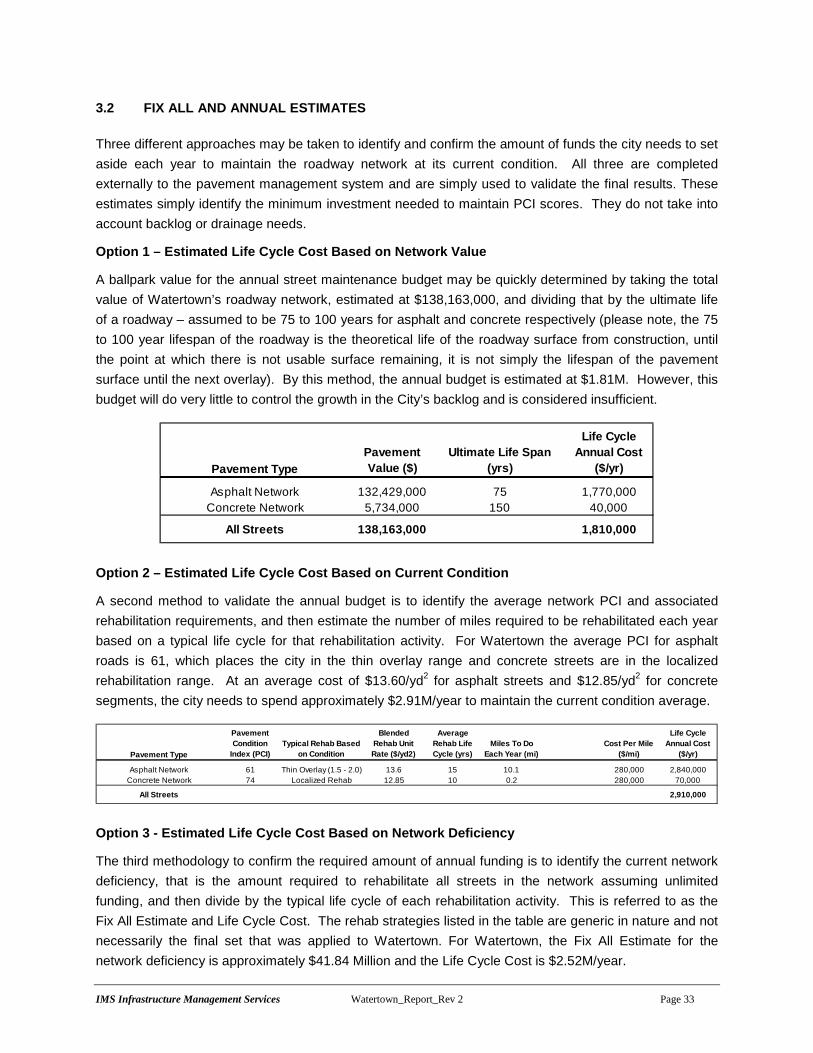
3.2 FIX ALL AND ANNUAL ESTIMATES
Three different approaches may be taken to identify and confirm the amount of funds the city needs to set aside each year to maintain the roadway network at its current condition. All three are completed externally to the pavement management system and are simply used to validate the final results. These estimates simply identify the minimum investment needed to maintain PCI scores. They do not take into account backlog or drainage needs.
Option 1 – Estimated Life Cycle Cost Based on Network Value
A ballpark value for the annual street maintenance budget may be quickly determined by taking the total value of Watertown’s roadway network, estimated at $138,163,000, and dividing that by the ultimate life of a roadway – assumed to be 75 to 100 years for asphalt and concrete respectively (please note, the 75 to 100 year lifespan of the roadway is the theoretical life of the roadway surface from construction, until the point at which there is not usable surface remaining, it is not simply the lifespan of the pavement surface until the next overlay). By this method, the annual budget is estimated at $1.81M. However, this budget will do very little to control the growth in the City’s backlog and is considered insufficient.
Pavement TypePavement Value ($)
Ultimate Life Span (yrs)
Life Cycle Annual Cost
($/yr)
Asphalt Network 132,429,000 75 1,770,000Concrete Network 5,734,000 150 40,000
All Streets 138,163,000 1,810,000
Option 2 – Estimated Life Cycle Cost Based on Current Condition
A second method to validate the annual budget is to identify the average network PCI and associated rehabilitation requirements, and then estimate the number of miles required to be rehabilitated each year based on a typical life cycle for that rehabilitation activity. For Watertown the average PCI for asphalt roads is 61, which places the city in the thin overlay range and concrete streets are in the localized rehabilitation range. At an average cost of $13.60/yd2 for asphalt streets and $12.85/yd2 for concrete segments, the city needs to spend approximately $2.91M/year to maintain the current condition average.
Pavement Type
Pavement Condition
Index (PCI)Typical Rehab Based
on Condition
Blended Rehab Unit Rate ($/yd2)
Average Rehab Life Cycle (yrs)
Miles To Do Each Year (mi)
Cost Per Mile ($/mi)
Life Cycle Annual Cost
($/yr)
Asphalt Network 61 Thin Overlay (1.5 - 2.0) 13.6 15 10.1 280,000 2,840,000Concrete Network 74 Localized Rehab 12.85 10 0.2 280,000 70,000
All Streets 2,910,000
Option 3 - Estimated Life Cycle Cost Based on Network Deficiency
The third methodology to confirm the required amount of annual funding is to identify the current network deficiency, that is the amount required to rehabilitate all streets in the network assuming unlimited funding, and then divide by the typical life cycle of each rehabilitation activity. This is referred to as the Fix All Estimate and Life Cycle Cost. The rehab strategies listed in the table are generic in nature and not necessarily the final set that was applied to Watertown. For Watertown, the Fix All Estimate for the network deficiency is approximately $41.84 Million and the Life Cycle Cost is $2.52M/year.

IMS Infrastructure Management Services Watertown_Report_Rev 2 Page 34
Asphalt DeficiencyTotal Cost
($) % of Total ART COL MnCOL LOCLife Cycle
(years)Life CycleCost ($)
Reconstruction (Base) 191,800 0.5 0 0 0 191,800 50 4,000Reconstruction (Surface) 4,240,400 10.4 112,900 414,500 54,700 3,658,300 30 141,000
Thick Olay (> 2.0 - 3.0) 12,150,700 29.7 0 1,030,400 855,300 10,265,000 20 608,000Mod Overlay (2.0 - 3.0) 11,514,300 28.2 54,300 2,479,000 57,200 8,923,800 18 640,000Thin Overlay (1.5 - 2.0) 10,700,000 26.2 311,100 4,102,900 0 6,286,000 15 713,000
Surface Treatment 1,097,000 2.7 1,500 410,100 0 685,400 7 157,000Slurry Seal 955,300 2.3 32,500 402,900 14,800 505,100 5 191,000
Routine Maintenance 30,200 0.1 0 11,800 300 18,100 2 15,000
Total Asphalt Network: 40,879,700 100 512,300 8,851,600 982,300 30,533,500 2,469,000
Concrete DeficiencyTotal Cost
($) % of Total ART COL MnCOL LOCLife Cycle
(years)Life CycleCost ($)
PCC Reconstruction 0 0.0 0 0 0 0 75 0PCC Partial Recon 0 0.0 0 0 0 0 50 0
Extensive Pnl Rplcmnt 237,400 24.7 0 0 0 237,400 25 9,000Moderate Pnl Rplcmnt 490,800 51.1 0 328,800 0 162,000 20 25,000
Slight Pnl Rplcmnt 121,600 12.7 0 92,200 0 29,400 15 8,000Localized Rehab 80,200 8.4 0 0 0 80,200 10 8,000
Joint Rehab 26,400 2.7 0 17,600 0 8,800 5 5,000Routine Maintenance 4,000 0.4 0 0 0 4,000 2 2,000
Total Concrete Network: 960,400 100 0 438,600 0 521,800 57,000
Total Network : 41,840,100 512,300 9,290,200 982,300 31,055,300 2,526,000
3.3 NETWORK BUDGET ANALYSIS MODELS
An analysis containing a total of 10 budget runs ($500K through $8.0M per year) plus Unlimited and Do Nothing options was prepared for Watertown.
The analysis results are summarized below:
• Unlimited - The Unlimited (or Fix All) budget assumes each street is rehabilitated with unlimited funds available. The idea is to identify the upper limit of spending the city would require without any constraints on budgets. For Watertown, the unlimited budget is approximately $41.2M over 5 years. This increases the network PCI to a maximum of 91 and tapering off to an 88 in 5 years.
• Do Nothing - This option identifies the effect of spending no capital for 5 years. After 5 years, the Do Nothing option results in an average PCI drop from a 61 to a 51.
• $500K through $8.0M - Identifies the resultant network PCI at various funding levels. From these budgets, the final recommended annual budget was determined.
IMS Infrastructure Management Services Watertown_Report_Rev 2 Page 35
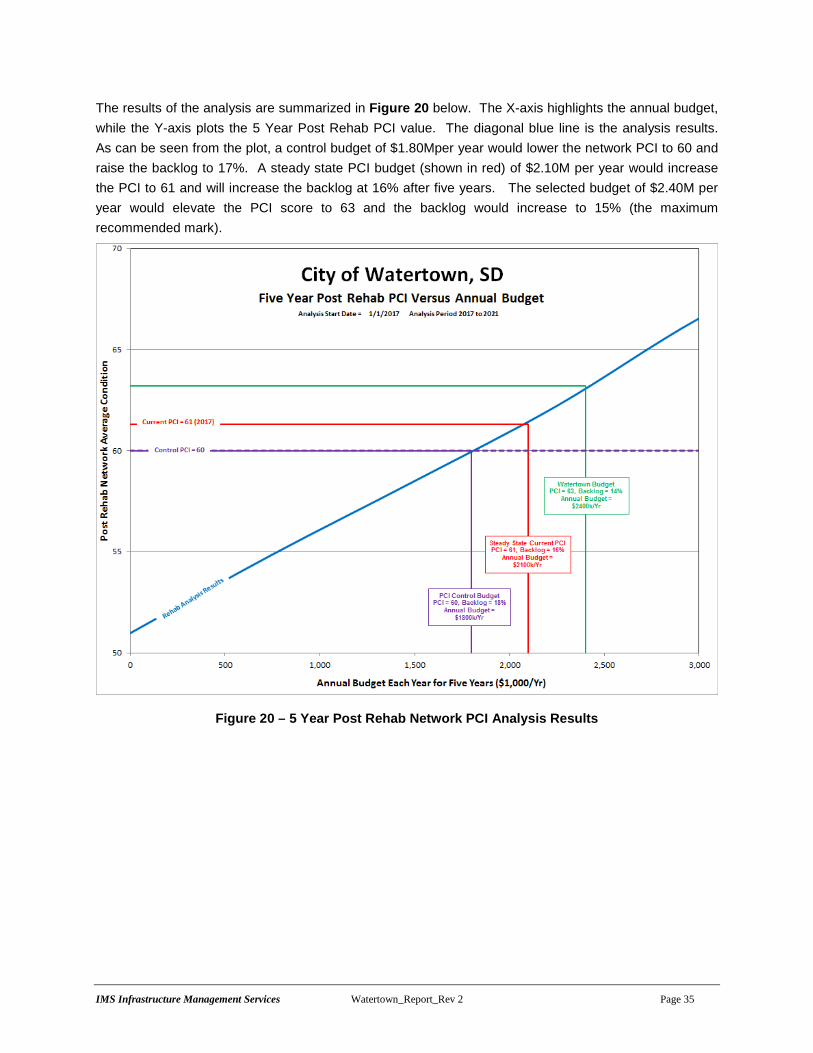
The results of the analysis are summarized in Figure 20 below. The X-axis highlights the annual budget, while the Y-axis plots the 5 Year Post Rehab PCI value. The diagonal blue line is the analysis results. As can be seen from the plot, a control budget of $1.80Mper year would lower the network PCI to 60 and raise the backlog to 17%. A steady state PCI budget (shown in red) of $2.10M per year would increase the PCI to 61 and will increase the backlog at 16% after five years. The selected budget of $2.40M per year would elevate the PCI score to 63 and the backlog would increase to 15% (the maximum recommended mark).
Figure 20 – 5 Year Post Rehab Network PCI Analysis Results
IMS Infrastructure Management Services Watertown_Report_Rev 2 Page 36
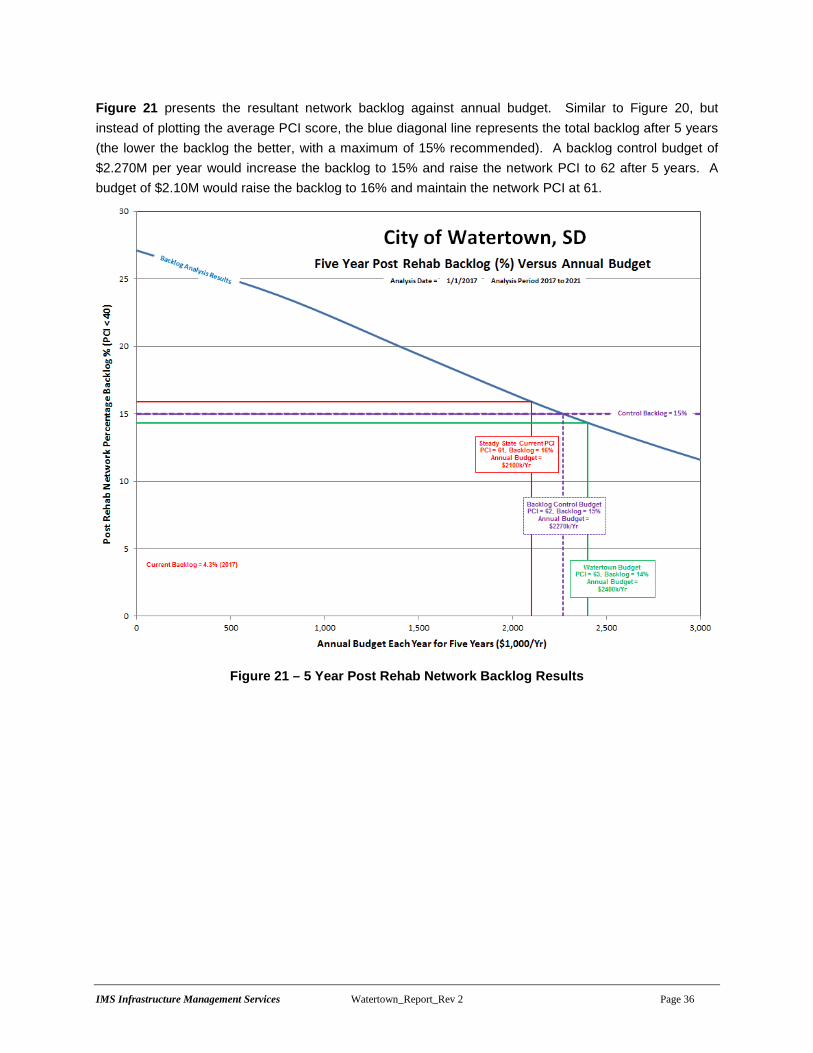
Figure 21 presents the resultant network backlog against annual budget. Similar to Figure 20, but instead of plotting the average PCI score, the blue diagonal line represents the total backlog after 5 years (the lower the backlog the better, with a maximum of 15% recommended). A backlog control budget of $2.270M per year would increase the backlog to 15% and raise the network PCI to 62 after 5 years. A budget of $2.10M would raise the backlog to 16% and maintain the network PCI at 61.
Figure 21 – 5 Year Post Rehab Network Backlog Results
IMS Infrastructure Management Services Watertown_Report_Rev 2 Page 37
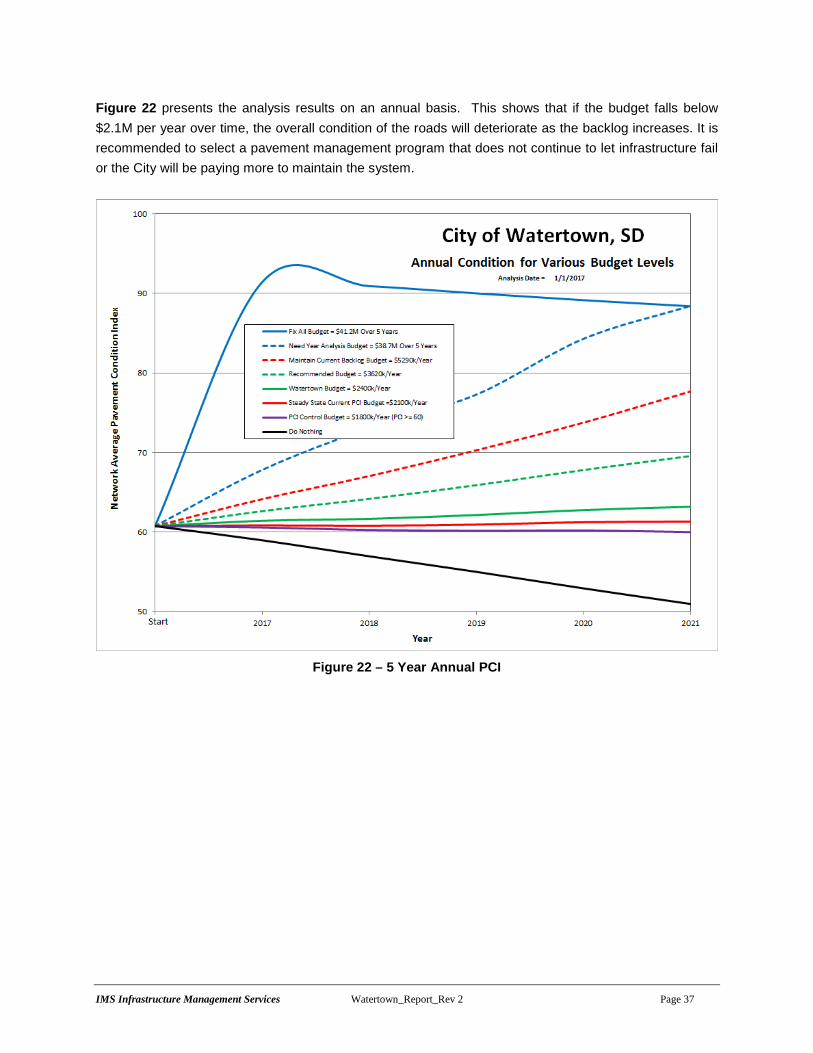
Figure 22 presents the analysis results on an annual basis. This shows that if the budget falls below $2.1M per year over time, the overall condition of the roads will deteriorate as the backlog increases. It is recommended to select a pavement management program that does not continue to let infrastructure fail or the City will be paying more to maintain the system.
Figure 22 – 5 Year Annual PCI
IMS Infrastructure Management Services Watertown_Report_Rev 2 Page 38
3.4 WATERTOWN COMPARISON TO OTHER AGENCIES
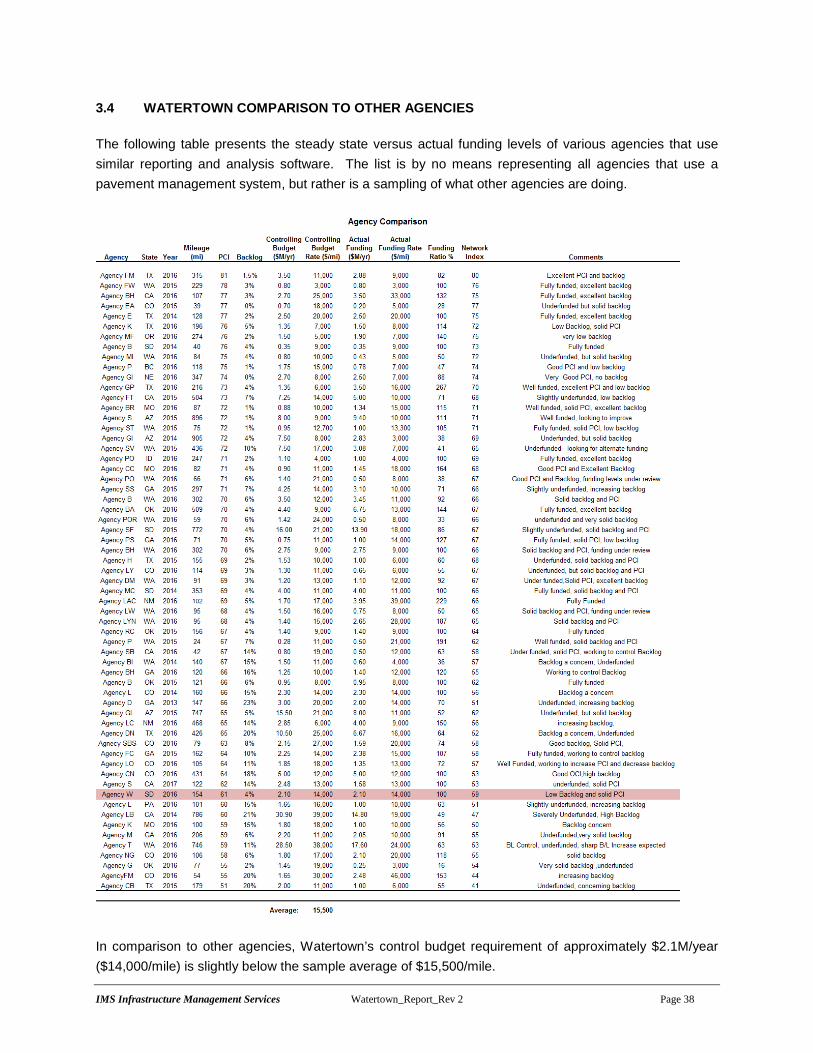
The following table presents the steady state versus actual funding levels of various agencies that use similar reporting and analysis software. The list is by no means representing all agencies that use a pavement management system, but rather is a sampling of what other agencies are doing.
In comparison to other agencies, Watertown’s control budget requirement of approximately $2.1M/year ($14,000/mile) is slightly below the sample average of $15,500/mile.

IMS Infrastructure Management Services Watertown_Report_Rev 2 Page 39
Figure 23 illustrates the overall network health of various agencies by developing a relative scoring system (Network Index) that compares the Network average PCI and the agency’s Backlog (Very Poor and Poor roadways). An agency with a PCI of 100 and no backlog would score a perfect Network Index of 100. A very well managed network would score above 71, while one in healthy condition would fall between 58 and 71, representing a PCI score of 65 with no more than 10% backlog up to a PCI of 75 with only 5% backlog. The minimum target Network Index is 51 representing a PCI of 60 with 15% backlog.
Watertown’s current Network Index is 59 placing it at the upper end at the minimum network index network target zone (shown as the blue square).
Figure 23 – Network Index
IMS Infrastructure Management Services Watertown_Report_Rev 2 Page 40
3.5 SELECTION SUMMARY AND POST REHABILITATION CONDITION
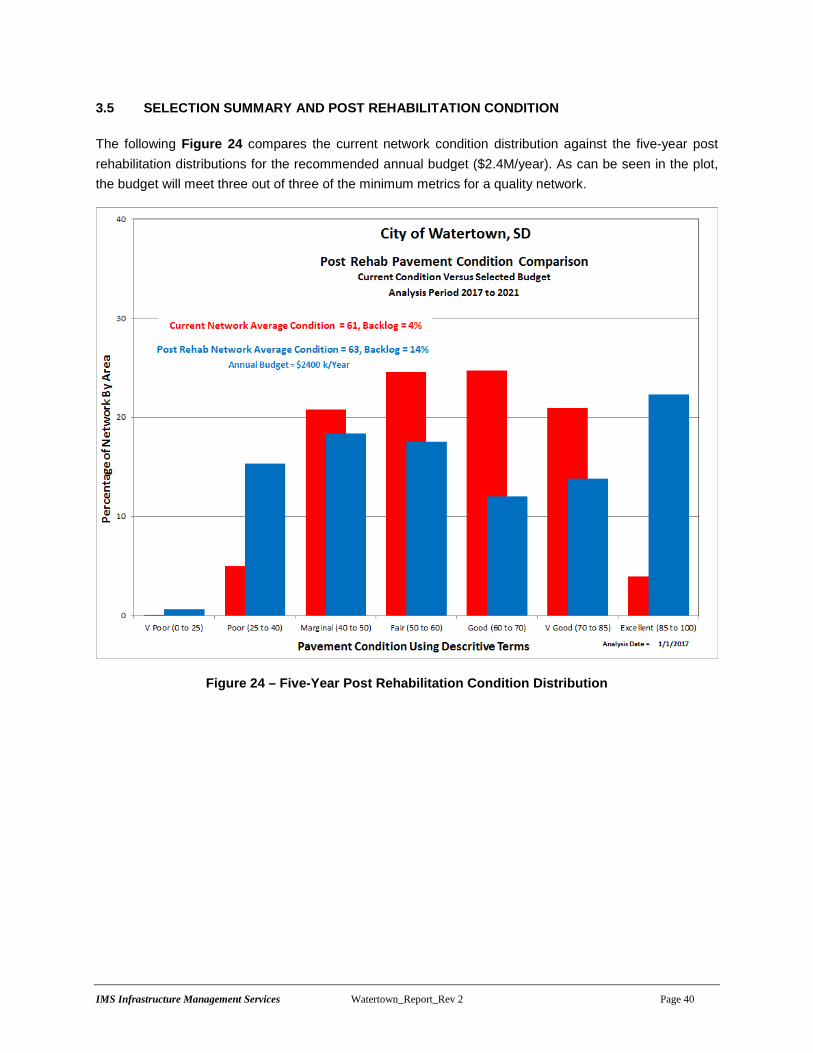
The following Figure 24 compares the current network condition distribution against the five-year post rehabilitation distributions for the recommended annual budget ($2.4M/year). As can be seen in the plot, the budget will meet three out of three of the minimum metrics for a quality network.
Figure 24 – Five-Year Post Rehabilitation Condition Distribution
IMS Infrastructure Management Services Watertown_Report_Rev 2 Page 41
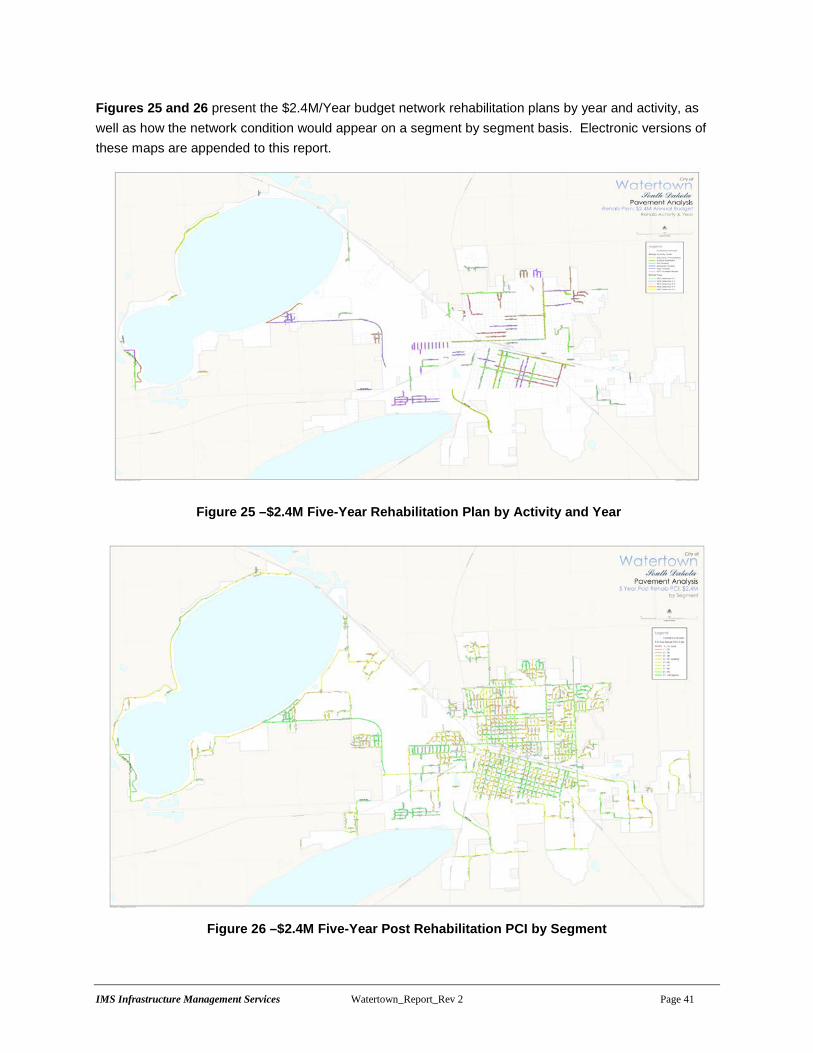
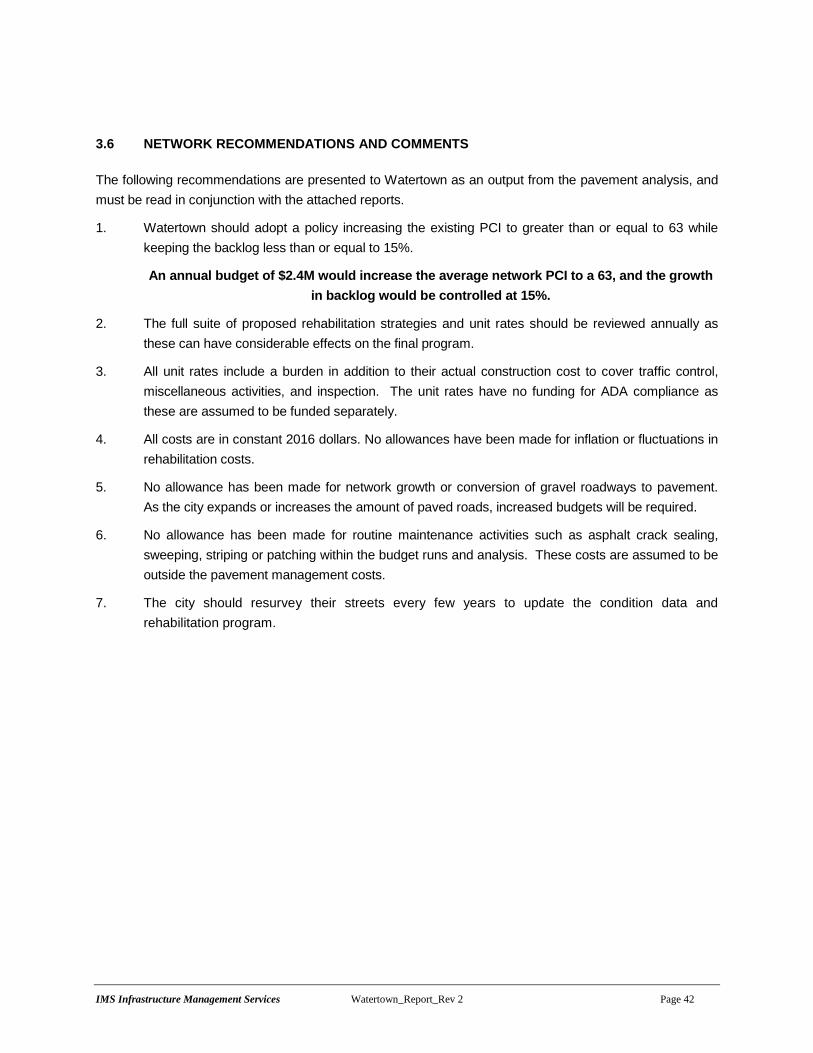
Figures 25 and 26 present the $2.4M/Year budget network rehabilitation plans by year and activity, as well as how the network condition would appear on a segment by segment basis. Electronic versions of these maps are appended to this report.
Figure 25 –$2.4M Five-Year Rehabilitation Plan by Activity and Year
Figure 26 –$2.4M Five-Year Post Rehabilitation PCI by Segment
IMS Infrastructure Management Services Watertown_Report_Rev 2 Page 42
3.6 NETWORK RECOMMENDATIONS AND COMMENTS
The following recommendations are presented to Watertown as an output from the pavement analysis, and must be read in conjunction with the attached reports.
1. Watertown should adopt a policy increasing the existing PCI to greater than or equal to 63 while keeping the backlog less than or equal to 15%.
An annual budget of $2.4M would increase the average network PCI to a 63, and the growth in backlog would be controlled at 15%.
2. The full suite of proposed rehabilitation strategies and unit rates should be reviewed annually as these can have considerable effects on the final program.
3. All unit rates include a burden in addition to their actual construction cost to cover traffic control, miscellaneous activities, and inspection. The unit rates have no funding for ADA compliance as these are assumed to be funded separately.
4. All costs are in constant 2016 dollars. No allowances have been made for inflation or fluctuations in rehabilitation costs.
5. No allowance has been made for network growth or conversion of gravel roadways to pavement. As the city expands or increases the amount of paved roads, increased budgets will be required.
6. No allowance has been made for routine maintenance activities such as asphalt crack sealing, sweeping, striping or patching within the budget runs and analysis. These costs are assumed to be outside the pavement management costs.
7. The city should resurvey their streets every few years to update the condition data and rehabilitation program.

1
APPENDIX D
2
Methods and Assumptions Document Date: Tuesday, September 22, 2015
Project: Watertown Pavement Management Study
To: Watertown Pavement Management Study - Study Advisory Team
From: HDR/IMS
Subject: Methods and Assumptions
This Methods and Assumptions document was developed in preparation for the Methods and Assumptions Meeting held as part of the project start-up with representatives from the City of Watertown, South Dakota Department of Transportation (SDDOT), IMS, and HDR. This document is intended to serve as a historical record of the process, dates, and decisions made by the study team representatives for the Watertown Pavement Management Study
3
2. Stakeholder Acceptance Page
The undersigned parties concur with the Methods and Assumptions for the Watertown Pavement Management Study as presented in this document.
CITY OF WATERTOWN:
_________________________ Signature _________________________ Title _________________________ Date
SDDOT:
Signature
Title
Date
.
4
3. Introduction and Project Description
Project Background and Understanding
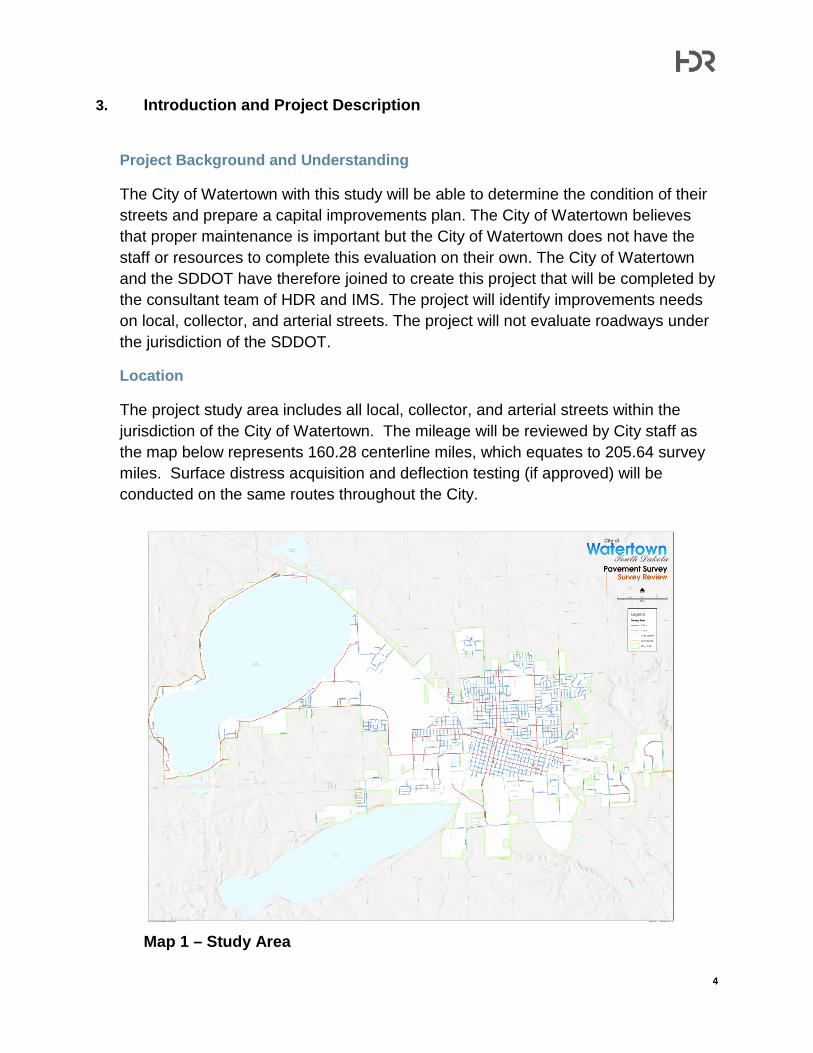
The City of Watertown with this study will be able to determine the condition of their streets and prepare a capital improvements plan. The City of Watertown believes that proper maintenance is important but the City of Watertown does not have the staff or resources to complete this evaluation on their own. The City of Watertown and the SDDOT have therefore joined to create this project that will be completed by the consultant team of HDR and IMS. The project will identify improvements needs on local, collector, and arterial streets. The project will not evaluate roadways under the jurisdiction of the SDDOT.
Location
The project study area includes all local, collector, and arterial streets within the jurisdiction of the City of Watertown. The mileage will be reviewed by City staff as the map below represents 160.28 centerline miles, which equates to 205.64 survey miles. Surface distress acquisition and deflection testing (if approved) will be conducted on the same routes throughout the City.
Map 1 – Study Area
5
Need for Study
The City of Watertown does not have the technical resources or staff availability to complete a comprehensive study on the condition of their streets. For that reason, the City of Watertown has been able to gain funding through the SDDOT to complete this study.
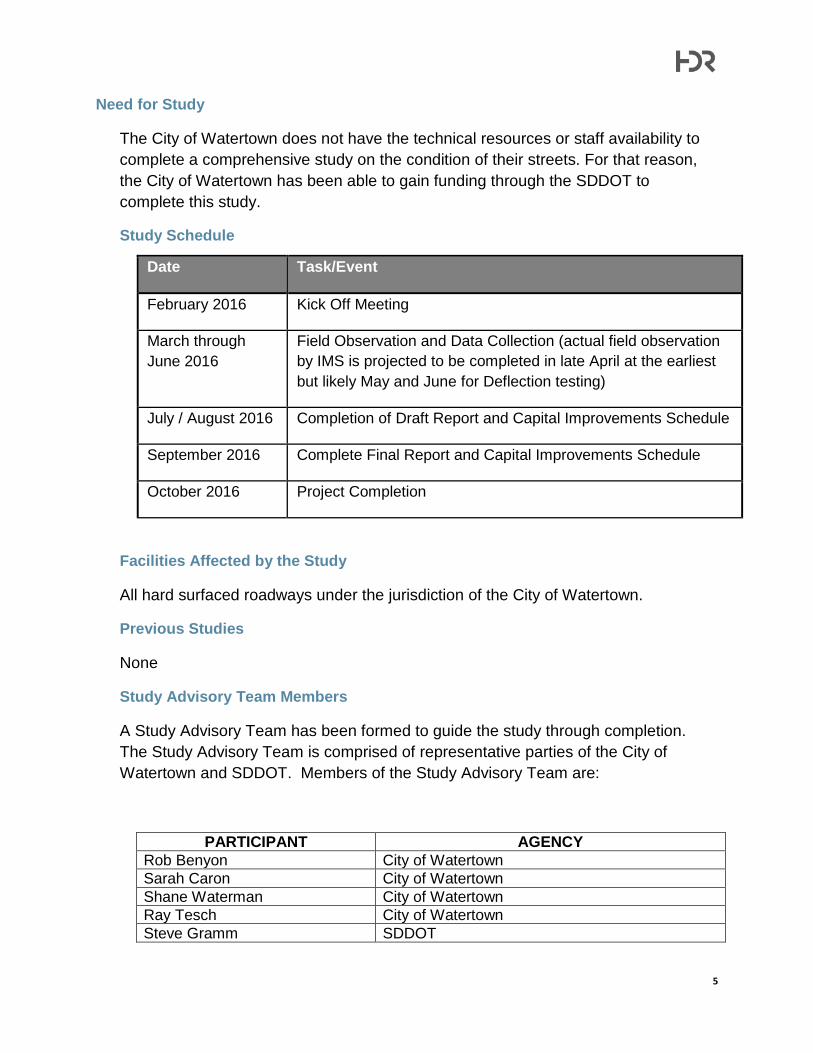
Study Schedule
Date Task/Event
February 2016 Kick Off Meeting
March through June 2016
Field Observation and Data Collection (actual field observation by IMS is projected to be completed in late April at the earliest but likely May and June for Deflection testing)
July / August 2016 Completion of Draft Report and Capital Improvements Schedule
September 2016 Complete Final Report and Capital Improvements Schedule
October 2016 Project Completion
Facilities Affected by the Study
All hard surfaced roadways under the jurisdiction of the City of Watertown.
Previous Studies
None
Study Advisory Team Members
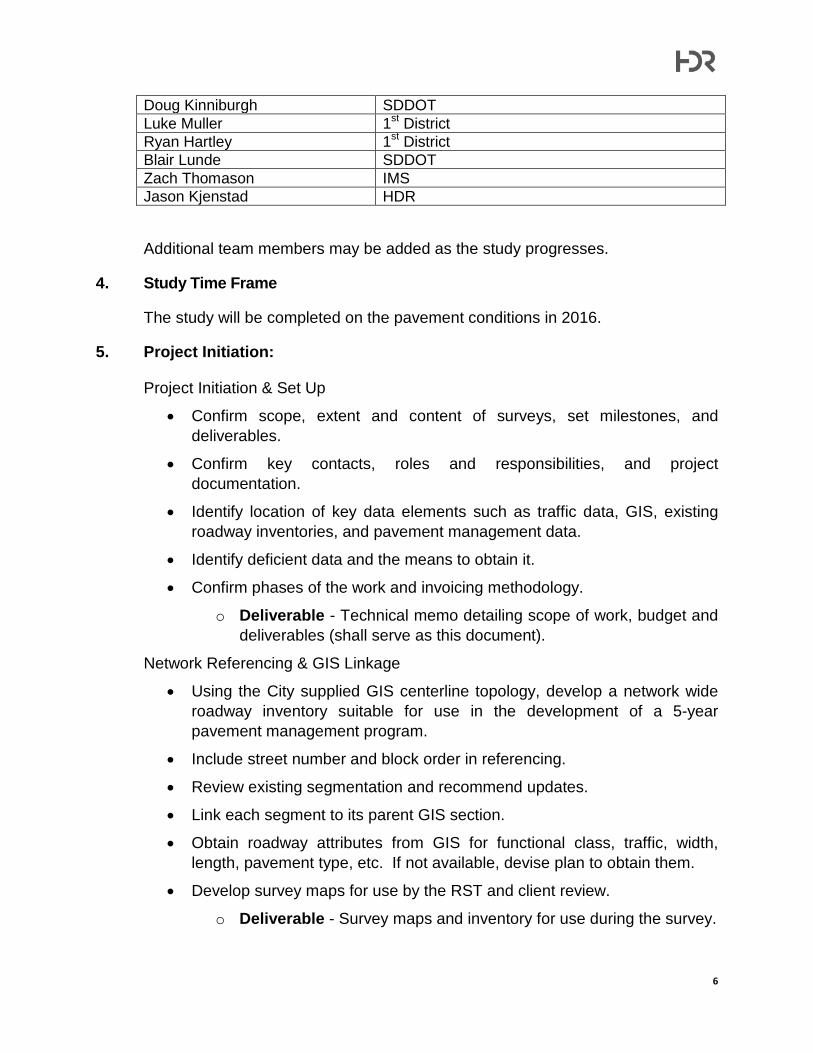
A Study Advisory Team has been formed to guide the study through completion. The Study Advisory Team is comprised of representative parties of the City of Watertown and SDDOT. Members of the Study Advisory Team are:
PARTICIPANT AGENCY Rob Benyon City of Watertown Sarah Caron City of Watertown Shane Waterman City of Watertown Ray Tesch City of Watertown Steve Gramm SDDOT
6
Doug Kinniburgh SDDOT Luke Muller 1st District Ryan Hartley 1st District Blair Lunde SDDOT Zach Thomason IMS Jason Kjenstad HDR
Additional team members may be added as the study progresses.
4. Study Time Frame
The study will be completed on the pavement conditions in 2016.
5. Project Initiation:
Project Initiation & Set Up
• Confirm scope, extent and content of surveys, set milestones, and deliverables.
• Confirm key contacts, roles and responsibilities, and project documentation.
• Identify location of key data elements such as traffic data, GIS, existing roadway inventories, and pavement management data.
• Identify deficient data and the means to obtain it.
• Confirm phases of the work and invoicing methodology.
o Deliverable - Technical memo detailing scope of work, budget and deliverables (shall serve as this document).
Network Referencing & GIS Linkage
• Using the City supplied GIS centerline topology, develop a network wide roadway inventory suitable for use in the development of a 5-year pavement management program.
• Include street number and block order in referencing.
• Review existing segmentation and recommend updates.
• Link each segment to its parent GIS section.
• Obtain roadway attributes from GIS for functional class, traffic, width, length, pavement type, etc. If not available, devise plan to obtain them.
• Develop survey maps for use by the RST and client review.
o Deliverable - Survey maps and inventory for use during the survey.
7
6. Field Surveys:
RST and Dynaflect Mobilization & Calibration
• Mobilize surface distress, roughness, and rutting testing equipment to project.
• Demonstrate the equipment to the City.
• Calibrate equipment. RST Field Data Collection
• On all arterials and collectors, complete 2 pass testing collecting ASTM D6433 distresses and attributes at 100-foot intervals on a block by block basis.
• Local roadways will be surveyed in a single pass. • IMS will survey approximately 228 miles of roadway based
upon 179 centerline miles. Mileage will be updated upon completion of coverage map review.
Dynaflect Field Data Collection • On all roadways, collect multi-sensor deflection data at an
average of 400 - 500 foot intervals. • Arterials and collectors will be surveyed in 2 directions. • Collect GPS and temperature. • High traffic routes may require the use of a Public Works
shadow vehicle. The field operator will assess traffic conditions upon arrival.
7. Data Management:
Data QA/QC, & Processing (surface and structural)
• Develop exceptions report for lengths that do not match GIS.
• For each data stream (surface distress, roughness, deflection, & GPS), aggregate and process the data at the segment level.
• Develop individual index scores for surface distress, structural, and roughness as appropriate.
• Develop a pavement condition index for each section.
• Shape files of the processed data.
• Complete QA of data.
o Deliverable - Excel spreadsheet of the sectional data and index
8
values. Segment level condition data will be supplemented with network comps and several graphs to illustrate network condition.
Process Forward View of Imagery at 25-Foot Intervals – 1 View
• Process 1 forward view of HD pavement imagery at 25-foot intervals.
• Deliver the images in .jpeg format with an associated geodatabase.
• Additional views can be added and supplied at the unit rates provided.
o Deliverable – digital imagery delivered as a .jpeg file format and supplied with a Personal Geodatabase containing image point hyperlinks.
Pavement Data Format & Supply
• Assemble, format, and supply the City road inventory, segmentation, and distress data into several industry standard file types such as Excel Spreadsheets, Personal Geodatabases, and Google Earth KMZ files.
o Deliverable - Final pavement condition data ready for analysis.
Pavement Analysis, Budget Development, & Report
• Develop the intelligence that drives rehabilitation and maintenance selection on each roadway.
o Develop deterioration models for load during pavement analysis.
o Review PCI thresholds, cost of deferment, strength index’s, functional classification, and all other weighted criteria.
o Program critical set points and maintenance activities.
• Following the operating parameter development, complete the following analysis:
o Present status and PCI report in Excel format c/w PCI charts and backlog.
o Fix all needs analysis and budget.
o Steady state (SS), do nothing, unlimited, SS plus 50%, SS minus 50%.
o Budget driven analysis ($/yr estimate).
o Integrate City capital plans and “must do’s” ($ to hit set PCI and backlog target).
• After reviewing the analysis and finalizing the results, begin assembling a comprehensive report:
o The report shall include a summary of the network value, pavement
9
condition, rehabilitation & maintenance treatments, budget scenarios, PCI definitions, analysis operating parameters, and the results of the survey.
o The written report shall be supplemented with appendix’s that contain spreadsheet reports such as:
Street Inventory and Condition Summary $ Driven 5-year Rehab Program by Segment $ Driven 5-year Rehab Program by Year Alternate $ Driven Rehab Programs by Year & Segment.
• Deliver draft report to City and incorporate any modifications to the analysis or reporting methodology.
o Deliverable - Draft analysis and report. Up to 7 models/budget analysis options will be completed. Delivery of draft pavement management report and hard copies of the final report to be delivered. An electronic version of the report and GIS maps will also be supplied.
Broswer Based Viewing Software
• Development of a browser based image and data viewing tool to be hosted on City servers.
• The application will be populated with pavement condition, analysis results, and digital image data.
• City must have a web server and an ArcGIS server. If the City does not wish to retain these, IMS can offer a hosting option instead.
o Deliverable - Delivery and installation of the image and data viewing tool.
8. Data Provided by SDDOT / Watertown
SDDOT / City of Watertown is providing the following information:
• All available GIS Shapefiles provided by Watertown / 1st District • SDDOT Functional Class Map for Watertown
9. Deviations/Justifications
No deviations from standards are currently known. If it is determined during the study that deviations are required, the methods and assumptions document will be amended prior to proceeding.
10. Conclusion

10
All sections contained in this document will guide the pavement management study.
11. Appendices
The appendix includes the following:
• Kick Off Meeting Minutes