Embed Size (px)
Citation preview

PAVEMENT DESIGN MANUAL
2016
Materials Bureau

This page intentionally blank
MDT Surfacing Design Guide Table of Contents
January 2015 i
Contents
Preface .................................................................................................................... 1 Chapter 1
Introduction ............................................................................................................. 3 Chapter 2
Pavement Types ..................................................................................................... 5 Chapter 3
MDT’s Pavement Design Overview ........................................................................ 7 Chapter 44.1 DESIGNING WITH THICK PMS LAYER ........................................................................ 7
4.2 PAVEMENT FAILURE TYPES ....................................................................................... 8
4.3 PAVEMENT OVERLAYS – STAGED CONSTRUCTION ................................................ 9
Pavement Design Process ....................................................................................11 Chapter 55.1 PROJECT FLOWCHARTS ............................................................................................12
5.2 PAVEMENT PRESERVATION FLOWCHART ...............................................................15
5.3 CONSULTANT DESIGN PROJECT FLOWCHART .......................................................18
5.4 DESIGN MEMOS ..........................................................................................................21
New and Reconstructed Pavements ....................................................................23 Chapter 66.1 GENERAL CHARACTERISTICS OF MDT PAVEMENTS..............................................23
6.2 FLEXIBLE PAVEMENT DESIGN METHOD ..................................................................25
6.2.1 Step #1: Determine Pavement Design Inputs .................................................25
6.2.2 Step #2: Determining required structural number (SNreq’d) ..............................41
6.2.3 Step #3 Design a flexible pavement structure with SNdes >= SNreq’d .................41
6.2.4 Step #4: Specifying Pavement Materials .........................................................47
6.2.5 Step #5: Send Pavement Design Memo to Project Design Manager. .............57
Flexible Pavement Rehabilitation .........................................................................75 Chapter 77.1 MINOR REHABILITATION ............................................................................................75
7.1.1 Major Rehabilitation ........................................................................................77
7.1.2 Pavement Pulverization ..................................................................................78
7.1.3 Flexible Pavement Rehabilitation Design ........................................................83
7.1.4 Non-Destructive Testing Overview ..................................................................90
7.1.5 Flexible pavement rehabilitation design example .......................................... 108
Engineered Overlays ........................................................................................... 127 Chapter 88.1 ENGINEERED OVERLAYS ON HIGH VS. LOW VOLUME ROADS ........................... 128
8.2 ISOLATION AND LEVELING LIFTS ............................................................................ 129
8.2.1 Isolation Lifts ................................................................................................. 129
8.2.2 PMS Leveling Quantity .................................................................................. 129
8.3 ENGINEERING OVERLAY DESIGN ........................................................................... 130
8.3.1 Determine SNeff from in-situ Destructive Testing ........................................... 132
8.3.2 Determining SNeff from NDT information ....................................................... 137
8.4 STEP #3: DETERMINE FUTURE PAVEMENT STRUCTURAL CAPACITY (SNDGN) ... 138
8.5 STEP #4: DETERMINE ADDITIONAL PAVEMENT STRUCTURE NEEDED (SNOL) ... 139
8.5.1 Completing the Widening Section Design ..................................................... 139
8.5.2 Spreadsheet Solution for Calculating SNeff, SNdgn, and SNol ..................... 140
8.6 STEP #5: SPECIFY CONSTRUCTION METHODS AND MATERIALS ....................... 143
8.7 STEP #6: SEND PAVEMENT DESIGN AND MATERIALS MEMO. ............................. 143
MDT Surfacing Design Guide Table of Contents
January 2015 ii
Gravel Pavement Design ..................................................................................... 145 Chapter 9
New and Reconstructed Rigid Pavement Design ............................................ 147 Chapter 1010.1 CONCRETE PAVEMENT DESIGN DETAILS .............................................................. 147
Rigid Pavement Rehabilitation ......................................................................... 149 Chapter 1111.1 MINOR REHABILITATION: ......................................................................................... 149
11.2 MAJOR REHABILITATION: ......................................................................................... 149
11.3 OTHER REHABILITATION TREATMENTS: ................................................................ 150
Pavement Preservation & Scheduled Treatments ........................................... 151 Chapter 1212.1 PAVEMENT PRESERVATION PROJECTS ................................................................ 151
12.1.1 Surface Treatments....................................................................................... 151
12.1.2 Scheduled Rehabilitation Treatments ............................................................ 153
Bridge End Pavement Design ........................................................................... 159 Chapter 1313.1 THE BRIDGE END PAVEMENT PROBLEM ............................................................... 159
13.2 GENERAL BRIDGE END PAVEMENT DESIGN PROCESS ....................................... 162
13.3 30-YEAR BRIDGE END PAVEMENT DESIGN OVERVIEW ....................................... 165
13.3.1 New Bridge and/ or Road Reconstruction ..................................................... 165
13.3.2 Pavement Major Rehabilitation ..................................................................... 168
13.4 REINFORCED BRIDGE END PAVEMENT DESIGN OVERVIEW ............................... 168
13.4.1 Reinforced Bridge End Pavement Design Example ...................................... 169
13.4.2 Reinforced Bridge End Pavement Designs – Chip Seal Projects .................. 170
13.4.2 Reinforced Bridge End Pavement Designs – Thin Overlay and Minor
Rehabilitation Projects .................................................................................. 170
Pavement Economic Analysis .......................................................................... 173 Chapter 1414.1 INTRODUCTION ......................................................................................................... 173
14.2 PROJECT SELECTION .............................................................................................. 173
14.3 LCCA TERMINOLOGY ............................................................................................... 173
14.3.1 LCCA Process: ............................................................................................. 175
14.3.2 Additional Resources: ................................................................................... 176
Tools for Pavement Analysis ............................................................................ 177 Chapter 15
Works Cited ........................................................................................................ 179 Chapter 16
Appendix A – Sample Traffic Memo ................................................................. 181 Chapter 17
Index ................................................................................................................... 185 Chapter 18

MDT Surfacing Design Guide Chapter 1 Preface
January 2015 1
Preface Chapter 1
Pavement design is a complex process that requires the designer to analyze data and
information from many sources. It is imperative that the designer examine data and design
calculations for reasonableness. The guidance provided within this manual is intended to
reduce subjectivity in the analysis and design process, but not initiate a "cookbook" approach. It
does not nor could it, give inputs for every possible design situation. When the designer varies
from these inputs it is important that the change be noted in the design file. This will allow future
designers to recreate any given pavement design.
There was no attempt to make this surfacing manual a user's guide for the computer design
programs used by the Surfacing Design Unit. There are user's manuals available for that
purpose. Additionally, discussion regarding design theory is left to the reference manuals.
Contacts:
Pavement Analysis Engineer, (406) 444-3424
Pavement Design Engineer, (406) 444-7650
Surfacing Design, (406) 444-7606; (406) 444-6707

MDT Surfacing Design Guide Chapter 1 Preface
January 2015 2
This page intentionally blank.

MDT Surfacing Design Guide Chapter 2 Introduction
January 2015 3
Introduction Chapter 2
Historically, pavement design has been an empirical procedure where engineering judgment
and experience have played an integral part. In 1962 the American Association of State
Highway Officials (AASHO) issued an interim design guide. This Guide presents an empirical
pavement design method based upon the well-known AASHTO road test that took place in the
1950’s in Ottawa, Illinois. Updates to the 1962 Guide are described below.
In 1986 the American Association of State Highway and Transportation Officials (AASHTO)
issued a more comprehensive guide titled AASHTO® Guide for Design of Pavement Structures.
This guide addresses a greater number of design parameters. The idea of mechanistic-
empirical (M-E) design procedures was also introduced at this time. Personal computers began
to replace nomographs in the design procedures and AASHTO introduced DNSP86, a
computerized design procedure to be used in conjunction with the AASHTO® Guide for Design
of Pavement Structures. Some state agencies began incorporating non-destructive testing
(NDT) in to pavement design.
In 1991 AASHTO released a pavement design software package entitled Design Analysis and
Rehabilitation for Windows (DARWin).
A new version of DARWin was released in 1993 along with a revised edition of AASHTO®
Guide for Design of Pavement Structures (1993 Guide (AASHTO, 1993)). MDT currently uses a
pavement design method based upon the 1993 Guide and DARWin software, with adjustments
made based upon MDT’s past experience and pavement materials.
Today, the pavement design industry is slowly migrating to M-E pavement design. AASTHO
has endorsed a software package entitled AASHTO ME Pavement Design (AASHTO M-E).
MDT did a comprehensive study (VonQuitus, 2007) to calibrate the pavement performance
models found within a previous version of AASHTO M-E. Unfortunately, the study did not result
in a reliable M-E design method. In addition, in the summer 2014, MDT’s Surfacing Design Unit
did a thorough comparison of the AASHTO 1993 method vs. MEPDG and came to a similar
conclusion that at this time MDT is not ready to switch to MEPDG. MDT will continue to work
towards utilizing AASHTO M-E or another M-E design method, but for the time being should
continue utilizing this manual for routine pavement designs.

MDT Surfacing Design Guide Chapter 2 Introduction
January 2015 4
This page intentionally blank.
MDT Surfacing Design Guide Chapter 3 Pavement Types
January 2015 5
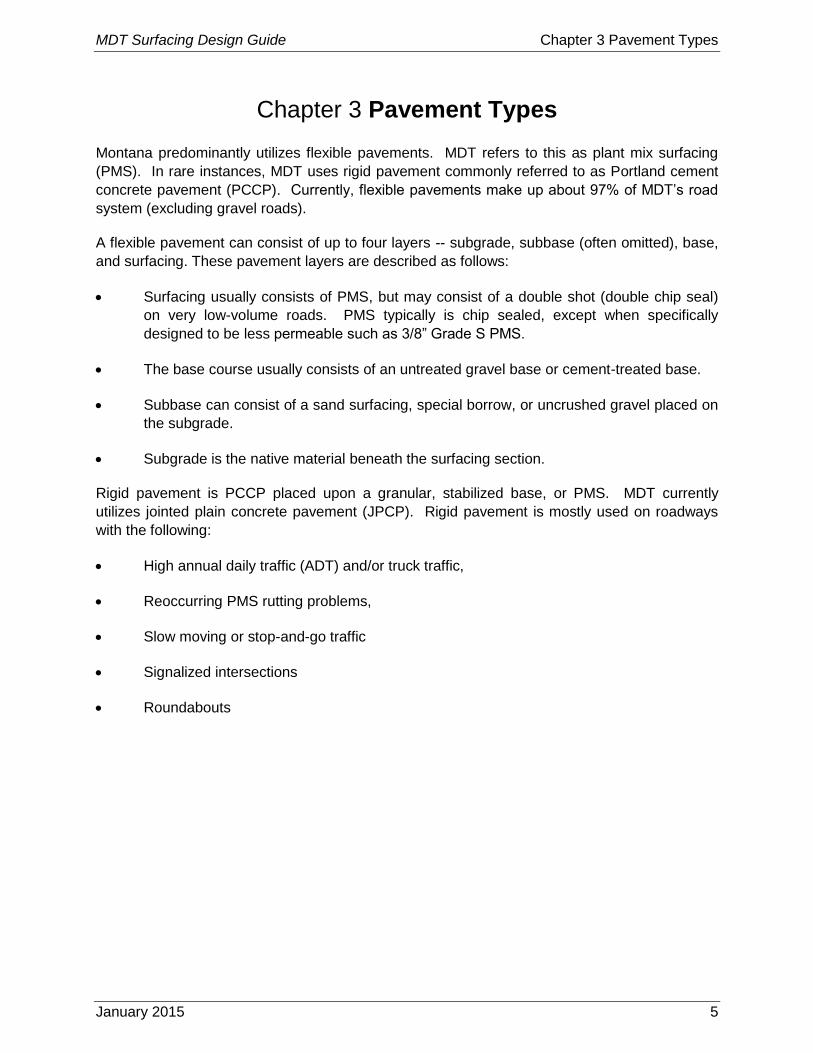
Pavement Types Chapter 3
Montana predominantly utilizes flexible pavements. MDT refers to this as plant mix surfacing
(PMS). In rare instances, MDT uses rigid pavement commonly referred to as Portland cement
concrete pavement (PCCP). Currently, flexible pavements make up about 97% of MDT’s road
system (excluding gravel roads).
A flexible pavement can consist of up to four layers -- subgrade, subbase (often omitted), base,
and surfacing. These pavement layers are described as follows:
Surfacing usually consists of PMS, but may consist of a double shot (double chip seal)
on very low-volume roads. PMS typically is chip sealed, except when specifically
designed to be less permeable such as 3/8” Grade S PMS.
The base course usually consists of an untreated gravel base or cement-treated base.
Subbase can consist of a sand surfacing, special borrow, or uncrushed gravel placed on
the subgrade.
Subgrade is the native material beneath the surfacing section.
Rigid pavement is PCCP placed upon a granular, stabilized base, or PMS. MDT currently
utilizes jointed plain concrete pavement (JPCP). Rigid pavement is mostly used on roadways
with the following:
High annual daily traffic (ADT) and/or truck traffic,
Reoccurring PMS rutting problems,
Slow moving or stop-and-go traffic
Signalized intersections
Roundabouts

MDT Surfacing Design Guide Chapter 3 Pavement Types
January 2015 6
This page intentionally blank.

MDT Surfacing Design Guide Chapter 4 MDT’s Pavement Design Overview
January 2015 7
MDT’s Pavement Design Overview Chapter 4
Effective pavement design is an important element of the overall roadway project design. The
pavement is the portion of the highway most obvious to the motorist. From a project design
perspective, pavement and related items comprise from 10 percent to 90 percent of highway
construction costs. Due to these facts, the designer should not under design pavements, which
may lead to:
Increased user costs (fuel consumption, tires, repair, etc.)
increased accident cost
Increased maintenance costs
Costs of user delays due to reconstruction and maintenance
Cost of early reconstruction.
Pavement Design is both art and science. Precise pavement design and performance
prediction is somewhere between difficult and impossible. The difficulty is due to a number of
variables that are difficult to predict including:
Pavement material properties that change due to climate and over time
Truck traffic prediction over the 20-year design life
Construction and Maintenance practices
Subgrade soil properties
Pavement design should be conservative since the above variables are difficult to predict, but
not overly conservative. The cost of overdesign can be substantial due to the high costs of
pavement materials, and the fact that the costs of overdesign could be better used on another
pavement.
It is believed that MDT’s pavement design method has a practical amount of conservatism
balanced with cost-effectiveness. It has been adjusted over the years to reflect the
improvements made in construction practices, materials, and traffic predictions. But, some level
of conservatism is still used in those items that continue to be hard to predict, such as the
subgrade soil quality.
4.1 DESIGNING WITH THICK PMS LAYER
MDT pavement designs relatively thick PMS layers relative to other state highway agencies.
This reduces the critical tensile stress at the bottom of the PMS layer.
MDT Surfacing Design Guide Chapter 4 MDT’s Pavement Design Overview
January 2015 8
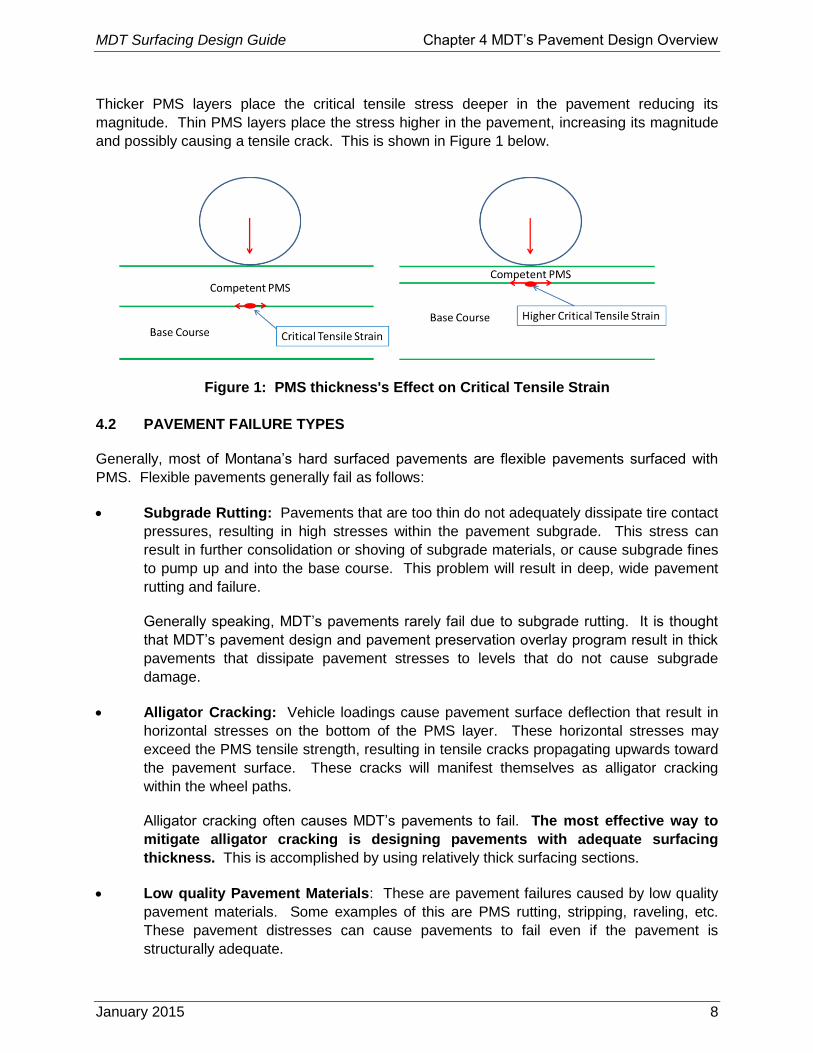
Thicker PMS layers place the critical tensile stress deeper in the pavement reducing its
magnitude. Thin PMS layers place the stress higher in the pavement, increasing its magnitude
and possibly causing a tensile crack. This is shown in Figure 1 below.
Figure 1: PMS thickness's Effect on Critical Tensile Strain
4.2 PAVEMENT FAILURE TYPES
Generally, most of Montana’s hard surfaced pavements are flexible pavements surfaced with
PMS. Flexible pavements generally fail as follows:
Subgrade Rutting: Pavements that are too thin do not adequately dissipate tire contact
pressures, resulting in high stresses within the pavement subgrade. This stress can
result in further consolidation or shoving of subgrade materials, or cause subgrade fines
to pump up and into the base course. This problem will result in deep, wide pavement
rutting and failure.
Generally speaking, MDT’s pavements rarely fail due to subgrade rutting. It is thought
that MDT’s pavement design and pavement preservation overlay program result in thick
pavements that dissipate pavement stresses to levels that do not cause subgrade
damage.
Alligator Cracking: Vehicle loadings cause pavement surface deflection that result in
horizontal stresses on the bottom of the PMS layer. These horizontal stresses may
exceed the PMS tensile strength, resulting in tensile cracks propagating upwards toward
the pavement surface. These cracks will manifest themselves as alligator cracking
within the wheel paths.
Alligator cracking often causes MDT’s pavements to fail. The most effective way to
mitigate alligator cracking is designing pavements with adequate surfacing
thickness. This is accomplished by using relatively thick surfacing sections.
Low quality Pavement Materials: These are pavement failures caused by low quality
pavement materials. Some examples of this are PMS rutting, stripping, raveling, etc.
These pavement distresses can cause pavements to fail even if the pavement is
structurally adequate.
MDT Surfacing Design Guide Chapter 4 MDT’s Pavement Design Overview
January 2015 9
Unfortunately, these problems are often unforeseeable and can be the result of poor
construction processes. The designer can reduce the failures by specifying the correct
pavement materials as discussed in the Manual.
4.3 PAVEMENT OVERLAYS – STAGED CONSTRUCTION
PMS overlays can be used to build thick pavements resistant to alligator cracking. Generally
speaking, an overlay will increase a 20-year pavement design to a 30-year pavement design as
long as the overlay is placed before alligator cracking occurs. A 2nd overlay may result in a
pavement that won’t alligator crack, often referred to as a “perpetual pavement” by the asphalt
industry.
An example of pavements that have become alligator crack resistant through overlays is MDT’s
Interstate system. Most of the Interstate was originally built in the 1960’s and 1970’s with 0.35’
PMS. Throughout the years, these pavements have been overlayed multiple times, and most of
them are still in-service. Currently, many of these pavements are periodically mill and filled to
address rutting or smoothness, but alligator cracking is minimal.
The following guidance will allow the buildup of surfacing thickness through overlays:
Roads should be constructed with enough pavement width to place at least one overlay
upon them.
Overlays should be placed before alligator cracking occurs. PMS overlays placed on
alligator cracked pavement may experience reflective cracking. This may result in
alligator cracking of the PMS overlay in a relatively short time period.

MDT Surfacing Design Guide Chapter 4 MDT’s Pavement Design Overview
January 2015 10
This page intentionally blank.
MDT Surfacing Design Guide Chapter 5 Pavement Design Process
January 2015 11
Pavement Design Process Chapter 5
MDT uses Engineering Project Scheduler (EPS) computer software for project management.
Designers are EPS Functional Managers, and are responsible for updating the status of the
surfacing design activities. Details of EPS are beyond the scope of this manual, however it is
important to outline the designer’s responsibilities in regards to statusing OPX2, ensuring that:
There are no late activities on the critical path
Activities are statused regularly. EPS should be checked and statused no less than
every two weeks.
Do not appear on the Status Compliance Report more than once during a calendar year
with activities unstatused for more than two weeks.
The Surfacing Design EPS activities are:
MDT designed projects:
Activity 600: Prepare Preliminary Surfacing Typical Section
Activity 602: Provide Deflection Data - NDT unit responsible for this Activity
Activity 604: Final Surfacing Sections
Activity 610: Final Surfacing Design Check
Consultant designed MDT projects
Activity 440: Preliminary Geotech & Materials Review
Activity 442: Geotechnical & Materials Report Review
Activity 444: Materials and Geotech Final Review
Activity 602: Provide Deflection Data - NDT unit responsible for this Activity
The following flowcharts and activity descriptions describe the Surfacing Design Unit’s role
within the roadway design process. The flowcharts were developed using the EPS flowcharts
published by the Engineering Division’s Engineering Information Systems Section. The flow
charts can be found on the intranet at the following links:
For in-house projects.
For consultant projects.
MDT Surfacing Design Guide Chapter 5 Pavement Design Process
January 2015 12
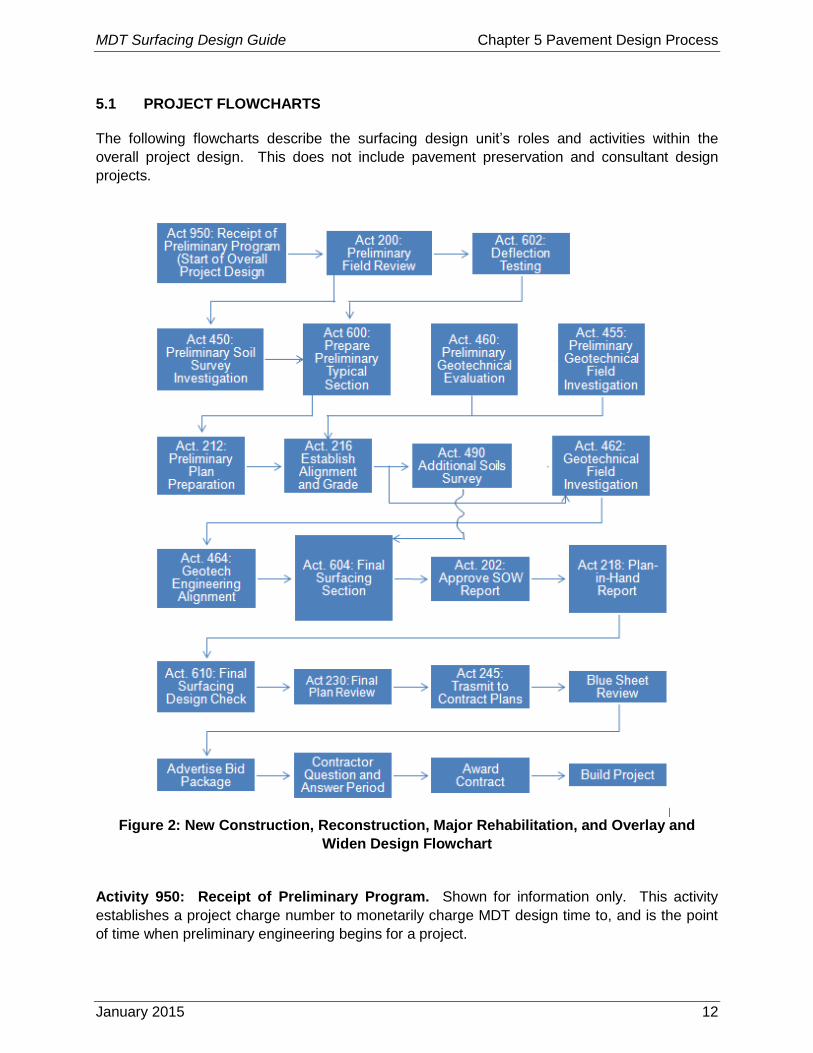
5.1 PROJECT FLOWCHARTS
The following flowcharts describe the surfacing design unit’s roles and activities within the
overall project design. This does not include pavement preservation and consultant design
projects.
Figure 2: New Construction, Reconstruction, Major Rehabilitation, and Overlay and
Widen Design Flowchart
Activity 950: Receipt of Preliminary Program. Shown for information only. This activity
establishes a project charge number to monetarily charge MDT design time to, and is the point
of time when preliminary engineering begins for a project.
MDT Surfacing Design Guide Chapter 5 Pavement Design Process
January 2015 13
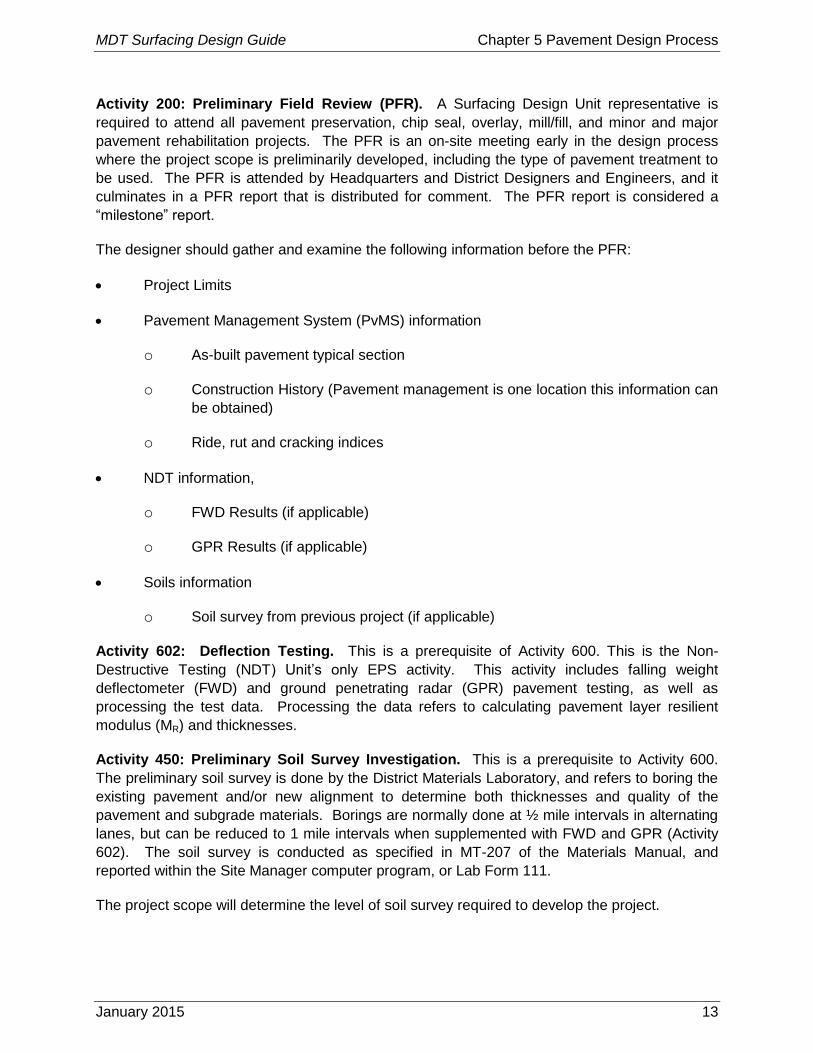
Activity 200: Preliminary Field Review (PFR). A Surfacing Design Unit representative is
required to attend all pavement preservation, chip seal, overlay, mill/fill, and minor and major
pavement rehabilitation projects. The PFR is an on-site meeting early in the design process
where the project scope is preliminarily developed, including the type of pavement treatment to
be used. The PFR is attended by Headquarters and District Designers and Engineers, and it
culminates in a PFR report that is distributed for comment. The PFR report is considered a
“milestone” report.
The designer should gather and examine the following information before the PFR:
Project Limits
Pavement Management System (PvMS) information
o As-built pavement typical section
o Construction History (Pavement management is one location this information can
be obtained)
o Ride, rut and cracking indices
NDT information,
o FWD Results (if applicable)
o GPR Results (if applicable)
Soils information
o Soil survey from previous project (if applicable)
Activity 602: Deflection Testing. This is a prerequisite of Activity 600. This is the Non-
Destructive Testing (NDT) Unit’s only EPS activity. This activity includes falling weight
deflectometer (FWD) and ground penetrating radar (GPR) pavement testing, as well as
processing the test data. Processing the data refers to calculating pavement layer resilient
modulus (MR) and thicknesses.
Activity 450: Preliminary Soil Survey Investigation. This is a prerequisite to Activity 600.
The preliminary soil survey is done by the District Materials Laboratory, and refers to boring the
existing pavement and/or new alignment to determine both thicknesses and quality of the
pavement and subgrade materials. Borings are normally done at ½ mile intervals in alternating
lanes, but can be reduced to 1 mile intervals when supplemented with FWD and GPR (Activity
602). The soil survey is conducted as specified in MT-207 of the Materials Manual, and
reported within the Site Manager computer program, or Lab Form 111.
The project scope will determine the level of soil survey required to develop the project.

MDT Surfacing Design Guide Chapter 5 Pavement Design Process
January 2015 14
If the project is a reconstruct, the soil survey should primarily consist of a subgrade soil
survey. The designer will develop the new typical section based upon the subgrade
results. Any information on the base is useful and composite samples should be
performed on the base gravel.
If the project is a pulverization project, the soil survey should consist of both the
subgrade and base course information.
Activity 600: Prepare Preliminary Typical Section. This is the Surfacing Design Unit’s major
design activity. This activity involves retrieving, organizing, and analyzing information to design
the preliminary pavement section for a given road project. Details of the process are described
throughout this design manual. The conclusion of this activity is sending the preliminary
surfacing memo to both Headquarters and District road design staff.
Activities 455 and 465: Preliminary Geotechnical Evaluation and Field Investigation.
Shown for information only. This information can be requested from the Geotechnical Section
as needed by the Designer to supplement the information provided in Activities 450 and 602.
Activity 212 and 216: Preliminary Plan Preparation and Establish Alignment and Grade.
Shown for information only. The preliminary typical section (Activity 600) is a predecessor for
both of these Road Design activities. The Designer should be aware the effect that Activity 600
has on these activities and the overall project schedule.
Activity 490: Additional Soils Survey. After the roadway alignment and grade have been set
within the Alignment and Grade report, the District Materials Lab may need to retrieve additional
soils and pavement information in locations that weren’t bored during the preliminary soils
survey (Act. 450). The Designer should review the alignment and grade report, and request
additional soil survey as needed for the Final Surfacing Section (Activity 604). Usually, the
preliminary soil survey is adequate for pavement design, and Activity 490 doesn’t occur. Note
that it is the Designer’s responsibility to request additional soils survey when needed.
Activities 462 and 464. Geotechnical Field Investigation and Engineering Alignment.
Shown for information only. The Designer can request this information from the Geotechnical
Section as needed to supplement the information provided in Activities 450, 490, and 602.
Activity 222 and 604. Approve Scope of Work Report and Final Surfacing Section. The
Scope of Work (Act. 214) is a project milestone report where the design scope of a given project
is defined. The report includes the preliminary typical section. Activity 604 consists of the
designer checking the typical section and pavement materials described in the SOW report for
accuracy and completion. When the information is correct, the designer should “card-off” the
activity in OPX2. If revisions are needed, a final surfacing design memo showing the revised
surfacing section is prepared and sent to Headquarters and District Road Design staff.
Activities 218 and 610. Plan-in-Hand Report and Final Surfacing Design Check. The Plan-
in-Hand Report (Act. 218) is a project milestone report where the plans are thoroughly reviewed.
Activity 610 consists of the designer checking the typical section and pavement materials
described in the PIH report for accuracy and completion, especially considering additional

MDT Surfacing Design Guide Chapter 5 Pavement Design Process
January 2015 15
information that became available since the final surfacing design (Act. 604) was completed.
When the information is correct, the designer should “card-off” the activity in OPX2. If revisions
are needed, an e-mail or memo outlining the revisions is prepared and sent to Headquarters
and District Road Design staff.
Activities 230: Final Plan Review. Shown for information only. The final plan review is a mail
/ e-mail distribution of the project plans, specifications, and cost estimate when the overall
design is 90% complete. The distribution should be reviewed for accuracy, but the Designer
should not make comments at this stage unless absolutely necessary and after consulting with
the Materials Engineer. The reason for this is comments and/or changes made to the plans at
this point may delay project delivery.
Activity 245 and Blue Sheet Review. Shown for information only. Preconstruction submits
the bid package to contract plans three months before it is scheduled to be released to
Contractors for bidding. During the three months, the last project review occurs when the
Contract Plans distributes “blue sheet” bid package which is literally the bid package printed on
blue paper. The distribution should be reviewed for accuracy, but the Designer should not make
comments at this stage unless absolutely necessary and after consulting with the Materials
Engineer. The reason for this is comments and/or changes made to the plans at this point may
delay project delivery.
Advertise Bid Package, Contractor Question and Answer Period, and Award Contract.
Shown for information only. When the project is advertised for award (or “letting”) there is a
question and answer (Q&A) period where Contractors can ask questions regarding the bid
package. The Q&A may result in changes to the bid package. Surfacing Design routinely is
involved in answering or advising on questions submitted during the Q&A period. In the event a
contractor contacts the designer directly with questions, they need to be directed to submit their
questions through the Q/A system for a response. This allows all potential bidders to have the
same information.
Build Project. Shown for information only. During construction, surfacing design routinely is
called upon to advise regarding surfacing sections and materials. Time devoted to this should
be billed to the projects 9402 account with no activity number. Work done on projects under
construction should be done quickly and take priority since construction delays are costly to
both MDT and Contractors.
5.2 PAVEMENT PRESERVATION FLOWCHART
Pavement Preservation projects are pavement treatments meant to preserve pavements that
are in good condition. It is the intent of MDT to nominate, design, and let these projects in less
than 2 years in order to build the project with the appropriate scope before the pavement
deteriorates into a poorer condition and may no longer be a pavement preservation candidate.
The project is developed as shown in the flow chart and activities below. Surfacing Design
normally gets involved in these projects starting with the preliminary field review.
MDT Surfacing Design Guide Chapter 5 Pavement Design Process
January 2015 16
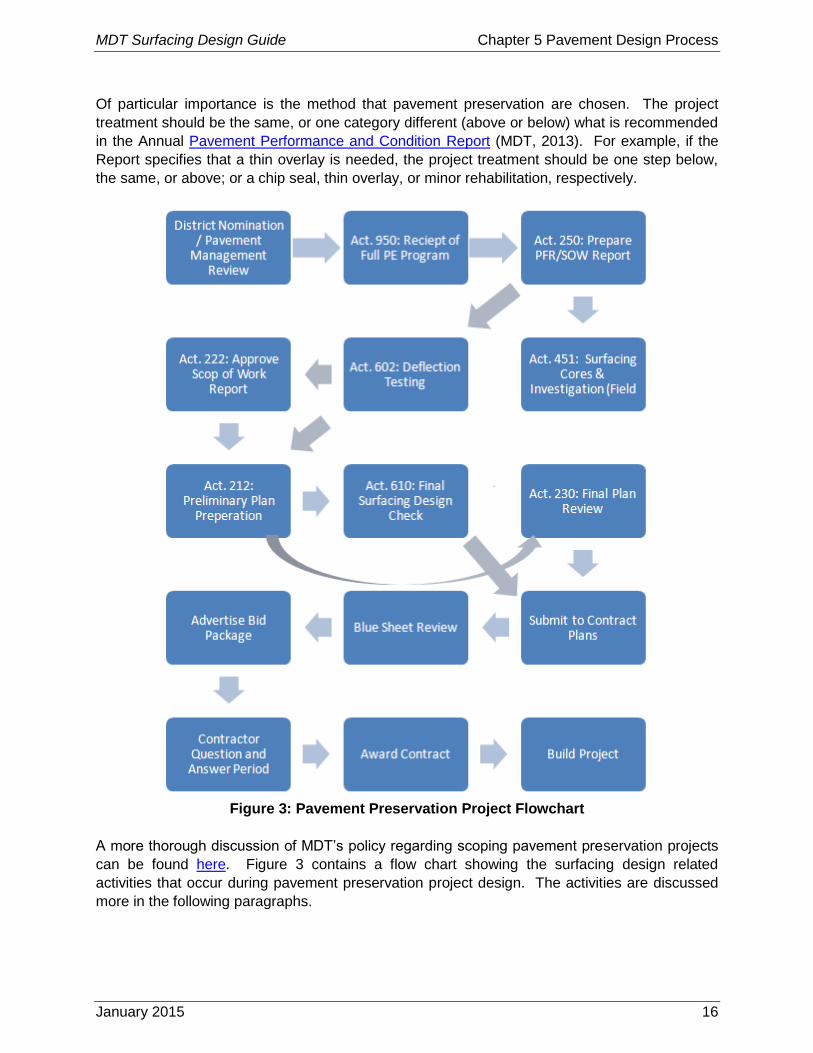
Of particular importance is the method that pavement preservation are chosen. The project
treatment should be the same, or one category different (above or below) what is recommended
in the Annual Pavement Performance and Condition Report (MDT, 2013). For example, if the
Report specifies that a thin overlay is needed, the project treatment should be one step below,
the same, or above; or a chip seal, thin overlay, or minor rehabilitation, respectively.
Figure 3: Pavement Preservation Project Flowchart
A more thorough discussion of MDT’s policy regarding scoping pavement preservation projects
can be found here. Figure 3 contains a flow chart showing the surfacing design related
activities that occur during pavement preservation project design. The activities are discussed
more in the following paragraphs.
MDT Surfacing Design Guide Chapter 5 Pavement Design Process
January 2015 17
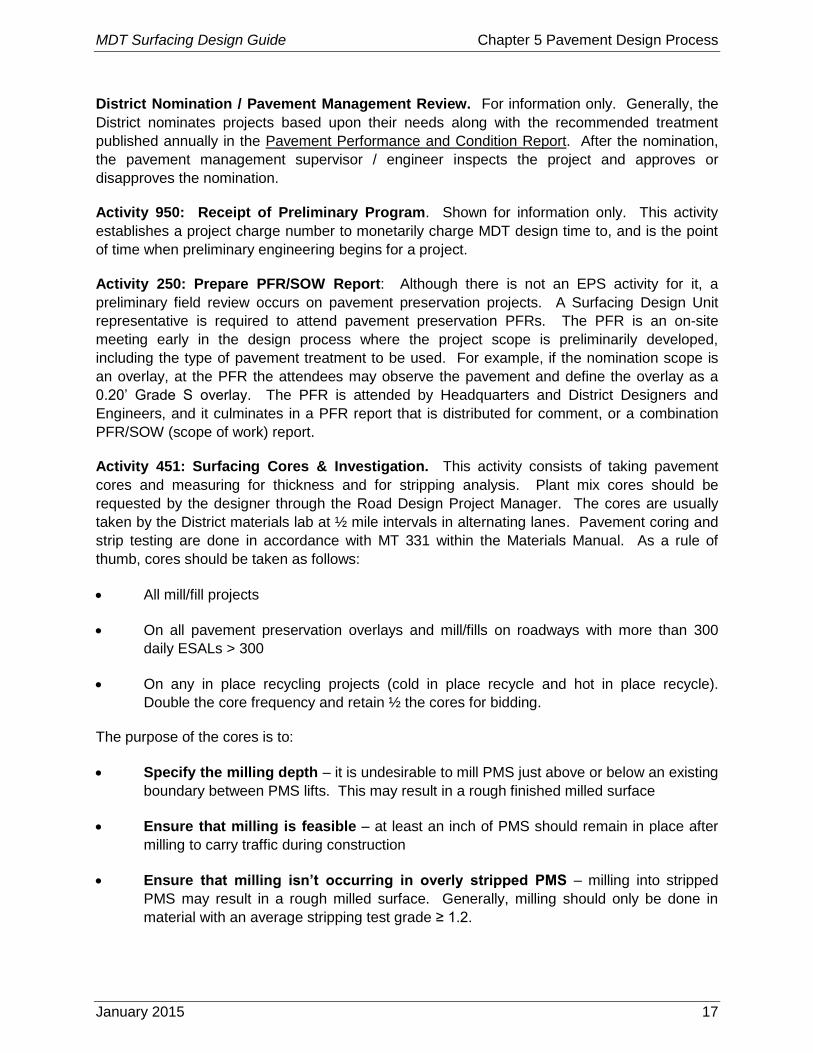
District Nomination / Pavement Management Review. For information only. Generally, the
District nominates projects based upon their needs along with the recommended treatment
published annually in the Pavement Performance and Condition Report. After the nomination,
the pavement management supervisor / engineer inspects the project and approves or
disapproves the nomination.
Activity 950: Receipt of Preliminary Program. Shown for information only. This activity
establishes a project charge number to monetarily charge MDT design time to, and is the point
of time when preliminary engineering begins for a project.
Activity 250: Prepare PFR/SOW Report: Although there is not an EPS activity for it, a
preliminary field review occurs on pavement preservation projects. A Surfacing Design Unit
representative is required to attend pavement preservation PFRs. The PFR is an on-site
meeting early in the design process where the project scope is preliminarily developed,
including the type of pavement treatment to be used. For example, if the nomination scope is
an overlay, at the PFR the attendees may observe the pavement and define the overlay as a
0.20’ Grade S overlay. The PFR is attended by Headquarters and District Designers and
Engineers, and it culminates in a PFR report that is distributed for comment, or a combination
PFR/SOW (scope of work) report.
Activity 451: Surfacing Cores & Investigation. This activity consists of taking pavement
cores and measuring for thickness and for stripping analysis. Plant mix cores should be
requested by the designer through the Road Design Project Manager. The cores are usually
taken by the District materials lab at ½ mile intervals in alternating lanes. Pavement coring and
strip testing are done in accordance with MT 331 within the Materials Manual. As a rule of
thumb, cores should be taken as follows:
All mill/fill projects
On all pavement preservation overlays and mill/fills on roadways with more than 300
daily ESALs > 300
On any in place recycling projects (cold in place recycle and hot in place recycle).
Double the core frequency and retain ½ the cores for bidding.
The purpose of the cores is to:
Specify the milling depth – it is undesirable to mill PMS just above or below an existing
boundary between PMS lifts. This may result in a rough finished milled surface
Ensure that milling is feasible – at least an inch of PMS should remain in place after
milling to carry traffic during construction
Ensure that milling isn’t occurring in overly stripped PMS – milling into stripped
PMS may result in a rough milled surface. Generally, milling should only be done in
material with an average stripping test grade ≥ 1.2.

MDT Surfacing Design Guide Chapter 5 Pavement Design Process
January 2015 18
Ensure that an overlay isn’t being placed directly on overly stripped PMS – placing
PMS overlays on stripped plant mix (stripping grade less than or equal to 1) is not
recommended. The underlying PMS may not have adequate strength to support the
new overlay. This may not hold true on very low volume roads where overlaying
stripped plant mix may be possible due to low truck loading.
Allow the recycling contractor to obtain information on existing pavement -
including aggregate size, fracture and oil content. A mix design can also be performed
using cores.
Activity 602: Deflection Testing. Often, this activity is only done on mill/fill projects to
determine the in-place PMS thickness for specifying milling depths. For pavement preservation
projects, FWD data is usually not needed since by definition the pavement should be in good
condition.
5.3 CONSULTANT DESIGN PROJECT FLOWCHART
Often, MDT contracts with engineering consultants to design and prepare bid packages for MDT
projects. On these projects, a consultant design engineer administers the project and acts as a
liaison between MDT and the consultant. That being the case, all project communication
with the consultant must be done through the consultant design engineer responsible for
the project.
On these projects, surfacing design’s duty does not include design work, but rather reviewing
the consultant’s pavement reports, calculations, plans and specifications to ensure that they are
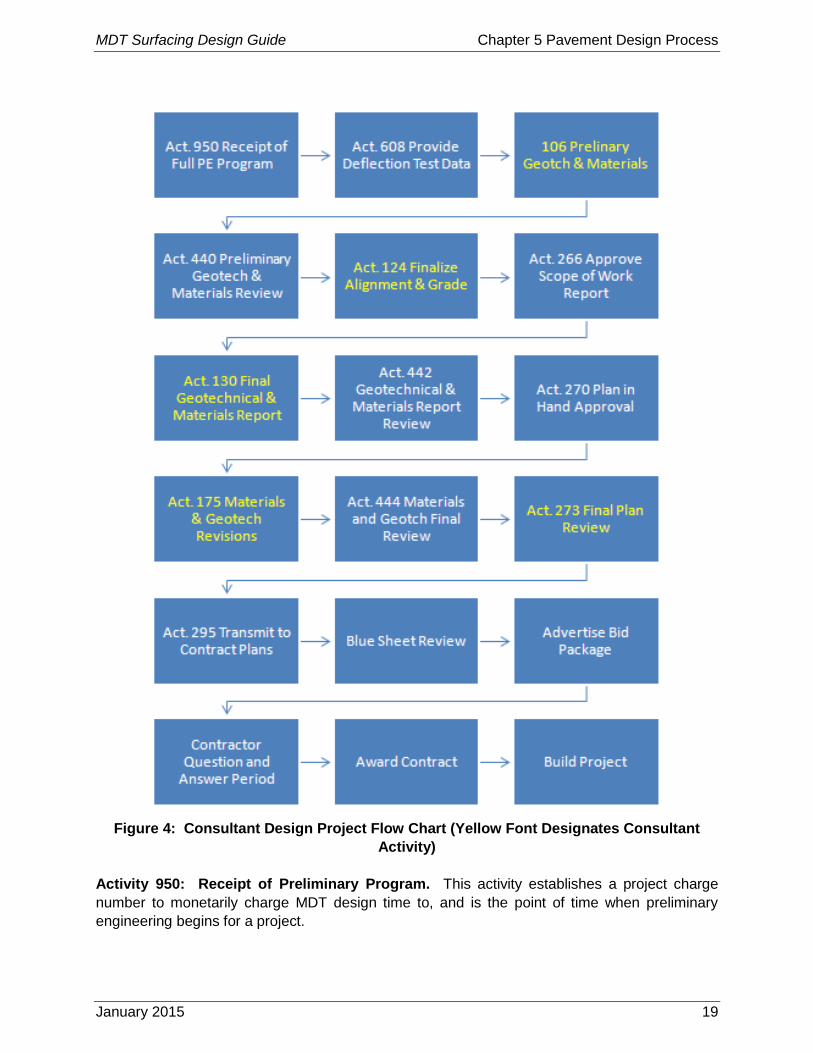
designed and specified in accordance with MDT policies and procedures. Figure 4 contains a
flow chart showing the consultant activities integrate with MDT pavement design activities.
Consultant Design EPS activities of direct interest to Surfacing Design include:
Activity 440: Preliminary Geotech & Materials Review
Activity 442: Geotechnical & Materials Report Review
Activity 444: Materials and Geotech Final Review
Activity 608: Provide Deflection Test Data – NDT Unit responsible for this Activity
MDT Surfacing Design Guide Chapter 5 Pavement Design Process
January 2015 19
Figure 4: Consultant Design Project Flow Chart (Yellow Font Designates Consultant
Activity)
Activity 950: Receipt of Preliminary Program. This activity establishes a project charge
number to monetarily charge MDT design time to, and is the point of time when preliminary
engineering begins for a project.

MDT Surfacing Design Guide Chapter 5 Pavement Design Process
January 2015 20
Activity 440: Preliminary Geotech & Materials Review. The design consultant completes
this activity. This activity includes:
Preliminary Soil Survey Investigation
Borrow Pit Investigation
Surfacing Pit Investigation
Prepare Preliminary Surfacing Typical Sections
Deflection Analysis
Preliminary Geotechnical Evaluation
Activity 106: Preliminary Geotech & Materials. This refers to MDT’s review of the Activity
440 report for accuracy and completion. The surfacing design unit reviews the pavement
related portion of the report including the soil survey investigation, preliminary surfacing typical
sections, and the deflection analysis. Comments on the report should be sent via email to the
District, Materials Bureau, and the Consultant Design Project Manager.
Activities 124 and 266: Finalize Alignment & Grade and Approve Scope of Work Report.
For information only. Defines the project scope.
Activity 130. Final Geotechnical & Materials Report. The design consultant completes this
activity including:
Prepare Final Surfacing Sections
Primary Soils Survey
Geotechnical Surveys and Field Investigation
Geotechnical Engineering – Alignment
Activity 442: Preliminary Geotech & Materials. This refers to MDT’s review of the Act. 130
report for accuracy and completion. The surfacing design unit reviews the pavement related
portion of the report including the final surfacing sections and primary soils survey. Comments
on the report should be sent via email to the District, Materials Bureau, and the Consultant
Design Project Manager.
Act. 273: Final Plan Review. Shown for information only. The final plan review is a mail / e-
mail distribution of the project plans, specifications, and cost estimate when the design is
approximately 90% complete. The distribution should be reviewed for accuracy, but the
Designer should not make comments at this stage that significantly alters the design unless
absolutely necessary and after consulting with the Materials Engineer. The reason for this is
comments and/or changes made to the plans at this point may delay project delivery.
MDT Surfacing Design Guide Chapter 5 Pavement Design Process
January 2015 21
Activity 444: Materials and Geotech Final Review This activity serves as consultation for
finalizing any changes for final plan review.
Activity 608: Provide Deflection Test Data: The NDT unit is responsible for this activity.
Upon request, the NDT unit will provide FWD and GPR data to the design consultant. It should
be noted project level NDT data can only be collected when weather permits during spring and
fall.
5.4 DESIGN MEMOS
The surfacing designer should be aware of the Design Memos posted here:
Design memos provide additional guidance and take precedence over what is printed in the
Road Design Manual and the Surfacing Design Guide.
The surfacing designer should also be aware of the Construction Memos posted here.
Construction Memos provide guidance on topics such as chip seals and subgrade sampling.

MDT Surfacing Design Guide Chapter 5 Pavement Design Process
January 2015 22
This page intentionally blank.
MDT Surfacing Design Guide Chapter 6 New and Reconstructed Pavements
January 2015 23
New and Reconstructed Pavements Chapter 6
The design method outlined within this section assumes that the existing road will not be used
in-place as part of the new pavement. This includes both new and reconstructed pavements
defined as follows:
NEW PAVEMENT - A new pavement is a pavement structure that is placed on a
previously undisturbed subgrade. It applies to a highway on a new alignment, or to the
new part of a widened highway. Often, these projects are needed to update old
roadways to new geometric standards.
RECONSTRUCTED PAVEMENT - A reconstructed pavement refers to completely
removing an existing pavement structure replacing it with a new pavement structure.
This type of work is needed when the existing pavement is in a weakened condition that
cannot be salvaged. Also, these projects are often needed to update old roadways to
new geometric standards.
MDT’s flexible pavement design method is based upon the 1993 AASHTO Guide for the Design
of Pavement Structures (1993 Guide) (AASHTO, 1993). MDT has incorporated several
modifications to the 1993 Guide to reflect specific Montana conditions and past experience.
6.1 GENERAL CHARACTERISTICS OF MDT PAVEMENTS
The following figures show typical sections from a sample of MDT road plans. In all instances,
note that the PMS, base course, and special borrow are uniform thickness across the entire
pavement (i.e. the shoulders are not built thinner).
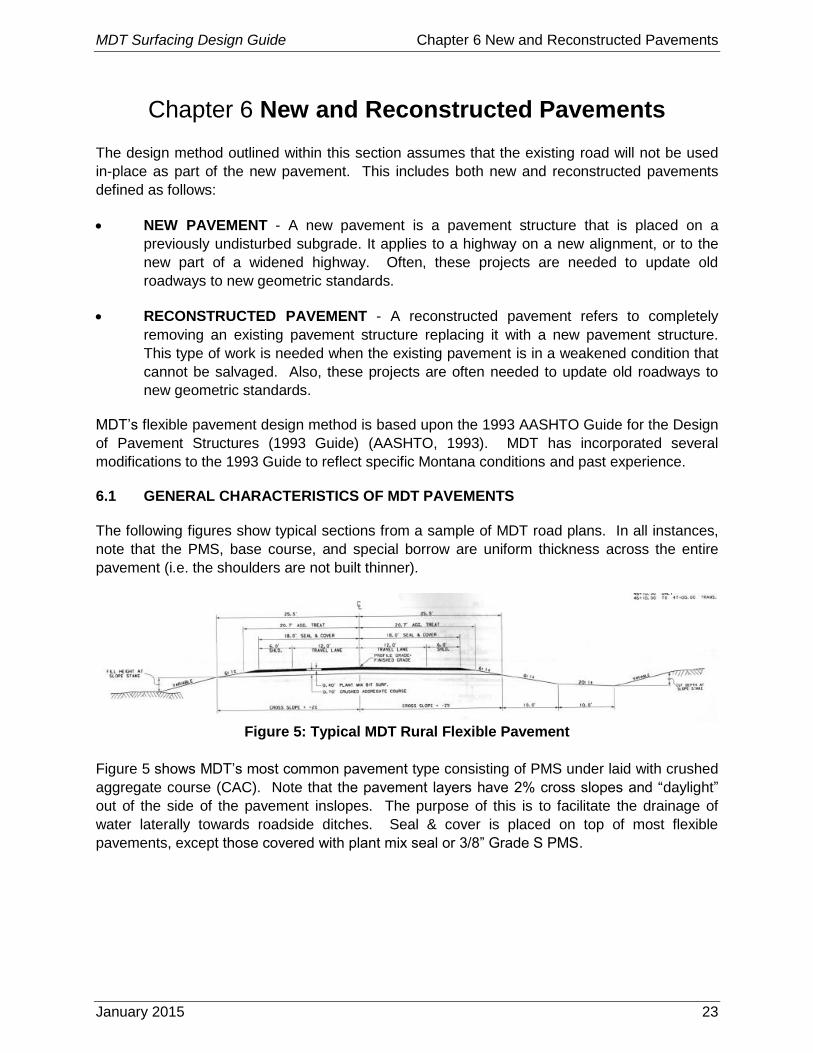
Figure 5: Typical MDT Rural Flexible Pavement
Figure 5 shows MDT’s most common pavement type consisting of PMS under laid with crushed
aggregate course (CAC). Note that the pavement layers have 2% cross slopes and “daylight”
out of the side of the pavement inslopes. The purpose of this is to facilitate the drainage of
water laterally towards roadside ditches. Seal & cover is placed on top of most flexible
pavements, except those covered with plant mix seal or 3/8” Grade S PMS.

MDT Surfacing Design Guide Chapter 6 New and Reconstructed Pavements
January 2015 24
Figure 6: Typical Urban Flexible Pavement
Figure 6 shows the most common urban pavement. Note the urban pavement layers do not
“daylight”. Edge drains may be used to facilitate drainage depending on soil characteristics.
Figure 7: Typical Flexible Pavement with Special Borrow
Figure 7 shows a pavement with a standard 2’ layer of special borrow beneath it. Special
borrow is often used to decrease CAC thickness or to “bridge” soft subgrades. It usually
consists of pit-run gravel, but may consist of other granular materials in gravel-poor areas.
Special borrow pavements are designed using the resilient modulus (MR) of the special
borrow when a minimum of 2 feet of special borrow is used. Typically it is assumed up
to five feet of the underlying subgrade will influence the MR of the special borrow. Care
should be taken to select an appropriate (MR) which accounts for the stiffness of the
underlying subgrade.
Figure 8: Typical Cement Treated Base CTB Pavement
Figure 8 shows MDT’s standard cement treated base (CTB) pavement section. CTB is often
used in areas where gravel is scarce. CTB pavements are designed similarly to CAC
pavements. Note that the CTB section extends 1’ beneath the adjacent shoulders, and
CAC is beneath the shoulders. This practice is based strictly on economics since CAC is less
expensive than CTB.
MDT Surfacing Design Guide Chapter 6 New and Reconstructed Pavements
January 2015 25
6.2 FLEXIBLE PAVEMENT DESIGN METHOD
MDT pavement design uses the structural number (SN) approach presented in the 1993
AASHTO Guide. The SN is an abstract number that expresses pavement structural strength
required for given combinations of soil support (MR) and total traffic expressed in ESALs.
Flexible pavement design process consists of the following steps:
Step #1. Determine design inputs to calculate structural number (SNReq’d)
Step #2. Calculate SNReq’d
Step #3. Design a pavement structure with SNdes >= SNreq’d
Step #4. Specify pavement materials
Step #5. Send pavement design and materials memo
6.2.1 Step #1: Determine Pavement Design Inputs
Most of the work involved in pavement design involves determining the inputs needed to
calculate the SNReq’d including:
Total 18-kip ESALs Over Pavement Design Life
Initial Serviceability (po = 4.2)
Terminal Serviceability (pt = 2.5)
Reliability Level (varies by route type)
Overall Standard Deviation (S.D. = 0.45)
Roadbed Soil Resilient Modulus (from R-Value and FWD testing)
Number of Construction Stages (1)
These inputs are discussed in detail within the following sections.
Traffic
Highway traffic is a combination of many vehicle types, all having different gross weights and
axle configurations. To simplify the variety of loadings for pavement design, vehicle loadings
are converted to 18-kip equivalent single axle loadings (ESAL). The process of collecting traffic
data and converting it to ESAL's is complex and the 1993 Guide presents this in more detail.
It is important to accurately characterize traffic loading for pavement design. Small errors
carried through the project design life can produce unexpected results, such as under design
and premature failure or overdesign and unnecessary expense.
For pavement design, traffic information is provided by the Traffic Data Unit within the Planning
Division. Traffic information is usually requested by the road design project manager after the

MDT Surfacing Design Guide Chapter 6 New and Reconstructed Pavements
January 2015 26
preliminary field review, and the pavement designer is copied on this traffic information. The
pavement designer can also contact the Traffic Data Unit directly to request traffic information.
A sample copy of a traffic report is included in Appendix A.
Annual traffic counts are available on an interactive map found on MDT’s website.
http://www.mdt.mt.gov/publications/maps.shtml
Flexible pavement design life is 20-years unless specified otherwise by the District. 20-year
traffic information is provided by the Traffic Data Unit by default. For designs with other than 20-
year design lives, a note should be placed in the project file explaining why another design life
length was used.
The design input for pavement design is the total ESALs during the pavement design life. An
example of how to calculate this follows.
Example Problem: Calculating Design Life ESAL loading The traffic memo in Appendix A states that the EAL (ESAL) = 23. The EAL is the
average daily ESAL loading during the 20-year design life. In this case the total ESALs
during the 20-year design life is calculated as follows:
Design Life ESALs = Daily ESALs * Design Life (years) * 365 days per year
= 23 ESALs per day * 20 years * 365 days per year
= 167,900 ESALs over the 20 year design life
Estimating Traffic – Special Cases
Pavements are often designed in areas where the Traffic Data Unit’s traffic estimates are
unavailable or unable to capture future traffic generators. Some examples of this are Interstate
rest areas, energy sectors such as the Bakken oil patch and commodity haul routes near grain
elevators. For these situations, the designer should work with the District Traffic Engineer and
estimate the daily ESAL’s. For special situations such as the Bakken, a report outlining traffic
impacts may be available.
Agricultural commodities are a large industry, and a generator of heavy trucks during harvest
times. Traffic data may not include commodity hauls in their traffic estimates since traffic counts
may have not been done during harvest time. On roadways with commodity hauls, the designer
should estimate the increased daily ESALs due to commodity hauls, and add those ESALs to
the Daily ESALs provided by the Traffic Data Unit. This is discussed further in the following
sections.
Rest Areas
Use the following equation to estimate ESALs for rest area pavements, including approaches
and entrance and exit ramps:
Adjacent Mainline Pavement ESALs * 0.25 = Rest Area ESALs
MDT Surfacing Design Guide Chapter 6 New and Reconstructed Pavements
January 2015 27
For example, for an interstate pavement with 600 daily ESALs, use 150 ESALs for rest area
pavement design.
Sugar Beet Truck Routes
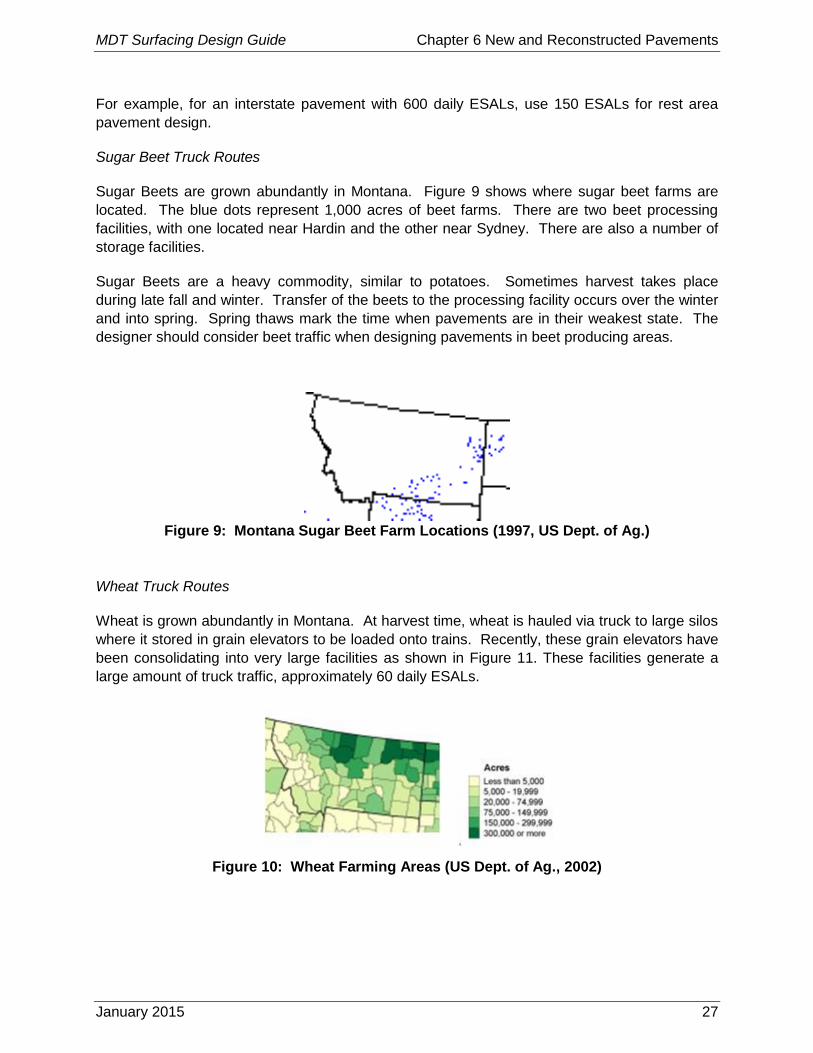
Sugar Beets are grown abundantly in Montana. Figure 9 shows where sugar beet farms are
located. The blue dots represent 1,000 acres of beet farms. There are two beet processing
facilities, with one located near Hardin and the other near Sydney. There are also a number of
storage facilities.
Sugar Beets are a heavy commodity, similar to potatoes. Sometimes harvest takes place
during late fall and winter. Transfer of the beets to the processing facility occurs over the winter
and into spring. Spring thaws mark the time when pavements are in their weakest state. The
designer should consider beet traffic when designing pavements in beet producing areas.
Figure 9: Montana Sugar Beet Farm Locations (1997, US Dept. of Ag.)
Wheat Truck Routes
Wheat is grown abundantly in Montana. At harvest time, wheat is hauled via truck to large silos
where it stored in grain elevators to be loaded onto trains. Recently, these grain elevators have
been consolidating into very large facilities as shown in Figure 11. These facilities generate a
large amount of truck traffic, approximately 60 daily ESALs.
Figure 10: Wheat Farming Areas (US Dept. of Ag., 2002)

MDT Surfacing Design Guide Chapter 6 New and Reconstructed Pavements
January 2015 28
\
Figure 11: Modern Large Grain Elevator
Oil Production and Exploration
There are a number of areas in Montana with oil and gas reserves, but the area where
pavements are most currently affected is within the Bakken formation in Northeastern Montana.
Truck traffic has increased tremendously within the Bakken within the past 4-5 years and is
expected to increase further in the coming years. Designers should consider recommendations
in Table 1 when designing pavements within the Bakken Area. The UGPTI traffic predictions
are located here.
The surfacing design unit can provide calculated design ESALs for consultant design projects.
The report does not provide specific ESAL estimates.
Table 1 Bakken Area Pavement Design Recommendations
Project Type Recommendation
Pavement Preservation
Utilize the Traffic Data Unit’s traffic predictions for pavement
design. Do not use UGPTI Traffic Predictions. Consider adding
pavement structure utilizing thicker or stronger pavement
treatments while still working with pavement preservation
guidelines as outlined in the joint agreement.
Minor Rehabilitation 10-year design life using 20-rig UGPTI Traffic Predictions
Major Rehabilitation, Reconstruction
and New Construction
20 year design life using 20-rig UGPTI Traffic Predictions
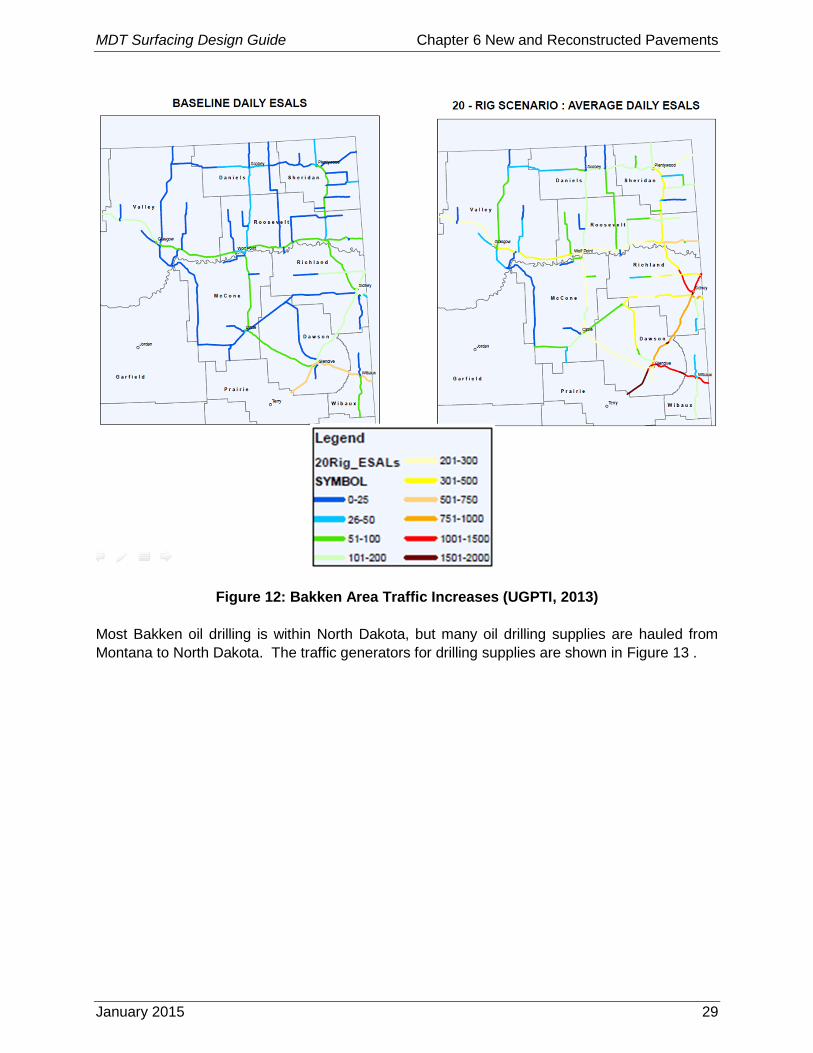
Research to predict future traffic growth within the Bakken has been completed (UGPTI, 2013)
and an overview of these predictions is shown in Figure 12. The reference to “20-Rig Scenario”
within Figure 12 refers to 20 oil drilling rigs operating continuously within Montana. The 20-rig
assumption is thought to be reasonable, and should be utilized for pavement design. Impacts
have been seen in surrounding counties not included in the report and as such, care should be
taken when estimating ESALs.
MDT Surfacing Design Guide Chapter 6 New and Reconstructed Pavements
January 2015 29
Figure 12: Bakken Area Traffic Increases (UGPTI, 2013)
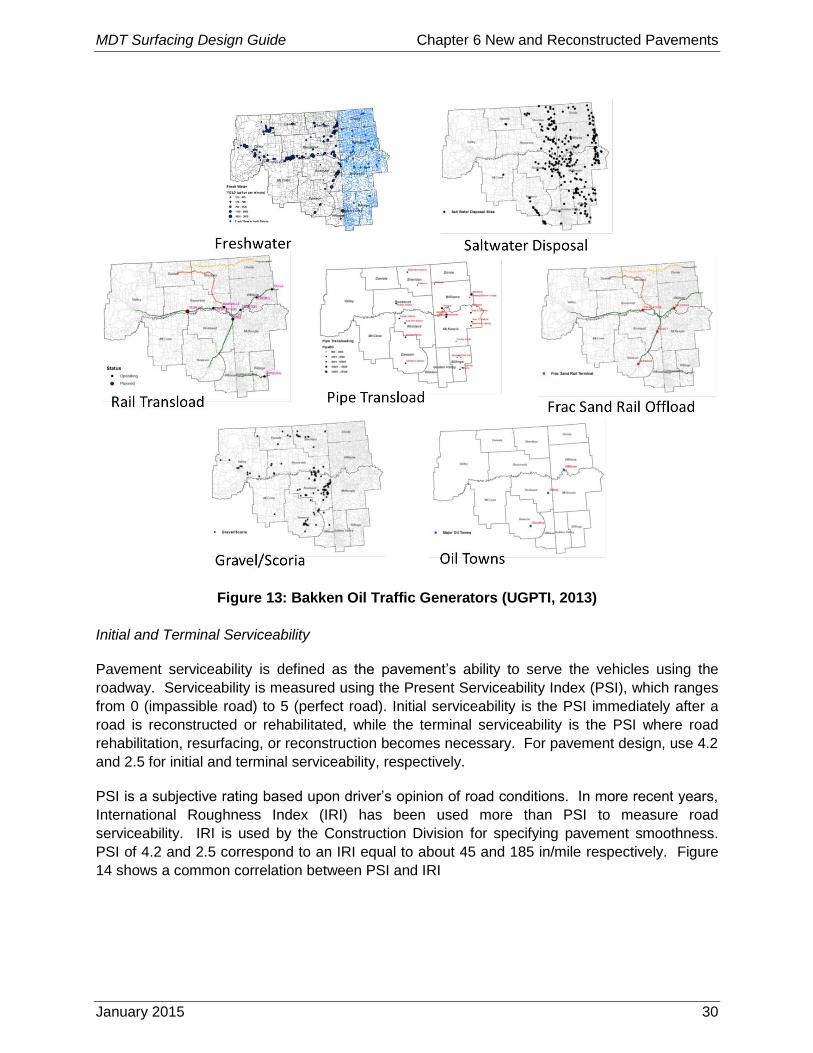
Most Bakken oil drilling is within North Dakota, but many oil drilling supplies are hauled from
Montana to North Dakota. The traffic generators for drilling supplies are shown in Figure 13 .
MDT Surfacing Design Guide Chapter 6 New and Reconstructed Pavements
January 2015 30
Figure 13: Bakken Oil Traffic Generators (UGPTI, 2013)
Initial and Terminal Serviceability
Pavement serviceability is defined as the pavement’s ability to serve the vehicles using the
roadway. Serviceability is measured using the Present Serviceability Index (PSI), which ranges
from 0 (impassible road) to 5 (perfect road). Initial serviceability is the PSI immediately after a
road is reconstructed or rehabilitated, while the terminal serviceability is the PSI where road
rehabilitation, resurfacing, or reconstruction becomes necessary. For pavement design, use 4.2
and 2.5 for initial and terminal serviceability, respectively.
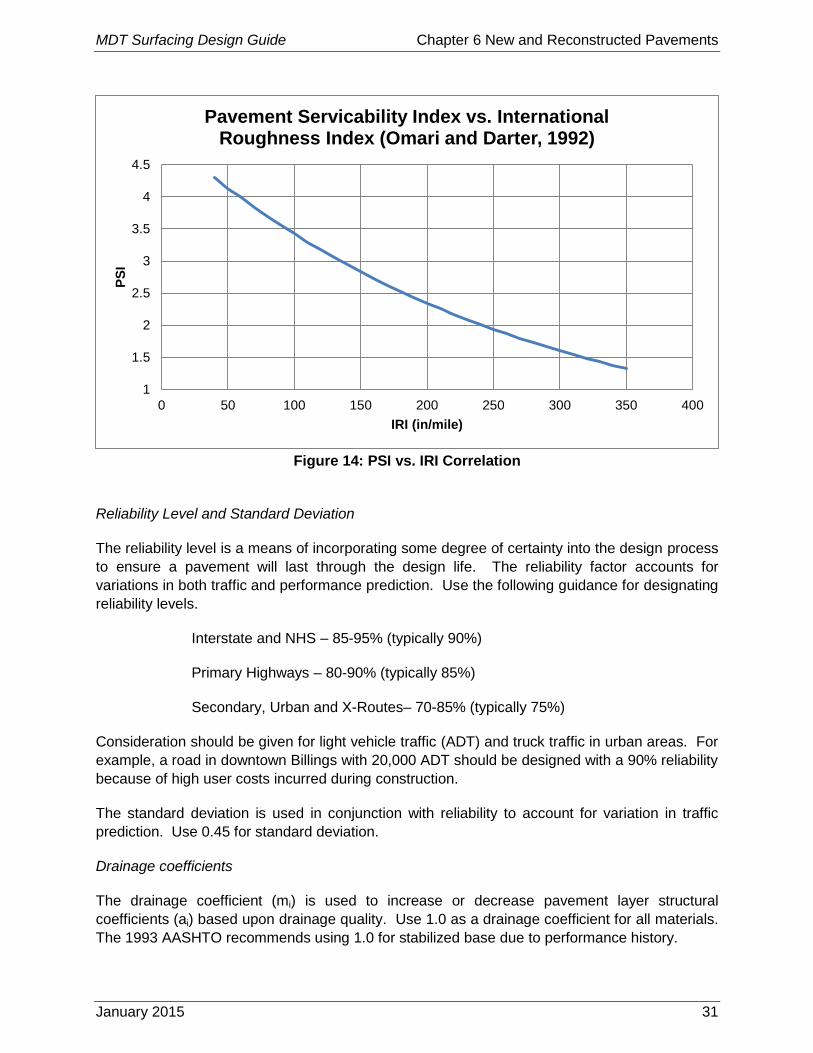
PSI is a subjective rating based upon driver’s opinion of road conditions. In more recent years,
International Roughness Index (IRI) has been used more than PSI to measure road
serviceability. IRI is used by the Construction Division for specifying pavement smoothness.
PSI of 4.2 and 2.5 correspond to an IRI equal to about 45 and 185 in/mile respectively. Figure
14 shows a common correlation between PSI and IRI
MDT Surfacing Design Guide Chapter 6 New and Reconstructed Pavements
January 2015 31
Figure 14: PSI vs. IRI Correlation
Reliability Level and Standard Deviation
The reliability level is a means of incorporating some degree of certainty into the design process
to ensure a pavement will last through the design life. The reliability factor accounts for
variations in both traffic and performance prediction. Use the following guidance for designating
reliability levels.
Interstate and NHS – 85-95% (typically 90%)
Primary Highways – 80-90% (typically 85%)
Secondary, Urban and X-Routes– 70-85% (typically 75%)
Consideration should be given for light vehicle traffic (ADT) and truck traffic in urban areas. For
example, a road in downtown Billings with 20,000 ADT should be designed with a 90% reliability
because of high user costs incurred during construction.
The standard deviation is used in conjunction with reliability to account for variation in traffic
prediction. Use 0.45 for standard deviation.
Drainage coefficients
The drainage coefficient (mi) is used to increase or decrease pavement layer structural
coefficients (ai) based upon drainage quality. Use 1.0 as a drainage coefficient for all materials.
The 1993 AASHTO recommends using 1.0 for stabilized base due to performance history.
1
1.5
2
2.5
3
3.5
4
4.5
0 50 100 150 200 250 300 350 400
PS
I
IRI (in/mile)
Pavement Servicability Index vs. International Roughness Index (Omari and Darter, 1992)
MDT Surfacing Design Guide Chapter 6 New and Reconstructed Pavements
January 2015 32
Number of Construction Stages
The number of construction stages is required when using the DARWin software. Assume one
Construction Stage for all projects.
One Direction Width
The directional width is required when using the DARWin software. Assume 12 feet for all
designs.
Subgrade Resilient Modulus
Resilient Modulus (MR) is a fundamental material property used to characterize unbound
pavement materials. It is a measure of material stiffness and provides a means to analyze
stiffness under different conditions, such as moisture, density and stress level. With the
laboratory, MR is determined using the triaxial test. The test applies a repeated axial cyclic
stress of fixed magnitude, load duration and cycle duration to a cylindrical test specimen. While
the specimen is subjected to this dynamic cyclic stress, it is also subjected to a static confining
stress provided by a triaxial pressure chamber. It is essentially a cyclic version of a triaxial
compression test; the cyclic load application is thought to more accurately simulate actual traffic
loading. MR is defined as a ratio of applied axle deviator stress and axial recoverable strain.
MDT does not do triaxial testing at this time.
Pavement sections are designed based upon the subgrade resilient modulus of:
the top five feet of the subgrade directly beneath the surfacing section in the
case of pavements without special borrow or,
the special borrow with consideration of subgrade stiffness in the case of
pavements under laid with two or more feet of special borrow.
MDT utilizes R-Value testing and FWD back-calculation to estimate MR as detailed later in this
section. MDT uses the lesser value of the 85th percentile R-Value and results of FWD test
results during spring thaw conditions.
It should be noted that the R-Value test utilizes disturbed specimens while FWD measures
undisturbed stiffness. Standard Penetration Test (SPT) blow counts can be used to compare
Resilient Modulus (MR) values based on R-Value, soils class and FWD.
MR varies over the course of a year, lowering and increasing dramatically during the spring thaw
(saturation) and winter freeze, respectively. This change is more pronounced in clay and silts
and less so with sand and gravels. For example, the MR of clay can dip as low as 3,000 psi in
the spring and up to 20,000 psi in the winter. Figure 15 illustrates this phenomenon. To
account for this variation, the 1993 Guide recommends using an average annual MR.
MDT does not use an average annual MR. Instead, MDT utilizes MR based on spring thaw
(worst case) conditions for pavement design. This is a conservative practice but believed to

MDT Surfacing Design Guide Chapter 6 New and Reconstructed Pavements
January 2015 33
work since it is difficult to determine the subgrade type, compaction, and loading conditions that
will occur during construction.
For these reasons MDT has used the spring thaw MR for pavement design for a long time, and
field performance including lack of subgrade rutting has indicated that it is a reasonable
practice.
An in-depth study was conducted on the measurement of subgrade soil parameters. Various
relationships of soil class, R-Value, CBR and resilient modulus are evaluated. The study can be
found here.
Subgrade MR determination for pavement design is discussed in the next two sections.
Figure 15: Subgrade Modulus Variations Throughout the Year (1993 Guide, page I-24)
Using R-Value to Estimate MR(Des)
R-Value, or resistance value, is a laboratory soil test that measures the support capabilities of
subgrade soils. The R-Value tests the soil’s saturated condition and is considered to be an
estimate of subgrade support capabilities during the spring thaw.

MDT Surfacing Design Guide Chapter 6 New and Reconstructed Pavements
January 2015 34
This section discusses determining the subgrade MR (MR(Des)) The following steps describe this
process:
1. R-Value soil samples are gathered during the District soil survey (EPS Act. 450) and
sent to the Headquarters materials laboratory for R-Value testing.
2. R-Value test results are provided to the Surfacing Design Unit upon the soil survey. The
soil survey is provided either via email from the Testing Section’s SiteManager software,
or via paper copy on materials lab form 111 entitled “MDT Preconstruction Soil Survey
Data and Special Recommendations Relative to Subgrade and Road Surface Design”
3. In each soil boring location, determine the R-Value of the material within the top two feet
of subgrade.
4. The soil survey should be reviewed to determine major changes in soils and R-Value.
For example, it may be clear that for the first three miles of a seven-mile project, soils
are fairly uniform and a particular R-Value will represent the area. However, the
remaining four miles may be substantially different and a different R-Value may have to
be used in the design. If this is the case, two typical sections may be recommended.
MDT Surfacing Design Guide Chapter 6 New and Reconstructed Pavements
January 2015 35
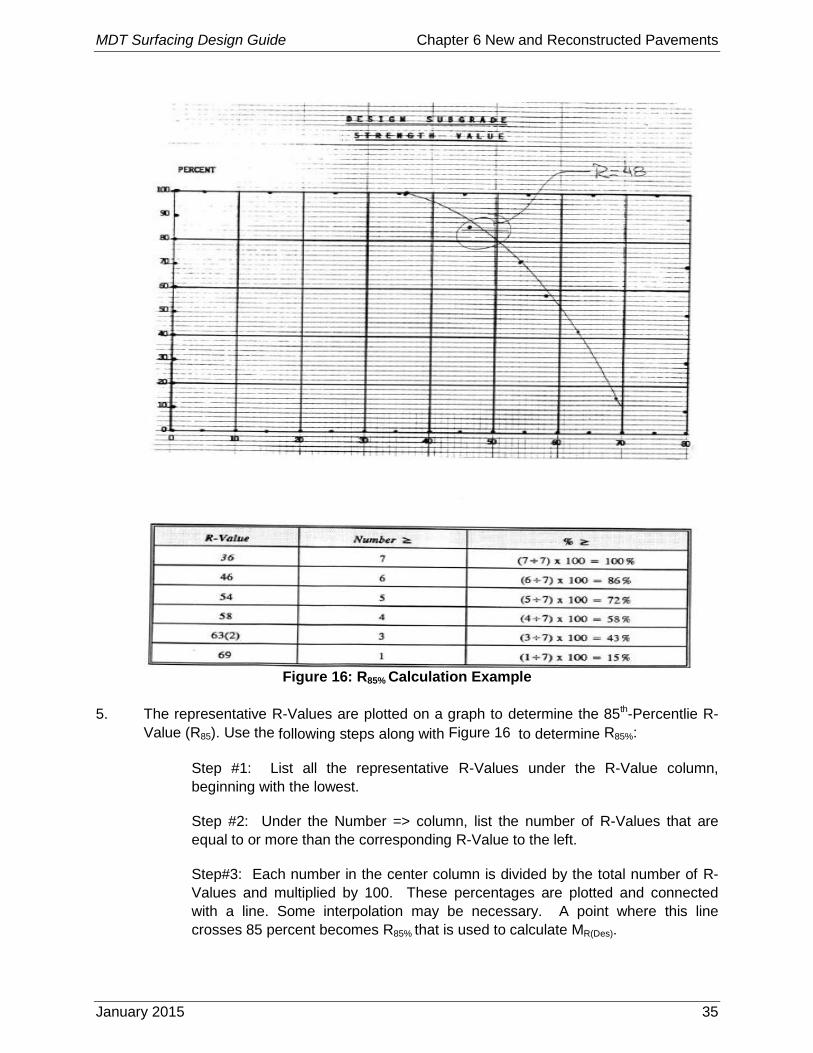
Figure 16: R85% Calculation Example
5. The representative R-Values are plotted on a graph to determine the 85th-Percentlie R-
Value (R85). Use the following steps along with Figure 16 to determine R85%:
Step #1: List all the representative R-Values under the R-Value column,
beginning with the lowest.
Step #2: Under the Number => column, list the number of R-Values that are
equal to or more than the corresponding R-Value to the left.
Step#3: Each number in the center column is divided by the total number of R-
Values and multiplied by 100. These percentages are plotted and connected
with a line. Some interpolation may be necessary. A point where this line
crosses 85 percent becomes R85% that is used to calculate MR(Des).
MDT Surfacing Design Guide Chapter 6 New and Reconstructed Pavements
January 2015 36
6. Calculate MR(Des): The relationship between R85% and MR(Des) commonly used by
MDT is (NCHRP, 2004). This relationship is intended for fine grained soils with an R-
Value less than 20:
MR(Des) = 1155 + 555*R85th%
Where:
Minimum MR(Des) = 3,250psi Maximum MR(Des) = 19,000 psi
California Bearing Ratio (CBR) is a soil strength test that is commonly used by MDT
consultants. CBR testing can be substituted for R-Value testing. CBR85% is converted to
R85% as follows (NCHRP, 2004):
4. 60 * (CBR85%)0.64 – 2.08 = R85%
Where:
CBR85% = The 85th Percentile CBR calculated in the same manner as R85% (See Steps #1 - #3 above)
A-1-a subgrade materials should be R-Value tested to determine the design R-Value. However,
if A-1-a materials are not R-Value tested, they can be assumed to have an R-Value = 30 (MR =
12,000 psi) without testing.
Both A-6 and A-7 subgrade soils are not tested for R-Value. An R-Value=5 is assumed for
these materials. FWD back-calculated should be reviewed to determine MR, but in the absence
of FWD MR, an MR = 3,250 psi can be assumed.
MR Calculated from Falling Weight Deflectometer
MDT’s Non-Destructive Testing (NDT) Unit is responsible for conducting Falling Weight
Deflectometer (FWD) and Ground Penetrating Radar (GPR) testing. A more thorough summary
of this equipment and its use is located in Chapter 7. This section summarizes the use of FWD-
generated subgrade MR for new pavement design.
The NDT unit provides the following FWD testing that can be used to determine subgrade MR:
Network level FWD/GPR testing is done on all state roadways on a 5-year rotation.
Network level testing is done at 820 ft. (250 m) increments within the outside wheel path
of the driving lane in one direction only. Network level testing may occur during the
summer months which can yield a higher MR than during the period of spring thaw.
Project level FWD/GPR: In addition to Network level testing, project level testing is
done prior to road construction projects. Project level testing is done at 330 ft. (100 m)
increments within the outside wheelpath, of the driving lane in one direction only. A
MDT Surfacing Design Guide Chapter 6 New and Reconstructed Pavements
January 2015 37
second run may be completed (one in spring and one in fall) if the schedule of the
project allows. GPR testing is done continuously. This testing is done early in the
project design process before Surfacing Design’s preliminary surfacing design activity
(Act. 600).
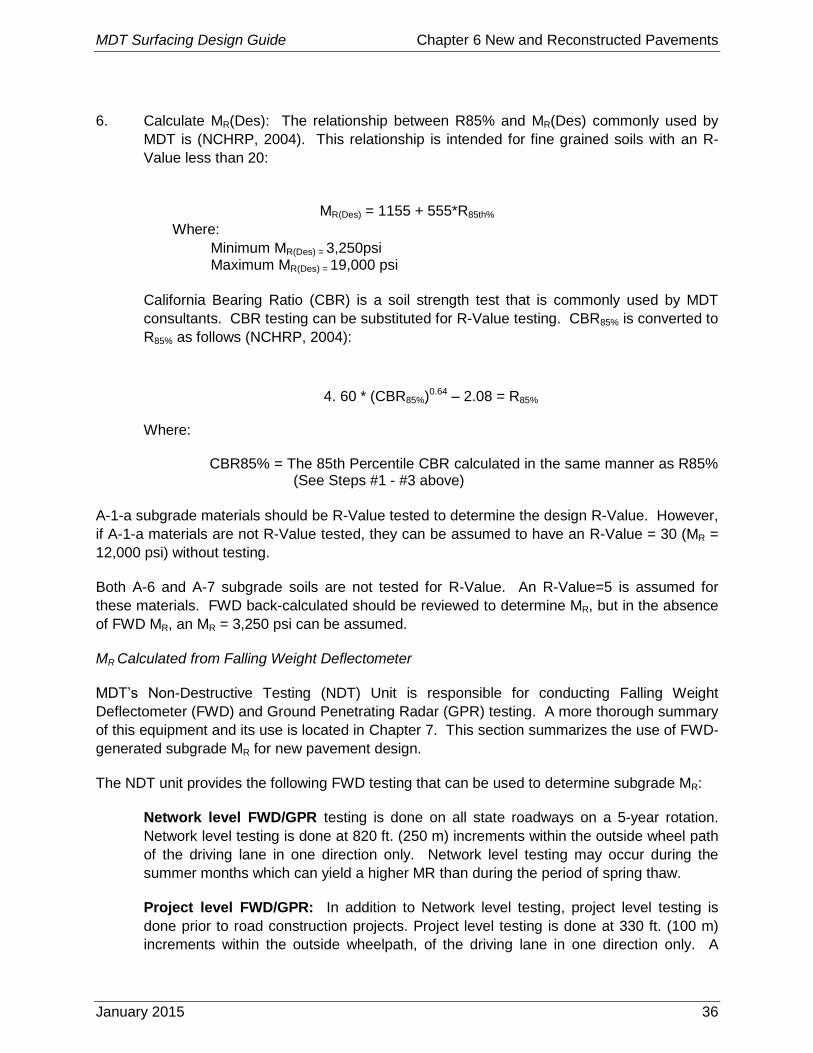
Figure 17: Example FWD Subgrade MR Printout
After FWD and GPR data is collected, the NDT unit processes the deflection data and
backcalculates the in-situ subgrade MR . Surfacing Design receives the data along with an Excel
spreadsheet summarizing the subgrade MR . Figure 17 shows an example spreadsheet.
Figure 17 shows the unadjusted back-calculated subgrade MR. The table shows 4 different
figures:
Average: This is the average value of all of the unadjusted MR values.
Std. Dev: The standard deviation of the unadjusted MR values.
Corrected: Calculated as follows:
Corrected MR = Average MR – 0.7 * Std. Dev.
Lab: This is the laboratory MR (MR Lab) converted from the Average MR calculated as
follows:
MR Lab = Unadjusted Average MR * 0.5
MR LAB should be used for pavement design. The reason is the AASHTO pavement design
equation is based upon laboratory calculated Subgrade MR. The LAB resilient modulus for all
three layers was derived by multiplying the AVERAGE by a coefficient. These are modified
values from the FHWA-RD-97-076 booklet. This booklet shows what coefficients to use to
approximate a laboratory resilient modulus value from a back-calculated resilient modulus

MDT Surfacing Design Guide Chapter 6 New and Reconstructed Pavements
January 2015 38
value. The NDT has been instructed to use a coefficient of 0.45 for PMS, a 0.62 for unbound
granular bases, and 0.50 for subgrade.
MR Estimated for Special Borrow Pavements
There will be instances where MR(Des) will need to be estimated. This situation will usually occur
when designing special borrow pavements. Recall that special borrow pavements are designed
based upon the special borrow MR, not the subgrade MR. In this case, the material to be used
for special borrow will be unknown since it will be provided by the Contractor.
In these instances the designer will often estimate MR(Des) based upon the special borrow
material that is locally available, and/or the type of special borrow the designer determines
should be used. Most often, pit run A-1-a material is utilized for special borrow, and a design R-
Value = 30 is assumed.
Once the special borrow R-Value is determined / estimated, utilize the following equation to
determine MR(Des) (NCHRP, 2004):
MR(Des) = 1155 + 555*R85th%
Where:
Minimum MR(Des) = 3,250 psi
Maximum MR(Des) = 19,000 psi
Our current practice utilizes a maximum MR(Des) = 12,000 psi for A-1-a material (R-Value = 30),
unless project specific circumstances dictate otherwise. Higher MR(Des) values rely on stiff
subgrade underlying the special borrow cap. It should be noted, this situation (placing special
borrow on stiff subgrade) rarely occurs. Resilient Modulus is a measure of stiffness of the
subgrade to a semi-infinite depth (~around 5 feet deep).
Estimating MR for Small Projects
Sometimes the Project Designer asks for a pavement design where soil R-Value testing and/or
FWD information isn’t available and will not be collected. This should occur infrequently, and
only for small projects where the pavement quantity is too small to justify the cost of a soil
survey, or there is not enough design time to allow for a soil survey.
In these cases, inquire with the NDT unit for FWD back-calculated MR that may be available
from past FWD testing. If FWD information isn’t available, the designer should estimate the
“worst-case” R-Value that may be encountered on the project and design accordingly. Often, in
areas of known fine-grained subgrades, the Minimum MR(Des) = 3,250 psi is assumed for
pavement design.
Subgrade Monitoring During Construction
Since subgrade strength is one of the primary inputs to flexible pavement design, it is important
to monitor the subgrade during construction. The purpose of this is to ensure that the subgrade

MDT Surfacing Design Guide Chapter 6 New and Reconstructed Pavements
January 2015 39
material is of equal or greater quality than the subgrade material that was assumed during the
pavement design.
Subgrade and Special Borrow sources are approved prior to construction, and subgrade design
checks are done during construction. Either R-Value testing and/or soils classification are used
for borrow source approval and subgrade design checks. To ensure that these activities occur,
include one of the following special provisions in to the contract when subgrade material is
imported to the project:
MDT Standard Special Provision 106-2a -Borrow Source Approval–Soil Classification,
MDT Standard Special Provision 106-2b. Borrow Source Approval–Resistance Value, or
MDT Standard Special Provision 106-2c. Borrow Source Approval-Soil Classification
and Resistance Value
Acceptance of subgrade material on the roadbed is generally done by soil classification.
A note showing the design R-Value should be located next to the typical sections within the
Plans. The note’s purpose is to notify construction personnel of the design R-Value, and help
them identify material that does not meet the pavement design requirements.
R-Value testing is used as a final design check during construction. The procedure is described
in the Materials Manual. This testing is not a construction contract requirement. It is the final
check to ensure the subgrade material meets the properties assumed during the pavement
design. MDT’s Construction Memo “R-Value Testing of Finished Subgrade” provides guidance
on R-Value testing.
MDT Surfacing Design Guide Chapter 6 New and Reconstructed Pavements
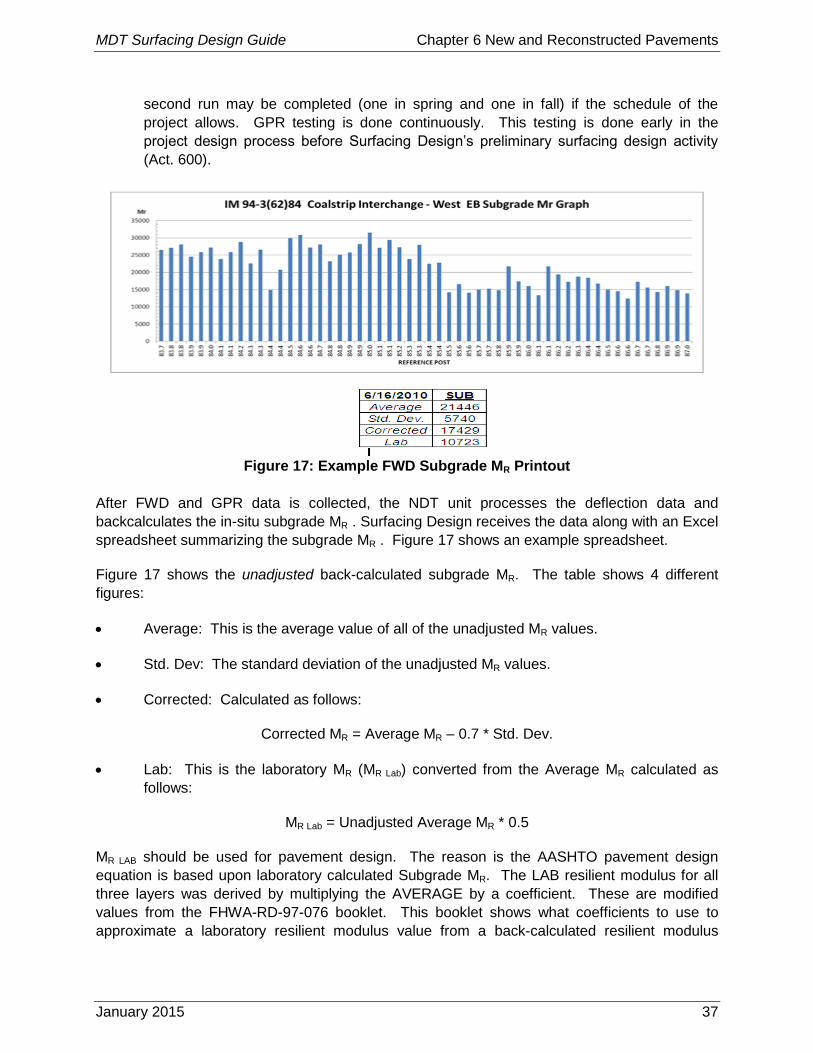
January 2015 40
Figure 18: 1993 AASHTO Pavement Design Nomograph and Equation (1993 AASHTO, pg.
II-32)
MDT Surfacing Design Guide Chapter 6 New and Reconstructed Pavements
January 2015 41
6.2.2 Step #2: Determining required structural number (SNreq’d)
The design inputs determined in Step #1 are used to calculate SNreq’d. SNreq’d is the SN required
for satisfactory pavement performance over the design life. The design equation found in the
1993 AASHTO Guide may be calculated using the nomograph in Figure 18, a spreadsheet or
the DARWin software. Utilizing the DARWin software is the preferred method of determining
SNreq’d. A design example usring DARWin is found later in this Section.
6.2.3 Step #3 Design a flexible pavement structure with SNdes >= SNreq’d
Step # 3 consists of choosing the material type and thickness for each pavement layer.
The first task is to choose which materials are to be used for the pavement structure. For
flexible pavements, the top layer will always be PMS (PMS). However, the pavement designer
may choose to utilize different types of materials to use beneath the PMS. MDT’s pavement
types are as follows:
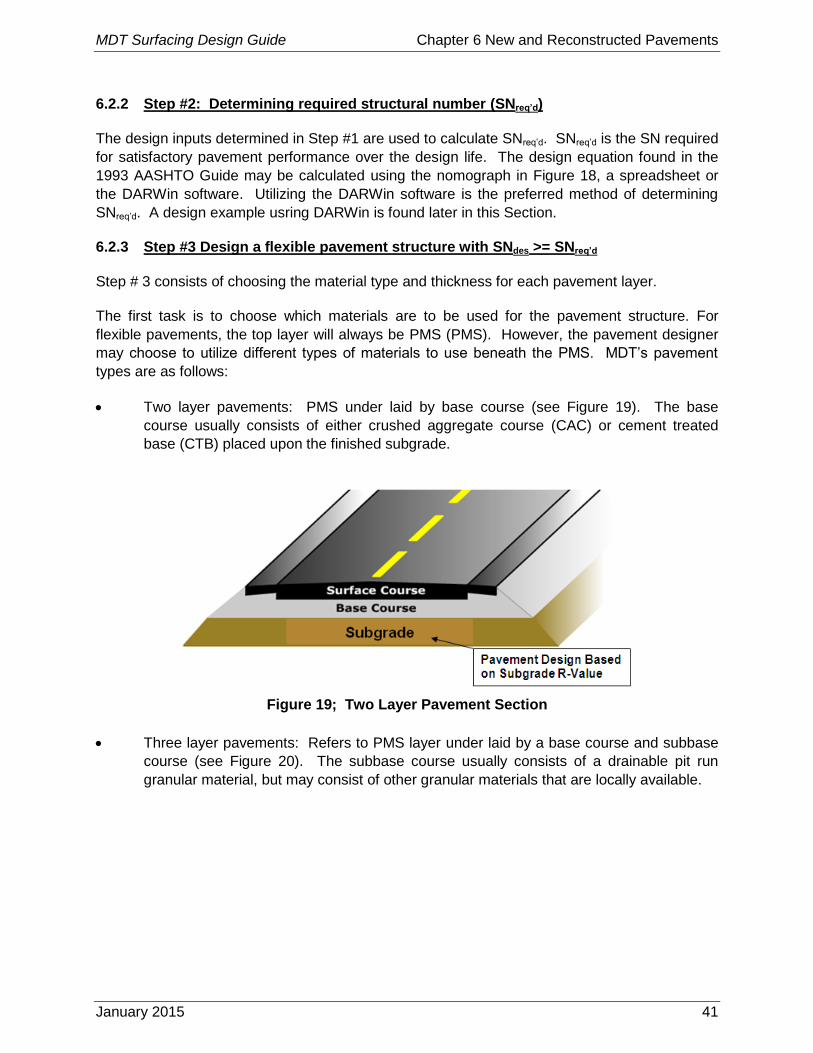
Two layer pavements: PMS under laid by base course (see Figure 19). The base
course usually consists of either crushed aggregate course (CAC) or cement treated
base (CTB) placed upon the finished subgrade.
Figure 19; Two Layer Pavement Section
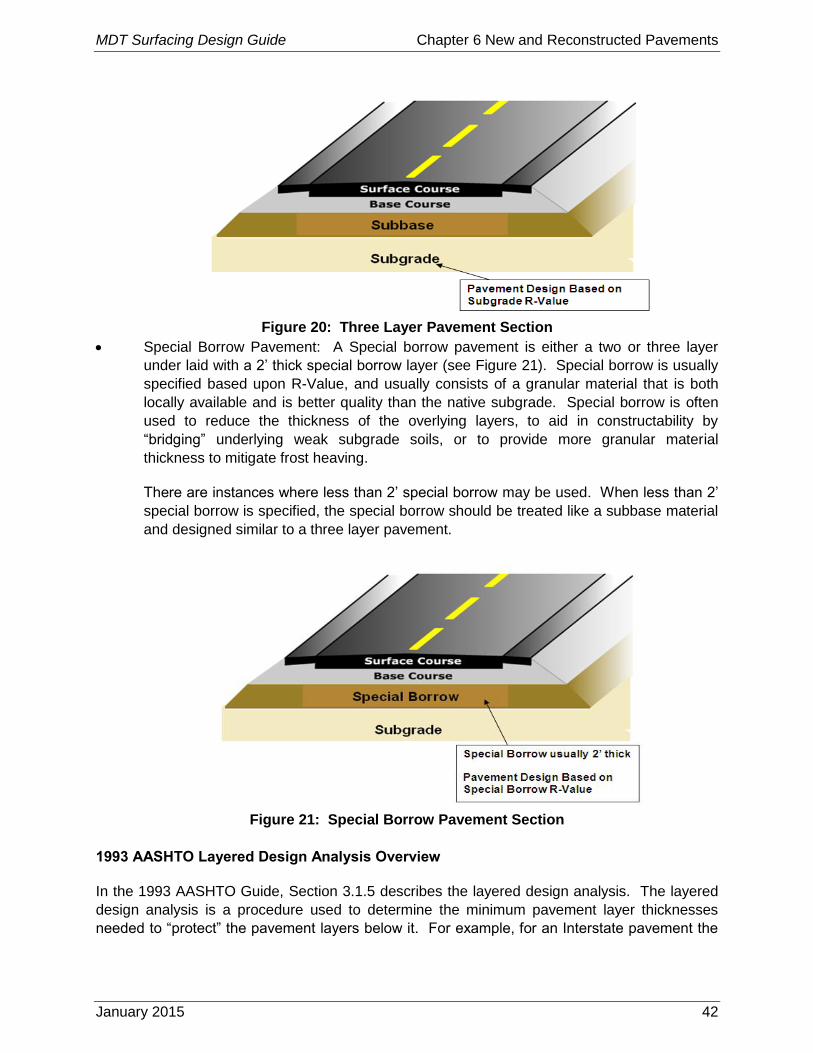
Three layer pavements: Refers to PMS layer under laid by a base course and subbase
course (see Figure 20). The subbase course usually consists of a drainable pit run
granular material, but may consist of other granular materials that are locally available.
MDT Surfacing Design Guide Chapter 6 New and Reconstructed Pavements
January 2015 42
Figure 20: Three Layer Pavement Section
Special Borrow Pavement: A Special borrow pavement is either a two or three layer
under laid with a 2’ thick special borrow layer (see Figure 21). Special borrow is usually
specified based upon R-Value, and usually consists of a granular material that is both
locally available and is better quality than the native subgrade. Special borrow is often
used to reduce the thickness of the overlying layers, to aid in constructability by
“bridging” underlying weak subgrade soils, or to provide more granular material
thickness to mitigate frost heaving.
There are instances where less than 2’ special borrow may be used. When less than 2’
special borrow is specified, the special borrow should be treated like a subbase material
and designed similar to a three layer pavement.
Figure 21: Special Borrow Pavement Section
1993 AASHTO Layered Design Analysis Overview
In the 1993 AASHTO Guide, Section 3.1.5 describes the layered design analysis. The layered
design analysis is a procedure used to determine the minimum pavement layer thicknesses
needed to “protect” the pavement layers below it. For example, for an Interstate pavement the

MDT Surfacing Design Guide Chapter 6 New and Reconstructed Pavements
January 2015 43
layered design analysis may show that the PMS layer must be at least 0.5’ thick to “protect” the
underlying base layer.
The layered design analysis is a very important procedure to calculate minimum PMS layer
thicknesses since PMS layers may crack prematurely if they are too thin. However, the
Designer does not have to conduct a layered design analysis. Instead, utilize the minimum
PMS, CAC, CTB, and subbase layer thicknesses shown in
Table 2, which were calculated based on layered design analysis.
The designer should design multiple pavement sections for each project. For example, when
designing a high-volume, thick pavement section the designer may choose to design all 3
pavement types (two layer, three layer, and special borrow) and provide all designs to the
project manager. The project manager can compare all designs while designing the road
alignment and grade to determine which option is the most cost effective.
The use of alternate typical sections can increase competition and reduce the possibility of
Value Engineering proposals by Contractors. This refers to bid documents that include multiple
typical sections with different pavement types or materials, and allowing the Contractor to bid on
the alternate that is most cost effective. Examples of alternate typical sections are crushed
aggregate course (CAC) vs. cement treated base (CTB) and flexible (asphalt) vs. rigid
(concrete) pavements. Due to the variance in typical thicknesses, the designer will need to
develop alternate plan and profile sheets to match bridge ends, approaches and other fixed
elevations. In addition, alternate typical sections may affect grading quantities, hydraulic
features and construction limits. The benefits of alternate sections must be weighed against the
additional resources and time required to develop multiple designs.
After the pavement type(s) have been selected, the next step is to design the pavement layer
thicknesses. SNDes and pavement layer thicknesses are designed using the following equation:
SNDes = aPMS*dPMS + aBase*dBase + aSubbase*dSubbase)≥ SNReq’d
Where:
SNDes = SN of design pavement section
SNReq’d = SN required for satisfactory pavement performance over the design life.
aPMS, aBase, aSub = structural-layer coefficients of PMS, base, and subbase layers, respectively,
(
Table 3)
dPMS, dBase, dSub = thickness of PMS, base, and subbase layers, respectively, (
Table 2)
The following steps are based upon the equation above and can be used to design pavement
layers:
Step #1. Select PMS thickness: PMS thickness is chosen based upon daily
ESALs and the pavement location as shown in
MDT Surfacing Design Guide Chapter 6 New and Reconstructed Pavements
January 2015 44
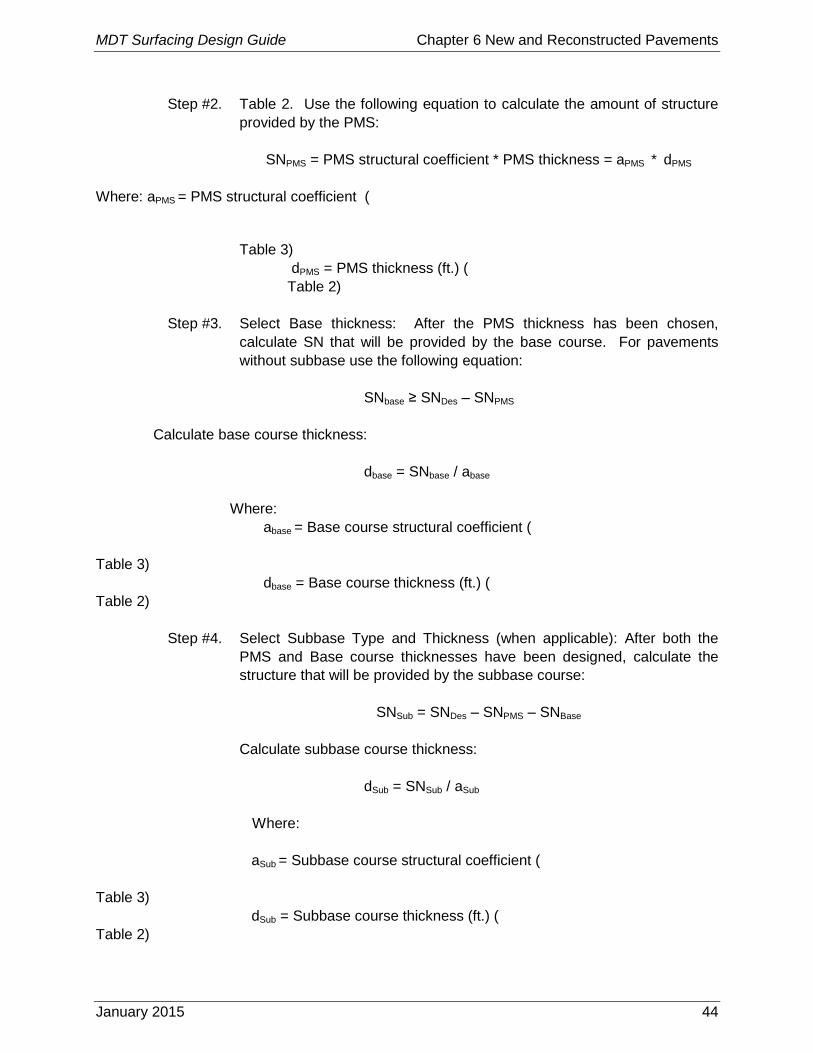
Step #2. Table 2. Use the following equation to calculate the amount of structure
provided by the PMS:
SNPMS = PMS structural coefficient * PMS thickness = aPMS * dPMS
Where: aPMS = PMS structural coefficient (
Table 3)
dPMS = PMS thickness (ft.) (
Table 2)
Step #3. Select Base thickness: After the PMS thickness has been chosen,
calculate SN that will be provided by the base course. For pavements
without subbase use the following equation:
SNbase ≥ SNDes – SNPMS
Calculate base course thickness:
dbase = SNbase / abase
Where:
abase = Base course structural coefficient (
Table 3)
dbase = Base course thickness (ft.) (
Table 2)
Step #4. Select Subbase Type and Thickness (when applicable): After both the
PMS and Base course thicknesses have been designed, calculate the
structure that will be provided by the subbase course:
SNSub = SNDes – SNPMS – SNBase
Calculate subbase course thickness:
dSub = SNSub / aSub
Where:
aSub = Subbase course structural coefficient (
Table 3)
dSub = Subbase course thickness (ft.) (
Table 2)

MDT Surfacing Design Guide Chapter 6 New and Reconstructed Pavements
January 2015 45
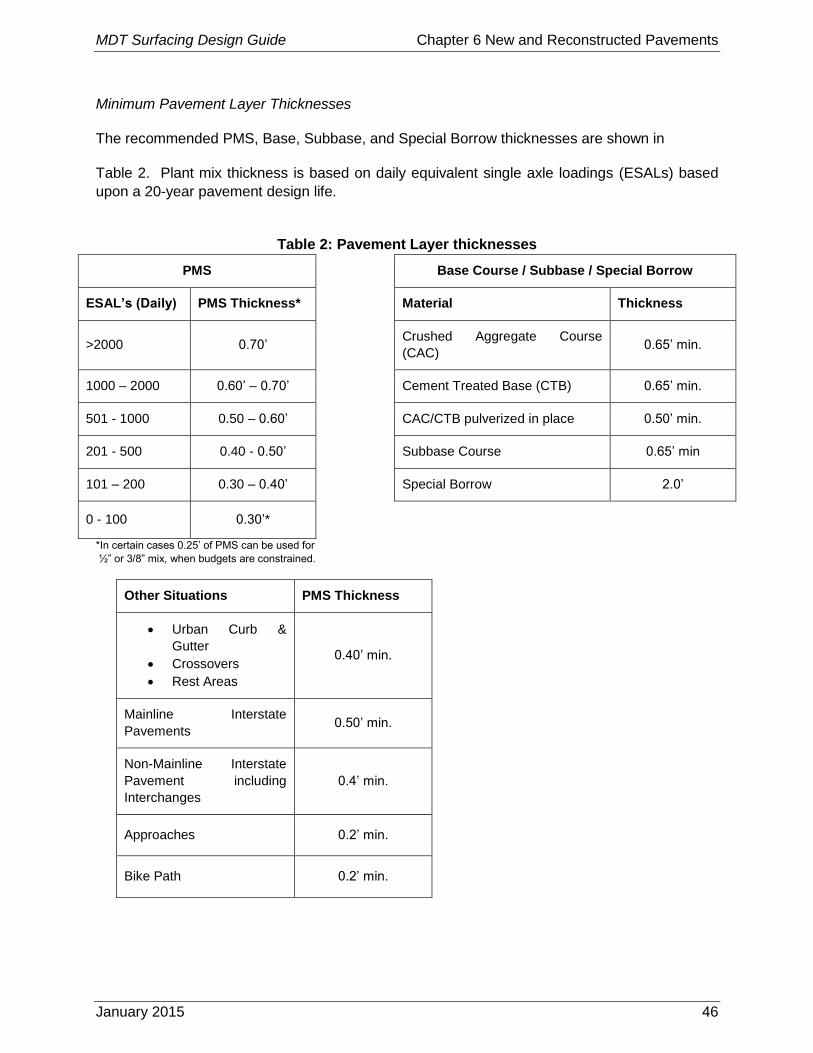
MDT Surfacing Design Guide Chapter 6 New and Reconstructed Pavements
January 2015 46
Minimum Pavement Layer Thicknesses
The recommended PMS, Base, Subbase, and Special Borrow thicknesses are shown in
Table 2. Plant mix thickness is based on daily equivalent single axle loadings (ESALs) based
upon a 20-year pavement design life.
Table 2: Pavement Layer thicknesses
PMS Base Course / Subbase / Special Borrow
ESAL’s (Daily) PMS Thickness* Material Thickness
>2000 0.70’ Crushed Aggregate Course
(CAC) 0.65’ min.
1000 – 2000 0.60’ – 0.70’ Cement Treated Base (CTB) 0.65’ min.
501 - 1000 0.50 – 0.60’ CAC/CTB pulverized in place 0.50’ min.
201 - 500 0.40 - 0.50’ Subbase Course 0.65’ min
101 – 200 0.30 – 0.40’ Special Borrow 2.0’
0 - 100 0.30’*
*In certain cases 0.25’ of PMS can be used for
½” or 3/8” mix, when budgets are constrained.
Other Situations PMS Thickness
Urban Curb &
Gutter
Crossovers
Rest Areas
0.40’ min.
Mainline Interstate
Pavements 0.50’ min.
Non-Mainline Interstate
Pavement including
Interchanges
0.4’ min.
Approaches 0.2’ min.
Bike Path 0.2’ min.
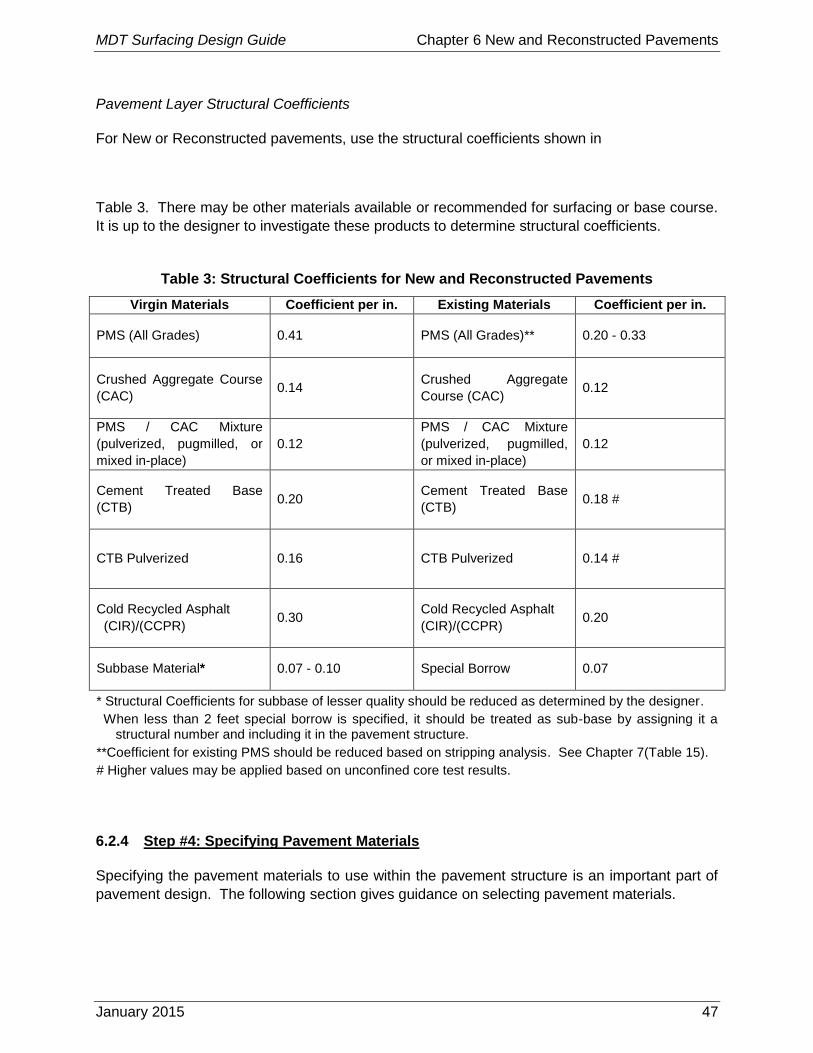
MDT Surfacing Design Guide Chapter 6 New and Reconstructed Pavements
January 2015 47
Pavement Layer Structural Coefficients
For New or Reconstructed pavements, use the structural coefficients shown in
Table 3. There may be other materials available or recommended for surfacing or base course.
It is up to the designer to investigate these products to determine structural coefficients.
Table 3: Structural Coefficients for New and Reconstructed Pavements
6.2.4 Step #4: Specifying Pavement Materials
Specifying the pavement materials to use within the pavement structure is an important part of
pavement design. The following section gives guidance on selecting pavement materials.
Virgin Materials Coefficient per in. Existing Materials Coefficient per in.
PMS (All Grades) 0.41 PMS (All Grades)** 0.20 - 0.33
Crushed Aggregate Course
(CAC) 0.14
Crushed Aggregate
Course (CAC) 0.12
PMS / CAC Mixture
(pulverized, pugmilled, or
mixed in-place)
0.12
PMS / CAC Mixture
(pulverized, pugmilled,
or mixed in-place)
0.12
Cement Treated Base
(CTB) 0.20
Cement Treated Base
(CTB) 0.18 #
CTB Pulverized 0.16 CTB Pulverized 0.14 #
Cold Recycled Asphalt
(CIR)/(CCPR) 0.30
Cold Recycled Asphalt
(CIR)/(CCPR) 0.20
Subbase Material* 0.07 - 0.10 Special Borrow 0.07
* Structural Coefficients for subbase of lesser quality should be reduced as determined by the designer.
When less than 2 feet special borrow is specified, it should be treated as sub-base by assigning it a structural number and including it in the pavement structure.
**Coefficient for existing PMS should be reduced based on stripping analysis. See Chapter 7(Table 15).
# Higher values may be applied based on unconfined core test results.
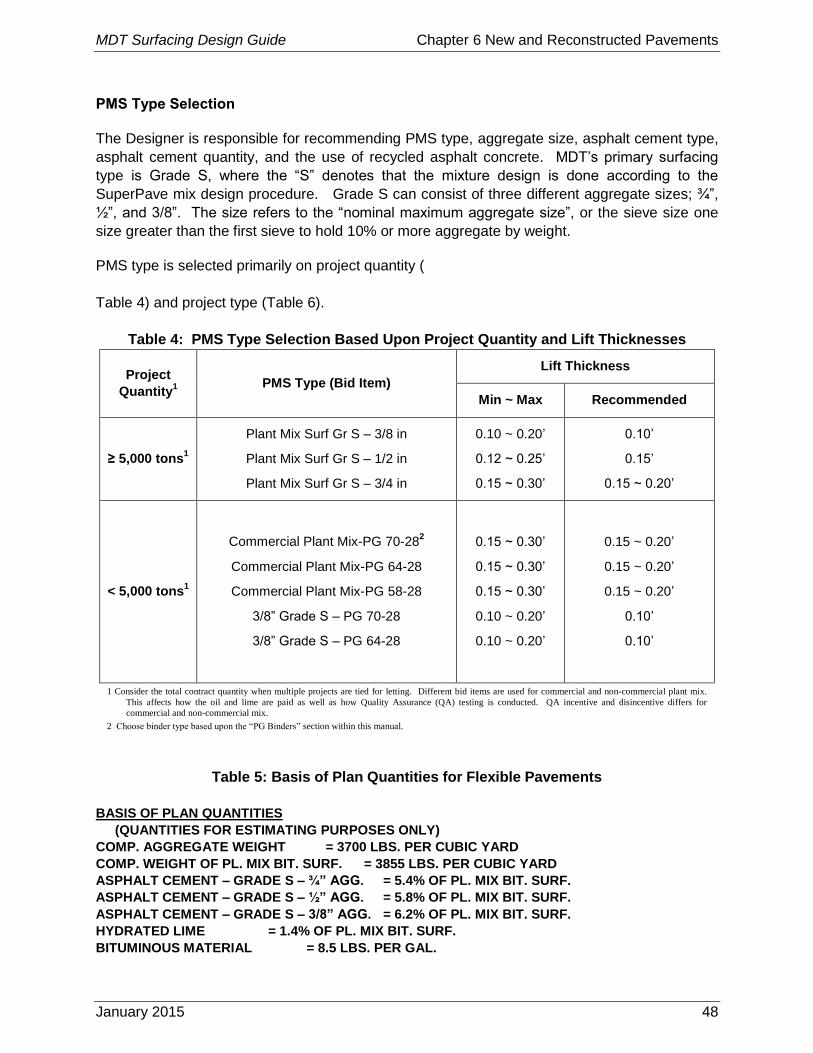
MDT Surfacing Design Guide Chapter 6 New and Reconstructed Pavements
January 2015 48
PMS Type Selection
The Designer is responsible for recommending PMS type, aggregate size, asphalt cement type,
asphalt cement quantity, and the use of recycled asphalt concrete. MDT’s primary surfacing
type is Grade S, where the “S” denotes that the mixture design is done according to the
SuperPave mix design procedure. Grade S can consist of three different aggregate sizes; ¾”,
½”, and 3/8”. The size refers to the “nominal maximum aggregate size”, or the sieve size one
size greater than the first sieve to hold 10% or more aggregate by weight.
PMS type is selected primarily on project quantity (
Table 4) and project type (Table 6).
Table 4: PMS Type Selection Based Upon Project Quantity and Lift Thicknesses
Project
Quantity1
PMS Type (Bid Item)
Lift Thickness
Min ~ Max Recommended
≥ 5,000 tons1
Plant Mix Surf Gr S – 3/8 in
Plant Mix Surf Gr S – 1/2 in
Plant Mix Surf Gr S – 3/4 in
0.10 ~ 0.20’
0.12 ~ 0.25’
0.15 ~ 0.30’
0.10’
0.15’
0.15 ~ 0.20’
< 5,000 tons1
Commercial Plant Mix-PG 70-282
Commercial Plant Mix-PG 64-28
Commercial Plant Mix-PG 58-28
3/8” Grade S – PG 70-28
3/8” Grade S – PG 64-28
0.15 ~ 0.30’
0.15 ~ 0.30’
0.15 ~ 0.30’
0.10 ~ 0.20’
0.10 ~ 0.20’
0.15 ~ 0.20’
0.15 ~ 0.20’
0.15 ~ 0.20’
0.10’
0.10’
1 Consider the total contract quantity when multiple projects are tied for letting. Different bid items are used for commercial and non-commercial plant mix.
This affects how the oil and lime are paid as well as how Quality Assurance (QA) testing is conducted. QA incentive and disincentive differs for
commercial and non-commercial mix.
2 Choose binder type based upon the “PG Binders” section within this manual.
Table 5: Basis of Plan Quantities for Flexible Pavements
BASIS OF PLAN QUANTITIES
(QUANTITIES FOR ESTIMATING PURPOSES ONLY)
COMP. AGGREGATE WEIGHT = 3700 LBS. PER CUBIC YARD
COMP. WEIGHT OF PL. MIX BIT. SURF. = 3855 LBS. PER CUBIC YARD
ASPHALT CEMENT – GRADE S – ¾” AGG. = 5.4% OF PL. MIX BIT. SURF.
ASPHALT CEMENT – GRADE S – ½” AGG. = 5.8% OF PL. MIX BIT. SURF.
ASPHALT CEMENT – GRADE S – 3/8” AGG. = 6.2% OF PL. MIX BIT. SURF.
HYDRATED LIME = 1.4% OF PL. MIX BIT. SURF.
BITUMINOUS MATERIAL = 8.5 LBS. PER GAL.

MDT Surfacing Design Guide Chapter 6 New and Reconstructed Pavements
January 2015 49
TACK (ASPHALT SURFACES) = 0.025 GAL. PER SQ. YARD (UNDILUTED)
TACK (ALL OTHER SURFACES) = 0.05 GAL. PER SQ. YARD (UNDILUTED)
SEAL = 0.42 GAL. PER SQ. YARD
COVER = 25 LBS. PER SQ. YARD
BLOTTER = 15 LBS. PER SQ. YARD
FOGSEAL = 0.05 GAL. PER SQ. YARD
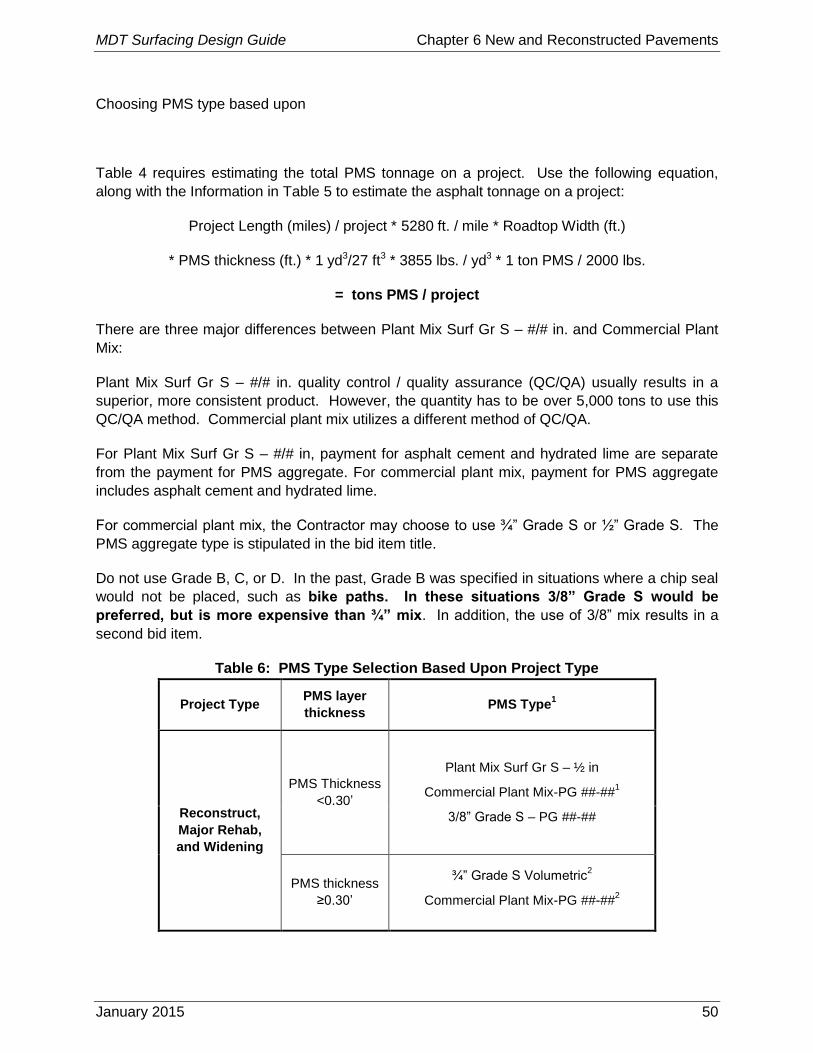
MDT Surfacing Design Guide Chapter 6 New and Reconstructed Pavements
January 2015 50
Choosing PMS type based upon
Table 4 requires estimating the total PMS tonnage on a project. Use the following equation,
along with the Information in Table 5 to estimate the asphalt tonnage on a project:
Project Length (miles) / project * 5280 ft. / mile * Roadtop Width (ft.)
* PMS thickness (ft.) * 1 yd3/27 ft3 * 3855 lbs. / yd3 * 1 ton PMS / 2000 lbs.
= tons PMS / project
There are three major differences between Plant Mix Surf Gr S – #/# in. and Commercial Plant
Mix:
Plant Mix Surf Gr S – #/# in. quality control / quality assurance (QC/QA) usually results in a
superior, more consistent product. However, the quantity has to be over 5,000 tons to use this
QC/QA method. Commercial plant mix utilizes a different method of QC/QA.
For Plant Mix Surf Gr S – #/# in, payment for asphalt cement and hydrated lime are separate
from the payment for PMS aggregate. For commercial plant mix, payment for PMS aggregate
includes asphalt cement and hydrated lime.
For commercial plant mix, the Contractor may choose to use ¾” Grade S or ½” Grade S. The
PMS aggregate type is stipulated in the bid item title.
Do not use Grade B, C, or D. In the past, Grade B was specified in situations where a chip seal
would not be placed, such as bike paths. In these situations 3/8” Grade S would be
preferred, but is more expensive than ¾” mix. In addition, the use of 3/8” mix results in a
second bid item.
Table 6: PMS Type Selection Based Upon Project Type
Project Type PMS layer
thickness PMS Type
1
Reconstruct,
Major Rehab,
and Widening
PMS Thickness
<0.30’
Plant Mix Surf Gr S – ½ in
Commercial Plant Mix-PG ##-##1
3/8” Grade S – PG ##-##
PMS thickness
≥0.30’
¾” Grade S Volumetric2
Commercial Plant Mix-PG ##-##2
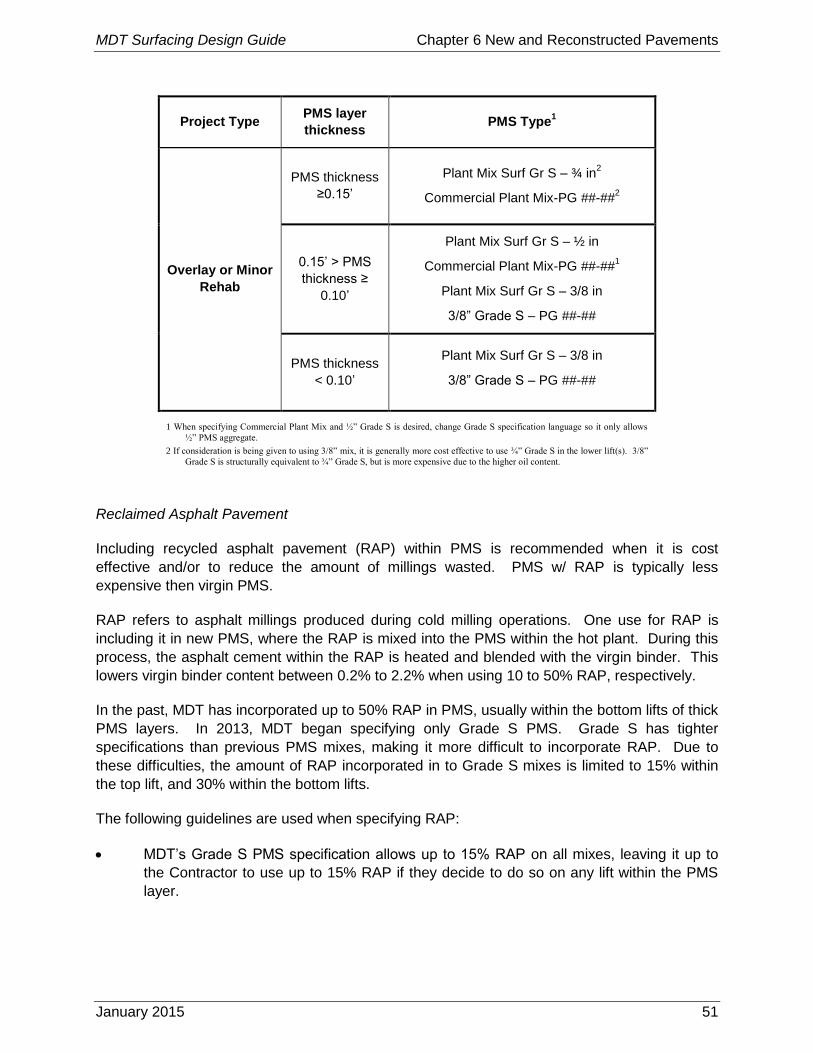
MDT Surfacing Design Guide Chapter 6 New and Reconstructed Pavements
January 2015 51
Project Type PMS layer
thickness PMS Type
1
Overlay or Minor
Rehab
PMS thickness
≥0.15’
Plant Mix Surf Gr S – ¾ in2
Commercial Plant Mix-PG ##-##2
0.15’ > PMS
thickness ≥
0.10’
Plant Mix Surf Gr S – ½ in
Commercial Plant Mix-PG ##-##1
Plant Mix Surf Gr S – 3/8 in
3/8” Grade S – PG ##-##
PMS thickness
< 0.10’
Plant Mix Surf Gr S – 3/8 in
3/8” Grade S – PG ##-##
1 When specifying Commercial Plant Mix and ½” Grade S is desired, change Grade S specification language so it only allows
½” PMS aggregate.
2 If consideration is being given to using 3/8” mix, it is generally more cost effective to use ¾” Grade S in the lower lift(s). 3/8”
Grade S is structurally equivalent to ¾” Grade S, but is more expensive due to the higher oil content.
Reclaimed Asphalt Pavement
Including recycled asphalt pavement (RAP) within PMS is recommended when it is cost
effective and/or to reduce the amount of millings wasted. PMS w/ RAP is typically less
expensive then virgin PMS.
RAP refers to asphalt millings produced during cold milling operations. One use for RAP is
including it in new PMS, where the RAP is mixed into the PMS within the hot plant. During this
process, the asphalt cement within the RAP is heated and blended with the virgin binder. This
lowers virgin binder content between 0.2% to 2.2% when using 10 to 50% RAP, respectively.
In the past, MDT has incorporated up to 50% RAP in PMS, usually within the bottom lifts of thick
PMS layers. In 2013, MDT began specifying only Grade S PMS. Grade S has tighter
specifications than previous PMS mixes, making it more difficult to incorporate RAP. Due to
these difficulties, the amount of RAP incorporated in to Grade S mixes is limited to 15% within
the top lift, and 30% within the bottom lifts.
The following guidelines are used when specifying RAP:
MDT’s Grade S PMS specification allows up to 15% RAP on all mixes, leaving it up to
the Contractor to use up to 15% RAP if they decide to do so on any lift within the PMS
layer.
MDT Surfacing Design Guide Chapter 6 New and Reconstructed Pavements
January 2015 52
If the designer wants to dictate the use of RAP on a project use the bid item “Plant Mix
Bit Surf Gr S - ## RAP”, where ## can be 3/8”, ½” or ¾”. The amount of RAP to be used
in the PMS is specified within the special provision.
See the PG binder section below and Asphalt Content section for more information on
specifying RAP.
On reconstruction projects, RAP may be used in other ways such as:
Traffic gravel
Supplement to base gravel (needs to be mixed with crushed aggregate course)
Digout backfill
Shoulder gravel
Guardrail widening
Detour Surfacing
Performance Grade (PG) Binder
Performance Grade (PG) Binder refers to the type of asphalt cement used within the PMS
mixture. Asphalt cements are specified by PG grade, for example “PG 70-28”. The numbers,
70 and -28, refer to the pavement temperatures in ºC where the asphalt cement should perform
well. For example, a PG 70-28 binder should be expected to be rut resistant at pavement
temperatures up to 70 ºC, and be crack resistant down to negative 28 ºC.
Table 7 shows binder types readily available in Montana. Binder grades not shown in the table
may be difficult to procure and are not recommended. Use Table 7 along with the guidance
below the table to specify PG binder types.
Table 7: PG Binder Selection
Design Parameter Binder Type
Interstate Roadway, Rest Areas and Scale
Sites, or Daily ESAL ≥ 400
PG 70-28
Roadway on National Highway System or daily
ESALs ≥ 50 or AADT ≥ 1200
PG 64-28
All other roadways PG 58-28
The following are situations where the binder grade may be bumped up from PG 58-28 to PG
64-28 or from PG 64-28 to PG 70-28:
Construction / Reconstruction projects – often it is desirable to use polymer modified
binders for these projects. PG 64-28 and 70-28 are typically polymer modified.
Urban routes with stop and go traffic and/or high traffic volumes.
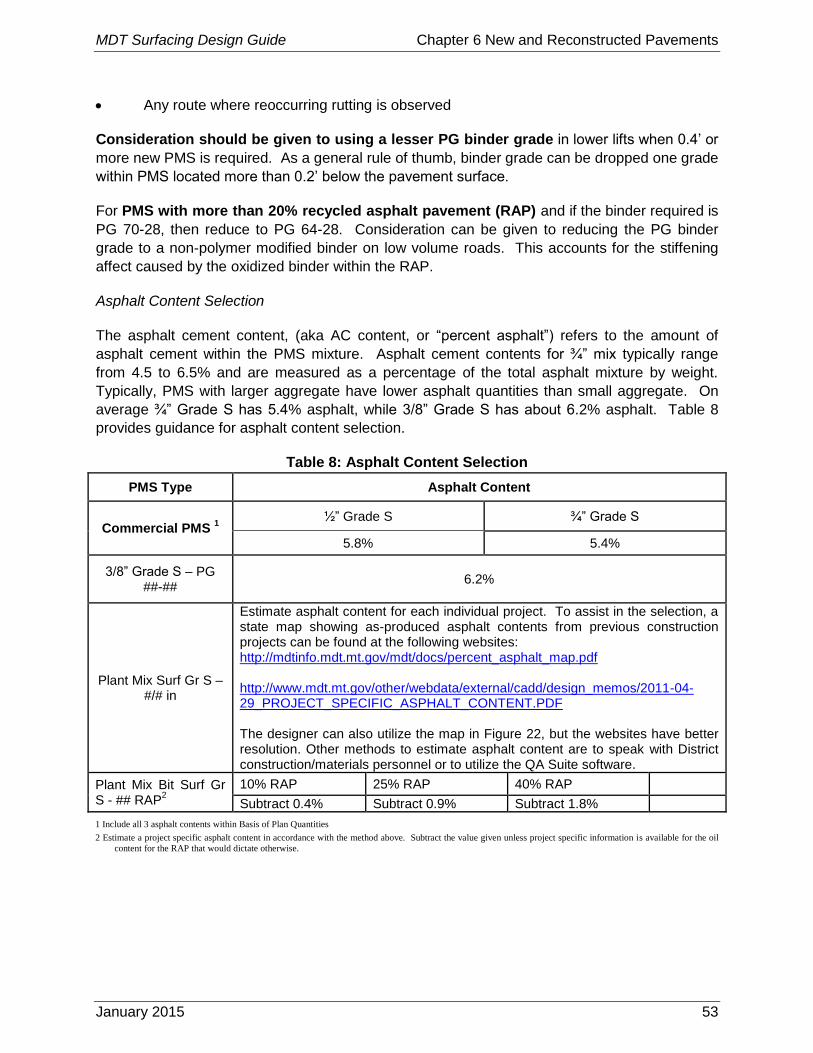
MDT Surfacing Design Guide Chapter 6 New and Reconstructed Pavements
January 2015 53
Any route where reoccurring rutting is observed
Consideration should be given to using a lesser PG binder grade in lower lifts when 0.4’ or
more new PMS is required. As a general rule of thumb, binder grade can be dropped one grade
within PMS located more than 0.2’ below the pavement surface.
For PMS with more than 20% recycled asphalt pavement (RAP) and if the binder required is
PG 70-28, then reduce to PG 64-28. Consideration can be given to reducing the PG binder
grade to a non-polymer modified binder on low volume roads. This accounts for the stiffening
affect caused by the oxidized binder within the RAP.
Asphalt Content Selection
The asphalt cement content, (aka AC content, or “percent asphalt”) refers to the amount of
asphalt cement within the PMS mixture. Asphalt cement contents for ¾” mix typically range
from 4.5 to 6.5% and are measured as a percentage of the total asphalt mixture by weight.
Typically, PMS with larger aggregate have lower asphalt quantities than small aggregate. On
average ¾” Grade S has 5.4% asphalt, while 3/8” Grade S has about 6.2% asphalt. Table 8
provides guidance for asphalt content selection.
Table 8: Asphalt Content Selection
PMS Type Asphalt Content
Commercial PMS 1
½” Grade S ¾” Grade S
5.8% 5.4%
3/8” Grade S – PG ##-##
6.2%
Plant Mix Surf Gr S – #/# in
Estimate asphalt content for each individual project. To assist in the selection, a state map showing as-produced asphalt contents from previous construction projects can be found at the following websites: http://mdtinfo.mdt.mt.gov/mdt/docs/percent_asphalt_map.pdf http://www.mdt.mt.gov/other/webdata/external/cadd/design_memos/2011-04-29_PROJECT_SPECIFIC_ASPHALT_CONTENT.PDF The designer can also utilize the map in Figure 22, but the websites have better resolution. Other methods to estimate asphalt content are to speak with District construction/materials personnel or to utilize the QA Suite software.
Plant Mix Bit Surf Gr S - ## RAP
2 10% RAP 25% RAP 40% RAP
Subtract 0.4% Subtract 0.9% Subtract 1.8%
1 Include all 3 asphalt contents within Basis of Plan Quantities
2 Estimate a project specific asphalt content in accordance with the method above. Subtract the value given unless project specific information is available for the oil
content for the RAP that would dictate otherwise.

MDT Surfacing Design Guide Chapter 6 New and Reconstructed Pavements
January 2015 54
A few items to consider when utilizing the Project Specific Asphalt Map:
In 2004 the department began using the Hamburg rut test. The test typically reduced
asphalt contents by about 0.3%. As a result, subtract 0.3% to projects built in 2004 and
earlier to estimate today’s asphalt contents.
Beginning in 2013, mix design gyrations on high traffic roads (>401 daily ESALs) were
lowered to increase asphalt content. This has resulted in an 0.2% increase in asphalt
content. As a result, add 0.2% asphalt content to estimate today’s asphalt contents (in
addition to the guidance given in bullet 1 above).
There are relatively few ½” Grade S projects on the map. ½” Grade S asphalt contents
can be estimated based upon ¾” Grade S asphalt contents. Do this by adding 0.4% to
¾” Grade S projects. For example, if a project on the map indicates a ¾” Grade S
project has 5.4% asphalt, assume that the same project would have 5.8% asphalt if it
had been ½” Grade S.
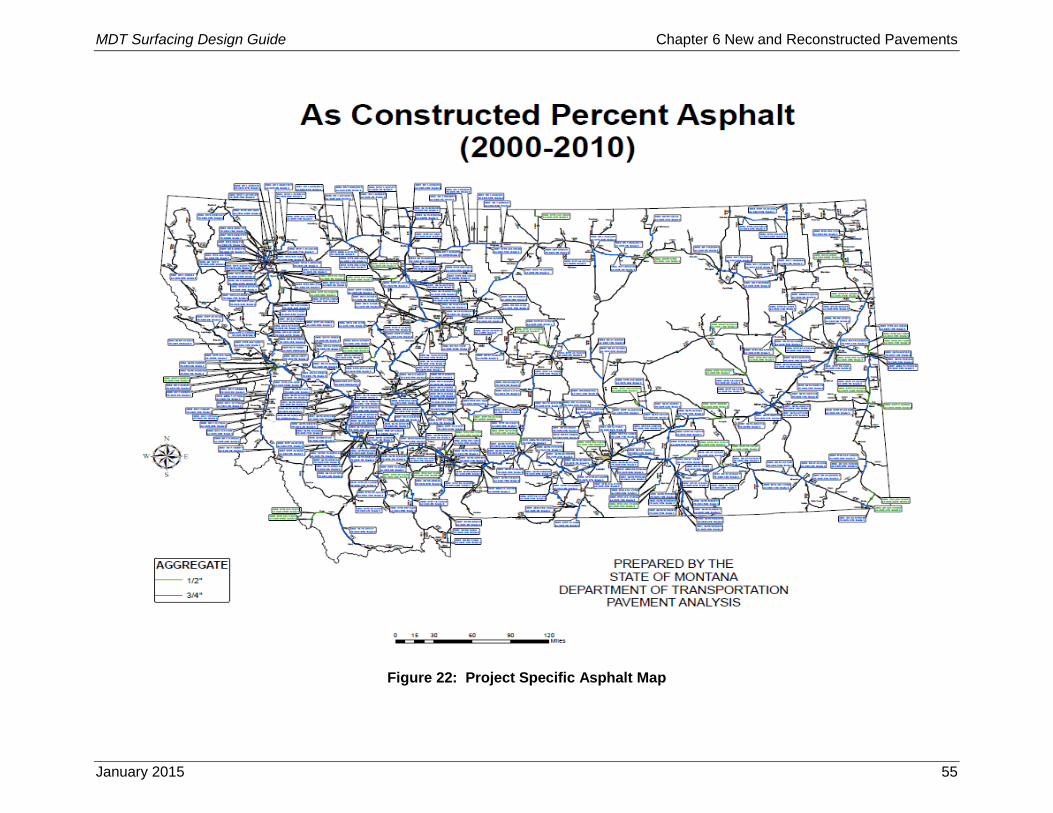
MDT Surfacing Design Guide Chapter 6 New and Reconstructed Pavements
January 2015 55
Figure 22: Project Specific Asphalt Map
MDT Surfacing Design Guide Chapter 6 New and Reconstructed Pavements
January 2015 56
Pavement Base Course
MDT primarily uses 2 types of base course: untreated crushed aggregate course (CAC) and
Cement Treated Base (CTB).
Crushed Aggregate Course
MDT’s most common pavement type is PMS under laid with aggregate base. Aggregate Base
Course is now referred to as crushed aggregate course (CAC). The current CAC specification
allows the Contractor to choose between Crushed Base Course Grade 5A (2”-) and Grade 6A
(1.5”-), and also allows the Contractor to choose whether or not to use crushed top surfacing
grade 2A (3/4” -) within the top 0.15’ of CAC.
MDT minimum CAC thickness is 0.65’. That depth includes crushed top surfacing.
In recent years, recycling RAP into virgin CAC has become more common, even on
reconstruction projects. This is a cost effective way to reuse RAP, and results in a competent
base course provided it is manufactured as follows:
It is important to have a uniform blend of CAC and RAP within the pulverized mixture.
To achieve a uniform blend, the material can be mixed in either a pugmill (off-site) or
with a pulverizer (in-place). Blade mixing is not allowed.
Within the blend, pulverized PMS should comprise a maximum 50% of the pulverized
mixture. Because of variability in existing surfacing thickness, some portions of the
project may have a higher percentage. MDT research has shown that the mixture
strength decreases when RAP comprised more than 60% of the mixture (Mokwa, 2005).
Compacted pulverized material can swell up to 12.5% by volume.
Cement Treated Base
MDT often uses Cement Treated Base Course (CTB) where it is cost effective. CTB courses
are generally 2/3 the thickness of comparable CAC courses. CTB is often used in areas without
economical access to gravel and/or where a thinner overall pavement section is desirable. The
CTB aggregate requires a smaller nominal maximum size (1 inch) than CAC aggregate (1 ½
inch).
For reconstruction or new construction projects, the minimum CTB thickness is 0.65’.
CTB can be manufactured with a pugmill (off-site) or with a pulverizer (in-place). The ability to
manufacture CTB with a pulverizer makes it ideal for full depth reclamation (FDR) of existing
pavements.
MDT Surfacing Design Guide Chapter 6 New and Reconstructed Pavements
January 2015 57
Pavement Subbase Course
While MDT’s most common pavement type is a two-layer pavement, three-layer pavements
consisting of a surfacing, base, and subbase layer should also be considered. These
pavements tend to be more cost effective on projects with:
CAC layers within two-layer pavements are greater than 1.10’ thick.
Subgrades with soft stiffness (MR < 4,000 psi) and traffic greater than 50 daily ESALs.
Subgrades with medium (9,000 psi > MR > 4,000 psi) stiffness and traffic greater than
800 daily ESALs.
Subbase should consist of material meeting the following requirements:
3” maximum aggregate size,
less than 15% passing the No. 200 sieve, and
material passing the No. 40 sieve must have a maximum liquid limit and plasticity index
of 30 and 6, respectively.
Subbase material meeting these material requirements can be assumed to have a resilient
modulus (MR) = 12,000 psi and structural coefficient = 0.07. Higher structural coefficients can
be utilized if appropriate testing data is approved by MDT. In locations where material meeting
the specifications above is unavailable, other granular materials can be used as subbase
material. An example of this sort of material is the sand deposits in eastern Montana. The
structural coefficient for these materials will usually range from 0.07 – 0.08/in.
Also, use the guidance below when specifying subbase:
Adequate base course thickness is needed to “protect” subbase materials from high
stresses and strains. The layered analysis approach (Figure 3.2, 1993 Guide) is
recommended for determining base course thickness in three-layer pavements.
Subbase material should daylight out into the pavement inslopes, similar to special
borrow.
The frequency of quality control / quality assurance (QC/QA) testing should be similar to
base course material. Special borrow QC / QA should not be used for subbase material.
Minimum subbase thickness is 0.65’.
6.2.5 Step #5: Send Pavement Design Memo to Project Design Manager.
Now that the thickness design and pavement materials have been determined, the last task is
to send a paper copy of the surfacing design memo to road design staff via interdepartmental
mail.

MDT Surfacing Design Guide Chapter 6 New and Reconstructed Pavements
January 2015 58
Figure 23: Example Surfacing Design Memo
Figure 23 shows an example surfacing design memo. The following list includes items that are
included within the memo:
To: Highways Engineer
Thru: Pavement Design Engineer (with signature)

MDT Surfacing Design Guide Chapter 6 New and Reconstructed Pavements
January 2015 59
From: Designer (with signature)
Date
Subject Project Number, Name, and CN Number
Designate whether memo is Preliminary (Act. 600) or Final design (Act. 604)
PMS, CAC, and Total Thicknesses
Design R-Value
Daily ESALs assumed for Pavement Design
Plant Mix Type
Use of RAP and PMS RAP content
Design Life Length (yrs.)
Construction methods and sequencing for pulverization typical sections
Binder type
Asphalt Content
CC’d to District Administrator, Road Design Engineer, Road Design Project Manager,
Bridge Engineer (for Bridge Lead projects), and Surfacing, Materials, and Geotechnical
Files
After completing the surfacing design memo with Microsoft Word, save the .doc file using the 7
digit Construction Number (CN) as the file name. Save the .doc files in the following share drive
location: \\astro\rdrtr\projects\#######, where ####### is the 7 digit project UPN. Once the
memo has been submitted for distribution and saved, the EPS activity may be carded off.
When the paper copy of the memo is distributed, the original copy is stamped “Master Copy”
with a green stamp by the Department’s mail staff, and sent back to surfacing design. This
“Master Copy” is stored in the surfacing design project file.
There will be instances when the design memo is sent electronically via email. When this is
necessary, the Word file (.doc) should be converted to an Adobe Acrobat File (.pdf) before
sending it. The purpose of this is that a .pdf file cannot be altered.
Low Volume Flexible Pavement Design
Low Volume Roads are defined as those having 137 or less daily ESALs during the 20 year
pavement design period. The 1993 AASHTO Low Volume Design (Table 11) should only be
used for Secondaries or when a reliability of 75% is deemed appropriate.
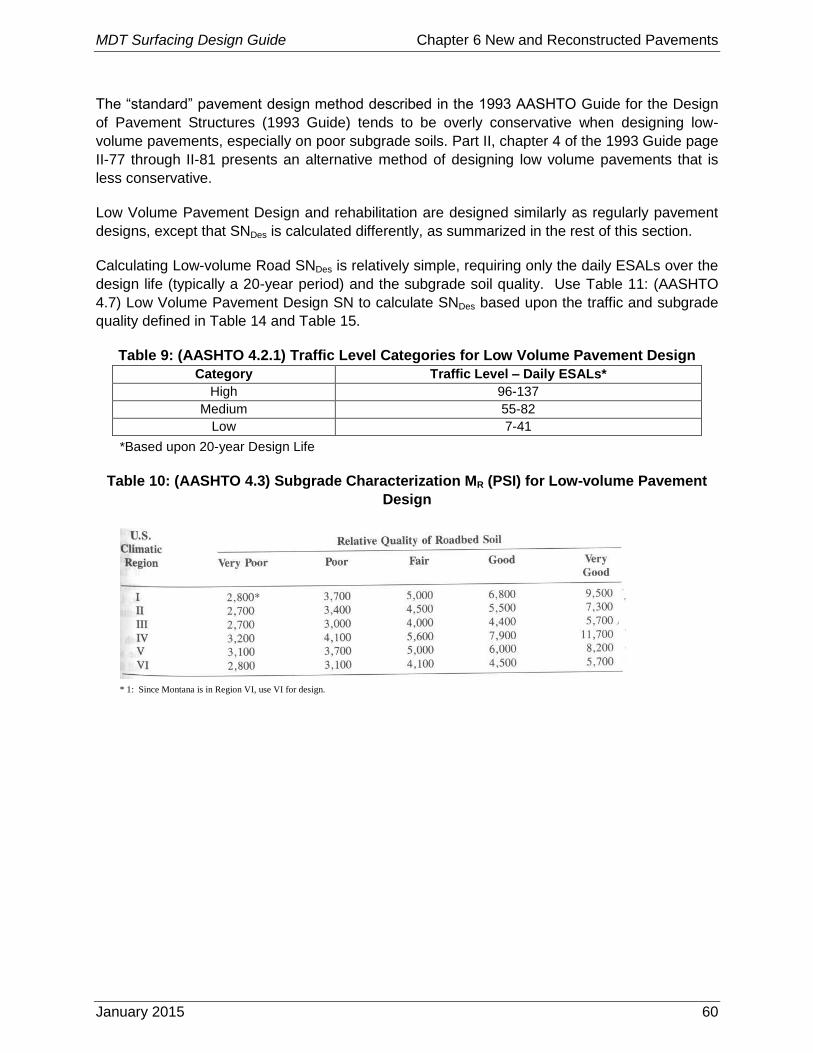
MDT Surfacing Design Guide Chapter 6 New and Reconstructed Pavements
January 2015 60
The “standard” pavement design method described in the 1993 AASHTO Guide for the Design
of Pavement Structures (1993 Guide) tends to be overly conservative when designing low-
volume pavements, especially on poor subgrade soils. Part II, chapter 4 of the 1993 Guide page
II-77 through II-81 presents an alternative method of designing low volume pavements that is
less conservative.
Low Volume Pavement Design and rehabilitation are designed similarly as regularly pavement
designs, except that SNDes is calculated differently, as summarized in the rest of this section.
Calculating Low-volume Road SNDes is relatively simple, requiring only the daily ESALs over the
design life (typically a 20-year period) and the subgrade soil quality. Use Table 11: (AASHTO
4.7) Low Volume Pavement Design SN to calculate SNDes based upon the traffic and subgrade
quality defined in Table 14 and Table 15.
Table 9: (AASHTO 4.2.1) Traffic Level Categories for Low Volume Pavement Design
Category Traffic Level – Daily ESALs*
High 96-137
Medium 55-82
Low 7-41
*Based upon 20-year Design Life
Table 10: (AASHTO 4.3) Subgrade Characterization MR (PSI) for Low-volume Pavement
Design
* 1: Since Montana is in Region VI, use VI for design.
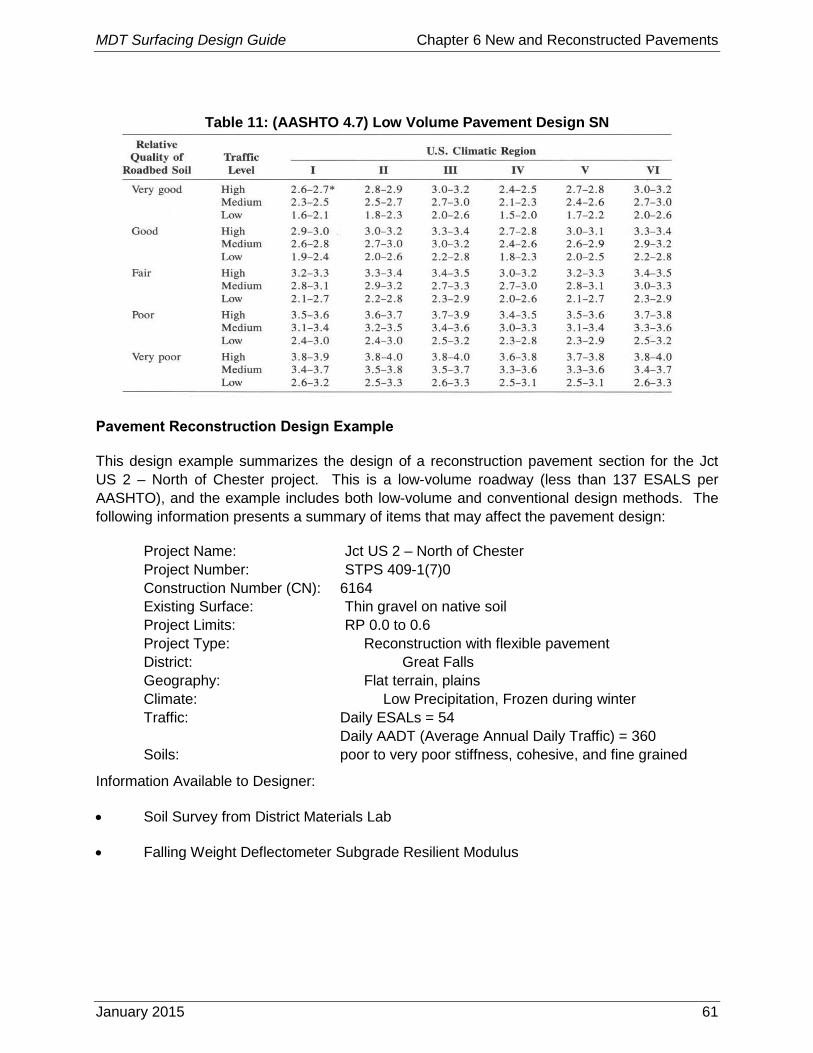
MDT Surfacing Design Guide Chapter 6 New and Reconstructed Pavements
January 2015 61
Table 11: (AASHTO 4.7) Low Volume Pavement Design SN
Pavement Reconstruction Design Example
This design example summarizes the design of a reconstruction pavement section for the Jct
US 2 – North of Chester project. This is a low-volume roadway (less than 137 ESALS per
AASHTO), and the example includes both low-volume and conventional design methods. The
following information presents a summary of items that may affect the pavement design:
Project Name: Jct US 2 – North of Chester
Project Number: STPS 409-1(7)0
Construction Number (CN): 6164
Existing Surface: Thin gravel on native soil
Project Limits: RP 0.0 to 0.6
Project Type: Reconstruction with flexible pavement
District: Great Falls
Geography: Flat terrain, plains
Climate: Low Precipitation, Frozen during winter
Traffic: Daily ESALs = 54
Daily AADT (Average Annual Daily Traffic) = 360
Soils: poor to very poor stiffness, cohesive, and fine grained
Information Available to Designer:
Soil Survey from District Materials Lab
Falling Weight Deflectometer Subgrade Resilient Modulus

MDT Surfacing Design Guide Chapter 6 New and Reconstructed Pavements
January 2015 62
Step #1: Determine Flexible Pavement Design Inputs
Traffic: The daily was provided by MDT’s Traffic Data Unit, the daily ESALs are 54 and the
daily AADT is 360 vehicles. Calculate the ESALs during the 20-year Design Life (Estimating
Traffic – Special Cases):
(54 ESALs/day)(365 days/year)(20 year/design life) =
394,200 daily ESALs/Design Life
Initial and Terminal Serviceability: 4.2, 2.5, and (Initial and Terminal Serviceability)
Reliability Level and Standard Deviation: 75% and 0.45 (Reliability Level and Standard
Deviation)
Drainage Coefficient: 1 (Drainage coefficients)
Number of Construction Stages: 1 (Number of Construction Stages)
Subgrade Resilient Modulus: This pavement design is for the first 0.6 miles of a larger 9.4
mile project. Figure 24 shows the District Soil Survey, where the orange outlining designates
the subgrade soils that will likely be encountered.
The 85th percentile R-Value (R85%) is used for design (Chapter 6). In this case there are 5
subgrade R-Value samples, 4 of which are A-6. Recall that A-6 and A-7 soils are automatically
given an R-Value = 5. Using the process outlined in Subgrade Resilient Modulus, it is
determined that R85% = 5.
R85% is converted to MR(Des) as follows (Chapter 6):
MR(Des) = 1155 + 555*R85th%
= 1155 + 555*(5)
= 3,930 psi
MR(Des) =3,930 psi will be rounded down to MR(Des) =3,750 psi based upon engineering judgment.
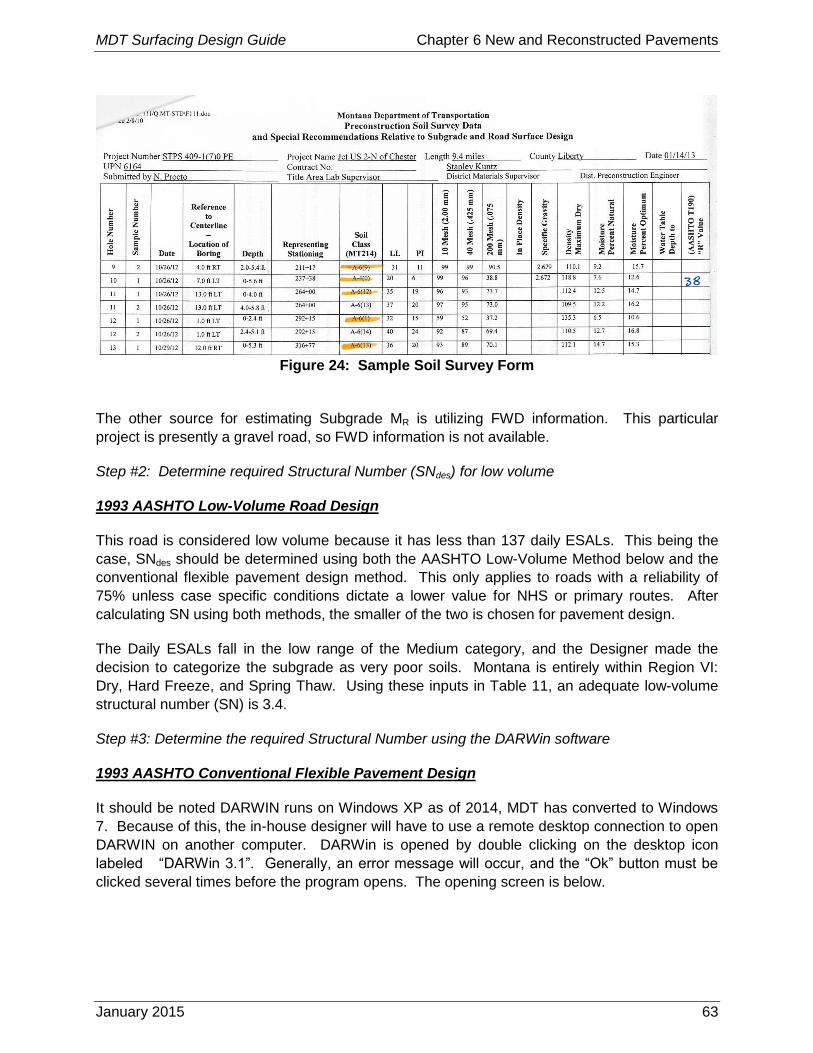
MDT Surfacing Design Guide Chapter 6 New and Reconstructed Pavements
January 2015 63
Figure 24: Sample Soil Survey Form
The other source for estimating Subgrade MR is utilizing FWD information. This particular
project is presently a gravel road, so FWD information is not available.
Step #2: Determine required Structural Number (SNdes) for low volume
1993 AASHTO Low-Volume Road Design
This road is considered low volume because it has less than 137 daily ESALs. This being the
case, SNdes should be determined using both the AASHTO Low-Volume Method below and the
conventional flexible pavement design method. This only applies to roads with a reliability of
75% unless case specific conditions dictate a lower value for NHS or primary routes. After
calculating SN using both methods, the smaller of the two is chosen for pavement design.
The Daily ESALs fall in the low range of the Medium category, and the Designer made the
decision to categorize the subgrade as very poor soils. Montana is entirely within Region VI:
Dry, Hard Freeze, and Spring Thaw. Using these inputs in Table 11, an adequate low-volume
structural number (SN) is 3.4.
Step #3: Determine the required Structural Number using the DARWin software
1993 AASHTO Conventional Flexible Pavement Design
It should be noted DARWIN runs on Windows XP as of 2014, MDT has converted to Windows
7. Because of this, the in-house designer will have to use a remote desktop connection to open
DARWIN on another computer. DARWin is opened by double clicking on the desktop icon
labeled “DARWin 3.1”. Generally, an error message will occur, and the “Ok” button must be
clicked several times before the program opens. The opening screen is below.
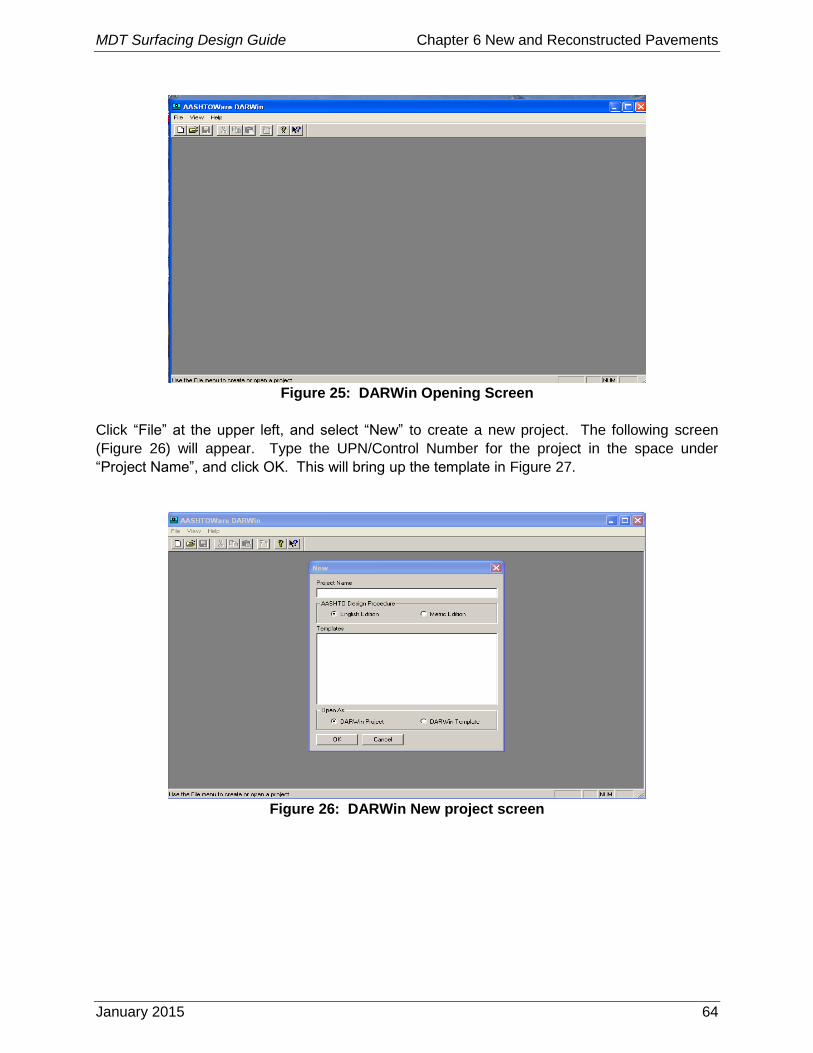
MDT Surfacing Design Guide Chapter 6 New and Reconstructed Pavements
January 2015 64
Figure 25: DARWin Opening Screen
Click “File” at the upper left, and select “New” to create a new project. The following screen
(Figure 26) will appear. Type the UPN/Control Number for the project in the space under
“Project Name”, and click OK. This will bring up the template in Figure 27.
Figure 26: DARWin New project screen
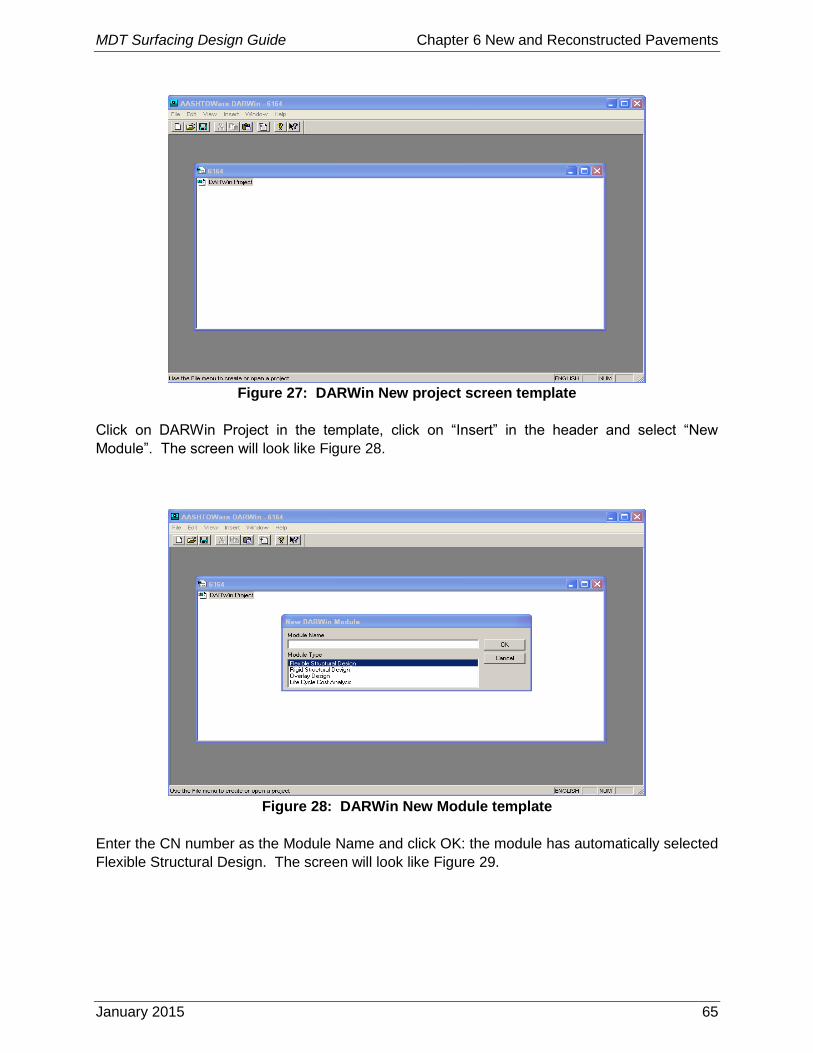
MDT Surfacing Design Guide Chapter 6 New and Reconstructed Pavements
January 2015 65
Figure 27: DARWin New project screen template
Click on DARWin Project in the template, click on “Insert” in the header and select “New
Module”. The screen will look like Figure 28.
Figure 28: DARWin New Module template
Enter the CN number as the Module Name and click OK: the module has automatically selected
Flexible Structural Design. The screen will look like Figure 29.
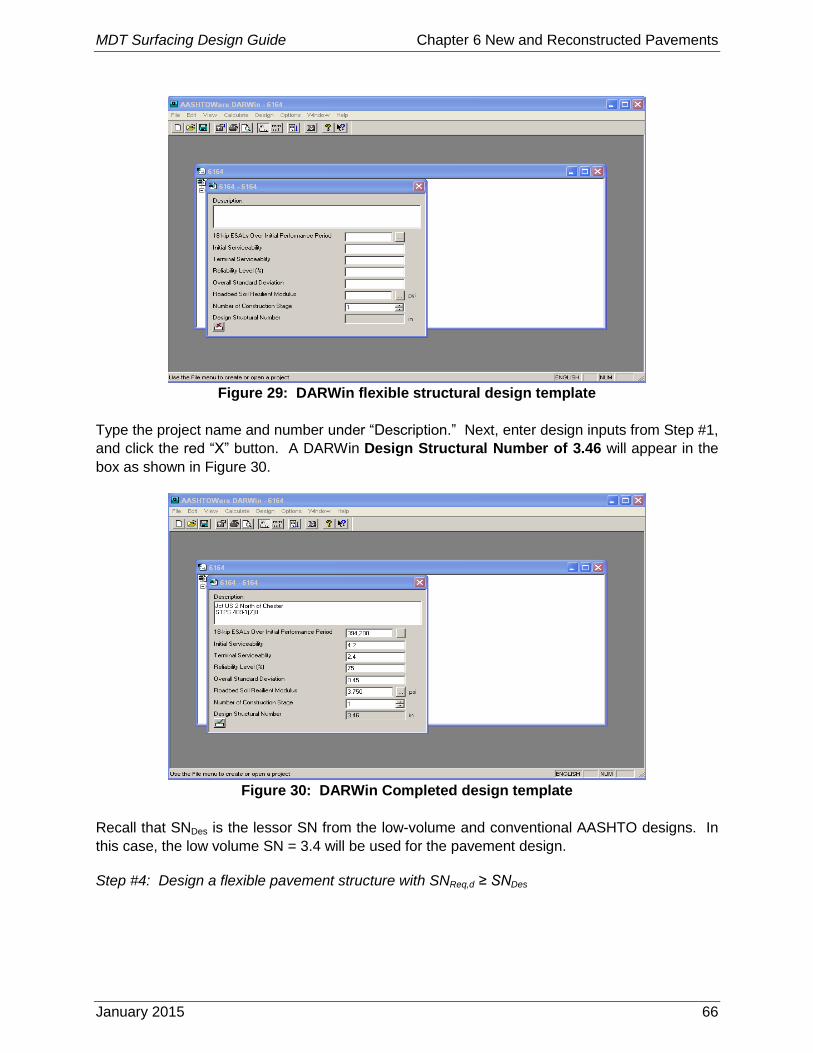
MDT Surfacing Design Guide Chapter 6 New and Reconstructed Pavements
January 2015 66
Figure 29: DARWin flexible structural design template
Type the project name and number under “Description.” Next, enter design inputs from Step #1,
and click the red “X” button. A DARWin Design Structural Number of 3.46 will appear in the
box as shown in Figure 30.
Figure 30: DARWin Completed design template
Recall that SNDes is the lessor SN from the low-volume and conventional AASHTO designs. In
this case, the low volume SN = 3.4 will be used for the pavement design.
Step #4: Design a flexible pavement structure with SNReq,d ≥ SNDes
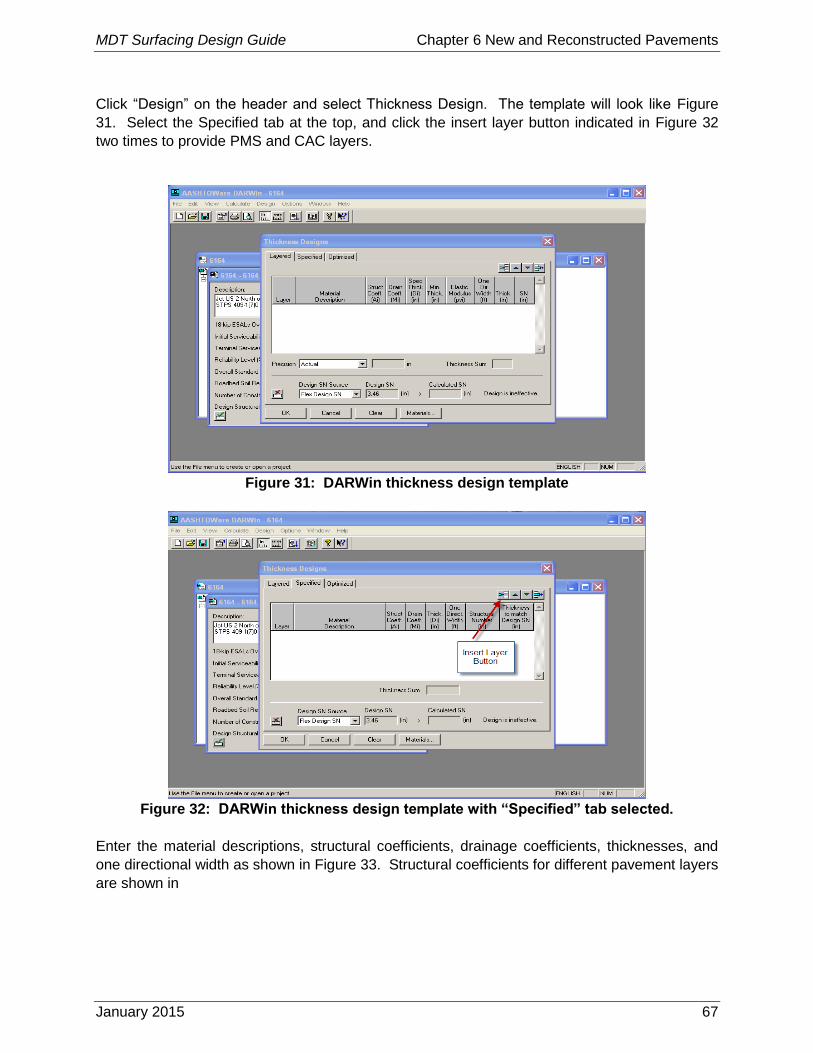
MDT Surfacing Design Guide Chapter 6 New and Reconstructed Pavements
January 2015 67
Click “Design” on the header and select Thickness Design. The template will look like Figure
31. Select the Specified tab at the top, and click the insert layer button indicated in Figure 32
two times to provide PMS and CAC layers.
Figure 31: DARWin thickness design template
Figure 32: DARWin thickness design template with “Specified” tab selected.
Enter the material descriptions, structural coefficients, drainage coefficients, thicknesses, and
one directional width as shown in Figure 33. Structural coefficients for different pavement layers
are shown in
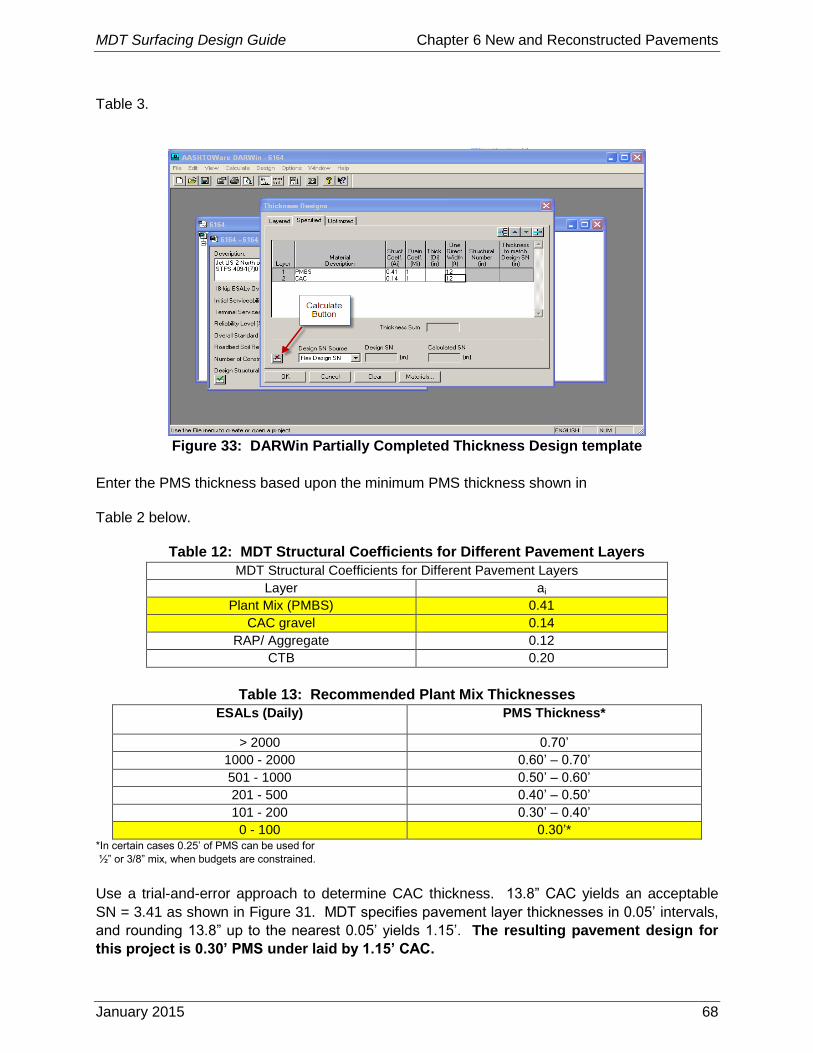
MDT Surfacing Design Guide Chapter 6 New and Reconstructed Pavements
January 2015 68
Table 3.
Figure 33: DARWin Partially Completed Thickness Design template
Enter the PMS thickness based upon the minimum PMS thickness shown in
Table 2 below.
Table 12: MDT Structural Coefficients for Different Pavement Layers
MDT Structural Coefficients for Different Pavement Layers
Layer ai
Plant Mix (PMBS) 0.41
CAC gravel 0.14
RAP/ Aggregate 0.12
CTB 0.20
Table 13: Recommended Plant Mix Thicknesses
ESALs (Daily) PMS Thickness*
> 2000 0.70’
1000 - 2000 0.60’ – 0.70’
501 - 1000 0.50’ – 0.60’
201 - 500 0.40’ – 0.50’
101 - 200 0.30’ – 0.40’
0 - 100 0.30’* *In certain cases 0.25’ of PMS can be used for
½” or 3/8” mix, when budgets are constrained.
Use a trial-and-error approach to determine CAC thickness. 13.8” CAC yields an acceptable
SN = 3.41 as shown in Figure 31. MDT specifies pavement layer thicknesses in 0.05’ intervals,
and rounding 13.8” up to the nearest 0.05’ yields 1.15’. The resulting pavement design for
this project is 0.30’ PMS under laid by 1.15’ CAC.
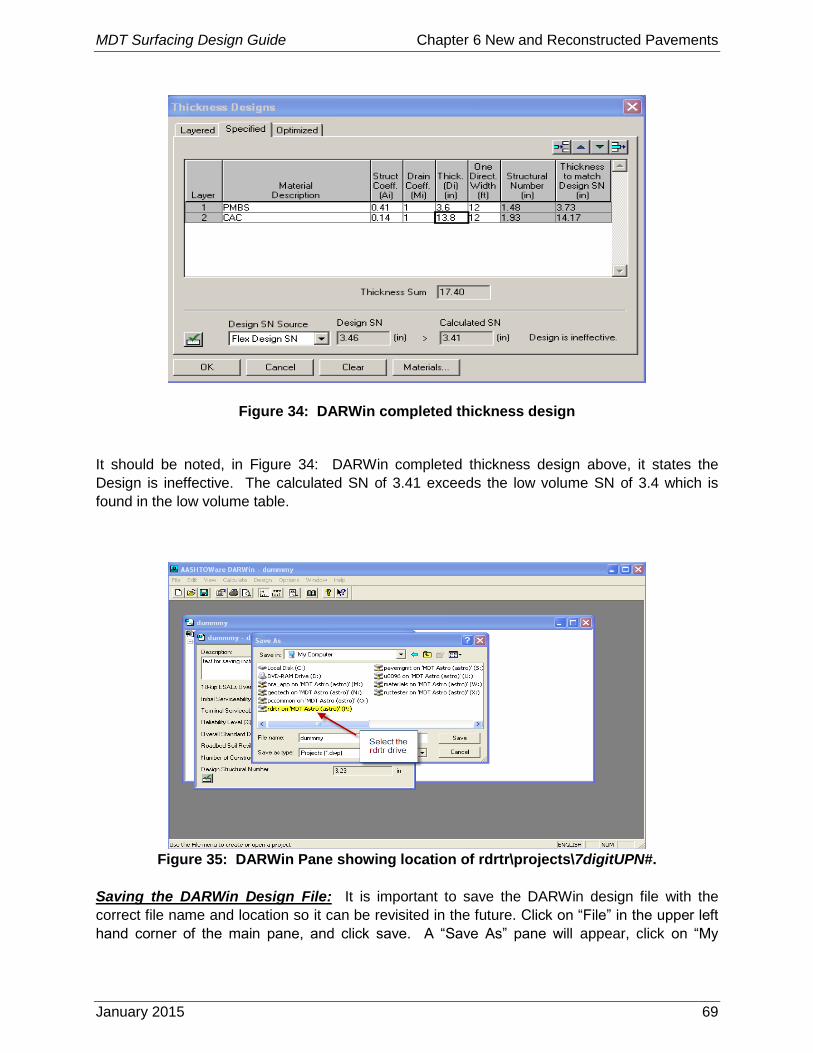
MDT Surfacing Design Guide Chapter 6 New and Reconstructed Pavements
January 2015 69
Figure 34: DARWin completed thickness design
It should be noted, in Figure 34: DARWin completed thickness design above, it states the
Design is ineffective. The calculated SN of 3.41 exceeds the low volume SN of 3.4 which is
found in the low volume table.
Figure 35: DARWin Pane showing location of rdrtr\projects\7digitUPN#.
Saving the DARWin Design File: It is important to save the DARWin design file with the
correct file name and location so it can be revisited in the future. Click on “File” in the upper left
hand corner of the main pane, and click save. A “Save As” pane will appear, click on “My

MDT Surfacing Design Guide Chapter 6 New and Reconstructed Pavements
January 2015 70
Computer”, and the selection will change as shown in Figure 35. Click on the “rdrtr on ‘MDT
Astro (astro)’ drive and click on the “DARWIN” folder. The “Save” button will now save the
project in the standard location for Surfacing Design projects.
The standard file name for DARWin design files is the 7-digit Construction Number (CN), and
DARWin design files are designated by the file extension .dwp. For Jct US 2 – North of
Chester, the file name is 6164000.dwp.
Step #5: Specify Pavement Materials
After the thickness design is completed, the next step is specifying pavement materials. This
pavement consists of a Surface Treatment (if applicable), PMS and CAC. Regarding the base
layer, specifying the base material type is easy because MDT only utilizes CAC for aggregate
base. The PMS type needs to be chosen first since that will determine the need for a surface
treatment. PMS type is chosen based upon PMS quantity and project type shown in
Table 4 and Table 6 found earlier in this manual.
PMS Type Selection
First, calculate PMS tonnage. Based upon discussion with the Road Design Project Manager,
the finished roadway width will be 28’. Use the equation below to calculate PMS tonnage:
Project Length (miles) / project * 5280 ft. / mile * Roadtop Width (ft.)
* PMS thickness (ft.) * 1 yd3/27 ft3 * 3855 lbs. / yd3 * 1 ton PMS / 2000 lbs.
= tons PMS / project
OR:
9.0 miles / project * 5280 ft. / mile * 28’ * 0.30’ * 1 yd3/27 ft3 * 3855 lbs. / yd3 * 1 ton PMS / 2000
lbs.
= 28,496 tons PMS / project
Based upon 28,496 tons,
Table 4 (found earlier in the manual) specifies that either ½” or ¾” Grade S Volumetric should
be specified. Table 6 (found earlier in the manual) specifies ¾” Grade S or Commercial Plant
mix. Since both tables allow ¾” Grade S Volumetric, the designer should specify ¾” Grade S
Volumetric. Climate or local project characteristics may lend themselves to ½” Grade S
Volumetric mix with higher oil content to combat stripping.
PG Binder Selection
The criteria for picking PG Binder type is found earlier in this manual in Table 7.
This reconstruction project has more than 50 daily ESALs, therefore PG 64-28 is specified.
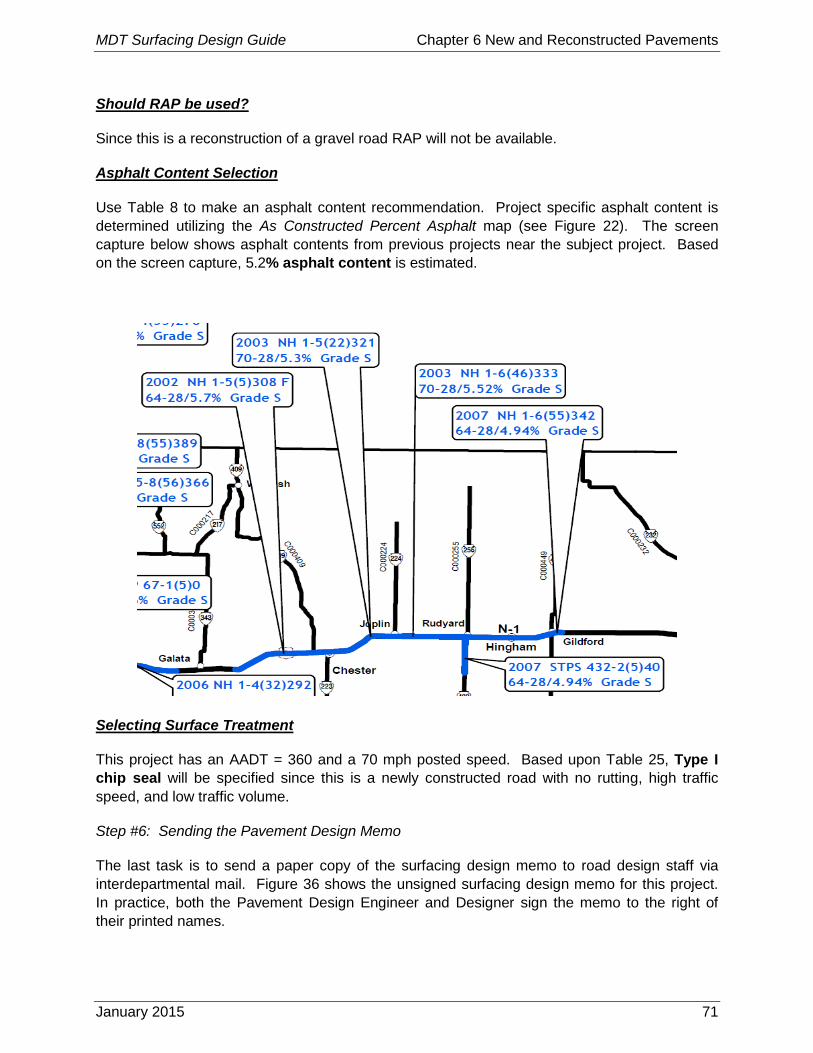
MDT Surfacing Design Guide Chapter 6 New and Reconstructed Pavements
January 2015 71
Should RAP be used?
Since this is a reconstruction of a gravel road RAP will not be available.
Asphalt Content Selection
Use Table 8 to make an asphalt content recommendation. Project specific asphalt content is
determined utilizing the As Constructed Percent Asphalt map (see Figure 22). The screen
capture below shows asphalt contents from previous projects near the subject project. Based
on the screen capture, 5.2% asphalt content is estimated.
Selecting Surface Treatment
This project has an AADT = 360 and a 70 mph posted speed. Based upon Table 25, Type I
chip seal will be specified since this is a newly constructed road with no rutting, high traffic
speed, and low traffic volume.
Step #6: Sending the Pavement Design Memo
The last task is to send a paper copy of the surfacing design memo to road design staff via
interdepartmental mail. Figure 36 shows the unsigned surfacing design memo for this project.
In practice, both the Pavement Design Engineer and Designer sign the memo to the right of
their printed names.

MDT Surfacing Design Guide Chapter 6 New and Reconstructed Pavements
January 2015 72
After completing the surfacing design memo with Microsoft Word, save the .doc file using the 7
digit Construction Number (CN) as the file name. Save the .doc file in the following locations:
Preliminary Surfacing Design Memo: \\astro\rdrtr\projects\6164000\6164000_600.doc
If changes occur to the Preliminary Surfacing Design Memo, then Surfacing Design will provide
a Final Surfacing Design Memo.
Final Surfacing Section Design Memo: \\astro\rdrtr\projects\6164000\6164000_604.doc
Once the memo has been submitted for distribution and saved, the EPS activity may be carded
off.
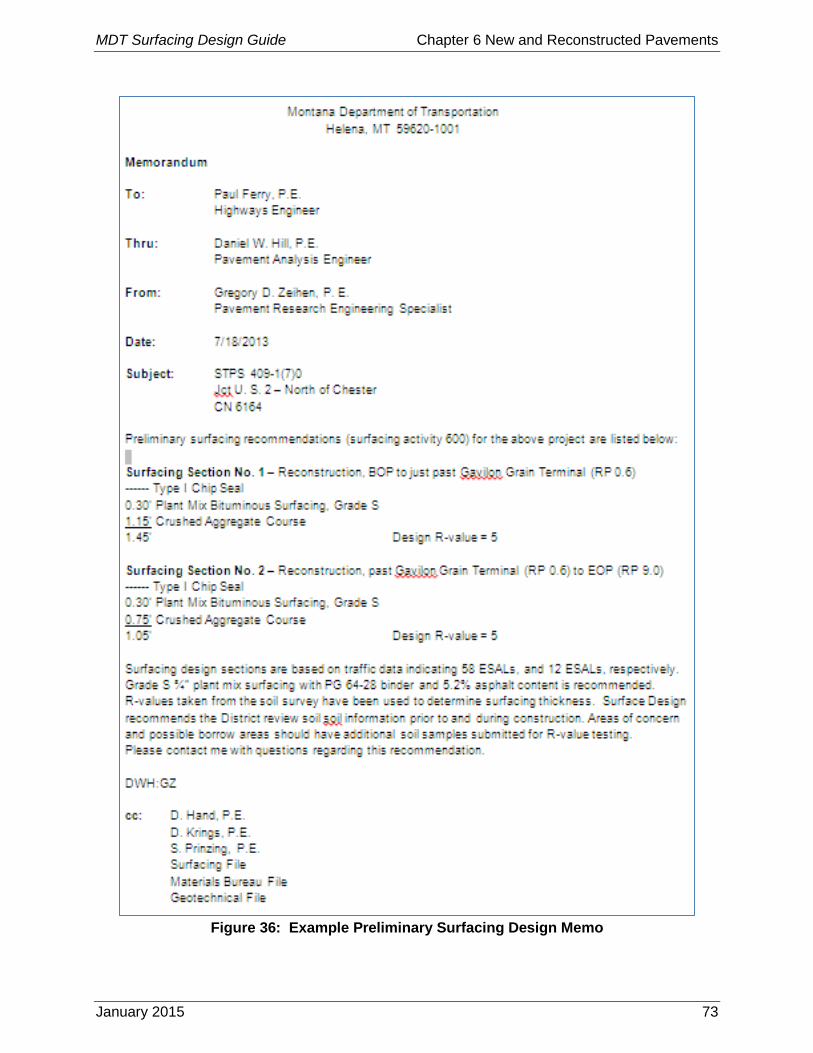
MDT Surfacing Design Guide Chapter 6 New and Reconstructed Pavements
January 2015 73
Figure 36: Example Preliminary Surfacing Design Memo

MDT Surfacing Design Guide Chapter 6 New and Reconstructed Pavements
January 2015 74
This page intentionally blank.
MDT Surfacing Design Guide Chapter 7 Flexible Pavement Rehabilitation
January 2015 75
Flexible Pavement Rehabilitation Chapter 7
Rehabilitation is a strategy to extend a pavement’s useful life through pavement structure
improvement utilizing the in-place materials. Rehabilitation is considered in two categories:
minor and major. These categories are explained further in Table 14.
Table 14: Minor vs. Major Rehabilitation
Category Minor Rehabilitation Major Rehabilitation
Surface Engineering Engineered Design Engineered Design
Geometric Design
Standards As Built
Ranging from As-Built to Current
Standards
Applied treatments
0.2’ ≤overlay ≤0.3’
Milling ≤ 0.2’
No exposure of base gravel
≥0.2’ overlay w/ Grading
Pulverization
Mill, recycle and overlay
Exposed gravel may be treated or
modified
How Needs are Identified Observed Distress Observed Distress
Geometrics
Design Life ≥10 years ≥20 years
7.1 MINOR REHABILITATION
The intent of these projects is to rehabilitate the existing pavement surface through an
engineered approach that considers the observed pavement distress and in-place materials.
Design guidelines for minor rehabilitation projects are defined in MDT / FHWA’s Guidelines for
Nomination and Development of Pavement Projects. This Guideline is available upon request.
Design Method: Engineered judgment, engineered overlay (see Chapter 8), estimated
structural number on assumed properties.
Design Life: 10-years design life.
Minor rehabilitation is intended for pavements that are structurally sound to restore the
functional condition of the pavement. This usually refers to restoring the ride and rut condition
of the pavement. Pavements where there is significant load-associated cracking or obvious
base course and subgrade issues should not be minor rehabilitated, as minor rehabilitation of
these pavements will probably not last the required 10 year design life.
Some minor rehabilitation treatments that have been utilized by MDT in the past include:
Asphalt overlay
MDT Surfacing Design Guide Chapter 7 Flexible Pavement Rehabilitation
January 2015 76
Asphalt mill and fill
Cold in-place recycling overlayed by a chip seal or an asphalt overlay
Hot in-place recycling with chip seal
The information needed for minor rehabilitation design includes observation of existing
pavement distress and in-place materials. Observation includes analyzing PvMS pavement
condition data to determine the pavement’s rut, ride, and cracking characteristics and visual
observation done during the preliminary field review. Characterization of the in-place materials
usually pertains to the PMS layer only, and usually consists of pavement cores and GPR
analysis to determine PMS condition and thickness.
Since information is not collected for the base course or subgrade materials, it is not usually
practical to design these projects using the 1993 AASHTO structural number method. Instead,
engineering judgment and past pavement performance are used to determine the pavement
treatment that cost effectively provides the desired design life. Using GPR thickness data and
FWD subgrade information, a structural number can be estimated.
Minor rehabilitation should be designed to correct the most critical pavement distress. The
critical pavement distress for minor rehabilitation is usually minor roughness and alligator
cracking or minor to major rutting and transverse cracking. Use Table 15 to help determine the
appropriate minor rehab strategy.
Table 15: Minor Rehabilitation Goals and Treatment Selection
Distress Minor Rehabilitation
Goal Example Treatments
Minor Alligator
Cracking
Add pavement
structure and seal
pavement
Mill <= 0.2’, Overlay <= 0.3’, cold or hot in-place recycle with overlay
Rutting
Correct or remove
pavement ruts
Follow the following guidelines to determine Treatment:
1. Establish that Rutting is confined to upper PMS layer. If rutting
exists in lower layers, it is not a Minor Rehabilitation Candidate.
2. Establish whether PMS is stable or unstable. If rutting is an
ongoing phenomenon the PMS may be unstable. If rut depth
has stabilized and is not becoming deeper, the PMS is stable.
This determination is often made by observing PvMS data and
graphing rut depth vs. time.
Stable PMS: Microsurfacing, PMS leveling with overlay, mill/fill
Unstable PMS: mill/fill as deep as necessary to remove unstable
PMS.
Do not use in-place recycling to treat stable or unstable rutting
unless an overlay is placed over the recycled material. Rutting
has been shown to reoccur when in-place recycling previously rutted
pavements.

MDT Surfacing Design Guide Chapter 7 Flexible Pavement Rehabilitation
January 2015 77
Distress Minor Rehabilitation
Goal Example Treatments
Minor
Roughness Restore ride quality
Overlay that includes a leveling quantity, mill/fill, cold or hot in place
recycle with overlay
Minor
Transverse
Cracking
(doesn’t affect
ride)
Seal pavement with
emphasis on
transverse cracks
Seal cracks followed by leveling course and overlay, mill fill, hot in-
place recycle followed by chip seal, cold in-place recycle followed by
chip seal (low-volume only)
Major
Transverse
Cracking
(affects ride)
Restore ride, seal
cracks, Add
pavement structure
Mill/fill (low volume), Mill/fill w/ additional overlay, cold or hot in-place
recycle with overlay
7.1.1 Major Rehabilitation
The intent of these projects is to rehabilitate the existing pavement structure through an
engineered approach that considers the observed pavement distress, in-place materials, and
roadway geometrics. Milling operations may be > 0.20 ft. and may expose base gravel that can
be treated or modified. New right-of-way and utility relocation may be required to improve
geometrics, to flatten slopes, or enhance safety. Appropriate soil survey work, subsurface
analysis, traffic data and accident data must be collected.
Major rehabilitation usually occurs in situations where:
An existing pavement is in good condition, but pavement structure needs to be added to
accommodate growing traffic levels
An existing pavement is distressed and the distress cannot be remediated with lesser
pavement treatments
The existing pavement is in good condition but is too narrow for growing traffic levels. In
this case, the existing pavement is usually major rehabilitated and widened to meet
today’s roadway width standards.
The following bullets provide design guidelines for major rehabilitation projects defined in MDT /
FHWA’s Guidelines for Nomination and Development of Pavement Projects.
Design Method: An engineered design based upon a thorough pavement investigation
and using the design method described in Chapter 7.
Design Life: 20-years design life.
There are instances where major rehabilitation projects are upgraded to reconstruction projects.
This usually occurs where the horizontal or vertical road alignment changes significantly to meet
geometric design standards. As a rule of thumb, major rehabilitation projects where more than
25% of the project length needs to be realigned should be upgraded to reconstruction.
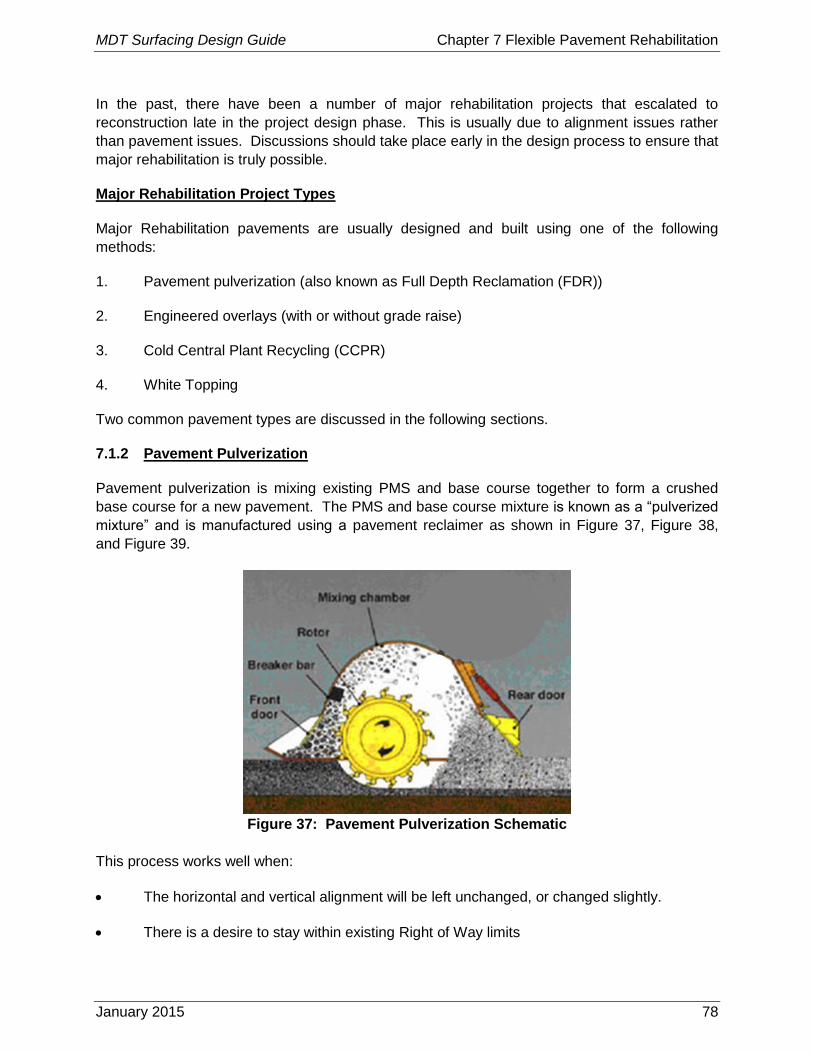
MDT Surfacing Design Guide Chapter 7 Flexible Pavement Rehabilitation
January 2015 78
In the past, there have been a number of major rehabilitation projects that escalated to
reconstruction late in the project design phase. This is usually due to alignment issues rather
than pavement issues. Discussions should take place early in the design process to ensure that
major rehabilitation is truly possible.
Major Rehabilitation Project Types
Major Rehabilitation pavements are usually designed and built using one of the following
methods:
1. Pavement pulverization (also known as Full Depth Reclamation (FDR))
2. Engineered overlays (with or without grade raise)
3. Cold Central Plant Recycling (CCPR)
4. White Topping
Two common pavement types are discussed in the following sections.
7.1.2 Pavement Pulverization
Pavement pulverization is mixing existing PMS and base course together to form a crushed
base course for a new pavement. The PMS and base course mixture is known as a “pulverized
mixture” and is manufactured using a pavement reclaimer as shown in Figure 37, Figure 38,
and Figure 39.
Figure 37: Pavement Pulverization Schematic
This process works well when:
The horizontal and vertical alignment will be left unchanged, or changed slightly.
There is a desire to stay within existing Right of Way limits
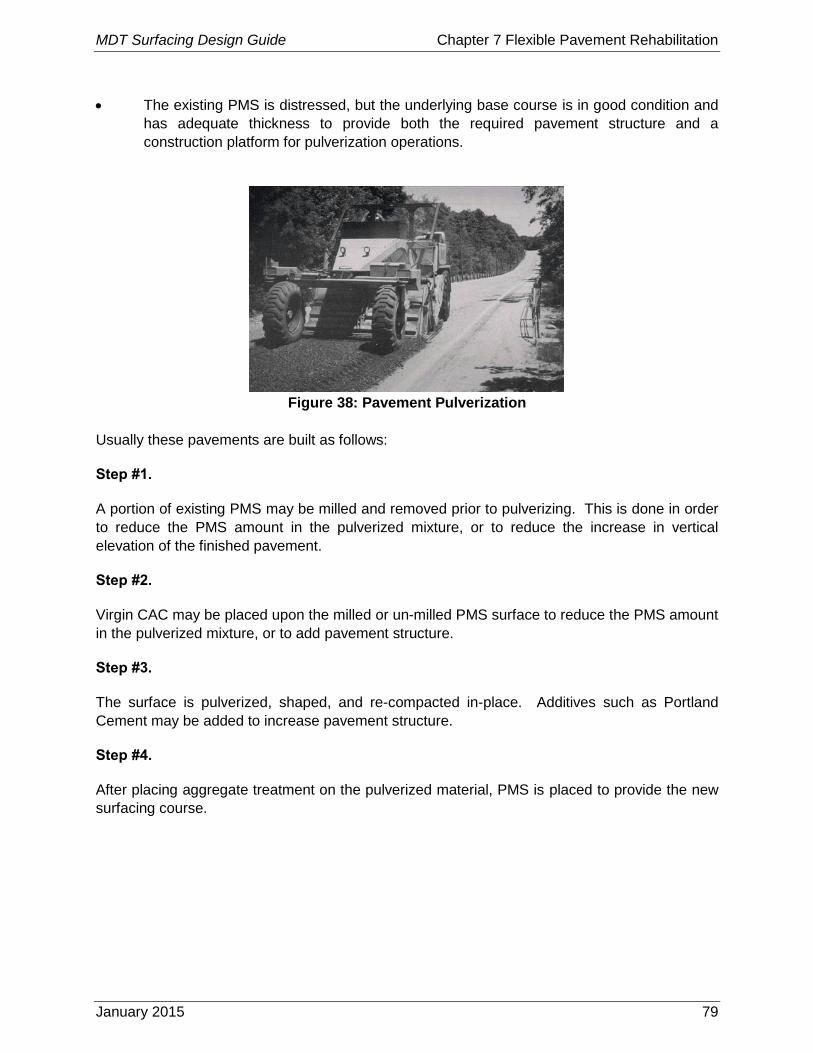
MDT Surfacing Design Guide Chapter 7 Flexible Pavement Rehabilitation
January 2015 79
The existing PMS is distressed, but the underlying base course is in good condition and
has adequate thickness to provide both the required pavement structure and a
construction platform for pulverization operations.
Figure 38: Pavement Pulverization
Usually these pavements are built as follows:
Step #1.
A portion of existing PMS may be milled and removed prior to pulverizing. This is done in order
to reduce the PMS amount in the pulverized mixture, or to reduce the increase in vertical
elevation of the finished pavement.
Step #2.
Virgin CAC may be placed upon the milled or un-milled PMS surface to reduce the PMS amount
in the pulverized mixture, or to add pavement structure.
Step #3.
The surface is pulverized, shaped, and re-compacted in-place. Additives such as Portland
Cement may be added to increase pavement structure.
Step #4.
After placing aggregate treatment on the pulverized material, PMS is placed to provide the new
surfacing course.
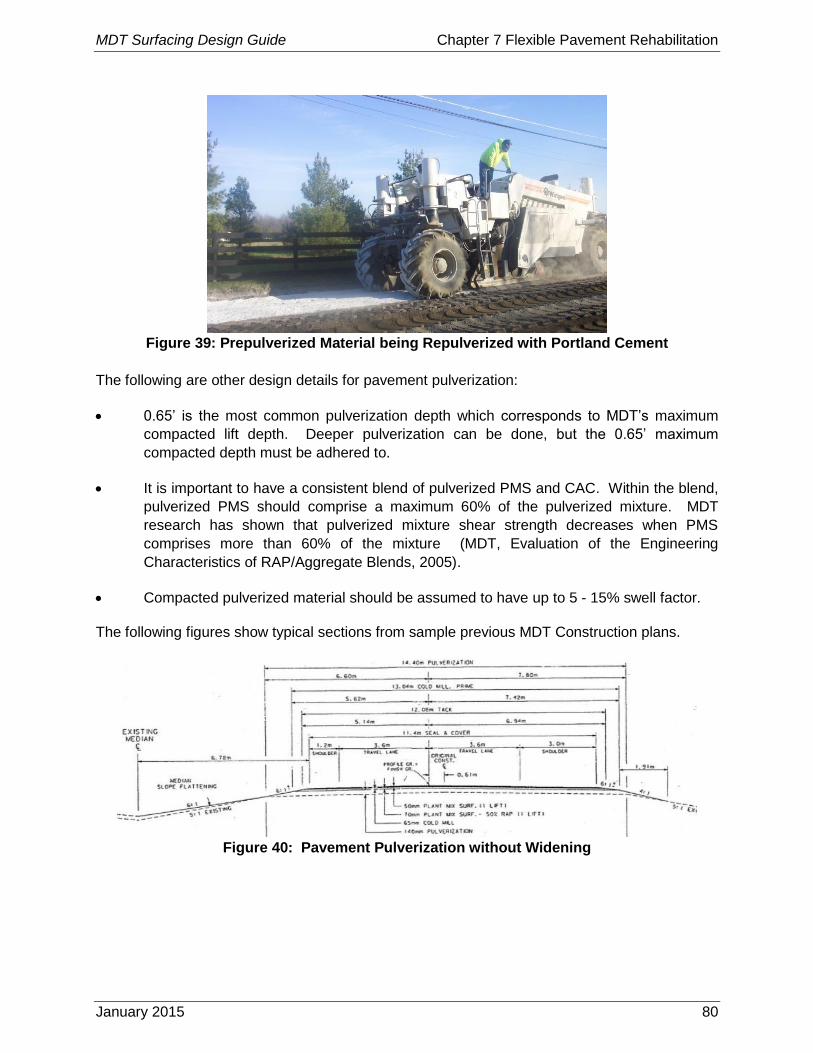
MDT Surfacing Design Guide Chapter 7 Flexible Pavement Rehabilitation
January 2015 80
Figure 39: Prepulverized Material being Repulverized with Portland Cement
The following are other design details for pavement pulverization:
0.65’ is the most common pulverization depth which corresponds to MDT’s maximum
compacted lift depth. Deeper pulverization can be done, but the 0.65’ maximum
compacted depth must be adhered to.
It is important to have a consistent blend of pulverized PMS and CAC. Within the blend,
pulverized PMS should comprise a maximum 60% of the pulverized mixture. MDT
research has shown that pulverized mixture shear strength decreases when PMS
comprises more than 60% of the mixture (MDT, Evaluation of the Engineering
Characteristics of RAP/Aggregate Blends, 2005).
Compacted pulverized material should be assumed to have up to 5 - 15% swell factor.
The following figures show typical sections from sample previous MDT Construction plans.
Figure 40: Pavement Pulverization without Widening
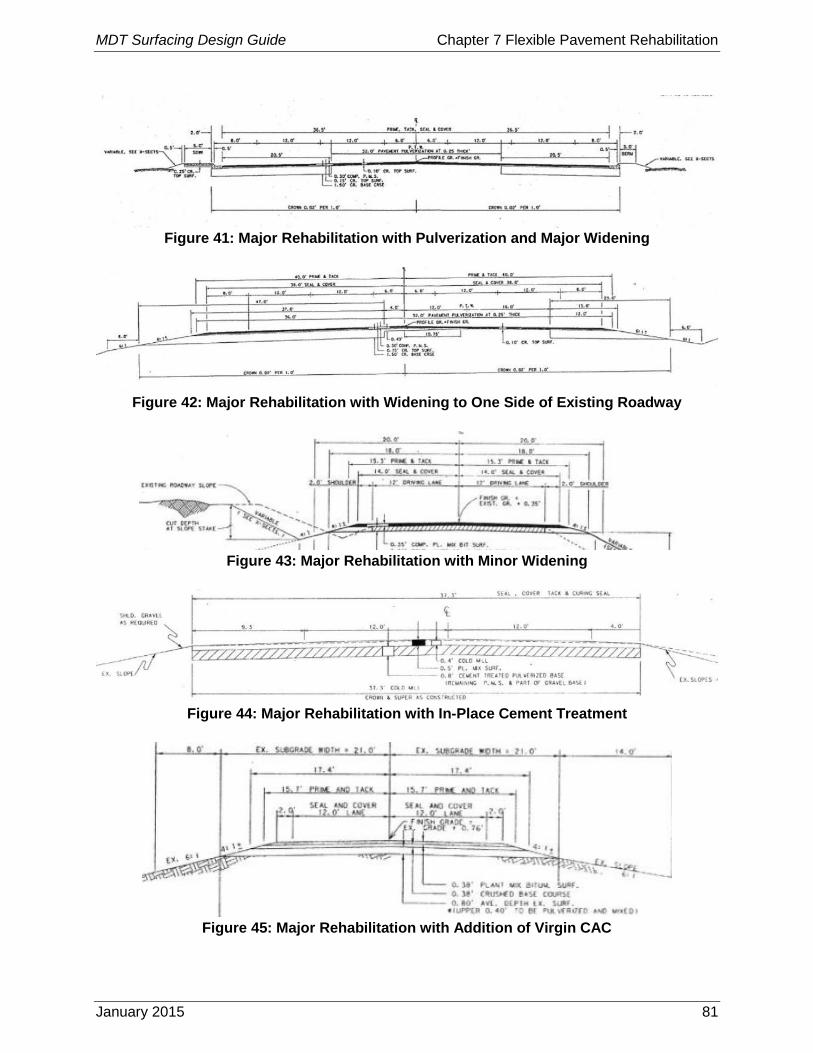
MDT Surfacing Design Guide Chapter 7 Flexible Pavement Rehabilitation
January 2015 81
Figure 41: Major Rehabilitation with Pulverization and Major Widening
Figure 42: Major Rehabilitation with Widening to One Side of Existing Roadway
Figure 43: Major Rehabilitation with Minor Widening
Figure 44: Major Rehabilitation with In-Place Cement Treatment
Figure 45: Major Rehabilitation with Addition of Virgin CAC
MDT Surfacing Design Guide Chapter 7 Flexible Pavement Rehabilitation
January 2015 82
Project Selection
The appropriate candidate for pulverization needs to be verified early in the design stage. One
factor to successful pulverization is to have limited to no change to the vertical alignment. If the
existing vertical alignment undulates compared to the corrected vertical profile pulverization is
not feasible. The primary reason is due to the conflict where the existing profile protrudes up
into the proposed typical section (cut sections).
Pulverization depth is limited by the ability to compact the blended base. MDT specs call for a
maximum of 8” compacted lift. Some reclaimers can pulverize up to 20 inches deep, however
the maximum pulverization depth is driven by the plant mix thickness. The existing plant mix
should not be more than 8 inches (0.65’) thick for pulverization. At that maximum, a 16 inch
depth would be required to obtain a 50/50 blend. In this case, 8 inches would be required to be
bladed off in order to compact the remaining pulverized 8 inches per MDT’s specs. This could
be a viable option for projects that incorporate widening.
Caution should be used when considering pulverization on projects with existing cement treated
base. CTB can be pulverized but can cause difficulties. A combination of milling and
pulverization may be necessary. Also, MDT’s CTB aggregate gradation allows up to 20% minus
200 mesh, while having a maximum aggregate size of 1 inch. This has been rarely encountered
in Montana.
On projects with very weak, soft subgrades and thin existing gravel sections the use of
pulverization should be questioned. When utilizing the pulverized base for design, the bottom
0.2’ – 0.4’ should not be accounted to contribute to the structural number.
When the soil survey encounters high fines in the base, again the designer should question the
use of pulverization. Pulverized plant mix typically contains around 8% minus 200 mesh. When
blended with base, the plant mix will help reduce the fines content of the mixture. It should be
noted that historically MDT’s gravel specification allowed for up to 12% minus 200 mesh,
whereas the current specification allows for only up to 8% passing the 200 mesh. The
estimated weighted average of the pulverized blend should not exceed 10% passing the 200
mesh unless approved by the Pavement Analysis Engineer.
Pulverized Pavement Constructability
MDT has encountered problems with constructability of pulverization projects. The most
common problem is the pulverized surface being unable to support traffic before it is paved
over. This may result from thin existing pavement thickness and/or fine-grained, saturated
subgrade materials. Either of these scenarios may result in subgrade material pumping up into
pulverized section and ruining the pulverized material.
A thorough pavement evaluation of the following needs to be completed before pavement
design:
PMS thickness: The PMS thickness should be measured continuously along the
project length. The purpose of this is to determine the pulverization depth and/or milling
MDT Surfacing Design Guide Chapter 7 Flexible Pavement Rehabilitation
January 2015 83
depth needed to meet the blend requirements, and to ensure the pulverizer teeth do not
extend into the subgrade material. GPR is an effective way to continuously measure
PMS thickness. The soil survey PMS depths can also be used.
CAC thickness and condition: A soils survey (MT-207) should be completed to
determine the in-place CAC thickness, condition, and moisture level. Falling Weight
Deflectometer data can be used in addition to the soil survey to determine CAC stiffness.
Subgrade Type and condition: Similar to CAC, both a soil survey and FWD testing can
be used to identify unstable subgrades. Subgrade moisture contents above optimum
may indicate soft, pumpable soils.
After the pavement evaluation has been completed and pavement pulverization is determined to
be feasible, follow these design procedures to improve constructability:
Do not lower pavement grade. The finished pulverized surface should be at or above
the existing pavement grade. Lowering the grade will reduce pavement structure and
reduce construction platform strength.
Include contract language to not allow pulverization in the wetter spring months.
Include contract language to limit the amount of time both public and Contractor
traffic is allowed to travel on the pulverized material. Provide alternative haul routes
so heavy construction traffic does not travel on pulverized material.
7.1.3 Flexible Pavement Rehabilitation Design
MDT’s pavement rehabilitation design is based upon the method presented in the 1993
AASHTO Guide Part III, with modifications presented in this Design Manual.
The following equation is used to design rehabilitation projects:
SNdgn – SNeff = SNol
Where:
SNdgn = The structural number required for future traffic loading. Also known as
SNf (Structural number to carry future traffic) in the 1993 AASHTO Guide.
SNeff = Existing pavement structural number.
SNol = The Structural Number deficiency between the existing pavement and that
needed for the future pavement design. This is the amount of pavement
structure that needs to be added with an overlay.
Generally, pavement rehabilitation design includes the following steps:
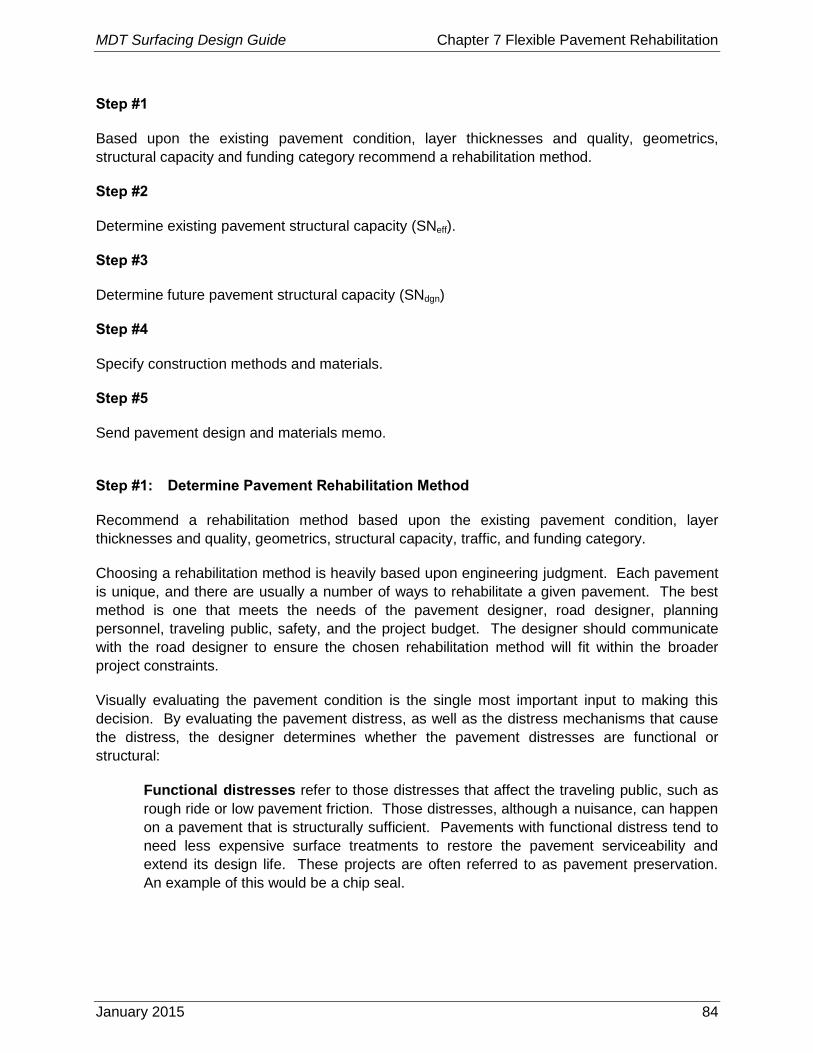
MDT Surfacing Design Guide Chapter 7 Flexible Pavement Rehabilitation
January 2015 84
Step #1
Based upon the existing pavement condition, layer thicknesses and quality, geometrics,
structural capacity and funding category recommend a rehabilitation method.
Step #2
Determine existing pavement structural capacity (SNeff).
Step #3
Determine future pavement structural capacity (SNdgn)
Step #4
Specify construction methods and materials.
Step #5
Send pavement design and materials memo.
Step #1: Determine Pavement Rehabilitation Method
Recommend a rehabilitation method based upon the existing pavement condition, layer
thicknesses and quality, geometrics, structural capacity, traffic, and funding category.
Choosing a rehabilitation method is heavily based upon engineering judgment. Each pavement
is unique, and there are usually a number of ways to rehabilitate a given pavement. The best
method is one that meets the needs of the pavement designer, road designer, planning
personnel, traveling public, safety, and the project budget. The designer should communicate
with the road designer to ensure the chosen rehabilitation method will fit within the broader
project constraints.
Visually evaluating the pavement condition is the single most important input to making this
decision. By evaluating the pavement distress, as well as the distress mechanisms that cause
the distress, the designer determines whether the pavement distresses are functional or
structural:
Functional distresses refer to those distresses that affect the traveling public, such as
rough ride or low pavement friction. Those distresses, although a nuisance, can happen
on a pavement that is structurally sufficient. Pavements with functional distress tend to
need less expensive surface treatments to restore the pavement serviceability and
extend its design life. These projects are often referred to as pavement preservation.
An example of this would be a chip seal.

MDT Surfacing Design Guide Chapter 7 Flexible Pavement Rehabilitation
January 2015 85
Structural distresses, such as deep pavement rutting and alligator cracking, are an
indication of inadequate pavement. Structural distress often needs deeper, more
expensive rehabilitation in order to meet the desired design life.
Engineered overlays are the preferred method to rehabilitate pavements with functional distress
that require additional structure. Milling, pulverization or in-place recycling should be utilized to
treat structural distresses. Figure 46 shows a flowchart to serve as a starting point when
choosing a rehabilitation method. In addition to the issues defined in the flowchart, some other
issues that influence this decision are:
Traffic Volume: There are times when heavy traffic volumes will influence the
rehabilitation treatment decision, where the design team may want a more conservative
treatment than shown in the flowchart.
Conversely, on low volume roads there may be a desire to be less conservative in the
pavement design. This may mean an engineered solution that effectively “bridges” over
a problem pavement rather than treats its structural distress directly. An example of this
is designing a thick engineered overlay over a pavement with base course distress.
Pavement Grade Raise: Often, in order to reduce roadside slope work or reduce right-
of-way take, the pavement rehabilitation needs to be designed to reduce or eliminate
pavement grade raise.

MDT Surfacing Design Guide Chapter 7 Flexible Pavement Rehabilitation
January 2015 86
This page intentionally blank.
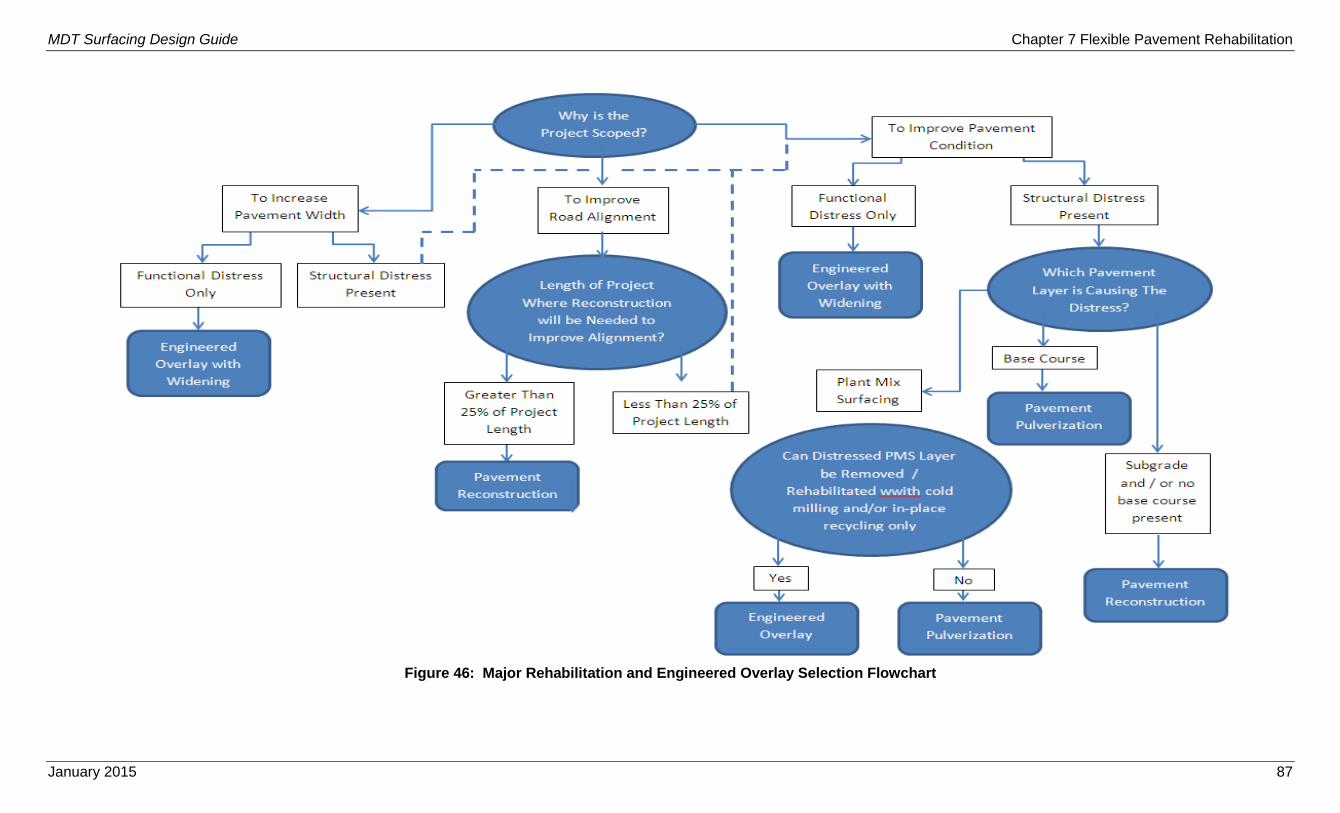
MDT Surfacing Design Guide Chapter 7 Flexible Pavement Rehabilitation
January 2015 87
Figure 46: Major Rehabilitation and Engineered Overlay Selection Flowchart

MDT Surfacing Design Guide Chapter 7 Flexible Pavement Rehabilitation
January 2015 88
This page intentionally blank.
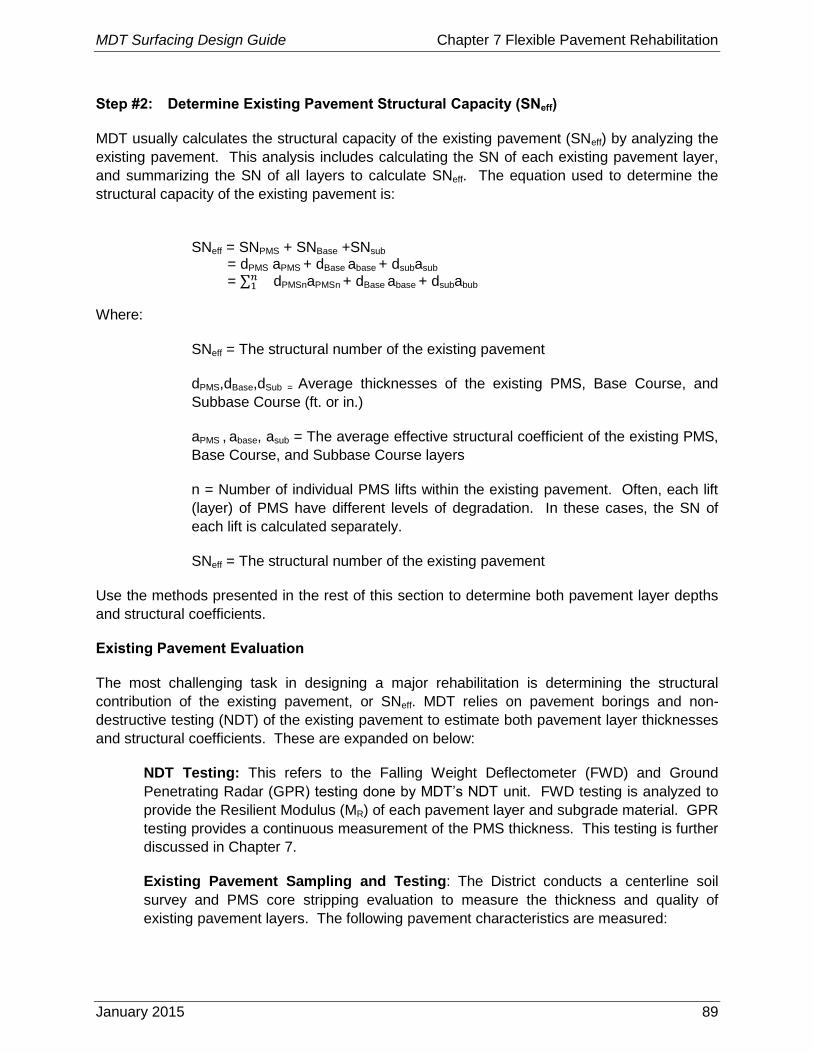
MDT Surfacing Design Guide Chapter 7 Flexible Pavement Rehabilitation
January 2015 89
Step #2: Determine Existing Pavement Structural Capacity (SNeff)
MDT usually calculates the structural capacity of the existing pavement (SNeff) by analyzing the
existing pavement. This analysis includes calculating the SN of each existing pavement layer,
and summarizing the SN of all layers to calculate SNeff. The equation used to determine the
structural capacity of the existing pavement is:
SNeff = SNPMS + SNBase +SNsub = dPMS aPMS + dBase abase + dsubasub
= ∑𝑛1 dPMSnaPMSn + dBase abase + dsubabub
Where:
SNeff = The structural number of the existing pavement
dPMS,dBase,dSub = Average thicknesses of the existing PMS, Base Course, and
Subbase Course (ft. or in.)
aPMS , abase, asub = The average effective structural coefficient of the existing PMS,
Base Course, and Subbase Course layers
n = Number of individual PMS lifts within the existing pavement. Often, each lift
(layer) of PMS have different levels of degradation. In these cases, the SN of
each lift is calculated separately.
SNeff = The structural number of the existing pavement
Use the methods presented in the rest of this section to determine both pavement layer depths
and structural coefficients.
Existing Pavement Evaluation
The most challenging task in designing a major rehabilitation is determining the structural
contribution of the existing pavement, or SNeff. MDT relies on pavement borings and non-
destructive testing (NDT) of the existing pavement to estimate both pavement layer thicknesses
and structural coefficients. These are expanded on below:
NDT Testing: This refers to the Falling Weight Deflectometer (FWD) and Ground
Penetrating Radar (GPR) testing done by MDT’s NDT unit. FWD testing is analyzed to
provide the Resilient Modulus (MR) of each pavement layer and subgrade material. GPR
testing provides a continuous measurement of the PMS thickness. This testing is further
discussed in Chapter 7.
Existing Pavement Sampling and Testing: The District conducts a centerline soil
survey and PMS core stripping evaluation to measure the thickness and quality of
existing pavement layers. The following pavement characteristics are measured:

MDT Surfacing Design Guide Chapter 7 Flexible Pavement Rehabilitation
January 2015 90
o PMS, base, and subbase thicknesses,
o Base Course Soils Class, Gradation, Atterburg Limits, Natural (in-place) Moisture
Content, Optimum (Proctor) Moisture Content, and R-Value. Usually there is not
enough material from any given bore hole, so composite base course samples
from a number of bore holes are combined. Note that this results in “average”
properties of the in-place base materials.
o Subgrade Soils Class, Gradation, Atterburg Limits, Natural (in-place) Moisture
Content, Optimum (Proctor) Moisture Content and R-Value.
The soil sample is done in accordance with MT-207, and the results are presented on Materials
Form 111. An example Form 111 is shown in Figure 24.
7.1.4 Non-Destructive Testing Overview
The NDT Unit is responsible for conducting Falling Weight Deflectometer (FWD) and Ground
Penetrating Radar (GPR) testing on the state highway network on an ongoing basis. FWD and
GPR testing can only occur on bound pavement surfaces. NDT provides analyzed data to both
internal and external customers. Testing is done as follows:
Network level FWD/GPR testing is done on all state roadways on a 5-year rotation,
meaning that there should be FWD and GPR information available that was collected in
the last 5 years for all pavements. Network level FWD testing is done at 820 ft.
increments within the outside wheel path of the driving lane in one direction only on 2
lane roads. For Interstate and multi-lane facilities, excluding turning lanes, both
directions are tested. GPR is collected continuously.
Project level FWD/GPR: In addition to Network level testing, project level testing is
done prior to road construction projects. Project level FWD testing is done at 330 ft.
increments within the outside wheel path, of the driving lane in one direction only (or in
both directions of Interstate Pavements). GPR testing is done continuously. This testing
is done before Surfacing Design’s preliminary surfacing design activity (Act. 600). The
following paragraphs summarize the testing and reporting of different types of projects.
Reconstruction: The NDT unit analyzes this data and backcalculates the in-situ
pavement structure MR (which includes subgrade, base and pavement
surfacing). The existing pavement and base layer MR is not needed in the
calculations for new pavement structure because it will be eliminated because of
a new surfacing section. Surfacing Design receives the data in an Excel
spreadsheet summarizing the subgrade MR.
Major Rehabilitation: The NDT unit analyzes this data and determines the MR
of the in-situ subgrade, base course, and surfacing materials. GPR is also used
to calculate PMS thickness continuously along the project length. Both GPR and
FWD information are analyzed, graphed, and provided to surfacing design in an
Excel spreadsheet.
MDT Surfacing Design Guide Chapter 7 Flexible Pavement Rehabilitation
January 2015 91
Minor Rehabilitation: The NDT unit also tests Minor Rehabilitation projects for
both FWD and GPR. The NDT unit then provides the in-situ pavement structure
MR to the surfacing design unit. GPR is analyzed for existing pavement section
thicknesses used for back calculation. The analyzed GPR depths may also be
used to determine appropriate milling depths.
Pavement Preservation: GPR testing is done on lower traffic volume projects
to report PMS thickness to ensure there is adequate PMS thickness for milling
operations. GPR testing is not done for pavement preservation projects on the
Interstate System due to the known structural integrity of the road. For seal and
cover type projects only, GPR testing is not needed. The GPR information is
analyzed, graphed, and provided to surfacing design in an Excel spreadsheet.
Falling Weight Deflectometer
A falling weight deflectometer (FWD) is a testing device used by civil engineers to evaluate
the physical properties of pavements. FWD data is primarily used to estimate pavement
structural capacity for 1) overlay design and 2) to determine if a pavement is being overloaded.
Use includes (but is not limited to) highways, local roads, airport pavements, and railway tracks.
The FWD is designed to impart a load pulse to the pavement surface which simulates the load
produced by a rolling vehicle wheel. The load is produced by dropping a large weight, and
transmitted to the pavement through a circular load plate - typically 12 inches in diameter. A
load cell mounted on top of the load plate measures the load imparted to the pavement surface.
The load plate can be solid or segmented. The advantage of a segmented load plate is that it
adapts to the shape of the pavement, giving an even distribution of the load on uneven
surfaces. MDT’s NDT unit also incorporates a swiveling knuckle to ensure proper surface
contact.
There are two different types of load impact systems; single-mass and double-mass. In a
single-mass system, which MDT utilizes, a weight is dropped onto a single buffer connected to a
load plate, which rests on the surface being tested. The load force is transferred through the
plate, and the plate creates a deflection that simulates a wheel load. In the double-mass
system, typically used for very thick sections such as airport runways, the weight drops onto a
double-buffer system, which includes a first buffer, a second weight, and a second buffer.
Deflection sensors (geophones; force-balance seismometers) mounted radially from the center
of the load plate measure the deformation of the pavement in response to the load. MDT’s
sensor placements are 0”, 8”, 12”, 18”, 24”, 36”, 48”, and 60”.
FWD data is most often used to calculate stiffness-related parameters of a pavement structure.
The process of calculating the elastic moduli of individual layers in a multi-layer system (e.g.
asphalt concrete on top of a base course on top of the subgrade) based on surface deflections
is known as "back-calculation", as there is no closed-form solution. Instead, initial moduli are
assumed, surface deflections calculated, and then the moduli are adjusted in an iterative
fashion to converge on the measured deflections. This process is computationally intensive

MDT Surfacing Design Guide Chapter 7 Flexible Pavement Rehabilitation
January 2015 92
although quick on modern computers. It can give quite misleading results and requires an
experienced analyst.
The FWD process consists of first lowering the mass of weight and the rack of sensors called
“geophones” that measure deflections to the roadway surface. The weight and rack of sensors
are located in the back of the truck, just behind the rear axle (Figure 47). Next a large weight is
dropped which mimics a heavy truck tire, and measures how much the pavement deflects
beneath the weight. The weight is approximately 9,000 lbs. which is meant to represent an
18,000 lb. (18-kip) ESAL.
The deflection is measured in 8 locations by geophones located in the following distances from
the center of the load plate; D1 = 0 in., D2 = 8 in., D3 = 12 in., D4 = 18 in., D5 = 24 in., D6 = 36 in.,
D7 = 48 in., and D8 = 60 in. All of the deflections measure the deflection basin as shown in
Figure 48.
Figure 47 shows one of the two NDT vehicles with both GPR and FWD equipment mounted
upon it.
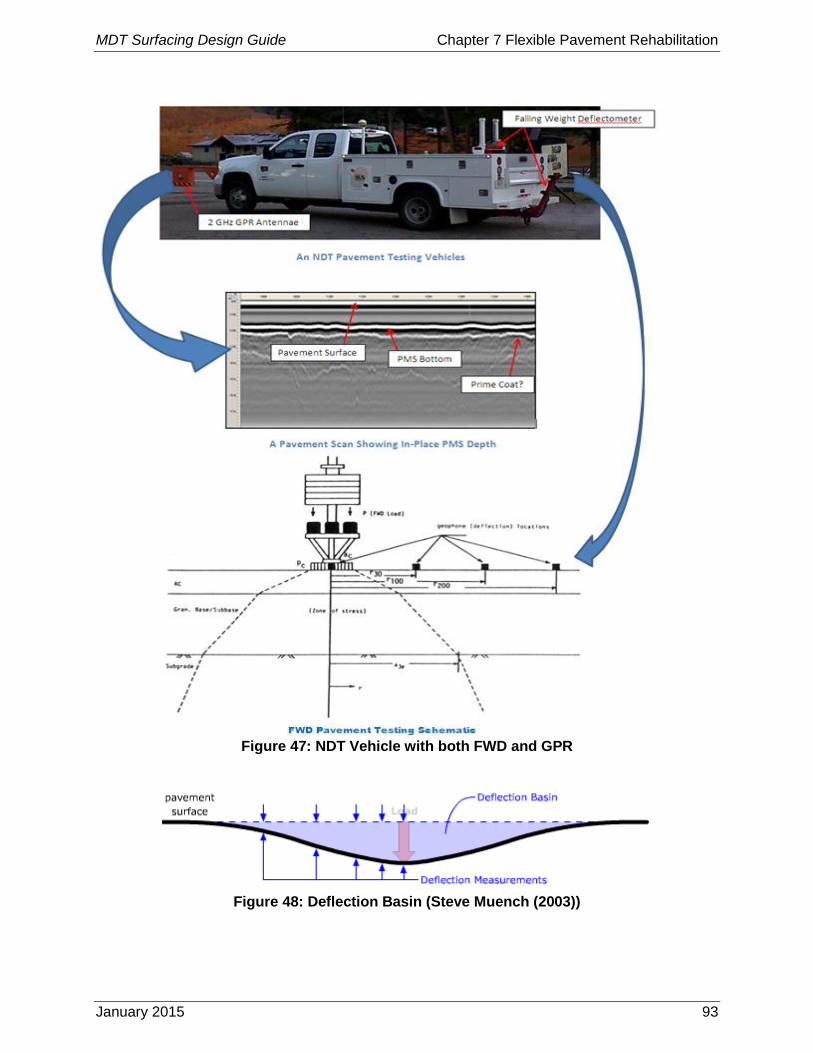
MDT Surfacing Design Guide Chapter 7 Flexible Pavement Rehabilitation
January 2015 93
Figure 47: NDT Vehicle with both FWD and GPR
Figure 48: Deflection Basin (Steve Muench (2003))
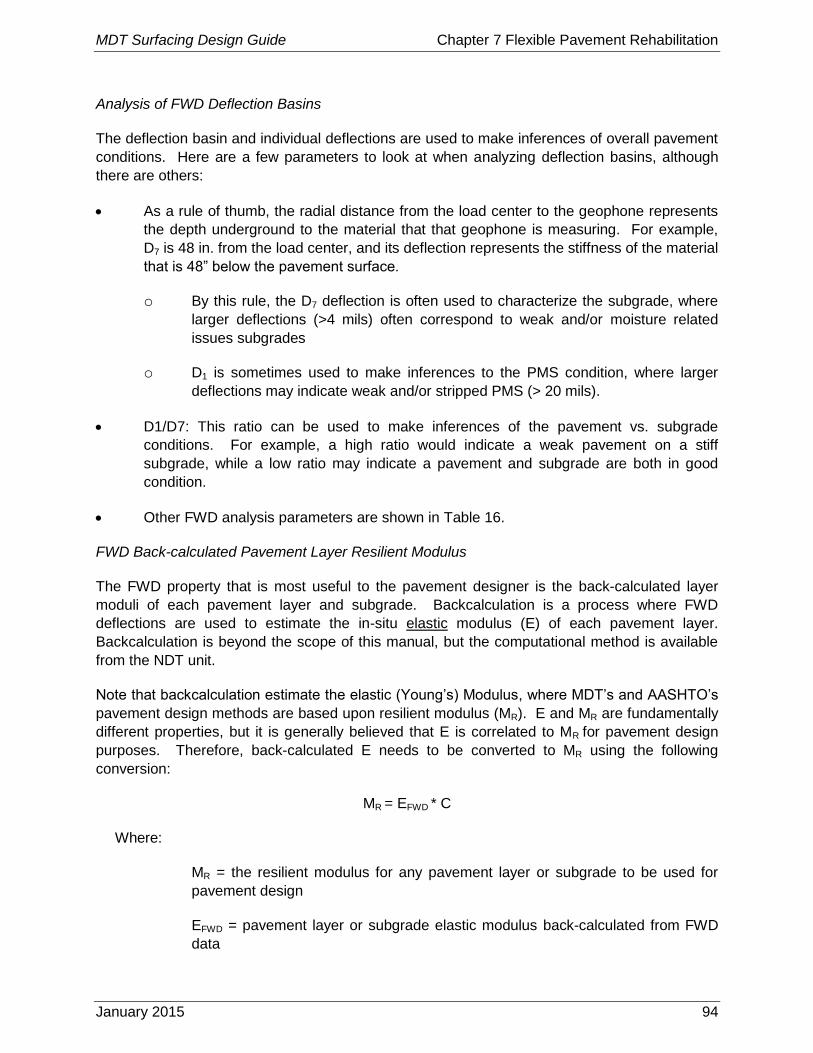
MDT Surfacing Design Guide Chapter 7 Flexible Pavement Rehabilitation
January 2015 94
Analysis of FWD Deflection Basins
The deflection basin and individual deflections are used to make inferences of overall pavement
conditions. Here are a few parameters to look at when analyzing deflection basins, although
there are others:
As a rule of thumb, the radial distance from the load center to the geophone represents
the depth underground to the material that that geophone is measuring. For example,
D7 is 48 in. from the load center, and its deflection represents the stiffness of the material
that is 48” below the pavement surface.
o By this rule, the D7 deflection is often used to characterize the subgrade, where
larger deflections (>4 mils) often correspond to weak and/or moisture related
issues subgrades
o D1 is sometimes used to make inferences to the PMS condition, where larger
deflections may indicate weak and/or stripped PMS (> 20 mils).
D1/D7: This ratio can be used to make inferences of the pavement vs. subgrade
conditions. For example, a high ratio would indicate a weak pavement on a stiff
subgrade, while a low ratio may indicate a pavement and subgrade are both in good
condition.
Other FWD analysis parameters are shown in Table 16.
FWD Back-calculated Pavement Layer Resilient Modulus
The FWD property that is most useful to the pavement designer is the back-calculated layer
moduli of each pavement layer and subgrade. Backcalculation is a process where FWD
deflections are used to estimate the in-situ elastic modulus (E) of each pavement layer.
Backcalculation is beyond the scope of this manual, but the computational method is available
from the NDT unit.
Note that backcalculation estimate the elastic (Young’s) Modulus, where MDT’s and AASHTO’s
pavement design methods are based upon resilient modulus (MR). E and MR are fundamentally
different properties, but it is generally believed that E is correlated to MR for pavement design
purposes. Therefore, back-calculated E needs to be converted to MR using the following
conversion:
MR = EFWD * C
Where:
MR = the resilient modulus for any pavement layer or subgrade to be used for
pavement design
EFWD = pavement layer or subgrade elastic modulus back-calculated from FWD
data
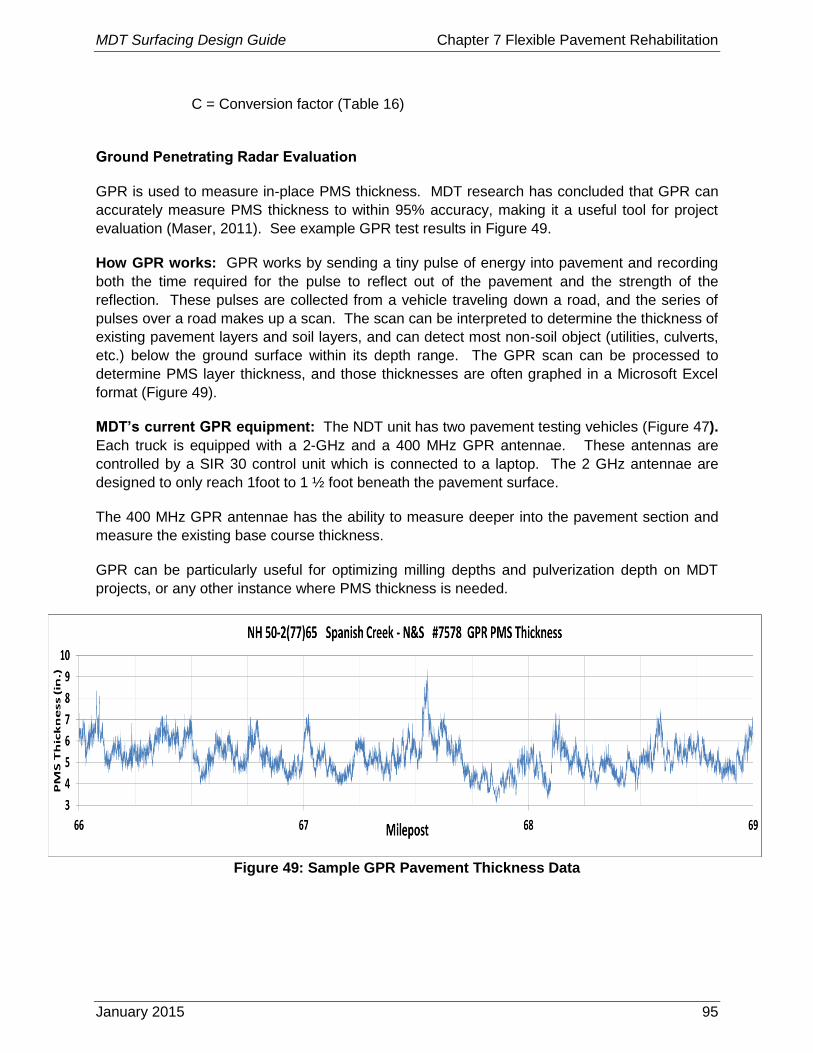
MDT Surfacing Design Guide Chapter 7 Flexible Pavement Rehabilitation
January 2015 95
C = Conversion factor (Table 16)
Ground Penetrating Radar Evaluation
GPR is used to measure in-place PMS thickness. MDT research has concluded that GPR can
accurately measure PMS thickness to within 95% accuracy, making it a useful tool for project
evaluation (Maser, 2011). See example GPR test results in Figure 49.
How GPR works: GPR works by sending a tiny pulse of energy into pavement and recording
both the time required for the pulse to reflect out of the pavement and the strength of the
reflection. These pulses are collected from a vehicle traveling down a road, and the series of
pulses over a road makes up a scan. The scan can be interpreted to determine the thickness of
existing pavement layers and soil layers, and can detect most non-soil object (utilities, culverts,
etc.) below the ground surface within its depth range. The GPR scan can be processed to
determine PMS layer thickness, and those thicknesses are often graphed in a Microsoft Excel
format (Figure 49).
MDT’s current GPR equipment: The NDT unit has two pavement testing vehicles (Figure 47).
Each truck is equipped with a 2-GHz and a 400 MHz GPR antennae. These antennas are
controlled by a SIR 30 control unit which is connected to a laptop. The 2 GHz antennae are
designed to only reach 1foot to 1 ½ foot beneath the pavement surface.
The 400 MHz GPR antennae has the ability to measure deeper into the pavement section and
measure the existing base course thickness.
GPR can be particularly useful for optimizing milling depths and pulverization depth on MDT
projects, or any other instance where PMS thickness is needed.
Figure 49: Sample GPR Pavement Thickness Data
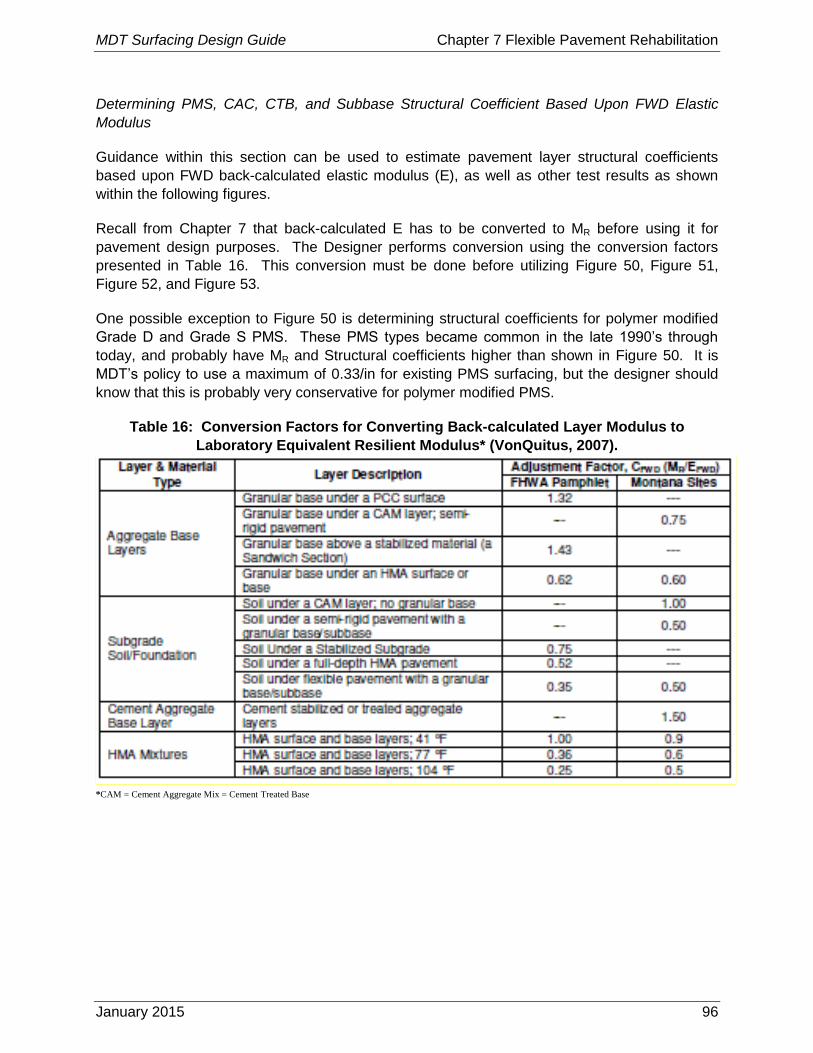
MDT Surfacing Design Guide Chapter 7 Flexible Pavement Rehabilitation
January 2015 96
Determining PMS, CAC, CTB, and Subbase Structural Coefficient Based Upon FWD Elastic
Modulus
Guidance within this section can be used to estimate pavement layer structural coefficients
based upon FWD back-calculated elastic modulus (E), as well as other test results as shown
within the following figures.
Recall from Chapter 7 that back-calculated E has to be converted to MR before using it for
pavement design purposes. The Designer performs conversion using the conversion factors
presented in Table 16. This conversion must be done before utilizing Figure 50, Figure 51,
Figure 52, and Figure 53.
One possible exception to Figure 50 is determining structural coefficients for polymer modified
Grade D and Grade S PMS. These PMS types became common in the late 1990’s through
today, and probably have MR and Structural coefficients higher than shown in Figure 50. It is
MDT’s policy to use a maximum of 0.33/in for existing PMS surfacing, but the designer should
know that this is probably very conservative for polymer modified PMS.
Table 16: Conversion Factors for Converting Back-calculated Layer Modulus to
Laboratory Equivalent Resilient Modulus* (VonQuitus, 2007).
*CAM = Cement Aggregate Mix = Cement Treated Base
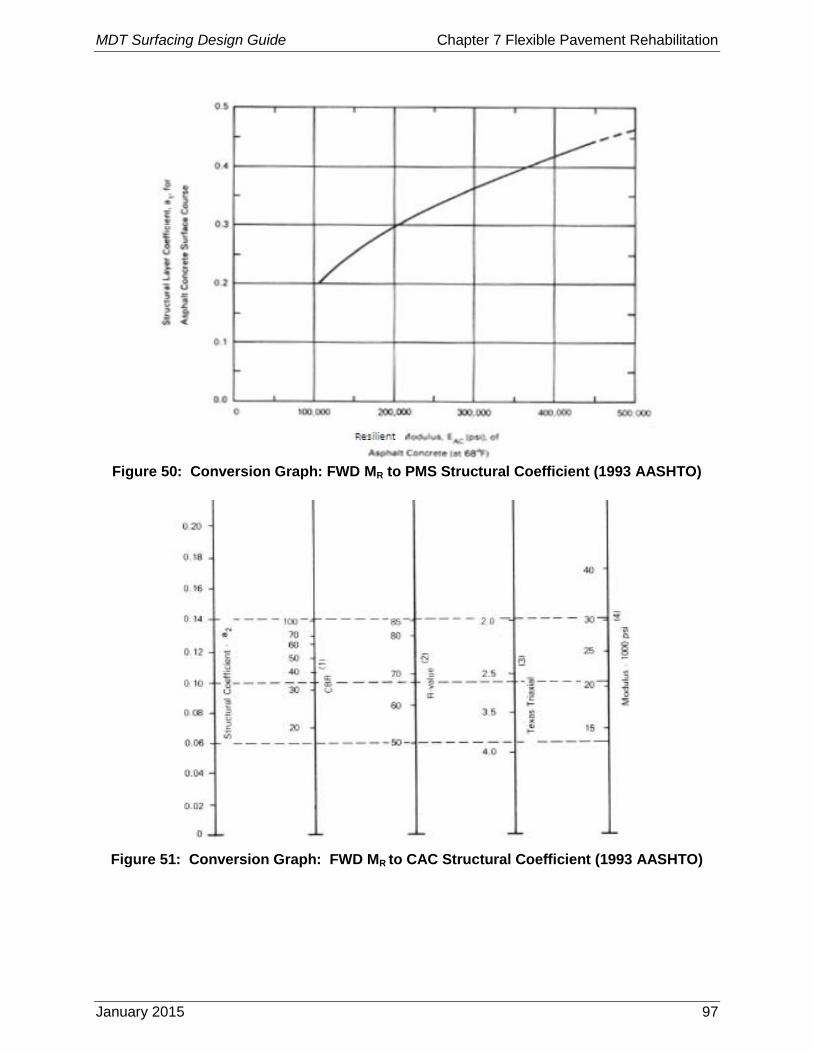
MDT Surfacing Design Guide Chapter 7 Flexible Pavement Rehabilitation
January 2015 97
Figure 50: Conversion Graph: FWD MR to PMS Structural Coefficient (1993 AASHTO)
Figure 51: Conversion Graph: FWD MR to CAC Structural Coefficient (1993 AASHTO)
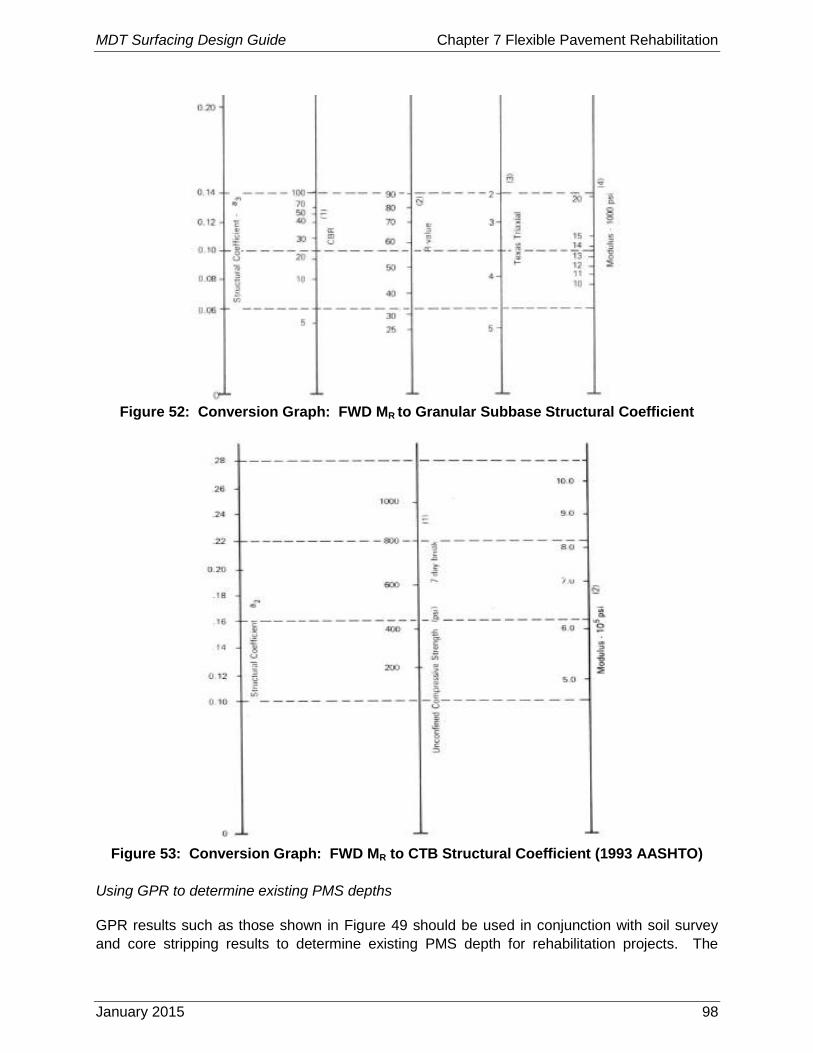
MDT Surfacing Design Guide Chapter 7 Flexible Pavement Rehabilitation
January 2015 98
Figure 52: Conversion Graph: FWD MR to Granular Subbase Structural Coefficient
Figure 53: Conversion Graph: FWD MR to CTB Structural Coefficient (1993 AASHTO)
Using GPR to determine existing PMS depths
GPR results such as those shown in Figure 49 should be used in conjunction with soil survey
and core stripping results to determine existing PMS depth for rehabilitation projects. The
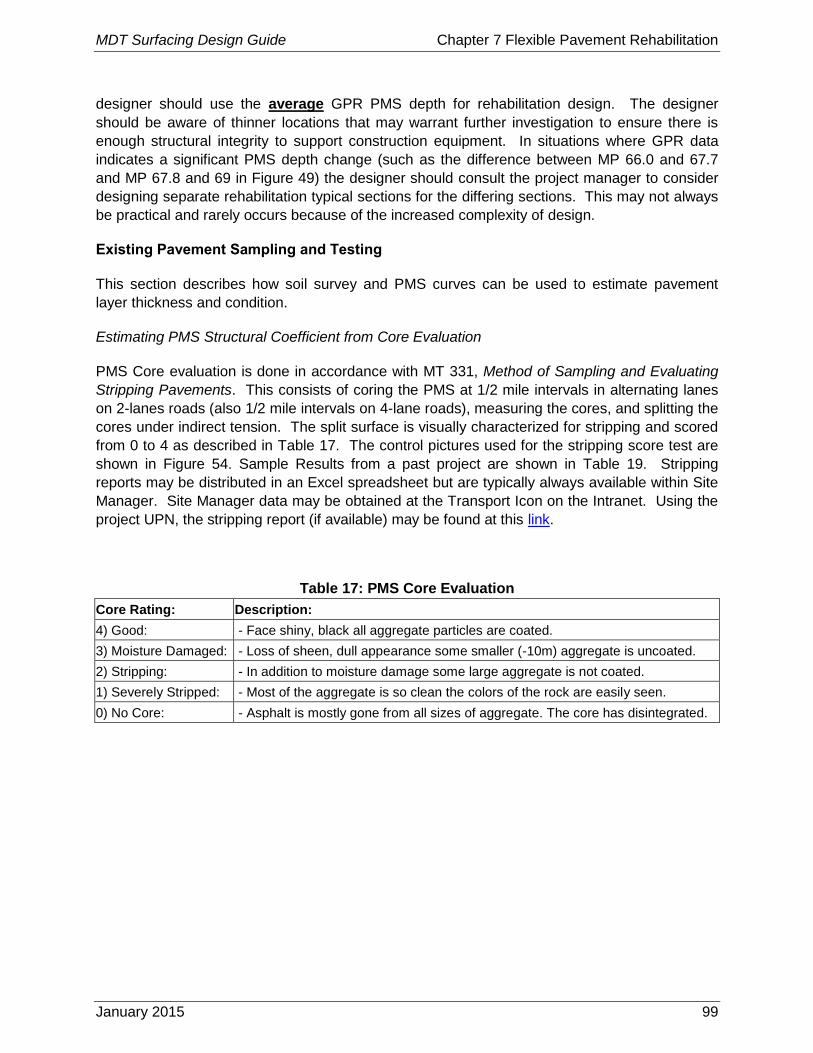
MDT Surfacing Design Guide Chapter 7 Flexible Pavement Rehabilitation
January 2015 99
designer should use the average GPR PMS depth for rehabilitation design. The designer
should be aware of thinner locations that may warrant further investigation to ensure there is
enough structural integrity to support construction equipment. In situations where GPR data
indicates a significant PMS depth change (such as the difference between MP 66.0 and 67.7
and MP 67.8 and 69 in Figure 49) the designer should consult the project manager to consider
designing separate rehabilitation typical sections for the differing sections. This may not always
be practical and rarely occurs because of the increased complexity of design.
Existing Pavement Sampling and Testing
This section describes how soil survey and PMS curves can be used to estimate pavement
layer thickness and condition.
Estimating PMS Structural Coefficient from Core Evaluation
PMS Core evaluation is done in accordance with MT 331, Method of Sampling and Evaluating
Stripping Pavements. This consists of coring the PMS at 1/2 mile intervals in alternating lanes
on 2-lanes roads (also 1/2 mile intervals on 4-lane roads), measuring the cores, and splitting the
cores under indirect tension. The split surface is visually characterized for stripping and scored
from 0 to 4 as described in Table 17. The control pictures used for the stripping score test are
shown in Figure 54. Sample Results from a past project are shown in Table 19. Stripping
reports may be distributed in an Excel spreadsheet but are typically always available within Site
Manager. Site Manager data may be obtained at the Transport Icon on the Intranet. Using the
project UPN, the stripping report (if available) may be found at this link.
Table 17: PMS Core Evaluation
Core Rating: Description:
4) Good: - Face shiny, black all aggregate particles are coated.
3) Moisture Damaged: - Loss of sheen, dull appearance some smaller (-10m) aggregate is uncoated.
2) Stripping: - In addition to moisture damage some large aggregate is not coated.
1) Severely Stripped: - Most of the aggregate is so clean the colors of the rock are easily seen.
0) No Core: - Asphalt is mostly gone from all sizes of aggregate. The core has disintegrated.
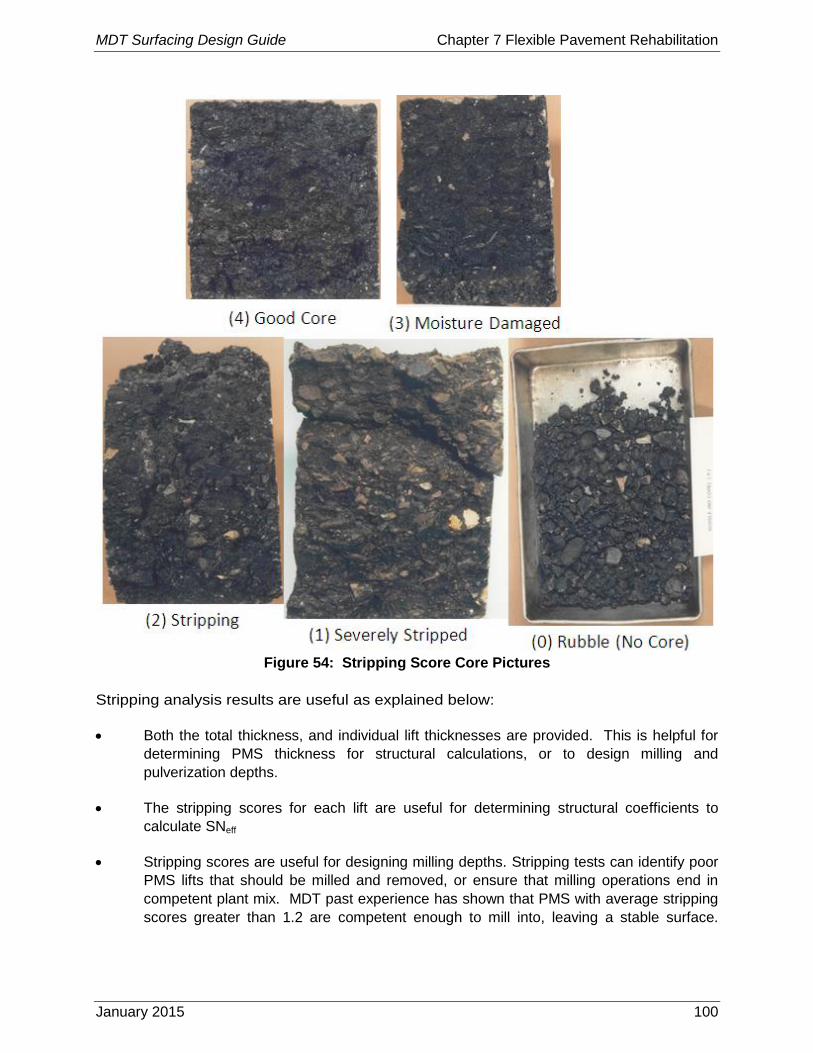
MDT Surfacing Design Guide Chapter 7 Flexible Pavement Rehabilitation
January 2015 100
Figure 54: Stripping Score Core Pictures
Stripping analysis results are useful as explained below:
Both the total thickness, and individual lift thicknesses are provided. This is helpful for
determining PMS thickness for structural calculations, or to design milling and
pulverization depths.
The stripping scores for each lift are useful for determining structural coefficients to
calculate SNeff
Stripping scores are useful for designing milling depths. Stripping tests can identify poor
PMS lifts that should be milled and removed, or ensure that milling operations end in
competent plant mix. MDT past experience has shown that PMS with average stripping
scores greater than 1.2 are competent enough to mill into, leaving a stable surface.
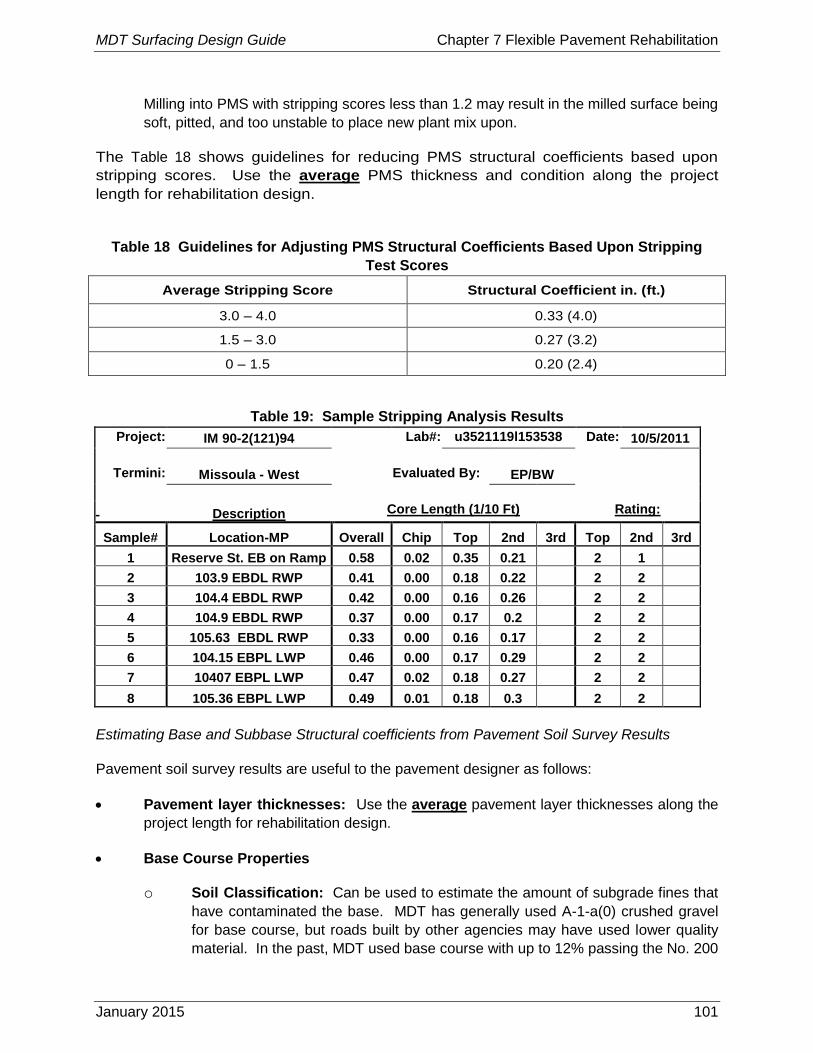
MDT Surfacing Design Guide Chapter 7 Flexible Pavement Rehabilitation
January 2015 101
Milling into PMS with stripping scores less than 1.2 may result in the milled surface being
soft, pitted, and too unstable to place new plant mix upon.
The Table 18 shows guidelines for reducing PMS structural coefficients based upon
stripping scores. Use the average PMS thickness and condition along the project
length for rehabilitation design.
Table 18 Guidelines for Adjusting PMS Structural Coefficients Based Upon Stripping
Test Scores
Average Stripping Score Structural Coefficient in. (ft.)
3.0 – 4.0 0.33 (4.0)
1.5 – 3.0 0.27 (3.2)
0 – 1.5 0.20 (2.4)
Table 19: Sample Stripping Analysis Results
Project: IM 90-2(121)94 Lab#: u3521119l153538 Date: 10/5/2011
Termini: Missoula - West
Evaluated By: EP/BW
Description Core Length (1/10 Ft) Rating:
Sample# Location-MP Overall Chip Top 2nd 3rd Top 2nd 3rd
1 Reserve St. EB on Ramp 0.58 0.02 0.35 0.21 2 1
2 103.9 EBDL RWP 0.41 0.00 0.18 0.22 2 2
3 104.4 EBDL RWP 0.42 0.00 0.16 0.26 2 2
4 104.9 EBDL RWP 0.37 0.00 0.17 0.2 2 2
5 105.63 EBDL RWP 0.33 0.00 0.16 0.17 2 2
6 104.15 EBPL LWP 0.46 0.00 0.17 0.29 2 2
7 10407 EBPL LWP 0.47 0.02 0.18 0.27 2 2
8 105.36 EBPL LWP 0.49 0.01 0.18 0.3 2 2
Estimating Base and Subbase Structural coefficients from Pavement Soil Survey Results
Pavement soil survey results are useful to the pavement designer as follows:
Pavement layer thicknesses: Use the average pavement layer thicknesses along the
project length for rehabilitation design.
Base Course Properties
o Soil Classification: Can be used to estimate the amount of subgrade fines that
have contaminated the base. MDT has generally used A-1-a(0) crushed gravel
for base course, but roads built by other agencies may have used lower quality
material. In the past, MDT used base course with up to 12% passing the No. 200
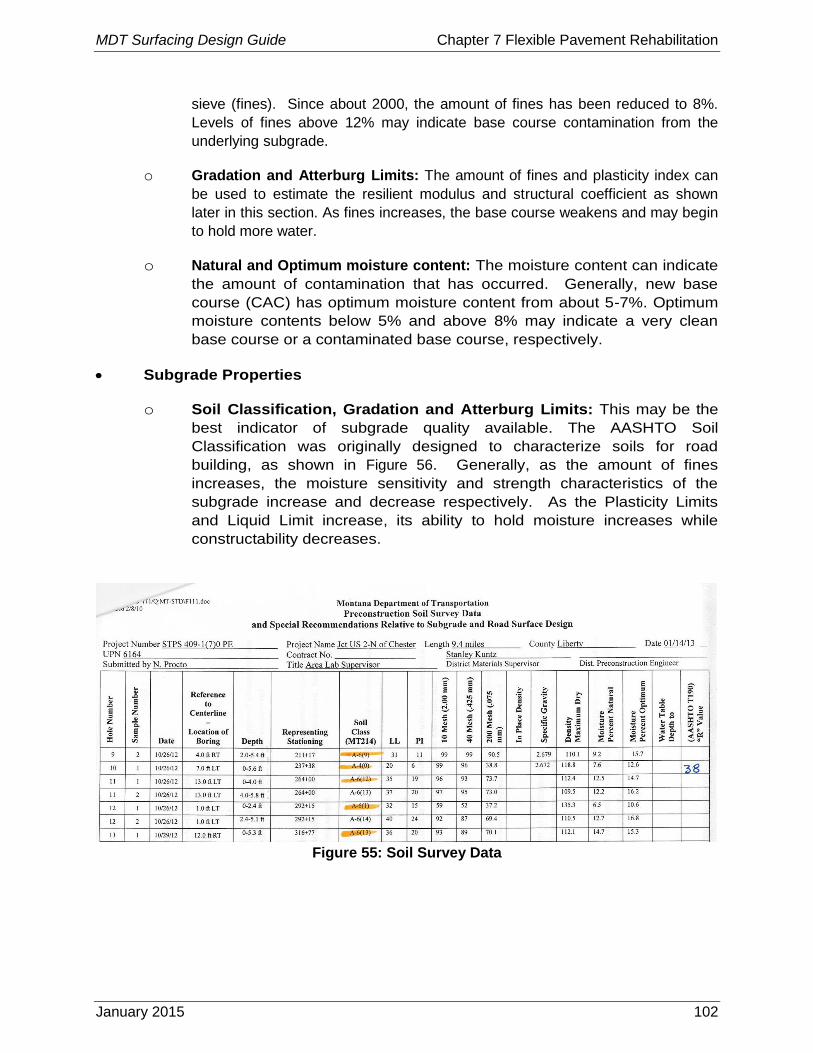
MDT Surfacing Design Guide Chapter 7 Flexible Pavement Rehabilitation
January 2015 102
sieve (fines). Since about 2000, the amount of fines has been reduced to 8%.
Levels of fines above 12% may indicate base course contamination from the
underlying subgrade.
o Gradation and Atterburg Limits: The amount of fines and plasticity index can
be used to estimate the resilient modulus and structural coefficient as shown
later in this section. As fines increases, the base course weakens and may begin
to hold more water.
o Natural and Optimum moisture content: The moisture content can indicate
the amount of contamination that has occurred. Generally, new base
course (CAC) has optimum moisture content from about 5-7%. Optimum
moisture contents below 5% and above 8% may indicate a very clean
base course or a contaminated base course, respectively.
Subgrade Properties
o Soil Classification, Gradation and Atterburg Limits: This may be the
best indicator of subgrade quality available. The AASHTO Soil
Classification was originally designed to characterize soils for road
building, as shown in Figure 56. Generally, as the amount of fines
increases, the moisture sensitivity and strength characteristics of the
subgrade increase and decrease respectively. As the Plasticity Limits
and Liquid Limit increase, its ability to hold moisture increases while
constructability decreases.
Figure 55: Soil Survey Data
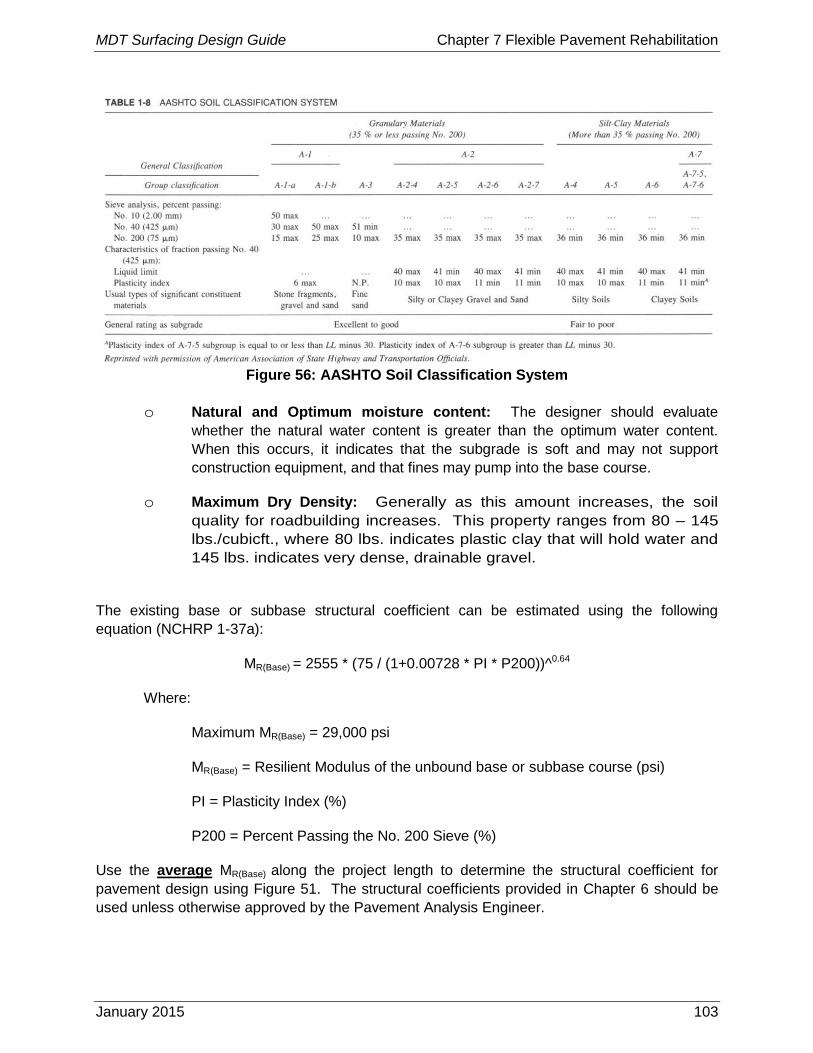
MDT Surfacing Design Guide Chapter 7 Flexible Pavement Rehabilitation
January 2015 103
Figure 56: AASHTO Soil Classification System
o Natural and Optimum moisture content: The designer should evaluate
whether the natural water content is greater than the optimum water content.
When this occurs, it indicates that the subgrade is soft and may not support
construction equipment, and that fines may pump into the base course.
o Maximum Dry Density: Generally as this amount increases, the soil
quality for roadbuilding increases. This property ranges from 80 – 145
lbs./cubicft., where 80 lbs. indicates plastic clay that will hold water and
145 lbs. indicates very dense, drainable gravel.
The existing base or subbase structural coefficient can be estimated using the following
equation (NCHRP 1-37a):
MR(Base) = 2555 * (75 / (1+0.00728 * PI * P200))^0.64
Where:
Maximum MR(Base) = 29,000 psi
MR(Base) = Resilient Modulus of the unbound base or subbase course (psi)
PI = Plasticity Index (%)
P200 = Percent Passing the No. 200 Sieve (%)
Use the average MR(Base) along the project length to determine the structural coefficient for
pavement design using Figure 51. The structural coefficients provided in Chapter 6 should be
used unless otherwise approved by the Pavement Analysis Engineer.
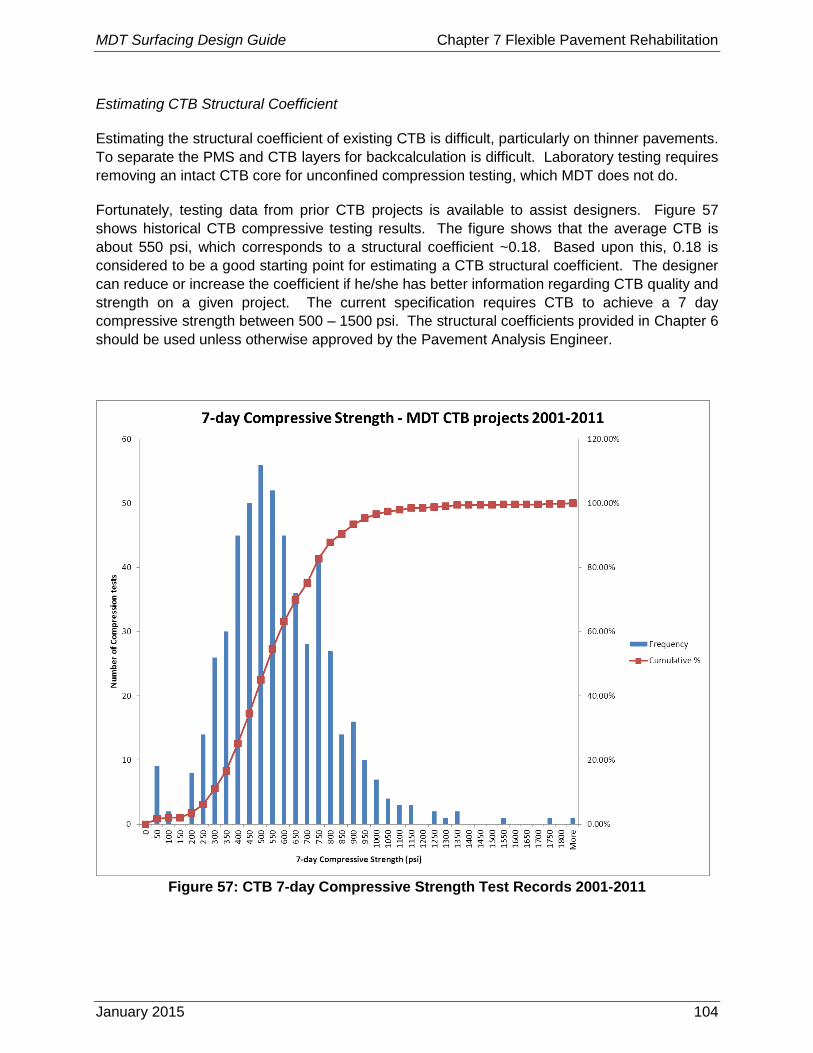
MDT Surfacing Design Guide Chapter 7 Flexible Pavement Rehabilitation
January 2015 104
Estimating CTB Structural Coefficient
Estimating the structural coefficient of existing CTB is difficult, particularly on thinner pavements.
To separate the PMS and CTB layers for backcalculation is difficult. Laboratory testing requires
removing an intact CTB core for unconfined compression testing, which MDT does not do.
Fortunately, testing data from prior CTB projects is available to assist designers. Figure 57
shows historical CTB compressive testing results. The figure shows that the average CTB is
about 550 psi, which corresponds to a structural coefficient ~0.18. Based upon this, 0.18 is
considered to be a good starting point for estimating a CTB structural coefficient. The designer
can reduce or increase the coefficient if he/she has better information regarding CTB quality and
strength on a given project. The current specification requires CTB to achieve a 7 day
compressive strength between 500 – 1500 psi. The structural coefficients provided in Chapter 6
should be used unless otherwise approved by the Pavement Analysis Engineer.
Figure 57: CTB 7-day Compressive Strength Test Records 2001-2011
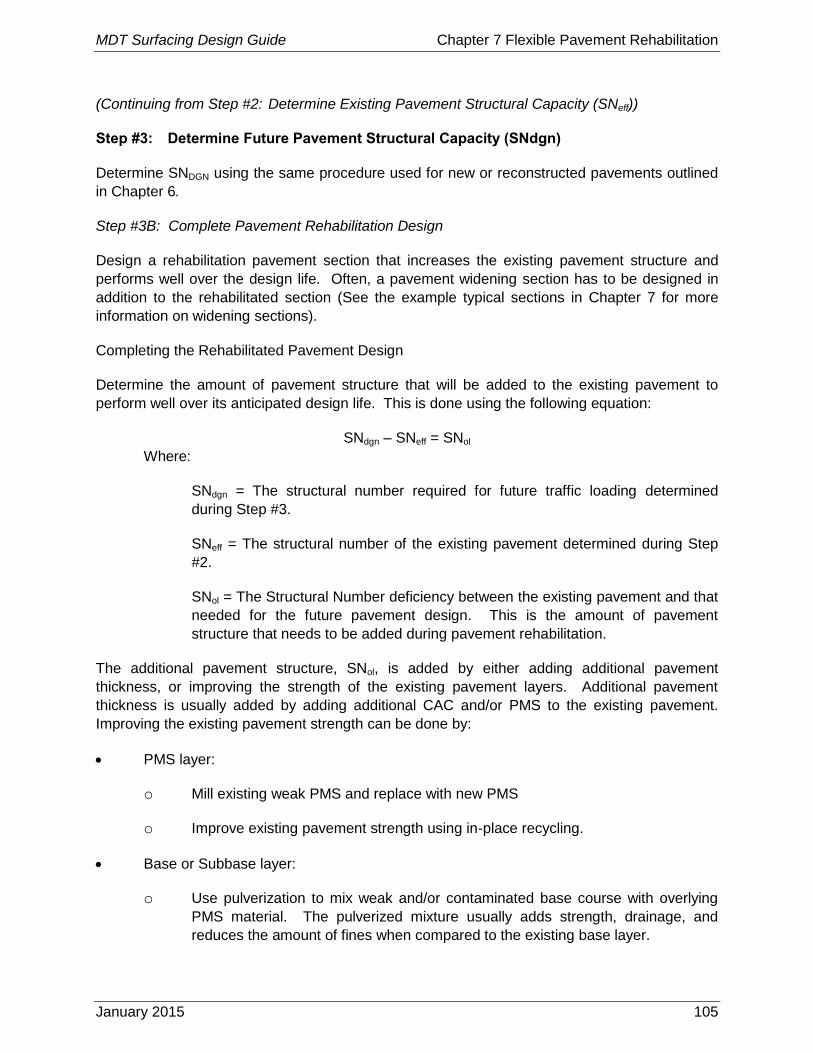
MDT Surfacing Design Guide Chapter 7 Flexible Pavement Rehabilitation
January 2015 105
(Continuing from Step #2: Determine Existing Pavement Structural Capacity (SNeff))
Step #3: Determine Future Pavement Structural Capacity (SNdgn)
Determine SNDGN using the same procedure used for new or reconstructed pavements outlined
in Chapter 6.
Step #3B: Complete Pavement Rehabilitation Design
Design a rehabilitation pavement section that increases the existing pavement structure and
performs well over the design life. Often, a pavement widening section has to be designed in
addition to the rehabilitated section (See the example typical sections in Chapter 7 for more
information on widening sections).
Completing the Rehabilitated Pavement Design
Determine the amount of pavement structure that will be added to the existing pavement to
perform well over its anticipated design life. This is done using the following equation:
SNdgn – SNeff = SNol
Where:
SNdgn = The structural number required for future traffic loading determined
during Step #3.
SNeff = The structural number of the existing pavement determined during Step
#2.
SNol = The Structural Number deficiency between the existing pavement and that
needed for the future pavement design. This is the amount of pavement
structure that needs to be added during pavement rehabilitation.
The additional pavement structure, SNol, is added by either adding additional pavement
thickness, or improving the strength of the existing pavement layers. Additional pavement
thickness is usually added by adding additional CAC and/or PMS to the existing pavement.
Improving the existing pavement strength can be done by:
PMS layer:
o Mill existing weak PMS and replace with new PMS
o Improve existing pavement strength using in-place recycling.
Base or Subbase layer:
o Use pulverization to mix weak and/or contaminated base course with overlying
PMS material. The pulverized mixture usually adds strength, drainage, and
reduces the amount of fines when compared to the existing base layer.
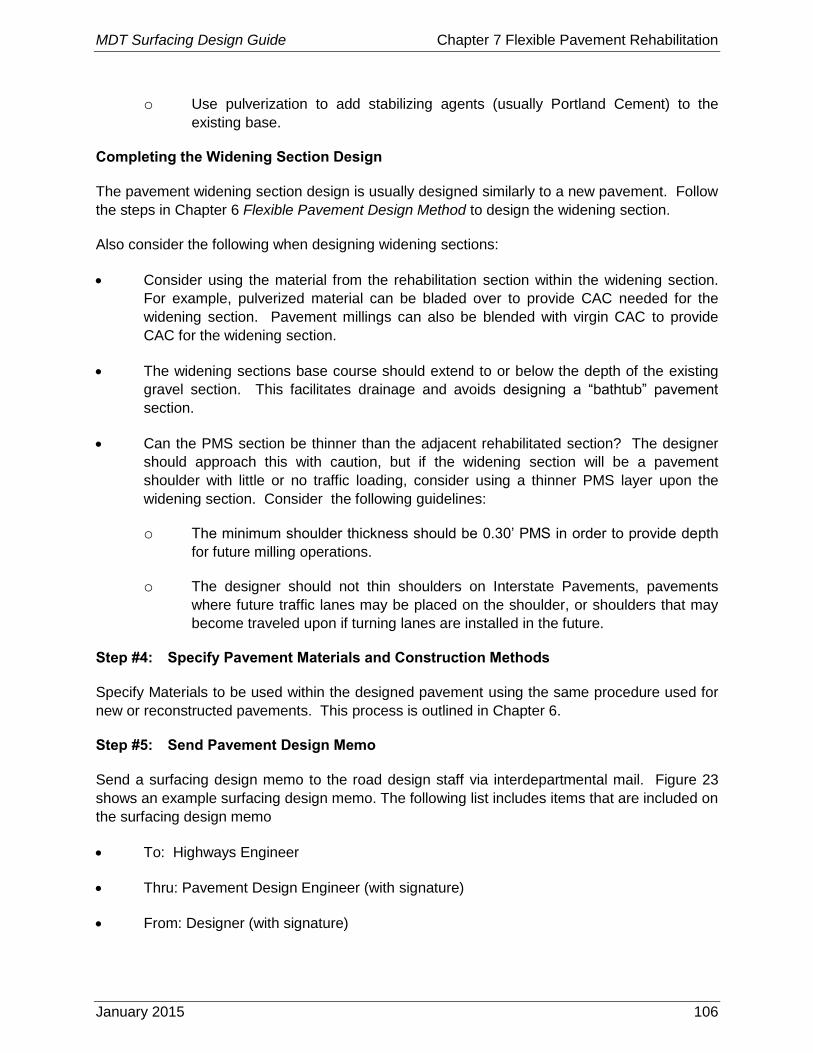
MDT Surfacing Design Guide Chapter 7 Flexible Pavement Rehabilitation
January 2015 106
o Use pulverization to add stabilizing agents (usually Portland Cement) to the
existing base.
Completing the Widening Section Design
The pavement widening section design is usually designed similarly to a new pavement. Follow
the steps in Chapter 6 Flexible Pavement Design Method to design the widening section.
Also consider the following when designing widening sections:
Consider using the material from the rehabilitation section within the widening section.
For example, pulverized material can be bladed over to provide CAC needed for the
widening section. Pavement millings can also be blended with virgin CAC to provide
CAC for the widening section.
The widening sections base course should extend to or below the depth of the existing
gravel section. This facilitates drainage and avoids designing a “bathtub” pavement
section.
Can the PMS section be thinner than the adjacent rehabilitated section? The designer
should approach this with caution, but if the widening section will be a pavement
shoulder with little or no traffic loading, consider using a thinner PMS layer upon the
widening section. Consider the following guidelines:
o The minimum shoulder thickness should be 0.30’ PMS in order to provide depth
for future milling operations.
o The designer should not thin shoulders on Interstate Pavements, pavements
where future traffic lanes may be placed on the shoulder, or shoulders that may
become traveled upon if turning lanes are installed in the future.
Step #4: Specify Pavement Materials and Construction Methods
Specify Materials to be used within the designed pavement using the same procedure used for
new or reconstructed pavements. This process is outlined in Chapter 6.
Step #5: Send Pavement Design Memo
Send a surfacing design memo to the road design staff via interdepartmental mail. Figure 23
shows an example surfacing design memo. The following list includes items that are included on
the surfacing design memo
To: Highways Engineer
Thru: Pavement Design Engineer (with signature)
From: Designer (with signature)

MDT Surfacing Design Guide Chapter 7 Flexible Pavement Rehabilitation
January 2015 107
Date
Subject Project Number, Name, and CN Number
Designate Preliminary or Final and EPS Act. 600 or 604, respectively
PMS, CAC, and Total Thicknesses for both the rehabilitation and widening sections
A description of milling and pulverization depths
Thorough description of the type and order of construction operations needed for
pavement rehabilitation
Description of stabilizers (i.e. portland cement)
Design R-Value
The Daily ESALs used for Design
Plant Mix Type
Use of RAP and PMS RAP content
Design Life Length (yrs.)
Binder type
Asphalt Content
CC’d to District Administrator, Road Design Engineer, Road Design Project Manager,
and Surfacing Materials, and Geotechnical
An effort should be made to make the surfacing design memos as detailed as needed for the
road designer to develop both project reports and construction plans.
After completing the preliminary surfacing design memo with Microsoft Word, save the .doc file
using the 7 digit Construction Number (CN) as the file name. Save the file in the project folder
on the shared drive. Once the memo has been submitted for distribution and saved, the EPS
activity may be carded off.
When the paper copy of the memo is distributed, the original copy is stamped “Master Copy”
with a green stamp by the Department’s mail staff, and sent back to surfacing design. This
“Master Copy” is stored in the surfacing design project file.
There will be instances when the design memo is sent electronically via email. When this is
necessary, the Word file (.doc) should be converted to an Adobe Acrobat File (.pdf) before
sending it. The purpose of this is that a .pdf file cannot be altered.
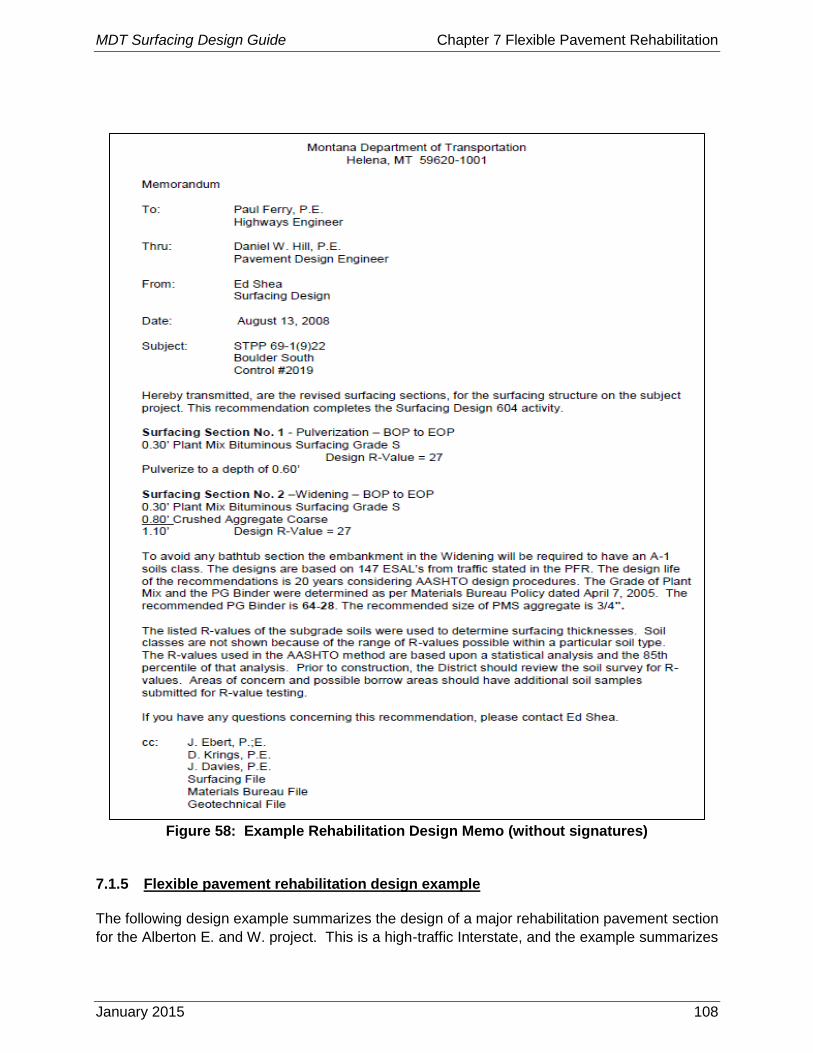
MDT Surfacing Design Guide Chapter 7 Flexible Pavement Rehabilitation
January 2015 108
Figure 58: Example Rehabilitation Design Memo (without signatures)
7.1.5 Flexible pavement rehabilitation design example
The following design example summarizes the design of a major rehabilitation pavement section
for the Alberton E. and W. project. This is a high-traffic Interstate, and the example summarizes
MDT Surfacing Design Guide Chapter 7 Flexible Pavement Rehabilitation
January 2015 109
a pavement design using the DARWin software. The following information presents a summary
of items that may affect the pavement design:
Project Name: Alberton E. and W.
Project Number: IM 90-1(196)74
Construction Number(CN): 7523
Existing Surface: 0.2’ PMS
0.15-0.30’ Hot Recycled PMS
0.15-0.2’ CTS
1.25’-1.50’ CAC
Project Limits: RP 74.4 – 84.0
Project Type: Major Rehabilitation without Added Capacity
District: Missoula
Geographic Province: Rolling Terrain - Rural
Weather / Climate: Moderate Precipitation, Multiple Freeze-Thaw During Spring
and Fall, frozen during winter
Traffic information: Daily ESALs = 1104
Daily AADT (Average Annual Daily Traffic) = 7,090
Soils: Mostly Gravel
FWD Subgrade Lab MR = 12,000 psi
Determine Pavement Rehabilitation Method
This pavement is in poor condition. The District decided that this pavement needed major
rehabilitation because the Maintenance Division was spending a lot of time and money
maintaining the roadway.
The road was reconstructed between 1963 and 1979 (projects I-90-1(17), I-90-1(70), I-90-2(51)
and I-90-2(21)). In 1998, an overlay and chip seal was applied to the roadway under project IM
90-1(119)74. In 2006, another chip seal was applied under project SFCI 90-1(156)74.
A key design feature on this project is the vertical grade cannot be raised.
Core samples have been obtained from the MDT Missoula District Materials. The following is a
summary of the existing surfacing depths.
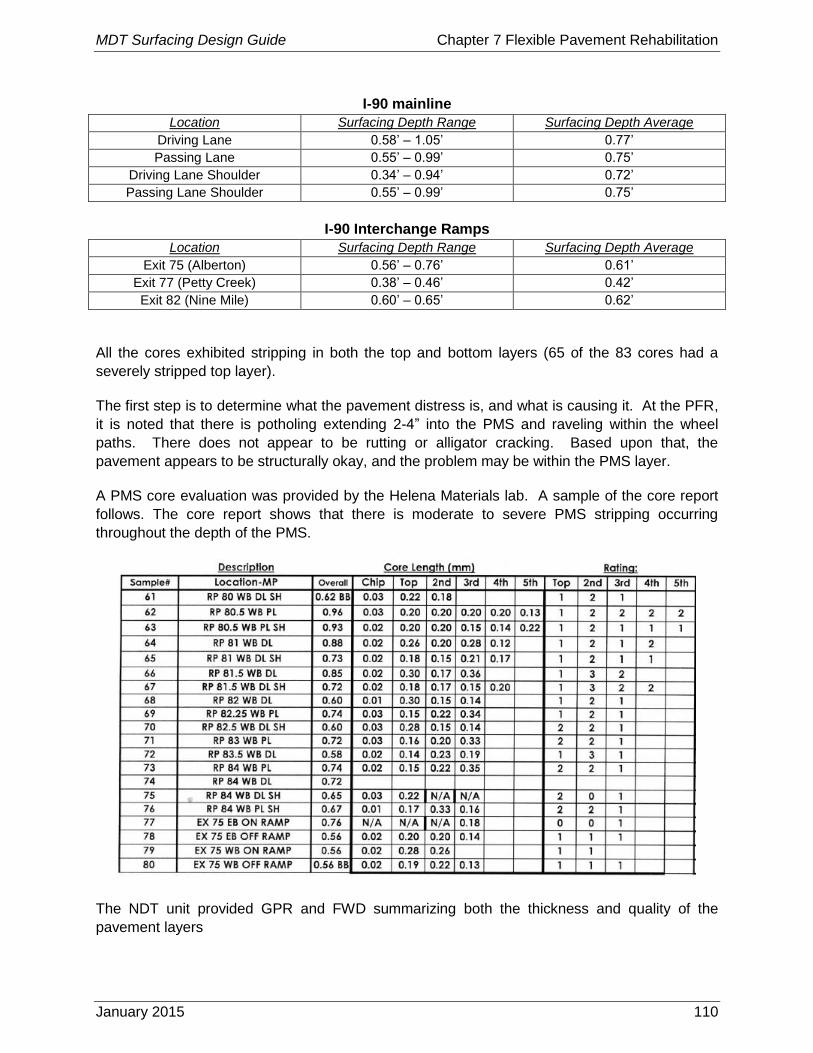
MDT Surfacing Design Guide Chapter 7 Flexible Pavement Rehabilitation
January 2015 110
I-90 mainline
Location Surfacing Depth Range Surfacing Depth Average
Driving Lane 0.58’ – 1.05’ 0.77’
Passing Lane 0.55’ – 0.99’ 0.75’
Driving Lane Shoulder 0.34’ – 0.94’ 0.72’
Passing Lane Shoulder 0.55’ – 0.99’ 0.75’
I-90 Interchange Ramps
Location Surfacing Depth Range Surfacing Depth Average
Exit 75 (Alberton) 0.56’ – 0.76’ 0.61’
Exit 77 (Petty Creek) 0.38’ – 0.46’ 0.42’
Exit 82 (Nine Mile) 0.60’ – 0.65’ 0.62’
All the cores exhibited stripping in both the top and bottom layers (65 of the 83 cores had a
severely stripped top layer).
The first step is to determine what the pavement distress is, and what is causing it. At the PFR,
it is noted that there is potholing extending 2-4” into the PMS and raveling within the wheel
paths. There does not appear to be rutting or alligator cracking. Based upon that, the
pavement appears to be structurally okay, and the problem may be within the PMS layer.
A PMS core evaluation was provided by the Helena Materials lab. A sample of the core report
follows. The core report shows that there is moderate to severe PMS stripping occurring
throughout the depth of the PMS.
The NDT unit provided GPR and FWD summarizing both the thickness and quality of the
pavement layers
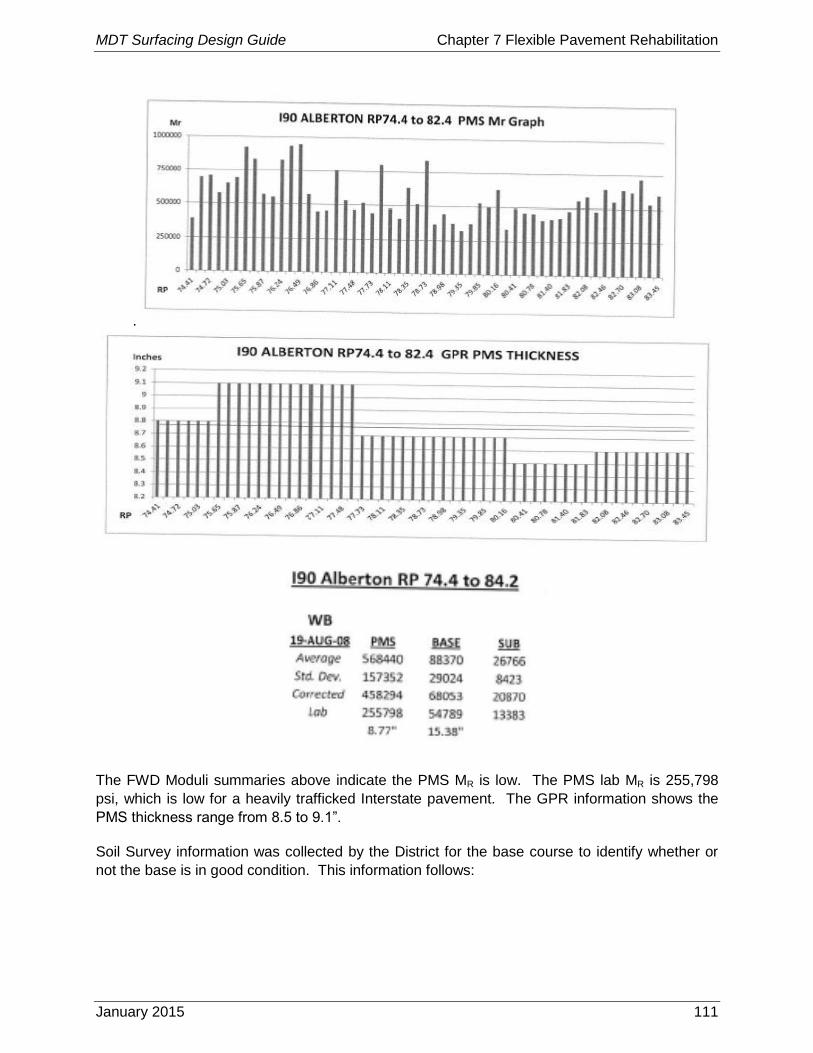
MDT Surfacing Design Guide Chapter 7 Flexible Pavement Rehabilitation
January 2015 111
.
The FWD Moduli summaries above indicate the PMS MR is low. The PMS lab MR is 255,798
psi, which is low for a heavily trafficked Interstate pavement. The GPR information shows the
PMS thickness range from 8.5 to 9.1”.
Soil Survey information was collected by the District for the base course to identify whether or
not the base is in good condition. This information follows:
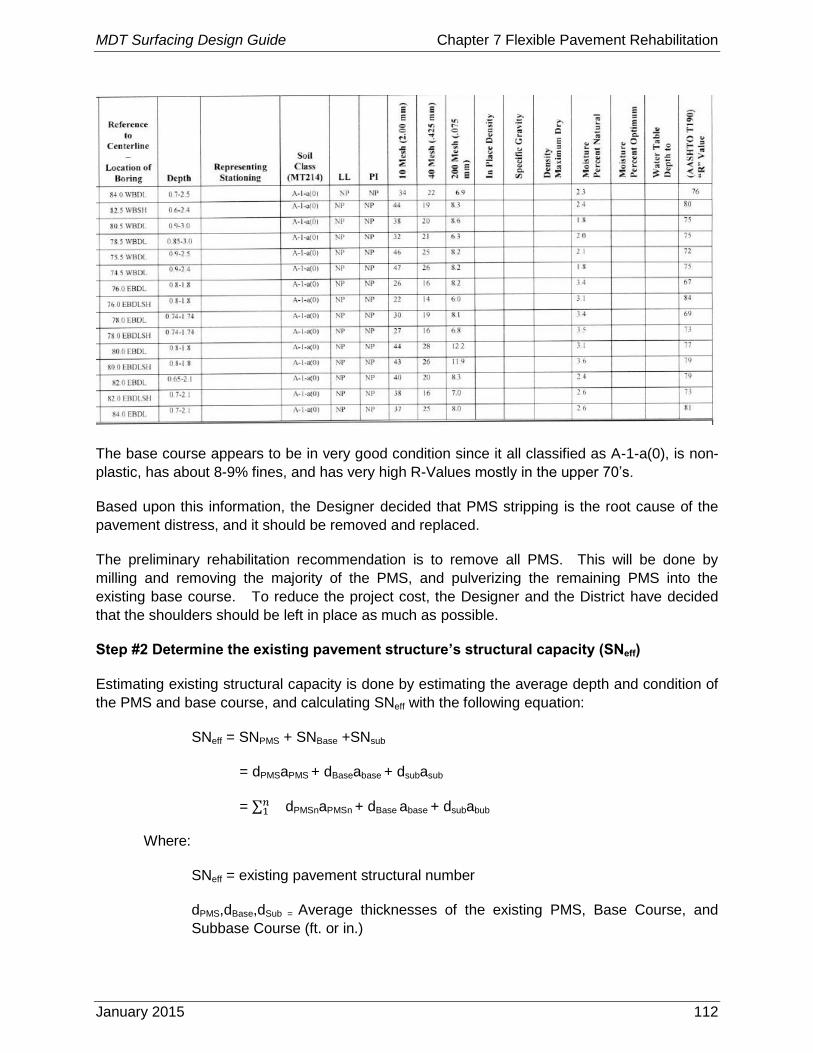
MDT Surfacing Design Guide Chapter 7 Flexible Pavement Rehabilitation
January 2015 112
The base course appears to be in very good condition since it all classified as A-1-a(0), is non-
plastic, has about 8-9% fines, and has very high R-Values mostly in the upper 70’s.
Based upon this information, the Designer decided that PMS stripping is the root cause of the
pavement distress, and it should be removed and replaced.
The preliminary rehabilitation recommendation is to remove all PMS. This will be done by
milling and removing the majority of the PMS, and pulverizing the remaining PMS into the
existing base course. To reduce the project cost, the Designer and the District have decided
that the shoulders should be left in place as much as possible.
Step #2 Determine the existing pavement structure’s structural capacity (SNeff)
Estimating existing structural capacity is done by estimating the average depth and condition of
the PMS and base course, and calculating SNeff with the following equation:
SNeff = SNPMS + SNBase +SNsub
= dPMSaPMS + dBaseabase + dsubasub
= ∑𝑛1 dPMSnaPMSn + dBase abase + dsubabub
Where:
SNeff = existing pavement structural number
dPMS,dBase,dSub = Average thicknesses of the existing PMS, Base Course, and
Subbase Course (ft. or in.)
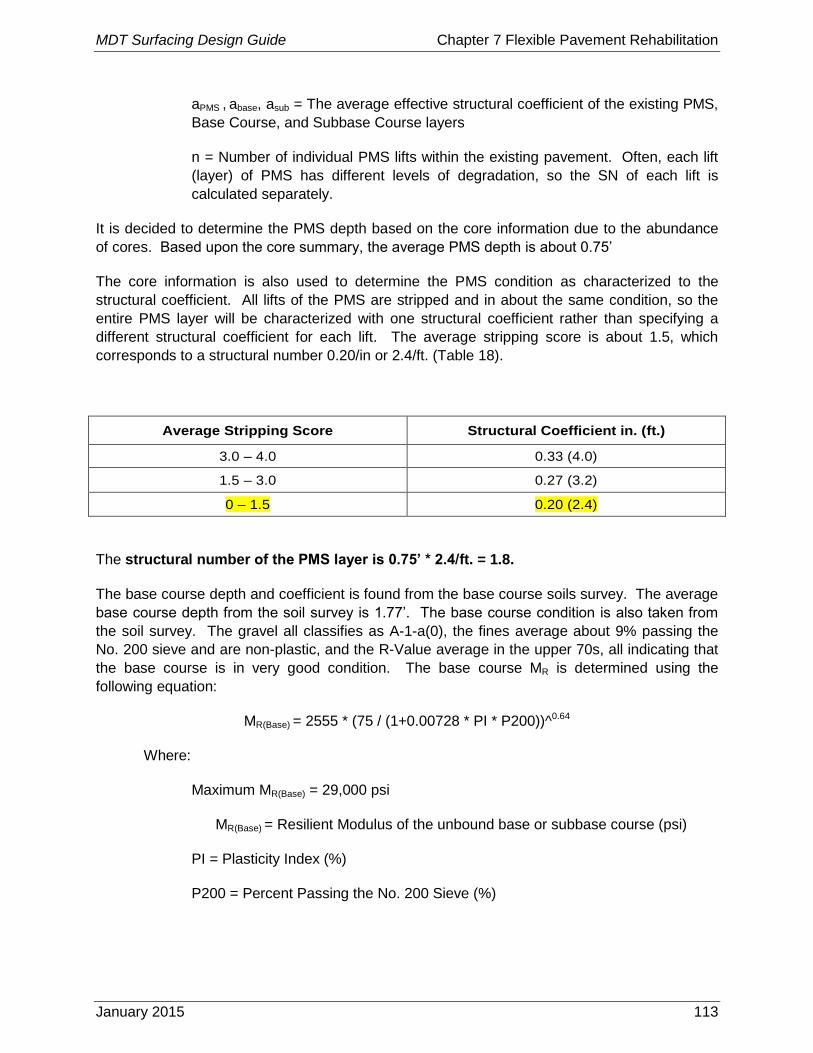
MDT Surfacing Design Guide Chapter 7 Flexible Pavement Rehabilitation
January 2015 113
aPMS , abase, asub = The average effective structural coefficient of the existing PMS,
Base Course, and Subbase Course layers
n = Number of individual PMS lifts within the existing pavement. Often, each lift
(layer) of PMS has different levels of degradation, so the SN of each lift is
calculated separately.
It is decided to determine the PMS depth based on the core information due to the abundance
of cores. Based upon the core summary, the average PMS depth is about 0.75’
The core information is also used to determine the PMS condition as characterized to the
structural coefficient. All lifts of the PMS are stripped and in about the same condition, so the
entire PMS layer will be characterized with one structural coefficient rather than specifying a
different structural coefficient for each lift. The average stripping score is about 1.5, which
corresponds to a structural number 0.20/in or 2.4/ft. (Table 18).
Average Stripping Score Structural Coefficient in. (ft.)
3.0 – 4.0 0.33 (4.0)
1.5 – 3.0 0.27 (3.2)
0 – 1.5 0.20 (2.4)
The structural number of the PMS layer is 0.75’ * 2.4/ft. = 1.8.
The base course depth and coefficient is found from the base course soils survey. The average
base course depth from the soil survey is 1.77’. The base course condition is also taken from
the soil survey. The gravel all classifies as A-1-a(0), the fines average about 9% passing the
No. 200 sieve and are non-plastic, and the R-Value average in the upper 70s, all indicating that
the base course is in very good condition. The base course MR is determined using the
following equation:
MR(Base) = 2555 * (75 / (1+0.00728 * PI * P200))^0.64
Where:
Maximum MR(Base) = 29,000 psi
MR(Base) = Resilient Modulus of the unbound base or subbase course (psi)
PI = Plasticity Index (%)
P200 = Percent Passing the No. 200 Sieve (%)
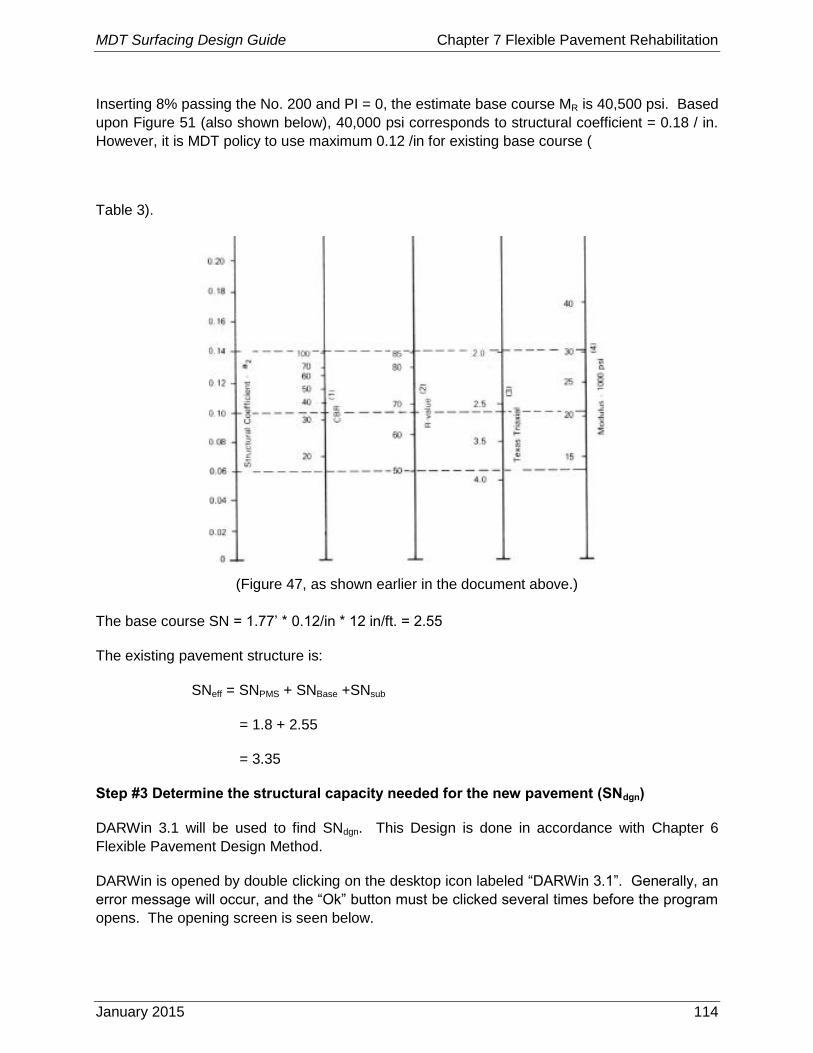
MDT Surfacing Design Guide Chapter 7 Flexible Pavement Rehabilitation
January 2015 114
Inserting 8% passing the No. 200 and PI = 0, the estimate base course MR is 40,500 psi. Based
upon Figure 51 (also shown below), 40,000 psi corresponds to structural coefficient = 0.18 / in.
However, it is MDT policy to use maximum 0.12 /in for existing base course (
Table 3).
(Figure 47, as shown earlier in the document above.)
The base course SN = 1.77’ * 0.12/in * 12 in/ft. = 2.55
The existing pavement structure is:
SNeff = SNPMS + SNBase +SNsub
= 1.8 + 2.55
= 3.35
Step #3 Determine the structural capacity needed for the new pavement (SNdgn)
DARWin 3.1 will be used to find SNdgn. This Design is done in accordance with Chapter 6
Flexible Pavement Design Method.
DARWin is opened by double clicking on the desktop icon labeled “DARWin 3.1”. Generally, an
error message will occur, and the “Ok” button must be clicked several times before the program
opens. The opening screen is seen below.
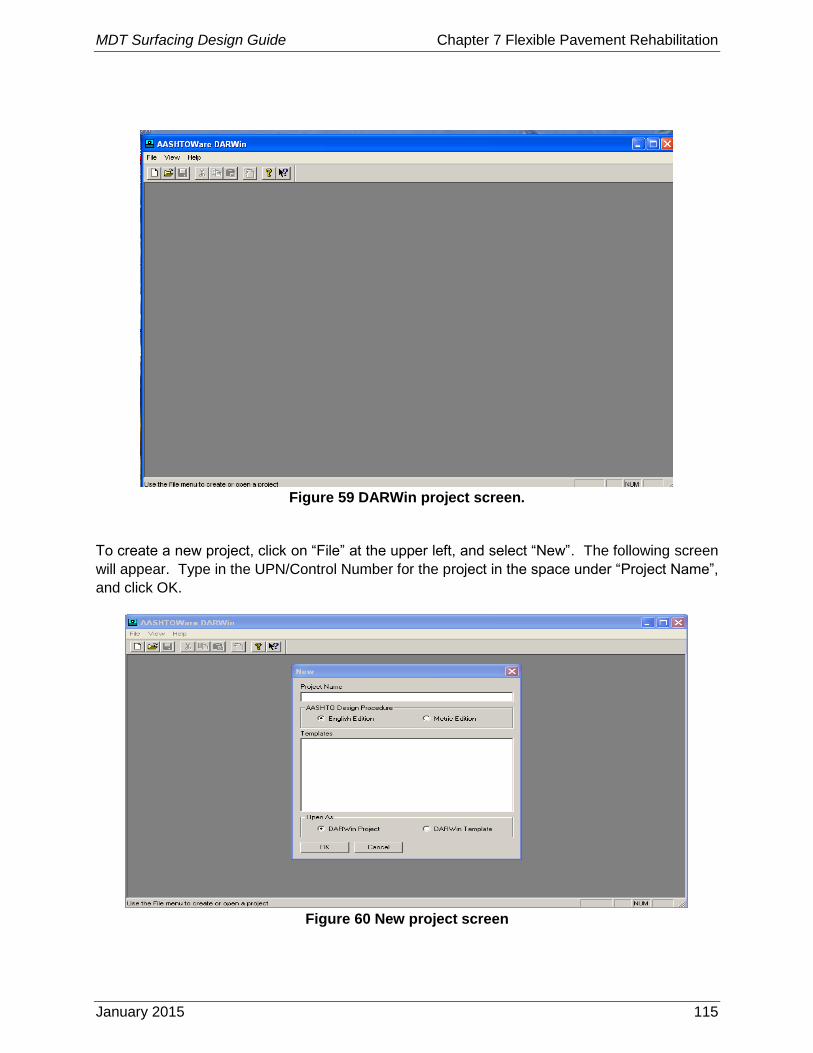
MDT Surfacing Design Guide Chapter 7 Flexible Pavement Rehabilitation
January 2015 115
Figure 59 DARWin project screen.
To create a new project, click on “File” at the upper left, and select “New”. The following screen
will appear. Type in the UPN/Control Number for the project in the space under “Project Name”,
and click OK.
Figure 60 New project screen
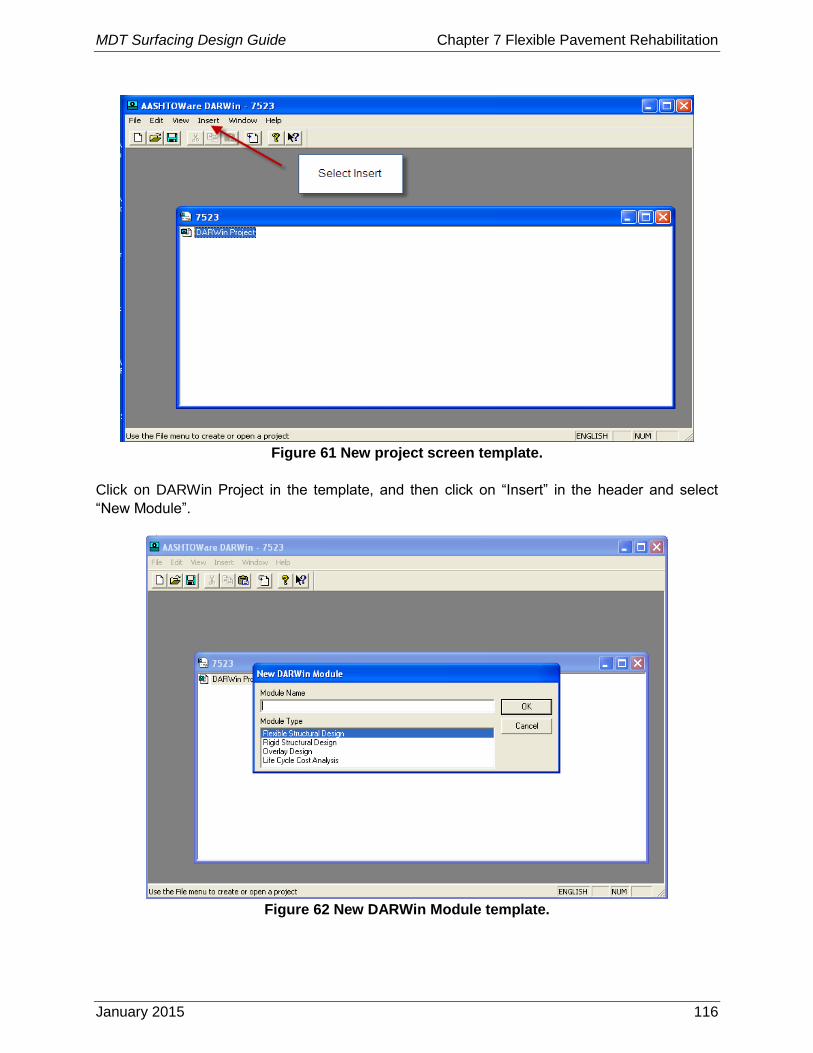
MDT Surfacing Design Guide Chapter 7 Flexible Pavement Rehabilitation
January 2015 116
Figure 61 New project screen template.
Click on DARWin Project in the template, and then click on “Insert” in the header and select
“New Module”.
Figure 62 New DARWin Module template.
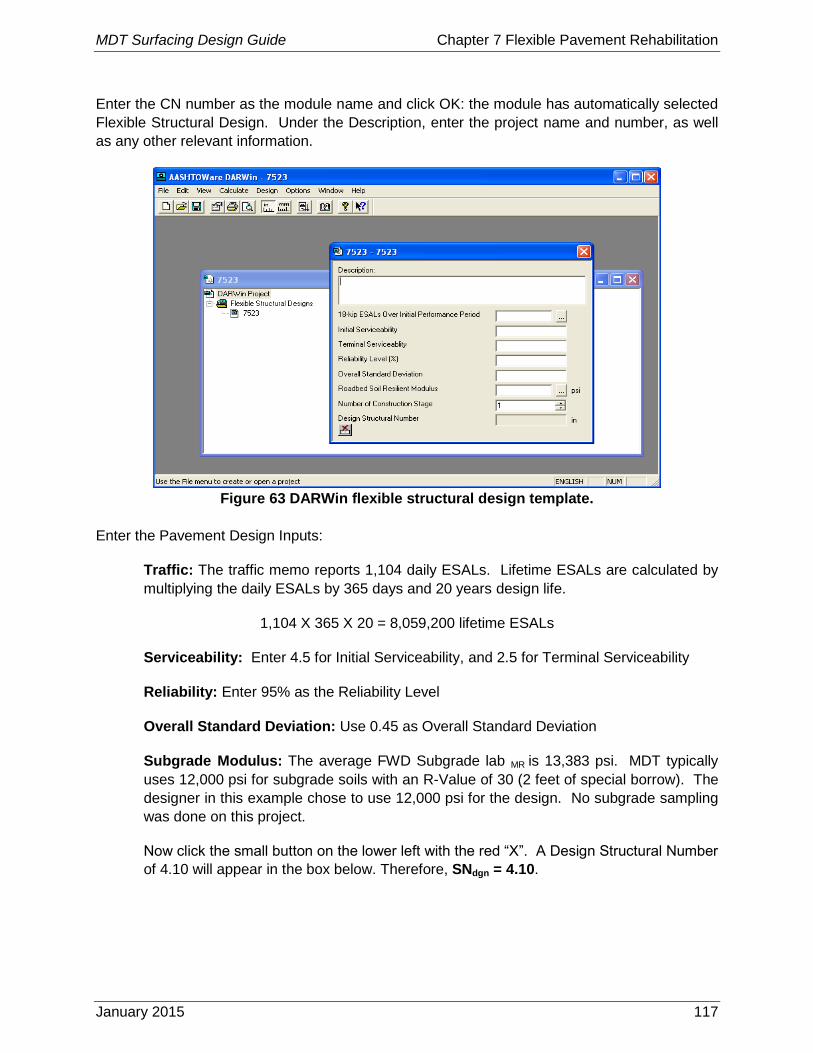
MDT Surfacing Design Guide Chapter 7 Flexible Pavement Rehabilitation
January 2015 117
Enter the CN number as the module name and click OK: the module has automatically selected
Flexible Structural Design. Under the Description, enter the project name and number, as well
as any other relevant information.
Figure 63 DARWin flexible structural design template.
Enter the Pavement Design Inputs:
Traffic: The traffic memo reports 1,104 daily ESALs. Lifetime ESALs are calculated by
multiplying the daily ESALs by 365 days and 20 years design life.
1,104 X 365 X 20 = 8,059,200 lifetime ESALs
Serviceability: Enter 4.5 for Initial Serviceability, and 2.5 for Terminal Serviceability
Reliability: Enter 95% as the Reliability Level
Overall Standard Deviation: Use 0.45 as Overall Standard Deviation
Subgrade Modulus: The average FWD Subgrade lab MR is 13,383 psi. MDT typically
uses 12,000 psi for subgrade soils with an R-Value of 30 (2 feet of special borrow). The
designer in this example chose to use 12,000 psi for the design. No subgrade sampling
was done on this project.
Now click the small button on the lower left with the red “X”. A Design Structural Number
of 4.10 will appear in the box below. Therefore, SNdgn = 4.10.
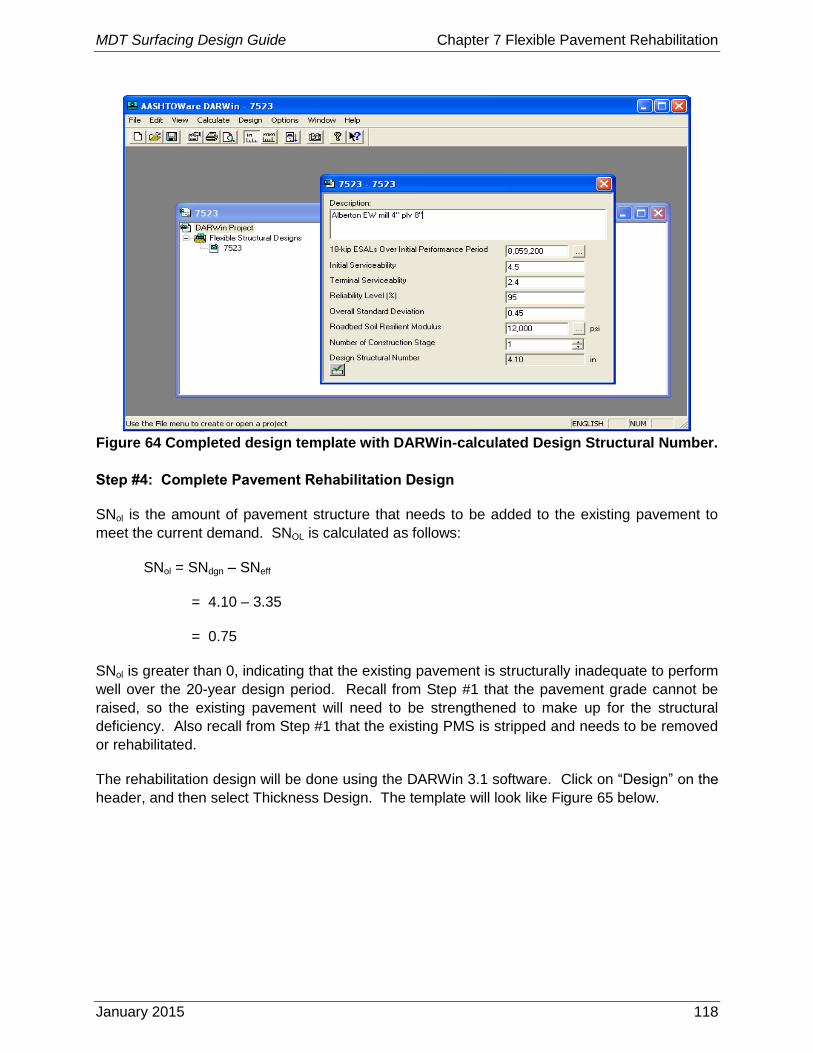
MDT Surfacing Design Guide Chapter 7 Flexible Pavement Rehabilitation
January 2015 118
Figure 64 Completed design template with DARWin-calculated Design Structural Number.
Step #4: Complete Pavement Rehabilitation Design
SNol is the amount of pavement structure that needs to be added to the existing pavement to
meet the current demand. SNOL is calculated as follows:
SNol = SNdgn – SNeff
= 4.10 – 3.35
= 0.75
SNol is greater than 0, indicating that the existing pavement is structurally inadequate to perform
well over the 20-year design period. Recall from Step #1 that the pavement grade cannot be
raised, so the existing pavement will need to be strengthened to make up for the structural
deficiency. Also recall from Step #1 that the existing PMS is stripped and needs to be removed
or rehabilitated.
The rehabilitation design will be done using the DARWin 3.1 software. Click on “Design” on the
header, and then select Thickness Design. The template will look like Figure 65 below.
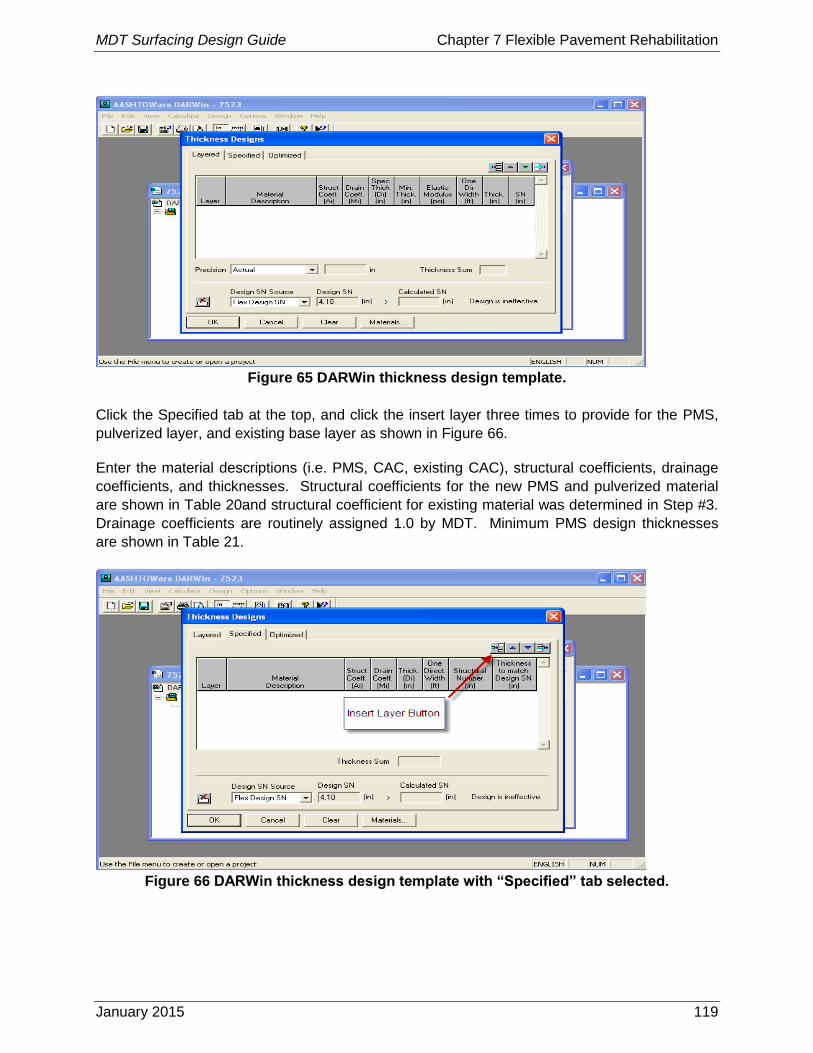
MDT Surfacing Design Guide Chapter 7 Flexible Pavement Rehabilitation
January 2015 119
Figure 65 DARWin thickness design template.
Click the Specified tab at the top, and click the insert layer three times to provide for the PMS,
pulverized layer, and existing base layer as shown in Figure 66.
Enter the material descriptions (i.e. PMS, CAC, existing CAC), structural coefficients, drainage
coefficients, and thicknesses. Structural coefficients for the new PMS and pulverized material
are shown in Table 20and structural coefficient for existing material was determined in Step #3.
Drainage coefficients are routinely assigned 1.0 by MDT. Minimum PMS design thicknesses
are shown in Table 21.
Figure 66 DARWin thickness design template with “Specified” tab selected.
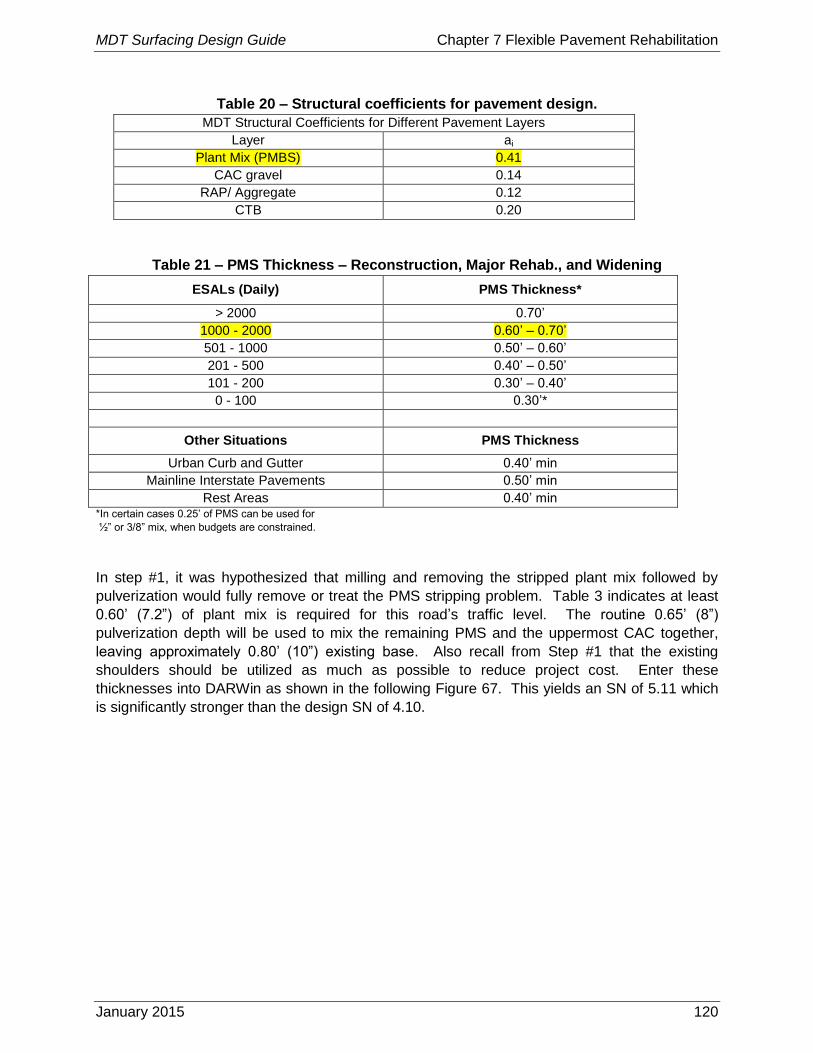
MDT Surfacing Design Guide Chapter 7 Flexible Pavement Rehabilitation
January 2015 120
Table 20 – Structural coefficients for pavement design.
MDT Structural Coefficients for Different Pavement Layers
Layer ai
Plant Mix (PMBS) 0.41
CAC gravel 0.14
RAP/ Aggregate 0.12
CTB 0.20
Table 21 – PMS Thickness – Reconstruction, Major Rehab., and Widening
ESALs (Daily) PMS Thickness*
> 2000 0.70’
1000 - 2000 0.60’ – 0.70’
501 - 1000 0.50’ – 0.60’
201 - 500 0.40’ – 0.50’
101 - 200 0.30’ – 0.40’
0 - 100 0.30’*
Other Situations PMS Thickness
Urban Curb and Gutter 0.40’ min
Mainline Interstate Pavements 0.50’ min
Rest Areas 0.40’ min *In certain cases 0.25’ of PMS can be used for
½” or 3/8” mix, when budgets are constrained.
In step #1, it was hypothesized that milling and removing the stripped plant mix followed by
pulverization would fully remove or treat the PMS stripping problem. Table 3 indicates at least
0.60’ (7.2”) of plant mix is required for this road’s traffic level. The routine 0.65’ (8”)
pulverization depth will be used to mix the remaining PMS and the uppermost CAC together,
leaving approximately 0.80’ (10”) existing base. Also recall from Step #1 that the existing
shoulders should be utilized as much as possible to reduce project cost. Enter these
thicknesses into DARWin as shown in the following Figure 67. This yields an SN of 5.11 which
is significantly stronger than the design SN of 4.10.
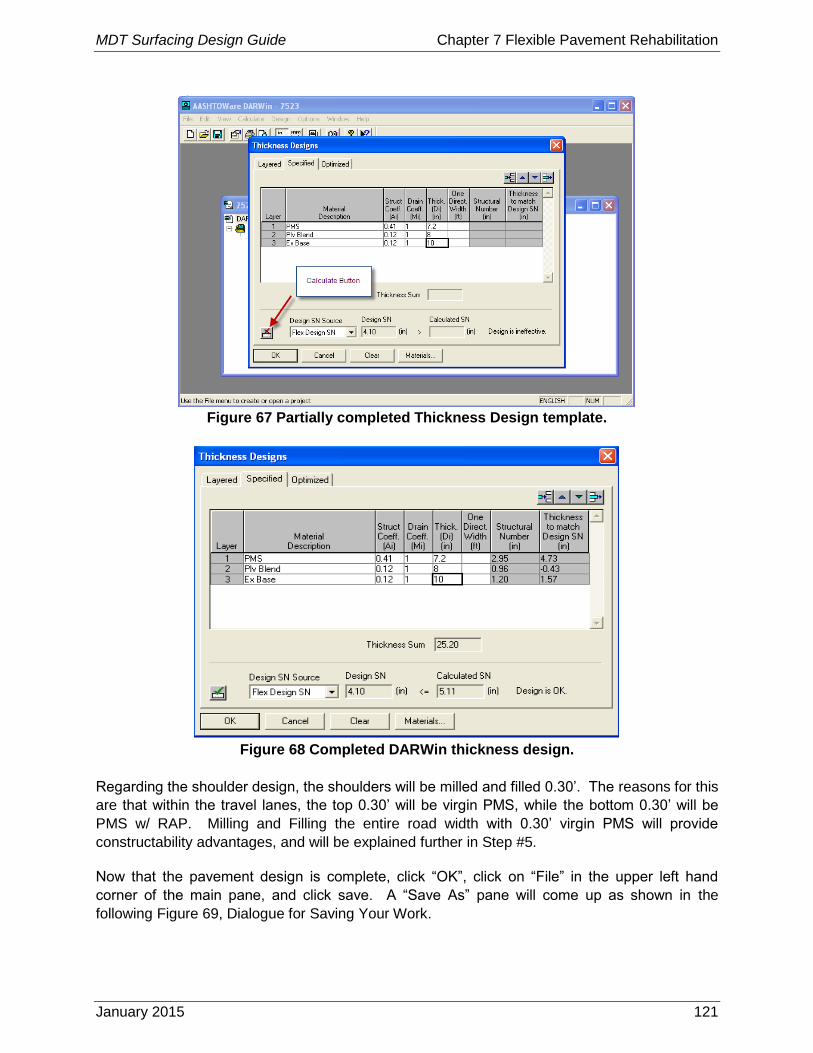
MDT Surfacing Design Guide Chapter 7 Flexible Pavement Rehabilitation
January 2015 121
Figure 67 Partially completed Thickness Design template.
Figure 68 Completed DARWin thickness design.
Regarding the shoulder design, the shoulders will be milled and filled 0.30’. The reasons for this
are that within the travel lanes, the top 0.30’ will be virgin PMS, while the bottom 0.30’ will be
PMS w/ RAP. Milling and Filling the entire road width with 0.30’ virgin PMS will provide
constructability advantages, and will be explained further in Step #5.
Now that the pavement design is complete, click “OK”, click on “File” in the upper left hand
corner of the main pane, and click save. A “Save As” pane will come up as shown in the
following Figure 69, Dialogue for Saving Your Work.
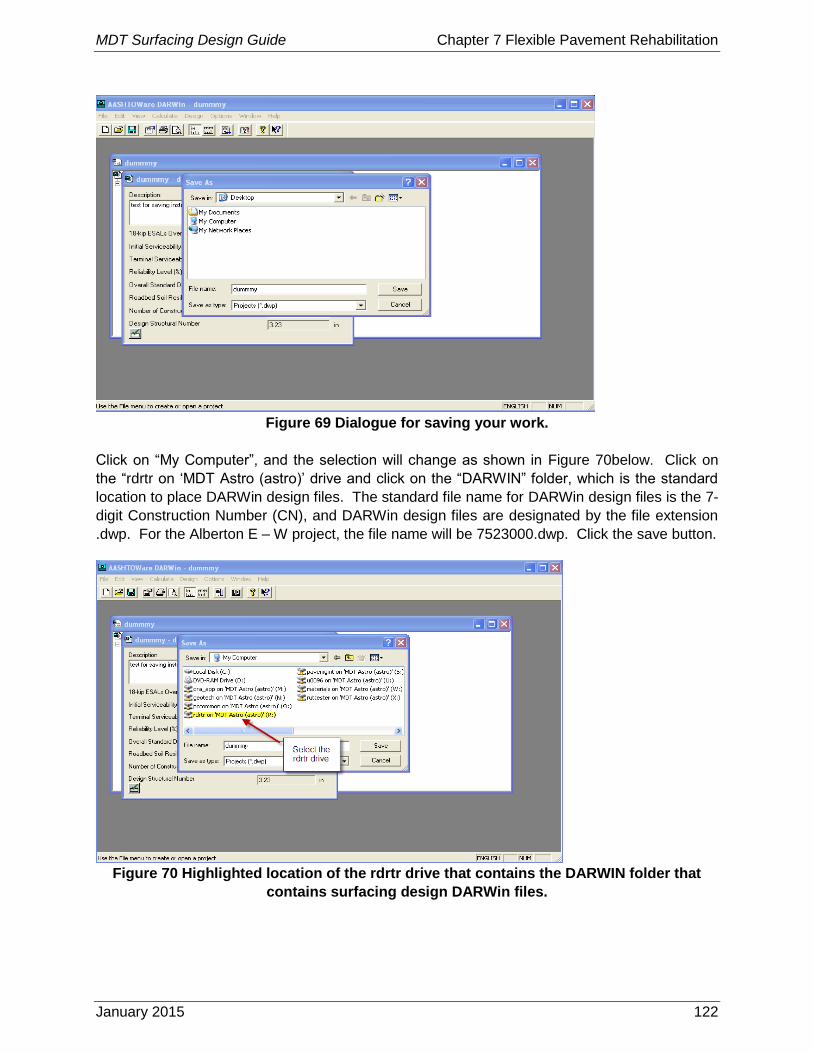
MDT Surfacing Design Guide Chapter 7 Flexible Pavement Rehabilitation
January 2015 122
Figure 69 Dialogue for saving your work.
Click on “My Computer”, and the selection will change as shown in Figure 70below. Click on
the “rdrtr on ‘MDT Astro (astro)’ drive and click on the “DARWIN” folder, which is the standard
location to place DARWin design files. The standard file name for DARWin design files is the 7-
digit Construction Number (CN), and DARWin design files are designated by the file extension
.dwp. For the Alberton E – W project, the file name will be 7523000.dwp. Click the save button.
Figure 70 Highlighted location of the rdrtr drive that contains the DARWIN folder that
contains surfacing design DARWin files.

MDT Surfacing Design Guide Chapter 7 Flexible Pavement Rehabilitation
January 2015 123
Step #5: Specify Pavement Materials and Construction Methods
After the thickness design is completed, the next step is to specify the pavement materials to be
within the pavement.
The PMS type needs to be chosen first since that will determine the need for a surface
treatment. PMS type is chosen based upon PMS quantity and project type as shown in Table 5
and Table 6.
PMS Type Selection
First, the PMS tonnage is calculated. Recall that this design example is a small portion of a 9.0
mile project. Also, based upon discussion with the Road Design Project Manager, the finished
roadway width will be 28’. Use the equation below to calculate PMS tonnage:
Project Length (miles) / project * 5280 ft. / mile * Roadtop Width (ft.)
* PMS thickness (ft.) * 1 yd3/27 ft3 * 3855 lbs. / yd3 * 1 ton PMS / 2000 lbs.
= tons PMS / project
OR:
9.6 miles / project * 5280 ft. / mile * (40’ pavement width) *( 2 sides of Interstate * 0.60’ * 1
yd3/27 ft3 * 3855 lbs. / yd3 * 1 ton PMS / 2000 lbs.
= 173,690 tons PMS / project
Based upon 173,690 tons PMS,
Table 4 specifies that either ½” or ¾” Grade S Volumetric should be specified.
To further refine the PMS type, use Table 6 for this reconstruction project with 0.30’ PMS. The
table specifies that ¾” Grade S or Commercial Plant should be used. Since both tables allow
¾” Grade S Volumetric, the designer should recommend using ¾” Grade S Volumetric on the
project.
Recall from Step #1 that the District would like to use RAP as much as possible. Chapter 6
indicates that RAP contents up to 15% and 30% in the top and bottom lifts are allowed. On this
project it was decided to utilize Virgin PMS on the top 0.3’ PMS (as shown above), and PMS
containing 30% RAP on the bottom lifts. The PMS for the bottom lifts will be “Plant Mix Bit Surf
Gr S – ¾” RAP”, and 30% RAP content within the project Special Provisions.
PG Binder Selection
The criteria for picking PG Binder type is in Table 7. This project has more than 400 daily
ESALs and is also an Interstate Roadway. For the top 0.30’ of virgin PMS, PG 70-28 is
selected, which is a polymer modified binder.
The bottom 0.30’ will consist of PMS with RAP. Here is the guidance given in Chapter 6
regarding specifying PG binders in PMS with RAP:
MDT Surfacing Design Guide Chapter 7 Flexible Pavement Rehabilitation
January 2015 124
Consideration should be given to using a lesser PG binder grade in lower lifts when 0.4’
or more new PMS is required. As a general rule of thumb, binder grade can be dropped
one grade within PMS located more than 0.2’ below the pavement surface.
For PMS with more than 20% recycled asphalt pavement (RAP), reduce the PG binder
grade by one binder grade to account for the oxidized binder within the RAP.
Since the PMS with RAP is more than 0.2’ below the pavement surface and contains more than
20% RAP, the Binder type can be bumped down twice from what is shown in Table 7 (PG 70-
28). That suggests that PG 58-28 should be specified. However, this project is the first project
where Grade S PMS with RAP will be used, so the Pavement Design Engineer recommends
that PG 64-28 be used within the PMS with RAP since it has polymers and will lower the
potential risk.
Asphalt Content Selection
The selection of asphalt content is described in Chapter 6. Within Table 8, it is stated that
project specific asphalt content should be specified for projects where ¾” Grade S Volumetric is
specified. The following website is visited to view the statewide As Constructed Percent Asphalt
map (Also shown in Figure 22). Based on the figure, 5.2% asphalt content is estimated.
Within the PMS with RAP layer, utilize 4.2% asphalt content. This is determined by
interpolating between the asphalt contents for 25% and 40% RAP within Chapter 6, Table 8.
Surface Treatment Selection
This project has AADT = 7090 and has a 70 mph posted speed. Based upon Table 25, a Type I
chip seal should be specified since this is a newly constructed road with no rutting, high traffic
speed, and low traffic volume. However, chip seals tend to wear off within the wheel paths
within this geographic area. Due to this, a Type II chip seal will be specified since it will provide
better durability.
Step #6: Sending the Pavement Design Memo
Now that the thickness design and pavement materials have been determined, the last task is to
send a paper copy of the surfacing design memo to road design staff via interdepartmental mail.
The following pages show the surfacing design memo for this project. Note that the memo is
not signed. In practice, both the Pavement Design Engineer and Designer sign the memo to the
right of their printed names.
After completing the surfacing design memo with Microsoft Word, save the .doc file using the 7
digit Construction Number (CN) as the file name. Save the .doc file in the projects folder on the
shared drive. Once the memo has been submitted for distribution and saved, the EPS activity
may be carded.
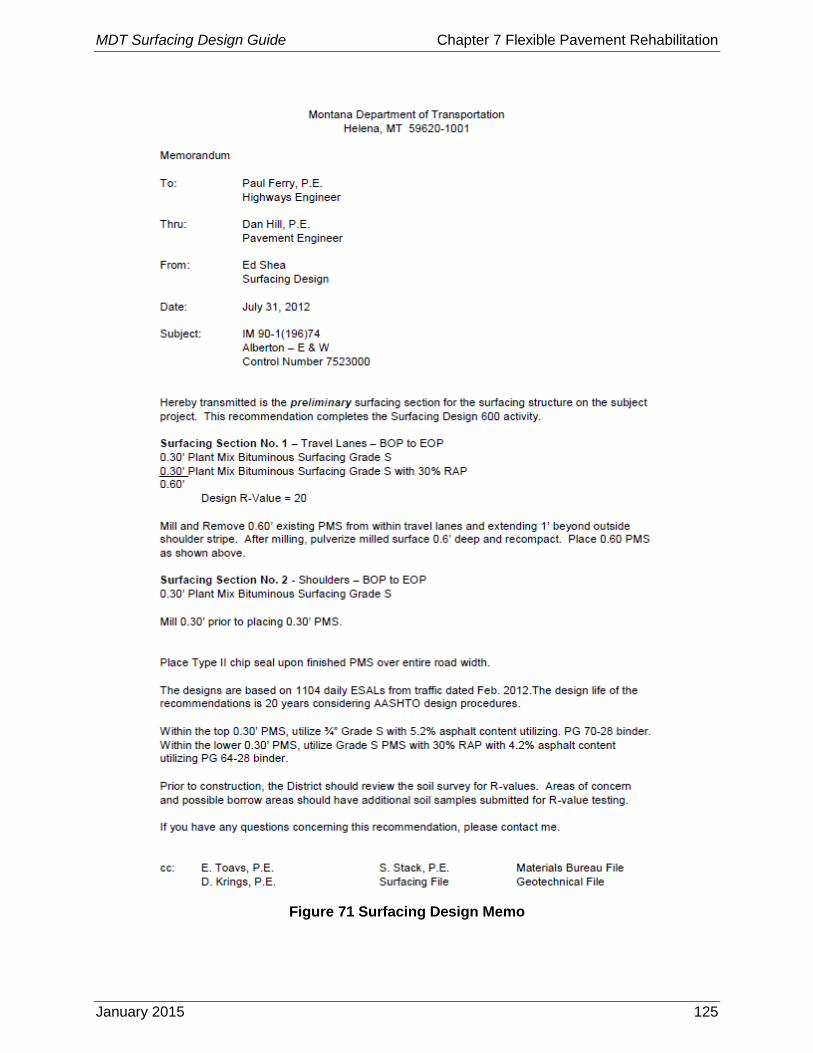
MDT Surfacing Design Guide Chapter 7 Flexible Pavement Rehabilitation
January 2015 125
Figure 71 Surfacing Design Memo

MDT Surfacing Design Guide Chapter 7 Flexible Pavement Rehabilitation
January 2015 126
This page intentionally blank.

MDT Surfacing Design Guide Chapter 8 Engineered Overlays
January 2015 127
Engineered Overlays Chapter 8
An engineered overlay returns the pavement to a high serviceability level and provides the
strength for the pavement design life. It is designed to mitigate existing pavement distress and
material defects. For a Minor Rehabilitation project (Work Type 160), a minimum of 10 years for
the design life is required. The need for milling is determined by the designer based upon the
existing pavement condition. The overlay should do both of the following:
Provide additional pavement structure needed for the pavement design life,
Correct existing pavement distresses and/or pavement material problems so those
issues do not affect performance of the engineered overlay.
A grade raise can be accommodated (~0.2’ to 0.3’)
Engineered Overlays should also be considered on portions of Major Rehabilitation projects
where the following conditions are met:
The horizontal and vertical alignment is not going to change along most of the project
length.
A grade raise can be accommodated (~0.2’ to 0.5’)
A pavement design life of 20 years can be achieved.
The existing pavement, and in particular the PMS layer, is in good condition.
The existing plant mix does not have excessive cracking.
Overhead clearance at grade separations needs to be considered on thick overlay
projects.
Engineered overlays can be a cost effective and relatively fast method to rehabilitate an existing
pavement. They are also particularly useful for pavement widening projects since the existing
pavement can be used to carry traffic while the widening section(s) are built.
Figure 72: Engineered Overlay Design with Deep Pavement Milling
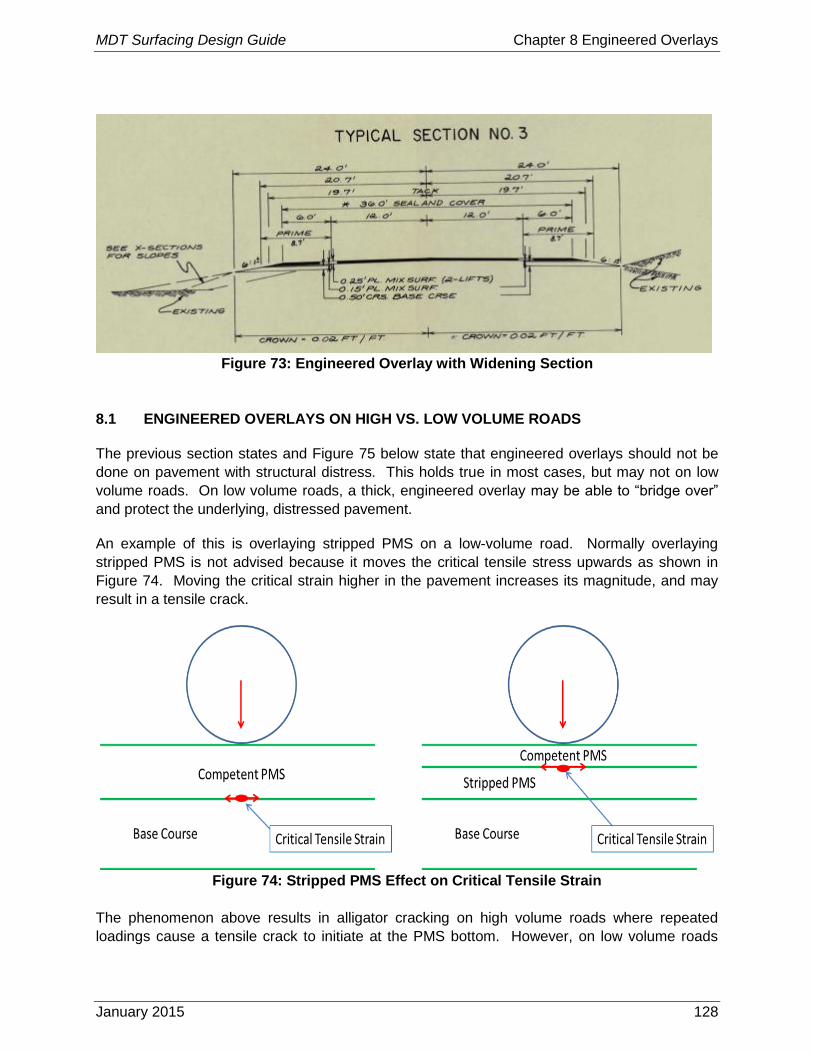
MDT Surfacing Design Guide Chapter 8 Engineered Overlays
January 2015 128
Figure 73: Engineered Overlay with Widening Section
8.1 ENGINEERED OVERLAYS ON HIGH VS. LOW VOLUME ROADS
The previous section states and Figure 75 below state that engineered overlays should not be
done on pavement with structural distress. This holds true in most cases, but may not on low
volume roads. On low volume roads, a thick, engineered overlay may be able to “bridge over”
and protect the underlying, distressed pavement.
An example of this is overlaying stripped PMS on a low-volume road. Normally overlaying
stripped PMS is not advised because it moves the critical tensile stress upwards as shown in
Figure 74. Moving the critical strain higher in the pavement increases its magnitude, and may
result in a tensile crack.
Figure 74: Stripped PMS Effect on Critical Tensile Strain
The phenomenon above results in alligator cracking on high volume roads where repeated
loadings cause a tensile crack to initiate at the PMS bottom. However, on low volume roads
MDT Surfacing Design Guide Chapter 8 Engineered Overlays
January 2015 129
where the pavement is loaded relatively few times, a crack may not start. This lends itself to
using thick overlays on low-volume roads to bridge structurally deficient pavement. Also, Grade
S PMS is a high quality product with superior modulus, tensile strength, and durability; allowing
it to bridge structurally deficient pavements more effectively.
8.2 ISOLATION AND LEVELING LIFTS
Isolation and Leveling Lifts can be utilized with engineered or routing PMS overlays to address
ride, rutting, and/or crack sealant “bumping” issues.
8.2.1 Isolation Lifts
Crack sealant expands when overlaid with hot PMS. The expansion results in a noticeable
bump on the overlay surface. An isolation lift can be used to mitigate this problem. An isolation
lift is an additional 0.07’ PMS lift placed before the overlay. It is placed only within the travel
lanes. Another benefit of an isolation lift is it acts as a leveling course and results in a smoother
post-construction ride.
On overlay projects greater than 0.15’, it may be desirable to reduce the overlay thickness to
0.15’ and place the remaining thickness as an isolation lift. For example, for a 0.20’ overlay, the
plans should specify a 0.15' overlay and a 0.07’ isolation lift. This results in a total thickness of
0.22’. In this case, the isolation lift will provide extra structure and a better post-construction
ride.
Note that on engineered overlays where multiple lifts will be placed isolation lifts are not
necessary since the bottom lift will serve as an isolation lift. In addition, it should be noted
isolation lifts are 0.07’ which is thinner than the recommended lift thickness for ¾ inch plant mix
(which is 2 to 3 times the nominal maximum aggregate size). Because of this, MDT requires a
pneumatic rubber tire roller on the isolation lift to achieve compaction. Currently, there is a
special provision that must be inserted in the plans package to outline the requirements and
ensure adequate compaction is achieved.
8.2.2 PMS Leveling Quantity
Leveling is almost always necessary on single-lift overlay projects. Leveling serves two
purposes. First, it corrects surface defects such as dips, rutting, and otherwise out-of-section
pavements. Secondly, it provides a smoother surface to place the overlay upon, resulting in a
better post-construction ride.
Review of prior projects has shown that projects with adequate leveling quantities result in
smoother overlays. The determination of the proper quantity should be made based on the
condition of the existing roadway, discussions with District design and construction personnel,
and guidance given in Table 22.
The leveling quantities shown in Table 22 have been shown to result in post-construction rides
that meet or exceed MDT’s ride specification. If a decision is made to provide significantly less
leveling than shown in Table 22, ensure the Ride Specification is excluded from that contract.
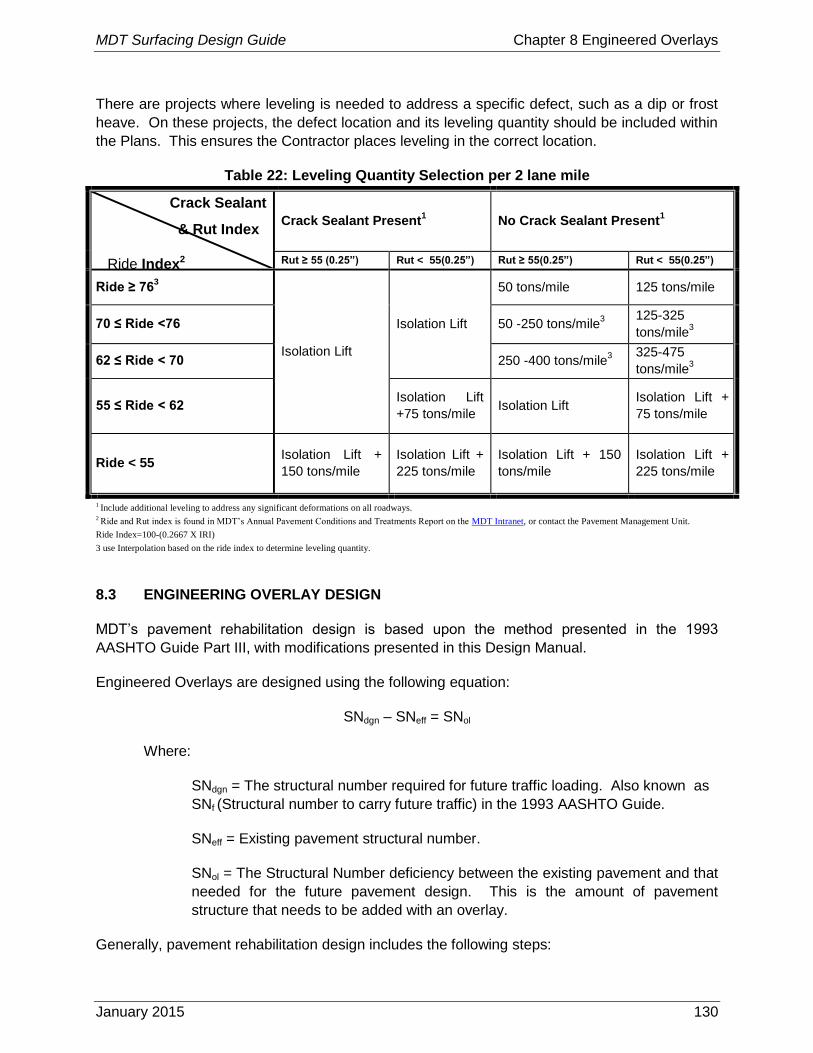
MDT Surfacing Design Guide Chapter 8 Engineered Overlays
January 2015 130
There are projects where leveling is needed to address a specific defect, such as a dip or frost
heave. On these projects, the defect location and its leveling quantity should be included within
the Plans. This ensures the Contractor places leveling in the correct location.
Table 22: Leveling Quantity Selection per 2 lane mile
8.3 ENGINEERING OVERLAY DESIGN
MDT’s pavement rehabilitation design is based upon the method presented in the 1993
AASHTO Guide Part III, with modifications presented in this Design Manual.
Engineered Overlays are designed using the following equation:
SNdgn – SNeff = SNol
Where:
SNdgn = The structural number required for future traffic loading. Also known as
SNf (Structural number to carry future traffic) in the 1993 AASHTO Guide.
SNeff = Existing pavement structural number.
SNol = The Structural Number deficiency between the existing pavement and that
needed for the future pavement design. This is the amount of pavement
structure that needs to be added with an overlay.
Generally, pavement rehabilitation design includes the following steps:
Crack Sealant Present1 No Crack Sealant Present
1
Rut ≥ 55 (0.25”) Rut < 55(0.25”) Rut ≥ 55(0.25”) Rut < 55(0.25”)
Ride ≥ 763
Isolation Lift
Isolation Lift
50 tons/mile 125 tons/mile
70 ≤ Ride <76 50 -250 tons/mile3
125-325
tons/mile3
62 ≤ Ride < 70 250 -400 tons/mile3
325-475
tons/mile3
55 ≤ Ride < 62 Isolation Lift
+75 tons/mile Isolation Lift
Isolation Lift +
75 tons/mile
Ride < 55 Isolation Lift +
150 tons/mile
Isolation Lift +
225 tons/mile
Isolation Lift + 150
tons/mile
Isolation Lift +
225 tons/mile
1 Include additional leveling to address any significant deformations on all roadways. 2 Ride and Rut index is found in MDT’s Annual Pavement Conditions and Treatments Report on the MDT Intranet, or contact the Pavement Management Unit.
Ride Index=100-(0.2667 X IRI)
3 use Interpolation based on the ride index to determine leveling quantity.
Ride Index2
Crack Sealant
& Rut Index
MDT Surfacing Design Guide Chapter 8 Engineered Overlays
January 2015 131
Step #1. Determine if Engineered Overlay is Feasible.
Step #2. Determine existing pavement structural capacity (SNeff).
Step #3. Determine future pavement structural capacity (SNdgn)
Step #4. Determine additional pavement structure needed for design life (SNol)
Step #5. Specify construction methods and materials
Step #6. Send pavement design and materials memo.
Step #1: Determine if Engineered Overlay is Feasible
Choosing an engineered overlay project is heavily based upon engineering judgment. Each
pavement is unique, and there are usually a number of ways to rehabilitate a given pavement.
The best method is one that meets the needs of the pavement designer, road designer,
planning personnel, traveling public, safety, and the project budget. The designer should
communicate with the road designer to ensure the chosen rehabilitation method will fit within the
broader project constraints.
Visually evaluating the pavement condition is the single most important input to making this
decision. By evaluating the pavement distress, as well as the distress mechanisms that cause
the distress, the designer determines whether the pavement distresses are functional or
structural:
Functional distresses refer to those distresses that affect the traveling public, such as
rough ride or low pavement friction. Those distresses, although a nuisance, can happen
on a pavement that is structurally sufficient. Pavements with functional distress tend to
need less expensive surface treatments to restore the pavement serviceability and
extend its design life. These projects are often referred to as pavement preservation.
Structural distresses, such as deep pavement rutting and alligator cracking, are an
indication of inadequate pavement. Structural distress often needs deeper, more
expensive rehabilitation in order to meet the desired design life.
Engineered overlays are the preferred method to rehabilitate pavements with functional
distress while pulverization should be utilized to treat structural distresses. Figure 75
shows a flowchart to serve as a starting point when choosing a rehabilitation method. In
addition to the issues defined in the flowchart, some other issues that influence this decision
are:
Traffic Volume: There are times when heavy traffic volumes will influence the
rehabilitation treatment decision, where the design team may want a more conservative
treatment than shown in the flowchart.
Conversely, on low volume roads there may be a desire to be less conservative in the
pavement design. This may mean an engineered solution that effectively “bridges” over
a problem pavement rather than treats its structural distress directly.
Pavement Grade Raise: Engineering Overlays require pavement grade raise, usually
on the order of 0.2’ to 0.5’. This needs to be considered since it may require roadside
MDT Surfacing Design Guide Chapter 8 Engineered Overlays
January 2015 132
work and/or ROW take to accommodate the grade raise. Engineered overlays will also
reduce the top width and should be discussed accordingly as sometimes this may not be
a feasible option.
Other design issues that should be considered for engineered overlays:
The existing pavement has to be characterized using GPR, FWD, soil survey, and PMS
cores since these designs rely on the underlying pavement structure.
Reflection cracking and rutting needs to be mitigated so it does not reoccur on the
finished pavement surface. Deep or unstable rutting should be addressed by removing
and replacing the unstable PMS layer. Cold in-place recycling should be considered to
reduce or delay the onset of reflection cracking. CIR material has a high air void content
(~11-14%). The high air void level may retard reflective crack propagation.
Do not expose Base gravel.
Ensure that milling is feasible – at least an inch of PMS should remain in place after
milling to carry traffic during construction
Ensure that milling isn’t occurring in overly stripped PMS – milling into stripped PMS may
result in a rough milled surface. Generally, milling should only be done in material with
an average stripping test grade ≥ 1.2.
Ensure that an overlay isn’t being placed directly on overly stripped PMS – placing PMS
overlays on stripped plant mix (stripping grade less than or equal to 1) is not
recommended (Section 0). The underlying PMS may not have adequate strength to
support the new overlay. This may not hold true on very low volume roads where
overlaying stripped plant mix may be possible due to low truck loading.
For overlay and widening projects, the widening sections CAC layer should extend to at
least the depth of the existing roadway base course. This facilitates lateral pavement
drainage and prevents “bathtub” pavement sections.
If milling and overlays are not recommended because of poor stripping analysis results, the
project is likely a good candidate for pulverization.
Step #2: Determing Existing Pavement Structural Capacity (SNeff)
There are two different procedures for determining SNeff; 1) Determine SNeff from in-situ
Destructive Testing, and 2) Determine SNeff from Non-Destructive Testing Results. These
procedures are discussed further in the following sections.
8.3.1 Determine SNeff from in-situ Destructive Testing
In the past, MDT has usually determined SNeff utilizing destructive methods to evaluate the
existing pavement. Destructive methods refer to methods that damage the pavement such as
soil survey boring and PMS coring. The destructive testing information will help characterize

MDT Surfacing Design Guide Chapter 8 Engineered Overlays
January 2015 133
each pavement layer. SNeff is calculated by summarizing the SN of each existing pavement
layer. This method is explained in Chapter 7.

MDT Surfacing Design Guide Chapter 8 Engineered Overlays
January 2015 134
This page intentionally blank.
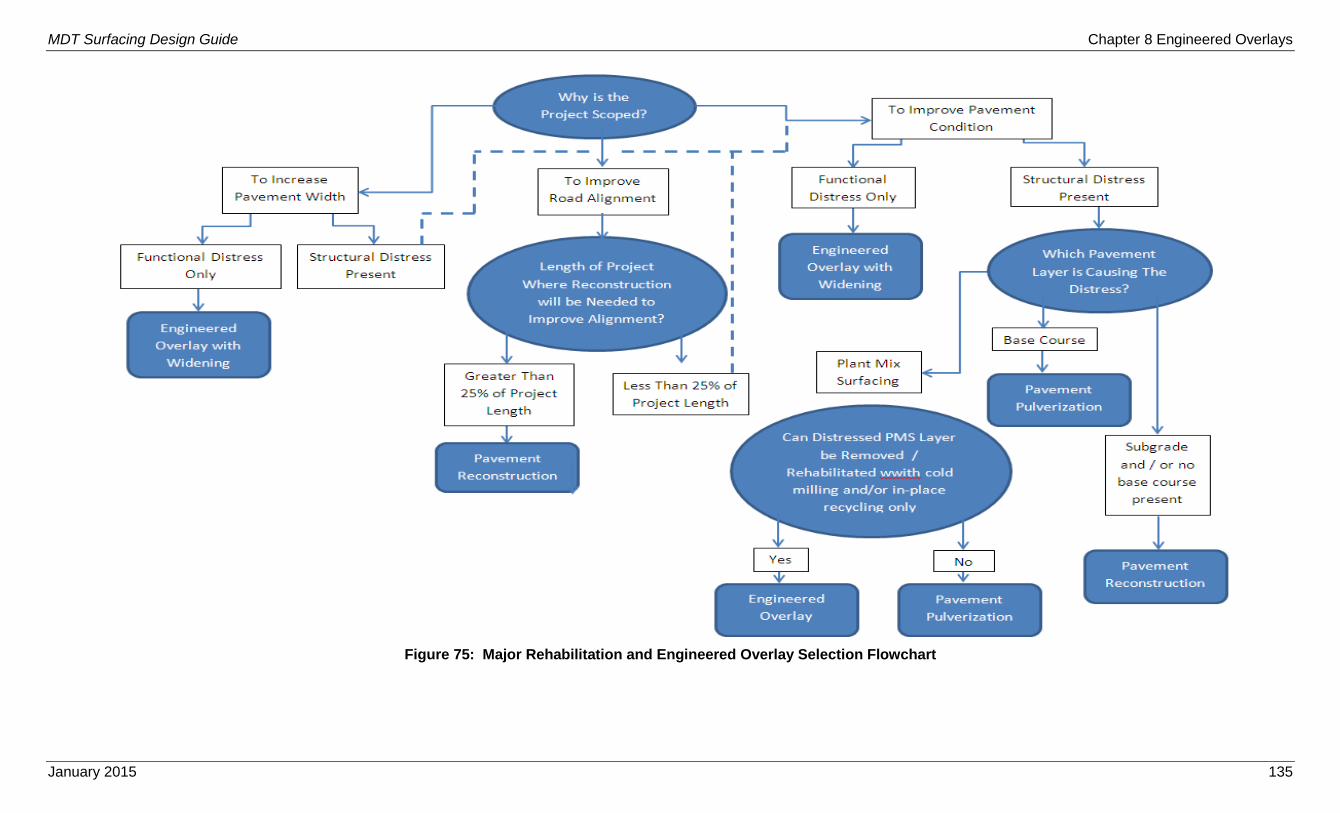
MDT Surfacing Design Guide Chapter 8 Engineered Overlays
January 2015 135
Figure 75: Major Rehabilitation and Engineered Overlay Selection Flowchart

MDT Surfacing Design Guide Chapter 8 Engineered Overlays
January 2015 136
This page intentionally blank.
MDT Surfacing Design Guide Chapter 8 Engineered Overlays
January 2015 137
8.3.2 Determining SNeff from NDT information
This method of determining SNeff is based upon the information presented in 1993 AASHTO,
Chapter 5.4 (pg. III-94 to III-102) (AASHTO, 1993), with adjustments based upon MDT
experience.
In practice, the SNeff should be calculated at each FWD testing location along the project length.
This is most practically done using a spreadsheet discussed later in this section.
This method relies on NDT testing information only to determine SNeff. NDT testing refers to
Falling Weight Deflectometer (FWD) and Ground Penetrating Radar (GPR), which are
discussed more thoroughly in Chapter 7 subsection Existing Pavement Evaluation within this
Manual.
The first step to calculate SNeff is to determine (Ep/Mr)nomograph
Ep/Mr is determined by using the nomograph in 59. The nomograph requires the following
variables:
MR * do / P and D
MR = Uncorrected FWD back-calculated subgrade MR. Uncorrected refers to not
converting the back-calculated MR to laboratory MR (psi)
do = The FWD deflection directly under the load plate (mil)
P = The actual FWD load taken from FWD deflection data. Usually ranges from
8,500 to 9,500 lbs.
D = The total thickness of all pavement layers above the subgrade. This
information should be determined as follows, in order of decreasing accuracy
(in):
GPR PMS depth and soil survey base course depth
Soil survey / core PMS depth and base course depth
TIS Roadlog PMS and base course depth
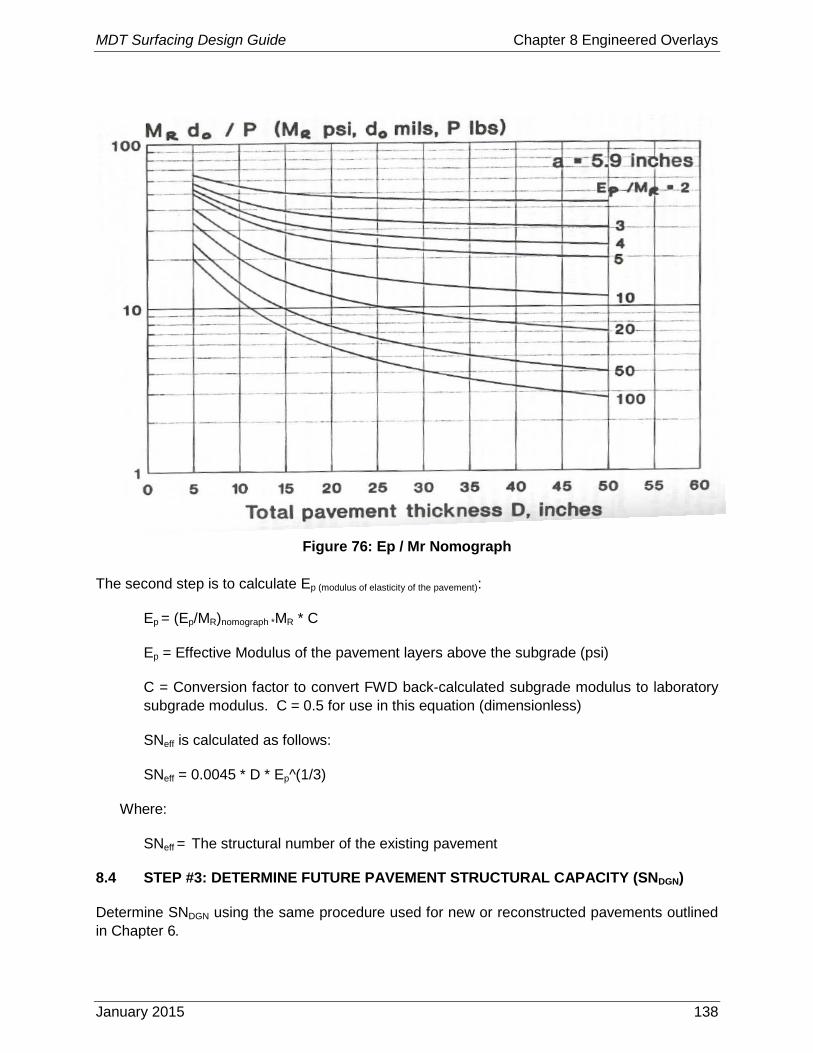
MDT Surfacing Design Guide Chapter 8 Engineered Overlays
January 2015 138
Figure 76: Ep / Mr Nomograph
The second step is to calculate Ep (modulus of elasticity of the pavement):
Ep = (Ep/MR)nomograph *MR * C
Ep = Effective Modulus of the pavement layers above the subgrade (psi)
C = Conversion factor to convert FWD back-calculated subgrade modulus to laboratory
subgrade modulus. C = 0.5 for use in this equation (dimensionless)
SNeff is calculated as follows:
SNeff = 0.0045 * D * Ep^(1/3)
Where:
SNeff = The structural number of the existing pavement
8.4 STEP #3: DETERMINE FUTURE PAVEMENT STRUCTURAL CAPACITY (SNDGN)
Determine SNDGN using the same procedure used for new or reconstructed pavements outlined
in Chapter 6.

MDT Surfacing Design Guide Chapter 8 Engineered Overlays
January 2015 139
8.5 STEP #4: DETERMINE ADDITIONAL PAVEMENT STRUCTURE NEEDED (SNOL)
Determine the pavement structure that needs to be added to the existing pavement to perform
well over its anticipated design life. This is done using the following equation:
SNdgn – SNeff = SNol
Where:
SNdgn = The structural number required for future traffic loading determined during Step
#3.
SNeff = The structural number of the existing pavement determined during Step #2.
SNol = The Structural Number deficiency between the existing pavement and that
needed for the future pavement design. This is the amount of pavement structure that
needs to be added during pavement rehabilitation.
The additional pavement structure, SNol, is added by either adding additional pavement
thickness, or improving the strength of the existing pavement layers. Additional pavement
thickness is usually added with PMS overlay. Improving the existing pavement strength can be
done by:
PMS layer:
Mill and remove existing PMS and replace with new PMS
Improve existing pavement strength using in-place recycling
8.5.1 Completing the Widening Section Design
The pavement widening section design is usually designed similarly to a new pavement. Follow
the steps in Chapter 6 subsection Flexible Pavement Design Method to design the widening
section.
Also consider the following when designing widening sections:
Consider using the material from the rehabilitation section within the widening section.
For example, pavement millings can be blended with virgin CAC to provide CAC for the
widening section.
The widening sections base course should extend to or below the depth of the existing
gravel section. This facilitates drainage and avoids designing a “bathtub” pavement
section.
The designer should approach widening sections with caution. If the widening section
will be a pavement shoulder with little or no traffic, consider using a thinner PMS layer
upon the widening section. Consider the following guidelines:

MDT Surfacing Design Guide Chapter 8 Engineered Overlays
January 2015 140
o The minimum shoulder thickness should be 0.30’ PMS in order to provide depth
for future milling operations (shoulder less than 0.30’ may be considered on very
narrow widening sections or low-volume roads).
o The designer should not do this on Interstate Pavements, pavements where
future traffic lanes may be placed on the shoulder, or shoulders that may become
traveled upon if turning lanes are installed in the future.
o Consider constructability when designing widening section PMS thickness.
Usually, the engineered overlay is placed over the entire road surface after the
widening CAC is placed (Figure 73).
Where more than one PMS lift is placed on the widening section, the bottom lifts are
placed flush with the existing surface.
8.5.2 Spreadsheet Solution for Calculating SNeff, SNdgn, and SNol
A spreadsheet has been developed to quickly calculate the structural numbers needed for
engineered overlay design. Table 23 shows the spreadsheet with details on its use. The
spreadsheet can be found in the Surfacing Design Share Drive.
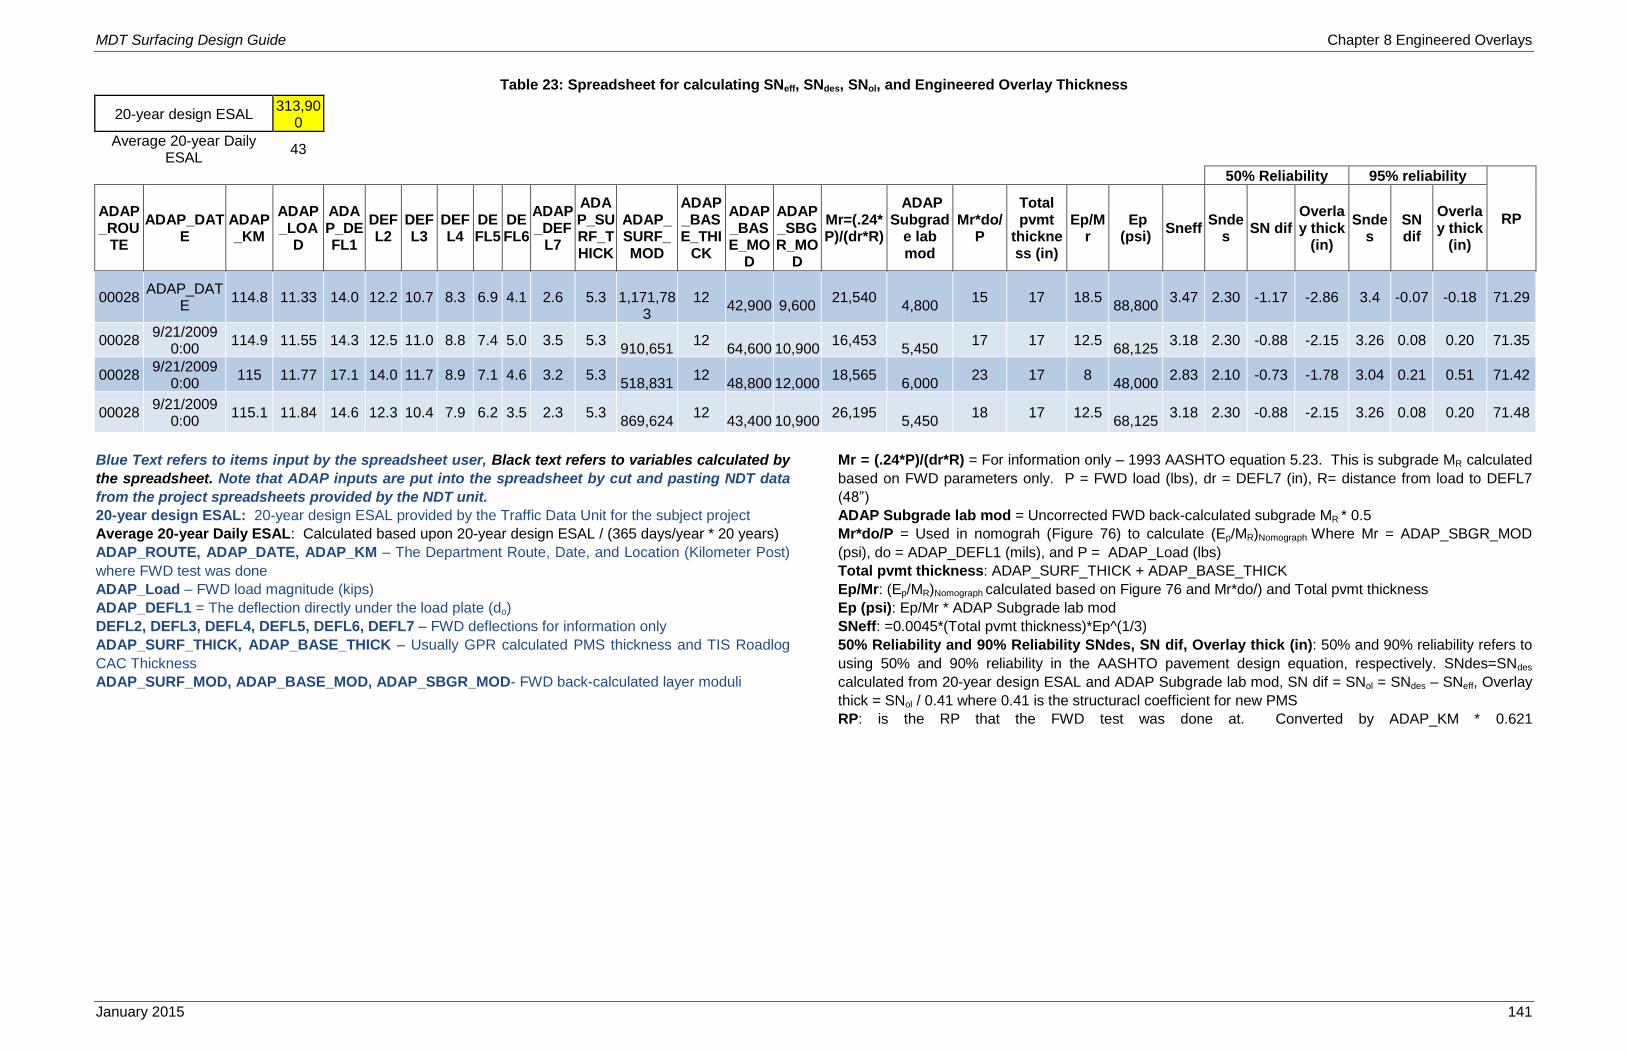
MDT Surfacing Design Guide Chapter 8 Engineered Overlays
January 2015 141
Table 23: Spreadsheet for calculating SNeff, SNdes, SNol, and Engineered Overlay Thickness
20-year design ESAL 313,90
0
Average 20-year Daily ESAL
43
50% Reliability 95% reliability
RP ADAP_ROU
TE
ADAP_DATE
ADAP_KM
ADAP_LOA
D
ADAP_DEFL1
DEFL2
DEFL3
DEFL4
DEFL5
DEFL6
ADAP_DEF
L7
ADAP_SURF_THICK
ADAP_SURF_MOD
ADAP_BASE_THI
CK
ADAP_BASE_MO
D
ADAP_SBGR_MO
D
Mr=(.24*P)/(dr*R)
ADAP Subgrad
e lab mod
Mr*do/P
Total pvmt
thickness (in)
Ep/Mr
Ep (psi)
Sneff Snde
s SN dif
Overlay thick
(in)
Sndes
SN dif
Overlay thick
(in)
00028 ADAP_DAT
E 114.8 11.33 14.0 12.2 10.7 8.3 6.9 4.1 2.6 5.3
1,171,78
3 12
42,900
9,600
21,540
4,800 15 17 18.5
88,800
3.47 2.30 -1.17 -2.86 3.4 -0.07 -0.18 71.29
00028 9/21/2009
0:00 114.9 11.55 14.3 12.5 11.0 8.8 7.4 5.0 3.5 5.3
910,651
12
64,600
10,900 16,453
5,450
17 17 12.5
68,125 3.18 2.30 -0.88 -2.15 3.26 0.08 0.20 71.35
00028 9/21/2009
0:00 115 11.77 17.1 14.0 11.7 8.9 7.1 4.6 3.2 5.3
518,831
12
48,800
12,000 18,565
6,000
23 17 8
48,000 2.83 2.10 -0.73 -1.78 3.04 0.21 0.51 71.42
00028 9/21/2009
0:00 115.1 11.84 14.6 12.3 10.4 7.9 6.2 3.5 2.3 5.3
869,624
12
43,400
10,900 26,195
5,450
18 17 12.5
68,125 3.18 2.30 -0.88 -2.15 3.26 0.08 0.20 71.48
Blue Text refers to items input by the spreadsheet user, Black text refers to variables calculated by
the spreadsheet. Note that ADAP inputs are put into the spreadsheet by cut and pasting NDT data
from the project spreadsheets provided by the NDT unit.
20-year design ESAL: 20-year design ESAL provided by the Traffic Data Unit for the subject project
Average 20-year Daily ESAL: Calculated based upon 20-year design ESAL / (365 days/year * 20 years)
ADAP_ROUTE, ADAP_DATE, ADAP_KM – The Department Route, Date, and Location (Kilometer Post)
where FWD test was done
ADAP_Load – FWD load magnitude (kips)
ADAP_DEFL1 = The deflection directly under the load plate (do)
DEFL2, DEFL3, DEFL4, DEFL5, DEFL6, DEFL7 – FWD deflections for information only
ADAP_SURF_THICK, ADAP_BASE_THICK – Usually GPR calculated PMS thickness and TIS Roadlog
CAC Thickness
ADAP_SURF_MOD, ADAP_BASE_MOD, ADAP_SBGR_MOD- FWD back-calculated layer moduli
Mr = (.24*P)/(dr*R) = For information only – 1993 AASHTO equation 5.23. This is subgrade MR calculated
based on FWD parameters only. P = FWD load (lbs), dr = DEFL7 (in), R= distance from load to DEFL7
(48”)
ADAP Subgrade lab mod = Uncorrected FWD back-calculated subgrade MR * 0.5
Mr*do/P = Used in nomograh (Figure 76) to calculate (Ep/MR)Nomograph Where Mr = ADAP_SBGR_MOD
(psi), do = ADAP_DEFL1 (mils), and P = ADAP_Load (lbs)
Total pvmt thickness: ADAP_SURF_THICK + ADAP_BASE_THICK
Ep/Mr: (Ep/MR)Nomograph calculated based on Figure 76 and Mr*do/) and Total pvmt thickness
Ep (psi): Ep/Mr * ADAP Subgrade lab mod
SNeff: =0.0045*(Total pvmt thickness)*Ep^(1/3)
50% Reliability and 90% Reliability SNdes, SN dif, Overlay thick (in): 50% and 90% reliability refers to
using 50% and 90% reliability in the AASHTO pavement design equation, respectively. SNdes=SNdes
calculated from 20-year design ESAL and ADAP Subgrade lab mod, SN dif = SNol = SNdes – SNeff, Overlay
thick = SNol / 0.41 where 0.41 is the structuracl coefficient for new PMS
RP: is the RP that the FWD test was done at. Converted by ADAP_KM * 0.621

MDT Surfacing Design Guide Chapter 8 Engineered Overlays
January 2015 142
This page intentionally blank.

MDT Surfacing Design Guide Chapter 8 Engineered Overlays
January 2015 143
8.6 STEP #5: SPECIFY CONSTRUCTION METHODS AND MATERIALS
Specify Materials to be used within the designed pavement using the same procedure used for
new or reconstructed pavements. This process is outlined in Chapter 6 Step #4: Specifying
Pavement Materials.
8.7 STEP #6: SEND PAVEMENT DESIGN AND MATERIALS MEMO.
Send a surfacing design memo to the road design staff via interdepartmental mail. The
following list includes items that are included on the surfacing design memo
To: Highways Engineer
Thru: Pavement Design Engineer (with signature)
From: Designer (with signature)
Date
Subject Project Number, Name, and CN Number
Designate Preliminary or Final and EPS Act. 600 or 604, respectively
PMS Thicknesses for existing pavement sections
PMS and CAC thickness for widening section
A description of milling or in-place recycling depths
Thorough description of the type and order of construction operations needed for
engineered overlay
Design R-Value
The Daily ESALs used for Design
Plant Mix Type
Use of RAP and PMS RAP content
Design Life Length (yrs.)
Binder type
Asphalt Content
CC’d to District Administrator, Road Design Engineer, Road Design Project Manager,
and Surfacing, Materials, and Geotechnical

MDT Surfacing Design Guide Chapter 8 Engineered Overlays
January 2015 144
An effort should be made to make the surfacing design memos as detailed as needed for the
road designer to develop both project reports and construction plans.
After completing the surfacing design memo with Microsoft Word, save the .doc file using the 7
digit Construction Number (CN) as the file name. Save the .doc file in the rdrtr share drive as
previously described in Chapter 6. Once the memo has been submitted for distribution and
saved, the EPS activity may be carded off.
When the paper copy of the memo is distributed, the original copy is stamped “Master Copy”
with a green stamp by the Department’s mail staff, and sent back to surfacing design. This
“Master Copy” is stored in the surfacing design project file.
There will be instances when the design memo is sent electronically via email. When this is
necessary, the Word file (.doc) should be converted to an Adobe Acrobat File (.pdf) before
sending it. The purpose of this is that a .pdf file cannot be altered.
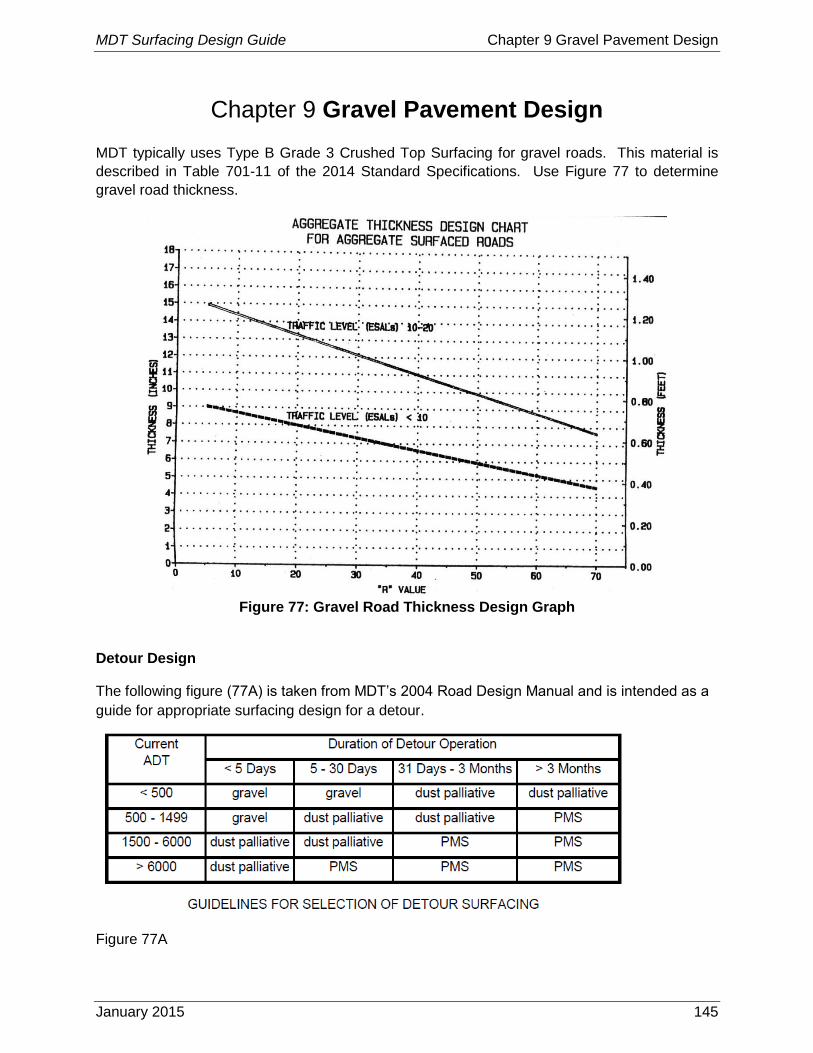
MDT Surfacing Design Guide Chapter 9 Gravel Pavement Design
January 2015 145
Gravel Pavement Design Chapter 9
MDT typically uses Type B Grade 3 Crushed Top Surfacing for gravel roads. This material is
described in Table 701-11 of the 2014 Standard Specifications. Use Figure 77 to determine
gravel road thickness.
Figure 77: Gravel Road Thickness Design Graph
Detour Design
The following figure (77A) is taken from MDT’s 2004 Road Design Manual and is intended as a
guide for appropriate surfacing design for a detour.
Figure 77A

MDT Surfacing Design Guide Chapter 9 Gravel Pavement Design
January 2015 146
This page intentionally blank.
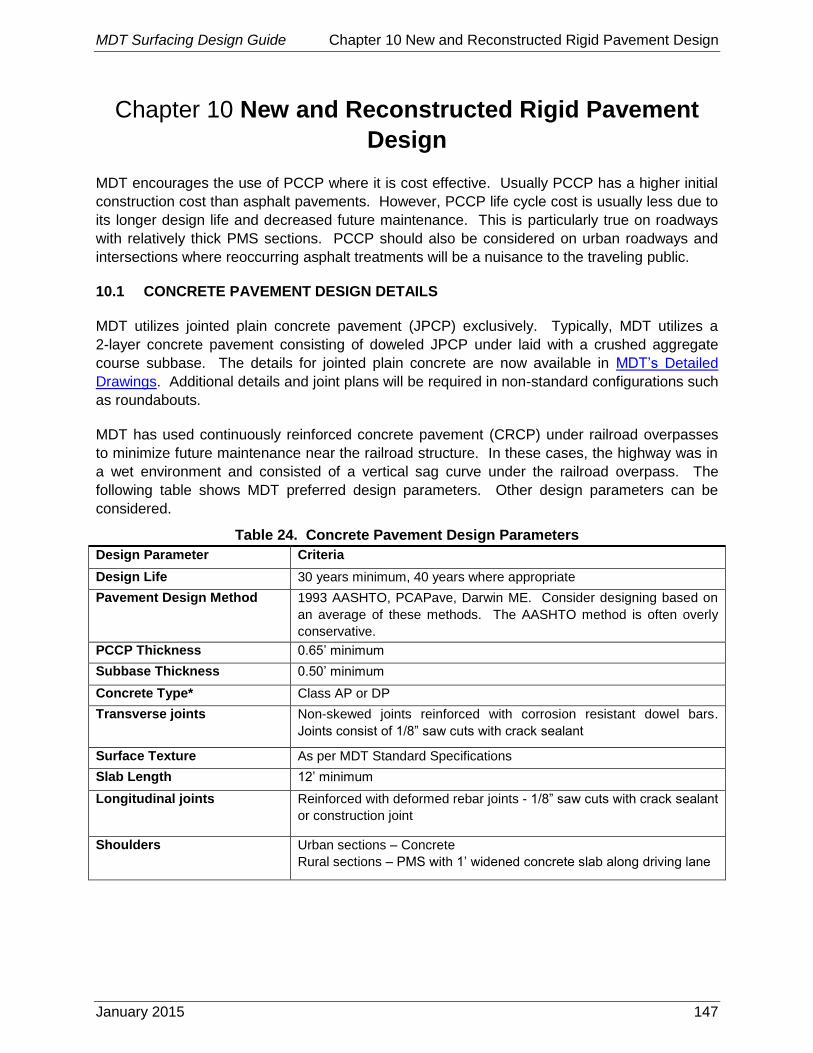
MDT Surfacing Design Guide Chapter 10 New and Reconstructed Rigid Pavement Design
January 2015 147
New and Reconstructed Rigid Pavement Chapter 10
Design
MDT encourages the use of PCCP where it is cost effective. Usually PCCP has a higher initial
construction cost than asphalt pavements. However, PCCP life cycle cost is usually less due to
its longer design life and decreased future maintenance. This is particularly true on roadways
with relatively thick PMS sections. PCCP should also be considered on urban roadways and
intersections where reoccurring asphalt treatments will be a nuisance to the traveling public.
10.1 CONCRETE PAVEMENT DESIGN DETAILS
MDT utilizes jointed plain concrete pavement (JPCP) exclusively. Typically, MDT utilizes a
2-layer concrete pavement consisting of doweled JPCP under laid with a crushed aggregate
course subbase. The details for jointed plain concrete are now available in MDT’s Detailed
Drawings. Additional details and joint plans will be required in non-standard configurations such
as roundabouts.
MDT has used continuously reinforced concrete pavement (CRCP) under railroad overpasses
to minimize future maintenance near the railroad structure. In these cases, the highway was in
a wet environment and consisted of a vertical sag curve under the railroad overpass. The
following table shows MDT preferred design parameters. Other design parameters can be
considered.
Table 24. Concrete Pavement Design Parameters
Design Parameter Criteria
Design Life 30 years minimum, 40 years where appropriate
Pavement Design Method 1993 AASHTO, PCAPave, Darwin ME. Consider designing based on
an average of these methods. The AASHTO method is often overly
conservative.
PCCP Thickness 0.65’ minimum
Subbase Thickness 0.50’ minimum
Concrete Type* Class AP or DP
Transverse joints Non-skewed joints reinforced with corrosion resistant dowel bars.
Joints consist of 1/8” saw cuts with crack sealant
Surface Texture As per MDT Standard Specifications
Slab Length 12’ minimum
Longitudinal joints Reinforced with deformed rebar joints - 1/8” saw cuts with crack sealant
or construction joint
Shoulders Urban sections – Concrete
Rural sections – PMS with 1’ widened concrete slab along driving lane

MDT Surfacing Design Guide Chapter 10 New and Reconstructed Rigid Pavement Design
January 2015 148
This page intentionally blank.

MDT Surfacing Design Guide Chapter 11 Rigid Pavement Rehabilitation
January 2015 149
Rigid Pavement Rehabilitation Chapter 11
11.1 MINOR REHABILITATION:
The first post construction treatment for concrete pavements is to perform a minor rehabilitation
which typically consists of minor slab replacement, diamond grind and joint resealing.
Depending on concrete thickness a concrete pavement may allow for multiple minor
rehabilitations within its overall life span.
Another minor rehabilitation treatment for concrete pavements is to perform a diamond grind
and then place a plant mix seal on the concrete. This has been done successfully by MDT in
the Glendive District.
11.2 MAJOR REHABILITATION:
The next level of post construction treatment for concrete pavements is to perform a major
rehabilitation which typically consists of slab replacement, dowel bar retrofit, diamond grind and
joint resealing. Many of the concrete pavements in Montana were initially constructed in the
1960’s using aggregate interlock between slabs and therefore do not have dowel bars or
reinforcement. A successful rehabilitation strategy is to saw cut in dowel bars and grout them in
place. Faulting is also corrected with the diamond grinding.
The final level of major rehabilitation treatment for concrete pavements is to perform a crack and
seat and then apply a Hot Mix Asphalt (HMA) overlay. The PCCP pavement should be crack
and seated prior to placing an HMA to minimize reflective cracking by reducing the size of the
PCCP slab. When crack and seated properly, reflective cracking is essentially eliminated.
The PCCP should be cracked at 24 inch intervals to create a uniform pattern of cracking. Once
the PCCP is cracked it should be seated with a rubber tired roller weighing at least 35 tons. The
seating by the roller pushes down the PCCP pieces and provides an excellent base for the
asphalt overlay to be placed directly on. The procedure for the crack and seat should be:
Crack the PCCP slabs.
Seat the cracked pieces.
Remove and repair any soft spots.
Sweep the project clean.
Apply a tack coat.
Place an asphalt leveling course.
Place the asphalt overlay.

MDT Surfacing Design Guide Chapter 11 Rigid Pavement Rehabilitation
January 2015 150
Crack and Seat is a treatment more suitable for the rural environment. When used on the east
coast in the urban environment, the process of cracking the existing PCCP broke old water
mains and cracked windows and walls in homes adjacent to the roadway.
11.3 OTHER REHABILITATION TREATMENTS:
White Topping can be used successfully on both existing plant mix and concrete pavements.
When placed on concrete, this is referred to as a bonded or un-bonded overlay. In the past,
MDT has successfully used this in urban areas with existing thick pavement sections. This was
primarily done on high AADT routes with bad rutting. This would be considered a major
rehabilitation treatment.

MDT Surfacing Design Guide Chapter 12 Pavement Preservation & Scheduled Treatments
January 2015 151
Pavement Preservation & Scheduled Chapter 12
Treatments
12.1 PAVEMENT PRESERVATION PROJECTS
The intent of pavement preservation projects is to extend the useful life of pavements based
upon an observed pavement distress rather than on a scheduled basis. For more information on
the pavement preservation process, view the agreement at this link.
The surfacing designer should prepare for the Preliminary Field Review prior to the review by
reviewing the project’s ride and rut data. In addition, the designer should have a knowledge of
the existing typical section thickness and the time and type of the last treatment. The designer
can review historical project files, as-built plans, and consult with the District Materials Labs to
obtain existing mix and source information.
12.1.1 Surface Treatments
All PMS needs a surface treatment placed on it with the exception of 3/8” Grade S. The primary
purpose of the surface treatment is to seal the pavement from water and oxidation. 3/8” Grade
S does not need a surface treatment since it is nearly impermeable. MDT’s most common
surface treatment is seal and cover, also known as a chip seal or seal coat. Seal and cover is
the standard surface treatment, but other treatments should be considered on roadways where
chip seals are not performing well or are not desired by the traveling public. Table 25 gives
guidance on surfacing treatment selection.
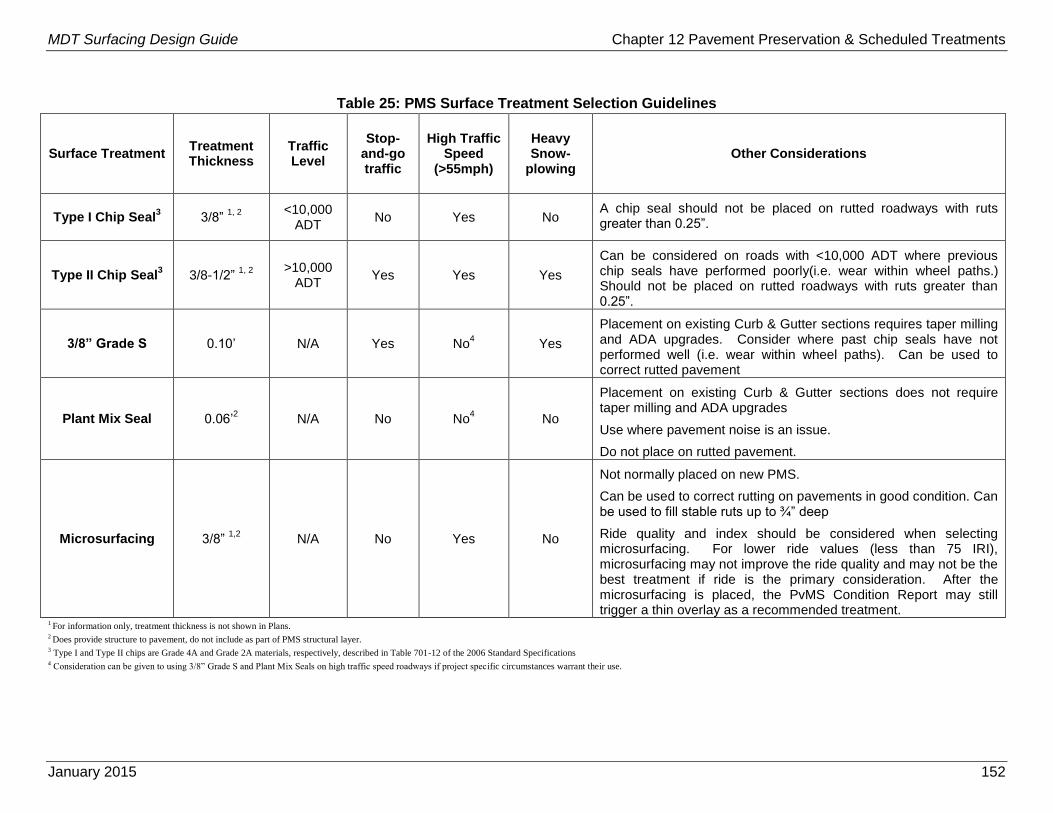
MDT Surfacing Design Guide Chapter 12 Pavement Preservation & Scheduled Treatments
January 2015 152
Table 25: PMS Surface Treatment Selection Guidelines
Surface Treatment Treatment Thickness
Traffic Level
Stop-and-go traffic
High Traffic Speed
(>55mph)
Heavy Snow-
plowing Other Considerations
Type I Chip Seal3 3/8”
1, 2 <10,000 ADT
No Yes No A chip seal should not be placed on rutted roadways with ruts greater than 0.25”.
Type II Chip Seal3 3/8-1/2”
1, 2 >10,000 ADT
Yes Yes Yes
Can be considered on roads with <10,000 ADT where previous chip seals have performed poorly(i.e. wear within wheel paths.) Should not be placed on rutted roadways with ruts greater than 0.25”.
3/8” Grade S 0.10’ N/A Yes No4 Yes
Placement on existing Curb & Gutter sections requires taper milling and ADA upgrades. Consider where past chip seals have not performed well (i.e. wear within wheel paths). Can be used to correct rutted pavement
Plant Mix Seal 0.06’2 N/A No No
4 No
Placement on existing Curb & Gutter sections does not require taper milling and ADA upgrades
Use where pavement noise is an issue.
Do not place on rutted pavement.
Microsurfacing 3/8” 1,2
N/A No Yes No
Not normally placed on new PMS.
Can be used to correct rutting on pavements in good condition. Can be used to fill stable ruts up to ¾” deep
Ride quality and index should be considered when selecting microsurfacing. For lower ride values (less than 75 IRI), microsurfacing may not improve the ride quality and may not be the best treatment if ride is the primary consideration. After the microsurfacing is placed, the PvMS Condition Report may still trigger a thin overlay as a recommended treatment.
1 For information only, treatment thickness is not shown in Plans. 2 Does provide structure to pavement, do not include as part of PMS structural layer. 3 Type I and Type II chips are Grade 4A and Grade 2A materials, respectively, described in Table 701-12 of the 2006 Standard Specifications 4 Consideration can be given to using 3/8” Grade S and Plant Mix Seals on high traffic speed roadways if project specific circumstances warrant their use.
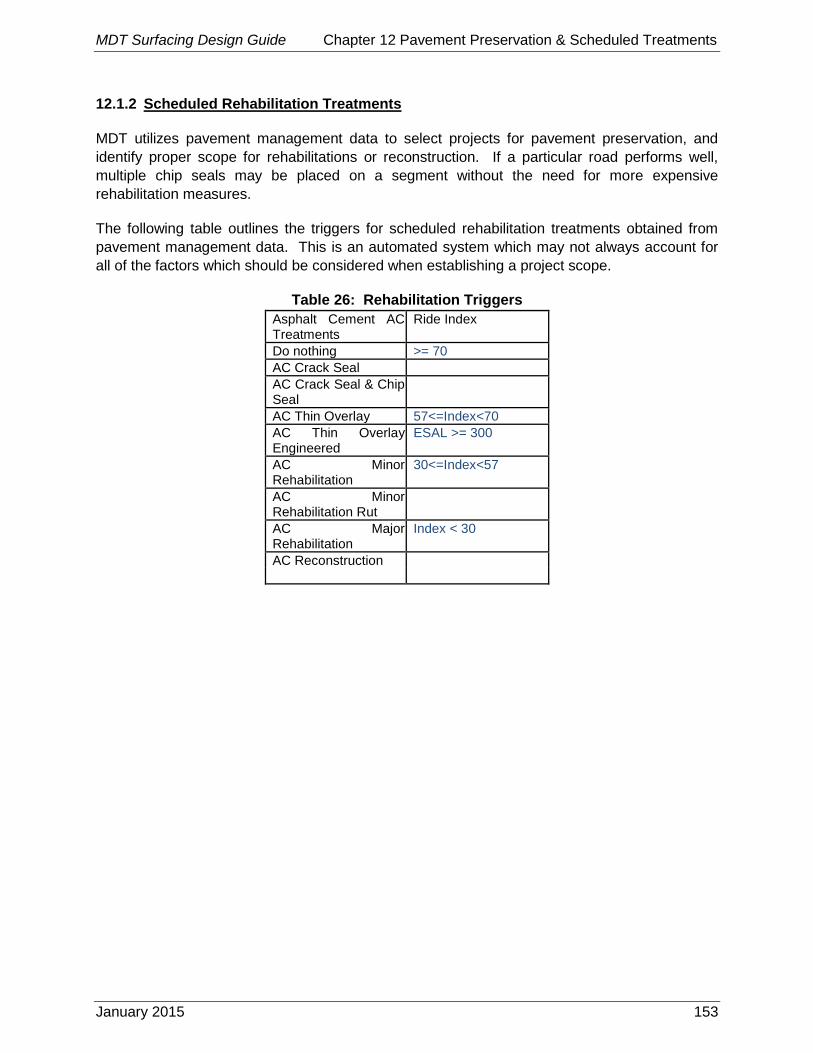
MDT Surfacing Design Guide Chapter 12 Pavement Preservation & Scheduled Treatments
January 2015 153
12.1.2 Scheduled Rehabilitation Treatments
MDT utilizes pavement management data to select projects for pavement preservation, and
identify proper scope for rehabilitations or reconstruction. If a particular road performs well,
multiple chip seals may be placed on a segment without the need for more expensive
rehabilitation measures.
The following table outlines the triggers for scheduled rehabilitation treatments obtained from
pavement management data. This is an automated system which may not always account for
all of the factors which should be considered when establishing a project scope.
Table 26: Rehabilitation Triggers
Asphalt Cement AC Treatments
Ride Index
Do nothing >= 70
AC Crack Seal
AC Crack Seal & Chip Seal
AC Thin Overlay 57<=Index<70
AC Thin Overlay Engineered
ESAL >= 300
AC Minor Rehabilitation
30<=Index<57
AC Minor Rehabilitation Rut
AC Major Rehabilitation
Index < 30
AC Reconstruction
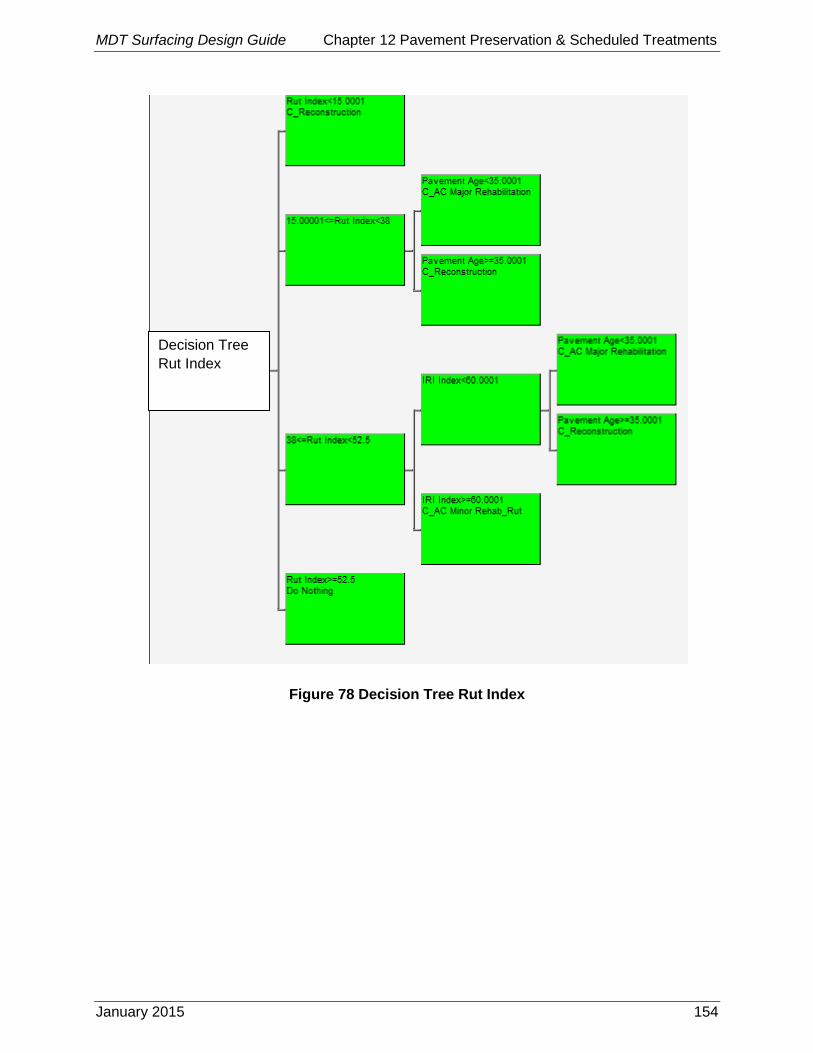
MDT Surfacing Design Guide Chapter 12 Pavement Preservation & Scheduled Treatments
January 2015 154
Figure 78 Decision Tree Rut Index
Decision Tree
Rut Index
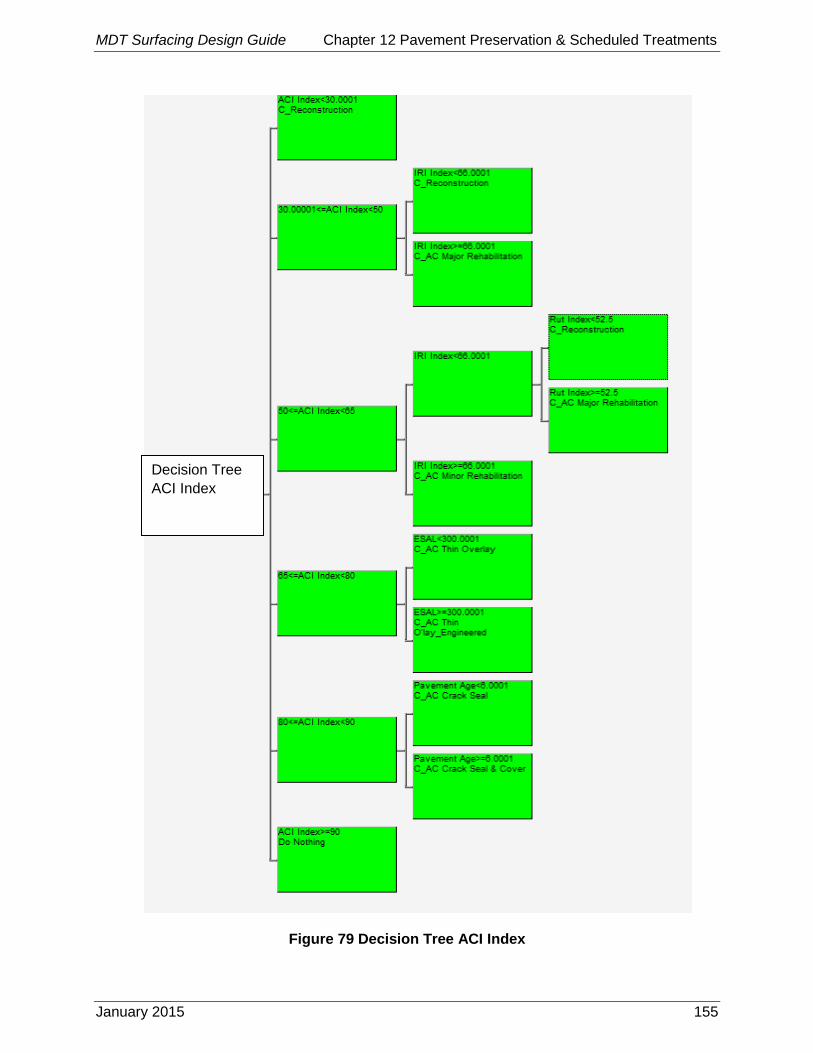
MDT Surfacing Design Guide Chapter 12 Pavement Preservation & Scheduled Treatments
January 2015 155
Figure 79 Decision Tree ACI Index
Decision Tree
ACI Index
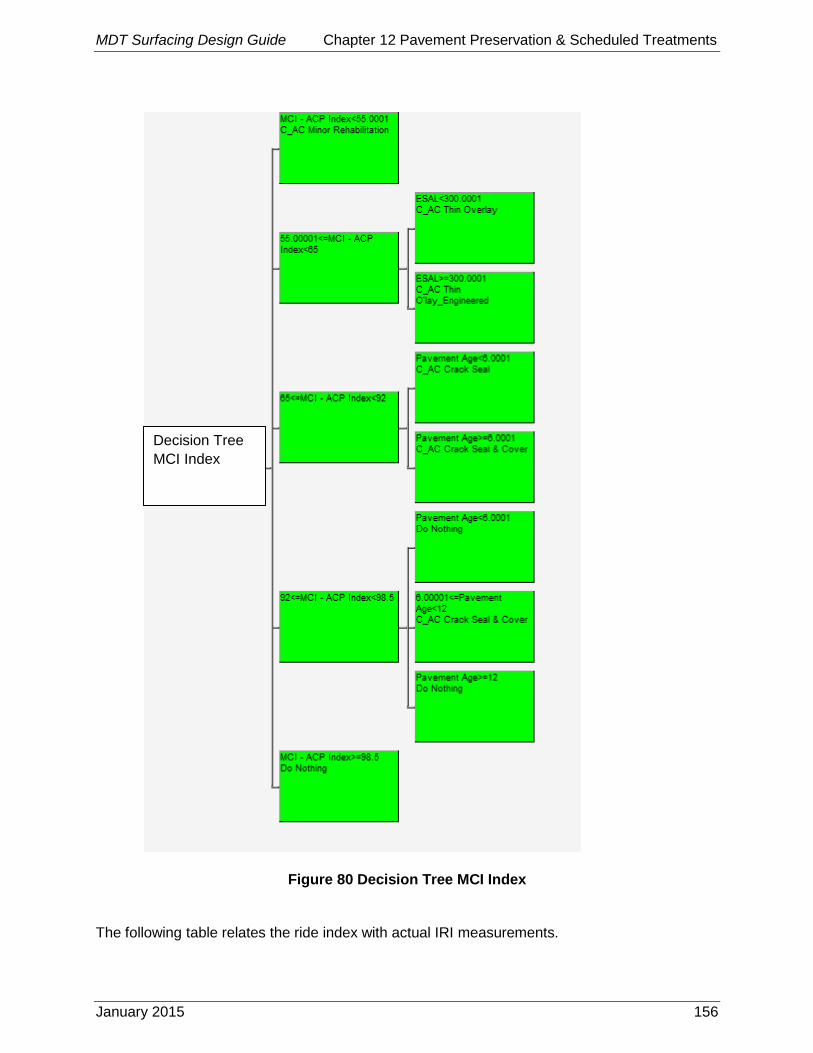
MDT Surfacing Design Guide Chapter 12 Pavement Preservation & Scheduled Treatments
January 2015 156
Figure 80 Decision Tree MCI Index
The following table relates the ride index with actual IRI measurements.
Decision Tree
MCI Index
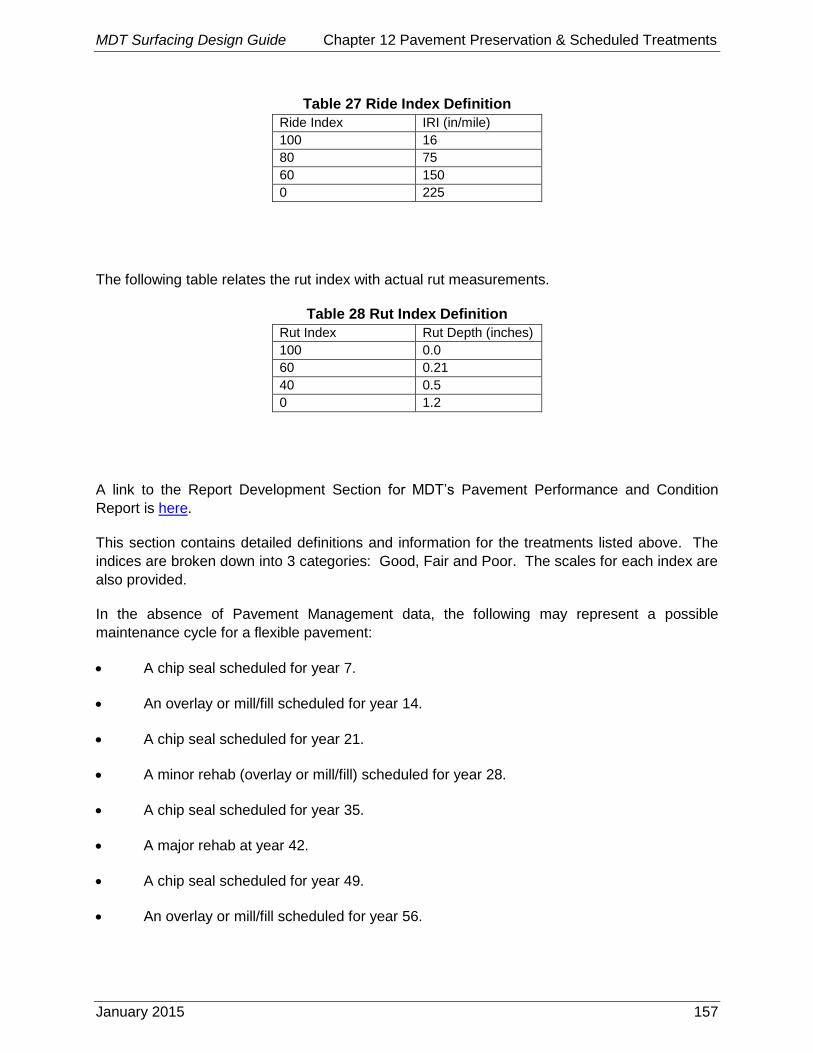
MDT Surfacing Design Guide Chapter 12 Pavement Preservation & Scheduled Treatments
January 2015 157
Table 27 Ride Index Definition
Ride Index IRI (in/mile)
100 16
80 75
60 150
0 225
The following table relates the rut index with actual rut measurements.
Table 28 Rut Index Definition
Rut Index Rut Depth (inches)
100 0.0
60 0.21
40 0.5
0 1.2
A link to the Report Development Section for MDT’s Pavement Performance and Condition
Report is here.
This section contains detailed definitions and information for the treatments listed above. The
indices are broken down into 3 categories: Good, Fair and Poor. The scales for each index are
also provided.
In the absence of Pavement Management data, the following may represent a possible
maintenance cycle for a flexible pavement:
A chip seal scheduled for year 7.
An overlay or mill/fill scheduled for year 14.
A chip seal scheduled for year 21.
A minor rehab (overlay or mill/fill) scheduled for year 28.
A chip seal scheduled for year 35.
A major rehab at year 42.
A chip seal scheduled for year 49.
An overlay or mill/fill scheduled for year 56.

MDT Surfacing Design Guide Chapter 12 Pavement Preservation & Scheduled Treatments
January 2015 158
Reconstruct at year 60.
In the absence of Pavement Management data, the following may represent a possible
maintenance cycle for a rigid pavement:
1. A diamond grind, joint seal, and slab replacement (~2%) at year 20.
2. A diamond grind, joint seal, and slab replacement (~2-5%) at year 40.
3. Reconstruct at year 60.
This is a simplistic view of a pavement’s life cycle and does not account for projects that may
result from other needs such as capacity and safety improvements.

MDT Surfacing Design Guide Chapter 13 Bridge End Pavement Design
January 2015 159
Bridge End Pavement Design Chapter 13
The following guidelines are to assist MDT design staff in scoping and designing 30-year and
reinforced bridge end pavements. This refers to the pavement section adjacent to bridge ends
or other fixed objects that often deteriorates faster than the mainline pavement.
There are 2 types of bridge end pavement treatments; 30-year and reinforced bridge end
pavements. The 30-year bridge end pavement is usually designed on reconstruction and major
rehabilitation projects. The reinforced bridge end pavement refers to bridge end treatments
done on minor rehabilitation and thin overlay projects.
The following outline shows how these guidelines are organized.
Section 13.1: Explains the bridge end pavement problem and why it occurs.
Section 13.2: Begins with a general overview of the bridge end pavement design
process, as well as Table 29 that outlines the design processes for different types of
construction projects.
Section 13.3 and 13.4: Include detailed design processes for 30-year and reinforced
bridge end pavements, respectively.
13.1 THE BRIDGE END PAVEMENT PROBLEM
Often, the pavement located adjacent to bridge ends has more pavement distress than the
mainline pavement. This is because the pavement within about 200’ of bridge ends is usually
thinner than the mainline pavement.
It is MDT’s policy to use a 20-year design life when designing new pavements. The 20-year
pavement design life refers to a pavement that lasts for 20 years from initial construction to the
point in time where the pavement has deteriorated and has an unacceptably rough ride. The
20-year design life assumes that there is not preventative maintenance applied to the pavement
during its design life.
In practice, it is the Department’s policy to apply preventative maintenance treatments to
pavements so the ride stays smooth. Often the preventative maintenance treatment is an
asphalt overlay, which adds pavement thickness to the original pavement. Usually, as a result
of asphalt overlays, pavements with 20-year pavement design lives last for 30-years or longer.
This generally presents a problem for the pavement located adjacent to a fixed structure such
as a bridge end. In these locations, asphalt thickness cannot be increased since asphalt
overlays are taper milled flush with the bridge end. Due to this, the pavement adjacent to the
bridge does not receive additional pavement structure, and theoretically should last only 20-
years. An example of this is shown in Figure 81.
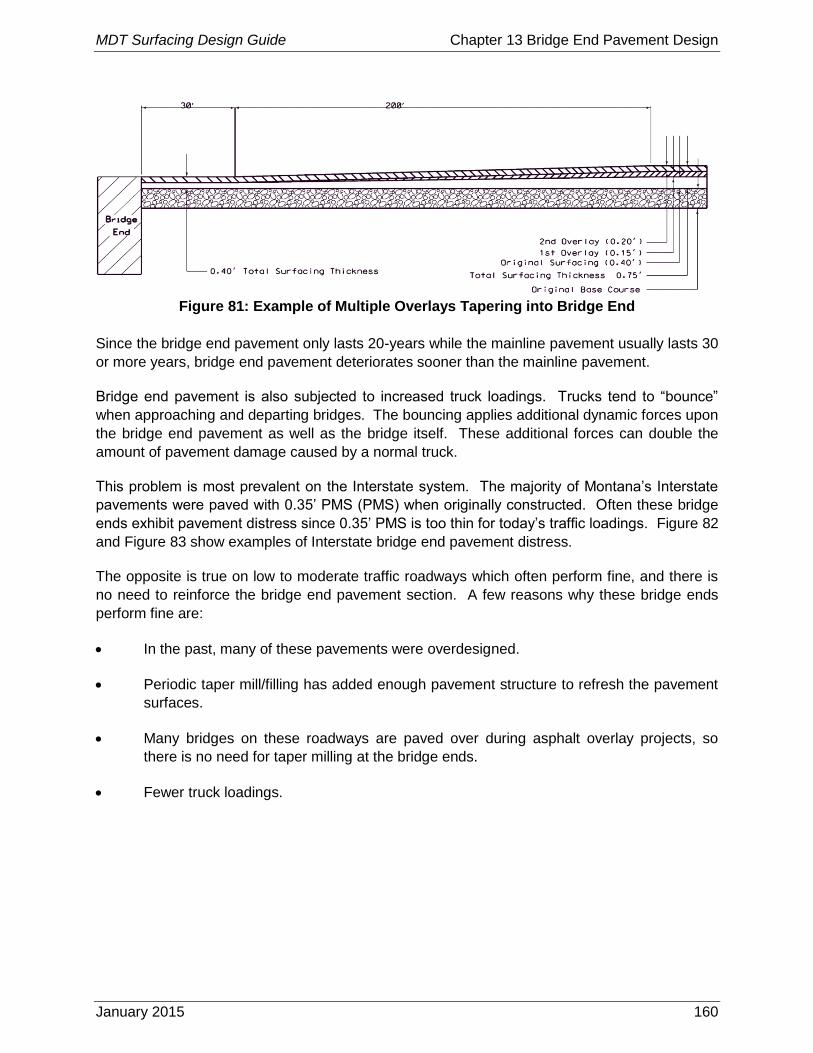
MDT Surfacing Design Guide Chapter 13 Bridge End Pavement Design
January 2015 160
Figure 81: Example of Multiple Overlays Tapering into Bridge End
Since the bridge end pavement only lasts 20-years while the mainline pavement usually lasts 30
or more years, bridge end pavement deteriorates sooner than the mainline pavement.
Bridge end pavement is also subjected to increased truck loadings. Trucks tend to “bounce”
when approaching and departing bridges. The bouncing applies additional dynamic forces upon
the bridge end pavement as well as the bridge itself. These additional forces can double the
amount of pavement damage caused by a normal truck.
This problem is most prevalent on the Interstate system. The majority of Montana’s Interstate
pavements were paved with 0.35’ PMS (PMS) when originally constructed. Often these bridge
ends exhibit pavement distress since 0.35’ PMS is too thin for today’s traffic loadings. Figure 82
and Figure 83 show examples of Interstate bridge end pavement distress.
The opposite is true on low to moderate traffic roadways which often perform fine, and there is
no need to reinforce the bridge end pavement section. A few reasons why these bridge ends
perform fine are:
In the past, many of these pavements were overdesigned.
Periodic taper mill/filling has added enough pavement structure to refresh the pavement
surfaces.
Many bridges on these roadways are paved over during asphalt overlay projects, so
there is no need for taper milling at the bridge ends.
Fewer truck loadings.
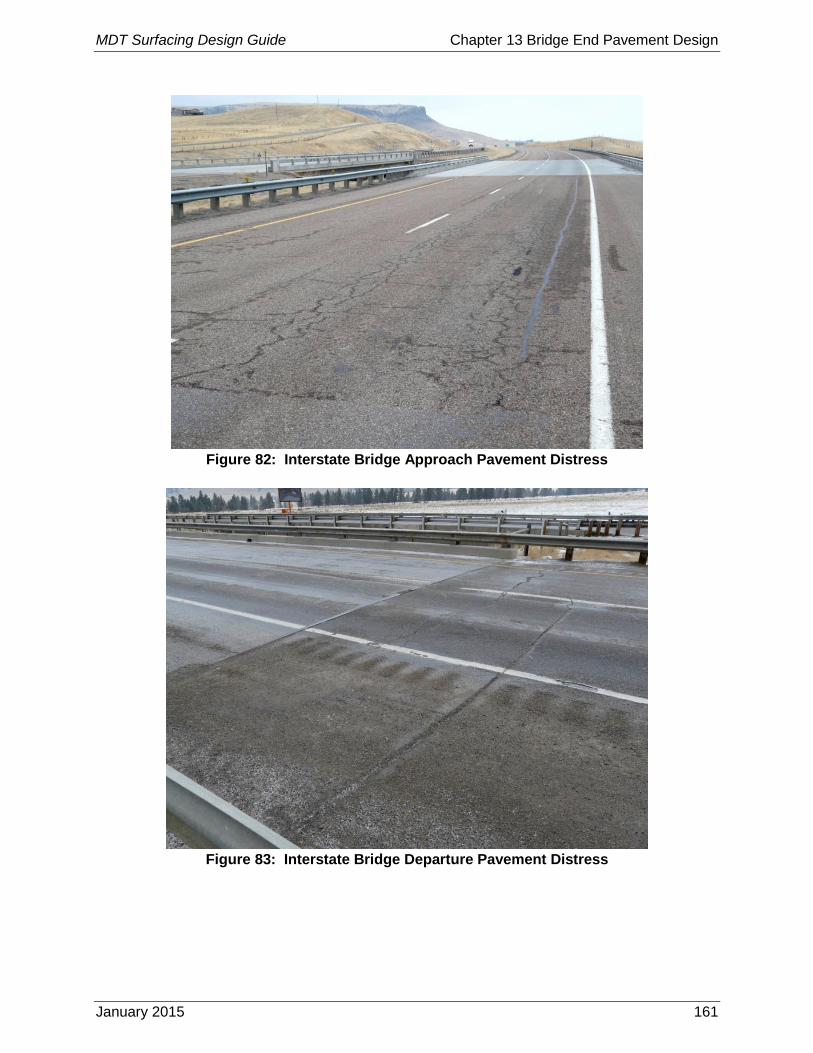
MDT Surfacing Design Guide Chapter 13 Bridge End Pavement Design
January 2015 161
Figure 82: Interstate Bridge Approach Pavement Distress
Figure 83: Interstate Bridge Departure Pavement Distress
MDT Surfacing Design Guide Chapter 13 Bridge End Pavement Design
January 2015 162
13.2 GENERAL BRIDGE END PAVEMENT DESIGN PROCESS
Bridge end pavements will often need a heavier, thicker pavement treatment than the mainline
pavement. This will either restore the pavement structure on pavement maintenance projects,
or provide a 30-year pavement life in the case of major rehabilitation and road / bridge
reconstruction projects.
For design purposes, there are 2 types of bridge end pavement treatments that are utilized by
MDT:
For bridge and/or road reconstruction and road major rehabilitation projects, bridge end
pavements should be designed for a 30-year pavement life utilizing a 30-year Bridge
End Pavement Design. The purpose of this is to design the bridge end pavement
section to last as long as the mainline pavement section.
For existing pavements that are receiving a pavement maintenance treatment, the
bridge end pavement should be treated with a Reinforced Bridge End Pavement
Design when necessary. Reinforced Bridge End Pavement Designs refer to designing
bridge end pavements so they perform similarly to the existing mainline pavement
section.
The intent of the bridge end pavement treatment is to address pavement issues only. It does
not address the common bump caused by bridge end pavement settlement. This refers to the
bump located at the bridge / pavement interface, caused by the pavement settling lower than
the top of the bridge deck. Usually, this settlement is rooted beneath the pavement section. It
may be caused by inadequate embankment compaction, or further densification and
consolidation of embankment and/or embankment foundation materials occurring after initial
construction.
Often in the case of bridge end pavement settlement, settlement occurs shortly after
construction and then stops sometime after construction. The settlement stops after the
embankment materials have reached equilibrium and their maximum density. In cases where
bridge end pavement settlement has either stopped or is not an issue, care should be taken to
not excavate more than necessary to provide for either the 30-year or Reinforced Bridge
End Pavement Section. Excavating deeper than needed may disturb otherwise stable soils,
and may result in a new settlement problem when the virgin materials settle after construction.
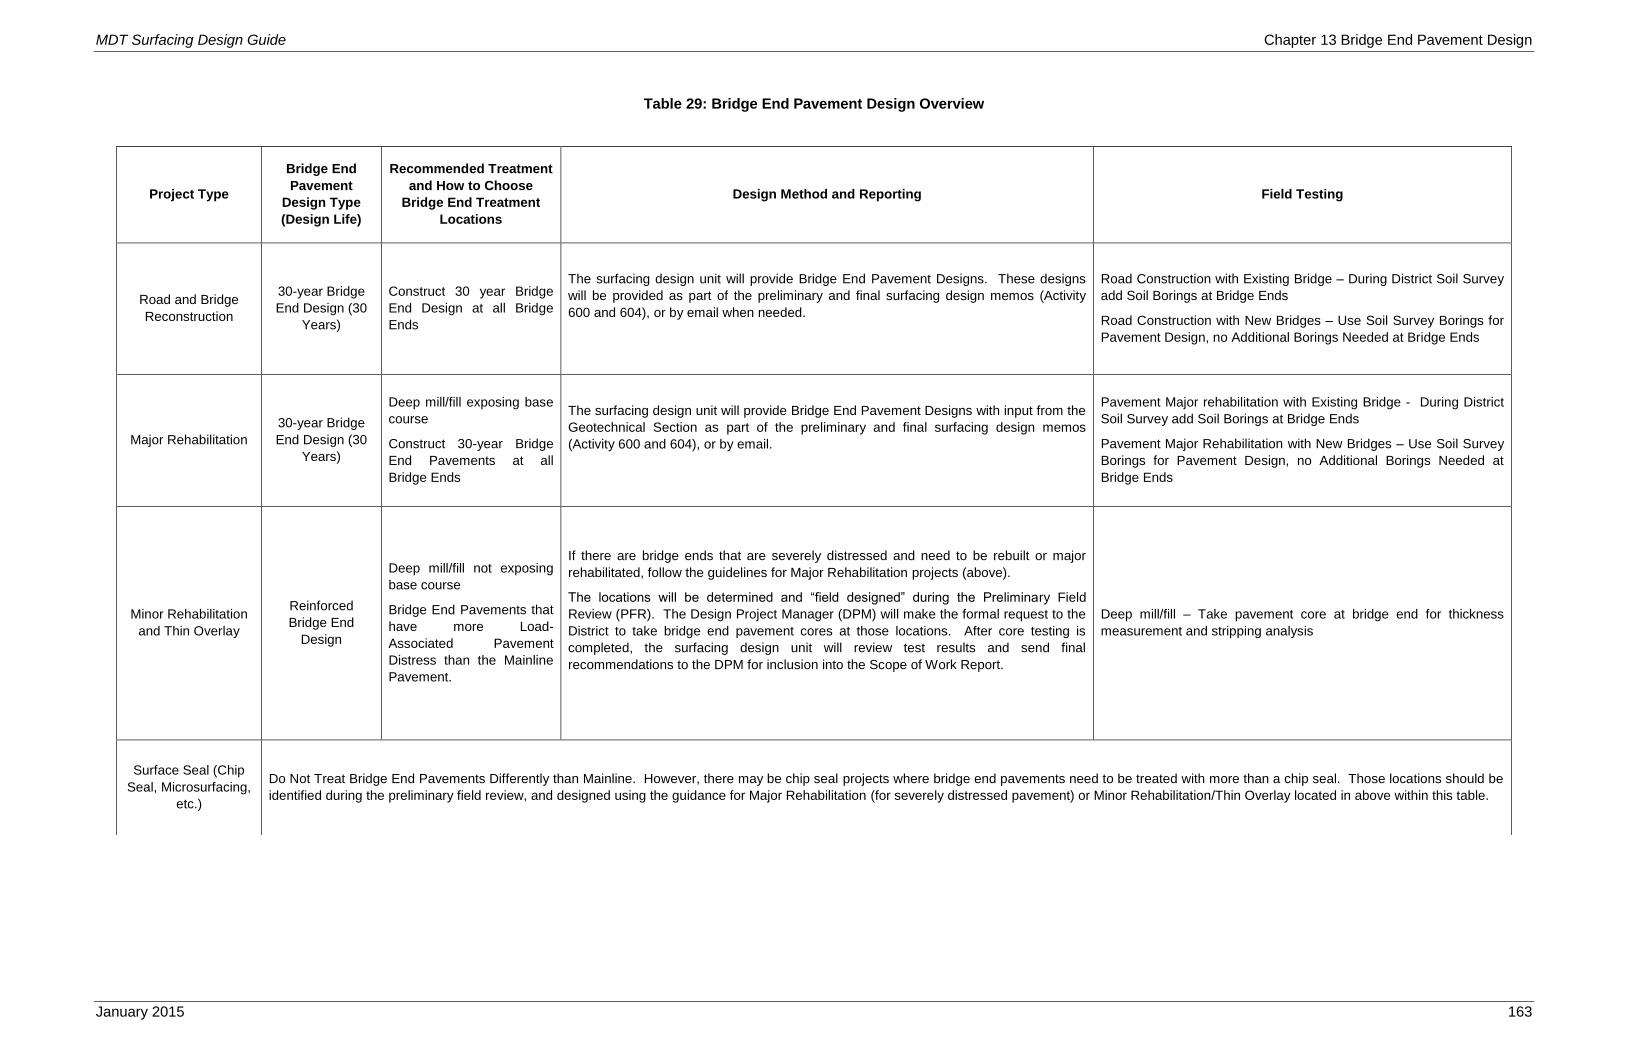
MDT Surfacing Design Guide Chapter 13 Bridge End Pavement Design
January 2015 163
Table 29: Bridge End Pavement Design Overview
Project Type
Bridge End
Pavement
Design Type
(Design Life)
Recommended Treatment
and How to Choose
Bridge End Treatment
Locations
Design Method and Reporting Field Testing
Road and Bridge
Reconstruction
30-year Bridge
End Design (30
Years)
Construct 30 year Bridge
End Design at all Bridge
Ends
The surfacing design unit will provide Bridge End Pavement Designs. These designs
will be provided as part of the preliminary and final surfacing design memos (Activity
600 and 604), or by email when needed.
Road Construction with Existing Bridge – During District Soil Survey
add Soil Borings at Bridge Ends
Road Construction with New Bridges – Use Soil Survey Borings for
Pavement Design, no Additional Borings Needed at Bridge Ends
Major Rehabilitation
30-year Bridge
End Design (30
Years)
Deep mill/fill exposing base
course
Construct 30-year Bridge
End Pavements at all
Bridge Ends
The surfacing design unit will provide Bridge End Pavement Designs with input from the
Geotechnical Section as part of the preliminary and final surfacing design memos
(Activity 600 and 604), or by email.
Pavement Major rehabilitation with Existing Bridge - During District
Soil Survey add Soil Borings at Bridge Ends
Pavement Major Rehabilitation with New Bridges – Use Soil Survey
Borings for Pavement Design, no Additional Borings Needed at
Bridge Ends
Minor Rehabilitation
and Thin Overlay
Reinforced
Bridge End
Design
Deep mill/fill not exposing
base course
Bridge End Pavements that
have more Load-
Associated Pavement
Distress than the Mainline
Pavement.
If there are bridge ends that are severely distressed and need to be rebuilt or major
rehabilitated, follow the guidelines for Major Rehabilitation projects (above).
The locations will be determined and “field designed” during the Preliminary Field
Review (PFR). The Design Project Manager (DPM) will make the formal request to the
District to take bridge end pavement cores at those locations. After core testing is
completed, the surfacing design unit will review test results and send final
recommendations to the DPM for inclusion into the Scope of Work Report.
Deep mill/fill – Take pavement core at bridge end for thickness
measurement and stripping analysis
Surface Seal (Chip
Seal, Microsurfacing,
etc.)
Do Not Treat Bridge End Pavements Differently than Mainline. However, there may be chip seal projects where bridge end pavements need to be treated with more than a chip seal. Those locations should be
identified during the preliminary field review, and designed using the guidance for Major Rehabilitation (for severely distressed pavement) or Minor Rehabilitation/Thin Overlay located in above within this table.

MDT Surfacing Design Guide Chapter 13 Bridge End Pavement Design
January 2015 164
This page intentionally blank.

MDT Surfacing Design Guide Chapter 13 Bridge End Pavement Design
January 2015 165
13.3 30-YEAR BRIDGE END PAVEMENT DESIGN OVERVIEW
30-year bridge end designs should be included on bridge end pavements where the existing
pavement is treated in a manner that provides a 20-year pavement design life. These projects
include bridge / road reconstruction, major rehabilitation, and engineered overlay projects.
The purpose of designing bridge end pavements with 30-year design lives is so the resulting
pavement performs similarly to the mainline pavement. This should result into more uniform
pavement performance between the bridge end and mainline pavements.
30-year bridge end pavements should be designed at all bridge ends as well as other fixed
objects that will limit future grade raises such as railroad tracks or cattle guards, but not where
the fixed object is an adjacent asphalt pavement.
The surfacing design unit will be responsible for providing the 30-year end pavement section
pavement thicknesses, treatment length, and other pavement related issues. Surfacing design
will also work with the Geotechnical Section regarding use of Special Borrow and Bridge End
Backfill. Surfacing design will verify the 30-year bridge end is incorporated into the plan set at
the appropriate time.
13.3.1 New Bridge and/ or Road Reconstruction
These projects provide the greatest opportunity to design a 30-year bridge end since the
pavement will be built new, or removed and replaced within its entirety.
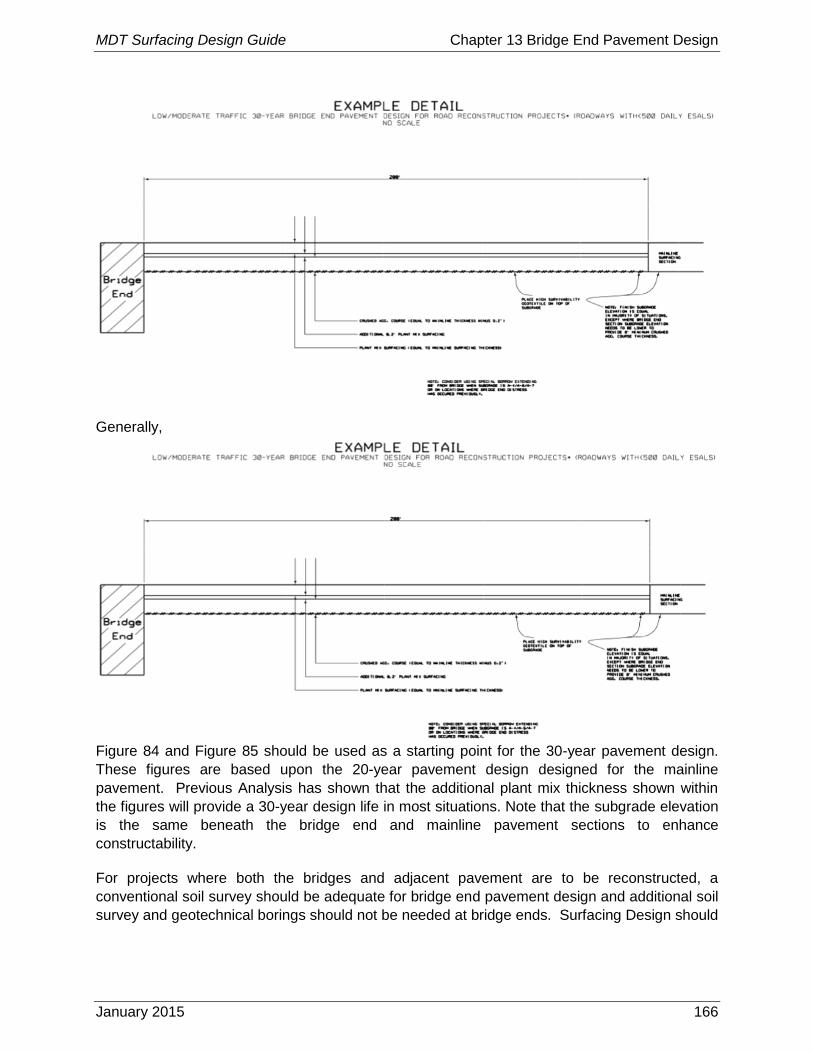
MDT Surfacing Design Guide Chapter 13 Bridge End Pavement Design
January 2015 166
Generally,
Figure 84 and Figure 85 should be used as a starting point for the 30-year pavement design.
These figures are based upon the 20-year pavement design designed for the mainline
pavement. Previous Analysis has shown that the additional plant mix thickness shown within
the figures will provide a 30-year design life in most situations. Note that the subgrade elevation
is the same beneath the bridge end and mainline pavement sections to enhance
constructability.
For projects where both the bridges and adjacent pavement are to be reconstructed, a
conventional soil survey should be adequate for bridge end pavement design and additional soil
survey and geotechnical borings should not be needed at bridge ends. Surfacing Design should
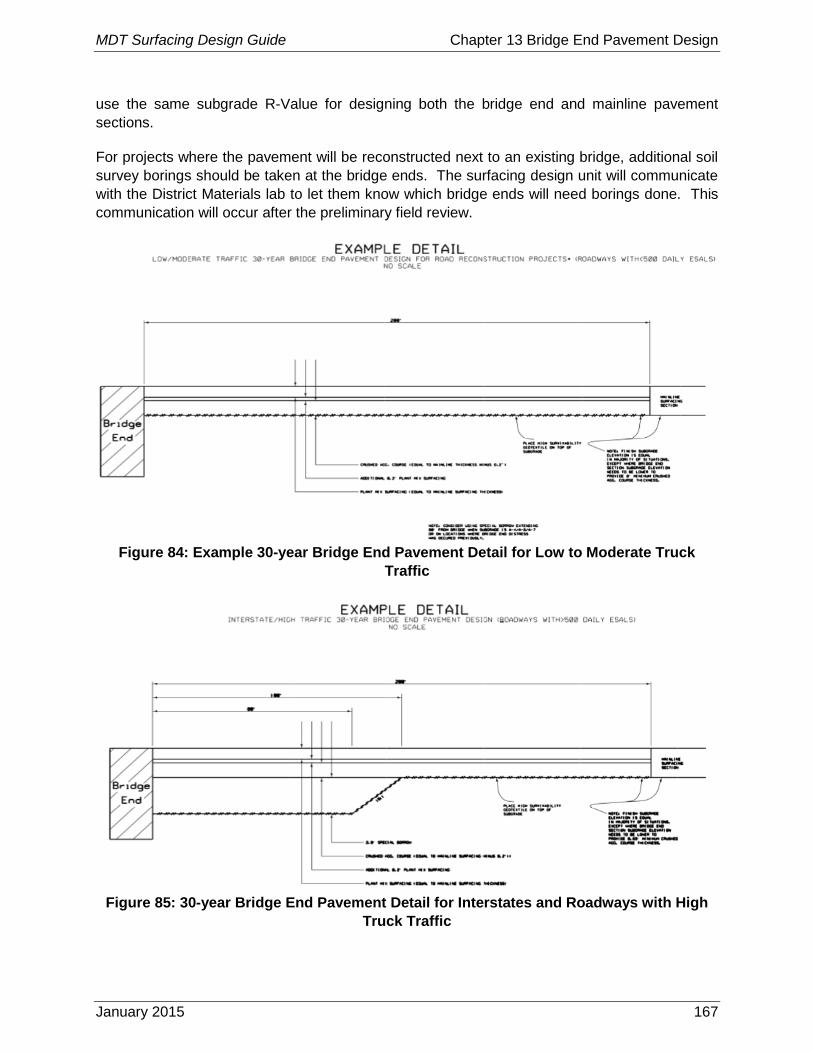
MDT Surfacing Design Guide Chapter 13 Bridge End Pavement Design
January 2015 167
use the same subgrade R-Value for designing both the bridge end and mainline pavement
sections.
For projects where the pavement will be reconstructed next to an existing bridge, additional soil
survey borings should be taken at the bridge ends. The surfacing design unit will communicate
with the District Materials lab to let them know which bridge ends will need borings done. This
communication will occur after the preliminary field review.
Figure 84: Example 30-year Bridge End Pavement Detail for Low to Moderate Truck
Traffic
Figure 85: 30-year Bridge End Pavement Detail for Interstates and Roadways with High
Truck Traffic
MDT Surfacing Design Guide Chapter 13 Bridge End Pavement Design
January 2015 168
For projects where the pavement will be reconstructed next to an existing bridge and there is
severe pavement distress and/or embankment settlement at the existing bridge end pavement
sections, a more thorough geotechnical investigation should be considered. The intent of the
investigation will be to identify embankment and foundation soil problems beneath the pavement
section, and to design a deeper solution to address these problems. These locations will be
identified at the preliminary field review by the Surfacing Design Unit and/or Geotechnical
Section. Additional borings and evaluation will be done as determined necessary by the
geotechnical section.
When necessary, the Geotechnical Section will provide both bridge end backfill and special
borrow type, thickness, and extent. If pavement drainage problems are determined to be the
cause of bridge end pavement distress in these locations, the Geotechnical Section will provide
drainage details.
13.3.2 Pavement Major Rehabilitation
On major rehabilitation projects, often the existing PMS is removed in its entirety or pulverized
into the existing base. The mainline pavement is normally designed for a 20-year design life,
and the bridge end pavement should be designed with a 30-year design life.
Ideally, the 30-year bridge end should be designed by thickening the PMS section while utilizing
the existing base course by leaving it in place. For example, if the mainline pavement is milled,
pulverized, and overlaid with 0.4’ PMS, the 30-year bridge end pavement may consist of deep
milling, pulverizing and placing a 0.6’ PMS overlay.
In locations where the existing bridges will remain in place during the pavement major
rehabilitation, all bridge ends should be examined during the Preliminary Field Review. In
locations where the bridge end pavement appears structurally sound, with no evidence of
subgrade failure, the 30-year bridge end pavement should be designed using additional PMS
thickness as described above. In locations with moderate to severe pavement distress,
pavement subgrade problems, or indications of embankment problems, a deeper 30-year bridge
end pavement should be designed.
All bridge end pavements should be bored during the District Material’s lab soil survey to
provide information for the bridge end pavement design. Bridge end borings should be
characterized using the laboratory tests normally done during a soil survey.
13.4 REINFORCED BRIDGE END PAVEMENT DESIGN OVERVIEW
For pavement maintenance / preservation projects, the pavement treatment is not designed for
a 20-year design life. Instead the pavement treatment is selected that will provide the most
cost-effective design life for the particular pavement. Pavement maintenance projects refer to
minor rehabilitation, thin asphalt overlay, chip seal, or other treatments that typically do not
expose base course during pavement construction.
On these projects a reinforced bridge end pavement section should be utilized that will provide
pavement performance that is similar to the mainline pavement. The resulting treatment will

MDT Surfacing Design Guide Chapter 13 Bridge End Pavement Design
January 2015 169
reduce bridge end pavement maintenance, and will place both the bridge end and mainline
pavement on a similar pavement maintenance cycle. This is explained more thoroughly in the
following example.
13.4.1 Reinforced Bridge End Pavement Design Example
During a preliminary field review of a thin overlay project it is determined that the bridge
end pavements have more fatigue cracking than the mainline pavement. It is probable
that if the bridge ends aren’t treated differently than the mainline pavement, the bridge
ends pavements will degrade faster than the mainline pavement and will need reactive
maintenance before the mainline pavement.
During their discussion, the PFR attendees agree that the 0.20’ thin overlay project is
expected to last 15 years before another pavement treatment is needed.
In this example, the bridge end pavement should be designed so it deteriorates at a
similar rate as the mainline pavement which is a 15-year design life. Based upon the
pavement condition and engineering judgment, the PFR attendees estimate that a mill/fill
0.40’ deep within 200’ of the bridge ends should result in the bridge end pavements
performing similarly to the mainline pavement.
As a general rule of thumb, bridge end pavements that are in similar condition as the
mainline pavement should not receive a reinforced bridge end pavement treatment. In
other words, if there isn’t anything wrong with the bridge end pavement it should be treated the
same as the mainline pavement. However, there will be projects where no bridge end distress
is present but an increase in truck traffic is predicted. In these locations, the District may decide
to preemptively reinforce the bridge end pavements before in anticipation of the future traffic
increase. A few examples are roadways within developing oil fields, or in the vicinity of future
gravel pits, mines, or agricultural infrastructure.
Generally, pavement maintenance and preservation projects are usually fast track designs that
may not provide adequate time for thorough geotechnical and pavement investigations for
designing reinforced bridge end pavements. Project letting dates on these projects should not
be pushed out into the future as a result of designing reinforced bridge end sections.
Therefore, in the interest of time, non-engineered designs based upon engineering
judgment should be utilized whenever possible.
Locations and types of reinforced bridge end treatments should be determined during the PFR.
During the PFR, the attendees should examine all bridge ends, identify locations where
reinforced bridge end treatments are needed. The surfacing representative should field design
a preliminary reinforced bridge end treatment for inclusion into the PFR report. This will require
a surfacing design representative to be present at these PFRs. A geotechnical representative
will normally not need to be present, but may be called upon in the event that bridge end
pavements are showing distress due to poor subgrade support.

MDT Surfacing Design Guide Chapter 13 Bridge End Pavement Design
January 2015 170
13.4.2 Reinforced Bridge End Pavement Designs – Chip Seal Projects
The intent of a chip seal project is to seal the existing pavement. Often there is not equipment
available on these projects to do anything beyond a chip seal on the bridge end pavement.
Therefore, the design team should not provide a reinforced bridge end pavement design unless
significant pavement distress is observed during the project nomination and preliminary field
reviews. However, that should be the exception to the rule.
If bridge end pavement distress is observed and/or is a reoccurring pavement maintenance
issue, the design team should coordinate with the District to decide whether reinforced bridge
end pavements should be built. If it is decided to reinforce the bridge end pavements, care
should be taken to provide a treatment that does not expose base gravel. Also, recognize that
adding a reinforced bridge end pavement will significantly increase the overall project cost.
A starting point for reinforced bridge end pavement design on these projects is a mill/fill
extending 200’ from the bridge end within the travel lanes. Both the mill/fill length and thickness
should be designed during the PFR based upon field observation.
Reinforced Bridge End Pavement Designs that expose base course should not be done on chip
seal projects unless the District makes a special request.
The geotechnical section will usually not be involved in the bridge end pavement design on
these projects. Construction input should be minimal since these treatments usually don’t
inconvenience the travelling public very much, and constructability issues should be infrequent
due to the simplicity of these treatments.
13.4.2 Reinforced Bridge End Pavement Designs – Thin Overlay and Minor Rehabilitation
Projects
Reinforced bridge end pavement should be considered on all bridge ends and fixed objects
where the bridge end pavement shows load-associated pavement distress or has reoccurring
maintenance issues. It is not necessary to provide reinforced bridge end pavements in
locations where the fixed object is an asphalt pavement, or in locations where the bridge end
pavement is in good structural condition and/or in similar condition as the mainline pavement.
The design life of the reinforced bridge end pavement should match the assumed design life of
the overlay. This means that if an overlay is anticipated to last 12 years before the next
pavement treatment (excluding surface seals), then the bridge end pavement should be
designed to last the same amount of time without maintenance patching and/or alligator crack
sealing. Determining design life is subjective, and should be done during the PFR using
engineering judgment based upon past performance of the mainline pavement.
The decision point on whether or not reinforced bridge end pavement designs will be built is
during the PFR. A surfacing design representative must be present to participate in the review.
At the PFR, each bridge end should be evaluated by the design team. If possible, the bridge
end pavements should be preliminarily designed at the PFR. Pavement cores should be
collected and tested for stripping and thickness to design the mill/fill depth. Care should be

MDT Surfacing Design Guide Chapter 13 Bridge End Pavement Design
January 2015 171
taken to provide a treatment that does not expose base gravel. However, Reinforced Bridge
End Pavement Designs that expose base course can be done on a thin overlay if needed to
address significant pavement deterioration and/or attain the desired design life.
The standard reinforced bridge end pavement design on these projects should be a deep mill/fill
extending 200’ from the bridge end within the travel lanes. Both the mill/fill length and thickness
should be designed based upon field observation. A “deep” mill/fill is a mill/fill that is thicker
than the asphalt overlay. For example, on a 0.20’ asphalt overlay project the reinforced
pavement bridge end section may consist of increasing the mill depth to 0.4’ depth extending
200’ from the bridge end.
The geotechnical section will usually not be involved in the bridge end design on these projects.
Construction input should be minimal since these treatments usually don’t inconvenience the
travelling public very much, and constructability issues should be infrequent due to the simplicity
of these treatments.

MDT Surfacing Design Guide Chapter 13 Bridge End Pavement Design
January 2015 172
This page intentionally blank.
MDT Surfacing Design Guide Chapter 14 Pavement Economic Analysis
January 2015 173
Pavement Economic Analysis Chapter 14
14.1 INTRODUCTION
A Life Cycle Cost Analysis (LCCA) consists of calculating initial construction costs, future
maintenance costs over the LCCA analysis period, and remaining life or salvage value at the
end of the analysis period. Based on these calculations, the relative value of each option is
determined based upon their net present value. MDT does not currently factor user costs in the
analysis.
When deemed necessary to perform an LCCA, a copy should be distributed with the surfacing
design memo created under activity 600 (Prepare Preliminary Surfacing Typical Section).
LCCAs are typically performed comparing concrete to plant mix. Currently MDT uses a design
life of 30 years for concrete and 20 years for plant mix. A 30 year design life for plant mix
should be considered with an adjusted maintenance cycle. A 40 year design life for concrete
should be considered in the instances where the minimum typical section will provide that life.
The design life is the length of time for which a pavement structure is being designed based on
structural distresses and traffic loadings.
MDT currently uses the Net Present Value (NPV) method for LCCA.
14.2 PROJECT SELECTION
A life cycle cost analysis (LCCA) comparing different pavement alternatives should be
performed any time there might be economic savings for a project when considering long term
construction cycles. In practice it is typically only necessary to do a LCCA on a project that
meets all of the following characteristics (or by request from the District or Road Design) :
Project Scope of Major Rehabilitation or Reconstruction
High Daily ESALs (plant mix thickness >= 0.40’)
Substantial Project Length
Width >= 40 feet
14.3 LCCA TERMINOLOGY
Analysis Period is the service life of the pavement considered in the economic analysis. An
analysis period of 40 years or more should be used.
Initial Design Period is the service life of the reconstructed pavement that does not include
subsequent pavement preservation or rehabilitation.
The outputs of this analysis include:
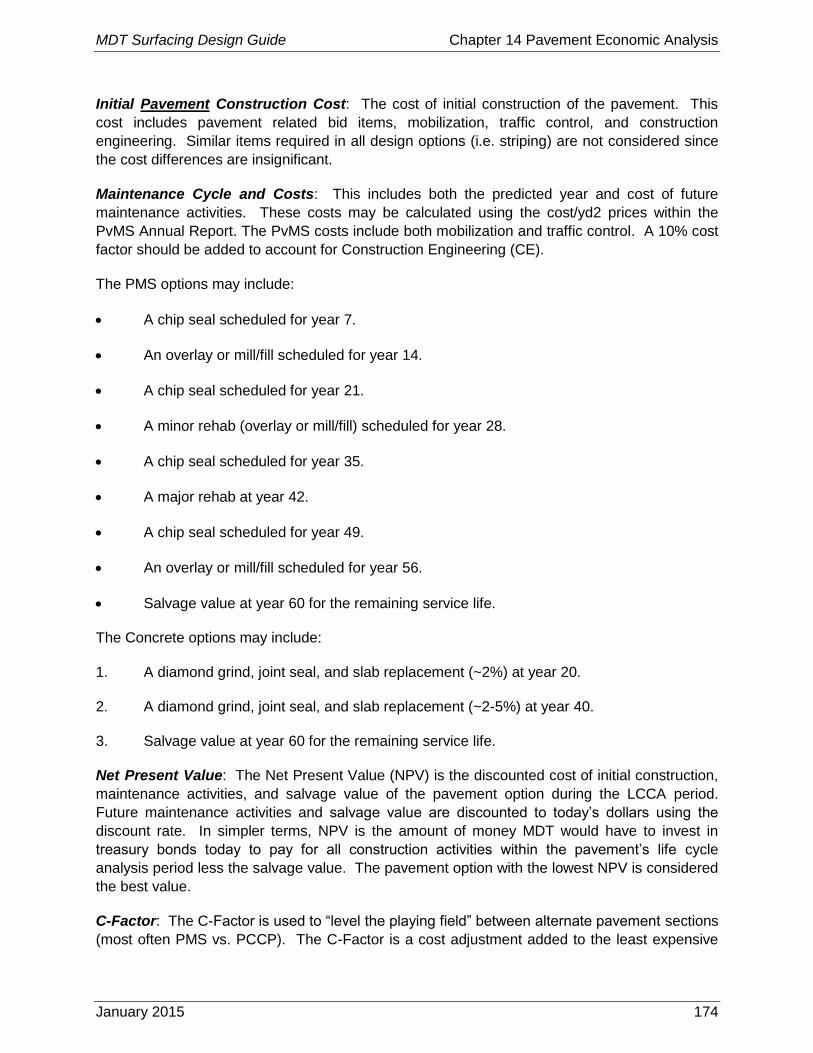
MDT Surfacing Design Guide Chapter 14 Pavement Economic Analysis
January 2015 174
Initial Pavement Construction Cost: The cost of initial construction of the pavement. This
cost includes pavement related bid items, mobilization, traffic control, and construction
engineering. Similar items required in all design options (i.e. striping) are not considered since
the cost differences are insignificant.
Maintenance Cycle and Costs: This includes both the predicted year and cost of future
maintenance activities. These costs may be calculated using the cost/yd2 prices within the
PvMS Annual Report. The PvMS costs include both mobilization and traffic control. A 10% cost
factor should be added to account for Construction Engineering (CE).
The PMS options may include:
A chip seal scheduled for year 7.
An overlay or mill/fill scheduled for year 14.
A chip seal scheduled for year 21.
A minor rehab (overlay or mill/fill) scheduled for year 28.
A chip seal scheduled for year 35.
A major rehab at year 42.
A chip seal scheduled for year 49.
An overlay or mill/fill scheduled for year 56.
Salvage value at year 60 for the remaining service life.
The Concrete options may include:
1. A diamond grind, joint seal, and slab replacement (~2%) at year 20.
2. A diamond grind, joint seal, and slab replacement (~2-5%) at year 40.
3. Salvage value at year 60 for the remaining service life.
Net Present Value: The Net Present Value (NPV) is the discounted cost of initial construction,
maintenance activities, and salvage value of the pavement option during the LCCA period.
Future maintenance activities and salvage value are discounted to today’s dollars using the
discount rate. In simpler terms, NPV is the amount of money MDT would have to invest in
treasury bonds today to pay for all construction activities within the pavement’s life cycle
analysis period less the salvage value. The pavement option with the lowest NPV is considered
the best value.
C-Factor: The C-Factor is used to “level the playing field” between alternate pavement sections
(most often PMS vs. PCCP). The C-Factor is a cost adjustment added to the least expensive

MDT Surfacing Design Guide Chapter 14 Pavement Economic Analysis
January 2015 175
option’s bid (usually PMS) to account for the decreased life cycle costs associated with
pavement options with higher initial costs (usually PCCP). The C-Factor is calculated as
follows:
PCCP pavement NPV – PMS pavement NPV = C-Factor
Some additional LCCA terminology is as follows:
Remaining Life / Salvage Value: For pavement LCCA, it is necessary to compare pavements
with a different length of service life. In these cases, an additional cost is subtracted during the
LCCA’s last year to account for either remaining service life or the pavement’s salvage value.
An example of this is the salvage value of a failed concrete pavement which can still serve as a
base for a crack & seat and overlay project.
Discount Rate: The discount rate is the real rate of return that can be expected on a
conservative, long-term investment. For pavements, the discount rate is calculated as follows:
30-year Treasury Bond Rate – Average Rate of Inflation = Discount Rate
The official discount rate (real interest rate not nominal) published by the White House Office of
Budget and Management (OBM circular A-94) is 1.9% for 30 years or longer for 2014. The
official discount rate can be found at this link.
14.3.1 LCCA Process:
The Pavement Design Engineer will perform the LCCA process as follows:
1. Perform a pavement design for concrete and PMS options.
2. Establish project parameters including quantities, length and width.
3. Work with the Road Design to identify unique project constraints such as grade
limitations due to approaches, structures, curb and gutter, hydraulic features, etc…
Project constraints will dictate the types of future rehabilitations that are possible.
4. Identify maintenance cycles associated with the analysis period for each option.
5. Quantify user costs if considered.
6. Determine materials cost based on project quantities and project location. Verify costs
with the respective District Construction personnel and the Engineering Cost Analyst.
7. Calculate the Net Present Value of each option.
8. Summarize the LCCA in a brief report and distribute with the activity 600 memo.

MDT Surfacing Design Guide Chapter 14 Pavement Economic Analysis
January 2015 176
14.3.2 Additional Resources:
A more comprehensive description of LCCAs can be found in the NCHRP Report 703 - Guide
for Pavement-Type Selection
FHWA Technical Advisory Use of Alternate Bidding for Pavement Type Selection
http://www.fhwa.dot.gov/pavement/t504039.cfm
FHWA Transportation Performance Management:
MDT Surfacing Design Guide Chapter 15 Tools for Pavement Analysis
January 2015 177
Tools for Pavement Analysis Chapter 15
Path Web is the current version of the road image viewer: This viewer contains information
such as image data, rut, ride, surface rendering, GPS map and transverse profile for all
Interstate, NHS, Primary, Secondary and some urban routes. Path Web may not be available
without Network access or if you are an external Design Consultant.
The ride and rut links are available at this link: annual treatment and condition reports.
Agile Assets is the comprehensive pavement management tool used by the pavement
management unit. Contact the Pavement Management supervisor at 444-6149 for more
information.
Path View is an image viewer similar to Path Web that accesses data from a share drive. This
viewer provides additional information such as:
Actual mile posts
Cross Slope
Rut Depth
GPS Coordinates
Contact the Pavement Management supervisor at 444-6149 for more information.
For more information, the following link has been provided to MDT’s Pavement Analysis
Section.
Additional resources regarding surfacing options can be found at the following link.
Also, additional resources for surfacing options can be found at the Research Link.

MDT Surfacing Design Guide Chapter 15 Tools for Pavement Analysis
January 2015 178
This page intentionally blank.

MDT Surfacing Design Guide Chapter 16 Works Cited
January 2015 179
Works Cited Chapter 16
AASHTO. (1993). AASHTO Guide for Design of Pavement Structures 1993. Washington DC:
AASHTO.
AASHTO. (1993). AASHTO Guide for Design of Pavement Structures 1993. Washington DC:
AASHTO.
Consortium, P. T. (2013). Pavement Interactive. FHWA.
Darter, A.-O. a. (1992). Relationships Between IRI and PSR. Springfield: Illinois Department of
Transportation.
Horak, E. (1987). The Use of Surface Deflection Basin Measurements in the Mechanistic
Analysis of Flexible Pavements. Ann Arbor, MI: Fifth International Conference on the
Structural Design of Asphalt Pavements.
Maser, K. R. (2011). Ground Penetrating Radar (GPR) Analysis: PHase II Field Evaluation.
Helena, MT: MDT.
MDT. (1991). Pavement Design Manual 1991. Helena, MT: MDT.
MDT. (2005). Evaluation of the Engineering Characteristics of RAP/Aggregate Blends. Helena:
MDT.
MDT. (2013). 2012 Pavement Performance and Condition. Helena: MDT.
MDT, F. a. (2008). Guidelines for Nomination and Development of Pavement Projects. Helena:
MDT.
MDT, F. a. (n.d.). Guidelines for Nomination and Devlopment of Pavement Projects.
Mokwa, R. L. (2005). Evaluation of the Engineering Characteristics of RAP/Aggregate Blends.
Helena: Montana Department of Transportation.
NCHRP. (2004). NCHRP 2-37A Development of the 2002 Guide for the Design of New and
Rehabilitated Pavement Structures. Washington DC: NCHRP.
UGPTI. (2013). Impacts to Montana State Highways Due to Bakken Oil Development. Helena:
MDT.
VonQuitus. (2007). Mechanistic-Empirical Pavement Design Guide Glexible Pavement
Performance Prediction Models for Montana. Helena: Montana Department of
Transportation.

MDT Surfacing Design Guide Chapter 16 Works Cited
January 2015 180
This page intentionally blank.

MDT Surfacing Design Guide Chapter 17 Appendix A: Sample Traffic Memo
January 2015 181
Appendix A – Sample Traffic Memo Chapter 17
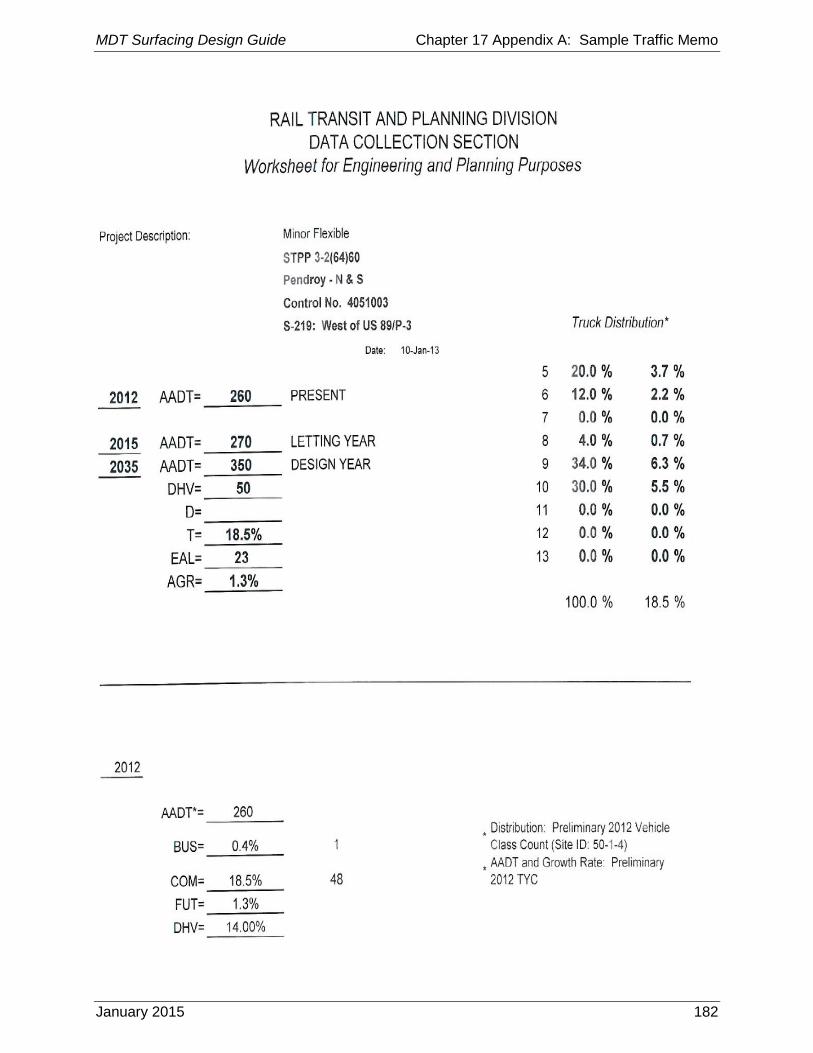
MDT Surfacing Design Guide Chapter 17 Appendix A: Sample Traffic Memo
January 2015 182
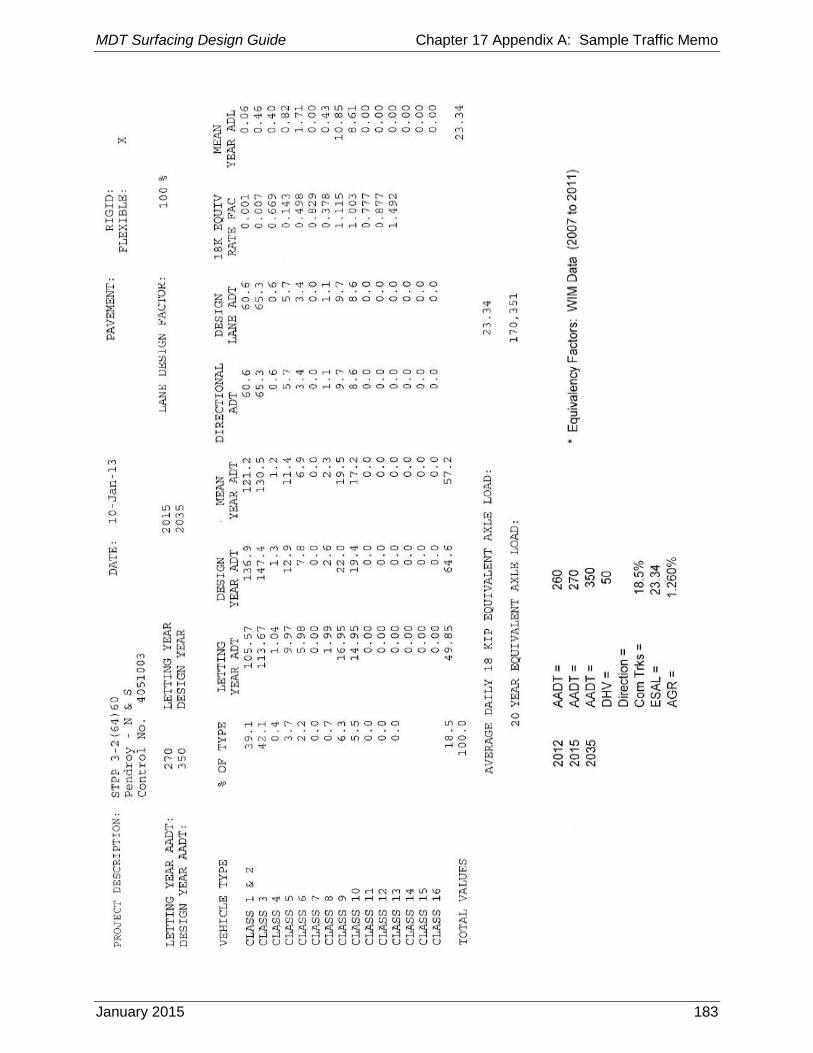
MDT Surfacing Design Guide Chapter 17 Appendix A: Sample Traffic Memo
January 2015 183

MDT Surfacing Design Guide Chapter 17 Appendix A: Sample Traffic Memo
January 2015 184
This page intentionally blank.
MDT Surfacing Design Guide Chapter 18 Index
January 2015 185
Index Chapter 18
Alligator Cracking, 8, 76 Asphalt Content Selection, 53, 71, 124 average annual MR, 32 Bakken, 26, 28, 29, 30, 179 Borrow Pit Investigation, 20 CAC
crushed aggregate course, 23, 24, 41, 43, 46, 47, 56, 57, 59, 67, 68, 70, 79, 80, 81, 83, 96, 97, 102, 105, 106, 107, 109, 119, 120, 132, 139, 140, 141, 143
CBR California Bearing Ratio, 33, 36
CCPR Cold Central Plant Recycling, 78
cement treated base CTB, 24, 41, 43, 82
chip seal, 5, 13, 16, 50, 71, 76, 77, 84, 109, 124, 151, 157, 163, 168, 170, 174
cold in place recycle, 17 Commercial mix, 48, 146 commodity hauls, 26 Consultant Design, 18 CRCP
continuously reinforced concrete pavement, 147
crushed aggregate course CAC, 23, 41, 43, 52, 56, 147
CTB cement treated base, 24, 41, 43, 46, 56,
68, 82, 96, 98, 104, 120 detour, 145 drainage coefficient (mi), 31 Economic Analysis, 173 engineered overlay, 75, 78, 85, 127, 128,
130 131, 140, 143, 165 ESAL
equivalent single axle loadings, 25, 26, 28, 46, 52, 92, 141, 153
FDR full depth reclamation, 56, 78
Flexible Pavement Rehabilitation, 75, 83 Functional distresses, 84, 131 FWD
falling weight deflectometer, 13, 18, 21, 25, 32, 36, 37, 38, 61, 63, 76, 83, 89, 90, 91, 92, 93, 94, 96, 97, 98, 109, 110, 111, 117, 132, 137, 138, 141
Geotechnical Engineering, 20 GPR
ground penetrating radar, 13, 21, 36, 37, 76, 83, 89, 90, 91, 92, 93, 95, 98, 99, 110, 111, 132, 137, 141, 179
Gravel Pavement Design, ii, 145 ground penetrating radar
GPR, 13 Hamburg rut test, 54 hot in place recycle, 17, 77 Initial Serviceability, 25, 30, 117 IRI
International Roughness Index, 30, 31, 156, 157, 179
Isolation Lifts, 129 JPCP
jointed plain concrete pavement, 5, 147 Leveling, 129, 130 LCCA Life Cycle Cost Analysis, 173, 174, 175 Low-Volume Road Design, 63 Major Rehabilitation, 12, 28, 75, 77, 78, 81,
87, 90, 109, 127, 135, 149, 153, 163, 168, 173
mi drainage coefficient, 31
Minor Rehabilitation, 28, 75, 76, 91, 127, 149, 153, 163, 170
MR resilient modulus, 13, 24, 25, 32, 33, 34,
35, 36, 37, 38, 57, 62, 63, 89, 90, 91, 94, 96, 97, 98, 103, 109, 111, 113, 114, 117, 137, 138, 141
NDT non-destructive testing, 3, 11, 13, 18, 21,
36, 37, 38, 89, 90, 91, 92, 93, 94, 95, 110, 137, 141
New Construction, 12, 28 NEW PAVEMENT, 23 oil and gas reserves, 28 Pavement Design Memo, 57, 71, 106, 124 Pavement Preservation, 15, 16, 28, 91, 151 Pavement pulverization, 78 Pavement serviceability, 30 Performance Grade (PG) Binder, 52 perpetual pavement, 9

MDT Surfacing Design Guide Chapter 18 Index
January 2015 186
PFR Preliminary Field Review, 13, 17, 110,
151, 163, 168, 169, 170 Preliminary Soil Survey Investigation, 13, 20 Present Serviceability Index
PSI, 30 Primary Soils Survey, 20 PSI
Present Serviceability Index, 30, 31 pulverization project, 14 RAP
recycled asphalt pavement, 51, 52, 53, 56, 59, 68, 71, 107, 120, 121, 123, 124, 143, 179
RECONSTRUCTED PAVEMENT, 23 Reconstruction, 12, 28, 52, 61, 90, 120,
153, 163, 165, 173 recycled asphalt pavement
RAP, 51, 53, 124 reflective cracking, 9, 149 reliability factor, 31 Reliability Level, 25, 31, 62, 117 Rigid Pavement Rehabilitation, 149 Roadbed Soil Resilient Modulus, 25
R-Value resistance value, 32, 33, 34, 35, 36, 38,
39, 42, 59, 62, 90, 107, 113, 117, 143, 167
SN structural number, 25, 41, 43, 44, 61, 63,
66, 68, 69, 89, 113, 114, 120, 133, 141 special borrow, 5, 23, 24, 32, 38, 42, 43, 57,
117, 168 spring thaw MR, 33 Standard Penetration Test
SPT, 32 stripping analysis, 17, 47, 132, 163 Structural distress, 85, 131 structural number
SN, 25, 41, 63, 75, 76, 82, 83, 89, 105, 112, 113, 130, 138, 139
Subgrade Rutting, 8 Sugar Beets, 27 Surfacing Pit Investigation, 20 Terminal Serviceability, 25, 30, 62, 117 triaxial test, 32 UGPTI, 28, 29, 30, 179 Wheat, 27 White Topping, 78, 150