Embed Size (px)
Citation preview
DEVELOPING PAVEMENT PERFORMANCE
PREDICTION MODELS AND DECISION TREES FOR THE CITY OF CINCINNATI
Final Report
Dr. Arudi Rajagopal
University of Cincinnati
Prepared in cooperation with The Ohio Department of Transportation and U.S. Department of Transportation
Federal Highway Administration And
The City of Cincinnati Department of Transportation & Engineering
State Job Number 134186
June 2006
1. Report No. FHWA/OH-2006/14
2. Government Accession No.
3. Recipient’s Catalog No.
5. Report Date June 2006
4. Title and subtitle Developing Pavement Performance Prediction Models and Decision Trees for the City of Cincinnati
6. Performing Organization Code
8. Performing Organization Report No.
7. Author(s) Arudi Rajagopal, Ph. D.
10. Work Unit No. (TRAIS) 11. Contract or Grant No. 134186
9. Performing Organization Name and Address University of Cincinnati Department of Civil & Environmental Engineering PO Box 210071 Cincinnati, OH 45221-0071
13. Type of Report and Period Covered
12. Sponsoring Agency Name and Address Ohio Department of Transportation, 1980, West Broad Street Columbus, OH 43223
14. Sponsoring Agency Code
15. Supplementary Notes 16. Abstract:
This report presents the details of a study conducted to develop pavement performance prediction models and decision trees for various families of pavements, using the data available with the City of Cincinnati. Required data was acquired from city’s pavement inventory database. The road network was divided into two classifications namely, major roads and minor roads. These roads were further grouped based on their structural makeup. Statistical regression models were developed for each group. A decision tree was developed to suggest appropriate maintenance and rehabilitation activities based on the condition of the pavement. The city engineers can use these models in conjunction with their pavement management system to predict the future condition of the highway network in Cincinnati and to implement cost effective pavement management solutions. Using the methodology developed in this study, the engineers can also further improve the accuracy of the models in the future.
17. Key Words Pavement Performance, Prediction Models, Decision Trees
18. Distribution Statement No restrictions. This document is available to the public through the National Technical Information Service, Springfield, Virginia 22161
19. Security Classif. (of this report) Unclassified
20. Security Classif. (of this page) Unclassified
21. No. of Pages 42
22. Price
Form DOT F 1700.7 (8-72) Reproduction of completed pages authorized

ACKNOWLEDGMENTS
This study was conducted in cooperation with the Ohio Department of Transportation and the City of Cincinnati.
The investigators wish to convey their appreciation to Mr. Roger Green and Mr. Andrew Williams of the Ohio
Department of Transportation for their help throughout the life of this project. Mr. Joseph Flading and Mr. Chris
Ertel of the City of Cincinnati’s Department of Transportation and Engineering were instrumental in developing the
database and setting up the goals of the study. Mr. Donald Rosemeyer and Mr. Joe Vogel from the City of
Cincinnati provided valuable direction and support. The assistance provided by Mr. Chaitanya Boggavarapu,
graduate student, is duly acknowledged. The cooperation extended by the Office of Research and Development is
highly acknowledged.

DISCLAIMER
The contents of this report reflect the views of the authors who are responsible for the facts and the accuracy of the
data presented herein. The contents do not necessarily reflect the official views or policies of the Ohio Department
of Transportation or the federal Highway Administration. This report does not constitute a standard, specification or
regulation.
TABLE OF CONTENTS
1. INTRODUCTION.................................................................................................................... 1
1.1 Overview of Pavement Performance Prediction Models and Decision Trees.................... 1
1.2 Cincinnati’s Pavement Management Practices................................................................... 2
1.3 Role of Ohio Department of Transportation in the Current Study ..................................... 5
1.3.1 Urban Paving Program................................................................................................ 5
1.3.2 Ohio Partnered Research Exploration Program (OPREP).......................................... 6
1.3.3 Pavement Management- Local Pavement Condition Rating ...................................... 6
2. PRESENT STUDY: OBJECTIVES AND SCOPE ................................................................ 7
3. BACKGROUND AND SIGNIFICANCE OF WORK............................................................ 7
4. REVIEW OF CINCINNATI’S PAVEMENT CONDITION DATABASES.......................... 9
4.1 IMS Database...................................................................................................................... 9
4.1.1 Deflection Data ......................................................................................................... 10
4.1.2 Surface Condition Data............................................................................................. 10
4.1.3 Pavement Condition Number.................................................................................... 11
4.2 ViPERS Database ............................................................................................................. 11
5. MODELING PAVEMENT PERFORMANCE ....................................................................... 11
5.1 Model Variables................................................................................................................. 11
5.2 Data Acquisition ................................................................................................................ 13
5.3 Data Validation ................................................................................................................. 16
5.4 Development of Performance Models .............................................................................. 16
5.4.1 General...................................................................................................................... 16
5.4.2 Models for Major Roads ........................................................................................... 17
5.4.3 Models for Minor Roads........................................................................................... 19
5.4.4 Validation of Performance Prediction Models ......................................................... 25
6. DECISION TREE .................................................................................................................. 30
7. SUMMARY, CONCLUSIONS AND RECOMMENDATIONS.......................................... 32
7. IMPLEMENTATION PLAN................................................................................................. 34
REFERENCES ............................................................................................................................. 36
LIST OF FIGURES
Figure 1. Typical Pavement Performance Curve………………………………………. 14
Figure 2. Performance Model for Major Roads………………………………………… 18
Figure 3. Performance Model for Minor Roads …………………………………..……. 20
Figure 4. Performance Model for Minor Roads – Flexible Type ………………………. 22
Figure 5. Performance Model for Minor Roads – Flexible Deep Granular Type ….….. 22
Figure 6. Performance Model for Minor Roads – Stabilized Type ……………...…….. 23
Figure 7. Performance Model for Minor Roads – Stabilized Deep Granular Type .….... 23
Figure 8. Performance Model for Minor Roads – Rigid Type …..…………………….. 24
Figure 9. Residual Plot for Major Roads ………………………...…………………….. 27
Figure 10. Residual Plot for Minor Roads – Flexible Type.……...…………………….. 27
Figure 11. Residual Plot for Minor Roads – Flexible Deep Granular Type...………….. 28
Figure 12. Residual Plot for Minor Roads – Stabilized Type ……...…………………... 28
Figure 13. Residual Plot for Minor Roads – Stabilized Deep Granular Type ….…...….. 29
Figure 14. Residual Plot for Minor Roads – Rigid Type ….……...………………..…... 29
Figure 15. Proposed decision Tree for Selection of M&R Alternative .………….…….. 31
LIST OF TABLES
Table 1. Summary of Performance Models …………………………….……………… 24
1
DEVELOPING PAVEMENT PERFORMANCE PREDICTION MODELS
AND DECISION TREES FOR THE CITY OF CINCINNATI
1. INTRODUCTION
1.1 Overview of Pavement Performance Prediction Models and Decision Trees
Pavement performance prediction models are used to predict future pavement conditions
of the highway network as part of the agency’s pavement management activities. The models
must reflect the best possible representation of the pavement deterioration. Predicting pavement
performance is an essential activity of a pavement management system. Within a pavement
management system, the prediction models are an important component for a multi-year analysis
for the types of activities listed below [1]:
• Estimating the type and timing of maintenance and/or rehabilitation as part of a multi-
year improvement program;
• Predicting the length of time until a lower limit of acceptable pavement condition is
reached (remaining service life);
• Optimizing the combination of projects, treatment, and timing to achieve agency goals;
• Evaluating the long-term impacts of various program scenarios;
• Providing a feedback loop to the pavement design process; and
• Estimating pavement life-cycle costs.
Deterministic models are one of the most common types of models used for a multi-year
pavement management analysis. These models may be either empirical (based on data from in-
service pavements) or mechanistic-empirical, calibrated using regression techniques that

2
statistically develop relationships between two or more variables. Development of deterministic
models requires a variety of data on factors that affect the rate of deterioration namely, traffic
loads, pavement layer thicknesses, materials, subgrade strength, environmental factors, and
construction techniques.
One of the primary uses of pavement performance prediction models is in the selection of
an appropriate Maintenance and Rehabilitation (M&R) treatment. Selecting an optimum M&R
strategy is often a complex process. Some researchers have suggested a “decision tree” approach.
The decision trees have been used primarily to select appropriate repair strategy based on the
existing pavement condition. The decision trees assist the pavement engineers to select the most
feasible M&R treatment considering roadway information – distress type, severity level and
extent of distresses, pavement type, and traffic level. In other words, decision trees will provide
directions and rationale for the selection of M&R strategies.
1.2 Cincinnati’s Pavement Management Practices
The City of Cincinnati’s Department of Transportation and Engineering (DOTE) is
responsible for the design, operation and maintenance of the City’s street rehabilitation program.
The DOTE coordinates with its Division of Engineering to generate quantitative and qualitative
data on the City’s street network, including its current and future performances. This
information base is used to link technical analysis, decision making and budgetary processes.
The street rehabilitation program includes all the activities involved in the planning and
programming, design, construction, maintenance and rehabilitation of street pavements in
Cincinnati. The street network has approximately 850 miles (or 2655 lane miles) of pavements.
In 1996, the city established a structured pavement management system to aid the management
in planning network-level budgets and developing multi-year plans for the network. The system

3
developed by the Infrastructure Management System (IMS) was operational till 1999 [2].
During this period, the IMS consultants collected a large amount of performance data for the city,
which included visual observation of surface distresses, automated roughness and deflection data.
An internal review of the system in 2000 indicated that the pavement conditions predicted by the
program did not relate to actual conditions observed by the engineers [3]. This may have been
due to the use of generic performance evaluation procedures instead of developing specific
procedures/models for the conditions that existed in the city of Cincinnati. Further, the program
was not capable of performing multi-year prioritization. As a result, the city decided to
discontinue the use of the IMS pavement management system and developed a simple condition
rating system on a four point scale (excellent, good, fair, and poor), based on visual observations
only. This procedure termed Visual Pavement Evaluation and Recording System (ViPERS) [4],
however, limited the use of pavement condition data for single year (year-to-year) programming
without the ability to do multi-year prioritization. During this period, more often than not,
pavements in ‘fair’ and ‘poor’ categories were selected for maintenance and rehabilitation. No
consideration was given to using the condition data to predict the probability of moving from one
condition to another. No consideration was given to using the condition data to predict the
probability of moving from one condition to another. In 2004, the city initiated steps to develop
and implement a new pavement management system. After a thorough review of several options,
late in 2005, the city decided to adopt Micro PAVER pavement management system.
Micro PAVER was developed by the U.S. Army Corps of Engineers and adopted by the
American Public Works Association in 1979 [5]. This is the most widely used software for
pavement management among city governments and airport authorities. However, very few State
agencies have adopted micro PAVER. Excellent documentation is available on the
4
developmental and operational aspects of the program. The program is user friendly, versatile
and customizable [6].
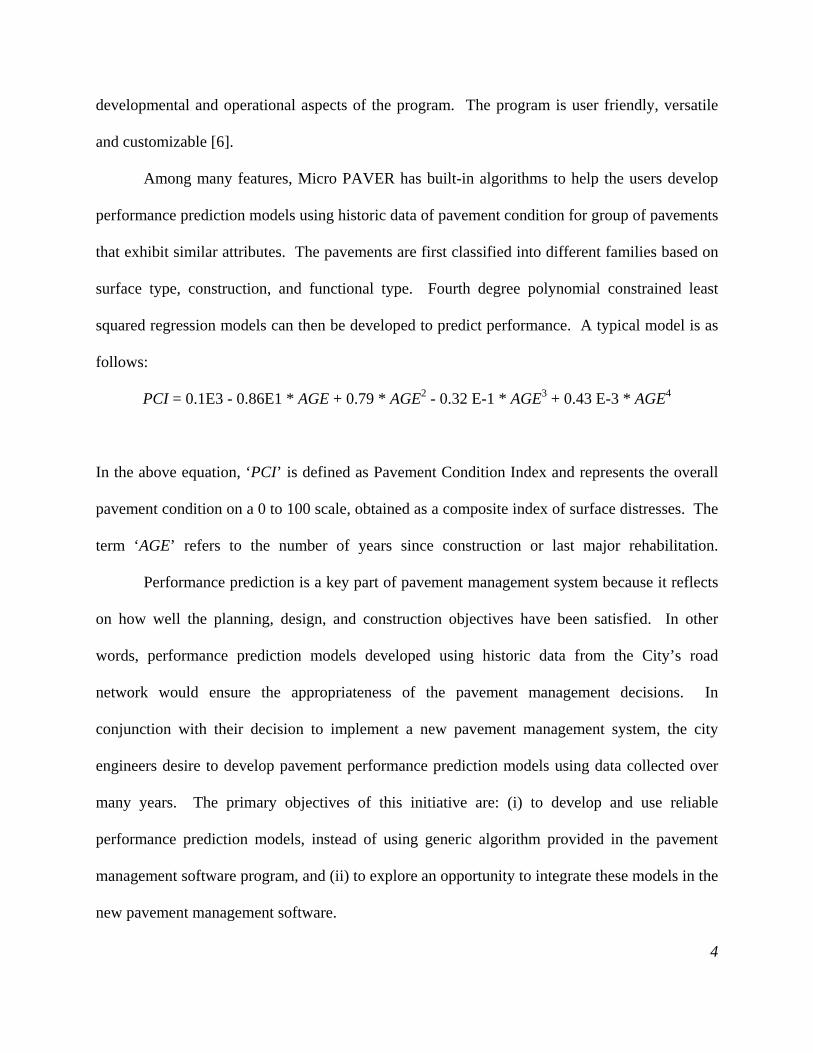
Among many features, Micro PAVER has built-in algorithms to help the users develop
performance prediction models using historic data of pavement condition for group of pavements
that exhibit similar attributes. The pavements are first classified into different families based on
surface type, construction, and functional type. Fourth degree polynomial constrained least
squared regression models can then be developed to predict performance. A typical model is as
follows:
PCI = 0.1E3 - 0.86E1 * AGE + 0.79 * AGE2 - 0.32 E-1 * AGE3 + 0.43 E-3 * AGE4
In the above equation, ‘PCI’ is defined as Pavement Condition Index and represents the overall
pavement condition on a 0 to 100 scale, obtained as a composite index of surface distresses. The
term ‘AGE’ refers to the number of years since construction or last major rehabilitation.
Performance prediction is a key part of pavement management system because it reflects
on how well the planning, design, and construction objectives have been satisfied. In other
words, performance prediction models developed using historic data from the City’s road
network would ensure the appropriateness of the pavement management decisions. In
conjunction with their decision to implement a new pavement management system, the city
engineers desire to develop pavement performance prediction models using data collected over
many years. The primary objectives of this initiative are: (i) to develop and use reliable
performance prediction models, instead of using generic algorithm provided in the pavement
management software program, and (ii) to explore an opportunity to integrate these models in the
new pavement management software.
5
1.3 Role of Ohio Department of Transportation in the Current Study
The City of Cincinnati is a large metropolitan city in the State of Ohio. The Ohio
Department of Transportation (ODOT), through its various programs, works with the local
governments to develop and foster transportation infrastructure in Ohio. Three such programs
related to the current study are:
• Urban paving program
• Ohio Partnered Research Exploration Program (OPREP)
• Pavement management – local pavement condition rating
1.3.1 Urban Paving Program
According to the Ohio state law, cities in Ohio are required to pave the U.S and state
routes within their boundaries. However, this is an expense most cities find it difficult to fund.
In response to this issue, in January 2000, the ODOT Urban Paving Program was established to
fund and evenly distribute state urban paving funds throughout Ohio [7]. This program sets new
standardized policy for paving U.S. and state routes in municipalities and aids in establishing an
equitable funding program. In this program, ODOT will provide 80 percent of the paving funds,
while the municipalities must provide a 20 percent match. By aiding cities equally, the
department can ensure a quality statewide transportation system. Such programs encourage the
local governments to develop systematic pavement management programs and policies.
Needless to say, a structured pavement management system can assist local governments to
develop plans, and better interact with ODOT to present their specific needs.

6
1.3.2 Ohio Partnered Research Exploration Program (OPREP)
The Ohio Partnered Research Exploration Program is administered through ODOT’s
Office of Research and Development [8]. This program helps local agencies leverage research
funds and resources. Some of the significant benefits of this program are that, by getting
involved in this program, the local agencies can directly interact with the experienced pavement
management specialists at ODOT, access ODOT’s resources, and obtain technical and financial
support to conduct research that can lead to development and implementation of sound pavement
management practices.
1.3.3 Pavement Management- Local Pavement Condition Rating
The Pavement Management Division of ODOT’s Office of Pavement Engineering
collects pavement performance data annually on all state owned and maintained pavements.
This includes U.S. and state routes in municipalities. In addition, through the ‘Local PCR
Program’ the department personnel collect condition data on selected local and secondary
systems [9]. This is a unique system that can bring the state and local agencies together and
further encourage the local governments in Ohio to collect condition data on the rest of the
network, and thereby establish a pavement management system.
In summary, the state and local governments in Ohio have developed programs that can
help them better interact and to develop a unified pavement management system throughout the
state. The current study has been undertaken jointly by the University of Cincinnati and the City
of Cincinnati. ODOT has provided technical and financial support for this project.

7
2. PRESENT STUDY: OBJECTIVES AND SCOPE
The specific objective of the present study is to develop pavement performance
prediction models and decision trees for various families of pavements, using data available with
City of Cincinnati. The report outlines a concise review of the published literature, the data
sources, statistical models and complete description of various tasks performed in this study.
3. BACKGROUND AND SIGNIFICANCE OF WORK
A pavement performance model is a mathematical expression that can be used to predict
future pavement condition, based on the present pavement condition and a host of factors that
contribute to the change in condition. Performance models are indispensable for many processes
of decision making as they are useful in establishing answers to questions: ‘what’, ‘where’, and
‘when’ with respect to managing pavements. In other words, the performance models enable the
engineers to determine type of treatment required, the portions of network requiring treatment,
and the timing of treatments. Used at the network level, pavement forecasting models are
helpful in planning, programming, and budgeting. At the project level, forecasting models are
used to design pavements, to perform life-cycle cost analyses, to select optimal designs with least
total costs, and in trade-off analyses in which the annualized costs of new construction,
maintenance, rehabilitation, and user costs are considered for a specific pavement design [10].
Several approaches are employed for their development. They include regression
analysis using field performance data, mechanistic modeling based on pavement response
parameters, and models that combine both field data and response parameters, which are aptly
called mechanistic-empirical models. There are four basic criteria that should be followed to
develop reliable performance models at any level within the transportation agency. These
include the following items [1, 11, 12]:

8
i. An adequate database;
ii. The inclusion of all significant variables that affect performance;
iii. An adequate functional form of the model; and
iv. The satisfaction of the statistical criteria concerning the precision of the model.
It is important that the data needed to develop model be available and continue to be updated as
changes occur. The data must be representative of the pavements for which the model is being
developed. Every possible variable that may affect the performance of pavement should be
considered. The functional form of the model, or the way in which the variables are arranged,
can only be determined through consideration of the actual relationships between the variables
and the trends from the data on plots. Statistics should be used when all forms are considered to
adhere to the boundary conditions and other physical principles that govern the variable being
modeled are considered. One of the important boundary conditions is Initial Condition Rating.
Several studies, including the previous study by ODOT, have reported that, when pavements are
rehabilitated, the condition rating of the rehabilitated pavement section is usually in the range of
90 to 98 based on a scale of 0 to 100 [13]. The initial condition rating depends on the type of
pavement, type of activity performed and construction techniques. In developing pavement
performance models, due consideration must be given to identify the initial condition rating,
initial slope, and overall trend of the model.
Because of the large number of variables involved in a regression analysis, performance
models are developed by grouping pavements into families that have common characteristics
such as surface type, functional classification, traffic levels, and geographic location. The family
approach has been used successfully by agencies. This approach is based on the assumption that
9
each pavement section within a family has a similar deterioration pattern. The pavement
performance model developed for the family represents the average deterioration pattern for all
sections in that family. When families of pavement sections with similar characteristics are
developed, the regression analysis need only analyze pavement condition in terms of age, greatly
reducing the number of variables in the regression equation.
Recently, ODOT has initiated a similar research to develop performance prediction
models applicable to interstate, U.S. and state routes [14]. The present study complements
ODOT’s ongoing study by developing performance models for an urban pavement network.
4. REVIEW OF CINCINNATI’S PAVEMENT CONDITION DATABASES
As outlined earlier, pavement condition data was collected in Cincinnati during two
distinct phases – first between 1996 and 1999 by IMS consultants and later by the City between
2000 and 2003. A description of the databases, termed IMS Database [2] and ViPERS Database
(Visual Pavement Evaluation Recording System) [4], is provided below:
4.1 IMS Database
The IMS database consists of pavement inventory and condition report for each pavement
segment that was surveyed. To begin with, the road network in Cincinnati was divided into four
zones. Pavement sections in each zone were divided into homogeneous sections based on
several factors including, functional classification and surface type. The required data was
collected by the consultants on all pavements in only one zone, each year. Thus, during the four
year period, all the pavements in the City were surveyed once. The condition data includes the
following:
10
4.1.1 Deflection Data
Deflection data was collected using Dynaflect. One set of readings was recorded in each
homogeneous pavement section. Deflection data was collected using five geophones, spaced at
12 inch intervals. The geophone readings were recorded in milli-inches and were labeled W1
through W5 where W1 is closest to the load. The data was processed to obtain Dynaflect
Maximum Deflection (DMD), Surface Curvature Index (SCI), Bending Curvature Index (BCI),
and Spreadability (SP). These terms are defined below:
• DMD = W1
• SCI = W1 – W2
• BCI = W4 – W5
• %SP = 100 x (W1 + W2 + W3 + W4 + W5) / (5 X W1)
Using the above parameters, a Dynamic Condition Number (DCN) was calculated for each
pavement section. DCN is a composite index of the above four parameters and varies from 10 to
100.
4.1.2 Surface Condition Data
The surface condition data was acquired using a Laser Road Surface Tester (RST). RST
is a self-contained automated device for measuring and storing detailed objective data about the
pavement surface. The RST consisted of eleven lasers mounted on a vehicle that enabled
measurement of surface data. The data collected included rut depth measurements, ride quality
in terms of International Roughness Index (IRI), and cracking. This information was combined
to form a Surface Condition Number that ranged from10 to 100.
11
4.1.3 Pavement Condition Number
Using the processed deflection and surface condition data, along with an environmental
factor, an index termed Pavement Condition Number (PCN) was generated. PCN is analogous to
ODOT’s Pavement Condition Rating (PCR) number and varied from 10 to 100. Unlike ODOT’s
PCR which is derived solely based on subjective evaluation of visual distresses (and varied from
0 to 100), PCN is obtained as a function of many parameters such as deflection, ride quality,
surface condition and environmental factor. The development and computational aspects of PCR
is well documented in ODOT’s PCR Manual [15]. However, such details are not available with
respect to PCN.
4.2 ViPERS Database
The VIPERS data consists of condition data collected on all pavements in the city, each
year. The data collection procedure consisted of rating pavements on a 4-point scale as excellent,
good, fair and poor. This system did not include collection and recording additional related to
severity and extent of individual distresses although the raters occasionally noted additional
comments about the distresses. No attempt was made to convert this rating into a number index.
As a result, this database was not used for the development of performance prediction models.
5. MODELING PAVEMENT PERFORMANCE
5.1 Model Variables
Development of pavement performance prediction models requires a careful consideration of
dependent and independent variables. The dependent variable is always a pavement condition
indicator. The choice of a dependent variable is often made based on the type of data collected and
the condition indicator established by the agencies. Some examples of pavement condition indicators
include Present Serviceability Index (PSI), Pavement Condition Rating (PCR), Pavement Condition
12
Index (PCI), and International Roughness Index (IRI). In the current study, Pavement Condition
Number (PCN), established by the IMS consultants as part of their pavement management system
was considered as the dependent variable. PCN is a composite condition index and is obtained as a
function of structural, surface and environmental characteristics.
The list of independent variables should always be comprehensive enough and be able to
describe the performance of highway sections in all respect. The variables should encompass various
categories deemed important in rating highway sections. Generally, a host of factors are considered
as independent variables. Typically they include: age of the pavement, traffic, pavement type,
functional classification, material type and properties, environmental conditions, and construction
and maintenance histories. Many highway agencies have incorporated combinations of these
variables depending on their relative importance (as perceived by them) and availability of data. In
the present study, a careful review of IMS database was made to select appropriate independent
variables.
The IMS database consists of the following group of information for each pavement segment
surveyed:
• Location – Zone Number, Street Name, From, To
• Functional Classification – Eight classifications
• Traffic- Average Daily Traffic and truck traffic
• Pavement Type – AC for asphalt surface, PC for Concrete surface
• PCN – Pavement Condition Number as an aggregate index of structural, surface and
environmental characteristics.
• PCN Year - Year when PCN was recorded

13
The pavement sections are predominantly (98%) asphalt surfaced. Reliable traffic data was not
available for all segments. However, the functional classification assigned to each segment was
recorded.
Age of pavement is a variable of paramount importance. Most performance models have
incorporated age either as a sole independent variable or in combination with other independent
variables. Age can adequately describe changes in pavement condition with time due to several
factors that affect performance of pavements.
In this study, to begin with, two independent variables namely, functional classification and
age were considered in the development of performance prediction models. Here, age is defined as
the number of years since construction or last major rehabilitation. It was decided to combine all the
pavement segments into two families (functional classifications) namely, major and minor roads.
5.2 Data Acquisition
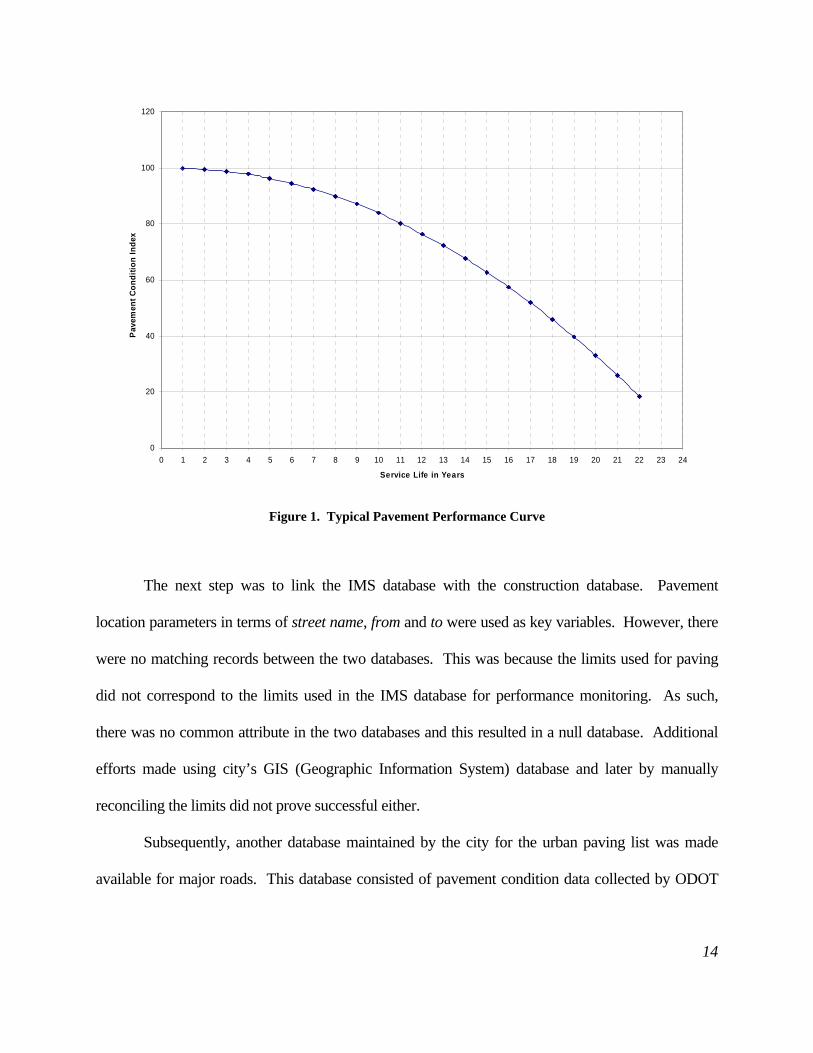
A typical performance model is shown in Figure 1. In this figure, the curve represents a
general pattern of deterioration of a group of pavements that exhibit similar characteristics. To
develop a model of this type, it is necessary to obtain performance data collected over a number of
years on a large number of pavement sections, along with date of construction or last major
rehabilitation. However, this information was not recorded in the IMS database. The city engineers
then assembled two databases listing construction records, one for major roads and the other minor
roads.
0
20
40
60
80
100
120
0 1 2 3 4 5 6 7 8 9 10 11 12 13 14 15 16 17 18 19 20 21 22 23 24
Service Life in Years
Pave
men
t Con
ditio
n In
dex
Figure 1. Typical Pavement Performance Curve
The next step was to link the IMS database with the construction database. Pavement
location parameters in terms of street name, from and to were used as key variables. However, there
were no matching records between the two databases. This was because the limits used for paving
did not correspond to the limits used in the IMS database for performance monitoring. As such,
there was no common attribute in the two databases and this resulted in a null database. Additional
efforts made using city’s GIS (Geographic Information System) database and later by manually
reconciling the limits did not prove successful either.
Subsequently, another database maintained by the city for the urban paving list was made
available for major roads. This database consisted of pavement condition data collected by ODOT
14
15
along with the construction history required to establish the age of pavement sections, for 100
pavement sections. In this database, the condition rating system used was ODOT’s PCR (Pavement
Condition Rating). Since the urban paving list database consisted of all the required information and
sufficient number of records, it was decided to use this database to develop performance models for
major roads.
At this juncture, the researchers reviewed ODOT’s database for Hamilton County, collected
through the local pavement management program. The information contained in this database for
minor roads was, however, insufficient for performance modeling. Unlike the urban paving program,
ODOT’s local program is very limited in scope. ODOT surveys a small percent of minor road
network, limiting the evaluation to the roads in the vicinity of major roads.
City’s database of construction history for minor roads consisted of 3000 records for all the
secondary roads in the city. When this file was joined with the IMS database, adequate information
to develop models, including pavement condition (PCN) and age of pavement sections was available
for 409 records.
Thus two different databases became available, one for major roads and the other for minor
roads. These databases offered two different condition rating indicators namely PCR and PCN. PCR
is derived using visual observation of surfaces distresses and ranges from 0 to100. PCN, on the other
hand, is derived as a function of deflection, surface profile and environmental characteristics, on a 10
to 100 scale. Following a series of meeting with the city engineers, a decision was made to proceed
with the development of performance models using the available data.
16
5.3 Data Validation
The data contained in the two databases for major and minor roads was subjected to
validation. Data validation is defined as inspection of all the collected data for completeness and
reasonableness, and elimination of erroneous values. This step transforms raw data into
validated data. The validated data are then processed to develop models. Typically, validation is
done by performing a range of tests, or by manually reconciling suspect values.
There are essentially two parts of data validation – data screening and data verification.
Data screening uses a series of validation routines to screen all the data for suspect (questionable
and erroneous) values. Data verification requires a case-by-case decision on what to do with the
suspect values – retain them as valid, reject as invalid, or replace them with redundant valid
values (if available). This part is where judgment by a qualified person is needed.
In this study, each data element was subjected to range tests. The data was compared to
upper and lower limiting values. As a result of this effort, the major roads database yielded 91
records while the minor roads database yielded 279 records.
5.4 Development of Performance Models
5.4.1 General
Pavement performance models developed can be either linear or non-linear, depending on
whether or not the relationship among the variables can be defined in terms of a straight line.
Regression is one of the most widely used and powerful analysis techniques available for
constructing performance models. A nonlinear regression is used when the relationship between
the dependent and independent variables is not linear. In these instances, polynomial regression
is frequently used. The common S-shaped deterioration curve is a result of a polynomial
regression. The best equations to use to predict the value of Y from some value of X is one that
minimizes the differences between the regression line and the actual data.
In this study, regression analysis was performed on the validated data by considering
several shape functions that included liner, polynomial, logistic, exponential, power function and
a few user defined shapes. The best fit was determined based on the coefficient of determination,
R2 value.
5.4.2 Models for Major Roads
This group included pavements on arterial highways, state highways and freeways
passing through the city. A total of 91 pavement sections were available for performance
modeling. Since more than 95% of these pavements belonged to AC type, pavement type was
not considered as an independent variable. Cincinnati’s major rehabilitation generally includes
milling existing asphalt layer and construction of two inch thick new asphalt overlay. Hence, the
type of activity performed was not considered as an independent variable. Thus, all these
pavement sections were grouped into one family, i.e., major roads.
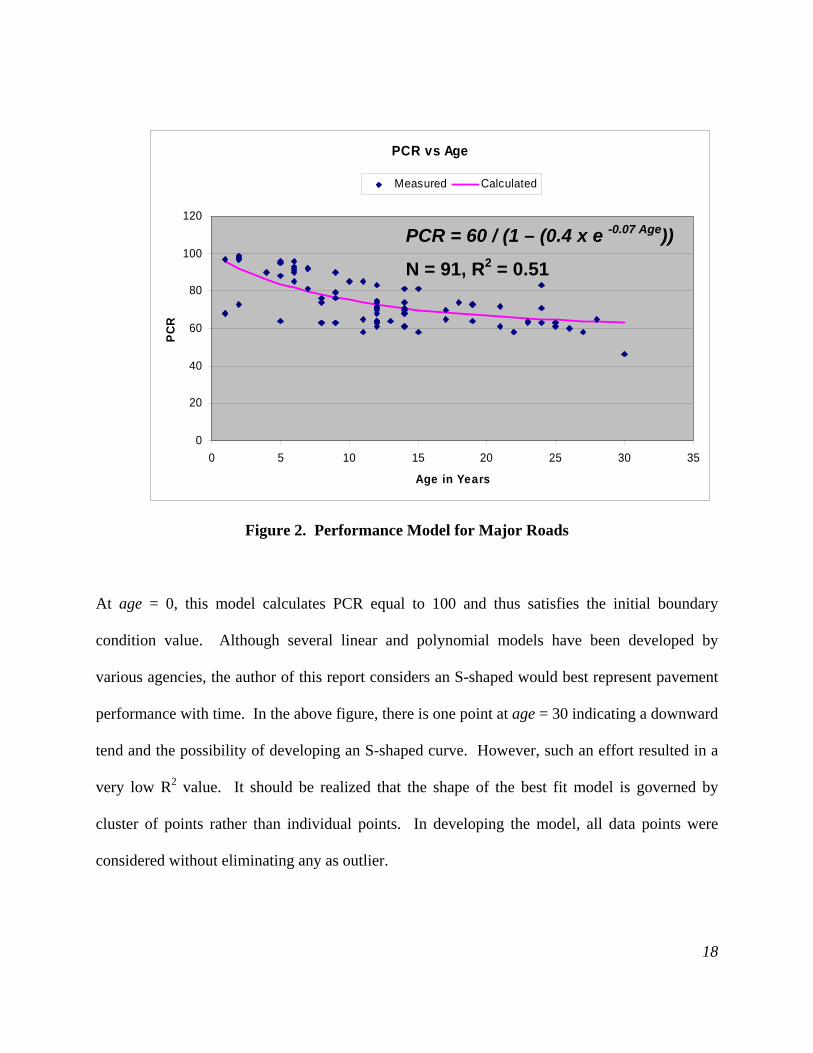
Figure 2 shows a scatter plot of age vs. PCR for major roads along with a best fit model.
The model can be represented by the following equation:
)4.0(160
07.0 AgeePCR ×−×−
=
17
PCR vs Age
0
20
40
60
80
100
120
0 5 10 15 20 25 30 35
Age in Years
PC
RMeasured Calculated
PCR = 60 / (1 – (0.4 x e -0.07 Age))
N = 91, R2 = 0.51
Figure 2. Performance Model for Major Roads
At age = 0, this model calculates PCR equal to 100 and thus satisfies the initial boundary
condition value. Although several linear and polynomial models have been developed by
various agencies, the author of this report considers an S-shaped would best represent pavement
performance with time. In the above figure, there is one point at age = 30 indicating a downward
tend and the possibility of developing an S-shaped curve. However, such an effort resulted in a
very low R2 value. It should be realized that the shape of the best fit model is governed by
cluster of points rather than individual points. In developing the model, all data points were
considered without eliminating any as outlier.
18
19
The R2 value describes how well the regression line represents the data. The regression
analysis for major roads yielded a value equal to 0.51. A value of 0.51 implies that 51% of the
variation is accounted for by the regression equation. An R2 value from 0.4 to 0.6 is generally
considered moderate correlation by most researchers, while a value ranging from 0.6 to 0.8 is
deemed strong correlation.
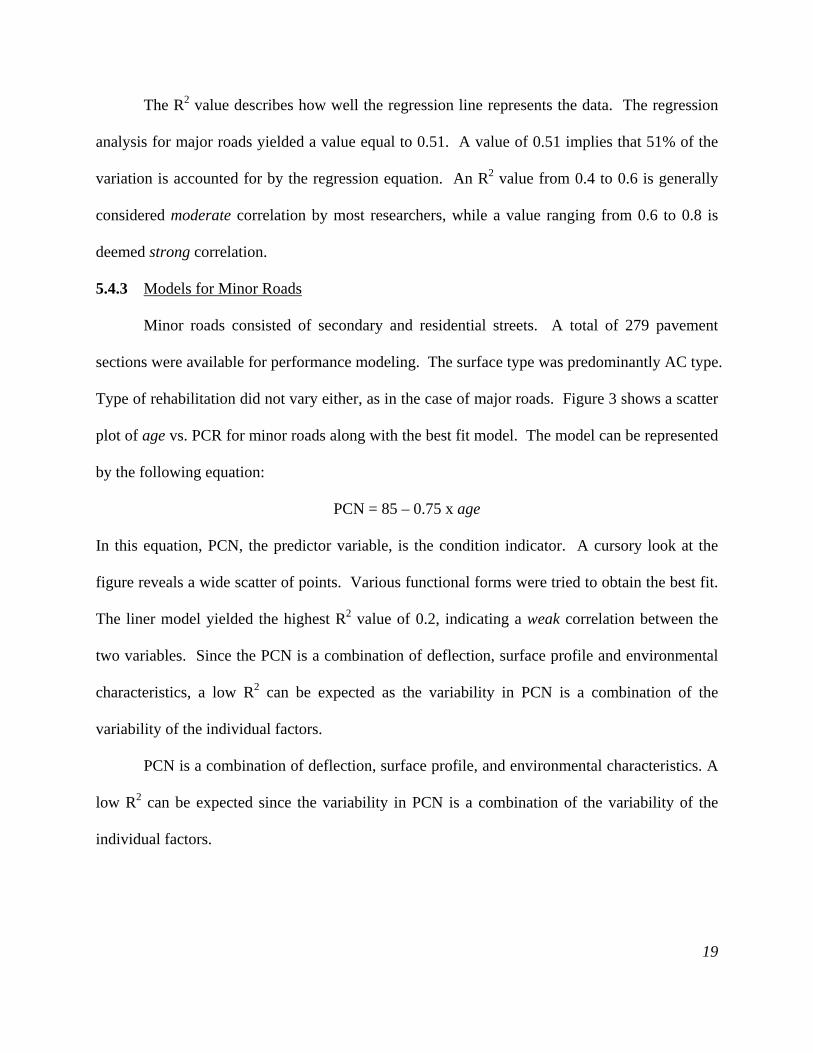
5.4.3 Models for Minor Roads
Minor roads consisted of secondary and residential streets. A total of 279 pavement
sections were available for performance modeling. The surface type was predominantly AC type.
Type of rehabilitation did not vary either, as in the case of major roads. Figure 3 shows a scatter
plot of age vs. PCR for minor roads along with the best fit model. The model can be represented
by the following equation:
PCN = 85 – 0.75 x age
In this equation, PCN, the predictor variable, is the condition indicator. A cursory look at the
figure reveals a wide scatter of points. Various functional forms were tried to obtain the best fit.
The liner model yielded the highest R2 value of 0.2, indicating a weak correlation between the
two variables. Since the PCN is a combination of deflection, surface profile and environmental
characteristics, a low R2 can be expected as the variability in PCN is a combination of the
variability of the individual factors.
PCN is a combination of deflection, surface profile, and environmental characteristics. A
low R2 can be expected since the variability in PCN is a combination of the variability of the
individual factors.
PCN vs Age
0
20
40
60
80
100
120
0 5 10 15 20 25 30
Age in Years
PCN
Measured Calculated
PCN = 85 – 0.75 x Age N = 279, R2 = 0.2
Figure 3. Performance Model for Minor Roads
In an effort to improve the R2 value, discussions were held with the city engineers and the
minor roads database was further investigated. Investigation of the IMS database revealed
additional information about pavement classification based on the structural makeup. The
pavements were classified into five categories as below [2]:
• Flexible
• Flexible Deep Granular
• Stabilized
• Stabilized Deep Granular
• Rigid
20

21
Flexible pavements are asphalt pavements over a granular base. Flexible deep granular
pavement is flexible pavement over a deep (greater than two feet) granular subbase. Stabilized
pavement is asphalt pavement over a semi-rigid base material. The base material normally
consists of a pozzolonic (lime/fly ash) aggregate mixture or cement stabilized aggregate mixture.
Stabilized deep granular pavements are stabilized pavements over deep granular layers as in
flexible pavement. Rigid pavement is Portland cement concrete pavement. Asphalt overlaid
concrete pavement is also considered rigid.
The minor roads database was subdivided into five groups, according to the pavement
type classification. The number of pavement sections available in each group was as follows:
• Flexible - 101
• Flexible Deep Granular - 41
• Stabilized - 31
• Stabilized Deep Granular - 28
• Rigid - 78
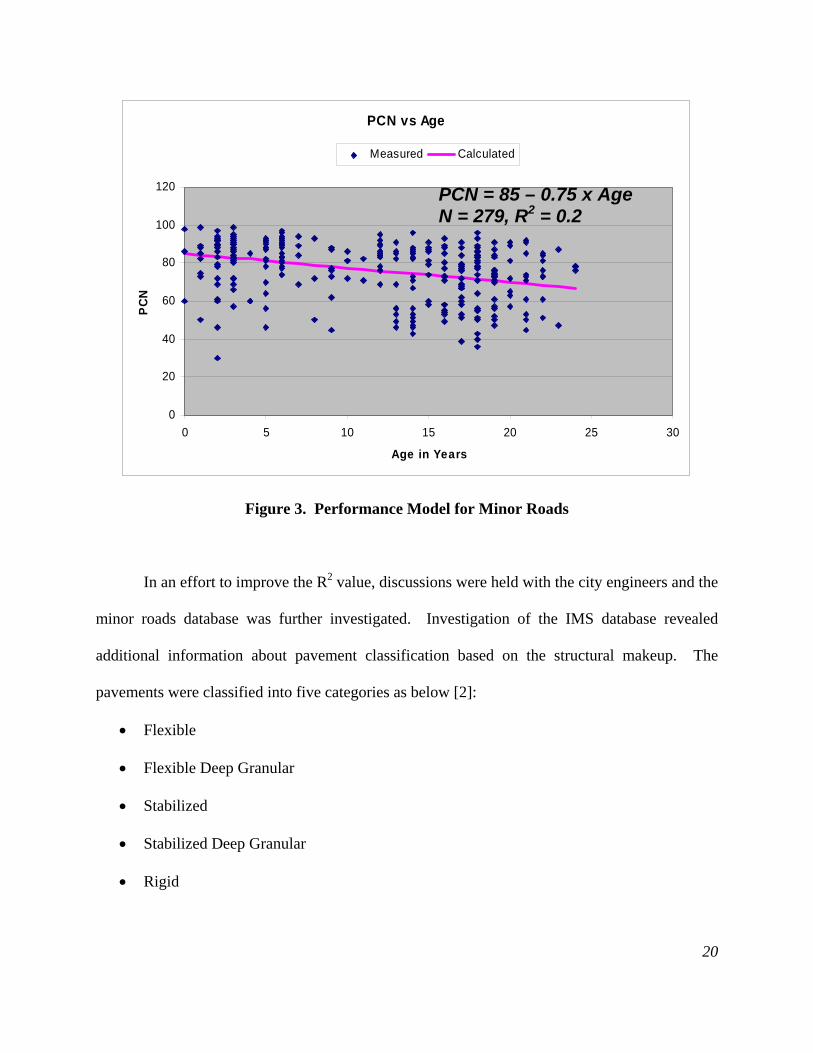
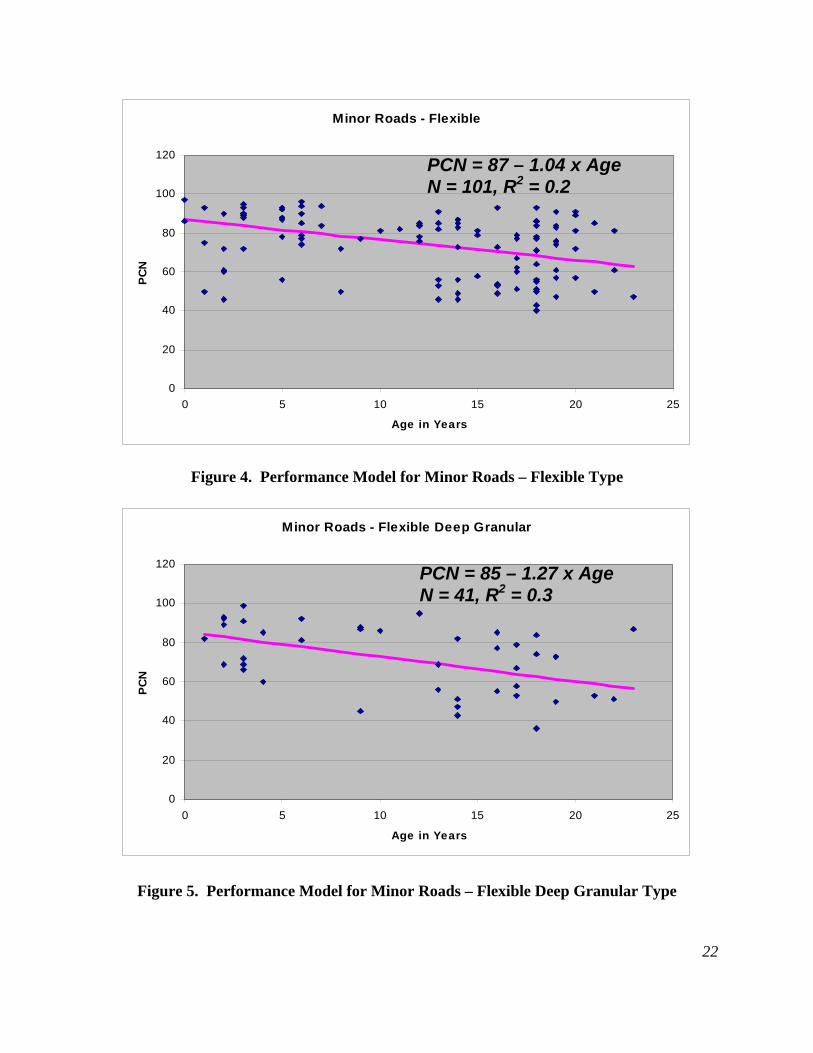
Performance models were developed for the individual group of pavements. Figures 4 through 8
show the scatter plots along with best fit model for each pavement type. A summary of the
models and R2 values is provided in Table 1. It can be seen that adequate data was available
from statistical standpoint to develop models for each pavement type. However, there was either
no improvement or marginal improvement in R2 values as a result of this effort.
Minor Roads - Flexible
0
20
40
60
80
100
120
0 5 10 15 20 25
Age in Years
PC
N
PCN = 87 – 1.04 x Age N = 101, R2 = 0.2
Figure 4. Performance Model for Minor Roads – Flexible Type
Minor Roads - Flexible Deep Granular
0
20
40
60
80
100
120
0 5 10 15 20 25
Age in Years
PCN
PCN = 85 – 1.27 x Age N = 41, R2 = 0.3
Figure 5. Performance Model for Minor Roads – Flexible Deep Granular Type
22
Minor Roads - Stabilized
0
20
40
60
80
100
120
0 5 10 15 20 25 30
Age in Years
PCN
PCN = 90 – 4.89 x Age N = 31, R2 = 0.2
Figure 6. Performance Model for Minor Roads – Stabilized Type
Minor Roads - Stabilized Deep Granular
0
10
20
30
40
50
60
70
80
90
100
0 5 10 15 20 25
Age in Years
PCN
PCN = 87 – 0.99 x Age N = 28, R2 = 0.3
Figure 7. Performance Model for Minor Roads – Stabilized Deep Granular Type
23
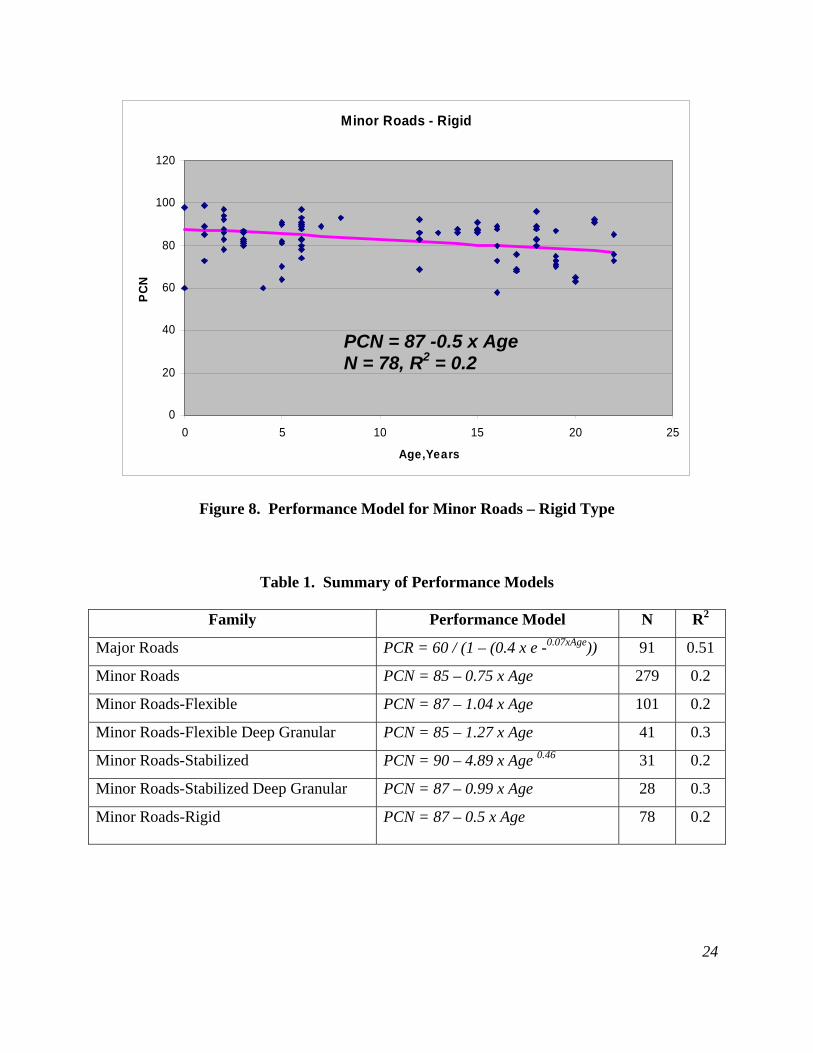
Minor Roads - Rigid
0
20
40
60
80
100
120
0 5 10 15 20 25
Age,Years
PCN
PCN = 87 -0.5 x Age N = 78, R2 = 0.2
Figure 8. Performance Model for Minor Roads – Rigid Type
Table 1. Summary of Performance Models
Family Performance Model N R2
Major Roads PCR = 60 / (1 – (0.4 x e -0.07xAge)) 91 0.51
Minor Roads PCN = 85 – 0.75 x Age 279 0.2
Minor Roads-Flexible PCN = 87 – 1.04 x Age 101 0.2
Minor Roads-Flexible Deep Granular PCN = 85 – 1.27 x Age 41 0.3
Minor Roads-Stabilized PCN = 90 – 4.89 x Age 0.46 31 0.2
Minor Roads-Stabilized Deep Granular PCN = 87 – 0.99 x Age 28 0.3
Minor Roads-Rigid PCN = 87 – 0.5 x Age 78 0.2
24

25
The format for the database provided in the IMS software is generic, meaning it was not
developed specifically for the pavements in Cincinnati. Classification of pavements is normally
done by taking core samples followed by a thorough review of historic construction records. No
report is available to indicate such an effort by the consultants while setting up the database. By
asserting correct pavement type for each pavement section in the minor roads database, it may
still be possible to obtain better R2 values and increase the accuracy of models.
5.4.4 Validation of Performance Prediction Models
Model validation using statistical techniques is an important step in the model building
sequence. Often the process of validation consists of citing the R2 value from the fit, which
measures the fraction of the total variability in the response that is accounted for by the model.
There are many statistical tools for model validation, but the primary tool of model validation is
graphical residual analysis, i.e., through an assortment of plots of differences between the
observed data and the predicted value from the model. Graphical methods have an advantage
over numerical methods for model validation because they readily illustrate a broad range of
complex aspects of the relationship between the model and the data. Numerical methods for
model validation tend to be narrowly focused on a particular aspect of the relationship between
the model and the data, and often try to compress that information into a single descriptive
number or test result. Graphical analysis of the residuals is the single most important technique
for determining the need for model refinement or for verifying that the underlying assumptions
of the analysis are met. The residuals are the differences between the responses observed and the
corresponding prediction of the response computed using the regression function. Examining
residuals is a key part of statistical modeling. Residuals can be thought of as elements of
variation unexplained by the fitted model. Since this is a form of error, the same general

26
assumptions apply to the group of residuals that is typically used for errors in general: it should
be roughly normal and approximately independently distributed with a mean of 0 and some
constant variance. These are the assumptions behind classical regression analysis. This means
that a regression model should err in predicting a response in a random fashion; the model should
predict values higher than actual and lower than actual with equal probability [15].
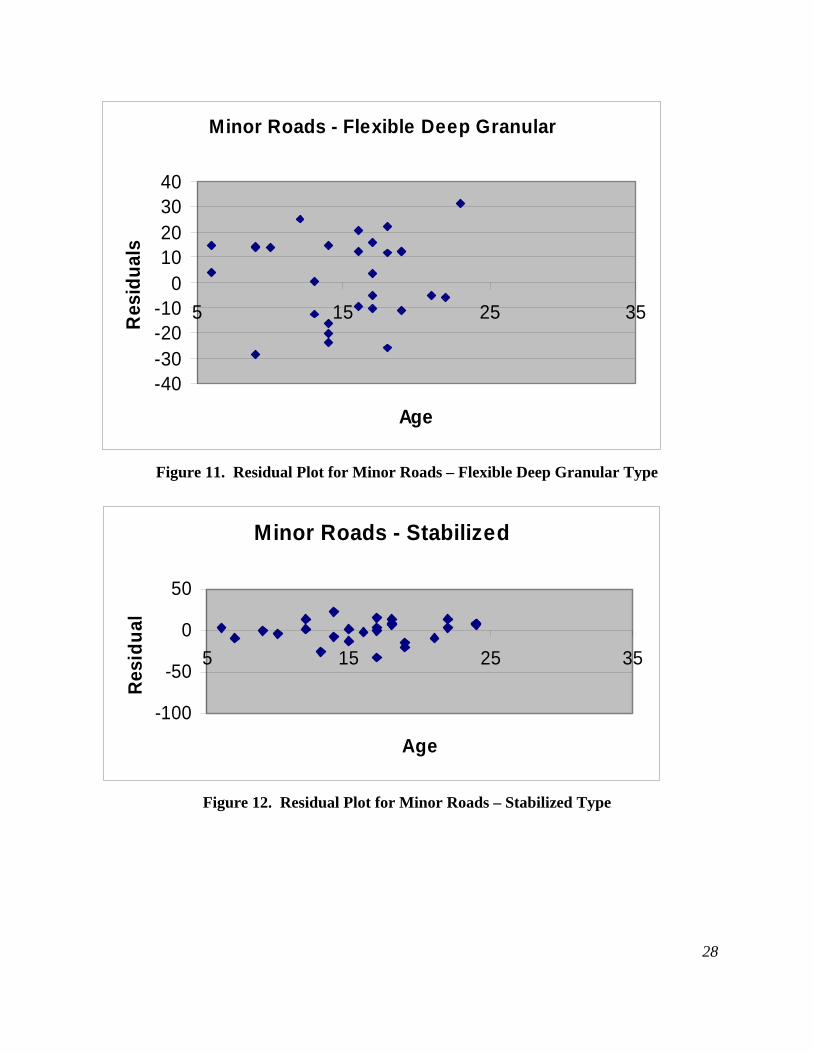
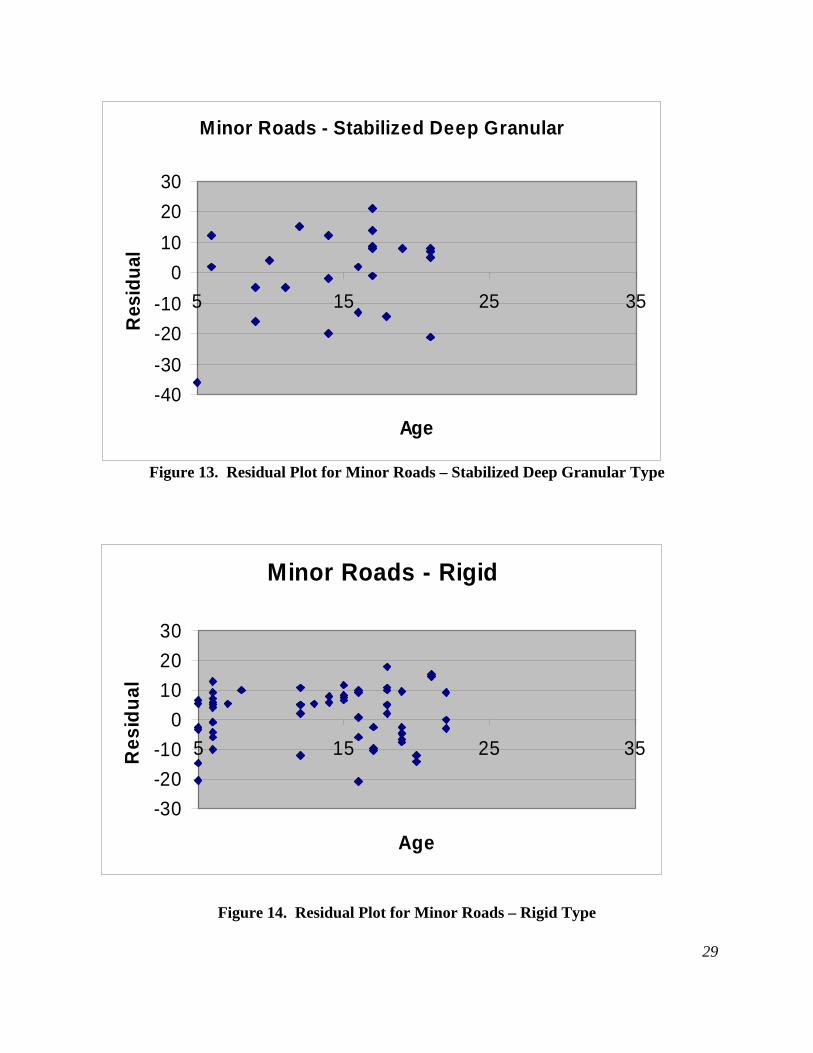
Figures 9 through 14 show the residual plots for the major and minor road models. The
residuals for the ith observation, ei are calculated as:
ei = PCR observed ,i – PCR calculated, i
As seen in these figures, for each model, the distribution of residuals is random, with no
definite pattern. Moreover, for each model the number of positive residuals is about the same as
the number of negative residuals. Since the residuals appear to behave randomly, it suggests that
the models developed fit the data well. On the other hand, if non-random structure is evident in
the residuals, it is a clear sign that the model fits the data poorly. The reference line at 0
emphasizes that the residuals are split about 50-50 between positive and negative. There are no
systematic patterns apparent in the plots. The residual plots explain if the assumptions made
during the model development (normality of the data) are valid. It does not explain how good
the fit is. Thus, in conclusion, the models presented represent the best-fit for the data used in
their development.
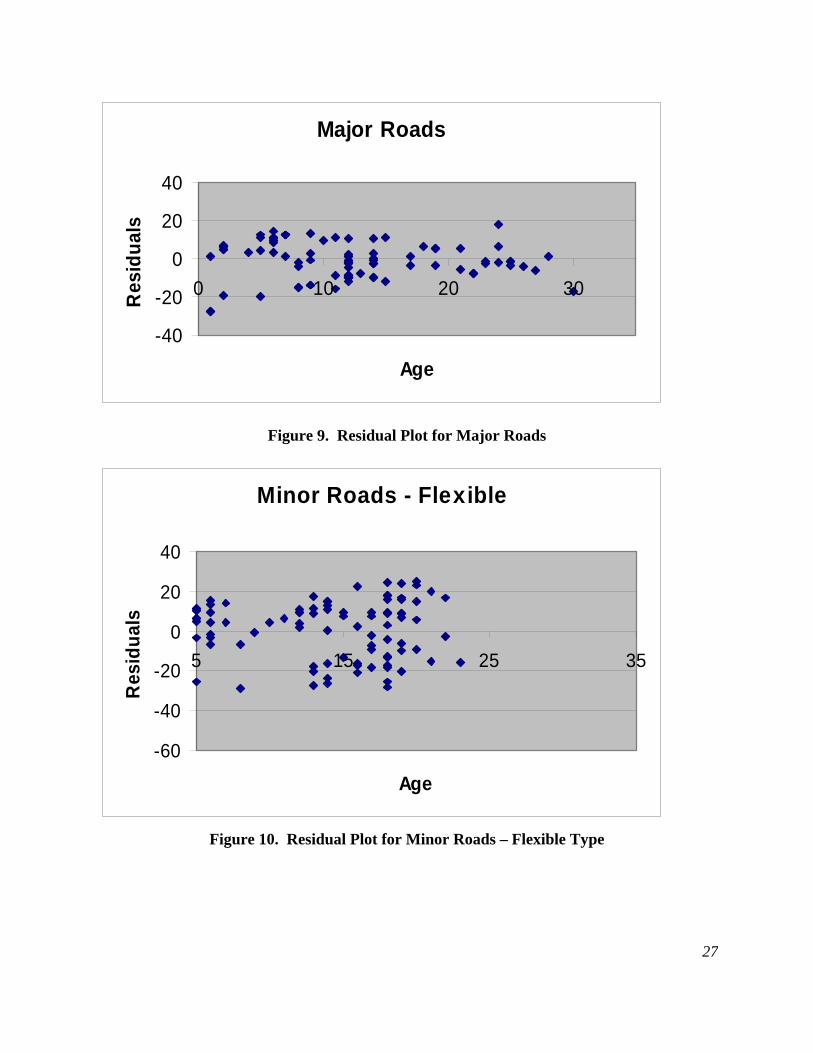
Major Roads
-40
-20
0
20
40
0 10 20 30
Age
Res
idua
ls
Figure 9. Residual Plot for Major Roads
Minor Roads - Flexible
-60
-40
-20
0
20
40
5 15 25
Age
Res
idua
ls
35
Figure 10. Residual Plot for Minor Roads – Flexible Type
27
28
Minor Roads - Flexible Deep Granular
-40-30-20-10
010203040
5 15 25
Age
Res
idua
ls
35
Figure 11. Residual Plot for Minor Roads – Flexible Deep Granular Type
Minor Roads - Stabilized
-100
-50
0
50
5 15 25 3
Age
Res
idua
l
5
Figure 12. Residual Plot for Minor Roads – Stabilized Type
Minor Roads - Stabilized Deep Granular
-40-30-20-10
0102030
5 15 25
Age
Res
idua
l
35
Figure 13. Residual Plot for Minor Roads – Stabilized Deep Granular Type
Minor Roads - Rigid
-30-20-10
0102030
5 15 25 3
Age
Res
idua
l
5
Figure 14. Residual Plot for Minor Roads – Rigid Type
29

30
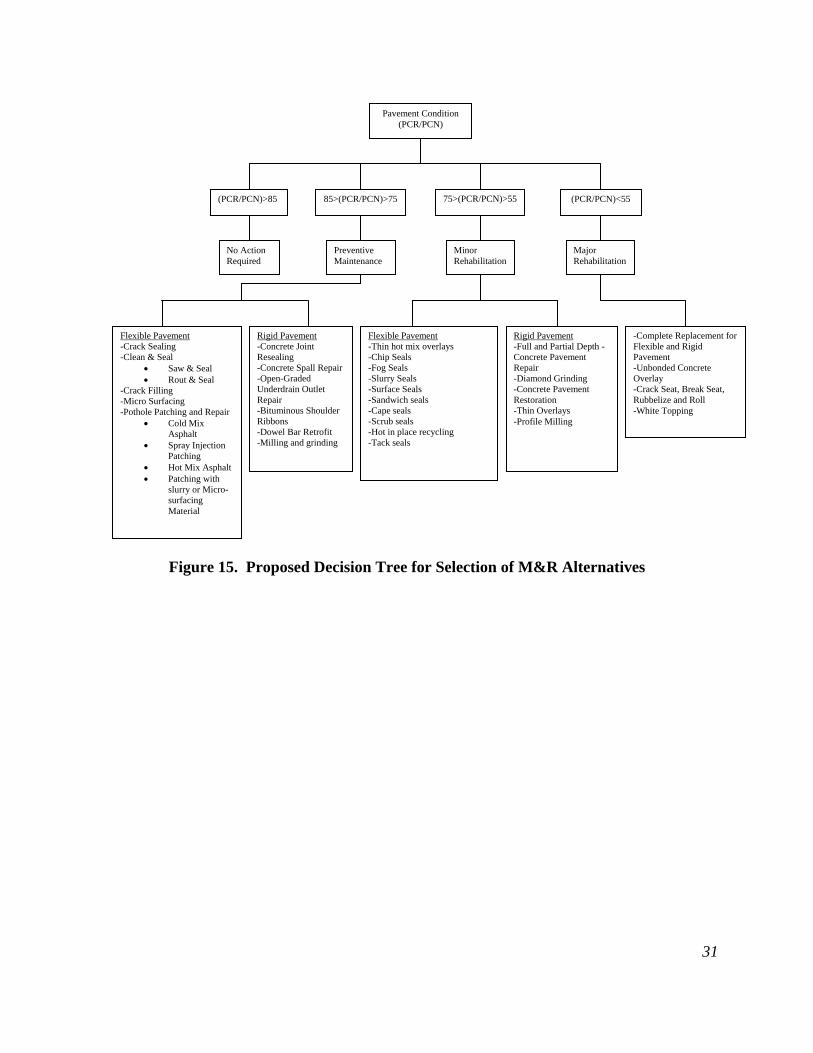
6. DECISION TREE
The objective of this task was to develop a decision tree to assist in the selection of a
reasonable maintenance or rehabilitation alternative for each project in the road network, based
on the condition of pavement and future expected performance. First, using a thorough review
of literature and practices followed by Ohio agencies, an exhaustive list of alternative treatments
was prepared. Then these alternative treatments were grouped into three categories namely,
preventive maintenance, minor rehabilitation, and major rehabilitation. A decision tree was
prepared, as illustrated in Figure 15.
It should be recognized that the decision tree presented can only assist the engineers at
the network level analysis, so as to assess total budget required to maintain the network at the
desired level. This should be followed by a project level analysis to determine the specific needs
of a pavement or group of pavements.
Pavement Condition (PCR/PCN)
Flexible Pavement -Crack Sealing -Clean & Seal
• Saw & Seal • Rout & Seal
-Crack Filling -Micro Surfacing -Pothole Patching and Repair
• Cold Mix Asphalt
• Spray Injection Patching
• Hot Mix Asphalt • Patching with
slurry or Micro-surfacing Material
85>(PCR/PCN)>75 75>(PCR/PCN)>55
Preventive Maintenance
Minor Rehabilitation
Major Rehabilitation
Rigid Pavement -Concrete Joint Resealing -Concrete Spall Repair -Open-Graded Underdrain Outlet Repair -Bituminous Shoulder Ribbons -Dowel Bar Retrofit -Milling and grinding
Flexible Pavement -Thin hot mix overlays -Chip Seals -Fog Seals -Slurry Seals -Surface Seals -Sandwich seals -Cape seals -Scrub seals -Hot in place recycling -Tack seals
Rigid Pavement -Full and Partial Depth -Concrete Pavement Repair -Diamond Grinding -Concrete Pavement Restoration -Thin Overlays -Profile Milling
-Complete Replacement for Flexible and Rigid Pavement -Unbonded Concrete Overlay -Crack Seat, Break Seat, Rubbelize and Roll -White Topping
(PCR/PCN)<55 (PCR/PCN)>85
No Action Required
Figure 15. Proposed Decision Tree for Selection of M&R Alternatives
31
32
7. SUMMARY, CONCLUSIONS AND RECOMMENDATIONS
The primary focus of this study was to develop pavement performance prediction models
for the City of Cincinnati. In addition, a decision tree was developed to suggest appropriate
maintenance and/or rehabilitation activities, based on the current condition of pavements.
The study began with an extensive review of literature designed to identify the factors
that affect the pavement condition, types of prediction models, modeling techniques and the
structure of decision trees developed by various highway agencies. Next, the data required to
develop performance models and the decision tree was acquired from the City of Cincinnati’s
pavement inventory database. Based on a review of the data, initially the following variables
were considered:
• Age of the pavement sections
• Functional classification of the roads
• Pavement type and composition
Age was calculated for each pavement section as the number of years since construction or last
major rehabilitation. The entire data obtained from the city’s records was divided into two
classifications: major roads and minor roads. Major roads are arterial highways, state highways
and freeways passing through the city. These roads are typically funded and periodically
monitored by ODOT. Minor roads consist of secondary and residential streets. The functional
classification also reflects the type and amount of traffic carried by the roads: major roads
subjected to medium to heavy traffic while minor roads generally receive low and occasionally
medium traffic.
33
While extracting the pavement condition data vital for the development of the
performance models, it became evident that there was a basic incompatibility between the
condition rating data for the two functional classifications. That is, the available pavement
condition data for major roads-which was collected by ODOT--was in terms of Pavement
Condition Rating (PCR), while the condition data for the minor roads-collected by Cincinnati’s
private consultant--was expressed as a Pavement Condition Number (PCN). Unfortunately,
there was no way of relating these two different summary statistics. Hence, regression analysis
was performed and two pavement performance models were developed (one for each type of
functional classification) using available data, with age as the independent variable and the
condition indicator being the dependent variable. A moderate correlation was obtained for the
major roads. However, the model for minor roads yielded a low value of R2 indicating a weak
correlation. In order to improve the accuracy of the model, it was decided to further investigate
the effect of pavement type and composition. The results are presented in section 4 of the report.
In conclusion, this study resulted in a set of pavement performance prediction models for
the city of Cincinnati based on the available historical data. A decision tree has been developed
to identify the appropriate maintenance and rehabilitation activities based on the condition of the
pavement. The city engineers can use these models in conjunction with their pavement
management system to predict the future condition of the highway network in Cincinnati and to
implement cost effective pavement management solutions. Using the methodology developed in
this study, the engineers can also improve the accuracy of the models in the future by updating
the database.
An important finding of this study is an understanding of data collection needs by the
local agencies in Ohio and type of interaction required between ODOT and the local agencies.

34
Cincinnati and similar agencies have been collecting systematic pavement condition data for
many years. Often, the agencies use private consultant services to establish a pavement
management system, data collection procedures and even to collect data and maintain the
database. In such cases, the pavement management systems are proprietary products and are not
necessarily compatible with ODOT’s or other agencies in Ohio. In the event a city replaces the
consultant as it happened in Cincinnati, there will be no compatibility between the existing and
new system, resulting in non-utilization of previous work. Currently, ODOT has been collecting
a fair amount of data on all major roads in the State and selected minor roads through their local
program. However, these efforts are not truly coordinated with the cities. As a case study, it can
be seen that Cincinnati’s efforts were not compatible with ODOT’s. The state roads were
monitored for condition evaluation by both ODOT and the city, but in different ways. To make
these efforts more productive it is recommended that the State and all local agencies in Ohio
establish an improved communication and a uniform pavement management practice, so it can
significantly benefit all agencies in general and ODOT’s urban paving program in particular.
8. IMPLEMENTATION PLAN
This research presents a set of pavement performance prediction models designed to
predict future pavement conditions for the urban highway network in the City of Cincinnati. The
models have been developed using historic data available with the city and hence represent
Cincinnati’s past and near future pavement management practices. When integrated with a
pavement management system, these models can help City’s engineers and planners to perform
various tasks including remaining life estimation, life-cycle-cost analysis, detailed inspection
scheduling, planning of needed works, development and optimization of budget plans and

35
optimization of network pavement condition. In essence, the prediction models can assist the
engineers and planners to predict condition of individual pavement section and subsequently the
entire network in future years, leading to efficient pavement management decisions.
The first step in the implementation is the development of a database from which data
can easily be accessed. The database should be designed in such a way that identification of
pavement family, age of pavement, type of surface, functional classification of road, type of
maintenance treatments provided in the past, and other relevant information about pavement
sections can easily be identified. It is important that the information about pavement sections be
kept current and be frequently updated. Next, the performance models need to be integrated with
City’s pavement management system. Cincinnati has recently acquired the services of a private
consultant to set up a pavement management system. A meeting should be held with the
pavement management engineers, construction engineers and the consultants to exchange and
discuss the integration of performance models. Such an interaction would allow the city and the
consultants to identify the changes to be made in the software package. Many pavement
management system software packages provide default models and coefficients for use in cases
where models may not be available. The use of prediction models developed in this study in
place of default models or coefficients is expected to result in more reliable predictions.
36
REFERENCES
1. National Highway Institute. (1998). “Pavement Management System Workshop,
Participants Workbook”. First edition, HI-97-024. U.S. Department of Transportation
and FHWA.
2. Infrastructure Management Systems. “City of Cincinnati’s IMS Pavement
Management Software, User’s Guide.”
3. Miscellaneous Correspondence with the City of Cincinnati, 1998-2003
4. Visual Pavement Evaluation and Recording System, a system developed and
implemented by the City of Cincinnati, 2000
5. http://www.apwa.net/About/SIG/MicroPaver/index.asp
6. Software Catalog of Selected Pavement Management Software for Local
Transportation Agencies, January 1997
7. http://www.dot.state.oh.us/News/2000/1-21-00.htm
8. http://www.dot.state.oh.us/divplan/research/manual/rd%20manual.htm
9. http://www.dot.state.oh.us/pavement/PavementManagement/LocalPCR.htm
10. Haas, R., Hudson, W.R., and Zaniewski, J, “Modern Pavement Management”,
Krieger Publishing Company, Malabar, Florida,1994
11. Pavement Management Analysis, Multi-Year Prioritization, Demonstration Project
108, Publication No. FHWA-SA-97-071, Office of Engineering, Office of
Technology Applications, FHWA
12. Raja Shekaran. A, (1996). “Modeling of Pavement Deterioration by Regression and
Artificial Neural Networks”, thesis presented to The University of Mississippi at
37
Oxford, MS, in partial fulfillment of the requirements for the degree of Doctor of
philosophy.
13. Ohio Department of Transportation, Pavement design and Rehabilitation Manual,
1999
14. Pavement Forecasting Models, Research in Progress conducted by the University of
Toledo for the Ohio Department of Transportation
15. Pavement Condition Rating System, Report No. FHWA/OH-99/004, Resource
International, Inc., May 1999