Embed Size (px)
Citation preview

Measuring confidence in academic study:
A summary report
Paul Sander and Lalage Sanders
University of Wales Institute, Cardiff
U. K.
Measuring confidence in academic study: A summary report.
Electronic Journal of Research in Educational Psychology and Psychopedagogy, 1 (1), 1-17 . ISSN: 1696-2095 - 2 -
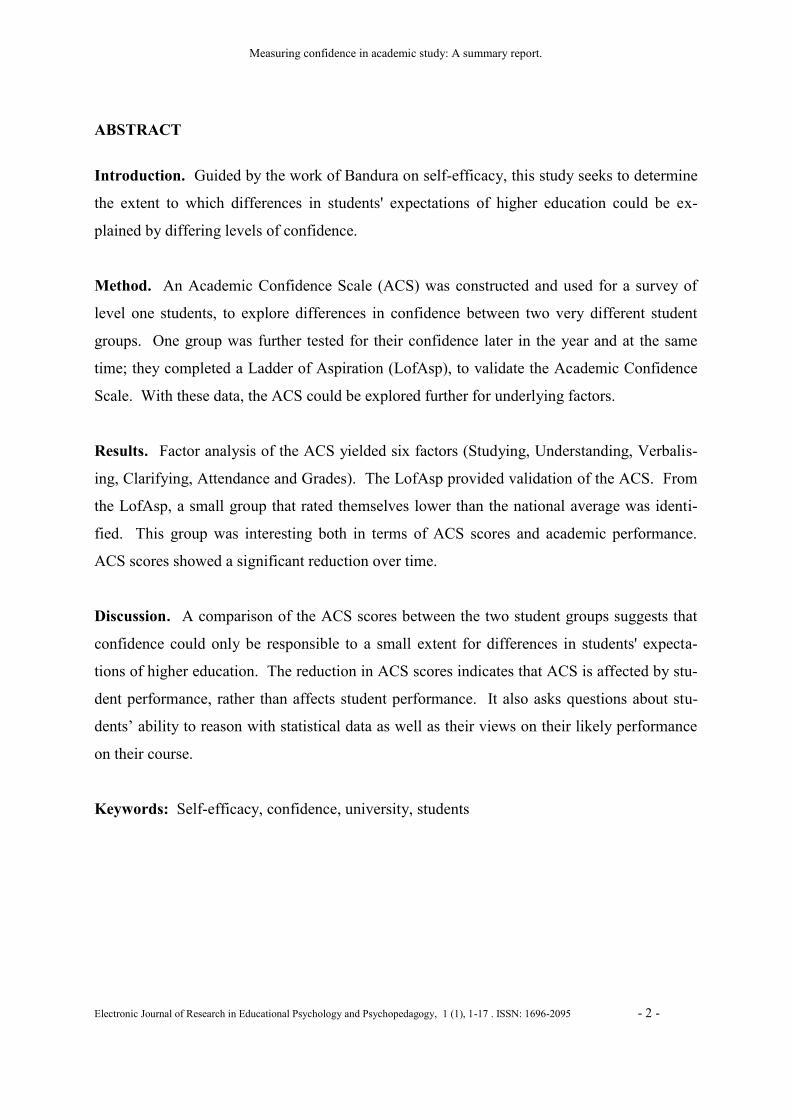
ABSTRACT
Introduction. Guided by the work of Bandura on self-efficacy, this study seeks to determine
the extent to which differences in students' expectations of higher education could be ex-
plained by differing levels of confidence.
Method. An Academic Confidence Scale (ACS) was constructed and used for a survey of
level one students, to explore differences in confidence between two very different student
groups. One group was further tested for their confidence later in the year and at the same
time; they completed a Ladder of Aspiration (LofAsp), to validate the Academic Confidence
Scale. With these data, the ACS could be explored further for underlying factors.
Results. Factor analysis of the ACS yielded six factors (Studying, Understanding, Verbalis-
ing, Clarifying, Attendance and Grades). The LofAsp provided validation of the ACS. From
the LofAsp, a small group that rated themselves lower than the national average was identi-
fied. This group was interesting both in terms of ACS scores and academic performance.
ACS scores showed a significant reduction over time.
Discussion. A comparison of the ACS scores between the two student groups suggests that
confidence could only be responsible to a small extent for differences in students' expecta-
tions of higher education. The reduction in ACS scores indicates that ACS is affected by stu-
dent performance, rather than affects student performance. It also asks questions about stu-
dents’ ability to reason with statistical data as well as their views on their likely performance
on their course.
Keywords: Self-efficacy, confidence, university, students
Paul Sander and Lalage Sanders
Electronic Journal of Research in Educational Psychology and Psychopedagogy, 1 (1), 1-17. ISSN: 1696-2095 - 3 -
INTRODUCTION
Confident, according to the Oxford English Dictionary (1989) is ‘having strong belief,
firm trust, or sure expectation; feeling certain, fully assured, ‘self-reliant, bold; sure of one-
self, one's cause, etc.; having no fear of failure’. Experience tells us that confidence differs
between people in the same situation and that people have differing levels of confidence in
different situations. Thus someone who is highly confident in a familiar setting, for example,
may lose confidence in an unfamiliar and challenging environment. The study reported here
originates firstly from the work by Bandura (e.g. 1977, 1993) on concept of self-efficacy, and
secondly from a study on students’ perceptions of university teaching (Sander et al, 2000).
This research details the development of a scale to measure one specific form of confidence,
namely academic confidence.
Self-efficacy has been defined (Bandura, 1986, page 391), as “people’s judgements of
their capabilities to organise and execute courses of action required to attain designated types
of performance” and stems from four sources: mastery experience, vicarious experience, ver-
bal persuasion and physiological states (Bandura, 1977). Self-efficacy can also be seen as the
confidence that people have in their ability to do the things that they try to do (Pajares, 2000).
Thus self-efficacy can be seen as a product of a reflexive loop between the individual and
their environment: successful experience resulting in higher levels of self-efficacy.
Self-efficacy scales have been applied to educational research, primarily in studies of
academic motivation and self-regulation (Pajares, 1997, 2002). Self-efficacy influences the
choices people make in specific situations, such as whether to start a task. It influences the
effort people put into tasks and their persistence, especially when the “going gets tough”.
Furthermore, self-efficacy has not only a psychological effect, but also a physiological effect,
affecting, for instance, anxiety levels (Pajares, 2002). In summary, self-efficacy research has
helped to tease out the contributions that ability and self-confidence in one’s ability makes to
academic success and in careers beyond education (Crozier, 1997).
Why develop a measure of academic confidence?
There is, therefore, a wealth of empirical evidence showing that self-efficacy affects
academic performance, as part of its general effect on behaviour. However this blanket effect
may obscure some more specific differences that could be applicable to educational settings,

Measuring confidence in academic study: A summary report.
Electronic Journal of Research in Educational Psychology and Psychopedagogy, 1 (1), 1-17 . ISSN: 1696-2095 - 4 -
in particular in higher education, where the autonomy and independence of the student are
essential to success (witness the key components of the contemporary interest in the concept
of 'graduateness'.) In this context, a new construct distinct from its parent concept, self-
efficacy, was suggested, a construct that we termed “academic confidence”.
Originally, academic confidence was hypothesised as explaining some interesting
group differences in an earlier study (Sander et al, 2000). This study examined the expecta-
tions of two groups of UK university students; one group comprised medical students in a
traditional university and the other psychology students in a new university. One aspect of
the results was the striking differences in reasons given by students for not liking role-play
and student presentations as methods of teaching. Essentially, the medical students were wor-
ried that these were not effective methods, whereas the psychology students were worried
about their own competence to do them (see also Sander and Stevenson 2002, Stevenson and
Sander, 2002). The possibility of academic confidence as an explanation for this difference
arose from an examination of the differing entry profiles of the two groups. The medical stu-
dents had an average A-level point score of 27.8, in contrast to 15.0 for the psychology stu-
dents, (using the standard pre 2002 UCAS formula for assigning A level points, where A =10,
B=8, C=6, D=4, E=2 and AS grades assigned half value points e.g. an A grade AS level =5).
Academic confidence is conceptualised as being how students differ in the extent to
which they have a ‘strong belief, firm trust, or sure expectation’ of what university has to of-
fer. As part of its parent concept, self-efficacy, academic confidence may stem from the same
four sources: mastery experience, vicarious experience, verbal persuasion and physiological
states. It is likely to be subject to change as experience impinges upon expectation. The
question becomes to what extent may it predict the nature of that experience? McLean (2001),
in a study of medical students found that learning style was clearly associated with academic
performance. How might academic confidence interact with learning styles? Could it have a
role to play in predicting academic performance?
Academic confidence, therefore, is proposed as a mediating variable between the indi-
vidual’s inherent abilities, their learning styles and the opportunities afforded by the academic
environment of higher education.
In order to explore this further it was necessary to develop an instrument to measure
this specific construct. As the notion of academic confidence has its theoretical foundations

Paul Sander and Lalage Sanders
Electronic Journal of Research in Educational Psychology and Psychopedagogy, 1 (1), 1-17. ISSN: 1696-2095 - 5 -
in Bandura’s work on self-efficacy, the guidelines for measuring self-efficacy are taken to be
equally applicable in measuring academic confidence.
METHOD
Level 1 students were surveyed at two points in the academic year. In induction week
(time 1), psychology students and medical students, at two different universities, completed
an Academic Confidence Scale (ACS, see appendix 1) that had already been tested for ac-
ceptable internal reliability. At the end of the Easter term (time 2), the same group of psy-
chology students were invited to complete the ACS for a second time, along with a validation
task, the Ladder of Aspiration (LofAsp, see appendix 2), based on the work of Cantrill (1965)
and Sanders (1987).
Results
At time 1, 102 psychology students and 182 medical students completed the ACS.
The average A level points for the medical students were 32.04 (sd=3.88) in comparison with
the psychology students, whose average A level points were 17.41 (sd=3.78). At time 2, at
the end of the Easter term, 88, psychology students responded to the ACS and LofAsp, 81 of
whom had completed the ACS in the first phase.
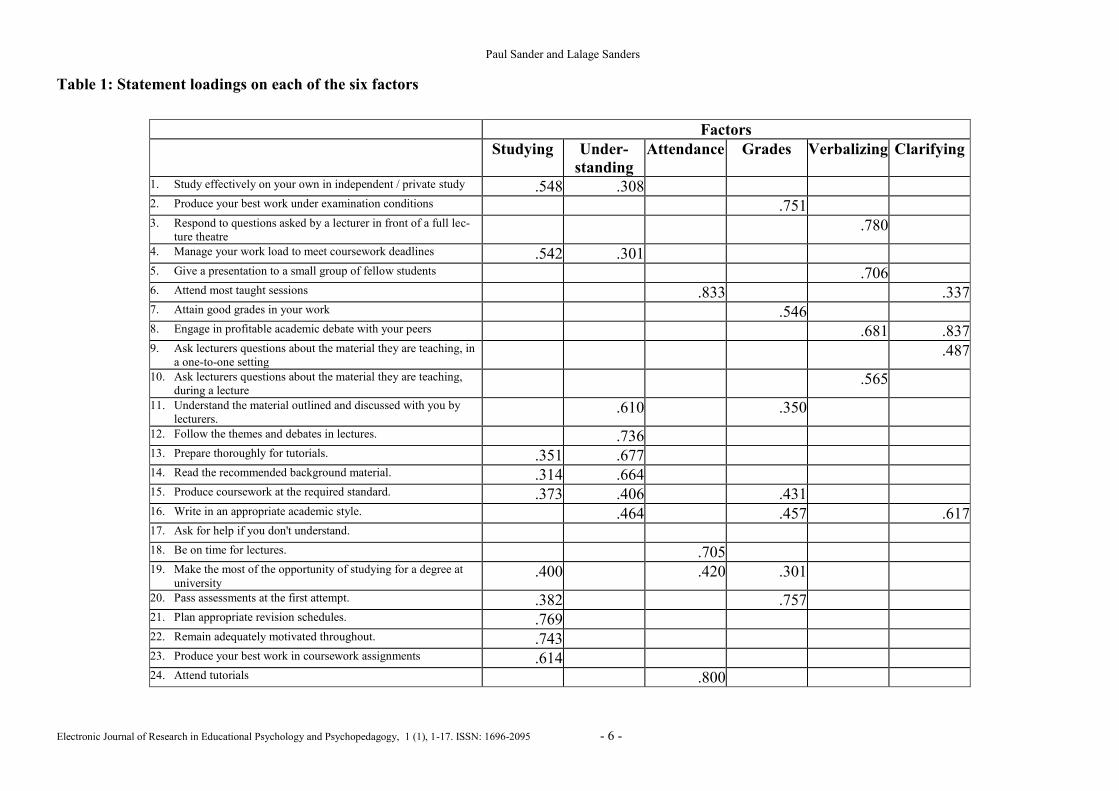
From the first phase of the study, the responses from both sets of students to the ACS
were factor analysed which yielded factors of: Studying, Understanding, Verbalising, Clarify-
ing, Attendance and Grades (Table 1). As shown, in table 1, the statements that comprised
the ACS did not, generally load onto just one factor, suggesting that it would not be accept-
able to look at differences between the two groups of students for each of these factors. How-
ever, there was a significant difference between the medical students and the psychology stu-
dents for mean ACS score (t=1.784, df=262, p<0.05, one tailed). A one-tailed test was felt to
be acceptable, as the Sander et al (2000) study had predicted that there would be greater aca-
demic confidence in the medical students. To further explore the differences in academic
confidence between the medical students and the psychology students, differences for each of
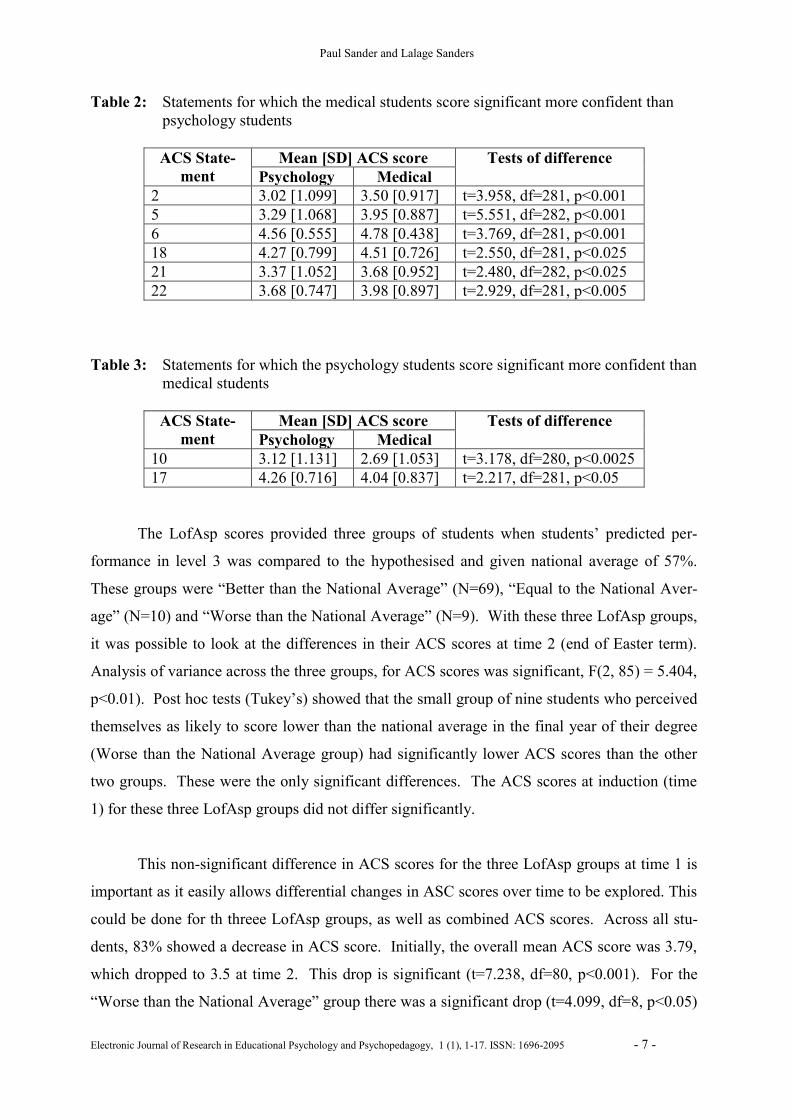
the 24 statements in the ACS were examined using t-tests. This showed that the medical stu-
dents had significantly higher scores for statements 2, 5, 6, 18, 21, 22 (table 2). In contrast,
the psychology students had significantly higher scores for statements 10 and 17 (table 3),
which explains the small difference between the two student groups for overall ACS score.

Paul Sander and Lalage Sanders
Electronic Journal of Research in Educational Psychology and Psychopedagogy, 1 (1), 1-17. ISSN: 1696-2095 - 6 -
Table 1: Statement loadings on each of the six factors
Factors
Studying Under-
standing
Attendance Grades Verbalizing Clarifying
1. Study effectively on your own in independent / private study .548 .308 2. Produce your best work under examination conditions .751 3. Respond to questions asked by a lecturer in front of a full lec-
ture theatre .780
4. Manage your work load to meet coursework deadlines .542 .301 5. Give a presentation to a small group of fellow students .706 6. Attend most taught sessions .833 .337 7. Attain good grades in your work .546 8. Engage in profitable academic debate with your peers .681 .837 9. Ask lecturers questions about the material they are teaching, in
a one-to-one setting .487
10. Ask lecturers questions about the material they are teaching,
during a lecture .565
11. Understand the material outlined and discussed with you by
lecturers. .610 .350
12. Follow the themes and debates in lectures. .736 13. Prepare thoroughly for tutorials. .351 .677 14. Read the recommended background material. .314 .664 15. Produce coursework at the required standard. .373 .406 .431 16. Write in an appropriate academic style. .464 .457 .617 17. Ask for help if you don't understand. 18. Be on time for lectures. .705 19. Make the most of the opportunity of studying for a degree at
university .400 .420 .301
20. Pass assessments at the first attempt. .382 .757 21. Plan appropriate revision schedules. .769 22. Remain adequately motivated throughout. .743 23. Produce your best work in coursework assignments .614 24. Attend tutorials .800

Paul Sander and Lalage Sanders
Electronic Journal of Research in Educational Psychology and Psychopedagogy, 1 (1), 1-17. ISSN: 1696-2095 - 7 -
Table 2: Statements for which the medical students score significant more confident than
psychology students
ACS State-
ment
Mean [SD] ACS score Tests of difference
Psychology Medical
2 3.02 [1.099] 3.50 [0.917] t=3.958, df=281, p<0.001
5 3.29 [1.068] 3.95 [0.887] t=5.551, df=282, p<0.001
6 4.56 [0.555] 4.78 [0.438] t=3.769, df=281, p<0.001
18 4.27 [0.799] 4.51 [0.726] t=2.550, df=281, p<0.025
21 3.37 [1.052] 3.68 [0.952] t=2.480, df=282, p<0.025
22 3.68 [0.747] 3.98 [0.897] t=2.929, df=281, p<0.005
Table 3: Statements for which the psychology students score significant more confident than
medical students
ACS State-
ment
Mean [SD] ACS score Tests of difference
Psychology Medical
10 3.12 [1.131] 2.69 [1.053] t=3.178, df=280, p<0.0025
17 4.26 [0.716] 4.04 [0.837] t=2.217, df=281, p<0.05
The LofAsp scores provided three groups of students when students’ predicted per-
formance in level 3 was compared to the hypothesised and given national average of 57%.
These groups were “Better than the National Average” (N=69), “Equal to the National Aver-
age” (N=10) and “Worse than the National Average” (N=9). With these three LofAsp groups,
it was possible to look at the differences in their ACS scores at time 2 (end of Easter term).
Analysis of variance across the three groups, for ACS scores was significant, F(2, 85) = 5.404,
p<0.01). Post hoc tests (Tukey’s) showed that the small group of nine students who perceived
themselves as likely to score lower than the national average in the final year of their degree
(Worse than the National Average group) had significantly lower ACS scores than the other
two groups. These were the only significant differences. The ACS scores at induction (time
1) for these three LofAsp groups did not differ significantly.
This non-significant difference in ACS scores for the three LofAsp groups at time 1 is
important as it easily allows differential changes in ASC scores over time to be explored. This
could be done for th threee LofAsp groups, as well as combined ACS scores. Across all stu-
dents, 83% showed a decrease in ACS score. Initially, the overall mean ACS score was 3.79,
which dropped to 3.5 at time 2. This drop is significant (t=7.238, df=80, p<0.001). For the
“Worse than the National Average” group there was a significant drop (t=4.099, df=8, p<0.05)

Measuring confidence in academic study: A summary report.
Electronic Journal of Research in Educational Psychology and Psychopedagogy, 1 (1), 1-17 . ISSN: 1696-2095 - 8 -
as well as for the “Greater than the National Average” group (t=6.161, df=62, p<0.001). There
was no significant change for the “Equal to the National Average group”.
The “Worse than the National Average” group was interesting in other ways, too. Four
had left the course by the end of level 1; all but one had resit assessments from semester 1;
four had “mitigating circumstances” presented to the semester 1 exam board and; one had to
be counselled on the request of the exam board. These nine students scored around 7% less in
their overall semester 1 assessments, but they were not significantly lower in A level points,
nor was there a significant difference in age in this group of students, compared to the other
two groups.
Seventy-eight percent of students who completed the ACS at time 2 thought that they
would perform better than the National Average, of whom, 3 thought that they would get a
mark in excess of 87%!
Interestingly, correlations between the average grade for semester 1 and each of the 24
ACS statements from both time 1 and time 2, for the psychology students, yielded just three
statements, 2, 20 and 21 that were significant (table 4), all from the ACS scores at time 2.
Correlations between pre-university performance (GCSE scores and A level points) and ACS
scores at time 1 and time 2 and average semester grade were computed. There was no signifi-
cant correlation between ACS scores and pre-university performance measures. However, A
level points did correlate with average semester 1 grades (r=0.344, n=68, p<0.005).
Table 4: Statements for which there was a significant correlation, for the psychology stu-
dents, between time 2 ACS score and average semester 1 grades
ACS Statement Correlation
2 r=0.243, n=88, p<0.025
20 r=0.307, n=88, p<0.005
21 r=0.230, n=88, p<0.05

Paul Sander and Lalage Sanders
Electronic Journal of Research in Educational Psychology and Psychopedagogy, 1 (1), 1-17. ISSN: 1696-2095 - 9 -
DISCUSSION
The differences in ACS scores for the LofAsp groups is taken as good evidence of the
validity of the ACS. In contrast to research on self-efficacy and academic performance, it
would seem that the ACS scores from the students used in these studies were affected by aca-
demic performance, rather than predicting academic performance. This is evidenced by the
significant correlations between the average grade for semester 1 and statements 2, 20 and 21
from the ACS, each of which directly relates to examination performance. There was no cor-
relation between any of the ACS statements at time 1 and semester 1 performance, which
would seem to rule out the use of the ACS as a diagnostic tool at the start of a course, or as a
measure for admission’s purposes.
One of the key features of self-efficacy theory is that self-efficacy is specific to particu-
lar situations (Pajares, 1996). There can be no meaningful measure of global self-efficacy.
That the ACS scores from time 1 do not correlate with later performance indicators, whether
average semester grades or LofAsp predictions, suggests that the academic environment in
university is, for the student, quite different than the school or college environment that they
have just left. The drop in ACS during the first year of study also points to the university en-
vironment as a new environment in which the student has to develop a level of confidence.
The fact that there was a significant correlation between A level points and semester 1 grades
(for the psychology students – the only group for which the level 1 grades was available), but
not between A level points and ACS scores at time 1 or time 2, or between ACS scores at ei-
ther time and average semester 1 grades, suggests that students, in rating their academic confi-
dence, are judging something broader than academic performance as measured by marks
awarded for assessed work.
The decrement in ACS score between time 1 and time 2, though, leads to the interest-
ing Gung-Ho! hypothesis. This hypothesis predicts that students enter university, or at least
the university that these psychology students came to, with unrealistic expectations that get
lowered through adverse experiences on the course. When the differential affect of LofAsp
group and ACS score changes over time is considered, it may well be that the Gung Ho! Hy-
pothesis only relates to the “Better than the National Average” group and not the “Worse that
the National Average” group. That there was no significant drop for the “Same as the Na-
tional Average” group, is quite reassuring as estimating likely level 3 performance as equal to

Measuring confidence in academic study: A summary report.
Electronic Journal of Research in Educational Psychology and Psychopedagogy, 1 (1), 1-17 . ISSN: 1696-2095 - 10 -
the National Average is probably the safest thing to do in the LofAsp test situation. There is
no reason to believe that Gung-Ho! would be more applicable to psychology students than
medical students, but there was no ACS data from time 2 for the medical students to explore
this further. The Gung-Ho! hypothesis is particularly interesting and could be explored in a
longitudinal study that monitored changes in ACS scores over the duration of a degree course.
The ACS would appear to be sufficiently sensitive to be used to monitor the impact of
teaching / learning innovations on a course, or to identify students in a large cohort, who could
benefit from advise, guidance or encouragement, with the aim of boosting their academic con-
fidence. It could also be useful for the teaching team to be aware of students who would seem
to be highly, and perhaps overly, confident in their academic studies.
The prediction that the differences between medical and psychology student groups on
perceptions of university teaching could be attributable to different confidence levels (Sander
et al, 2000) is only weakly supported. The medical students were more confident for overall
ACS scores, although, given that the average A level points for the medical students is getting
on for twice that of the psychology students, it is surprising that there was not a greater differ-
ence. In all, there were no significant differences between these two student groups for 16
statements in the ACS. The six statements that the medical students scored significantly more
confident on, suggest, perhaps, a general attribute of diligence (see Bernard and Schuttenberg,
1985; Covington, Spratt and Omelich, 1980) in these students. The two statements for which
the psychology students scored higher, suggests a greater confidence in asking for help in
these students who have the substantially lower entry qualifications. If so, the place of these
two statements in the ACS should be considered.
The small difference between the medical and psychology groups could also be be-
cause the ACS statements were worded in a way that did not measure confidence in perform-
ance at an absolute level, which the LofAsp did. Rather, the ACS could have been measuring
confidence more in relation to students' aspirations. Also, the ACS covers a much broader
spectrum of issues relating to academic performance. Had the medical students completed the
Lofsp, a substantial difference in predicted level 3 performance might have been observed.

Paul Sander and Lalage Sanders
Electronic Journal of Research in Educational Psychology and Psychopedagogy, 1 (1), 1-17. ISSN: 1696-2095 - 11 -
Another issue relating to the validation of the ACS by the LofAsp concerns the genera-
tion of the ACS statements. These were generated by teachers with many years of teaching
experience, which arguably, presents a view of academic confidence as seen by an out group
of teachers, than by the in-group of students themselves. It might be profitable to try and un-
derstand academic confidence from the students’ perspective as it is possible that academic
confidence, as seen by students, might well be different. Scenarios could be compiled, depict-
ing a confident student, or a student lacking in confidence. Students could then be asked to
identify aspects of the behaviour of students in the scenarios, which could reveal students’
thinking about academic confidence. The out-group, teacher’s perspective and the in-group,
student’s perspective could be compared and its impact on the structure and content of ACS
considered.
Further research is aimed at understanding the relationship between the ACS factors
and academic confidence. To pursue this, the wording of statements would have to be refined
to develop a psychometric tool that had statements loading onto just one factor of the six fac-
tors of the ACS. It would be interesting to see how the different LofAsp groups and students
from different academic subjects, like medicine and psychology, perform on any resultant sub-
scales.
Finally, the responses to the LofAsp gave insight into the way in which students, who
had at least one semester’s training in research methods and statistics, use statistical data. In
this study, students were asked to estimate their likely performance against an average per-
centage score, described as the National Average. Experience would suggest that 78% of the
participants on the psychology course used in this study would not really get a final grade
higher than a national average. There is, though, a large research literature from diverse areas
of psychology, which shows that people are not good at using statistical data, even when they
have been trained to think statistically. For example, in the area of health psychology, unreal-
istic optimism has been offered as an explanation for various types of behaviour, including
poor health (Sissons and Carter 1996). Linked to this may well be people’s desire not to see
themselves as average.

Measuring confidence in academic study: A summary report.
Electronic Journal of Research in Educational Psychology and Psychopedagogy, 1 (1), 1-17 . ISSN: 1696-2095 - 12 -
CONCLUSION:
There is good statistical evidence for the validity of the ACS and good statistical evi-
dence to believe that there are six factors, although intuitively and statistically, some of the
factors seem to more directly linked to academic confidence than others. Further work could
consider the place of statements 10 and 17 in the ACS and the refinement of the ACS to pro-
duce sub-scales.
Overall, there is good reason to believe that the ACS could be used to identify students
who are coping less well with a course. It is could also be that the ACS is sufficiently valid
and sensitive to be used to explore the impact of different or innovative teaching and learning
methods, like assessed and non-assessed student presentations.
Whilst there is a significant difference in ACS scores between the medical students and
psychology students for Studying, Attendance and Clarifying, it is felt that the qualitative dif-
ferences between these two groups require further investigation and explanation.

Paul Sander and Lalage Sanders
Electronic Journal of Research in Educational Psychology and Psychopedagogy, 1 (1), 1-17. ISSN: 1696-2095 - 13 -
REFERENCES
Bandura, A. (1977). Self-Efficacy: Toward a Unifying Theory of Behavioural Change. Psy-
chological Review, 84, 2, 191-215.
Bandura, A. (1986). Social Foundations of Thought and Action. London, Englewood Cliffs.
Bandura, A, (1993). Perceived Self-efficacy in Cognitive Development and Functioning.
Educational Psychologist, 28, 2, 117-148.
Bandura, A., (2001). Guide for Constructing Self-Efficacy Scales (revised March 2001).
Available online from Frank Pajares, Emory University, ([email protected]), refer-
enced in
http://www.emory.edu/EDUCATION/mfp/efftalk.html
Bernard, H. and Schuttenberg, E. (1995). Development of the Diligence Inventory-Higher
Education Form. Journal of Research and Development in Education, 28, 2, 91 – 100.
Cantrill, H. (1965). The Pattern of Human Concerns. Rutgers University Press, New Bruns-
wick.
Covington, M., Spratt, M. and Omelich, C. (1980). Is Effort Enough or Does Diligence Count
Too? Student and teacher Reactions to Effort Stability in Failure. Journal of Educa-
tional Psychology, 72, 6, 717-729.
Crozier, R. (1997). Individual Learners: personality differences in education. London,
Routledge.
McLean, M. (2001). Can we Relate Conceptions of Learning to Student Academic Achieve-
ment? Teaching in Higher Education, 6, 3, 399-413.
Pajares, F. (1996). Assessing self-efficacy beliefs and academic outcomes: The case for speci-
ficity and correspondence. Paper presented to the annual meeting of the American Edu-
cational research Association, New York. Accessed on line (11/9/01), from
http://www.emory-edu/EDUCATION/mfp/aera2.html
Pajares, F. (1997). Current Directions in Self-efficacy Research, in M Maehr and PR Pintrich
(eds), Advances in motivation and achievement, 10, 1-49. Accessed on line (07/05/02)
from http://www.emory.edu/EDUCATION/mfp/effchapter.html.
Pajares, F. (2000). Frank Pajares on Nurturing academic confidence. Emory Report, Feb 14,
52, 21. Accessed on line (03/05/02) from
http://www.emory.edu/EMORY_REPORT/errarchive/2000/February…/2_14_00pajares.
html
Pajares, F. (2002). Self-Efficacy Beliefs in Academic Contexts: An Outline. Accessed on line
(31/05/02) from http://www.emory.edu/EDUCATION/mfp/efftalk.html
Measuring confidence in academic study: A summary report.
Electronic Journal of Research in Educational Psychology and Psychopedagogy, 1 (1), 1-17 . ISSN: 1696-2095 - 14 -
Sander, P. and Stevenson, K. (2002). Why we don’t like student presentations: the students
speak. The Psychologist in Wales (Newsletter of the Welsh Branch of the British Psy-
chological Society), 14, 3-12.
Sander, P., Stevenson, K., King, M. and Coates, D. (2000). University Students’ Expectations
of Teaching. Studies in Higher Education, 25, 3, 309 - 323
Sanders, L. (1987). Images of Health: a study of health behaviour and somatic concern. Un-
published PhD thesis, University of Cardiff.
Sissons, J. and Carter, W. (1996). Unrealistic optimism – an East-West comparison. Paper
presented at the Annual Conference for the Special Group in Health Psychology (British
Psychological Society), York.
Stevenson, K. and Sander, P., (2002). Medical students are from Mars – business and psy-
chology students are from Venus – University lecturers are from Pluto. Medical
Teacher, 24, 1, 27-31.

Paul Sander and Lalage Sanders
Electronic Journal of Research in Educational Psychology and Psychopedagogy, 1 (1), 1-17. ISSN: 1696-2095 - 15 -
Appendix 1 How confident are you that you will be able to:
1. Study effectively on your own in independent / private
study
Ver Very Not at all confident confident 0 0 0 0 0
2. Produce your best work under examination conditions Very Not at all confident confident 0 0 0 0 0
3. Respond to questions asked by a lecturer in front of a
full lecture theatre
Very Not at all confident confident 0 0 0 0 0
4. Manage your work load to meet coursework deadlines Very Not at all confident confident 0 0 0 0 0
5. Give a presentation to a small group of fellow students Very Not at all confident confident 0 0 0 0 0
6. Attend most taught sessions Very Not at all confident confident 0 0 0 0 0
7. Attain good grades in your work Very Not at all confident confident 0 0 0 0 0
8. Engage in profitable academic debate with your peers Very Not at all confident confident 0 0 0 0 0
9. Ask lecturers questions about the material they are
teaching, in a one-to-one setting
Very Not at all confident confident 0 0 0 0 0
10. Ask lecturers questions about the material they are
teaching, during a lecture
Very Not at all confident confident 0 0 0 0 0
11. Understand the material outlined and discussed with
you by lecturers.
Very Not at all confident confident 0 0 0 0 0
12. Follow the themes and debates in lectures. Very Not at all confident confident 0 0 0 0 0
13. Prepare thoroughly for tutorials. Very Not at all confident confident 0 0 0 0 0
14. Read the recommended background material. Very Not at all confident confident 0 0 0 0 0
15. Produce coursework at the required standard. Very Not at all confident confident 0 0 0 0 0
16. Write in an appropriate academic style. Very Not at all confident confident 0 0 0 0 0
17. Ask for help if you don't understand. Very Not at all confident confident 0 0 0 0 0
18. Be on time for lectures. Very Not at all confident confident 0 0 0 0 0
19. Make the most of the opportunity of studying for a
degree at university
Very Not at all confident confident 0 0 0 0 0
20. Pass assessments at the first attempt. Very Not at all confident confident 0 0 0 0 0
21. Plan appropriate revision schedules. Very Not at all confident confident 0 0 0 0 0
22. Remain adequately motivated throughout. Very Not at all confident confident 0 0 0 0 0
23. Produce your best work in coursework assignments Very Not at all confident confident 0 0 0 0 0
24. Attend tutorials Very Not at all confident confident 0 0 0 0 0

Measuring confidence in academic study: A summary report.
Electronic Journal of Research in Educational Psychology and Psychopedagogy, 1 (1), 1-17 . ISSN: 1696-2095 - 16 -
Appendix 2
Now we are asking you to look ahead to think about what will be likely outcomes for you and your group for the next
three years of the course. That is, at the end of level 1 this summer, at the end of level 2 in 2003, and at the point of
graduation in 2004. To help you make this decision we have highlighted an average mark for psychology across all UK
Universities.
So using the table below, for each year please indicate:
1. What you think will be the average mark for your year group by writing 'YG'
2. What you think will be your own average mark by writing 'ME'
Grade Mark [%] Summer 2002
End of Level 1
Summer 2003
End of Level 2
Summer 2004
Graduation
A+ 95-100 90-94
A 85-89 80-84
A- 75-79 70-75
B+
69 68 67
B
66 65 64
B-
63 62 61 60
C+
59 58 57 Mean for psychology
C
56 55 54
C-
53 52 51 50
D+ 49 48 47
D 46 45 44
D-
43 42 41 40
F6 39 38 37
F5 36 35 34
F4
33 32 31 30
F3 25-29 20-24
F2 16-20 11-15
F1 5-10 0-4

- 17 -
{Blank page for matching different language versions}