Embed Size (px)
Citation preview

Performance Measurement and Case Studies at MSN
Paul Roy, Alex Polak, Gregory BershanskyMSN Performance & Reliability TeamMicrosoft
Velocity Web Performance & Operations Conference – June 2011

Performance Mission at MSN
Worldwide scope48 countries>500 million users (>100 million new users in last year)>20 billion monthly page views
Our mission is to make MSN the world’s fastest portal
Driving this mission requires a paradigm shift in how we measure performance and its impact

AgendaMeasuring performance and its impact
Performance metricsPerformance measurement systemsA/B testing
Performance case studies
Tips & Summary

Performance Metrics
Goal: Performance metrics directly represent a user’s perception of performance
“Good metrics drive good decisions, bad metrics drive bad decisions”

Our View of Perceived Performance
A user’s perception of web page performance is driven by two primary factors:
1. Rendering time for areas of greatest importance2. Response time to user interactions
Performance metrics need to focus onRendering and Responsiveness

Evolving Performance Metrics at MSNPast Today Current
DirectionsMeasure download time of all page resources
Measure download time of only visual resources
Measure rendering time and response time
Primary metrics Time to Last Byte
Primary metrics Time to Visual Content (w/ and w/o ads)
Secondary MetricsTime to First Byte, Onload,Page Bottom
Primary metrics Time to Render• First Render• Above Fold, Header,
Ads
Time to Respond• Scroll, Navigate,
Search Box interactions, etc.Poor representation of
perceived performanceFair representation of perceived performance
Direct representation of perceived performance Past
Today
Directions
Hidden Requests
Above Fold Area
Human viewInternal system view Paradigm Shift
Header
Ad

Measuring Rendering
What’s possible todayFirst Render from tools (HTTPWatch, DynaTrace, etc.)First Paint API in IE9 (extension to W3C Web Timing)Video analysis solutions (e.g., Webpagetest/Google Above Fold Time)
What we needTimings for First Render & Above Fold RenderHandle video and animated graphicsCross-browser solutionRendering metrics for different page regions
Different regions are of varying importance to the userE.g., search box, content vs. ads, Facebook News Feed vs. navigation area
Common methodology for real user & synthetic measurementsEase of use
Gap

Measuring Responsiveness
What’s possible today#notmuch
What we needMethodology, standardization, toolsTimings related to initial and continuous responsivenessCommon methodology for real user & synthetic measurementsEase of use
Gap

To browser makersStandardized cross-browser API’s for rendering timings
Whole page and different regions
To communityResearch and tools for measuring responsiveness
Call to Action

Measurement Systems
Goal: Comprehensive measurement capability acrossSynthetic and RUM systems

Requirements
• Measuring the real user experienceReal-User “Truth”
• Measuring rendering and responsivenessRendering and
Responsiveness
• Measuring global data center and network topologyGeo-Distributed Infrastructure
• Measuring competitor pagesCompetitive
• Measuring prototypes and internal milestones• Matrix testing (browsers, OS, hardware, network
bandwidth, ...)• In-depth analysis (traces, counters, profiling, …)
Engineering Cycle

Measurement Systems at MSNSynthetic
• Performance Lab• 3rd Party Agents (Keynote)
Real User Measurement (RUM)
• In-page & Server-side instrumentation• Browser Plug-in (toolbar)
Performance Lab 3rd Party Agents In-Page Browser Plug-in
Engineering Cycle
Real-User “Truth”
Rendering & Resp.
Geo-Distributed Infrastructure
Competitive
Call to Action (earlier slide)

Impact on business metrics is the ultimate truth of whether a change is worthwhile
A/B Testing

Measuring Business Impact at MSNA/B testing used to evaluate a change’s impact on business metrics
Subsets of user population receive different behavior/experiencesControl group vs. treatment group(s)Statistical power obtained through very large sample size
MSN business metrics (subset)Page Views, Page Clicks, Page CTRSearches to BingAd Impressions, Ad Clicks, Ad CTRUser satisfaction
Measuring Business Impact at MSN (cont.)
Small % improvements to business metrics make a difference in the aggregate
Even more so on an absolute basis at high scaleMSN: >20 billion monthly page views worldwide 1% improvement = >200 million page views
Performance metrics need to be excellent proxies for business metricsEnables prediction of how a change will affect the business

Caveat: your mileage may vary
Performance Case StudiesWhat worked….What didn’t
Case Study : Asynchronous jQuery LoadSituation
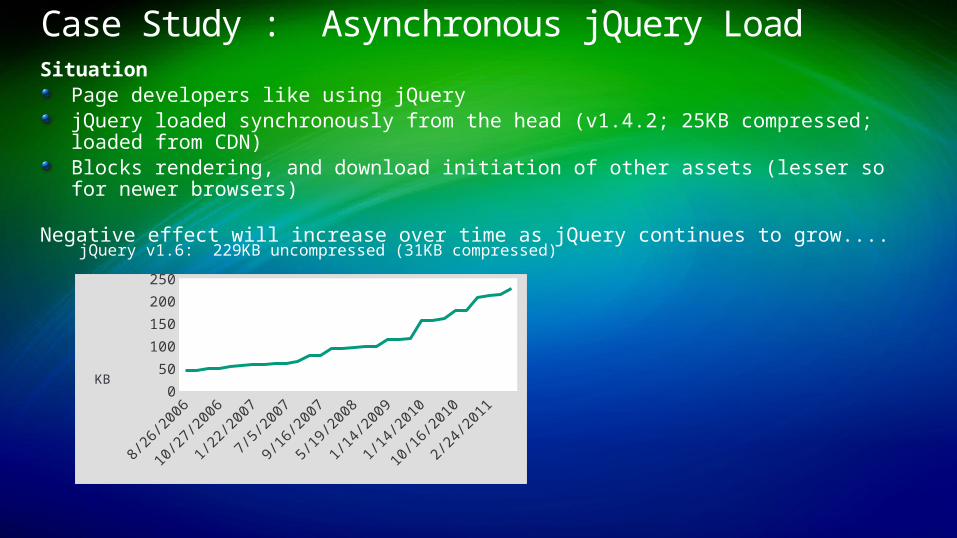
Page developers like using jQueryjQuery loaded synchronously from the head (v1.4.2; 25KB compressed; loaded from CDN)Blocks rendering, and download initiation of other assets (lesser so for newer browsers)
Negative effect will increase over time as jQuery continues to grow....
2006 2007 2008 2009 20100
50
100
150
200
250
KB
jQuery v1.6: 229KB uncompressed (31KB compressed)

Case Study : Asynchronous jQuery Load (cont.)
What We DidLoad jQuery asynchronouslyUse small “Early Stage JS” library for capabilities needed immediately (6KB loaded inline)
Usage tracking, Async loading, Event handling, DOM readingZero net size increase to inline JS (some code moved to external file, offsetting 6KB increase)
Impact
TakeawaysLoading jQuery synchronously hurts the business
Note….jQuery is on 45% of the top one million web sites*….
*Source: http://trends.builtwith.com/javascript, 6/7/2011
Time to First Render
Time to Onload
SearchClicks
PageClicks
200-300ms gain 250ms gain +0.5% +0.5%

Case Study : Improving JS Execution TimeSituation
Long running JS at page bottom (binds behavior to UI elements)
What We Did – three rounds of changes in succession (additive):Change #1 – reduce total JS execution timeChange #2 – defer some JS execution to scroll event (for below-fold bindings)Change #3 – defer more JS execution by 1s (for less-critical bindings)
Impact
TakeawaysLong running JS hurts the business
Impacts responsiveness (First Render not impacted)Open question:
Where is the point of diminishing return for reducing JS execution time?
Change
CPU Impact Search Clicks
Page Clicks
#1 400ms gain (1050->650,~40%)
+1.2% +0.5%
#2 200ms gain (650->450, ~30%)
+0.5% None
#3 100ms gain (450->350, ~20%)
None None

Case Study: Delayed Ad LoadingSituation
Core content loaded first, with ads immediately following (some overlap)
Big Upper Right Ad

Case Study: Delayed Ad Loading (cont.)What We Did
Delayed loading of the Big Upper Right Ad by 1s
Bandwidth utilization chartsBlue line – core content (HTML, CSS, JS, images)Red line – ads (JS lib, ad platform calls, creatives)
Impact
Helped performance and some business metrics, but dramatically hurt Ad business metrics=> Net lose for the business
TakeawaysSeek sweet spot for ad loading that yields a win-win
Time to Page
Bottom
Time to Onload
Page Clicks
Page Views
Ad Click Thru Rate
80ms gain 500ms gain
+0.5% +0.4% -15%
Before
After

Case Study: Embedding Thumbnails Contributor: Mujtaba Khambatti (Bing Performance Team)
SituationThumbnails on Bing Search Results Page incur extra round-trips, and rendering delay relative to rest of pageNote: thumbnails have low cache hit rate
What We DidUse Data URI’s to embed thumbnails within base page
At end of HTML (with chunked transfer encoding) to avoid blocking rendering of textual content
Eliminates round-trips and extra TCP connectionImpact
TakeawaysEmbedding low cache hit rate images helps the business (especially images above the fold)
Time to Onload
Session Success Rate(% of search sessions with a
click)
200-500ms gain(depends on # of
thumbnails)+0.7%

Tips & Summary

Driving the Performance Mission
Secure air coverGet executives bought into the performance mission (prove to them the business value)
Recruit the engineersMake every engineer an improvement-maker (not just a few select gurus)
Arm the engineersGreat performance metrics, statistically representative Synthetic and RUM measurement systems A/B testing
PermeateDrive the mission upstream into the engineering process (and downstream after shipping)
Win the hearts and mindsHelp stakeholders see that it's possible to have performance AND richness (within reason)
Drive the mission with committed goalsAccountabilities are a big lever

Summary
Performance metrics need to focus on rendering and responsiveness, and need to be excellent proxies for business metrics
A/B testing is criticalImpact on business metrics is the ultimate truth of whether a change is worthwhile
Call to Action – to browser makersStandardized cross-browser API’s for rendering timings
Call to Action – to communityResearch and tools for measuring response time


![ADescentConjugateGradientAlgorithmforOptimization ...Polak–Ribi`ere–Polak(PRP)formula[6,7]isoneofthewell-knownnonlinearCGformulaswith βPRP k gT k g k−g −1 g k−1 2, (4) whereg](https://img.pdfslide.us/doc/110x75/60aec745daea9b5b1e6e01b6/adescentconjugategradientalgorithmforoptimization-polakaribiereapolakprpformula67isoneofthewell-knownnonlinearcgformulaswith.jpg)