Embed Size (px)
Citation preview

080
Personal communicationsPersonal communications are not included in a reference list. As there is no way a reader can check them for further information, there is no point in listing them. They are simply listed in the text: (Anthony Youdeowei, pers. comm. 1999) [or personal communication 1999].
Accurate and complete references allow your readers to follow up on the material you have cited and to explore the implications of your research further for themselves. Providing incomplete or inaccurate references will cause referees to question the thoroughness and accuracy of the rest of your work, and impose a burden on your readers. You should apply the same standards of care and accuracy that you apply to your research, and to documenting your findings, to your reference lists.
Butcher, J., Drake, C. and Leach, M. 2006. Butcher’s Copy-Editing: The Cambridge Handbook for Editors, Copy-editors and Proofreaders (4th edn). Cambridge University Press, Cambridge, UK.
Council of Science Editors. 2006. Scientific Style and Format: The CSE Manual for Authors, Editors, and Publishers (7th edn). Council of Science Editors, Style Manual Committee, Wheat Ridge, CO, USA.
O’Connor, M. 1991. Writing Successfully in Science. Chapman & Hall, London, UK.
O’Connor, M. 1992. ‘With reference to references’. European Science Editing 47: 4–6.
University of Chicago Press. 2003. The Chicago Manual of Style for Authors, Editors, and Copywriters (15th edn). University of Chicago Press, Chicago, IL, USA.
7.5 The importance of accurate and complete references
7.6 References

Paul Neate
Using tables to present research results
8
082
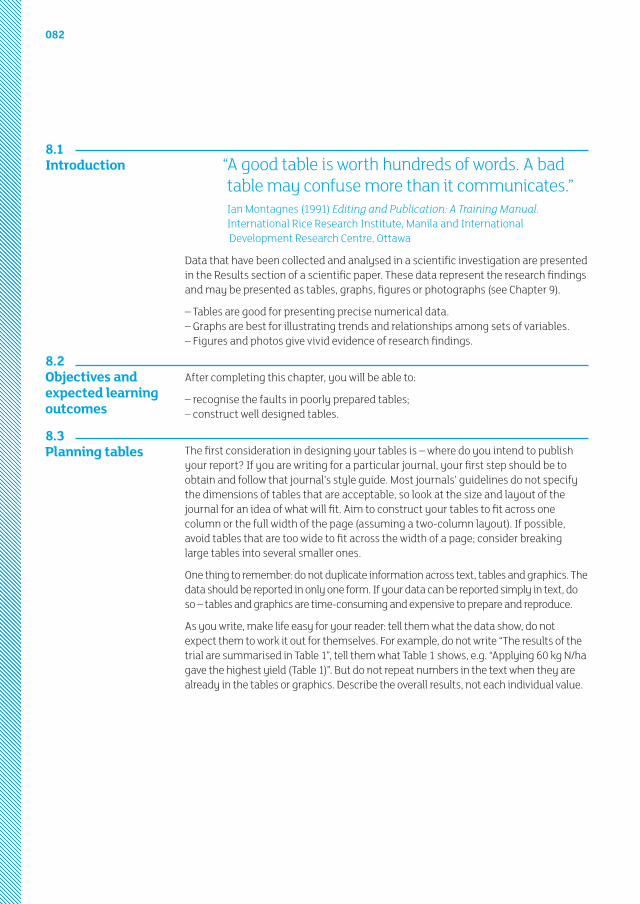
“ A good table is worth hundreds of words. A bad table may confuse more than it communicates.” Ian Montagnes (1991) Editing and Publication: A Training Manual. International Rice Research Institute, Manila and International Development Research Centre, Ottawa
Data that have been collected and analysed in a scientific investigation are presented in the Results section of a scientific paper. These data represent the research findings and may be presented as tables, graphs, figures or photographs (see Chapter 9).
– Tables are good for presenting precise numerical data.– Graphs are best for illustrating trends and relationships among sets of variables.– Figures and photos give vivid evidence of research findings.
After completing this chapter, you will be able to:
– recognise the faults in poorly prepared tables;– construct well designed tables.
The first consideration in designing your tables is – where do you intend to publish your report? If you are writing for a particular journal, your first step should be to obtain and follow that journal’s style guide. Most journals’ guidelines do not specify the dimensions of tables that are acceptable, so look at the size and layout of the journal for an idea of what will fit. Aim to construct your tables to fit across one column or the full width of the page (assuming a two-column layout). If possible, avoid tables that are too wide to fit across the width of a page; consider breaking large tables into several smaller ones.
One thing to remember: do not duplicate information across text, tables and graphics. The data should be reported in only one form. If your data can be reported simply in text, do so – tables and graphics are time-consuming and expensive to prepare and reproduce.
As you write, make life easy for your reader: tell them what the data show, do not expect them to work it out for themselves. For example, do not write “The results of the trial are summarised in Table 1”, tell them what Table 1 shows, e.g. “Applying 60 kg N/ha gave the highest yield (Table 1)”. But do not repeat numbers in the text when they are already in the tables or graphics. Describe the overall results, not each individual value.
8.1 Introduction
8.2 Objectives and expected learning outcomes
8.3 Planning tables

083 Chapter 8 — Using tables to present research results
8.3.1 Tables and their characteristicsA table is a systematic arrangement of data or information in a format that allows the reader to observe variations or trends and make comparisons. Generally a table consists of most or all of the following elements:
– number and title;– column headings;– stub, or row headings;– field, or body of the table;– footnotes.
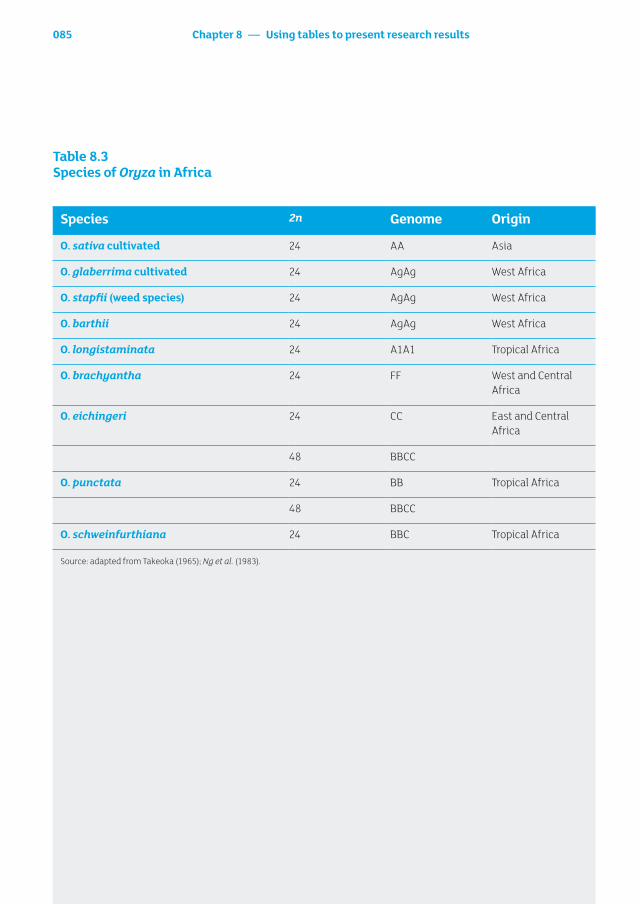
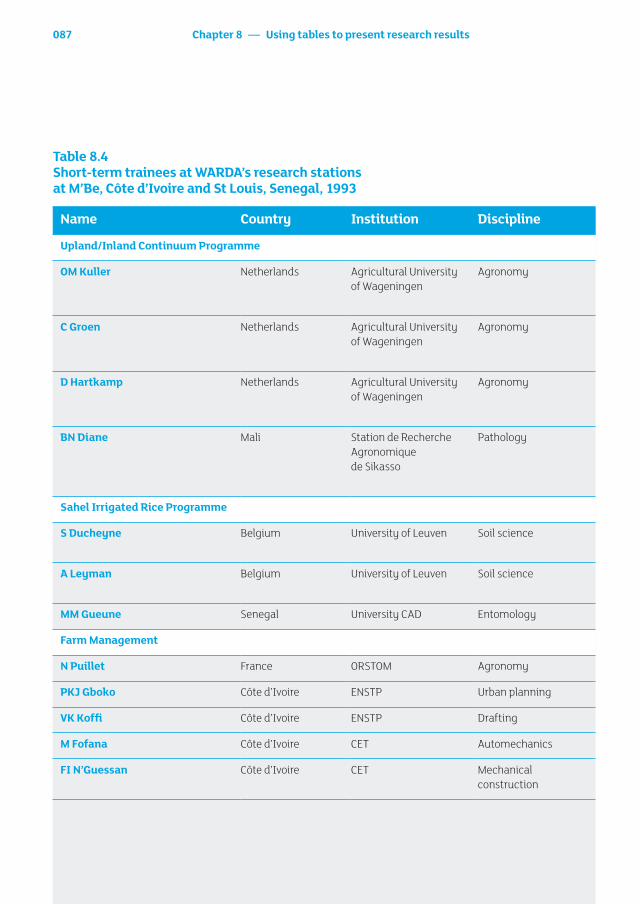
Tables may be constructed using numbers, as in Table 8.1 (which also names the parts of a table); symbols (Table 8.2); a mixture of words and numbers (Table 8.3); or words only and no numbers (Table 8.4). These examples show the variety of ways in which different kinds of information can be communicated through tables. The choice of the method adopted depends on the nature of the information to be communicated.
Table 8.1 Rice production in East Africa
Country Growth ratea Productionb
1970–90 1981–90 1988–90
Kenya 3.62 4.71 54
Madagascar 1.05 1.98 2310
Malawi 3.41 1.99 40
Somalia 14.50 –3.15 16
Tanzania 9.00 15.65 692
Uganda 4.59 6.75 20
Eastern Africa 2.16 3.93 3137
Source: WARDA (1992) Rice Trends in Sub-Saharan Africa. West Africa Rice Development Association.aGrowth rate (%).bProduction (’000 t).
Table header
Column headings
Row headings or stubs
Footnotes
Body or field

084
Table 8.2 Weighting of some environmental constraints to irrigated rice production in the Sahel as a function of seasonal and cultural factors
Stress factor Seasonal problems Aggravated by
CDS HDS WS Poor WM
Long CD RR DS
Cold nights (seedling stage)
++ + 0 0 0 ++ 0
Cold nights (reproduction stage)
+ 0 + 0 +++ ++ 0
Hot days (reproduction stage)
0 ++ 0 0 + + 0
Salinity/sodicity (evaporative residues)
++ ++ + ++ 0 0 0
Salinity/sodicity (rising groundwater)
++ ++ + ++a ++a ++a 0
Weed infestation + + + +++ 0 + ++
Bird damage ++ ++ + 0 0 ++ ++
CDS = cold-dry season; HDS = hot-dry season; WS = wet season; WM = water management; CD = crop duration; RR = rice–rice double cropping; OS = direct seeding.0 = neutral; + = yield reduction; ++ = severe yield reduction likely; +++ = possibility of total crop failure.aEffects with long-term environmental consequences.
085 Chapter 8 — Using tables to present research results
Table 8.3 Species of Oryza in Africa
Species 2n Genome Origin
O. sativa cultivated 24 AA Asia
O. glaberrima cultivated 24 AgAg West Africa
O. stapfii (weed species) 24 AgAg West Africa
O. barthii 24 AgAg West Africa
O. longistaminata 24 A1A1 Tropical Africa
O. brachyantha 24 FF West and Central Africa
O. eichingeri 24 CC East and Central Africa
48 BBCC
O. punctata 24 BB Tropical Africa
48 BBCC
O. schweinfurthiana 24 BBC Tropical Africa
Source: adapted from Takeoka (1965); Ng et al. (1983).

086
8.3.2 General guidelinesA table should be able to stand alone: casual readers often read the tables and figures to get the main points of a paper before deciding if they want to invest time reading the whole paper. Also, tables are often reproduced out of context (e.g. in another paper, or as an overhead for a presentation).
Every table in a manuscript for publication should have a number and be numbered sequentially: Table 1, Table 2, and so on. Do not use modifiers for table numbers such as Table 1a.
Tables should be numbered in the same order as they are cited in the text.
Tables should present analysed and summarised data, not raw data.
Give the table a clear and concise title, which immediately tells the reader its contents.
The title should state precisely what the table shows, not what the table is about.
Keep it simple: create separate tables for separate topics.
Apply logic to the sequence in which data are presented in tables.
Be consistent: use the same sequence of columns and rows in tables presenting similar information.
Use the same units, symbols and terminology in text, tables and graphics, for example, do not use t/ha in a table and then use kg/ha in the text.
Discuss information in the same order in the text as it is presented in the tables and graphics.
Do not put data in a table if they can be easily and clearly presented in the text; a rule of thumb is that the table field should contain at least eight items.
087 Chapter 8 — Using tables to present research results
Table 8.4 Short-term trainees at WARDA’s research stations at M’Be, Côte d’Ivoire and St Louis, Senegal, 1993
Name Country Institution Discipline
Upland/Inland Continuum Programme
OM Kuller Netherlands Agricultural University of Wageningen
Agronomy
C Groen Netherlands Agricultural University of Wageningen
Agronomy
D Hartkamp Netherlands Agricultural University of Wageningen
Agronomy
BN Diane Mali Station de Recherche Agronomique de Sikasso
Pathology
Sahel Irrigated Rice Programme
S Ducheyne Belgium University of Leuven Soil science
A Leyman Belgium University of Leuven Soil science
MM Gueune Senegal University CAD Entomology
Farm Management
N Puillet France ORSTOM Agronomy
PKJ Gboko Côte d’Ivoire ENSTP Urban planning
VK Koffi Côte d’Ivoire ENSTP Drafting
M Fofana Côte d’Ivoire CET Automechanics
FI N’Guessan Côte d’Ivoire CET Mechanical construction

088
Make column headings short.
Try to avoid abbreviations. If abbreviations are essential, explain uncommon ones (e.g. you do not need to explain “kg”) in a footnote to the table, even if you have already explained them in the text.
Always state the unit of measurement, usually in the SI system, either in the table title or in the column heads, as appropriate. If non-metric units are used in the investigation, convert to metric units for publications.
If percentages are used (e.g. in describing solutions), distinguish between percentage by weight (w/w) or percentage by volume (v/v).
Align the data in columns for ease of comparison down the column. In most cases, this will mean aligning numbers on the decimal point.
Data should be rounded for significance: 76.4, not 76.42796.
Think about the accuracy of your data collection: for example, if you are reporting on a small-plot trial, does it make sense to report a grain yield of 5671 kg/ha rather than 5.7 t/ha?
Use a zero (0) when writing data values less than 1, for example, 0.25 kg.
Choose units to avoid too many digits, e.g. 240 μg rather that 0.000 24 g.
Use powers of 10 to avoid numbers with strings of zeros: 39 200 000 should be written as 3.92 × 10⁷. For column headings, follow the designation of units with ’000 to indicate thousands, and use 42 as the entry for 42 000.
Avoid using a dash (–) in tables, but rather indicate whether no data were available (nd), the item is not applicable (na), or whatever may be the circumstances, using footnotes if necessary.
Do not use numbers with multipliers in column headings as this can cause confusion.
Use appropriate symbols to identify items that are explained in the footnotes, depending on the journal style. These may be superscript numbers (1, 2), superscript letters (a, b) or symbols (usually the following, in this order: †, ‡, §, ¶). Avoid using asterisks (*) other than for indications of significance. Choose a system that will not be confused with data in the table.
Use a consistent system for indicating statistical significance. One common standard is: * P ≤ 0.05, ** P ≤ 0.01, *** P ≤ 0.001. State which test of significance was used.
8.4.1 A practical exampleTables 8.5 and 8.6 are based on tables that appeared in a 2005 issue of Plant Genetic Resources Newsletter, and provide a good example of a number of problems that can occur.
8.4 Constructing a table

089 Chapter 8 — Using tables to present research results
Table 8.5 Biomass production and its contributory parameters in different cultivars of banana
Cultivars Plant parts
Whole plant weight (kg)
Leaves + peduncle (%)
Corm + roots (%)
Pseudostem (%)
Fibre-extractable pseudostem (%)
Fibre yield (%)
Poovan 21.83a 16.79 27.39 55.82 40.14b 0.72d
Karpuravalli 36.78b 18.92 26.52 54.56 29.22a 0.26a
Pachanadan 25.73a 16.73 31.59 51.68 34.29a,b 0.88e
Saba 37.63b 21.16 36.69 42.16 37.25b 0.40b
Peyan 37.13b 21.98 31.90 49.46 62.29c 0.53c
Robusta 19.00c 10.50 5.00 52.66 46.23 0.52
CD at 1% 9.3246 NS NS NS 10.9030 0.1110
Note: Within a column, values with the same superscript letter are not significantly different from each other.

090
In Table 8.5, the independent or fixed variables (in this case, cultivars) are arranged in rows, while the columns are the dependent, or measured, variables. In Table 8.6, the arrangement is reversed. It would be better to have one arrangement for both tables, to help readers orient themselves. Most people find that it is easier to compare numbers or entries running down a column than across a row. In this case, Table 8.5 has the better arrangement.
Another consideration is the sequence in which to present the information. If there is a reference treatment or entry (Robusta, in the case of Table 8.5), it is best to put this in the first or last row. The most important variable, the one on which you want your readers to focus (whole plant weight, in this case), ideally should come in the first column, although this may have to depend on logic if, for example, the focus is on a derived parameter.
Again, the sequence of the independent variables or rows should be guided by the message you want your readers to pick up from the table. If, for example, you want to highlight those with the highest whole plant weight, you could order the rows from heaviest to lightest (leaving the reference row at the top or the bottom).
Based on these considerations, Table 8.5 could be improved by ordering the rows in descending order of whole plant weight and by removing the columns for parameters that show no significant variation – these can be mentioned in text, with a simple range of values across the treatments (Table 8.7).
Following this approach, Table 8.6 would be rearranged to match Table 8.7. You should keep the same order of rows in the tables, to help readers compare results across the tables (Table 8.8).
These changes both improve the readability of the tables and make them smaller, which simplifies the layout of your final paper in its printed form.

091 Chapter 8 — Using tables to present research results
Table 8.6 Biochemical parameters of banana fibre as affected by varietal differences
Parameters Cultivar
Poovan Karpuravalli Pachanadan Saba Peyan Robusta CD at 5%
Total soluble solids (°Brix)
1.87b 1.53a 1.93b 1.53a 1.47a 1.27 0.1945
pH 6.650 6.390 6.663 6.447 6.397 0.641 NS
Total acidity (%)
0.025c 0.023b 0.020a 0.031d 0.034e 0.0294 0.0004
Moisture (%) 95.47d 89.13a 94.53c 93.60b 94.80c 90.64 0.4618
Total carbohydrate (%)
1.977 2.147 1.910 2.137 2.153 1.089 NS
Total cellulose (%)
3.103c 2.77a,b 3.193c 2.817b 2.697a 2.690 0.0946
Cellulose content in pure fibre (%)
56.490 55.84 57.89 56.33 56.07 56.34 NS
Note: Across a row, values with the same superscript letter are not significantly different from each other.

092
Table 8.7 Biomass production and its contributory parameters in different cultivars of banana
Cultivar Whole plant weight (kg)
Fibre-extractable pseudostem (%)
Fibre yield (%)
Saba 37.63b 37.25b 0.40b
Peyan 37.13b 62.29c 0.53c
Karpuravalli 36.78b 29.22a 0.26a
Pachanadan 25.73a 34.29a,b 0.88e
Poovan 21.83a 40.14b 0.72d
Robusta 19.00c 46.23b 0.52c
CD at 1% 9.3246 10.9030 0.1110
Note: Within a column, values with the same superscript letter are not significantly different from each other (P < 0.01).

093 Chapter 8 — Using tables to present research results
Table 8.8 Biochemical parameters of banana fibre as affected by varietal differences
Cultivars Total soluble solids (°Brix)
Total acidity (%)
Moisture (%) Total cellulose (%)
Saba 1.53a 0.031d 93.60b 2.817b
Peyan 1.47a 0.034e 94.80c 2.697a
Karpuravalli 1.53a 0.023b 89.13a 2.77a,b
Pachanadan 1.93b 0.020a 94.53c 3.193c
Poovan 1.87b 0.025c 95.47d 3.103c
Robusta 1.27 0.029 90.64 2.690
CD at 5% 0.1945 0.0004 0.4618 0.0946
Note: Values with the same superscript letter are not significantly different from each other.

094
Why is the table included?
What does the table show?
Is the table complete in itself?
Does the table stand alone without the rest of the text?
Does the table relate appropriately to the text?
Is the table well located and referred to within the text?
Is the title clear, concise and relevant?
Are the row and column headings accurate and appropriate?
Have the footnotes been identified with appropriate symbols?
Are the data in the table accurate?
Have the data been presented in a logical manner to facilitate understanding?
Is there too much data in the table?
Have you checked that the totals and statistical information in the table are accurate?
Is the table well designed?
Have all the tables been properly numbered?
“ One thing to remember: do not duplicate information across text, tables and graphics ”
8.5 Questions to help design good tables

Anthony Youdeowei
Using illustrations to present research results
9
096
“ One picture is worth more than ten thousand words” Chinese proverb, in John Bartlett (1955) Familiar Quotations (13th edn). Little, Brown, New York, USA.
Illustrations are frequently used in presenting scientific data because they present information in a way that is easy to read and understand quickly. As illustrations (often called figures) are intended to present data vividly, they must be simple and clear so that readers can immediately understand the message. Illustrations present information in a form that otherwise would need many words.
This chapter suggests some guidelines for making clear and effective illustrations for your scientific papers and reports.
After completing this chapter, you will be able to:
– understand the basic principles of preparing illustrations for scientific papers and reports;
– recognise faults in badly prepared illustrations;– prepare good illustrations from numerical data.
Good illustrations should:
– be simple and clear;– contain relevant legends;– be independent of the text and of each other;– be visually appealing, not crowded;– be organised in the way data are presented.
According to the Council of Biology Editors (1988), illustrations should do the following:
– show the data without distorting what they have to say;– lead the viewer into the substance of the data with ease;– encourage comparison of different pieces of data;– present statistical information in a small space selectively, without being too
densely packed (i.e. good composition);– match the content and style of presentation to the abilities, knowledge and
preferences of the target audience;– take into account the final production/printing process.
9.1 Introduction
9.2 Objectives and expected learning outcomes
9.3 Characteristics of good illustrations

097 Chapter 9 — Using illustrations to present research results
Scientific papers commonly use various types of illustration for different purposes.
9.4.1 Line graphsLine graphs demonstrate relationships among data, or dynamic comparisons. Actual quantities are not marked on line graphs, they tend to be obscure. The type of line graph selected depends on the purpose of the graph and the type of data. An example is shown in Figure 9.1.
Figure 9.1 Rice production and area, Côte d’Ivoire. [Line graphs illustrate relationships and make comparisons.]
9.4 Types of illustration
600 700
500600
400
500
350 400
450
550 650
450
550
3001980 19861982 19881984 19901981 19871983 19891985
350
area production
Area
(’00
0 ha
)
Prod
uctio
n (’0
00 M
t)

098
9.4.2 Bar and pictorial graphs (histograms)These compare qualities, as shown in Figures 9.2 and 9.3.
Figure 9.2 Growth rates and values of imports in major rice-eating countries in West Africa. [Bar graphs are good for visual comparisons.]
value 1988-90
growth rate 1970-90
Cote d’lvoire0 0
40
20
105
50
25
20
10
60
3080
30
15
70
3590
Senegal Nigeria Guinea S.Leonegr
owth
rate
(%)
valu
e (m
illio
ns o
f dol
lars
)

099 Chapter 9 — Using illustrations to present research results
Figure 9.3 Number of people from national programmes trained by WARDA, 1980–90. [Pictorial graphs also illustrate comparisons, but care must be taken not to distort the representations.]
1980
1981
1982
1983
1984
1985
1986
1987
1988
1989
1990
40 1 2 3 4 5 6 7 880 120 160 200number of trainees
10 trainees
1 course
number of courses