Embed Size (px)
Citation preview
Molecular Ecology (2005) 14,2259-2268 doi: 10.1 11 1 /j.1365-294X.2005.02547.x
Patterns of vegetative growth and gene flow in Rhizopogon vinicolor and R. vesiculosus (Boletales, Basidiomycota)
ANNETTE M. KRETZER,"SUSIE DUNHAM,+ RANDY MOLINAS and JOSEPH W. SPATAFORAt * S U N Y College of Environmental Science and Forest y, Faculty of Environmental and Forest Biology, 1 Forest y Drive, Syracuse, NY 13210, toregon State University, Department of Botany and Plant Pathology, 2082 Cordley Hall, Corvallis, OR 97331, SUSDA Forest Service; 620 S W Main St., Suite 400, Portland, OR 97205
Abstract
We have collected sporocarps and tuberculate ectomycorrhizae of both Rhizopogon vini- color and Rhizopogon vesiculosus from three 50 x 100 m plots located at Mary's Peak in the Oregon Coast Range (USA); linear map distances between plots ranged from c. 1 km to c. 5.5 km. Six and seven previously developed microsatellite markers were used to map the approximate size and distribution of R. vinicolor and R. vesiculosus genets, respectively. Genetic structure within plots was analysed using spatial autocorrelation analyses. No sig- nificant clustering of similar genotypes was detected in either species when redundant samples from the same genets were culled from the data sets. In contrast, strong clustering was detected in R. vesiculosus when all samples were analysed, but not in R. vinicolor. These results demonstrate that isolation by distance does not occur in either species at the intraplot sampling scale and that clonal propagation (vegetative growth) is significantly more prevalent in R. vesiculosus than in R. vinicolor. Significant genetic differentiation was detected between some of the plots and appeared greater in the more clonal species R. vesiculosus with OST values ranging from 0.010 to 0.078*** than in R. vinicolor with OsT values ranging from -0.002 to 0.022** (*P < 0.05, **P < 0.01, ***P < 0,001). When tested against the null hypothesis of no relationship between individuals, parentage analysis detected seven likely parentloffspring pairs in R. vinicolor and four in R. vesiculosus (a = 0.001). Of these 11 possible parentloffspring pairs, only two R. vinicolor pairs were still supported as parentloffspring when tested against the alternative hypothesis of being full siblings (a = 0.05). In the latter two cases, parent and offspring were located at approxi- mately 45 m and 28 m from each other. Challenges to parentage analysis in ectomycorrhizal fungi are discussed.
Keywords: false-truffles, genetic structure, microsatellite markers, mycophagy, spore dispersal, tuberculate ectomycorrhizae
Received 9 November 2004; revision accepted 17 Februa y 2005
Introduction
Genetic studies of ectomycorrhizal fungal populations have so far been primarily concerned with characterizing the size and distribution of genets. Genets (clones) are generally identified as 'repeatedly sampled, multilocus genotypes that are unlikely to arise by chance in sexual reproduction' (Anderson & Kohn 1998). Because ecto- mycorrhizal fungi do not generally produce asexual
Correspondence: Annette M. Kretzer, Fax: +1-315-470 6934; E-mail: [email protected]
(mitotic) spores, genets are propagated entirely by vegetative, hyphal growth and thus form fairly coherent localized units. The traditional approach to delineating genet size has been to sample macroscopic structures (typically sporocarps) and use either mycelial interactions (somatic incompatibility) or molecular markers for genet differen- tiation; the distance between the outermost samples of a genet is used as an estimate of genet size (see references in Kretzer et al. 2004). However, because the sampled structures are not necessarily located at the periphery of an actual genet, this approach likely underestimates genet size. Despite these and other limitations, valuable
O 2005 Blackwell Publishing Ltd
2260 A . M. KRETZER ET AL.
comparative data have been gained. Genets of ecto- mycorrhizal fungi have been found to range in size from less than 1 m2 (e.g. Gherbi et al. 1999) to 300 m2 or more (e.g. Bone110 et al. 1998). In Suillus bovinus and Suillus variegatus, genet size increases with forest age presumably due to continued vegetative growth (Dahlberg & Stenlid 1994; Dahlberg 1997). In contrast, Laccaria amethystina forms small and apparently short-lived genets in a 150- year-old forest (Gherbi et al. 1999). Ectomycorrhizal fungi such as S. bovinus and S . variegatus on the one hand and L. amethystina on the other seem to represent two extremes in a spectrum of life history traits that are dominated either by long-lived mycelia and abundant vegetative growth (clonal propagation) or by short-lived mycelia and frequent spore establishment (sexual reproduction). Both strategies have sometimes been likened to K- and r- selection strategies, respectively (Deacon & Fleming 1992). It has initially been assumed that the former strategists should be more prevalent with mature trees in stable environments, while the latter should be more prevalent with young trees and in early successional settings, but recent work has shown that a number of ectomycorrhizal fungi form small genets in fairly mature (Redecker etal. 2001) to very mature forests (Gherbi et al. 1999; Fiore- Donno & Martin 2001); it is possible that these fungi take advantage of microdisturbances for spore establishment.
The genetic structure of ectomycorrhizal fungal popula- tions is additionally shaped by short- and long-distance gene flow, which is a function of spore dispersal followed by successful establishment. Two common spore-dispersal strategies are either wind dispersal or animal dispersal (mycophagy). While many fungi may use a mix of both dis- persal strategies, the general belief is that wind dispersal dominates in fungi with epigeous (mushroom-like) sporo- carps and animal-dispersal dominates in fungi with hypo- geous (truffle-like) sporocarps (e.g. Bruns et al. 1989). Gene flow cannot be measured directly in ectomycorrhizal fungi, and indirect, genetic methods are required, but literature in this area continues to be sparse. Both Zhou et al. (2001) and Liang etal. (2004) found some fine-scale clustering of similar genotypes in Suillus grevillei and Russula vinosa, respectively. Beyond that, Zhou et al. (2001) found little genetic differentiation (FST = 0.024) between two populations of Suillus grevillei that were separated by 700 m. At larger spatial scales, Bergemann & Miller (2002) found strong genetic differentiation (F, = 0.434) between populations of Russula brevipes from California and Wyo- ming, but based on the almost complete absence of shared alleles, these populations may actually represent distinct species. Similarly, LoBuglio & Taylor (2002) detected strong differentiation (FST = 0.256) between populations of Cenococcum geophilum from New York State and Alberta, as did Jany et al. (2002) along a 250 km transect across northeastern France. Cenococcum geophilum is, however, an
unusual ectomycorrhizal fungus in that it is not known to form any type of spores and is thought to disperse exclu- sively via sclerotia. Recently, Murat et al. (2004) detected a strong subdivision (FsT = 0.20) between populations of Tuber melanosporum from France, northern Italy and north- eastern Spain; population structure within France strongly mirrored known routs of postglacial recolonization for ectomycorrhizal host tree species. Also, Grubisha et al. (private communication) recently found that mainland and island populations of Rhizopogon vulgaris from Califor- nia are heavily structured with painvise FST values up to 0.45 (Grubisha et al., personal communication). Given the overall sparseness of literature on ectomycorrhizal fungi, relevant information may also be gained from work on other nonmitosporic forest fungi, mostly wood decay and saprotrophic fungi. Most of these studies have been done at intracontinental scales and have revealed very little (e.g. Saville et al. 1996; Hogberg et al. 1999; Kauserud & Schumacher 2002) to moderate (Hogberg & Stenlid 1999) interpopulation differentia tion.
We are interested in the population genetics of two ectornycorrhizal sister species, Rhizopogon vinicolor and Rhizqmgon vesiculosus (Boletales, Basidiomycota). Both species form hypogeous sporocarps, and their spores are thought to be dispersed primarily by small mammal mycophagy. Rhizopogon vinicolor is well known as a predominant ecto- mycorrhizal fungus on Douglas-fir (Pseudotsuga menziesii) roots (Molina et al. 1999) and forms distinctive, large, tuberculate ectomycorrhizae (Zak 1971; Massicotte et al. 1992). Recently, however, we reported that its sister spe- cies, R. vesiculosus (sensu Kretzer et al. 2003), is commonly mistaken for R. vinicolor and also forms tuberculate ecto- mycorrhizae on Douglas-fir. Tuberculate ectomycorrhizae are relatively easy to sample because of their size (up to several centimetres across) and distinctive morphology and they provide ample material for genetic analysis; they are also more common and less seasonal than the associated sporocarps. Rhizopogon vinicolor and R. vesiculosus thus constitute ideal model systems to (i) study population genetics of ectomycorrhizal fungi with hypogeous sporo- carps and to (ii) improve fine-scale sampling by including ectomycorrhizae in addition to sporocarp collections. Finally, previous studies on the phylogeny of the genus Rhizopogon (Grubisha et al. 2001,2002; Kretzer et al. 2003) put compar- ative analyses of genetic structure into a broader phylogenetic context.
We have recently developed moderately polymorphic microsatellite markers for both R. vinicolor and R. vesiculo- sus and have demonstrated their utility in differentiating genets from both sporocarp and ectomycorrhizal samples (Kretzer et al. 2000,2004). In short it was found that 11 pre- viously mapped genets had multilocus genotypes with very low frequencies under Hardy-Weinberg expectations (1 4 x 10⁻³) making it unlikely for two samples to possess
O 2005 Blackwell Publishing Ltd, Molecular Ecology, 14,2259-2268
VEGETATIVE GROWTH AND GENE FLOW IN RHIZOPOGON SPP. 2261
identical multilocus genotypes by chance rather than by clonal descent. Furthermore it was found that when the number of genets resolved was plotted over the number of loci analysed, it only increased up to the fifth locus in both species. Adding a sixth or seventh locus did not increase the number of genets resolved in either species (Kretzer et al. 2004). Here we use previously developed microsatel- lite markers to analyse genetic structure in both R. vinicolor and R. vesiculosus. We use spatial autocorrelation analysis for comparative analysis of genet size, and results demon- strate that clonal reproduction (hyphal growth) is much more prevalent in R. vesiculosus than in R. vinicolor. We were further able to detect small but significant differentiation between plots at 5-5.5 krn scales. Finally we conduct parent- age analysis, which to our knowledge has not been done in ectomycorrhizal fungi before. Limitations of parentage analysis for ectomycorrhizal fungi are discussed.
Materials and methods
Plots and Sampling
Three 50 x 100 m plots were established on the slopes of Mary's Peak in the Oregon Coast Range (USA) and designated as plots MP1, MP3, and MP4. Plots MP1 and MP3 are located on the north side of the peak at approximately 44"31.8'N, 123'32.9W and 44"32.1'N, 123"32.1'W, respectively; MP4 is located on the south side of the peak at approximately 44"28.6N, 123'29.8'W. Because of the canopy cover over the plots, GPS readings are affected with an approximately f 0.1' error. Plots are within 40- to 80-year-old second-growth forests; MPI is dominated by Douglas-fir (Pseudotsuga menziesii), western hemlock (Tsuga heterophylla) and western red cedar (Thuja plicata), while the overstory in MP3 and MP4 is mostly dominated by Douglas-fir with some western hemlock present. According to the pollen record, Douglas-fir which is the only known host for both Rhizopogon vinicolor and Rhizopogon vesiculosus does not appear to have been common in the Pacific Northwest until about 10 000 BP (Whitlock 1992). Prelogging, wildfire and wind were the mapr natural disturbances in the forests of the Pacific Northwest with infrequent catastrophic fires occurring at intervals of several hundred years (Franklin 1988; Agee 1993).
Plots were sampled between mid-May and mid-July 2000 as follows. In each plot, eleven 50 m transects were run in parallel spaced 10 m apart. In western Oregon, tuberculate ectomycorrhizae of Douglas-fir have been reported to be particularly common in coarse woody debris (Zak 1971). Hence at locations with coarse woody debris within 5 m distance of a transect, the litter was removed with a rake from an approximately 0.25 m2 large area, and roots were examined for the presence of tuberculate ectomycorrhizae. When tuberculate ectomycorrhizae were found, the centre
of the raked area was mapped relative to the closest transect at a resolution of 0.5 m. Tuberculate ectomycor- rhizae were removed, cleaned and freeze dried within a week from sampling. Because both R. vinicolor and R. vesiculosus sensu Kretzer et al. (2003) are spring fruiters, the previously described sampling strategy did also yield a few sporocarp collections, which were treated the same as tuberculate ectomycorrhizal samples. If multiple collec- tions were made within the same c. 0.25 m2 sampling area, only one representative was subjected to genetic analyses, except when morphological examinations suggested the presence of both R. vinicolor and R. vesiculosus; in the latter case, one representative per species was subjected to genetic analysis. Finally, samples from a previous study that had been retrieved from within the MP1 plot were also included in this study (Kretzer et al. 2004).
Molecular typing
Although subtle morphological differences exist between tuberculate ectomycorrhizae and sporocarps of R. vinicolor and R. vesiculosus (see Kretzer et al. 2003), species identifica- tion of all samples was confirmed using restriction fragment length polymorphisms of the internal transcribe spacer region (ITSRFLPs) as described in Kretzer et al. (2003, 2004). Rhiwpogon vinicolor samples were subsequently geno typed at microsatellite loci Rv15, Rv46, Rv53, Rvel.34, Rve2.77, Rve3.21, and R. vesiculosus samples were geno- typed at loci Rd2, Rvel.21, Rvel34, Rve2.10, Rve2.14, Rvd.44, Rve2.74; development of these markers and genotyping techniques including PCR primer sequences have been described in Kretzer et al. (2000,2004).
Statistical analyses
Spatial autocorrelation analysis based on the multivariate approach of Smouse & Peakall (1999) was completed using GENALEX version 5.1 (available at http: / /www .anu.edu.au/ BoZo/GenAlEx/). This approach is suitable for the simultaneous analysis of multiallelic, multilocus data, and thus reduces allele to allele noise and enhances the signal from existing spatial patterns. Linear genetic and geographical distances were calculated for all pairwise sample comparisons, and values were binned into userdefined geographical distance classes. Geographic distance classes were chosen to yield even numbers of comparisons across distance classes. For each distance class, a correlation coefficient (r; range -1 to +1) between genetic and geographical distances was calculated. Statistical significance of r was determined using 999 permutations that randomized samples across distance classes and created a null distribution of r values for each distance class. The null distributions of r values were used to define 95% confidence intervals. Observed r values above the
O 2005 Blackwell Publishing Ltd, Molecular Ecology, 14,2259-2268
2262 A. M. KRETZER ET AL.
interval indicate significant positive spatial autocorrelation and r values below the interval indicate sippicant negative autocorrelation (Smouse & Peakall 1999). Spatial autocorrelation analyses were performed first on data sets including all samples ('complete' data sets) and subsequently on data sets using only one randomly chosen sample per genet ('culled' data sets).
The following tests were all conducted using only one sample per genet (culled data sets): Heterozygote deficiency and heterozygote excess were tested for independently and for each plot separately according to Rousset & Raymond (1995). The null hypothesis of no dif- ference in the distribution of alleles between plots was tested by the method of Raymond & Rousset (1995a). Both tests were conducted in the web-based version of GENEPOP
version 3.1 c (http: / /wbiomed.curtin.edu.au/genepop/ index. html; Raymond & Rousset 1995b). F--analogues (@ST) were calculated based on the molecular variance approach of Excoffier et al. (1992) and Michalakis & Excof- fier (1996), and significance of (DST values was tested using the randomization test of Excoffier et al. (1992). All as- related analyses were conducted in ARLEQUIN version 2.0 ( http: / / lgb.unige.ch/arlequin/ Schneider et al. 1999), and 10 000 permutations were used for significance testing.
Parentage analyses were conducted in KINSHIP ver- sion 1.3.1 (http://www.gsoftnet.us/GSoft.html) using the likelihood ratio test of Goodnight & Queller (1999). For every painvise sample comparison, KINSHIP calculates the likelihood of the samples to be related in a user-specified manner (primary hypothesis). Because likelihood values in themselves are not very meaningful, a likelihood-ratio approach is used for significance testing, which uses the likelihood of two samples to be related via the primary hypothesis over a secondary or null hypothesis. Computer simulations are used to generate pairs of individuals related under the null hypothesis, and the P value reflects the fraction of simulated pairs with larger likelihood ratios than the sample pair. We used 200 000 simulated pairs for each test.
Results
Sampling and molecular typing
In total, we examined 248 samples collected across all three plots. Species-level identification, achieved by ITS- RFLP analysis, assigned 103 and 145 samples to Rhizopogon vinicolor and Rhizopogon vesiculosus, respectively (Fig. 1). Samples were subsequently genotyped at six (for R. vinicolor) or seven (for R. vesiculosus) microsa tellite loci (see methods). Although a previous, smaller study showed that these microsatellite loci resolve genets with great confidence (Kretzer et al. 2004), it was found in this larger study that three multilocus genotypes in R. vinicolor and
North (m)
I . . . . . . . . . . . , 0 10 20 30 40 50 60 70 80 90 100
East (m)
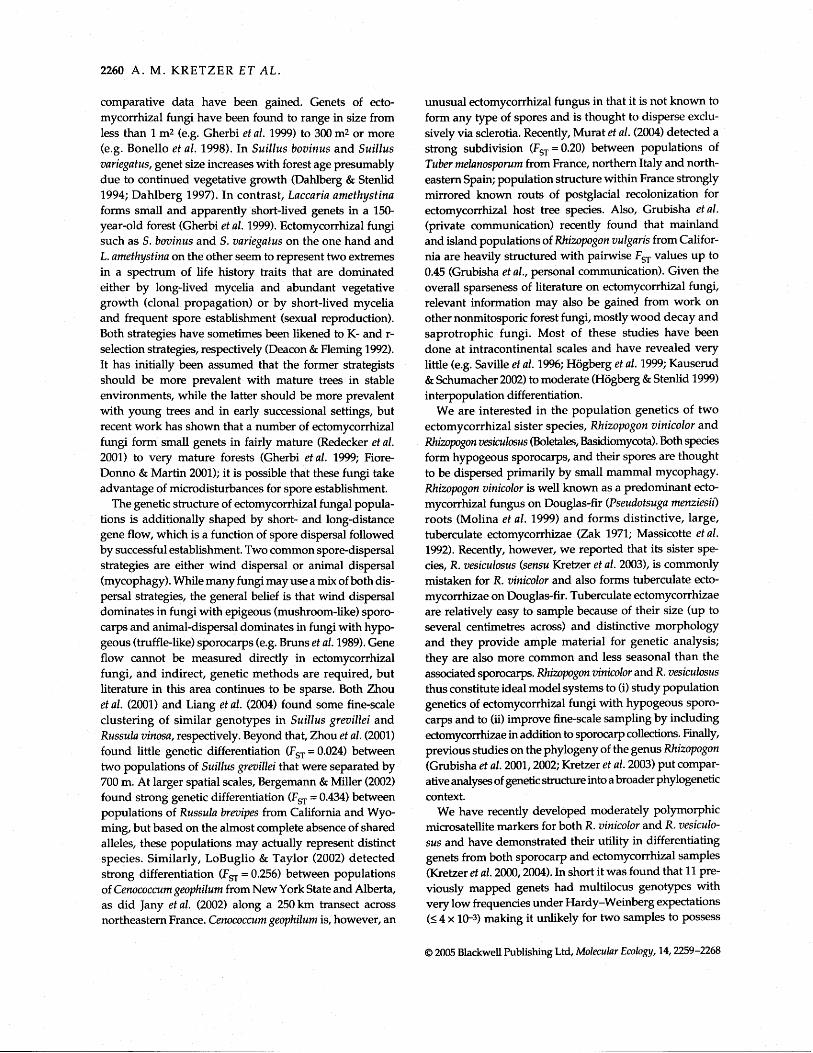
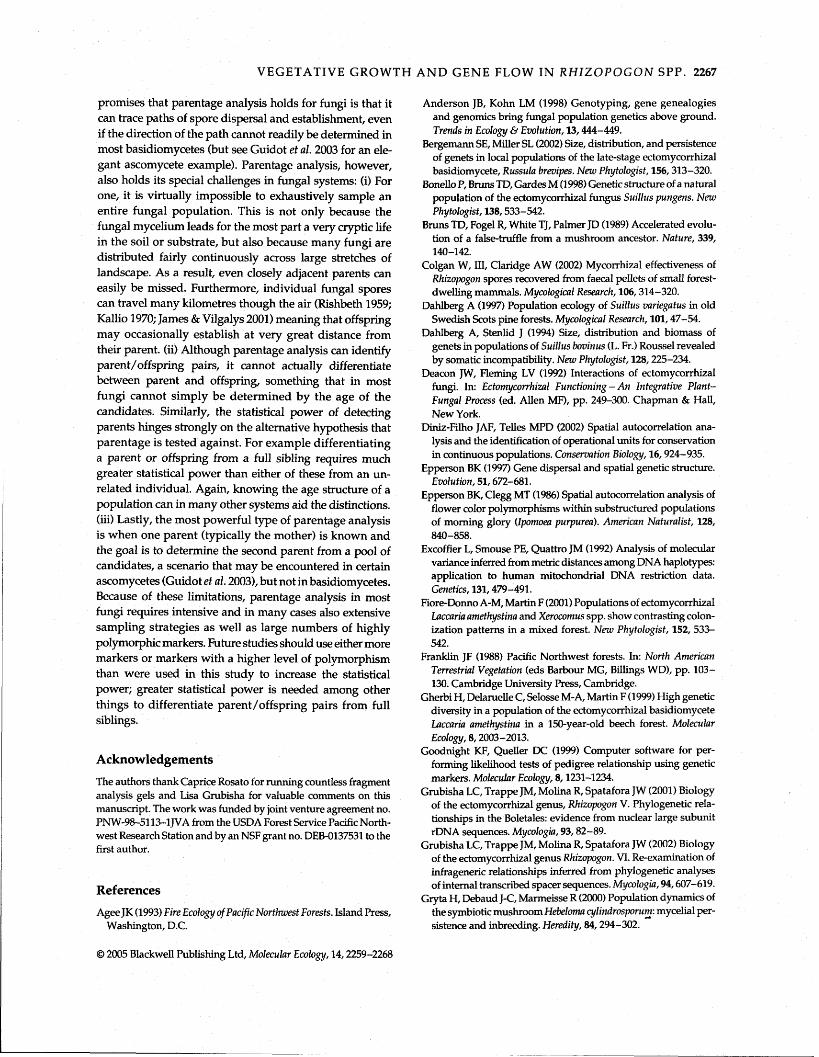
Fig. 1 Distribution of samples across plots MP1, MP3, and MP4. Open circles represent Rhizopogon vinicolor, solid circles represent Rhizopogon vesiculosus, and grey fillings indicate situations where ectomycorrhizae of both species were found within the same c. 0.25 m2 sampling area. The 10 x 10 m area nested within plot MP1 indicates the smaller plot sampled in the Kretzer et al. (2004) study. Multiple samples sharing the same multilocus genotype are surrounded by dashed lines, while single points represent unique multilocus genotypes. Letters indicate pairs of genets that are likely to constitute parent/offspring pairs when tested against the alternative hypothesis of being unrelated (P c 0.001).
one multilocus genotype in R. vesiculosus encompassed two genets each. We know this in part because samples were initially screened with additional markers that were subsequently dropped from the analyses because of scoring irregularities such as small allele dominance and possibly null alleles and in part because they were located on different plots; given that Rhizopogon does not form
O 2005 Blackwell Publishing Ltd, Molecular Ecology, 14,2259-2268
VEGETATIVE GROWTH AND GENE FLOW IN RHIZOPOGON SPP. 2263
mitotic spores, clonal propagation over such distances is extremely unlikely. One of the unresolved genets had missing data at one locus, the others had multilocus genotype frequencies ranging from 4.7 x 10⁻⁴ to 3.5 x 10⁻³. Lack of resolution is thus a combination of larger sample size and missing data in one case. Nevertheless, the number of unresolved genets is very small compared to the total number of samples analysed; it is further reduced to only one genet, when samples from different plots are not analysed together. In total, 181 genets were identified. Thirty-four, 16 and 47 genets were characterized for R. vinicolor from MP1, MP3 and MP4, respectively. Thirty- nine, 29 and 16 genets were characterized for R. vesiculosus from MP1, MP3 and MP4, respectively. Genets of both species were not evenly distributed across the three plots ( ~ 2 = 17.89, d.f. = 2, P < 0.001) with R. vinicolor genets over- represented on MP4 and under represented on MP3 com- pared to R. vesiculosus genets (Fig. 1).
Statistical analyses
Spatial autocorrelation analyses were not performed on data sets with fewer than 20 samples. These were both the
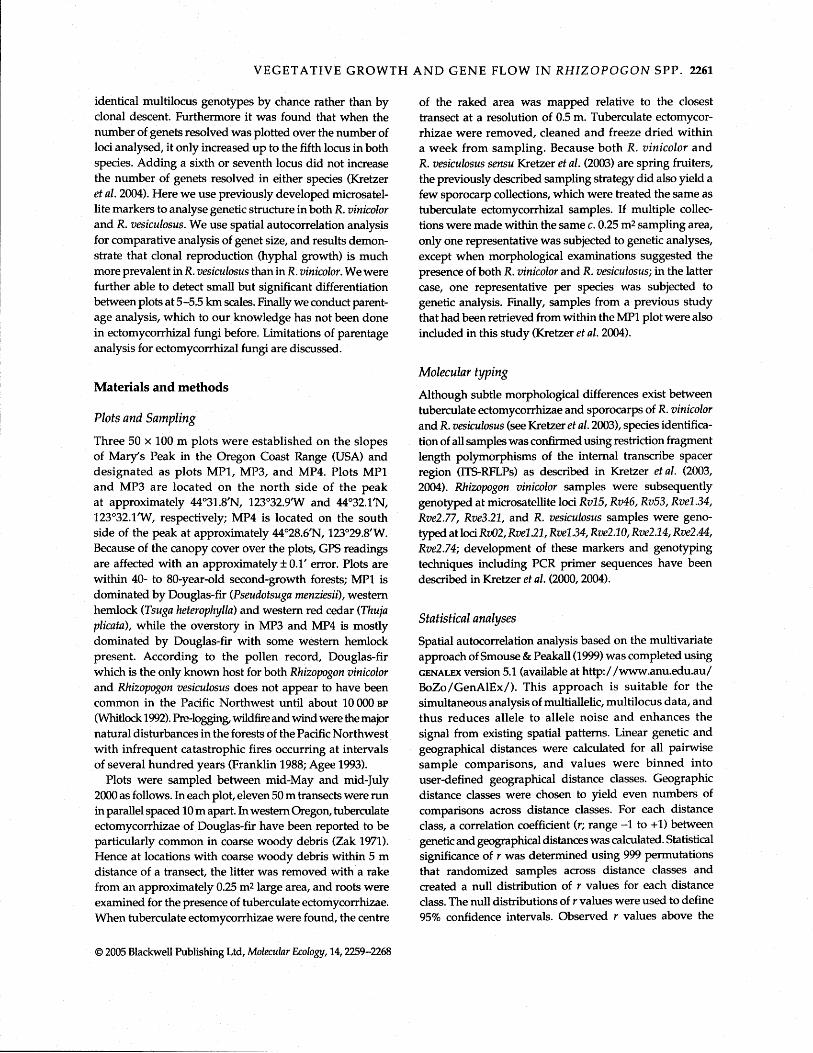
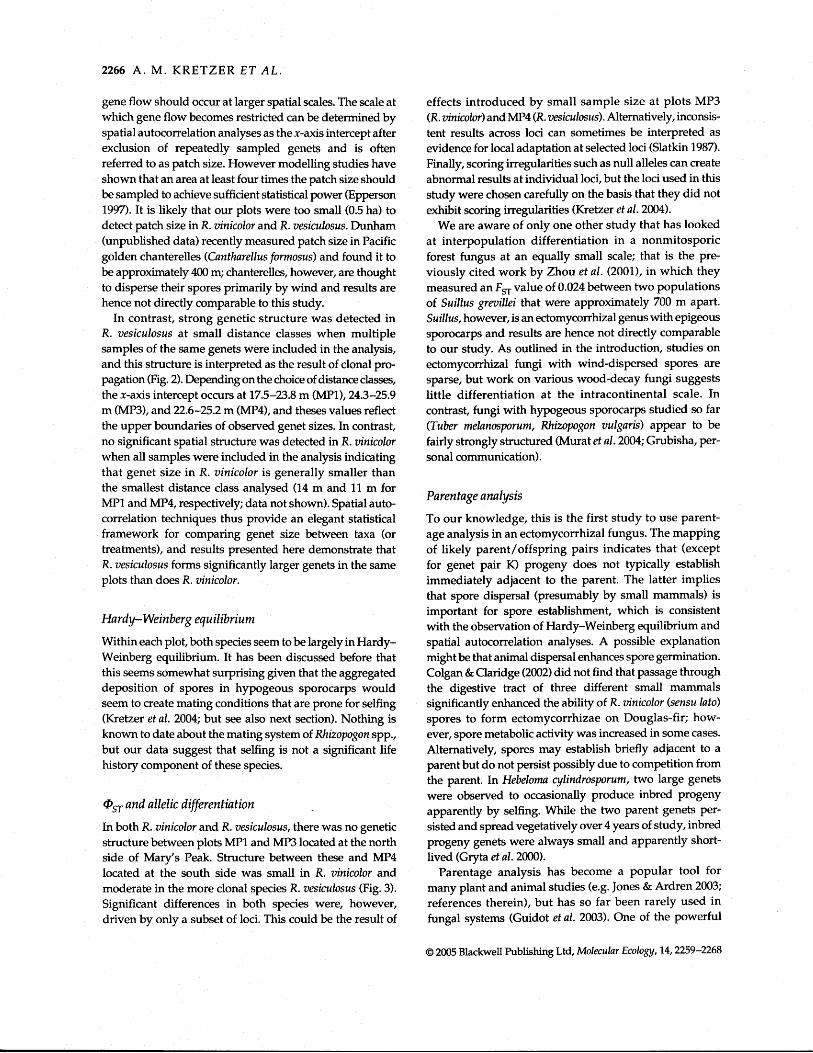
complete and culled MP3 data sets for R. vinicolor and the culled MP4 data set for R. vesiculosus. For all other data sets, multiple analyses were performed using various distance class sizes. Regardless of distance class size, the number of pairwise comparisons was always kept even across all distance classes. In no instance did the number or size of distance classes affect the detection of significant auto- correlation at short distances. Spatial autocorrelation analyses of the complete MP1 or MP4 data sets did not show any significant autocorrelation in R. vinicolor (data not shown). In contrast, strong positive autocorrelation in small distance classes was observed in the complete R. vesiculosus data sets from all three plots (Fig. 2); the first x-axis intercepts of the r values varied slightly between analyses and ranged from 17.5 m to 23.8 m (MPl), 24.3 m to 25.9 m (MP3), and 22.6 m to 25.2 m (MP4). No significant autocorrelation was observed in either species when only one sample per genet was analysed (data not shown).
Within each plot, both R. vinicolor and R. vesiculosus appeared to be largely in Hardy-Weinberg equilibrium. No sigxuficant deviations from Hardy-Weinberg expectations were detected in R. vinicolor (a = 0.05). In R. vesiculosus, a
MPl R. vesiculosus Fig. 2 Correlograms summizing the results 0.6 from spatial autocorrelation analyses of 0.5 ' the complete MP1, MP3, and MP4 data sets 0.4 for Rhizopogon vesiculosus. Distance values 0.3 reflect the upper boundaries of each distance
r. 0.2 class analysed. 0.1
0.0
-0.1
-0.2 6 10 13 16 19 22 25 28 31 34 36 39 41 43 45 47 49 51 54 56 60 64 70 78 88
MP3 0.5 1 I
-0.2 1 I 17 25 34 44 59 84
Distance (m)
O 2005 Blackwell Publishing Ltd, Molecular Ecology, 14,2259-2268
2264 A . M. KRETZER ET AL.
significant heterozygote deficiency was detected only at locus Rve1.21 and only in plot MP4 (P = 0.004). MP4, however, had a small sample size for R. vesiculosus (n = 16), and no significant heterozygote deficiency was detected at any other plot or locus. There was a weak heterozygote excess at locus Rvel.21 in plot MP3 (P = 0.025). General agreement with Hardy-Weinberg expectations was reported earlier for samples from the MP1 plot only (Kretzer et al. 2004).
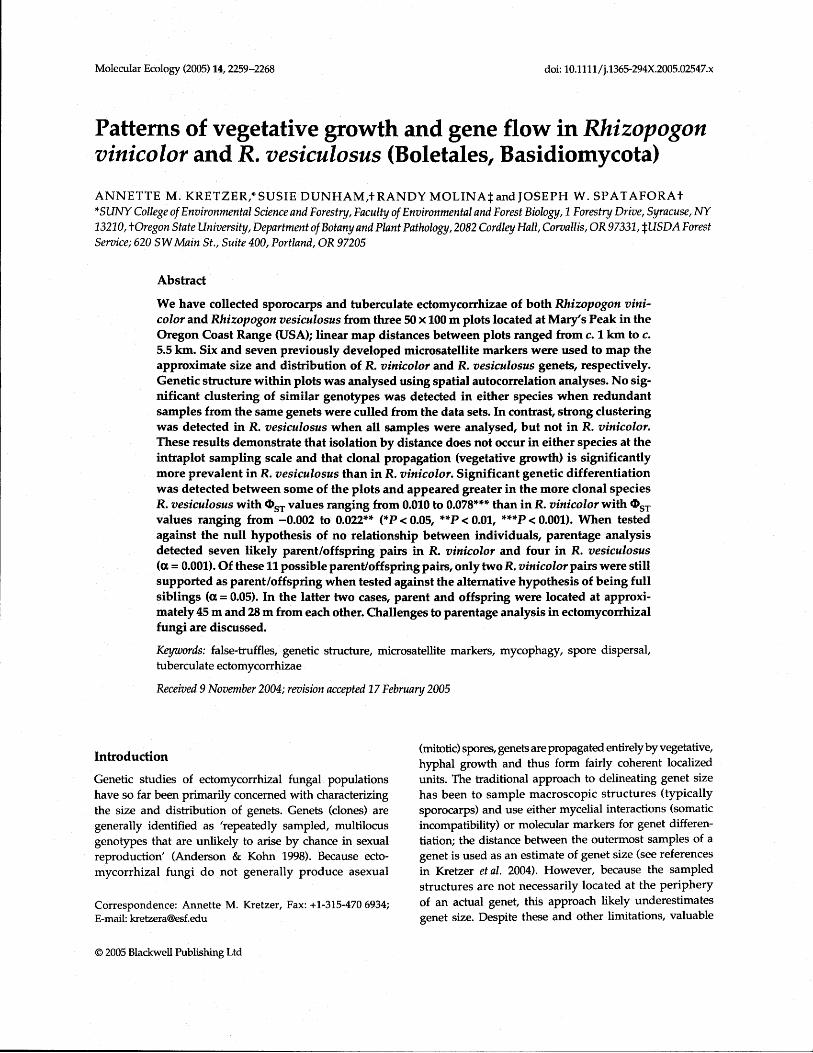
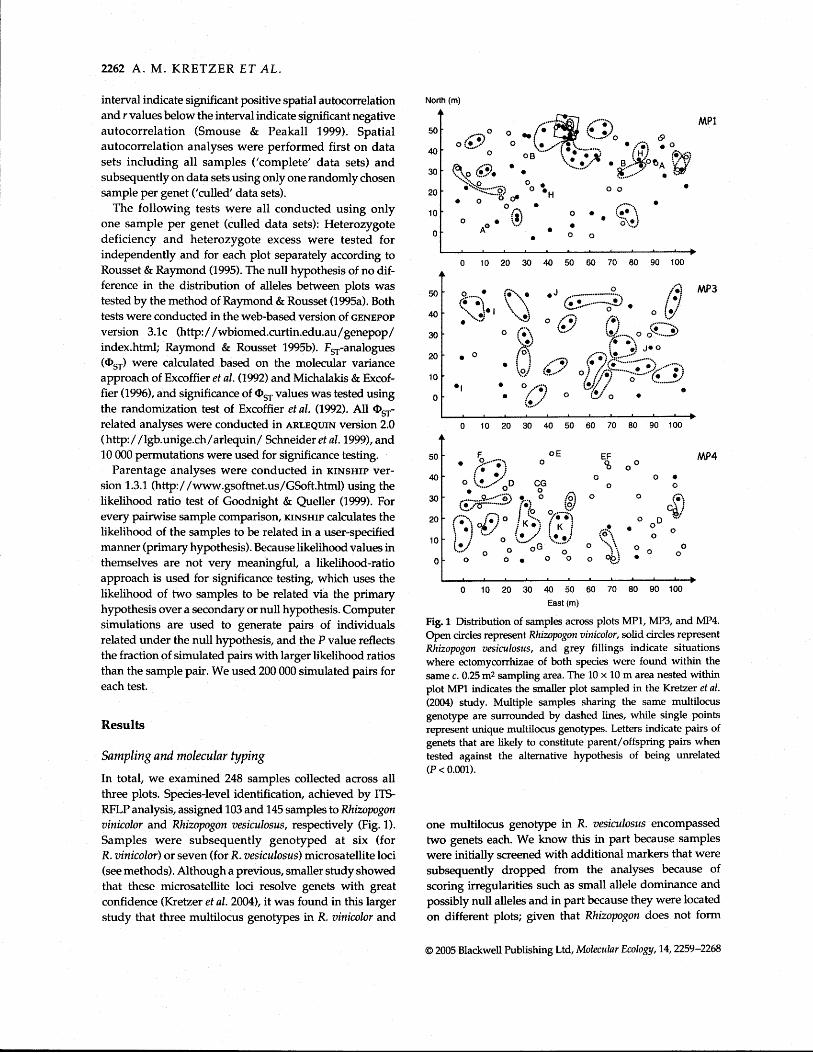
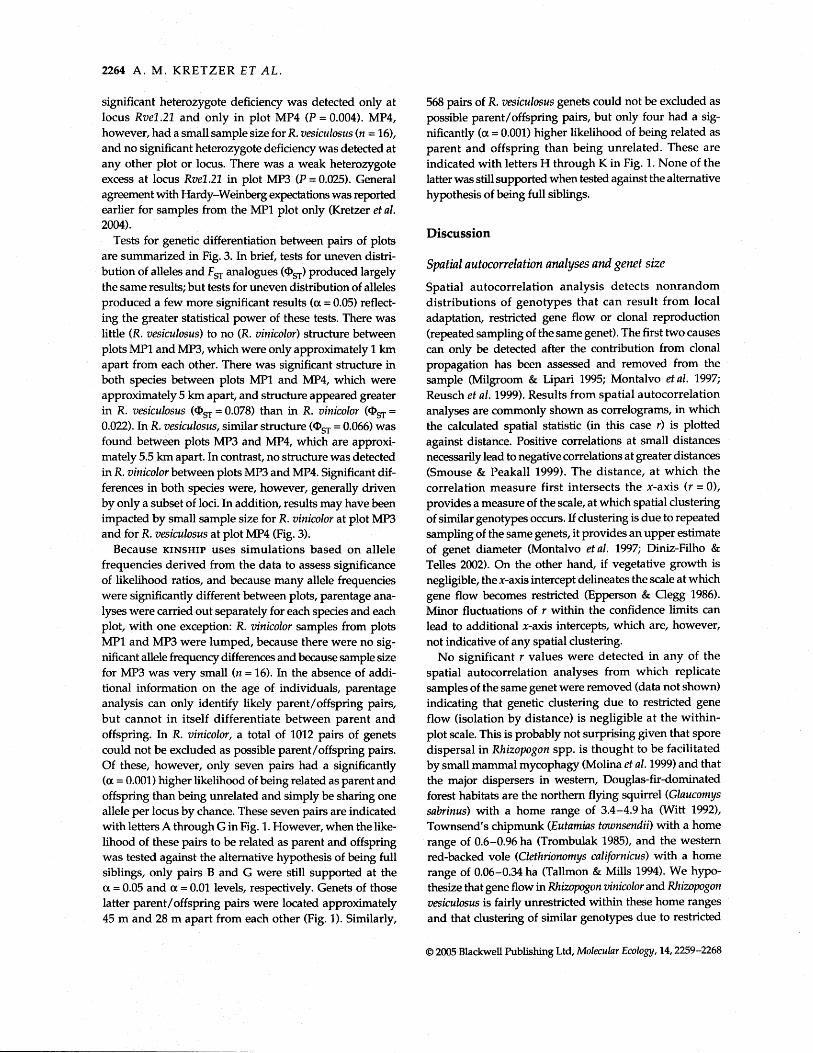
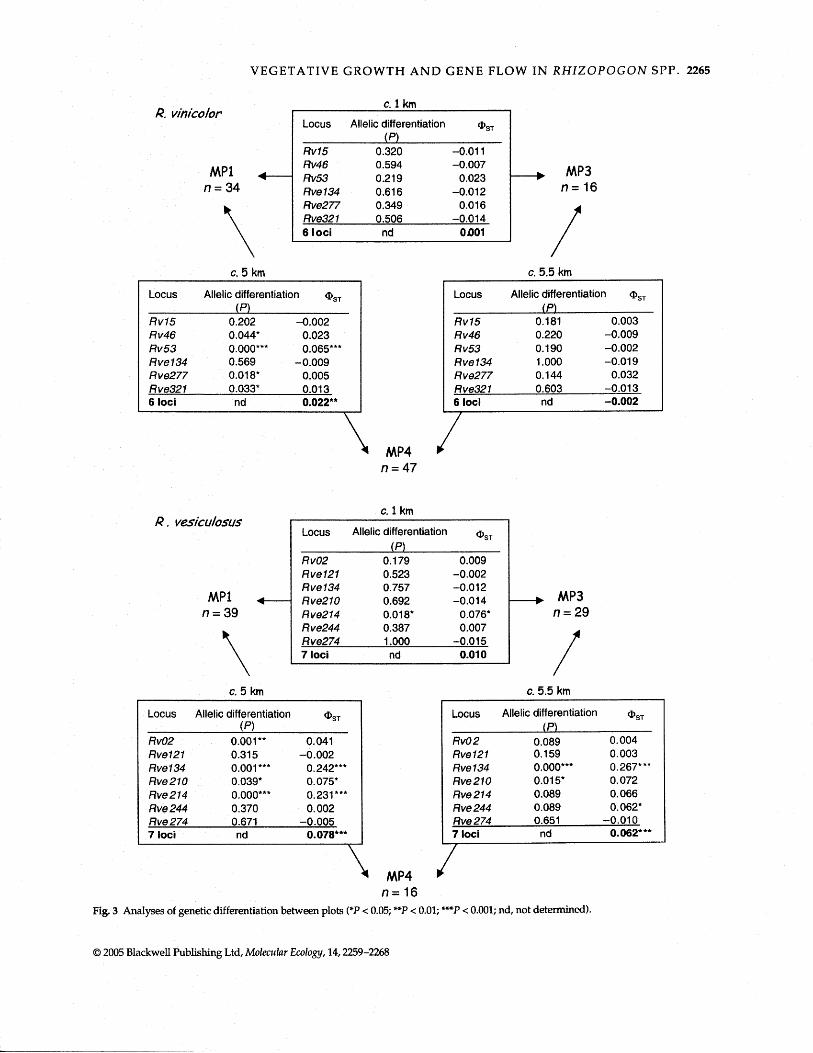
Tests for genetic differentiation between pairs of plots are summarized in Fig. 3. In brief, tests for uneven distri- bution of alleles and FST analogues (QST) produced largely the same results; but tests for uneven distribution of alleles produced a few more significant results (a = 0.05) reflect- ing the greater statistical power of these tests. There was little (R. vesiculosus) to no (R. vinicolor) structure between plots MP1 and MP3, which were only approximately 1 km apart from each other. There was significant structure in both species between plots MP1 and MP4, which were approximately 5 km apart, and structure appeared greater in R. vesiculosus (QsT = 0.078) than in R. vinicolor (QsT = 0.022). In R. vesiculosus, similar structure (aST = 0.066) was found between plots MP3 and MP4, which are approxi- mately 5.5 km apart. In contrast, no structure was detected in R. vinicolor between plots MP3 and MP4. Significant dif- ferences in both species were, however, generally driven by only a subset of loci. In addition, results may have been impacted by small sample size for R. vinicolor at plot MP3 and for R. vesiculosus at plot MP4 (Fig. 3).
Because KINSHIP uses simulations based on allele frequencies derived from the data to assess significance of likelihood ratios, and because many allele frequencies were significantly different between plots, parentage ana- lyses were carried out separately for each species and each plot, with one exception: R. vinicolor samples from plots MP1 and MP3 were lumped, because there were no sig- nificant allele frequency differences and because sample size for M . 3 was very small (n = 16). In the absence of addi- tional information on the age of individuals, parentage analysis can only identlfy likely parent/offspring pairs, but cannot in itself differentiate between parent and offspring. In R. vinicolor, a total of 1012 pairs of genets could not be excluded as possible parent/offspring pairs. Of these, however, only seven pairs had a significantly (a = 0.001) higher likelihood of being related as parent and offspring than being unrelated and simply be sharing one allele per locus by chance. These seven pairs are indicated with letters A through G in Fig. 1. However, when the like- lihood of these pairs to be related as parent and offspring was tested against the alternative hypothesis of being full siblings, only pairs B and G were still supported at the a = 0.05 and a = 0.01 levels, respectively. Genets of those latter parent/offspring pairs were located approximately 45 m and 28 m apart from each other (Fig. 1). Similarly,
568 pairs of R. vesiculosus genets could not be excluded as possible parent/offspring pairs, but only four had a sig- nificantly (a = 0.001) higher likelihood of being related as parent and offspring than being unrelated. These are indicated with letters H through K in Fig. 1. None of the latter was still supported when tested against the alternative hypothesis of being full siblings.
Discussion
Spatial autocorrelation analyses and genet size
Spatial autocorrelation analysis detects nonrandom distributions of genotypes that can result from local adaptation, restricted gene flow or clonal reproduction (repeated sampling of the same genet). The first two causes can only be detected after the contribution from clonal propagation has been assessed and removed from the sample (Milgroom & Lipari 1995; Montalvo et al. 1997; Reusch et al. 1999). Results from spatial autocorrelation analyses are commonly shown as correlograms, in which the calculated spatial statistic (in this case r) is plotted against distance. Positive correlations at small distances necessarily lead to negative correlations at greater distances (Smouse & Peakall 1999). The distance, at which the correlation measure first intersects the x-axis (r = O), provides a measure of the scale, at which spatial clustering of similar genotypes occurs. If clustering is due to repeated sampling of the same genets, it provides an upper estimate of genet diameter (Montalvo et al. 1997; Diniz-Filho & Telles 2002). On the other hand, if vegetative growth is negligible, the x-axis intercept delineates the scale at which gene flow becomes restricted (Epperson & Clegg 1986). Minor fluctuations of r within the confidence limits can lead to additional x-axis intercepts, which are, however, not indicative of any spatial clustering.
No significant r values were detected in any of the spatial autocorrelation analyses from which replicate samples of the same genet were removed (data not shown) indicating that genetic clustering due to restricted gene flow (isolation by distance) is negligible at the within- plot scale. This is probably not surprising given that spore dispersal in Rhizopogon spp. is thought to be facilitated by small mammal mycophagy (Molina et al. 1999) and that the major dispersers in western, Douglas-fir-dominated forest habitats are the northern flying squirrel (Glaucornys sahinus) with a home range of 3.4-4.9 ha (Witt 19921, Townsend's chipmunk (Eutamias townsendii) with a home range of 0.6-0.96 ha (Trombulak 1985), and the western red-backed vole (Clethrionomys californicus) with a home range of 0.06-0.34 ha (Tallmon & Mills 1994). We hypo- thesize that gene flow in Rhizopogon vinicolor and Rhizopogon vesiculosus is fairly unrestricted within these home ranges and that clustering of similar genotypes due to restricted
O 2005 Blackwell Publishing Ltd, Molecular Ecology, 14,2259-2268
VEGETATIVE GROWTH A N D GENE FLOW IN RHIZOPOGON SPP. 2265
R. viniculor Locus Allelic differentiation
Rv15 0.320 -0.01 1 0.594 -0.007 0.219 0.023
n=34 Rve 134 0.61 6 -0.01 2 n = 16
\ 1 ""I :;: -:;; 1 6 loci
Locus Allelic differentiation <g,, ( P)
Rv15 0.202 -0.002 Rv46 0.044* 0.023 Rv53 O.OOO*** 0.065*** Rve 134 0.569 -0.009 Rve277 0.01 8* 0.005 Rve32 1 0.033* 0.01 3 6 loci nd 0.022**
I Locus Allelic differentiation 4, 1 (P)
Rv15 0.181 0.003 Rv46 0.220 -0.009 R v53 0.190 -0.002 Rve134 1.000 -0.01 9 Rve277 0.144 0.032 Rve32 1 0.603 -0.01 3 6 loci nd -0.002
Locus Allelic differentiation aST (PI
Rv02 0.001** 0.041 Rvel21 0.31 5 -0.002 Rve134 0.001 '** 0.242* ** Rve27O 0.039" 0.075' Rve214 0 .OOO*'* 0.231*** Rve 244 0.370 0.002 Rve 274 0.671 -0.005 7 ioci nd 0.078***
Locus Allelic differentiation
Locus Allelic differentiation cp,, (PI
Rv0 2 0.089 0.004 Rvel2l 0.159 0.003 Rve 134 O.OOO*** 0.267*** Rve210 0.01 5* 0.072 Rve214 0.089 0.066 Rve 244 0.089 0.062* Rve 274 0.651 -0.010 7 loci nd 0.062"*
4
Fig. 3 Analyses of genetic differentiation between plots (*P < 0.05; +*P < 0.03; ***P < 0.001; nd, not determined).
(P) Rv02 0.1 79 0.009 Rve 127 0.523 -0.002 Rve134 0.757 -0.012 Rve2lO 0.692 -0.014 b Rve274 0.01 8' 0.076' Rve244 0.387 0.007 Rve274 1 .OOO -0.01 5 7 loci nd 0.01 0
O 2005 Blackwell Publishing Ltd, Molecular Ecology, 14,2259-2268
2266 A. M. KRETZER ET AL.
gene flow should occur at larger spatial scales. The scale at which gene flow becomes restricted can be determined by spatial autocorrelation analyses as the x-axis intercept after exclusion of repeatedly sampled genets and is often referred to as patch size. However modelling studies have shown that an area at least four times the patch size should be sampled to achieve sufficient statistical power (Epperson 1997). It is likely that our plots were too small (0.5 ha) to detect patch size in R. vinicolor and R. vesiculosus. Dunham (unpublished data) recently measured patch size in Pacific golden chanterelles (Cantharellus formosus) and found it to be approximately 400 m; chanterelles, however, are thought to disperse their spores primarily by wind and results are hence not directly comparable to this study.
In contrast, strong genetic structure was detected in R. vesiculosus at small distance classes when multiple samples of the same genets were included in the analysis, and this structure is interpreted as the result of clonal pro- pagation (Fig. 2). Depending on the choice of distance classes, the x-axis intercept occurs at 17.5-23.8 m (MPl), 24.3-25.9 m (MP3), and 22.6-25.2 m (MP4), and theses values reflect the upper boundaries of observed genet sizes. In contrast, no significant spatial structure was detected in R. vinicolor when all samples were included in the analysis indicating that genet size in R. vinicolor is generally smaller than the smallest distance class analysed (14 m and 11 m for MP1 and MP4, respectively; data not shown). Spatial auto- correlation techniques thus provide an elegant statistical framework for comparing genet size between taxa (or treatments), and results presented here demonstrate that R. vesiculosus forms significantly larger genets in the same plots than does R. vinicolor.
Hardy- Wein berg equilibrium
Within each plot, both species seem to be largely in Hardy- Weinberg equilibrium. It has been discussed before that this seems somewhat surprising given that the aggregated deposition of spores in hypogeous sporocarps would seem to create mating conditions that are prone for selfing (Kretzer et al. 2004; but see also next section). Nothing is known to date about the mating system of Rhizopogon spp., but our data suggest that selfing is not a significant life history component of these species.
and allelic differentiation
In both R. vinicolor and R. vesiculosus, there was no genetic structure between plots MP1 and MP3 located at the north side of Mary's Peak. Structure between these and MP4 located at the south side was small in R. vinicolor and moderate in the more clonal species R. vesiculosus (Fig. 3). Significant differences in both species were, however, driven by only a subset of loci. This could be the result of
effects introduced by small sample size at plots MP3 (R. vinicolor) and MP4 (R. vesiculosus). Alternatively, inconsis- tent results across loci can sometimes be interpreted as evidence for local adaptation at selected loci (Slatkin 1987). Finally, scoring irregularities such as null alleles can create abnormal results at individual loci, but the loci used in this study were chosen carefully on the basis that they did not exhibit scoring irregularities (Kretzer et al. 2004).
We are aware of only one other study that has looked at interpopulation differentiation in a nonmitosporic forest fungus at an equally small scale; that is the pre- viously cited work by Zhou et al. (2001), in which they measured an FST value of 0.024 between two populations of Suillus grevillei that were approximately 700 m apart. Suillus, however, is an ectomycorrhizal genus with epigeous sporocarps and results are hence not directly comparable to our study. As outlined in the introduction, studies on ectomycorrhizal fungi with wind-dispersed spores are sparse, but work on various wood-decay fungi suggests little differentiation at the intracontinental scale. In contrast, fungi with hypogeous sporocarps studied so far (Tuber melanosporum, Rhizopogon vulgaris) appear to be fairly strongly structured (Murat et al. 2004; Grubisha, per- sonal communication).
Parentage analysis
To our knowledge, this is the first study to use parent- age analysis in an ectomycorrhizal fungus. The mapping of likely parent/offspring pairs indicates that (except for genet pair K) progeny does not typically establish immediately adjacent to the parent. The latter implies that spore dispersal (presumably by small mammals) is important for spore establishment, which is consistent with the observation of Hardy-Weinberg equilibrium and spatial autocorrelation analyses. A possible explanation might be that animal dispersal enhances spore germination. Colgan & Claridge (2002) did not find that passage through the digestive tract of three different small mammals significantly enhanced the ability of R. vinicolor (sensu lato) spores to form ectomycorrhizae on Douglas-fir; how- ever, spore metabolic activity was increased in some cases. Alternatively, spores may establish briefly adjacent to a parent but do not persist possibly due to competition from the parent. In Hebeloma cylindrosporurn, two large genets were observed to occasionally produce inbred progeny apparently by selfing. While the two parent genets per- sisted and spread vegetatively over 4 years of study, inbred progeny genets were always small and apparently short- lived (Gryta et al. 2000).
Parentage analysis has become a popular tool for many plant and animal studies (e.g. Jones & Ardren 2003; references therein), but has so far been rarely used in fungal systems (Guidot etal. 2003). One of the powerful
O 2005 Blackwell Publishing Ltd, Molecular Ecology, 14,2259-2268
VEGETATIVE GROWTH AND GENE FLOW IN R H I Z O P O G O N SPP. 2267
promises that parentage analysis holds for fungi is that it can trace paths of spore dispersal and establishment, even if the direction of the path cannot readily be determined in most basidiomycetes (but see Guidot et al. 2003 for an ele- gant ascomycete example). Parentage analysis, however, also holds its special challenges in fungal systems: (i) For one, it is virtually impossible to exhaustively sample an entire fungal population. This is not only because the fungal mycelium leads for the most part a very cryptic life in the soil or substrate, but also because many fungi are distributed fairly continuously across large stretches of landscape. As a result, even closely adjacent parents can easily be missed. Furthermore, individual fungal spores can travel many kilometres though the air (Rishbeth 1959; Kallio 1970; James & Vilgalys 2001) meaning that offspring may occasionally establish at very great distance from their parent. (ii) Although parentage analysis can idenhfy parent/offspring pairs, it cannot actually differentiate between parent and offspring, something that in most fungi cannot simply be determined by the age of the candidates. Similarly, the statistical power of detecting parents hinges strongly on the alternative hypothesis that parentage is tested against. For example differentiating a parent or offspring from a full sibling requires much greater statistical power than either of these from an un- related individual. Again, knowing the age structure of a population can in many other systems aid the distinctions. (iii) Lastly, the most powerful type of parentage analysis is when one parent (typically the mother) is known and the goal is to determine the second parent from a pool of candidates, a scenario that may be encountered in certain ascomycetes (Guidot et al. 20031, but not in basidiomycetes. Because of these limitations, parentage analysis in most fungi requires intensive and in many cases also extensive sampling strategies as well as large numbers of highly polymorphic markers. Future studies should use either more markers or markers with a higher level of polymorphism than were used in this study to increase the statistical power; greater statistical power is needed among other things to differentiate parent/offspring pairs from full siblings.
Acknowledgements
Anderson JB, Kohn LM (1998) Genotyping, gene genealogies and genomics bring fungal population genetics above ground. Trends in Ecology & Evolution, 13,444-449.
Bergemann SE, Miller SL (2002) Size, distribution, and persistence of genets in local populations of the late-stage ectomycorrhizal basidiomycete, Russula brevipes. N m Phytologist, 156,313-320.
Bonello P, Bruns TD, Gardes M (1998) Genetic structure of a natural population of the edomycorrhizal fungus Suillus pungens. New Phytologist, 138,533-542.
B m TD, Fogel R, White TJ, Palmer JD (1989) Accelerated evolu- tion of a false-truffle from a mushroom ancestor. Nature, 339, 140-142.
Colgan W, 111, Claridge AW (2002) Myconhizal effectiveness of Rhizopogon spores recovered from faecal pellets of small forest- dwelling mammals. Mycological Research, 106,314-320.
Dahlberg A (1997) Population ecology of Suillus variegatus in old Swedish Scots pine forests. Mycological Research, 101,47-54.
Dahlberg A, Stenlid J (1994) Size, distribution and biomass of genets in populations of Suillus bovinus (L. Fr.) Roussel revealed by somatic incompatibility. New Phytologist, 128,225-234.
Deacon JW, Fleming LV (1992) Interactions of ectornycorrhizal fungi. In: Ectomycorrhizal Functioning - An Integrative Plant- Fungal Process (ed. Allen MF), pp. 249-300. Chapman & Hall, New York.
Diniz-Filho JAF, Telles MPD (2002) Spatial autocorrelation ana- lysis and the identification of operational units for conservation in continuous populations. Conservation Biology, 16,924-935.
Epperson BK (1997) Gene dispersal and spatial genetic structure. Evolution, 51,672-681.
Epperson BK, Clegg MT (1986) Spatial autocorrelation analysis of flower color po1ymorphisms within substructured populations of morning glory (Ipomoea purpurea). American Naturalist, 128, 840-858.
Excoffier L, Smouse PE, Quattro JM (1992) Analysis of molecular variance inferred from metric distances among DNA haplotypes: application to human mitochondria1 DNA restriction data. Genetics, 131,479-491.
Fiore-Donno A-MI Martin F (2001) Populations of ectornycorrhizal Laccaria amethystina and Xerocomus spp. show contrasting colon- ization patterns in a mixed forest. Nezu Phytologist, 152, 533- 542.
Franklin JF (1988) Pacific Northwest forests. In. North American Terrestrial Vegetation (eds Barbour MG, Billings WD), pp. 103- 130. Cambridge University Press, Cambridge.
Gherbi HI Delaruelle C, Selosse M-A, Martin F (1999) High genetic diversity in a population of the edomycorrhizal basidiomycete Laccaria amethystina in a 150-year-old beech forest. Molecular Ecology, 8,2003-2013.
Goodnight KF, Queller DC (1999) Computer software for per- forming likelihood tests of pedigree relationship using genetic
The authors thank Caprice Rosato for running countless fragment markers. Molecular Ecology, 8,1231-1234.
analysis gels and Lisa Grubisha for valuable co-enh on this Grubisha LC. Trappe W, Molina R, Spa tafora JW (2001) Biology
manuscript. The work was funded by joint venture agreement no. of the ectomycorrhizal genus, Rhizopogon V. Phylogenetic rela-
PNW-98-5113-IJVA from the USDA Forest Service Pacific North- tionships in the Boletales: evidence from nuclear large subunit
west Research Station and by an NSF grant no. DEB-0137531 to the rDNA sequences. Mycologia, 93,82-89.
first author. Grubisha LC, Trappe JM, Molina R, Spatafora JW (2002) Biology of the edomycorrhizal genus Rhizopogon. VI. Re-examination of infrageneric relationships inferred from phylogenetic analyses
References of internal transcribed spacer sequences. Mycologia, 94,607-619. Gryta HI Debaud J-C, Marmeisse R (2000) Population dynamics of
Agee JK (1993) Fire Ecology of Pacific Northwest Forests. Island Press, the symbiotic mushroom Hebeloma cylindrosporuz: mycelial per- Washington, D.C. sistence and inbreeding. Heredity, 84,294-302.
O 2005 Blackwell Publishing Ltd, Molecular Ecology, 14,2259-2268
2268 A . M. KRETZER ET AL.
Guidot A, Johannesson HI Dahlberg A, Stenlid J (2003) Parental tracking in the postfire wood decay ascomycete Daldinia loculata using highly variable nuclear gene loci. Molecular Ecology, 12, 1717-1730.
Hogberg N, Stenlid J (1999) Population genetics of Fomitopsis rosea - a wood-decay fungus of the old-growth European taiga. Molecular Ecology, 8,703-710.
Hogberg N, Holdenrider 0 , Stenlid J (1999) Population structure of the wood decay fungus Fomitopsis pinicola. Heredity, 83,354- 360.
James TY, Vilgalys R (2001) Abundance and diversity of Schizo- phyllum commune spore clouds in the Caribbean detected by selective sampling. Molecular Ecology, 10,471-479.
Jany J-L, Garbaye J, Martin F (2002) Cenococcum geophilum popula- tions show a high degree of genetic diversity in beech forests. New Phytologist, 154,651-659.
Jones AG, Ardren WR (2003) Methods of parentage analysis in natural populations. Molecular Ecology, 12,2511-2523.
Kallio T (1970) Aerial distribution of the root-rot fungus Fomes annosus (Fr.) Cooke in Finland. Acta Forestalia Fennica, 107,l-55.
Kauserud H, Schumacher T (2002) Population structure of the endangered wood decay fungus Phellinus nigrolimitatus (Basidio- mycota). Canadian Journal of Botany, 80,597-606.
Kretzer AM, Molina R, Spatafora JW (2000) Microsatellite markers for the ectomycorrhizal basidiomycete Rhizopogon viniwlor. Molecular Ec~logy, 9,1190-1191.
Kretzer AM, Luoma DL, Molina R, Spatafora JW (2003) Taxonomy of the Rhizopogon vinicolor species complex based on analysis of ITS sequences and microsatellite loci. Mycologia, 95,480-487.
Kretzer AM, Dunham S, Molina R, Spatafora JW (2004) Micro- satellite markers reveal the below ground distribution of genets in two species of Rhizopogon forming tuberculate ectomycorrhhs on Douglas-fir. New Phytologist, 161,313-320.
Liang Y, Guo L, Ma K (2004) Genetic structure of a population of the ectomycorrhizal fungus Russula vinosa in subtropical wood- lands in southwest China. Mycorrhiur, 14,235-240.
LoBuglio KF, Taylor JW (2002) Recombination and genetic differ- entiation in the mycorrhizal fungus Cenococcum geophilum Fr. Mycologia, 94,772-780.
Massicotte HB, Melville LH, Li CY, Peterson RL (1992) Structural aspects of Douglas-fir [Pseudotsuga menziesii (Mirb.) Franc01 tuberculate ectomyconhizae. Trees, 6,137-146.
Michalakis Y, Excoffier L (1996) A genetic estimation of population subdivision using distances between alleles with specla1 reference to microsatellite loci. Genetics, 142,1061-1061-64.
Milgroom MG, Lipari SE (1995) Spatial analysis of nuclear and mitochondria1 RFLP genotypes in populations of the chestnut blight fungus, Cryphonectria parasitica. Molecular Ecology, 4,633- 642.
Molina R, Trappe J, Grubisha L, Spatafora J (1999) Rhizopogon. In: Ectomycorrhizal Fungi: Key Genera in Profile (eds Cairney JWG, Chambers SM), pp. 129-161. Springer-Verlag, Heidelberg.
Montalvo AM, Conard SG, Conkle MT, Hodgskiss PD (1997) Population structure, genetic diversity, and clone formation in Quercus chrysolepis (Fagaceae). American Journal of Botany, 84, 1553-1564.
Mura t C, Diez J, Luis P et al. (2004) Polymorphism at the ribosomal DNA ITS and its relation to postglacial re-colonization routes of
the Perigord truffle Tuber melanosporum. New Phytologist, 164, 401-411.
Raymond MI Rousset F (1995a) An exact test for population differ- entiation. Evolution, 49,1280-1283.
Raymond MI Rousset F (1995b) GENEPOP (version 1.2): population genetics software for exad tests and emenicism. Journal of Heredity, 86,248-249.
Redecker Dl Szaro TM, Bowman RJ, Bruns TD (2001) Small genets of Luctarius xanthogalactus, Russula brevipes and Amanita francheti in Iate-stage ectomycorrhizal successions. Molecular Ecology, 10, 1025 -1034.
Reusch TBH, Hukriede W, Stam WT, Olsen JL (1999) Differenti- ating between clonal growth and limited gene flow using spatial autocorrelation of microsatellites. Heredity, 83,120-126.
Rishbeth J (1959) Dispersal of Fornes annosus Fr. And Peniophora gigantea (Fr.) Massee. Transactions of the British Mycological Society, 42,243-260.
Rousset F, Raymond M (1995) Testing heterozygote excess and deficiency. Genetics, 140,1413-1419.
Saville BJ, Yoell HI Anderson JB (1996) Genetic exchange and recombination in populations of the root-infecting fungus Armillaria gallica. Molecular Ecology, 5,485-497.
Schneider S, Roessli Dl Excoffier L (1999) ARLEQUIN, Version 2.0: a Software for Population Genetic Data Analysis. Genetics and Biometry Laboratory, University of Geneva, Switzerland.
Slatkin M (1987) Gene flow and the geographic structure of natural populations. Science, 236,787-792.
Smouse PE, Peakall R (1999) Spatial autocorrelation analysis of multi-allele and multi-locus genetic microstructure. Heredity, 82, 561-573.
Tallrnon D, Mills LS (1994) Use of logs within home ranges of California red-backed voles on a remnant of forest. Journal of Mammalogy, 75,97-101.
Trombulak SC (1985) The influence of interspecific competition on home range size in chipmunks (Eutamias). Journal of Mammalogy, 66,329-337.
Whitlock C (1992) Vegetational and climatic history of the Pacific Northwest during the last 20 000 years: implications for under- standxng present-day biodiversity. Northwest Environmenfal Journal, 8,5-28.
Witt JW (1992) Home range and density estimates for the northern flying squirrel, Glaucomys sabrinus, in western Oregon. Journal of Mammalogy, 73,921-929.
Zak B (1971) Characterization and classification of mycorrhizas of Douglas-fir. 11. Pseudotsuga menziesii + Rhizopogon vinicolor. Canadian Journal of Botany, 49,1079-1048.
Zhou Z, Miwa M, Hogetsu T (2001) Polymorphism of simple sequence repeats reveals gene flow within and between ecto- mycorrhizal Suillus gfevillei populations. New Phytologist, 149, 339-348.
The authors of this manuscript are interested in how genetic diversity is structured in ectomycorrhizal and other forest fungi and seek to close current information gaps in this area. This work was initiated in response to research and management mandates under the original Northwest Forest Plan.
O 2005 Blackwell Publishing Ltd, Molecular Ecology, 14,2259-2268