Embed Size (px)
Citation preview
Patterns of maternity care in English NHS trusts 2013/14
March 2016

Patterns of maternity care in English NHS trusts 2013/14
March 2016

© 2016 The Royal College of Obstetricians and Gynaecologists
First published 2016
All rights reserved. No part of this publication may be reproduced, stored or transmitted in any form or by any means, without the prior written permission of the publisher or, in the case of reprographic reproduction, in accordance with the terms of licences issued by the Copyright Licensing Agency in the UK [www.cla.co.uk]. Enquiries concerning reproduction outside the terms stated here should be sent to the publisher at the UK address printed on this page.
Published by the Royal College of Obstetricians and Gynaecologists, 27 Sussex Place, Regent’s Park, London NW1 4RG
www.rcog.org.uk
Registered charity no. 213280
Report authors: Fran Carroll, Research Fellow, Lindsay Stewart Centre for Audit and Clinical Informatics Hannah Knight, Manager, Lindsay Stewart Centre for Audit and Clinical Informatics David Cromwell, Reader, London School of Hygiene and Tropical Medicine Ipek Gurol-Urganci, Lecturer, London School of Hygiene and Tropical Medicine Jan van der Meulen, Professor of Clinical Epidemiology, London School of Hygiene and Tropical Medicine
Typeset by Andrew Welsh (www.andrew-welsh.com)
Contents
Acknowledgements .............................................................................................................................................. iv
Abbreviations ..........................................................................................................................................................v
Glossary ..................................................................................................................................................................vi
Foreword ..............................................................................................................................................................viii
Summary .................................................................................................................................................................ix
1 Introduction ......................................................................................................................................................1Challenges for maternity services ............................................................................................................................................ 1
Why measure variation? ................................................................................................................................................................ 1
Key changes from previous report .......................................................................................................................................... 2
2 Data source .......................................................................................................................................................4Hospital Episode Statistics ............................................................................................................................................................ 4
Selection of the cohort .................................................................................................................................................................. 4
Trust-level analysis ............................................................................................................................................................................. 5
Analysis and case-mix adjustment ........................................................................................................................................... 5
Presentation of data using funnel plots ................................................................................................................................. 7
3 Results ................................................................................................................................................................9Spontaneous unassisted vaginal deliveries .......................................................................................................................... 9
Indicators relating to induction of labour .......................................................................................................................... 11
Indicators relating to caesarean section .............................................................................................................................15
Involvement of instruments ...................................................................................................................................................... 22
Episiotomy ............................................................................................................................................................................................24
Indicators relating to third- and fourth-degree tears .................................................................................................27
Unplanned readmission to hospital ......................................................................................................................................31
4 Data quality .................................................................................................................................................... 35Quality of HES data........................................................................................................................................................................35
Assessment of data quality ........................................................................................................................................................36
Data quality implications..............................................................................................................................................................38
Unit results of data quality assessments ............................................................................................................................39
5 Key recommendations ................................................................................................................................. 43For NHS trusts ..................................................................................................................................................................................43
For commissioners ..........................................................................................................................................................................43
For researchers .................................................................................................................................................................................43
6 Stakeholder viewpoints ............................................................................................................................... 44
References .............................................................................................................................................................51
Appendix 1 Contributors ................................................................................................................................ 55
Appendix 2 Variable definitions and indicator specifications ................................................................. 57
Appendix 3 Clinical indications for prelabour caesarean section before 39 weeks of gestation .. 69
iviv Acknowledgements
This report has been prepared by the Lindsay Stewart Centre for Audit and Clinical Informatics at the Royal College of Obstetricians and Gynaecologists (RCOG) in collaboration with the Department of Health Services Research and Policy at the London School of Hygiene and Tropical Medicine (LSHTM).
We would like to thank the Clinical Effectiveness Unit (CEU) at the Royal College of Surgeons of England for supporting this project and providing access to the Hospital Episode Statistics (HES) data used in the analysis for this report. In particular, we are grateful to Lynn Copley for her support with data extraction. HES data were made available by the NHS Health and Social Care Information Centre (HSCIC) (Copyright 2012, reused with the permission of the HSCIC. All rights reserved).
We are indebted to those who have contributed to the latest version of this report, including members of the consensus and clinical interpretation groups named in Appendix 1, who guided the development and specification of the indicators described in this report as well as the interpretation of the findings.
We would also like to thank the hospitals that contacted us with their feedback following publication of the first report in 2013, and those that have provided their comments during the process of producing this report.
We are grateful to members of the RCOG committees who have provided useful thoughts and valuable feedback on draft versions of this report, particularly the Lindsay Stewart Committee for Audit and Clinical Informatics and the Clinical Quality Board.
This work was funded in part by a generous legacy donation made by Dr Lindsay Stewart OBE CA FRCOG(hon) FRCSEd FRCSI to support research and development activities within the RCOG.

vvAbbreviations
BMI body mass index
CQC Care Quality Commission
FMLU freestanding midwifery-led unit
HES Hospital Episode Statistics
HESID Hospital Episode Statistics Identification Number
HSCIC Health and Social Care Information Centre
ICD-10 International Classification of Diseases, 10th edition
LSHTM London School of Hygiene and Tropical Medicine
MSDS Maternity Services Dataset
NCT National Childbirth Trust
NICE National Institute for Health and Care Excellence
OPCS Office of Population, Censuses and Surveys Classification of Surgical Operations and Procedures, 4th revision
PROM prelabour rupture of membranes
RCM Royal College of Midwives
RCOG Royal College of Obstetricians and Gynaecologists
RCT randomised controlled trial
SGA small-for-gestational-age
VBAC vaginal birth after caesarean section
vivi Glossary
Case-mixClinical and demographic characteristics of patients affect both the demands placed on the service and the outcomes of care. Case-mix refers to the diversity of these characteristics among the group of patients who receive care at a particular health service.
CephalicA medical term that means relating to the head. It is commonly used to describe how a baby is lying at the time of birth. Cephalic presentation means that the baby presents head first, and is the most common form of presentation at delivery.
EpisiotomyA medical term used to describe a surgical incision made in the perineum to enlarge the vaginal opening during delivery.
Hospital Episode Statistics (HES)A data ‘warehouse’ containing the records of all in-patient admissions and day cases in English NHS hospitals. HES records are created from data extracted from local hospital patient administration systems. HES is administrated by the Health and Social Care Information Centre (HSCIC), a non-departmental public body sponsored by the Department of Health.
HES maternity tailEach HES record related to the delivery of a baby can contain details about the labour and delivery (e.g., parity, mode of delivery, gestational age, birthweight). This supplementary data is known as the HES maternity tail.
IndicatorA measure that can be used to describe levels of performance that can help identify possible problems and/or opportunities for improvement within a service.
IntrapartumThe medical term relating to the time spanning labour and delivery.
MultiparousThe medical term used to describe a woman who has given birth before.
PrimiparousThe medical term used to describe a woman who is giving birth for the first time.
Random variationA statistical term that refers to the tendency of a process to vary due to the influence of chance events. This means that, when a sample is used to estimate the value of an indicator, there will be some uncertainty about how close it is to the true value. In general, the larger the sample size, the lower the impact of random variation on the estimated value.
vii
Patterns of maternity care in English N
HS trusts 2013/14
Risk-adjustmentWhen presenting figures for individual hospitals, indicators must take into account the different characteristics of patients using each hospital. Risk-adjustment is a statistical technique that takes account of these differences. To make fair and meaningful comparisons across hospitals it is essential to remove these differences because they are outside the control of the organisations.
Routine dataData routinely collected by hospitals for administrative purposes. The data are primarily intended for health service planning and guiding the reimbursement of health care expenses, but can also be used to study patterns of care. HES is an example of a routine database.
Statistical powerThe likelihood that a statistical test will detect a difference when there is a difference to be detected. It depends on the sample size, the significance level of the test and the size of difference defined as clinically meaningful.
TermA term pregnancy is one that has lasted for at least 37 complete weeks of gestation.
ValidityThe extent to which an indicator accurately captures what it is designed to measure. An indicator is valid if differences in the values of the indicator across various providers reflect differences in the quality of care.
viiiviii Foreword
As Donald Berwick stated 25 years ago, ‘Professionals need to embrace the scientific control of variation in the service of their patients and themselves’.1
The first RCOG ‘Patterns of Maternity Care’ report, published in 2013, made important steps towards allowing the clinical effectiveness and efficiency of maternity care in England to be monitored by presenting a suite of eleven maternity indicators that could be derived from nationally available data.
Our original intention was to make this an annual publication. Such a timescale proved impossible due to an unforeseen delay in receiving the Hospital Episode Statistics (HES) data on which the indicators are based. However, since the data were made available in mid-2015, we have been working hard to deliver this long-anticipated second report which sees the inclusion of seven additional indicators, taking the total to eighteen.
It is clear that this initiative remains highly valued by the profession and I am delighted to see that it has already stimulated considerable discussion about local quality improvement in the spirit in which it was intended. It is vital that each of us reflects on the results contained within this national report, and the trust-level results which are available online. I hope that the new ability to compare results between trusts will trigger local, regional and national discussions that lead to improvements in the quality of care we provide for the future generations of women for whom we are privileged to care.
The recently published NHS England National Maternity Review makes a series of key recommen-dations for how services should change over the next five years to ensure that safer, personalised maternity services are available to all. One of the key recommendations was to develop a national set of indicators to help local maternity systems to track, benchmark and improve the quality of maternity services, and I am proud of the important progress that the RCOG has been able to make in this area. The introduction of a National Maternity Dataset for England from April 2015 should soon provide a richer source of information on the care of pregnant women and their babies. Its long-anticipated arrival is to be welcomed, as is the announcement of a new National Maternity and Perinatal Audit for England, Scotland and Wales to begin later this year, which I am delighted to announce will be led by the RCOG in partnership with the RCM, RCPCH and LSHTM.
By routinely collecting data on outcomes and mandating standardised perinatal morbidity and mortality reviews, trusts across the country will be able to benchmark their performance against others’ and aim to reduce variation and improve outcomes. It is somewhat disappointing to see that eighteen trusts, representing over 10% of the total, failed all four of our data quality checks. In our communication with trusts, some also raised concerns about apparent discrepancies between local data and the figures derived from HES data. Since HES data come from hospitals’ internal systems that they themselves have submitted to the HSCIC, local reflection on how these discrepancies occur is essential. Only then can improvements be made so that these data sources are consistent. This emphasises the need for much greater clinical engagement with NHS IT systems in order to comply with the need for improved data quality and to avoid the situation described by Sir Bruce Keogh where ‘if you do not know what you are doing and how well you are doing it, you have no right to be doing it at all’.
Alan Cameron Vice President (Clinical Quality)
Royal College of Obstetricians and Gynaecologists
ixixSummary
Maternity care represents a major component of NHS hospital services. In 2013, there were 690 820 live births in England, over 97% of which took place in an NHS setting.
This is the second report that the RCOG has published describing patterns of maternity care practice and outcomes within the English NHS using data routinely collected by NHS hospitals. The first report2 presented a set of clinically relevant and technically robust indicators, developed by a panel of clinical and methodological experts. It revealed that NHS maternity units in England were achieving similar outcomes but that there were large degrees of variation in some areas of practice. This second edition revises and extends the suite of indicators, thereby aiming to improve the quality of information available to NHS maternity services to use for performance assessment and quality improvement.
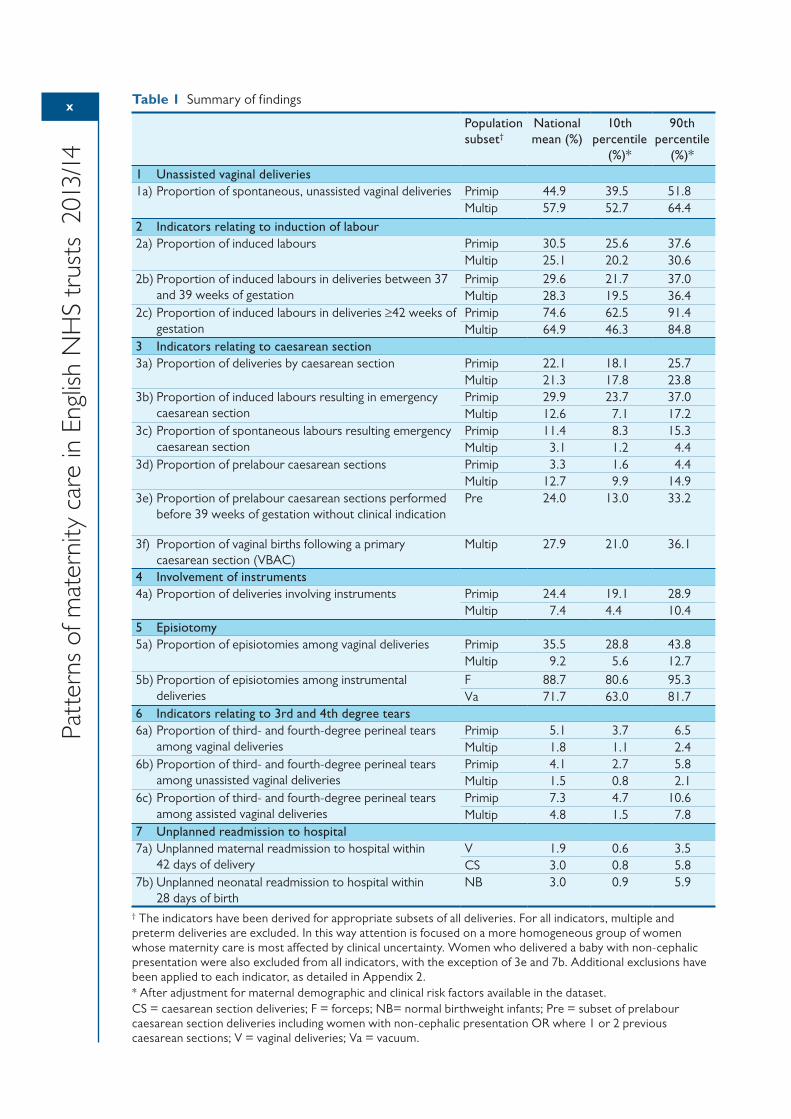
The second report again shows substantial variation in practice between NHS maternity units in England (Table 1). This variation is a source of concern because it suggests the care that women receive depends upon where they live. It also suggests that NHS resources are not being used in the most efficient way. Some of the variation could be due to differences in patient characteristics that could not be controlled for, or to differences in the quality of the data submitted by NHS trusts, but these are unlikely to explain the wide degree of variation seen across maternity units. Nonetheless, these data quality issues within routine hospital data, described in detail in Chapter 4 of this report, must now be addressed as a matter of national priority. The implementation of a national Maternity Services Dataset (MSDS) for England by the HSCIC from April 2015 should soon provide a richer source of information on the care of pregnant women and their babies. Its arrival is to be welcomed, as is the announcement of a new National Maternity and Perinatal Audit for England, Scotland and Wales to begin later in 2016.
The aim of the national picture presented in this report and the trust-level results available at https://indicators.rcog.org.uk/ is to provide maternity services and commissioners with meaningful high-quality information that allows them to identify priority areas for improving both the outcomes for women and their babies. In order to gain a full understanding of their service, maternity services should look at the whole pattern of their results and explore the relationships between the indicators, rather than focussing on individual results that may stand out as being high or low.
We hope that the information presented in this report will serve as a useful resource for the profession and offer the following key recommendations for NHS trusts, commissioners and researchers:
1 NHS maternity services should examine the trust-level figures that are available online at https://indicators.rcog.org.uk/. These indicators should be used as a basis for reflection on current practice and the causes of local variation. The results could be used to identify ‘peer’ units for comparison.
2 Maternity services should aim to enter complete data into the HES maternity tail. Units should also ensure standard coding definitions are followed to improve consistency, such as the distinction between induction and augmentation. Clinicians must take ownership of their own data in order to drive up quality.
3 Local commissioners and clinicians in consultation with patient groups should review the areas of maternity care described in this report and agree what steps will be taken to improve local outcomes.
4 Research is required to clarify ‘acceptable ranges’ of performance for intrapartum care processes and outcomes.
5 There is a need for improved understanding of the relationships between different process and outcome indicators.
x
Patt
erns
of m
ater
nity
car
e in
Eng
lish
NH
S tr
usts
201
3/14
Table 1 Summary of findings
Population subset†
National mean (%)
10th percentile
(%)*
90th percentile
(%)*
1 Unassisted vaginal deliveries1a) Proportion of spontaneous, unassisted vaginal deliveries Primip 44.9 39.5 51.8
Multip 57.9 52.7 64.42 Indicators relating to induction of labour2a) Proportion of induced labours Primip 30.5 25.6 37.6
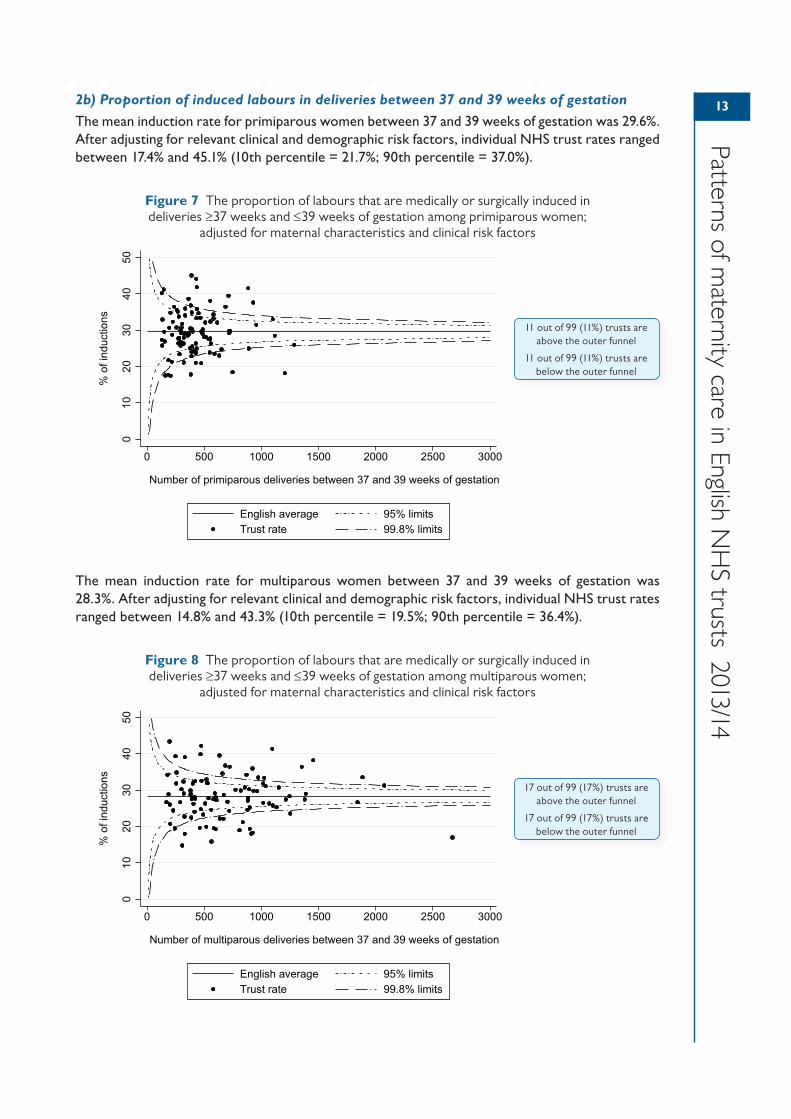
Multip 25.1 20.2 30.62b) Proportion of induced labours in deliveries between 37
and 39 weeks of gestationPrimip 29.6 21.7 37.0Multip 28.3 19.5 36.4
2c) Proportion of induced labours in deliveries ≥42 weeks of gestation
Primip 74.6 62.5 91.4Multip 64.9 46.3 84.8
3 Indicators relating to caesarean section3a) Proportion of deliveries by caesarean section Primip 22.1 18.1 25.7
Multip 21.3 17.8 23.83b) Proportion of induced labours resulting in emergency
caesarean sectionPrimip 29.9 23.7 37.0Multip 12.6 7.1 17.2
3c) Proportion of spontaneous labours resulting emergency caesarean section
Primip 11.4 8.3 15.3Multip 3.1 1.2 4.4
3d) Proportion of prelabour caesarean sections Primip 3.3 1.6 4.4Multip 12.7 9.9 14.9
3e) Proportion of prelabour caesarean sections performed before 39 weeks of gestation without clinical indication
Pre 24.0 13.0 33.2
3f) Proportion of vaginal births following a primary caesarean section (VBAC)
Multip 27.9 21.0 36.1
4 Involvement of instruments4a) Proportion of deliveries involving instruments Primip 24.4 19.1 28.9
Multip 7.4 4.4 10.45 Episiotomy5a) Proportion of episiotomies among vaginal deliveries Primip 35.5 28.8 43.8
Multip 9.2 5.6 12.75b) Proportion of episiotomies among instrumental
deliveriesF 88.7 80.6 95.3Va 71.7 63.0 81.7
6 Indicators relating to 3rd and 4th degree tears6a) Proportion of third- and fourth-degree perineal tears
among vaginal deliveriesPrimip 5.1 3.7 6.5Multip 1.8 1.1 2.4
6b) Proportion of third- and fourth-degree perineal tears among unassisted vaginal deliveries
Primip 4.1 2.7 5.8Multip 1.5 0.8 2.1
6c) Proportion of third- and fourth-degree perineal tears among assisted vaginal deliveries
Primip 7.3 4.7 10.6Multip 4.8 1.5 7.8
7 Unplanned readmission to hospital7a) Unplanned maternal readmission to hospital within
42 days of deliveryV 1.9 0.6 3.5CS 3.0 0.8 5.8
7b) Unplanned neonatal readmission to hospital within 28 days of birth
NB 3.0 0.9 5.9
† The indicators have been derived for appropriate subsets of all deliveries. For all indicators, multiple and preterm deliveries are excluded. In this way attention is focused on a more homogeneous group of women whose maternity care is most affected by clinical uncertainty. Women who delivered a baby with non-cephalic presentation were also excluded from all indicators, with the exception of 3e and 7b. Additional exclusions have been applied to each indicator, as detailed in Appendix 2.* After adjustment for maternal demographic and clinical risk factors available in the dataset.CS = caesarean section deliveries; F = forceps; NB= normal birthweight infants; Pre = subset of prelabour caesarean section deliveries including women with non-cephalic presentation OR where 1 or 2 previous caesarean sections; V = vaginal deliveries; Va = vacuum.
111 Introduction
Challenges for maternity servicesMaternity services are a major component of NHS hospital services. In fact, having a baby is the most common reason for hospital admission in England.3 In 2013, there were 690 820 live births in England, over 97% of which took place in an NHS setting.4
The safety and quality of care delivered by maternity units in the UK continues to attract a high level of public and political interest. Nationally, rates of maternal and perinatal mortality have fallen.5,6 However, there is evidence of substantial and persistent variation between regions and among women from different socio-economic and ethnic backgrounds.5–7 For example, in 2013, pregnancies among women living in areas of the UK with the highest levels of social deprivation and women of black or Asian ethnicity were over 50% more likely to end in stillbirth or neonatal death. Regional variations also exist in the proportion of full term babies admitted to specialist neonatal care, as well as the rate of emergency readmissions of babies within 14 days of birth.8
A recent Care Quality Commission (CQC) survey examined the experiences of 20 000 women who gave birth in February 2015 across 133 English NHS trusts.9 Compared with the previous survey, more women said they felt they were given the information they needed while in hospital and after the birth of their baby, and there was an increase in the proportion of women who said they were treated with dignity and respect during labour and birth. However, only two-thirds of women (64%) said they were able to get attention from a member of staff within a reasonable time when they felt they needed it in hospital and only half (54%) after the birth.9
Maternity services are facing numerous challenges in delivering care to women that arise from changing maternal characteristics,10–12 the need to respond to NHS reforms, and workforce and financial pressures. Several high profile cases of substandard maternity care, most recently in Morecambe Bay,13 have also highlighted how maternity services can occasionally fail to ensure safe and effective care. The Morecambe Bay report published a number of recommendations for improving maternity care, many of which are already being actively pursued by the RCOG and other national bodies.
In this report, we describe patterns of practice and outcomes across NHS maternity services in England. It is the second report that the RCOG has published on patterns of care within the English NHS, and extends the suite of indicators used in the first report.2 The project was carried out in collaboration with the London School of Hygiene and Tropical Medicine (LSHTM).
Why measure variation?The first RCOG report on patterns of maternity care found that there was substantial variation in practice between NHS maternity units. For many of the indicators related to clinical practice, this variation exceeded the amount that was expected due to random variation. For the indicators related to maternal outcomes, the report found considerably smaller variation. While this suggested that NHS maternity units were achieving similar outcomes of care, the variation in the process indicators provided some evidence of a postcode lottery in the type of care being given to women and babies.
The interpretation of differences between NHS hospitals is not straight forward. Some degree of variation in practice between healthcare providers is to be expected. Variation may:
• be due to factors outside the control of healthcare services, such as socio-economic deprivation and differences in population age or gender mix
2
Patt
erns
of m
ater
nity
car
e in
Eng
lish
NH
S tr
usts
201
3/14
• reflect a service that is tailored to the specific needs and preferences of individual patients or populations
• result from a local innovation which improves the quality of service.
Nonetheless, some variation can also be due to systematic differences in performance or differences in the uptake and implementation of national guidance. Consequently, identifying and investigating these causes of unwarranted variation offers an opportunity for NHS trusts to improve the quality and efficiency of care.
In the previous report, we outlined some of the key challenges when deciding what to measure in maternity care.2 In brief, the suitability of an indicator depends on a number of explicit criteria: validity, fairness, sufficient statistical power and an adequate technical specification. In addition to these criteria, it is important for a suite of indicators to cover various dimensions of care to give a complete overview of the service.
Numerous monitoring criteria have been proposed for maternity services (see Appendix 3 of the first report2 for an overview), but to date there has been little consensus about which indicators form a balanced suite for monitoring purposes. The measurement of quality in maternity care is made more complicated by the fact that the ‘best’ obstetric care pathway is dependent on various individual factors, including parity, past obstetric history (e.g. previous stillbirth, previous caesarean section), fetal presentation (e.g. cephalic, breech, transverse), length of gestation, the presence of pre-existing or pregnancy-related clinical conditions, and, importantly, maternal choice.
The aim of the national figures presented in this report, together with the trust-level results, is to stimulate thought among healthcare professionals, managers, commissioners and policy-makers; lead people to ask challenging questions and discuss and reflect locally, regionally and nationally; and allow maternity services and commissioners to identify priority areas for improving outcomes and productivity. The first step is for local services to understand their own outcomes in context so they can focus on reducing variation, further improving safety and ensuring their services meet the needs of women and their families. This would be a lasting response to the challenges currently faced by maternity units amid the ongoing reconfiguration of the English NHS.
Key changes from previous reportIn the previous 2013 report, we published risk-adjusted results for a suite of 11 maternity indicators for English NHS hospitals on an unnamed basis. The indicators focused on five areas of intrapartum care: induction of labour, caesarean section, instrumental delivery, third- and fourth-degree tears and emergency readmission. Individualised hospital-level results were shared with NHS trusts to enable them to review their results and compare these against national mean rates.
As the first report was based on feasibility work around the derivation of national performance indicators, publishing the results on a named-hospital basis was not deemed appropriate. We also wished to give hospitals an opportunity to identify and address any issues with data quality.
This latest report again provides a ‘state of the nation’ overview. It incorporates various refinements to the indicators following feedback from recipients of the 2013 report and advice from the panel of experts in our consensus group. These changes have given the indicators greater clinical relevance. In addition, we have included additional indicators in the areas of unassisted vaginal birth, induction of labour at specific gestations, episiotomy, and vaginal birth after caesarean section. We have also included an indicator related to neonatal admissions. These additions bring the total number of indicators included in this report to 18.
These modifications and additions mean the results published here are not directly comparable to those published in the 2013 report. We have outlined any specific changes made to indicator definitions within the respective results sections and we encourage NHS trusts to carefully examine the specification document (Appendix 2), where the attributes of each indicator, including the numerator and denominator, are described in detail.

3
Patterns of maternity care in English N
HS trusts 2013/14
We have also published trust-level results on a named basis (https://indicators.rcog.org.uk/). The reason for this is two-fold. First, although performance data are publicly available from other sources, the suite of indicators developed for this report is more comprehensive and includes indicators not published elsewhere. Second, our methodology is more robust than the approach of other publishers of indicators, as it includes explicit data quality checks as well as a process of risk-adjusting the hospital results for differences in their patient case-mix.
44 2 Data source
Hospital Episode StatisticsThe indicators described in this report have been derived using HES data. HES is a data ‘warehouse’ containing patient-level data on hospital admissions, outpatient appointments and A&E attendances for all NHS trusts in England.
HES collects a detailed record of each episode of admitted patient care delivered in England. Each record contains data on the patient demographics (e.g., age, sex, ethnicity, postcode), the episode of care (e.g., hospital name, date of admission and discharge) and clinical information. Diagnoses for each patient are recorded using the International Classification of Diseases, 10th edition (ICD-10).14 Procedures performed during an episode are coded using the Office of Population, Censuses and Surveys Classification of Surgical Operations and Procedures, 4th revision (OPCS).15 In addition, each episode related to the delivery of a baby can capture details about the labour and delivery (e.g., parity, mode of delivery, gestational age, birthweight) in supplementary data fields known as the HES ‘maternity tail’.
One of the advantages of HES is that each patient is assigned a unique identifier, a HESID. This makes it possible to study longitudinal patterns of care and trends, such as rates of readmission following a particular procedure or, in the case of maternity care, the number of previous deliveries for a particular woman.
HES is currently the only source of national maternity data available for England. While the Maternity Services Dataset (MSDS) is now mandated for maternity services across England,16 it is expected to be some time before the resource has matured sufficiently to support research activities in the way that HES enables. However, plans to use the MSDS to derive payment information for NHS trusts by 2017 and as a source of data for the forthcoming National Maternity and Perinatal Audit17 are expected to rapidly encourage a high level of compliance and data completeness.
Selection of the cohortThe figures produced in this report are based on HES data for the financial year 2013/14. We identified duplicate records on the basis of HESID and date of admission, which were then removed. Then, we defined delivery records as those which contained information about a delivery in either the maternity tail or the OPCS procedure fields.
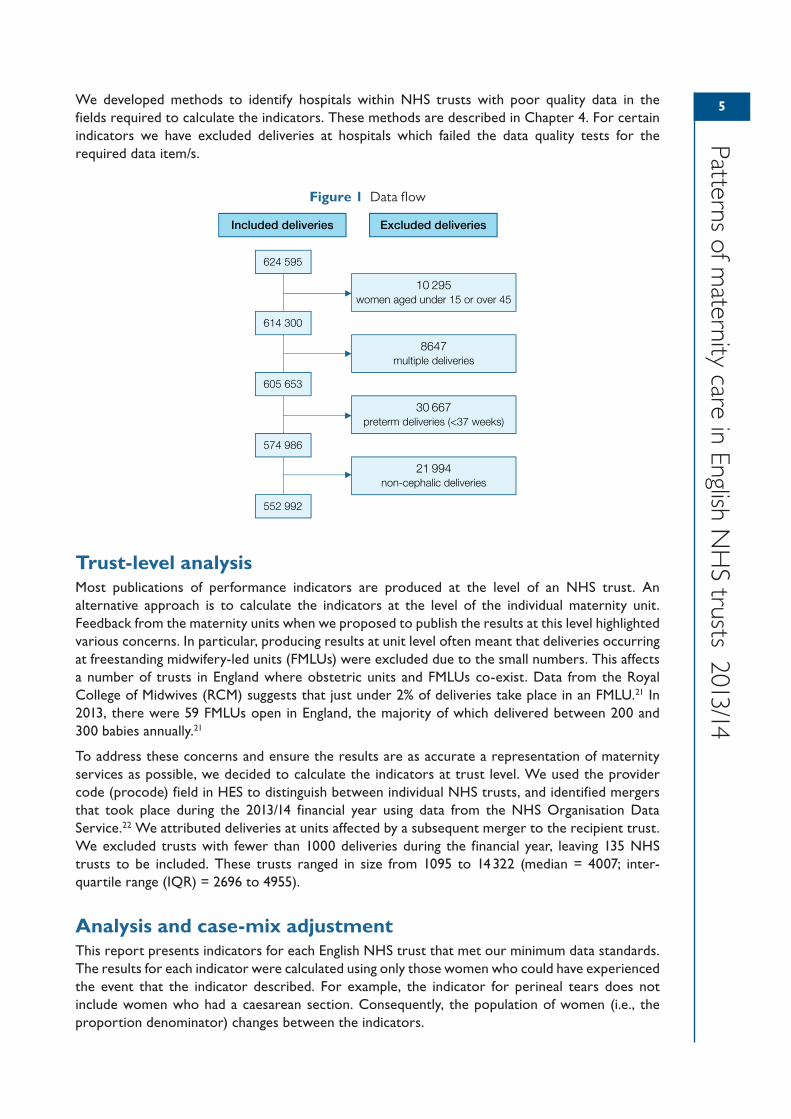
We then restricted the resulting sample of 624 595 deliveries to women aged between 15 and 45 with singleton, term, cephalic deliveries (Figure 1). Concentrating on this group allows attention to be focused on the group of women whose maternity care is most affected by clinical uncertainty and which varies the most between providers.18,19 Most indicators are then stratified by parity because it has a major influence on pregnancy and delivery outcomes. Additional exclusions have been applied to each indicator to focus on the appropriate group of women ‘at risk’ of the outcome of interest, as detailed in Appendix 2. It is worth noting that, for most indicators, the multiparous group includes both women with and without previous caesarean sections, meaning that the groups are not equivalent to the Robson groups that many clinicians will be familiar with.20 Although further stratification of the multiparous group is very useful for monitoring outcomes in what are two clinically distinct populations of women, for the purposes of this report it was felt that this would lead to some indicators having very small denominators, thereby reducing the reliability of the NHS trust figures.
5
Patterns of maternity care in English N
HS trusts 2013/14
We developed methods to identify hospitals within NHS trusts with poor quality data in the fields required to calculate the indicators. These methods are described in Chapter 4. For certain indicators we have excluded deliveries at hospitals which failed the data quality tests for the required data item/s.
Figure 1 Data flow
Trust-level analysisMost publications of performance indicators are produced at the level of an NHS trust. An alternative approach is to calculate the indicators at the level of the individual maternity unit. Feedback from the maternity units when we proposed to publish the results at this level highlighted various concerns. In particular, producing results at unit level often meant that deliveries occurring at freestanding midwifery-led units (FMLUs) were excluded due to the small numbers. This affects a number of trusts in England where obstetric units and FMLUs co-exist. Data from the Royal College of Midwives (RCM) suggests that just under 2% of deliveries take place in an FMLU.21 In 2013, there were 59 FMLUs open in England, the majority of which delivered between 200 and 300 babies annually.21
To address these concerns and ensure the results are as accurate a representation of maternity services as possible, we decided to calculate the indicators at trust level. We used the provider code (procode) field in HES to distinguish between individual NHS trusts, and identified mergers that took place during the 2013/14 financial year using data from the NHS Organisation Data Service.22 We attributed deliveries at units affected by a subsequent merger to the recipient trust. We excluded trusts with fewer than 1000 deliveries during the financial year, leaving 135 NHS trusts to be included. These trusts ranged in size from 1095 to 14 322 (median = 4007; inter-quartile range (IQR) = 2696 to 4955).
Analysis and case-mix adjustmentThis report presents indicators for each English NHS trust that met our minimum data standards. The results for each indicator were calculated using only those women who could have experienced the event that the indicator described. For example, the indicator for perineal tears does not include women who had a caesarean section. Consequently, the population of women (i.e., the proportion denominator) changes between the indicators.
Included deliveries Excluded deliveries
624 595
614 300
605 653
574 986
552 992
10 295women aged under 15 or over 45
8647 multiple deliveries
30 667preterm deliveries (<37 weeks)
21 994non-cephalic deliveries
6
Patt
erns
of m
ater
nity
car
e in
Eng
lish
NH
S tr
usts
201
3/14
When presenting figures for individual NHS trusts, indicators must take into account differences between the women who give birth at each organisation. The clinical and demographic characteristics of women (case-mix) can affect both the demands placed on the service and the outcomes of care. Accounting for patient factors that are outside the control of maternity units is essential if the indicator values of NHS trusts are to be interpreted fairly.
In this report, we have controlled for differences in the case-mix of NHS trusts in several ways. First, the results of many indicators are stratified by parity because of its major influence on practice and outcomes. Overall, the proportions of primiparous and multiparous women in the cohort analysed in this report were 42.3% and 57.7%, respectively.
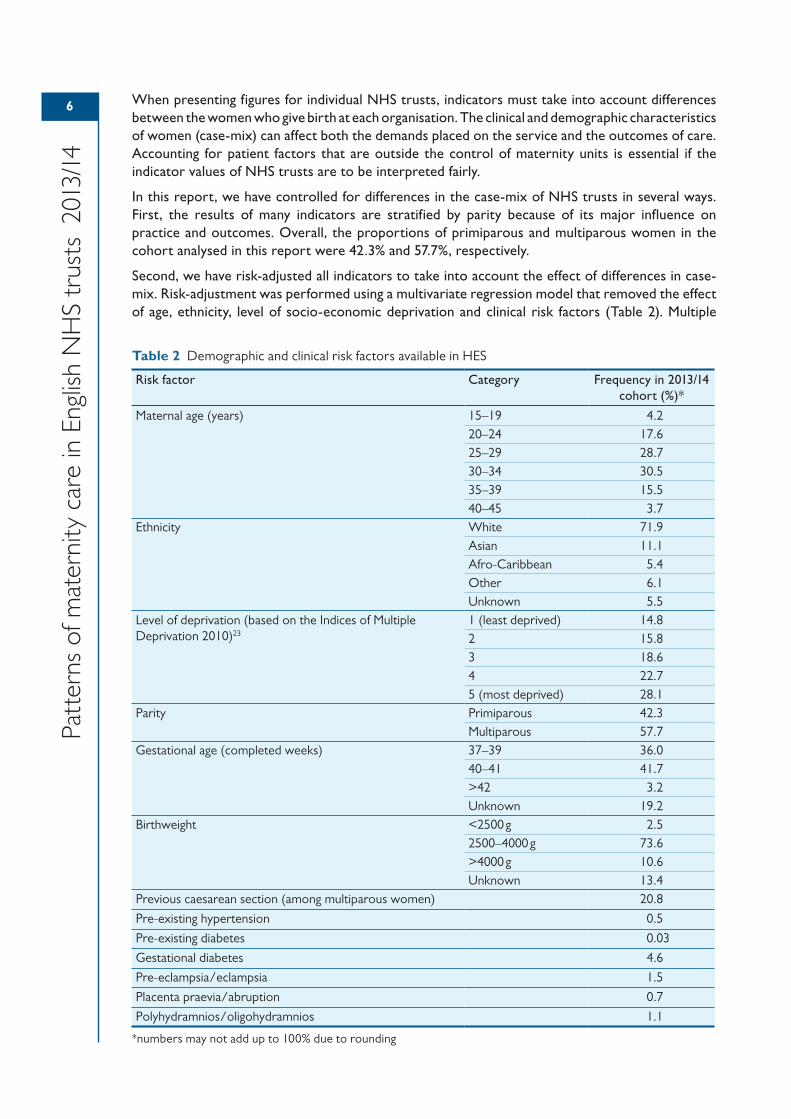
Second, we have risk-adjusted all indicators to take into account the effect of differences in case-mix. Risk-adjustment was performed using a multivariate regression model that removed the effect of age, ethnicity, level of socio-economic deprivation and clinical risk factors (Table 2). Multiple
Table 2 Demographic and clinical risk factors available in HES
Risk factor Category Frequency in 2013/14 cohort (%)*
Maternal age (years) 15–19 4.220–24 17.625–29 28.730–34 30.535–39 15.540–45 3.7
Ethnicity White 71.9Asian 11.1Afro-Caribbean 5.4Other 6.1Unknown 5.5
Level of deprivation (based on the Indices of Multiple Deprivation 2010)23
1 (least deprived) 14.82 15.83 18.64 22.75 (most deprived) 28.1
Parity Primiparous 42.3Multiparous 57.7
Gestational age (completed weeks) 37–39 36.040–41 41.7>42 3.2Unknown 19.2
Birthweight <2500 g 2.52500–4000 g 73.6>4000 g 10.6Unknown 13.4
Previous caesarean section (among multiparous women) 20.8
Pre-existing hypertension 0.5
Pre-existing diabetes 0.03
Gestational diabetes 4.6
Pre-eclampsia/eclampsia 1.5
Placenta praevia/abruption 0.7
Polyhydramnios/oligohydramnios 1.1
*numbers may not add up to 100% due to rounding
7
Patterns of maternity care in English N
HS trusts 2013/14
logistic regression was used to estimate the probability of each woman in the sample having the outcome of interest on the basis of her characteristics. We summed these probabilities for all women in the NHS trust to produce each trust’s predicted number of events for the indicator. Risk-adjusted rates were then produced by dividing each trust’s observed number of events by the predicted number and multiplying this ratio by the national mean rate. Further details of the risk-adjustment variables included in each model are given in Appendix 2.
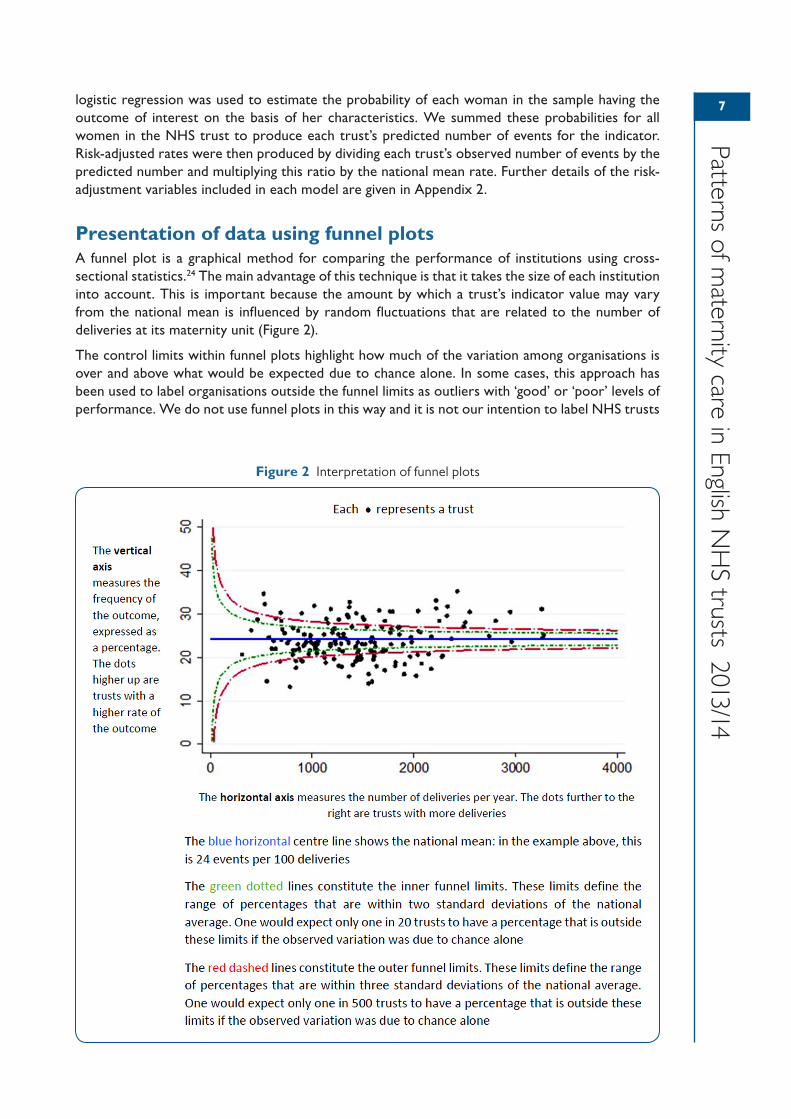
Presentation of data using funnel plotsA funnel plot is a graphical method for comparing the performance of institutions using cross-sectional statistics.24 The main advantage of this technique is that it takes the size of each institution into account. This is important because the amount by which a trust’s indicator value may vary from the national mean is influenced by random fluctuations that are related to the number of deliveries at its maternity unit (Figure 2).
The control limits within funnel plots highlight how much of the variation among organisations is over and above what would be expected due to chance alone. In some cases, this approach has been used to label organisations outside the funnel limits as outliers with ‘good’ or ‘poor’ levels of performance. We do not use funnel plots in this way and it is not our intention to label NHS trusts
Figure 2 Interpretation of funnel plots
8
Patt
erns
of m
ater
nity
car
e in
Eng
lish
NH
S tr
usts
201
3/14
with indicator values beyond the outer control limits as outliers. We have used funnel plots only to show where there are substantial systematic (non-random) differences between NHS trusts.
Several of the funnel plots presented in this report show evidence of a phenomenon known as overdispersion.25 Overdispersion occurs when there is a greater degree of variability among providers than can be explained by chance and the existence of a few outlying units. Important explanations for overdispersion are differences in data quality, limitations of risk-adjustment methods and clinical uncertainty.
As we have attempted to limit the impact of differences in case-mix and in data collection and coding practices between trusts, it is likely that much of the systematic variation between trusts that can be observed for some indicators reflects clinical uncertainty. If that is the case, the results cannot be used to distinguish ‘good’ from ‘bad’ hospitals. Consequently, we have concluded that it is premature to draw conclusions from these results about whether differences in the patterns of maternity care reflect differences in the quality of care provided in individual trusts.
993 Results
Detailed definitions and specifications used for all indicators can be found in Appendix 2.
Spontaneous unassisted vaginal deliveriesBackgroundIn 2007, the Maternity Care Working Party set out a consensus definition of ‘normal birth’, agreed by the RCOG, RCM, National Childbirth Trust (NCT) and other interested parties, to refer to deliveries ‘without induction, without the use of instruments, not by caesarean section and without general, spinal or epidural anaesthetic before or during delivery’.26
Rates of ‘normal birth’ appear to have fallen in recent years. In 1990, six out of ten women delivered without intervention; in 2005, just over four in ten women had this experience. Since 2005 however, figures appear to have remained relatively stable at between 40% and 43%.27 In 2010–11, 34% of primiparous women and 49% of multiparous women had a ‘normal birth’. However, rates of ‘normal birth’ have been found to vary considerably between maternity units.28
In our first report, most of the indicators focused on specific interventions and associated outcomes. In this second report, we wish to recognise the importance of measuring not only births with specific types of medical interventions or poor outcomes, but also births without any intervention. We have therefore developed an indicator which is a proxy for intervention-free birth. Unfortunately, we were not able to replicate the definition of ‘normal birth’ in the Maternity Care Working Party’s consensus statement due to data quality issues affecting the coding of anaesthetic use during delivery in HES (see Chapter 4 for further detail). The indicator presented in this report simply measures the proportion of births without induction, without the use of instruments and not by caesarean section, i.e. deliveries involving general, spinal or epidural anaesthetic have been included. We hope to be able to refine this definition as the quality of anaesthetic coding in national data improves. Although it may be aspirational at present, we also hope to develop a composite indicator that focuses on a positive outcome for both the mother and the baby, since an intervention-free delivery is only half the story in any birth.
Assessment of data qualityThe quality of data coding was carefully assessed for each hospital (obstetric unit) within a trust. We excluded hospitals from the analysis if more than 30% of delivery records were missing information about the onset of labour or if there were fewer than 1000 observations in the denominator. Chapter 4 describes additional criteria relating to the distribution of values and the overall data quality results for all hospitals within included trusts. Good quality data relating to this indicator were available for 107/135 trusts.
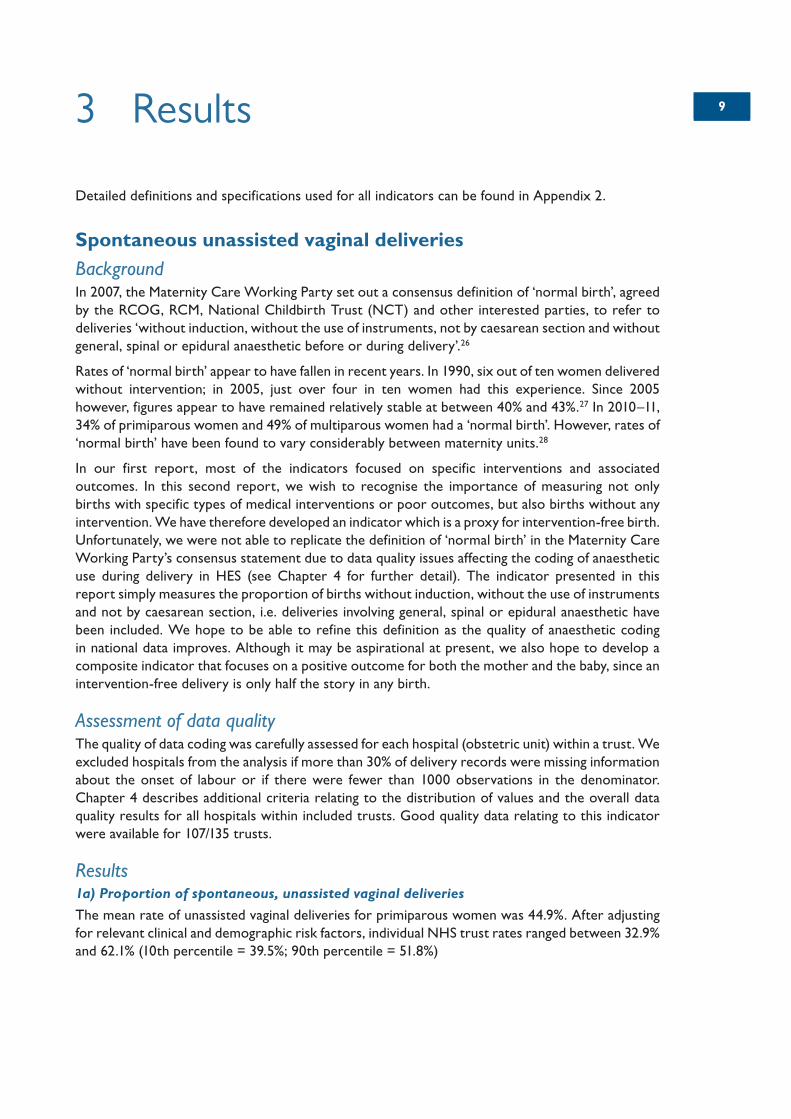
Results1a) Proportion of spontaneous, unassisted vaginal deliveries
The mean rate of unassisted vaginal deliveries for primiparous women was 44.9%. After adjusting for relevant clinical and demographic risk factors, individual NHS trust rates ranged between 32.9% and 62.1% (10th percentile = 39.5%; 90th percentile = 51.8%)
10
Patt
erns
of m
ater
nity
car
e in
Eng
lish
NH
S tr
usts
201
3/14
Figure 3 The proportion of spontaneous births without induction, instrument use or caesarean section among primiparous women; adjusted for maternal characteristics
and clinical risk factors
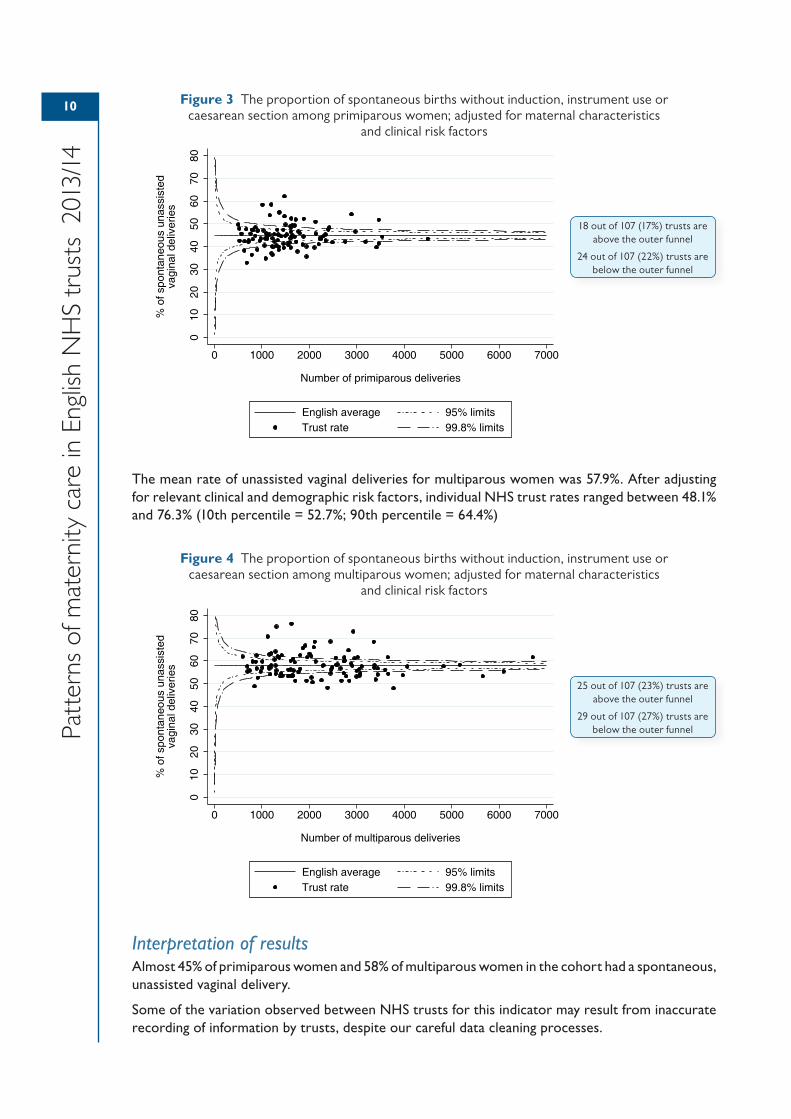
The mean rate of unassisted vaginal deliveries for multiparous women was 57.9%. After adjusting for relevant clinical and demographic risk factors, individual NHS trust rates ranged between 48.1% and 76.3% (10th percentile = 52.7%; 90th percentile = 64.4%)
Figure 4 The proportion of spontaneous births without induction, instrument use or caesarean section among multiparous women; adjusted for maternal characteristics
and clinical risk factors
Interpretation of resultsAlmost 45% of primiparous women and 58% of multiparous women in the cohort had a spontaneous, unassisted vaginal delivery.
Some of the variation observed between NHS trusts for this indicator may result from inaccurate recording of information by trusts, despite our careful data cleaning processes.
010
2030
4050
6070
80
% o
f spo
ntan
eous
una
ssis
ted
vagi
nal d
eliv
erie
s
0 1000 2000 3000 4000 5000 6000 7000
Number of primiparous deliveries
English average 95% limitsTrust rate 99.8% limits
18 out of 107 (17%) trusts are above the outer funnel
24 out of 107 (22%) trusts are below the outer funnel
010
2030
4050
6070
80
% o
f spo
ntan
eous
una
ssis
ted
vagi
nal d
eliv
erie
s
0 1000 2000 3000 4000 5000 6000 7000
Number of multiparous deliveries
English average 95% limitsTrust rate 99.8% limits
25 out of 107 (23%) trusts are above the outer funnel
29 out of 107 (27%) trusts are below the outer funnel
11
Patterns of maternity care in English N
HS trusts 2013/14
However, some of the variation is also likely to be due to differences in the structure and quality of maternity care that women receive. Little randomised controlled trial (RCT) evidence exists, although some research shows that a number of practices can increase normal birth rates in NHS settings.29 These include:
• providing the opportunity to give birth in a midwife-led unit, either alongside or free-standing30
• providing continuity of care from a small number of midwives during pregnancy and labour
• ensuring women have one-to-one care from a midwife during established labour
• supporting the use of natural and low-tech comfort aids during labour, such as the use of water, or encouraging the use of upright positions and mobility.
If staffing or structural issues within a trust mean that these practices are not possible, it could explain some variation within rates of unassisted, spontaneous birth.
Finally, some maternal risk factors that we have not been able to control for here, such as body mass index (BMI) and smoking status, are associated with a higher risk of complications and, therefore, a reduced likelihood of a spontaneous unassisted delivery.
Indicators relating to induction of labourBackgroundInduction of labour is a common obstetric intervention and occurs in around a quarter of all births in England.31,32 While the rate of inductions continues to increase slightly in the UK,32,33 this is also true in other countries.34,35
The most important reason to induce labour (at both pre- and post-term gestations) is to avoid the risk of fetal compromise and antepartum stillbirth. Common indications for induction of labour that are backed by strong evidence of improved outcomes include prelabour rupture of membranes (PROM) without spontaneous onset of labour within 24 hours and prolonged gestation.
National clinical guidelines in the UK recommend that induction of labour is only indicated if induction is likely to lead to a better outcome than allowing the pregnancy to continue.31 This suggests that the majority of the observed variation in rates of induction among organisations should be explained by the clinical characteristics of women presenting for obstetric care. However, some researchers have suggested that not all inductions are being carried out for clear indications given that the increase in labour induction has not been accompanied by proportional decreases in perinatal mortality.36
Evidence suggests that induction of labour may be associated with a reduced risk of caesarean section and perinatal death when compared to expectant management in pregnancies at 37 weeks of gestation and above,37–39 although further evidence is required before a policy of routine induction at term can be recommended.40–42
Where induction is deemed potentially unnecessary, the additional costs to the health service should be considered, as there is evidence suggesting induced labours result in deliveries that are more financially costly than those where labour was spontaneous.43
Assessment of data qualityWe excluded those hospitals whose induction of labour coding was considered unreliable. A hospital was omitted if the proportion of records missing data on onset of delivery exceeded 30% or the distribution of values fell outside the expected range (see Chapter 4 for additional details). For indicator 2a, good quality data was available for 100/135 trusts. Indicators 2b and 2c involved an additional data quality check relating to gestational age, and good quality data was available for 99/135 and 89/135 trusts, respectively.
12
Patt
erns
of m
ater
nity
car
e in
Eng
lish
NH
S tr
usts
201
3/14
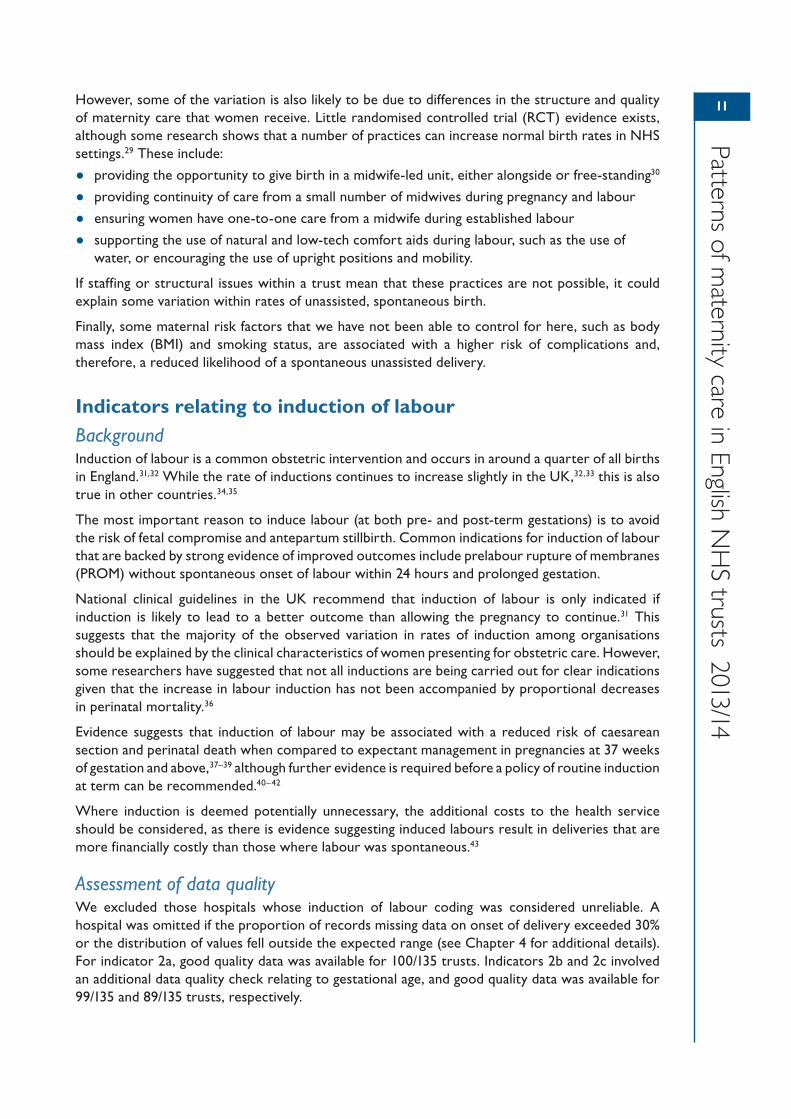
Results2a) Proportion of labours that are medically or surgically induced
The mean induction rate for primiparous women was 30.5%. After adjusting for relevant clinical and demographic risk factors, individual NHS trust rates ranged between 16.3% and 43.1% (10th percentile = 25.6%; 90th percentile = 37.6%).
Figure 5 The proportion of labours that are medically or surgically induced among primiparous women; adjusted for maternal characteristics and clinical risk factors
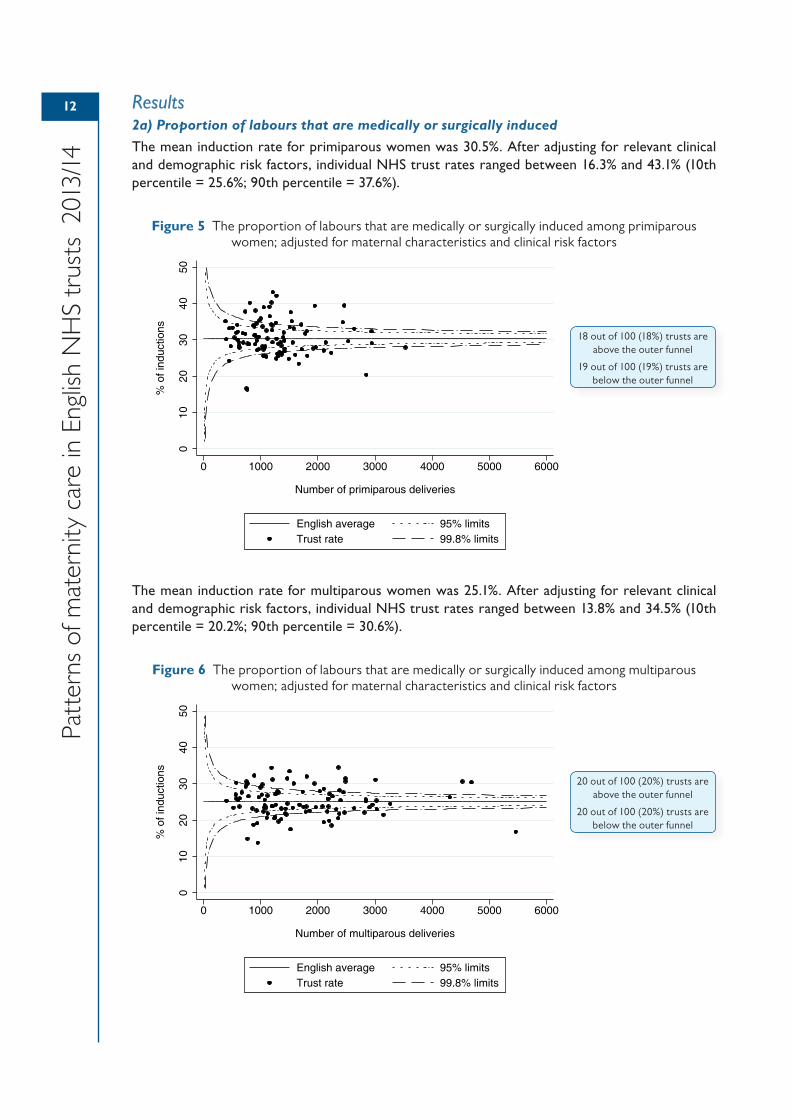
The mean induction rate for multiparous women was 25.1%. After adjusting for relevant clinical and demographic risk factors, individual NHS trust rates ranged between 13.8% and 34.5% (10th percentile = 20.2%; 90th percentile = 30.6%).
Figure 6 The proportion of labours that are medically or surgically induced among multiparous women; adjusted for maternal characteristics and clinical risk factors
010
2030
4050
% o
f ind
uctio
ns
0 1000 2000 3000 4000 5000 6000
Number of multiparous deliveries
English average 95% limitsTrust rate 99.8% limits
20 out of 100 (20%) trusts are above the outer funnel
20 out of 100 (20%) trusts are below the outer funnel
010
2030
4050
% o
f ind
uctio
ns
0 1000 2000 3000 4000 5000 6000
Number of primiparous deliveries
English average 95% limitsTrust rate 99.8% limits
18 out of 100 (18%) trusts are above the outer funnel
19 out of 100 (19%) trusts are below the outer funnel
13
Patterns of maternity care in English N
HS trusts 2013/14
2b) Proportion of induced labours in deliveries between 37 and 39 weeks of gestation
The mean induction rate for primiparous women between 37 and 39 weeks of gestation was 29.6%. After adjusting for relevant clinical and demographic risk factors, individual NHS trust rates ranged between 17.4% and 45.1% (10th percentile = 21.7%; 90th percentile = 37.0%).
Figure 7 The proportion of labours that are medically or surgically induced in deliveries ≥37 weeks and ≤39 weeks of gestation among primiparous women;
adjusted for maternal characteristics and clinical risk factors
The mean induction rate for multiparous women between 37 and 39 weeks of gestation was 28.3%. After adjusting for relevant clinical and demographic risk factors, individual NHS trust rates ranged between 14.8% and 43.3% (10th percentile = 19.5%; 90th percentile = 36.4%).
Figure 8 The proportion of labours that are medically or surgically induced in deliveries ≥37 weeks and ≤39 weeks of gestation among multiparous women;
adjusted for maternal characteristics and clinical risk factors
010
2030
4050
% o
f ind
uctio
ns
0 500 1000 1500 2000 2500 3000
Number of primiparous deliveries between 37 and 39 weeks of gestation
English average 95% limitsTrust rate 99.8% limits
11 out of 99 (11%) trusts are above the outer funnel
11 out of 99 (11%) trusts are below the outer funnel
010
2030
4050
% o
f ind
uctio
ns
0 500 1000 1500 2000 2500 3000
Number of multiparous deliveries between 37 and 39 weeks of gestation
English average 95% limitsTrust rate 99.8% limits
17 out of 99 (17%) trusts are above the outer funnel
17 out of 99 (17%) trusts are below the outer funnel
14
Patt
erns
of m
ater
nity
car
e in
Eng
lish
NH
S tr
usts
201
3/14
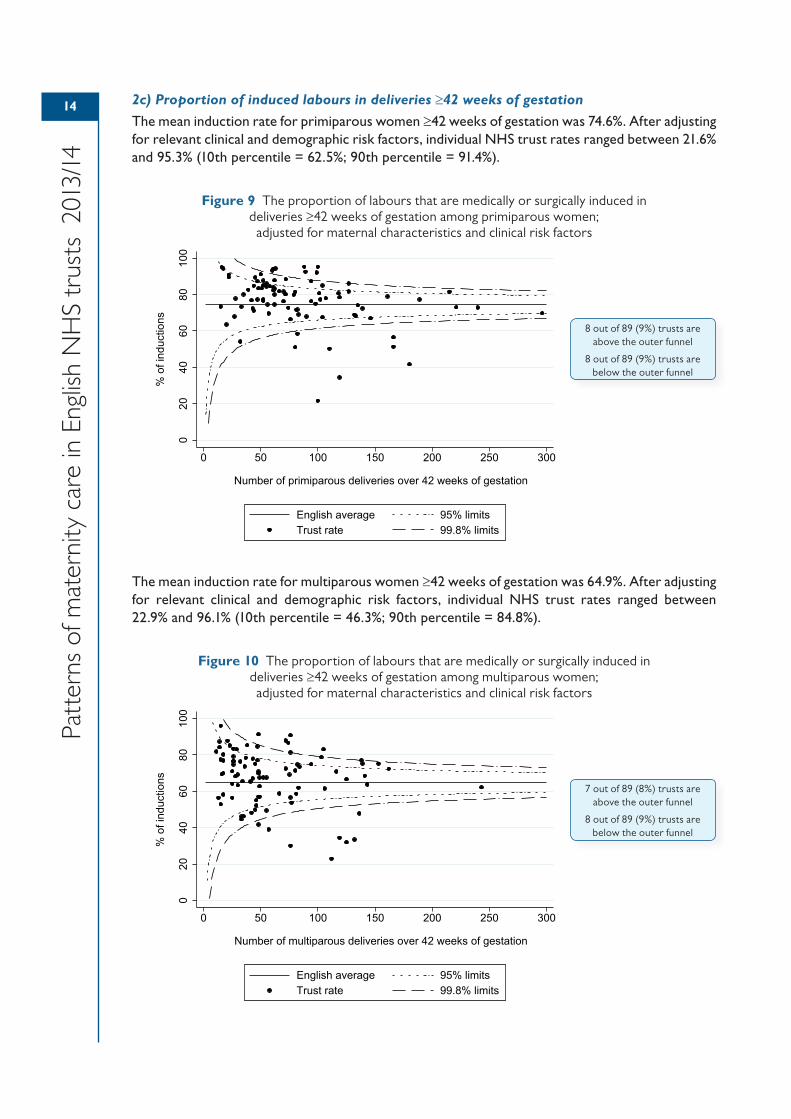
2c) Proportion of induced labours in deliveries ≥42 weeks of gestation
The mean induction rate for primiparous women ≥42 weeks of gestation was 74.6%. After adjusting for relevant clinical and demographic risk factors, individual NHS trust rates ranged between 21.6% and 95.3% (10th percentile = 62.5%; 90th percentile = 91.4%).
Figure 9 The proportion of labours that are medically or surgically induced in deliveries ≥42 weeks of gestation among primiparous women;
adjusted for maternal characteristics and clinical risk factors
The mean induction rate for multiparous women ≥42 weeks of gestation was 64.9%. After adjusting for relevant clinical and demographic risk factors, individual NHS trust rates ranged between 22.9% and 96.1% (10th percentile = 46.3%; 90th percentile = 84.8%).
Figure 10 The proportion of labours that are medically or surgically induced in deliveries ≥42 weeks of gestation among multiparous women; adjusted for maternal characteristics and clinical risk factors
020
4060
8010
0
% o
f ind
uctio
ns
0 50 100 150 200 250 300
Number of primiparous deliveries over 42 weeks of gestation
English average 95% limitsTrust rate 99.8% limits
8 out of 89 (9%) trusts are above the outer funnel
8 out of 89 (9%) trusts are below the outer funnel
020
4060
8010
0
% o
f ind
uctio
ns
0 50 100 150 200 250 300
Number of multiparous deliveries over 42 weeks of gestation
English average 95% limitsTrust rate 99.8% limits
7 out of 89 (8%) trusts are above the outer funnel
8 out of 89 (9%) trusts are below the outer funnel
15
Patterns of maternity care in English N
HS trusts 2013/14
Interpretation of resultsThe variation seen in the rates of induction of labour between NHS trusts may be explained by differences in clinical care and local policies, but may also be due in part to discrepancies in how induction is coded locally within patient administration systems. One such issue is the potential inconsistency of the coding of augmentation and induction of labour. NHS trusts which record these activities under the same procedure code will appear to have higher overall rates of induction than NHS trusts which differentiate between augmentation and induction.
A significant number of hospitals in England are now using customised growth charts through the GROW/GAP programme initiated by the Perinatal Institute.44 There is some anecdotal evidence that the implementation of such charts may be leading to higher rates of induction for small-for-gestational-age (SGA) babies. While national guidelines recommend induction only when a better outcome is likely compared with allowing the pregnancy to continue, it is not possible to know whether such guidelines are followed in the same way across all organisations.
Differences between NHS trusts in the interpretation of clinical guidelines could also explain the overall proportion of women being induced at ≥42 weeks (2c), with those women still pregnant at 42 weeks dependent largely on the policy of post-dates induction adopted at the unit. Known cut-offs for post-dates induction are term +10, +12 or +14 days beyond the estimated date of delivery.
While we have been able to risk-adjust the induction rate for many characteristics and clinical factors, we have not been able to control for maternal smoking status and BMI. There is evidence that these factors may influence the likelihood of a woman having a spontaneous, unassisted delivery, and as such may contribute a small amount to the overall variation in indicators relating to induction of labour.
Indicators relating to caesarean sectionBackgroundRates of caesarean section have been steadily rising both in the UK and elsewhere in the world.45–47 It has been suggested that the higher rates are due, in part, to an increase in non-clinically indicated caesarean section and, within this, a growing number of maternal requests for the procedure. However, with respect to the latter reason, an analysis of routine hospital data in England found that rates of emergency caesarean section varied between NHS trusts to a greater degree than rates of elective caesarean section.48
The UK is one of the safest places in the world to have a caesarean section and its judicious use saves the lives of many hundreds of women and babies each year. However, caesarean section also increases the risk of certain maternal complications such as haemorrhage, infection and thrombosis,49 as well as the risk of uterine rupture, placenta praevia and placenta accreta in subsequent pregnancies.50–52 Neonatal complications after delivery by caesarean section, although infrequent, include fetal respiratory distress syndrome, pulmonary hypertension, iatrogenic prematurity and difficulty with bonding and breastfeeding.53,54
UK and US guidelines recommend that elective caesarean section in uncomplicated pregnancies should not be carried out before 39 completed weeks of gestation because of an increased risk of respiratory morbidity in newborns.55,56 These recommendations are supported by evidence suggesting elective caesareans performed before 39 weeks carry an increased risk of neonates being admitted to intensive care and serious respiratory morbidity.57,58
Where women have had a previous caesarean section delivery, a planned vaginal birth after caesarean (VBAC) is clinically safe for the majority of women, but the choice should also be offered for a repeat elective caesarean section because a vaginal delivery poses some risk of harm to the mother, such as the rupture of the uterus.59 Repeat caesarean sections are one factor contributing to the rising overall numbers of surgical deliveries. One strategy for reducing the overall caesarean section rate is the promotion of VBAC, where appropriate.59 Rates of VBAC vary across countries, but have been declining in recent years.60,61
16
Patt
erns
of m
ater
nity
car
e in
Eng
lish
NH
S tr
usts
201
3/14
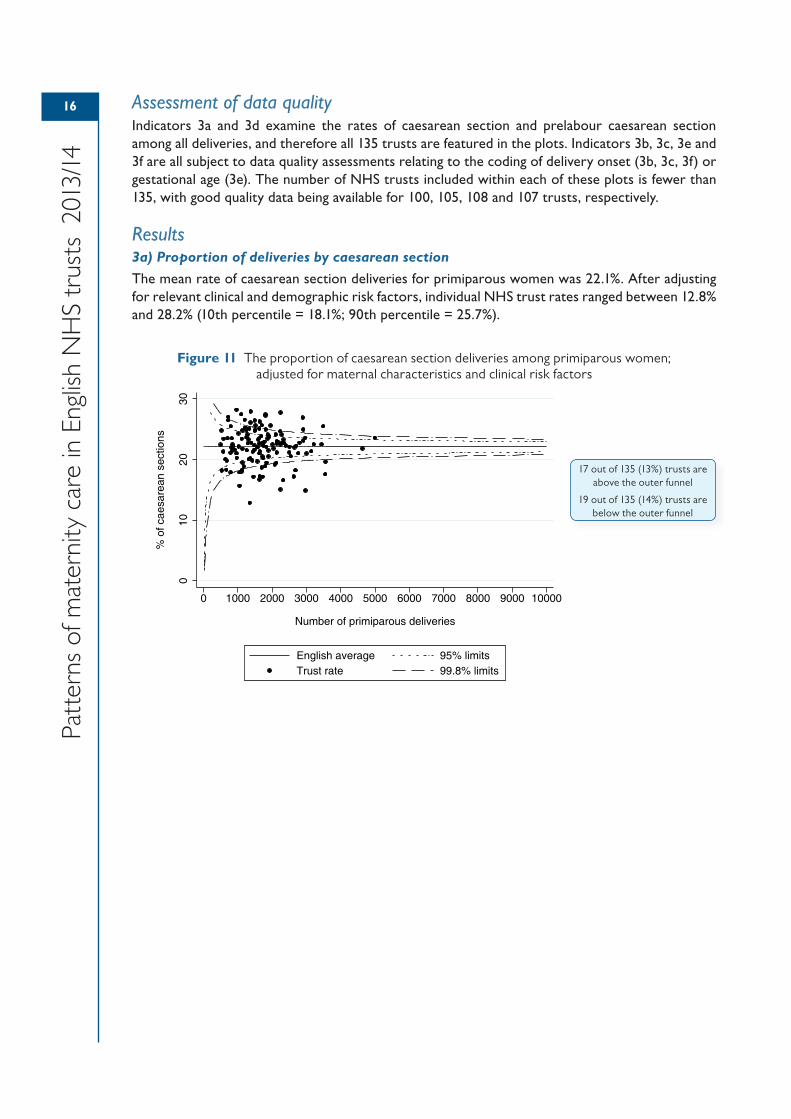
Assessment of data qualityIndicators 3a and 3d examine the rates of caesarean section and prelabour caesarean section among all deliveries, and therefore all 135 trusts are featured in the plots. Indicators 3b, 3c, 3e and 3f are all subject to data quality assessments relating to the coding of delivery onset (3b, 3c, 3f) or gestational age (3e). The number of NHS trusts included within each of these plots is fewer than 135, with good quality data being available for 100, 105, 108 and 107 trusts, respectively.
Results3a) Proportion of deliveries by caesarean section
The mean rate of caesarean section deliveries for primiparous women was 22.1%. After adjusting for relevant clinical and demographic risk factors, individual NHS trust rates ranged between 12.8% and 28.2% (10th percentile = 18.1%; 90th percentile = 25.7%).
Figure 11 The proportion of caesarean section deliveries among primiparous women; adjusted for maternal characteristics and clinical risk factors
010
2030
% o
f cae
sare
an s
ectio
ns
0 1000 2000 3000 4000 5000 6000 7000 8000 9000 10000
Number of primiparous deliveries
English average 95% limitsTrust rate 99.8% limits
17 out of 135 (13%) trusts are above the outer funnel
19 out of 135 (14%) trusts are below the outer funnel
17
Patterns of maternity care in English N
HS trusts 2013/14
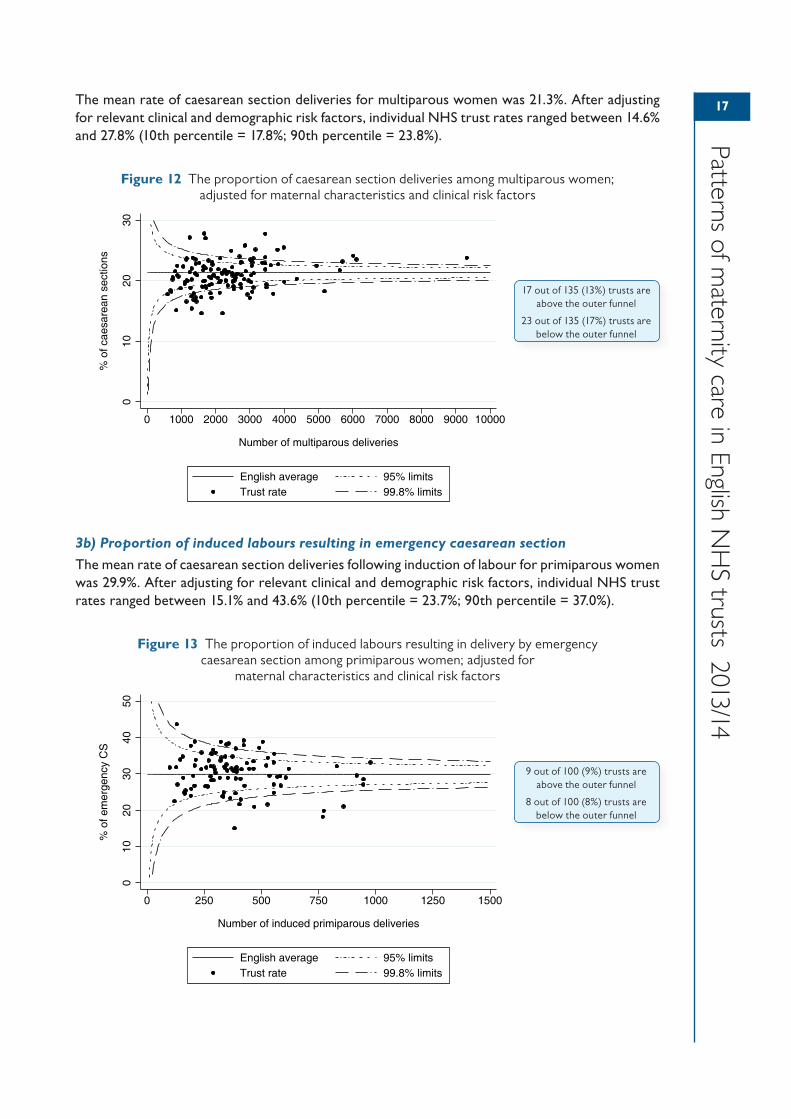
The mean rate of caesarean section deliveries for multiparous women was 21.3%. After adjusting for relevant clinical and demographic risk factors, individual NHS trust rates ranged between 14.6% and 27.8% (10th percentile = 17.8%; 90th percentile = 23.8%).
Figure 12 The proportion of caesarean section deliveries among multiparous women; adjusted for maternal characteristics and clinical risk factors
3b) Proportion of induced labours resulting in emergency caesarean section
The mean rate of caesarean section deliveries following induction of labour for primiparous women was 29.9%. After adjusting for relevant clinical and demographic risk factors, individual NHS trust rates ranged between 15.1% and 43.6% (10th percentile = 23.7%; 90th percentile = 37.0%).
Figure 13 The proportion of induced labours resulting in delivery by emergency caesarean section among primiparous women; adjusted for
maternal characteristics and clinical risk factors
010
2030
% o
f cae
sare
an s
ectio
ns
0 1000 2000 3000 4000 5000 6000 7000 8000 9000 10000
Number of multiparous deliveries
English average 95% limitsTrust rate 99.8% limits
17 out of 135 (13%) trusts are above the outer funnel
23 out of 135 (17%) trusts are below the outer funnel
010
2030
4050
% o
f em
erge
ncy
CS
0 250 500 750 1000 1250 1500
Number of induced primiparous deliveries
English average 95% limitsTrust rate 99.8% limits
9 out of 100 (9%) trusts are above the outer funnel
8 out of 100 (8%) trusts are below the outer funnel
18
Patt
erns
of m
ater
nity
car
e in
Eng
lish
NH
S tr
usts
201
3/14
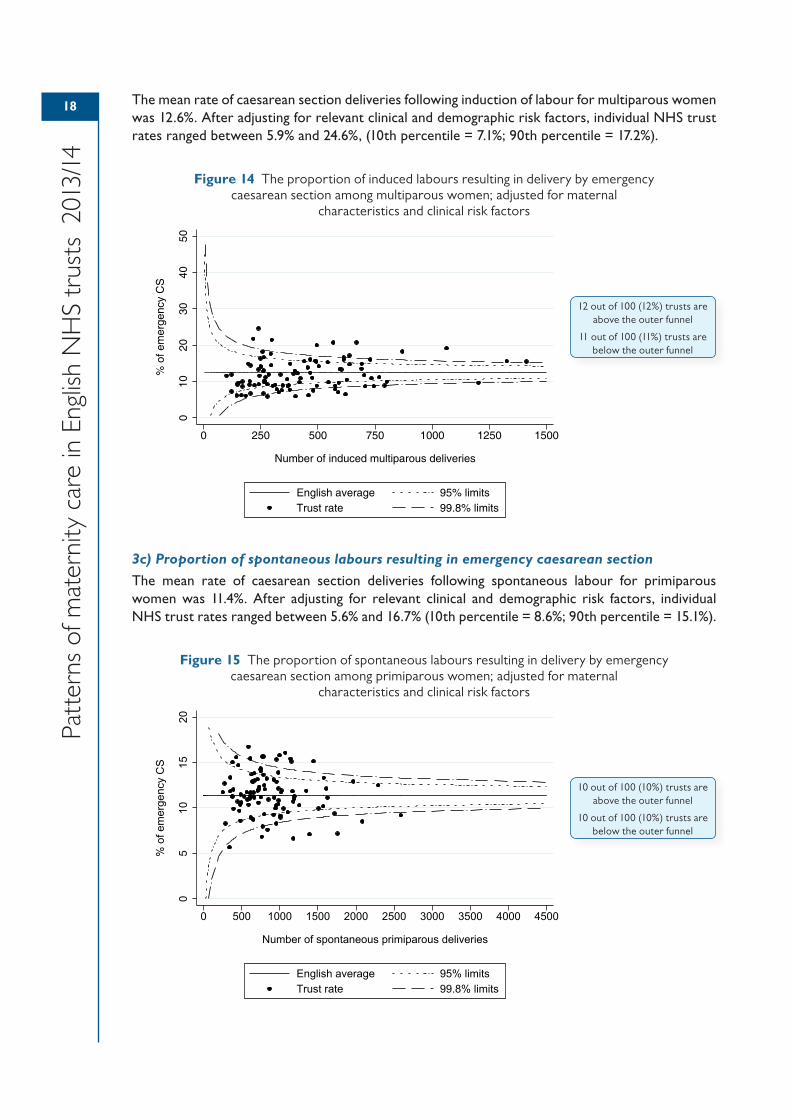
The mean rate of caesarean section deliveries following induction of labour for multiparous women was 12.6%. After adjusting for relevant clinical and demographic risk factors, individual NHS trust rates ranged between 5.9% and 24.6%, (10th percentile = 7.1%; 90th percentile = 17.2%).
Figure 14 The proportion of induced labours resulting in delivery by emergency caesarean section among multiparous women; adjusted for maternal
characteristics and clinical risk factors
3c) Proportion of spontaneous labours resulting in emergency caesarean section
The mean rate of caesarean section deliveries following spontaneous labour for primiparous women was 11.4%. After adjusting for relevant clinical and demographic risk factors, individual NHS trust rates ranged between 5.6% and 16.7% (10th percentile = 8.6%; 90th percentile = 15.1%).
Figure 15 The proportion of spontaneous labours resulting in delivery by emergency caesarean section among primiparous women; adjusted for maternal
characteristics and clinical risk factors
010
2030
4050
% o
f em
erge
ncy
CS
0 250 500 750 1000 1250 1500
Number of induced multiparous deliveries
English average 95% limitsTrust rate 99.8% limits
12 out of 100 (12%) trusts are above the outer funnel
11 out of 100 (11%) trusts are below the outer funnel
05
1015
20
% o
f em
erge
ncy
CS
0 500 1000 1500 2000 2500 3000 3500 4000 4500
Number of spontaneous primiparous deliveries
English average 95% limitsTrust rate 99.8% limits
10 out of 100 (10%) trusts are above the outer funnel
10 out of 100 (10%) trusts are below the outer funnel
19
Patterns of maternity care in English N
HS trusts 2013/14
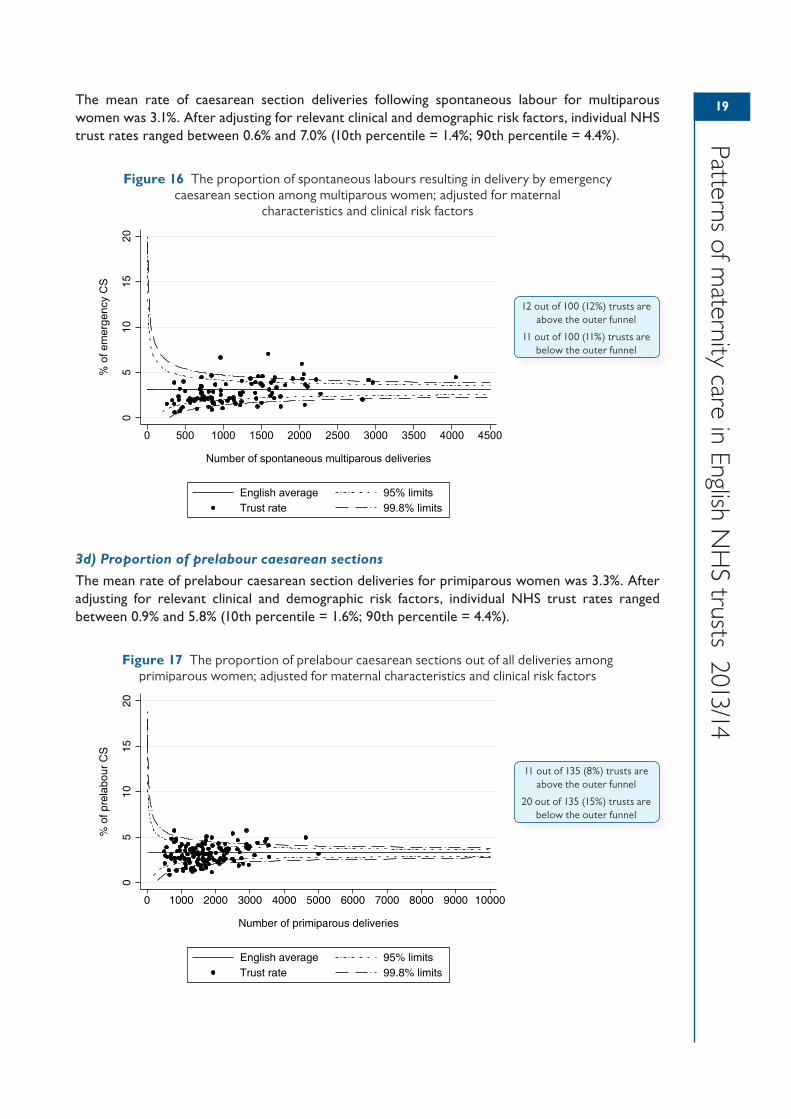
The mean rate of caesarean section deliveries following spontaneous labour for multiparous women was 3.1%. After adjusting for relevant clinical and demographic risk factors, individual NHS trust rates ranged between 0.6% and 7.0% (10th percentile = 1.4%; 90th percentile = 4.4%).
Figure 16 The proportion of spontaneous labours resulting in delivery by emergency caesarean section among multiparous women; adjusted for maternal
characteristics and clinical risk factors
3d) Proportion of prelabour caesarean sections
The mean rate of prelabour caesarean section deliveries for primiparous women was 3.3%. After adjusting for relevant clinical and demographic risk factors, individual NHS trust rates ranged between 0.9% and 5.8% (10th percentile = 1.6%; 90th percentile = 4.4%).
Figure 17 The proportion of prelabour caesarean sections out of all deliveries among primiparous women; adjusted for maternal characteristics and clinical risk factors
05
1015
20
% o
f em
erge
ncy
CS
0 500 1000 1500 2000 2500 3000 3500 4000 4500
Number of spontaneous multiparous deliveries
English average 95% limitsTrust rate 99.8% limits
12 out of 100 (12%) trusts are above the outer funnel
11 out of 100 (11%) trusts are below the outer funnel
05
1015
20
% o
f pre
labo
ur C
S
0 1000 2000 3000 4000 5000 6000 7000 8000 9000 10000
Number of primiparous deliveries
English average 95% limitsTrust rate 99.8% limits
11 out of 135 (8%) trusts are above the outer funnel
20 out of 135 (15%) trusts are below the outer funnel
20
Patt
erns
of m
ater
nity
car
e in
Eng
lish
NH
S tr
usts
201
3/14
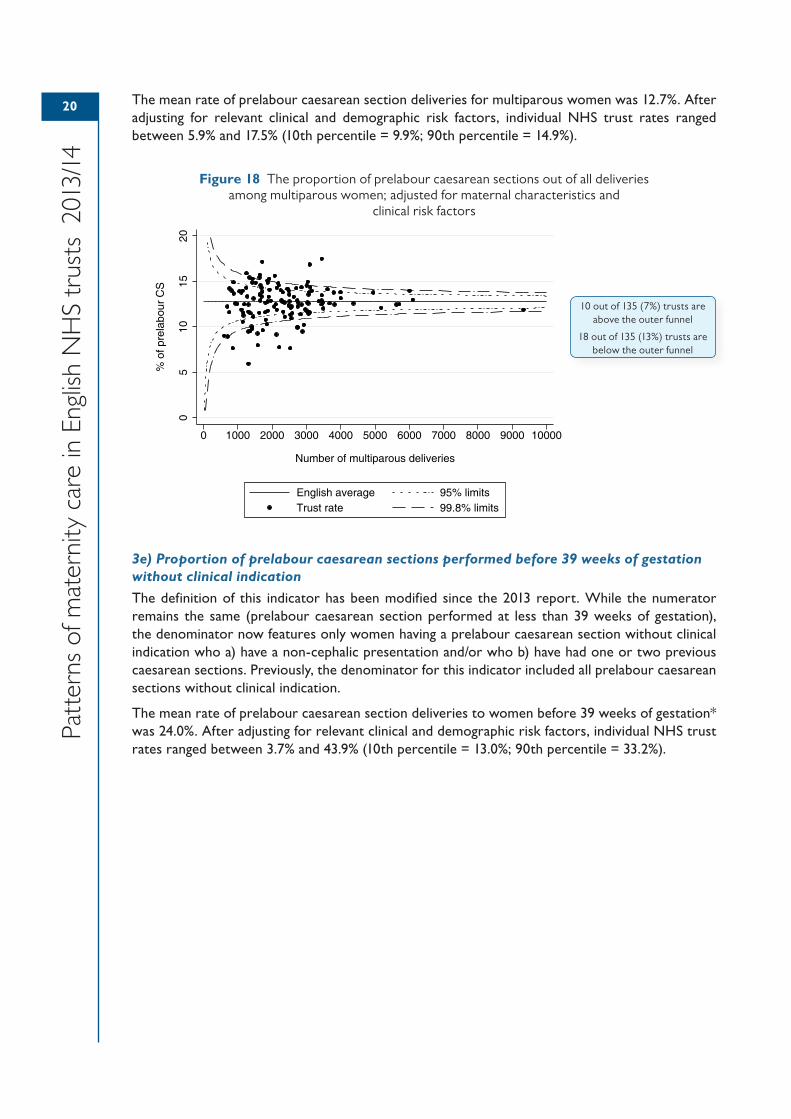
The mean rate of prelabour caesarean section deliveries for multiparous women was 12.7%. After adjusting for relevant clinical and demographic risk factors, individual NHS trust rates ranged between 5.9% and 17.5% (10th percentile = 9.9%; 90th percentile = 14.9%).
Figure 18 The proportion of prelabour caesarean sections out of all deliveries among multiparous women; adjusted for maternal characteristics and
clinical risk factors
3e) Proportion of prelabour caesarean sections performed before 39 weeks of gestation without clinical indication
The definition of this indicator has been modified since the 2013 report. While the numerator remains the same (prelabour caesarean section performed at less than 39 weeks of gestation), the denominator now features only women having a prelabour caesarean section without clinical indication who a) have a non-cephalic presentation and/or who b) have had one or two previous caesarean sections. Previously, the denominator for this indicator included all prelabour caesarean sections without clinical indication.
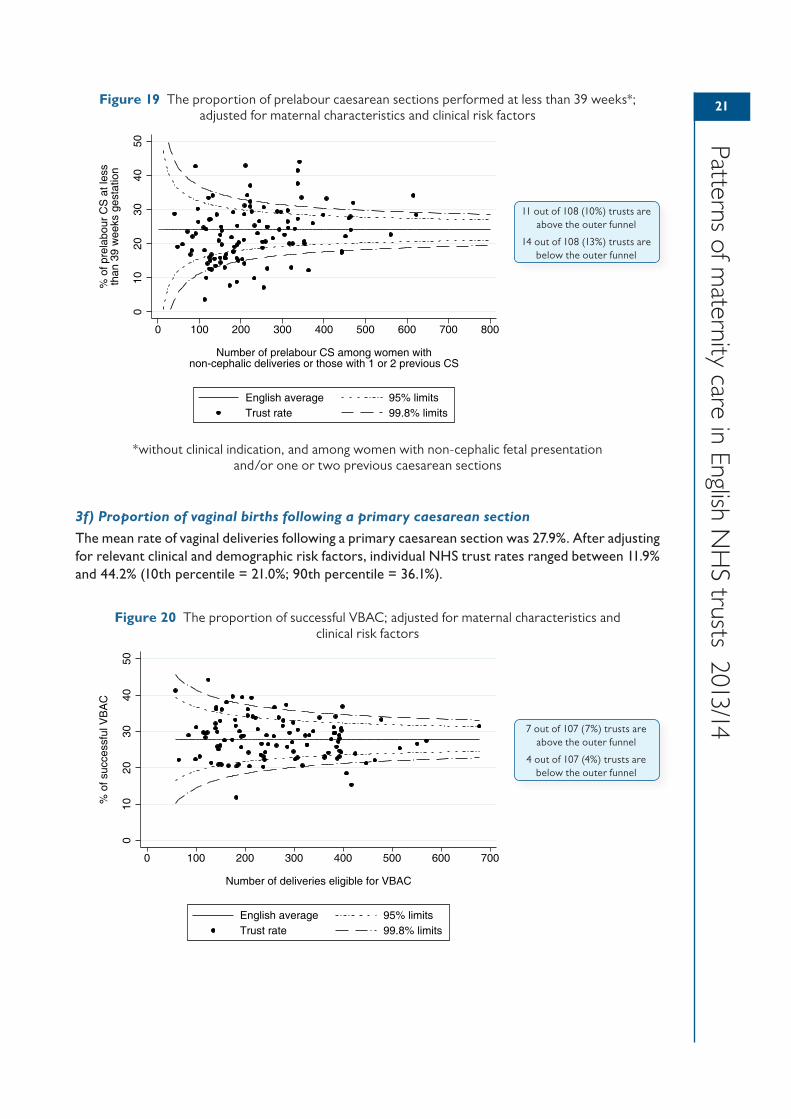
The mean rate of prelabour caesarean section deliveries to women before 39 weeks of gestation* was 24.0%. After adjusting for relevant clinical and demographic risk factors, individual NHS trust rates ranged between 3.7% and 43.9% (10th percentile = 13.0%; 90th percentile = 33.2%).
05
1015
20
% o
f pre
labo
ur C
S
0 1000 2000 3000 4000 5000 6000 7000 8000 9000 10000
Number of multiparous deliveries
English average 95% limitsTrust rate 99.8% limits
10 out of 135 (7%) trusts are above the outer funnel
18 out of 135 (13%) trusts are below the outer funnel
21
Patterns of maternity care in English N
HS trusts 2013/14
Figure 19 The proportion of prelabour caesarean sections performed at less than 39 weeks*; adjusted for maternal characteristics and clinical risk factors
*without clinical indication, and among women with non-cephalic fetal presentation and/or one or two previous caesarean sections
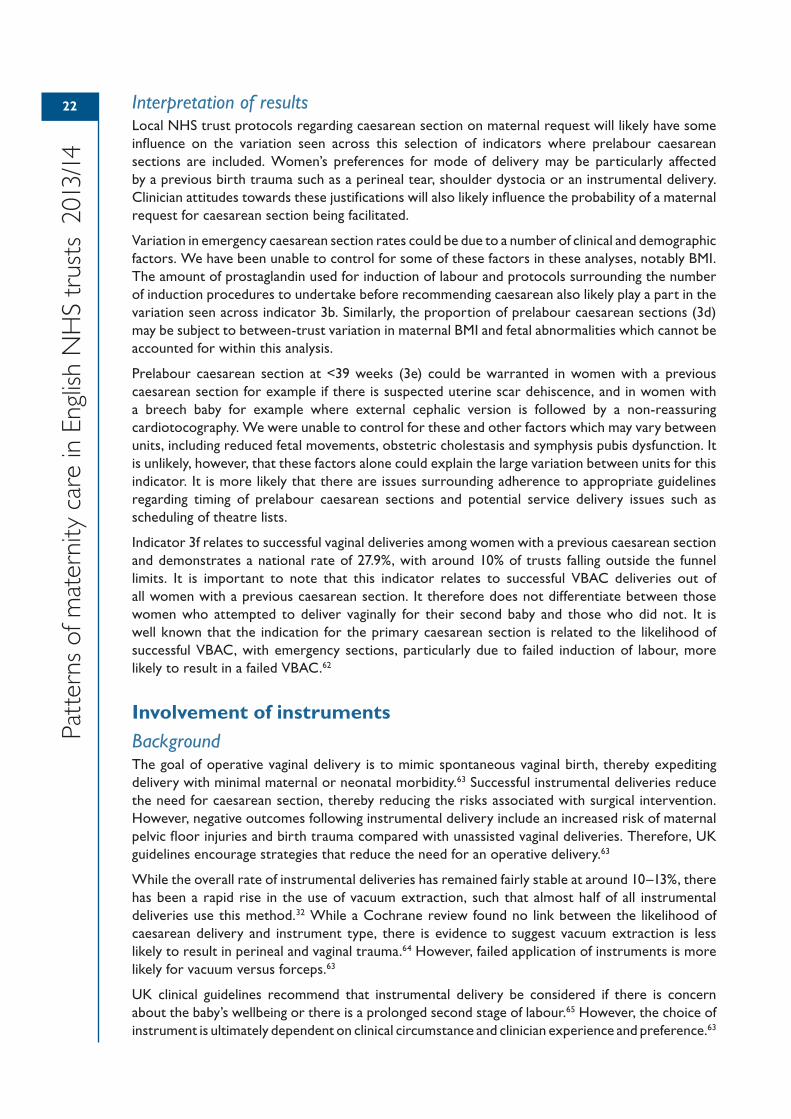
3f) Proportion of vaginal births following a primary caesarean section
The mean rate of vaginal deliveries following a primary caesarean section was 27.9%. After adjusting for relevant clinical and demographic risk factors, individual NHS trust rates ranged between 11.9% and 44.2% (10th percentile = 21.0%; 90th percentile = 36.1%).
Figure 20 The proportion of successful VBAC; adjusted for maternal characteristics and clinical risk factors
010
2030
4050
% o
f pre
labo
ur C
S a
t les
sth
an 3
9 w
eeks
ges
tatio
n
0 100 200 300 400 500 600 700 800
Number of prelabour CS among women withnon-cephalic deliveries or those with 1 or 2 previous CS
English average 95% limitsTrust rate 99.8% limits
11 out of 108 (10%) trusts are above the outer funnel
14 out of 108 (13%) trusts are below the outer funnel
010
2030
4050
% o
f suc
cess
ful V
BA
C
0 100 200 300 400 500 600 700
Number of deliveries eligible for VBAC
English average 95% limitsTrust rate 99.8% limits
7 out of 107 (7%) trusts are above the outer funnel
4 out of 107 (4%) trusts are below the outer funnel
22
Patt
erns
of m
ater
nity
car
e in
Eng
lish
NH
S tr
usts
201
3/14
Interpretation of resultsLocal NHS trust protocols regarding caesarean section on maternal request will likely have some influence on the variation seen across this selection of indicators where prelabour caesarean sections are included. Women’s preferences for mode of delivery may be particularly affected by a previous birth trauma such as a perineal tear, shoulder dystocia or an instrumental delivery. Clinician attitudes towards these justifications will also likely influence the probability of a maternal request for caesarean section being facilitated.
Variation in emergency caesarean section rates could be due to a number of clinical and demographic factors. We have been unable to control for some of these factors in these analyses, notably BMI. The amount of prostaglandin used for induction of labour and protocols surrounding the number of induction procedures to undertake before recommending caesarean also likely play a part in the variation seen across indicator 3b. Similarly, the proportion of prelabour caesarean sections (3d) may be subject to between-trust variation in maternal BMI and fetal abnormalities which cannot be accounted for within this analysis.
Prelabour caesarean section at <39 weeks (3e) could be warranted in women with a previous caesarean section for example if there is suspected uterine scar dehiscence, and in women with a breech baby for example where external cephalic version is followed by a non-reassuring cardiotocography. We were unable to control for these and other factors which may vary between units, including reduced fetal movements, obstetric cholestasis and symphysis pubis dysfunction. It is unlikely, however, that these factors alone could explain the large variation between units for this indicator. It is more likely that there are issues surrounding adherence to appropriate guidelines regarding timing of prelabour caesarean sections and potential service delivery issues such as scheduling of theatre lists.
Indicator 3f relates to successful vaginal deliveries among women with a previous caesarean section and demonstrates a national rate of 27.9%, with around 10% of trusts falling outside the funnel limits. It is important to note that this indicator relates to successful VBAC deliveries out of all women with a previous caesarean section. It therefore does not differentiate between those women who attempted to deliver vaginally for their second baby and those who did not. It is well known that the indication for the primary caesarean section is related to the likelihood of successful VBAC, with emergency sections, particularly due to failed induction of labour, more likely to result in a failed VBAC.62
Involvement of instrumentsBackgroundThe goal of operative vaginal delivery is to mimic spontaneous vaginal birth, thereby expediting delivery with minimal maternal or neonatal morbidity.63 Successful instrumental deliveries reduce the need for caesarean section, thereby reducing the risks associated with surgical intervention. However, negative outcomes following instrumental delivery include an increased risk of maternal pelvic floor injuries and birth trauma compared with unassisted vaginal deliveries. Therefore, UK guidelines encourage strategies that reduce the need for an operative delivery.63
While the overall rate of instrumental deliveries has remained fairly stable at around 10–13%, there has been a rapid rise in the use of vacuum extraction, such that almost half of all instrumental deliveries use this method.32 While a Cochrane review found no link between the likelihood of caesarean delivery and instrument type, there is evidence to suggest vacuum extraction is less likely to result in perineal and vaginal trauma.64 However, failed application of instruments is more likely for vacuum versus forceps.63
UK clinical guidelines recommend that instrumental delivery be considered if there is concern about the baby’s wellbeing or there is a prolonged second stage of labour.65 However, the choice of instrument is ultimately dependent on clinical circumstance and clinician experience and preference.63
23
Patterns of maternity care in English N
HS trusts 2013/14
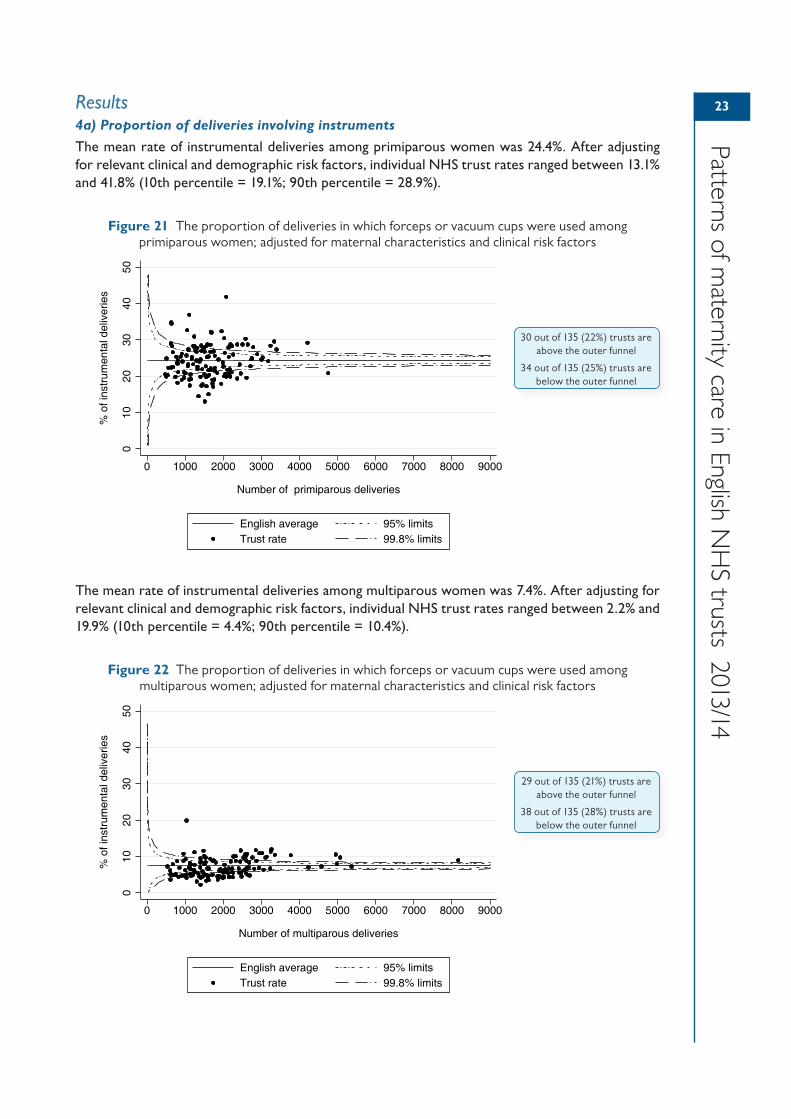
Results4a) Proportion of deliveries involving instruments
The mean rate of instrumental deliveries among primiparous women was 24.4%. After adjusting for relevant clinical and demographic risk factors, individual NHS trust rates ranged between 13.1% and 41.8% (10th percentile = 19.1%; 90th percentile = 28.9%).
Figure 21 The proportion of deliveries in which forceps or vacuum cups were used among primiparous women; adjusted for maternal characteristics and clinical risk factors
The mean rate of instrumental deliveries among multiparous women was 7.4%. After adjusting for relevant clinical and demographic risk factors, individual NHS trust rates ranged between 2.2% and 19.9% (10th percentile = 4.4%; 90th percentile = 10.4%).
Figure 22 The proportion of deliveries in which forceps or vacuum cups were used among multiparous women; adjusted for maternal characteristics and clinical risk factors
010
2030
4050
% o
f ins
trum
enta
l del
iver
ies
0 1000 2000 3000 4000 5000 6000 7000 8000 9000
Number of primiparous deliveries
English average 95% limitsTrust rate 99.8% limits
30 out of 135 (22%) trusts are above the outer funnel
34 out of 135 (25%) trusts are below the outer funnel
010
2030
4050
% o
f ins
trum
enta
l del
iver
ies
0 1000 2000 3000 4000 5000 6000 7000 8000 9000
Number of multiparous deliveries
English average 95% limitsTrust rate 99.8% limits
29 out of 135 (21%) trusts are above the outer funnel
38 out of 135 (28%) trusts are below the outer funnel
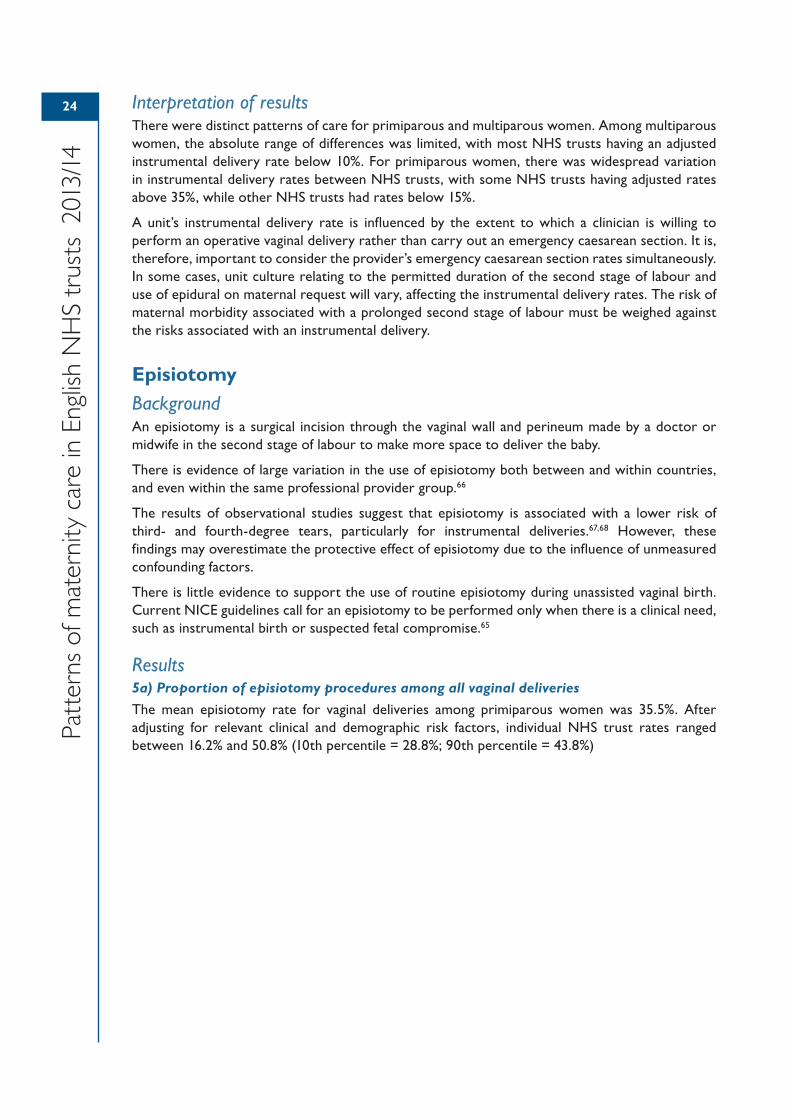
24
Patt
erns
of m
ater
nity
car
e in
Eng
lish
NH
S tr
usts
201
3/14
Interpretation of resultsThere were distinct patterns of care for primiparous and multiparous women. Among multiparous women, the absolute range of differences was limited, with most NHS trusts having an adjusted instrumental delivery rate below 10%. For primiparous women, there was widespread variation in instrumental delivery rates between NHS trusts, with some NHS trusts having adjusted rates above 35%, while other NHS trusts had rates below 15%.
A unit’s instrumental delivery rate is influenced by the extent to which a clinician is willing to perform an operative vaginal delivery rather than carry out an emergency caesarean section. It is, therefore, important to consider the provider’s emergency caesarean section rates simultaneously. In some cases, unit culture relating to the permitted duration of the second stage of labour and use of epidural on maternal request will vary, affecting the instrumental delivery rates. The risk of maternal morbidity associated with a prolonged second stage of labour must be weighed against the risks associated with an instrumental delivery.
EpisiotomyBackgroundAn episiotomy is a surgical incision through the vaginal wall and perineum made by a doctor or midwife in the second stage of labour to make more space to deliver the baby.
There is evidence of large variation in the use of episiotomy both between and within countries, and even within the same professional provider group.66
The results of observational studies suggest that episiotomy is associated with a lower risk of third- and fourth-degree tears, particularly for instrumental deliveries.67,68 However, these findings may overestimate the protective effect of episiotomy due to the influence of unmeasured confounding factors.
There is little evidence to support the use of routine episiotomy during unassisted vaginal birth. Current NICE guidelines call for an episiotomy to be performed only when there is a clinical need, such as instrumental birth or suspected fetal compromise.65
Results5a) Proportion of episiotomy procedures among all vaginal deliveries
The mean episiotomy rate for vaginal deliveries among primiparous women was 35.5%. After adjusting for relevant clinical and demographic risk factors, individual NHS trust rates ranged between 16.2% and 50.8% (10th percentile = 28.8%; 90th percentile = 43.8%)
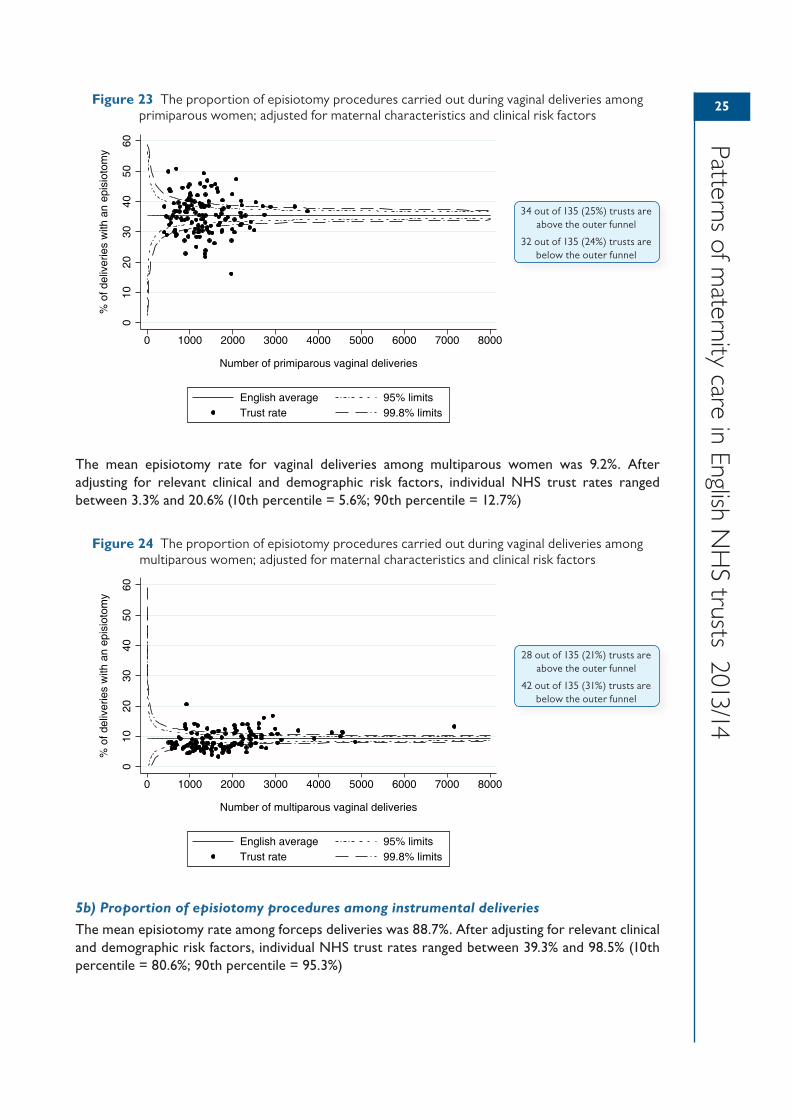
25
Patterns of maternity care in English N
HS trusts 2013/14
Figure 23 The proportion of episiotomy procedures carried out during vaginal deliveries among primiparous women; adjusted for maternal characteristics and clinical risk factors
The mean episiotomy rate for vaginal deliveries among multiparous women was 9.2%. After adjusting for relevant clinical and demographic risk factors, individual NHS trust rates ranged between 3.3% and 20.6% (10th percentile = 5.6%; 90th percentile = 12.7%)
Figure 24 The proportion of episiotomy procedures carried out during vaginal deliveries among multiparous women; adjusted for maternal characteristics and clinical risk factors
5b) Proportion of episiotomy procedures among instrumental deliveries
The mean episiotomy rate among forceps deliveries was 88.7%. After adjusting for relevant clinical and demographic risk factors, individual NHS trust rates ranged between 39.3% and 98.5% (10th percentile = 80.6%; 90th percentile = 95.3%)
010
2030
4050
60
% o
f del
iver
ies
with
an
epis
ioto
my
0 1000 2000 3000 4000 5000 6000 7000 8000
Number of primiparous vaginal deliveries
English average 95% limitsTrust rate 99.8% limits
34 out of 135 (25%) trusts are above the outer funnel
32 out of 135 (24%) trusts are below the outer funnel
010
2030
4050
60
% o
f del
iver
ies
with
an
epis
ioto
my
0 1000 2000 3000 4000 5000 6000 7000 8000
Number of multiparous vaginal deliveries
English average 95% limitsTrust rate 99.8% limits
28 out of 135 (21%) trusts are above the outer funnel
42 out of 135 (31%) trusts are below the outer funnel
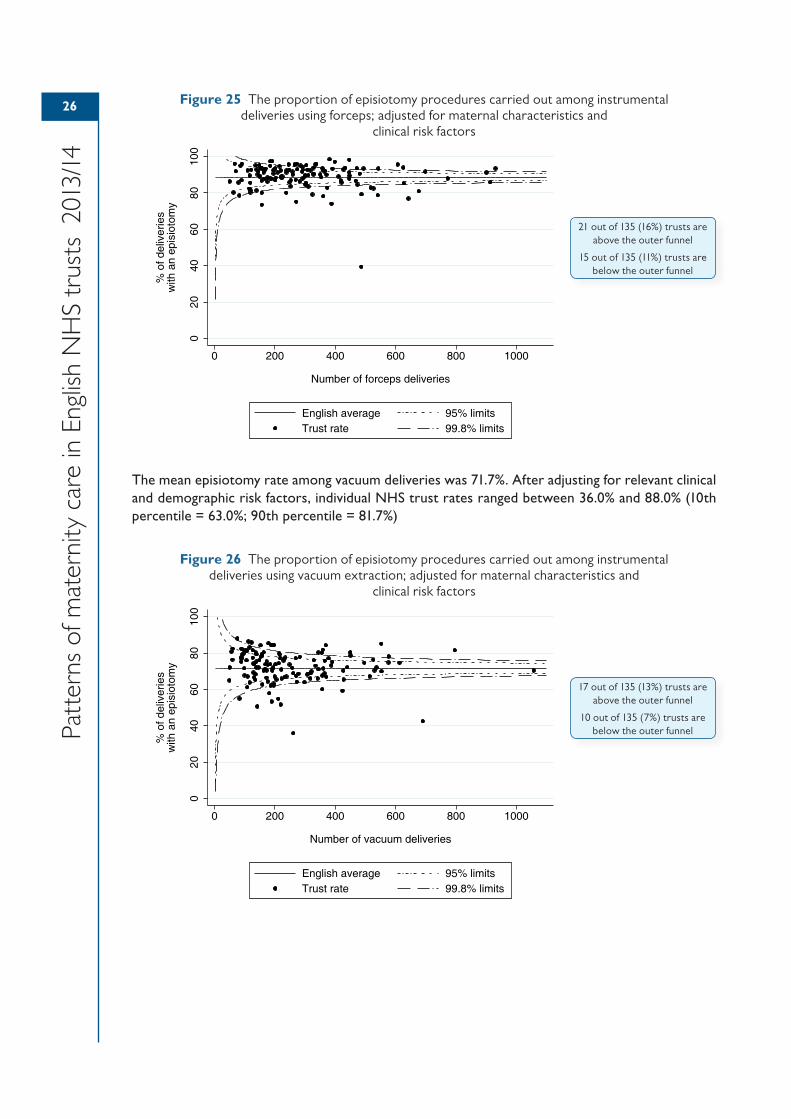
26
Patt
erns
of m
ater
nity
car
e in
Eng
lish
NH
S tr
usts
201
3/14
Figure 25 The proportion of episiotomy procedures carried out among instrumental deliveries using forceps; adjusted for maternal characteristics and
clinical risk factors
The mean episiotomy rate among vacuum deliveries was 71.7%. After adjusting for relevant clinical and demographic risk factors, individual NHS trust rates ranged between 36.0% and 88.0% (10th percentile = 63.0%; 90th percentile = 81.7%)
Figure 26 The proportion of episiotomy procedures carried out among instrumental deliveries using vacuum extraction; adjusted for maternal characteristics and
clinical risk factors
020
4060
8010
0
% o
f del
iver
ies
with
an
epis
ioto
my
0 200 400 600 800 1000
Number of forceps deliveries
English average 95% limitsTrust rate 99.8% limits
21 out of 135 (16%) trusts are above the outer funnel
15 out of 135 (11%) trusts are below the outer funnel
020
4060
8010
0
% o
f del
iver
ies
with
an
epis
ioto
my
0 200 400 600 800 1000
Number of vacuum deliveries
English average 95% limitsTrust rate 99.8% limits
17 out of 135 (13%) trusts are above the outer funnel
10 out of 135 (7%) trusts are below the outer funnel
27
Patterns of maternity care in English N
HS trusts 2013/14
Interpretation of resultsThese results show considerably higher rates of episiotomy among primiparous women than among multiparous women (5a). This is in large part due to the higher rate of instrumental delivery among the former group. It is important to note that the variation observed between NHS trusts in the overall episiotomy rate will, in part, be driven by local differences in the rate of instrumental delivery, and will be higher if there is a higher rate of instrumental delivery, particularly if the local preference is for forceps. The results should therefore be interpreted in the context of the instrumental delivery rate.
When the results are stratified by type of instrument (5b), we see higher rates of episiotomy for forceps than for vacuum deliveries. This is to be expected since the RCOG Green-top Guideline states that an episiotomy should be considered in instrumental deliveries, ‘particularly for forceps delivery’.63 An episiotomy should almost always be performed when delivering a primiparous woman using Kielland forceps. It is our view that NHS trusts with an episiotomy rate of less than 80% for forceps deliveries should therefore consider an audit of local practice.
Indicators relating to third- and fourth-degree tearsBackgroundIn England, the rate of third- and fourth-degree tears has tripled over the last decade from 1.8% to 5.9% among singleton, term, cephalic, vaginal first births.67 While the exact reasons for this increase are not fully understood, the probability of a third- or fourth-degree tear is increased during an instrumental delivery, and additional risk factors such as nulliparity, prolonged second stage of labour, high expected birthweight and shoulder dystocia have also been identified.67,69 There is also a possibility that the increase is due, in part, to improvements in the diagnosis and coding of perineal tears and repairs in HES data.
Short-term complications of tears of this nature include pain, bleeding and infection, which can result in urinary retention and constipation. The long term impact can include anal incontinence, chronic pain, dyspareunia and urinary incontinence.70 In some circumstances, the trauma of sustaining a serious tear and the associated complications affects subsequent deliveries where an elective caesarean section is preferred over vaginal delivery.67
The costs of third- and fourth-degree tears, in terms of both medico-legal negligence claims (estimated at £31.2 million across the ten years from 2000–2010)71 and any subsequent ongoing imaging, outpatient, community and surgical follow-up required for further treatment are potentially substantial.
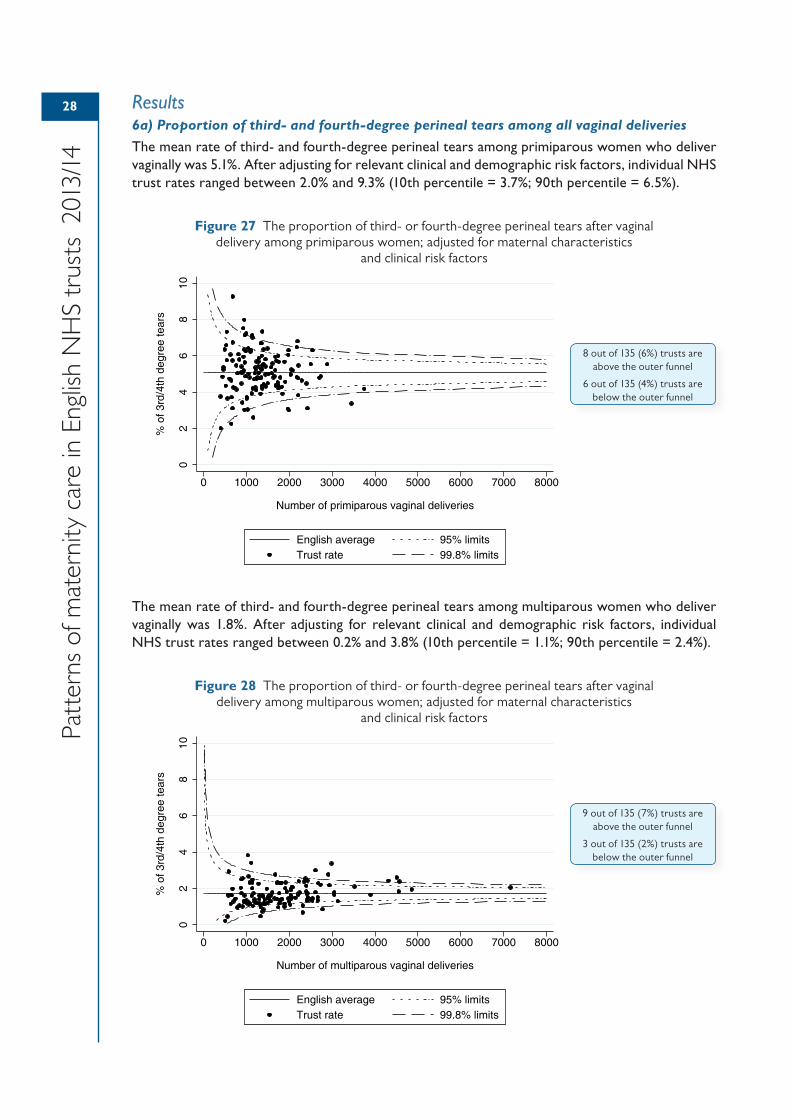
28
Patt
erns
of m
ater
nity
car
e in
Eng
lish
NH
S tr
usts
201
3/14
Results6a) Proportion of third- and fourth-degree perineal tears among all vaginal deliveries
The mean rate of third- and fourth-degree perineal tears among primiparous women who deliver vaginally was 5.1%. After adjusting for relevant clinical and demographic risk factors, individual NHS trust rates ranged between 2.0% and 9.3% (10th percentile = 3.7%; 90th percentile = 6.5%).
Figure 27 The proportion of third- or fourth-degree perineal tears after vaginal delivery among primiparous women; adjusted for maternal characteristics
and clinical risk factors
The mean rate of third- and fourth-degree perineal tears among multiparous women who deliver vaginally was 1.8%. After adjusting for relevant clinical and demographic risk factors, individual NHS trust rates ranged between 0.2% and 3.8% (10th percentile = 1.1%; 90th percentile = 2.4%).
Figure 28 The proportion of third- or fourth-degree perineal tears after vaginal delivery among multiparous women; adjusted for maternal characteristics
and clinical risk factors
02
46
810
% o
f 3rd
/4th
deg
ree
tear
s
0 1000 2000 3000 4000 5000 6000 7000 8000
Number of primiparous vaginal deliveries
English average 95% limitsTrust rate 99.8% limits
8 out of 135 (6%) trusts are above the outer funnel
6 out of 135 (4%) trusts are below the outer funnel
02
46
810
% o
f 3rd
/4th
deg
ree
tear
s
0 1000 2000 3000 4000 5000 6000 7000 8000
Number of multiparous vaginal deliveries
English average 95% limitsTrust rate 99.8% limits
9 out of 135 (7%) trusts are above the outer funnel
3 out of 135 (2%) trusts are below the outer funnel
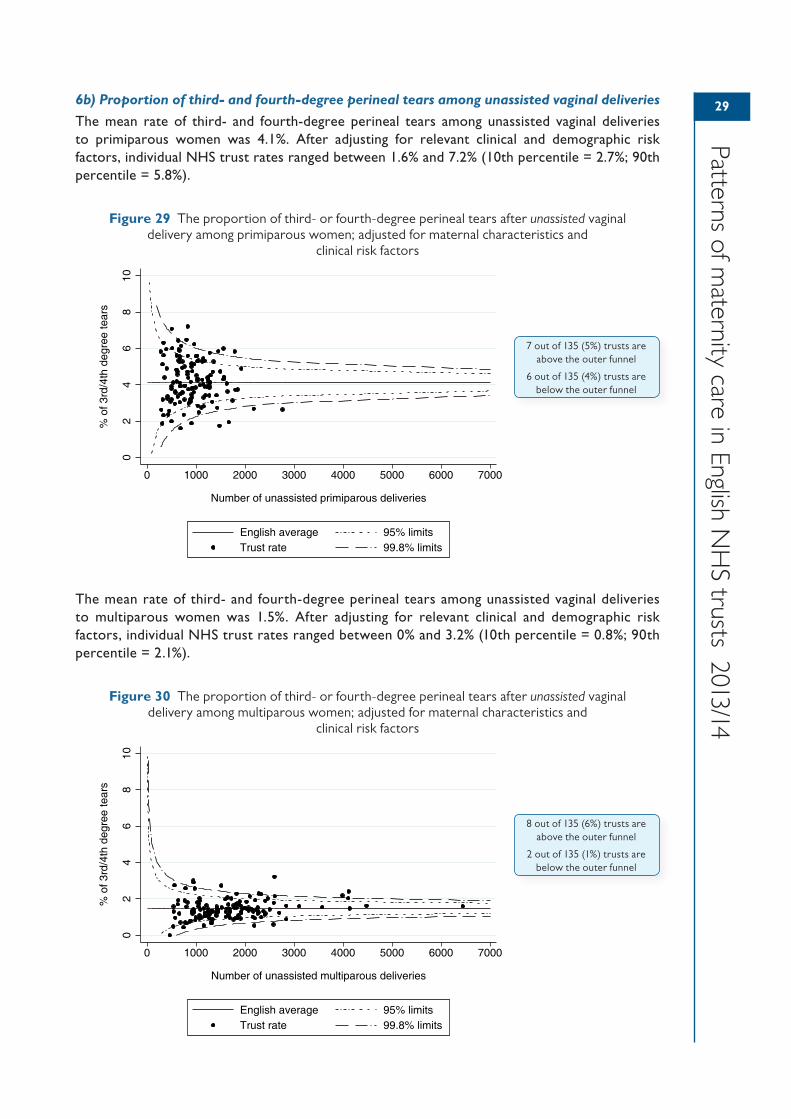
29
Patterns of maternity care in English N
HS trusts 2013/14
6b) Proportion of third- and fourth-degree perineal tears among unassisted vaginal deliveries
The mean rate of third- and fourth-degree perineal tears among unassisted vaginal deliveries to primiparous women was 4.1%. After adjusting for relevant clinical and demographic risk factors, individual NHS trust rates ranged between 1.6% and 7.2% (10th percentile = 2.7%; 90th percentile = 5.8%).
Figure 29 The proportion of third- or fourth-degree perineal tears after unassisted vaginal delivery among primiparous women; adjusted for maternal characteristics and
clinical risk factors
The mean rate of third- and fourth-degree perineal tears among unassisted vaginal deliveries to multiparous women was 1.5%. After adjusting for relevant clinical and demographic risk factors, individual NHS trust rates ranged between 0% and 3.2% (10th percentile = 0.8%; 90th percentile = 2.1%).
Figure 30 The proportion of third- or fourth-degree perineal tears after unassisted vaginal delivery among multiparous women; adjusted for maternal characteristics and
clinical risk factors
02
46
810
% o
f 3rd
/4th
deg
ree
tear
s
0 1000 2000 3000 4000 5000 6000 7000
Number of unassisted primiparous deliveries
English average 95% limitsTrust rate 99.8% limits
7 out of 135 (5%) trusts are above the outer funnel
6 out of 135 (4%) trusts are below the outer funnel
02
46
810
% o
f 3rd
/4th
deg
ree
tear
s
0 1000 2000 3000 4000 5000 6000 7000
Number of unassisted multiparous deliveries
English average 95% limitsTrust rate 99.8% limits
8 out of 135 (6%) trusts are above the outer funnel
2 out of 135 (1%) trusts are below the outer funnel
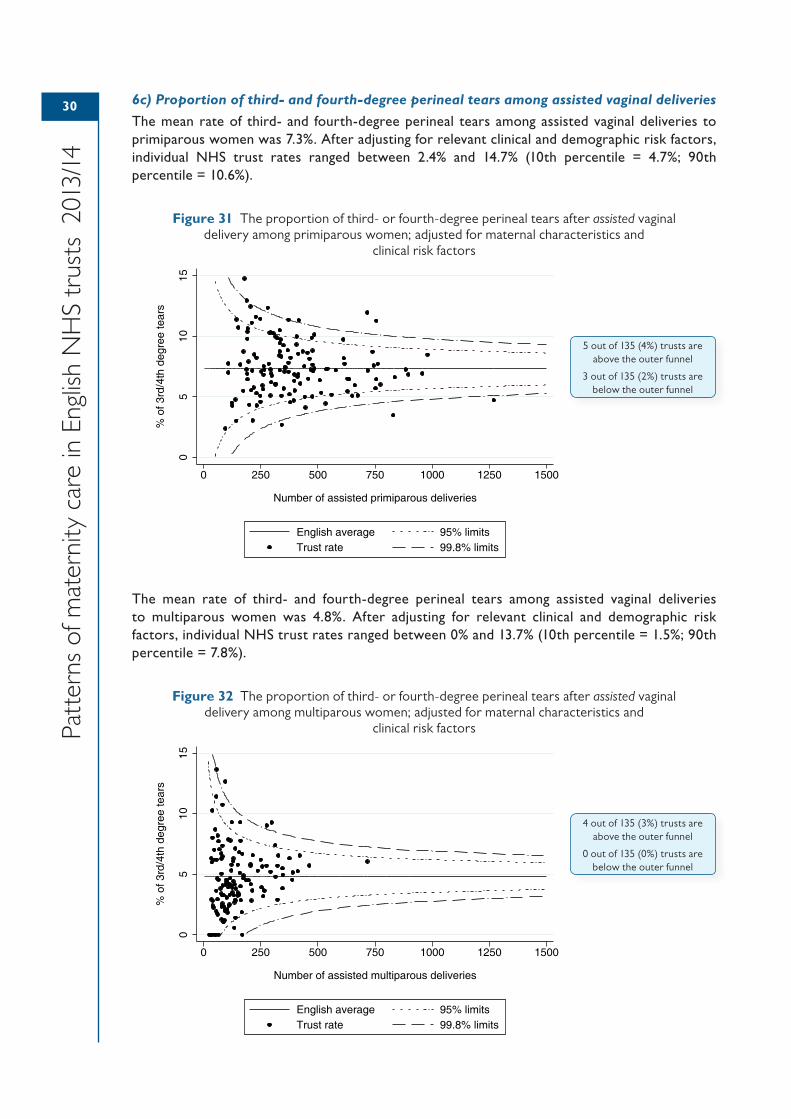
30
Patt
erns
of m
ater
nity
car
e in
Eng
lish
NH
S tr
usts
201
3/14
6c) Proportion of third- and fourth-degree perineal tears among assisted vaginal deliveries
The mean rate of third- and fourth-degree perineal tears among assisted vaginal deliveries to primiparous women was 7.3%. After adjusting for relevant clinical and demographic risk factors, individual NHS trust rates ranged between 2.4% and 14.7% (10th percentile = 4.7%; 90th percentile = 10.6%).
Figure 31 The proportion of third- or fourth-degree perineal tears after assisted vaginal delivery among primiparous women; adjusted for maternal characteristics and
clinical risk factors
The mean rate of third- and fourth-degree perineal tears among assisted vaginal deliveries to multiparous women was 4.8%. After adjusting for relevant clinical and demographic risk factors, individual NHS trust rates ranged between 0% and 13.7% (10th percentile = 1.5%; 90th percentile = 7.8%).
Figure 32 The proportion of third- or fourth-degree perineal tears after assisted vaginal delivery among multiparous women; adjusted for maternal characteristics and
clinical risk factors
05
1015
% o
f 3rd
/4th
deg
ree
tear
s
0 250 500 750 1000 1250 1500
Number of assisted primiparous deliveries
English average 95% limitsTrust rate 99.8% limits
5 out of 135 (4%) trusts are above the outer funnel
3 out of 135 (2%) trusts are below the outer funnel
05
1015
% o
f 3rd
/4th
deg
ree
tear
s
0 250 500 750 1000 1250 1500
Number of assisted multiparous deliveries
English average 95% limitsTrust rate 99.8% limits
4 out of 135 (3%) trusts are above the outer funnel
0 out of 135 (0%) trusts are below the outer funnel
31
Patterns of maternity care in English N
HS trusts 2013/14
Interpretation of resultsThe proportion of deliveries resulting in third- and fourth-degree perineal tears may be a useful metric for assessing the quality of delivery care. A particularly high rate of third- and fourth-degree tears should be investigated in case it is being inflated by potential quality problems, such as overuse or underuse of episiotomy.72,73
Variation between NHS trusts may also be due in part to differences in coding practices and in the methods used to diagnose perineal tears. An unusually low rate of perineal tears may be a cause for concern because it could indicate either under-reporting or under-diagnosis of these injuries before discharge, leading to delays in surgical repair. Related to this point, the difference in rates of third- and fourth-degree tears following assisted and unassisted vaginal delivery could in part be explained by the fact that after an instrumental delivery there is always a structured examination of the perineum, including a rectal examination, whereas this is not the case for vaginal deliveries. We suggest that trusts with exceptionally low rates of tears should investigate their diagnostic and coding practices to ensure figures are recorded accurately.
Although the funnel plots presented in this section show some evidence of variation in the rate of third- and fourth-degree tears between NHS trusts, less than 10% fall outside the outer funnel limits on any of the six indicators in this group. This is slightly more than would be expected but we have been unable to control for BMI or smoking status, which are known to be related to this outcome and may explain some of the excess variation.
It is worth noting that the results in this section should not be taken in isolation, but rather should be interpreted in the context of some of the other indicators presented in this report, particularly the caesarean section, instrumental delivery and episiotomy rates.
Unplanned readmission to hospitalBackgroundMonitoring the rate of unplanned readmission within 30 days of discharge is a common measure of hospital performance. Such indicators have been used for a wide variety of conditions and therapeutic interventions. A recent analysis of data from English hospitals concluded that a large minority of NHS emergency readmissions fell into groups that were amenable to local initiatives that could prevent such readmissions in the future.74
Emergency neonatal or maternal readmission to hospital within 28 and 42 days of birth, respectively, represents a deviation from the normal course of postnatal care and an undesirable outcome. The emotional and social consequences of any readmission, such as a new family having to spend time apart, should not be overlooked.
Maternal readmission to hospital following delivery can occur for a variety of reasons, including surgical site infection, chest or womb infection, urinary tract infection, perineal wound breakdown, endometritis, pneumonia, mastitis, uncontrolled postoperative pain, anaemia requiring a blood transfusion, venous thromboembolism, mental health conditions or, very rarely, visceral damage from surgery. The most common causes of neonatal readmission within 28 days of birth are feeding problems, jaundice, respiratory distress and suspected infection, including sepsis. According to Young et al.,75 the majority of emergency neonatal readmissions within 28 days of birth are potentially preventable.
Results7a) Unplanned maternal readmission to hospital within 42 days of delivery
This indicator has been modified since the 2013 report. The previous indicator examined unplanned maternal readmissions within 30 days of delivery. The new denominator now relates to all women, excluding those who died before discharge or who were not discharged within 42 days of delivery. The new numerator now includes hospital readmissions within 42 days of delivery (excluding: planned readmissions, planned transfers and readmissions of less than one day).
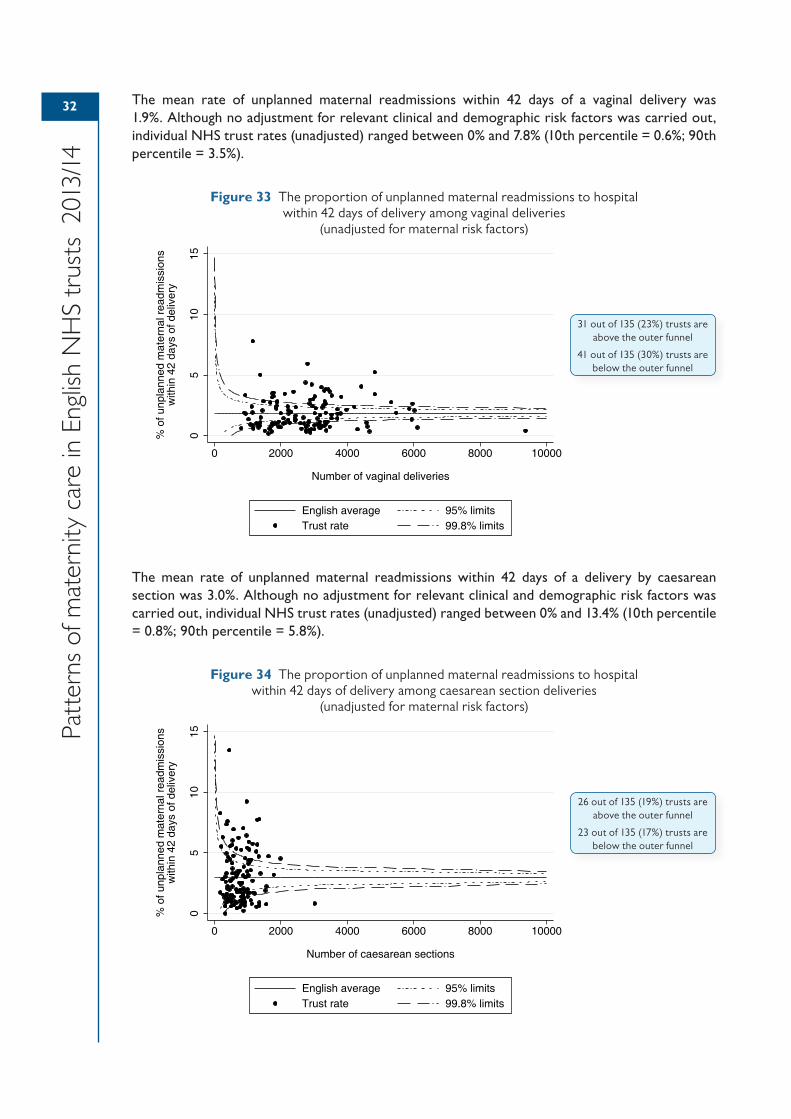
32
Patt
erns
of m
ater
nity
car
e in
Eng
lish
NH
S tr
usts
201
3/14
The mean rate of unplanned maternal readmissions within 42 days of a vaginal delivery was 1.9%. Although no adjustment for relevant clinical and demographic risk factors was carried out, individual NHS trust rates (unadjusted) ranged between 0% and 7.8% (10th percentile = 0.6%; 90th percentile = 3.5%).
Figure 33 The proportion of unplanned maternal readmissions to hospital within 42 days of delivery among vaginal deliveries
(unadjusted for maternal risk factors)
The mean rate of unplanned maternal readmissions within 42 days of a delivery by caesarean section was 3.0%. Although no adjustment for relevant clinical and demographic risk factors was carried out, individual NHS trust rates (unadjusted) ranged between 0% and 13.4% (10th percentile = 0.8%; 90th percentile = 5.8%).
Figure 34 The proportion of unplanned maternal readmissions to hospital within 42 days of delivery among caesarean section deliveries
(unadjusted for maternal risk factors)
05
1015
% o
f unp
lann
ed m
ater
nal r
eadm
issi
ons
with
in 4
2 da
ys o
f del
iver
y
0 2000 4000 6000 8000 10000
Number of vaginal deliveries
English average 95% limitsTrust rate 99.8% limits
31 out of 135 (23%) trusts are above the outer funnel
41 out of 135 (30%) trusts are below the outer funnel
05
1015
% o
f unp
lann
ed m
ater
nal r
eadm
issi
ons
with
in 4
2 da
ys o
f del
iver
y
0 2000 4000 6000 8000 10000
Number of caesarean sections
English average 95% limitsTrust rate 99.8% limits
26 out of 135 (19%) trusts are above the outer funnel
23 out of 135 (17%) trusts are below the outer funnel
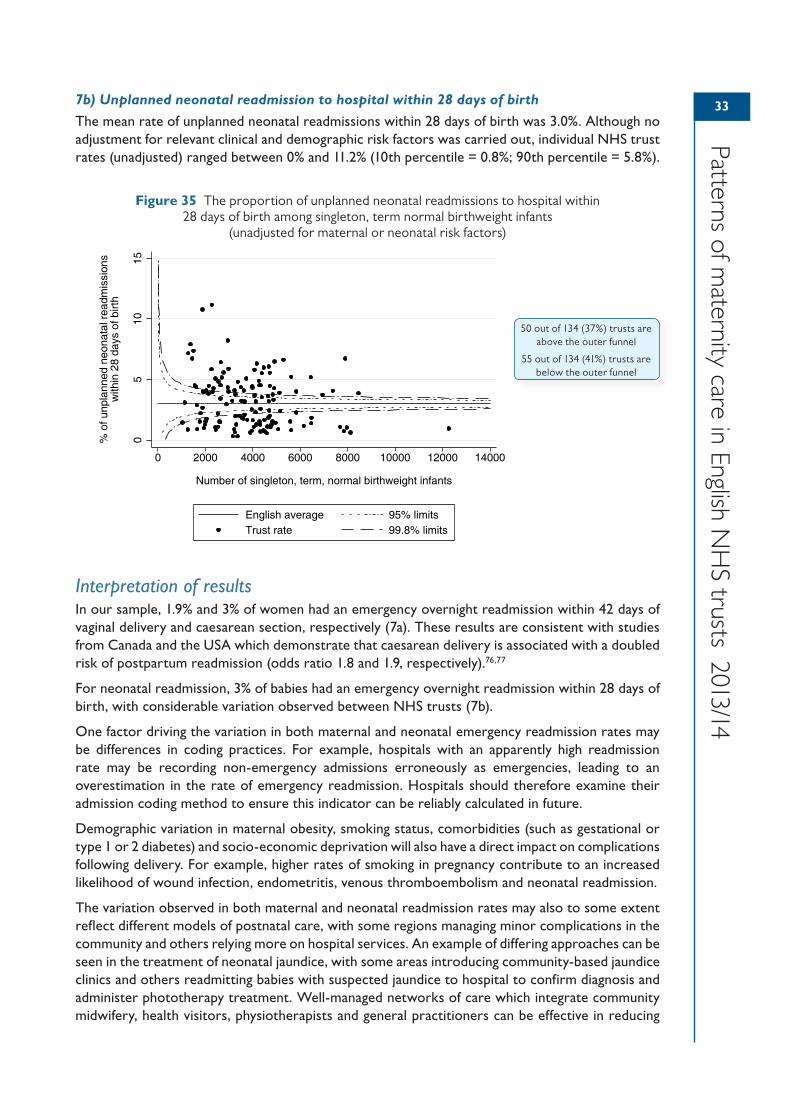
33
Patterns of maternity care in English N
HS trusts 2013/14
7b) Unplanned neonatal readmission to hospital within 28 days of birth
The mean rate of unplanned neonatal readmissions within 28 days of birth was 3.0%. Although no adjustment for relevant clinical and demographic risk factors was carried out, individual NHS trust rates (unadjusted) ranged between 0% and 11.2% (10th percentile = 0.8%; 90th percentile = 5.8%).
Figure 35 The proportion of unplanned neonatal readmissions to hospital within 28 days of birth among singleton, term normal birthweight infants
(unadjusted for maternal or neonatal risk factors)
Interpretation of resultsIn our sample, 1.9% and 3% of women had an emergency overnight readmission within 42 days of vaginal delivery and caesarean section, respectively (7a). These results are consistent with studies from Canada and the USA which demonstrate that caesarean delivery is associated with a doubled risk of postpartum readmission (odds ratio 1.8 and 1.9, respectively).76,77
For neonatal readmission, 3% of babies had an emergency overnight readmission within 28 days of birth, with considerable variation observed between NHS trusts (7b).
One factor driving the variation in both maternal and neonatal emergency readmission rates may be differences in coding practices. For example, hospitals with an apparently high readmission rate may be recording non-emergency admissions erroneously as emergencies, leading to an overestimation in the rate of emergency readmission. Hospitals should therefore examine their admission coding method to ensure this indicator can be reliably calculated in future.
Demographic variation in maternal obesity, smoking status, comorbidities (such as gestational or type 1 or 2 diabetes) and socio-economic deprivation will also have a direct impact on complications following delivery. For example, higher rates of smoking in pregnancy contribute to an increased likelihood of wound infection, endometritis, venous thromboembolism and neonatal readmission.
The variation observed in both maternal and neonatal readmission rates may also to some extent reflect different models of postnatal care, with some regions managing minor complications in the community and others relying more on hospital services. An example of differing approaches can be seen in the treatment of neonatal jaundice, with some areas introducing community-based jaundice clinics and others readmitting babies with suspected jaundice to hospital to confirm diagnosis and administer phototherapy treatment. Well-managed networks of care which integrate community midwifery, health visitors, physiotherapists and general practitioners can be effective in reducing
05
1015
% o
f unp
lann
ed n
eona
tal r
eadm
issi
ons
with
in 2
8 da
ys o
f birt
h
0 2000 4000 6000 8000 10000 12000 14000
Number of singleton, term, normal birthweight infants
English average 95% limitsTrust rate 99.8% limits
50 out of 134 (37%) trusts are above the outer funnel
55 out of 134 (41%) trusts are below the outer funnel
34
Patt
erns
of m
ater
nity
car
e in
Eng
lish
NH
S tr
usts
201
3/14
both maternal and neonatal hospital readmissions by tackling minor problems in the community, or by offering near-patient testing to reduce the need for hospital-based tests.
Another example of variation in local protocols concerns infant feeding problems. Local thresholds for readmission due to weight loss typically allow a loss of up to 10% of the infant’s birthweight, but this can be more or less depending on local policy. The proportion of infants meeting this threshold may also depend upon the availability of local breastfeeding clinics and support services.
Finally, high readmission rates may reflect a higher incidence of localised infections, for example seasonal outbreaks of bronchiolitis, or difficulties in breastfeeding education as a result of either discharge too soon from hospital or inadequate community support. On the other hand, a low readmission rate could also be a sign of reduced capacity in hospital. Higher thresholds for readmission may exist where there are bed shortages, particularly for borderline cases. These conflicting interpretations bring into question the validity of using readmission rates as a measure of quality of care.
35354 Data quality
Quality of HES dataUsing HES data has several advantages when trying to describe patterns of care and outcomes in English NHS maternity services. First, HES data are readily available and therefore are a cost-effective source of information. Second, over 96% of all deliveries in England occur in NHS hospitals and are therefore captured by HES.30 This substantially reduces the risk of selection bias when deriving national and provider-level statistics. Similarly, this high level of completeness gives large sample sizes for indicators that are based on all deliveries. Third, the data are able to capture multiple procedures and diagnoses at an individual level, and so provide a rich description of patient characteristics and clinical risk factors.
Despite these advantages, there are also some important limitations. Concerns surrounding the accuracy and completeness of diagnosis and procedure coding have been raised,78 although there is mounting evidence that most NHS trusts submit good quality data to HES.79–81 Moreover, by combining diagnosis, procedure and administrative codes, researchers have been able to develop coding frameworks that allow assessment of miscoding to identify hospitals with divergent coding practices.82
One particular limitation of the HES maternity data is that not all clinical information is captured in the dataset. Certain maternal risk factors such as BMI, smoking and alcohol consumption are not recorded, meaning that these factors cannot be taken into account in risk-adjustment models.
Further, national data warehouses like HES raise important issues around the standardisation of data definitions among maternity units. Divergent coding practices can undermine meaningful comparisons and lead to inappropriate incentives and penalties being given to hospitals. Discrepancies in coding tend to occur where there is not clarity about the definition of a particular data item. As previously mentioned, our analysis of HES maternity data suggests that some units are failing to differentiate between induction and augmentation of labour, leading to an overestimation of the induction of labour rate.
Finally, the completeness of the HES maternity tail varies among NHS trusts. Key data items such as parity, onset of labour, gestational age and birthweight are missing in over 20% of records overall, with some NHS trusts not submitting usable maternity tail data for any deliveries. The completeness of the maternity tail has improved in recent years. Nonetheless, it is often a limiting factor in the construction of precise performance indicators.
Clinical governance is a framework through which healthcare organisations are accountable for continuously improving the quality of their services and safeguarding high standards of care by creating an environment in which excellence in clinical care will flourish.In practice, this depends on clear lines of accountability and decision making, underpinned by immediate and continuous access to accurate outcome data from the organisation’s processes. If data either are not immediately available or are inaccurate, the organisation fails to function eff iciently. This will affect both quality and the identif ication and management of risk.There has traditionally been more emphasis and resources allocated to studying processes within randomised trials rather than investment in routine collection of outcome data. This has resulted in poor quality routinely collected data both at local and national level. This failure must be acknowledged before any improvement can take place. A detailed assessment around routinely collected maternity data needs to be carried out and a long-term strategy put in place to rectify the situation. An appropriate starting point would be encouraging and rewarding good quality validated data rather than achieving particular targets.
36
Patt
erns
of m
ater
nity
car
e in
Eng
lish
NH
S tr
usts
201
3/14
Assessment of data qualityBefore performing any data quality assessments, we comprehensively cleaned the HES data to remove duplicates and records that did not relate to a valid delivery episode. This ensured the initial cohort was as accurate as possible.
Using the cleaned dataset, we implemented a number of techniques to identify data quality issues. These techniques allowed us to be confident that the published figures are based on data that has met at least a minimum standard of consistency. In order to assess the quality of key data items, we used three main methods:
• investigation of the proportion of missing data
• distribution of non-missing values
• internal validation and cross-checking.
These techniques each served a different purpose and, together, improve the likelihood of detecting poor quality data. For example, a data quality assessment based on the proportion of missing data alone would not be sufficient, as it could lead to the inclusion of records from hospitals with seemingly complete data but with an observed distribution of data outside the expected range of values. In particular, a number of hospitals appear to have an implausible ratio of primiparous to multiparous women because primiparous women are seemingly being classified incorrectly as multiparous in the maternity tail. Internal validation methods can be used to examine the level of agreement between parity as recorded in the maternity tail and as derived using a historical ‘look-back’ approach, to determine which method is the most reliable source of data on parity.84 Although it was not possible for this report, there might also be some merit in carrying out external validation of HES data and sharing common coding errors on a national level.
The future of routine data collection is most likely to be successful by implementation of an electronic patient record (EPR). However, digitisation of healthcare information collection on its own will not ensure success, as most healthcare organisations will verify. The belief in, and commitment to, this process by all clinicians is crucial to its success, as is the contribution of the construction of the EPR itself. Standardisation of events and outcomes needs to be agreed and lessons have to be learned from the present Hospital Episode Statistics (HES), especially when the most fundamental labour and delivery information cannot at the moment be reliably collected for all units. This includes in particular previous obstetric history (nulliparous, multiparous without a scar and multiparous women with at least one scar), category of pregnancy (single cephalic, single breech, multiple and pregnancies with a single transverse or oblique lie), onset of pathway to delivery (spontaneous labour, induced labour and prelabour caesarean section) and lastly gestation at delivery.Only when routine data quality can be validated can clinical indicators be used with complete confidence to compare outcomes within different units. An objective perinatal classif ication system is also required to ensure reliable standardisation of data and will also assist in validating and interpreting the data.20,83
By using a standard perinatal classif ication, the reasons for differences between different healthcare organisations in either sizes of groups, or events and outcomes within the groups, are limited to the following: f irst, data quality (either in definitions or in the accuracy of the data collection); second, signif icant differences in epidemiological variables and case-mix; and third, practice variation. The first two are prerequisites to considerations of practice variation. An additional advantage of using perinatal classif ications to interpret perinatal outcome data is that multiple perinatal outcomes can be interpreted together in specif ic groups of women, which is essential to better understand and judge the overall quality of care.Ultimately, quality of care is related to outcome and outcome will guide processes, but good quality, routinely collected, validated perinatal data will always be an important clinical indicator in its own right.
Dr Michael RobsonConsultant Obstetrician and Gynaecologist, The National Maternity Hospital, Dublin
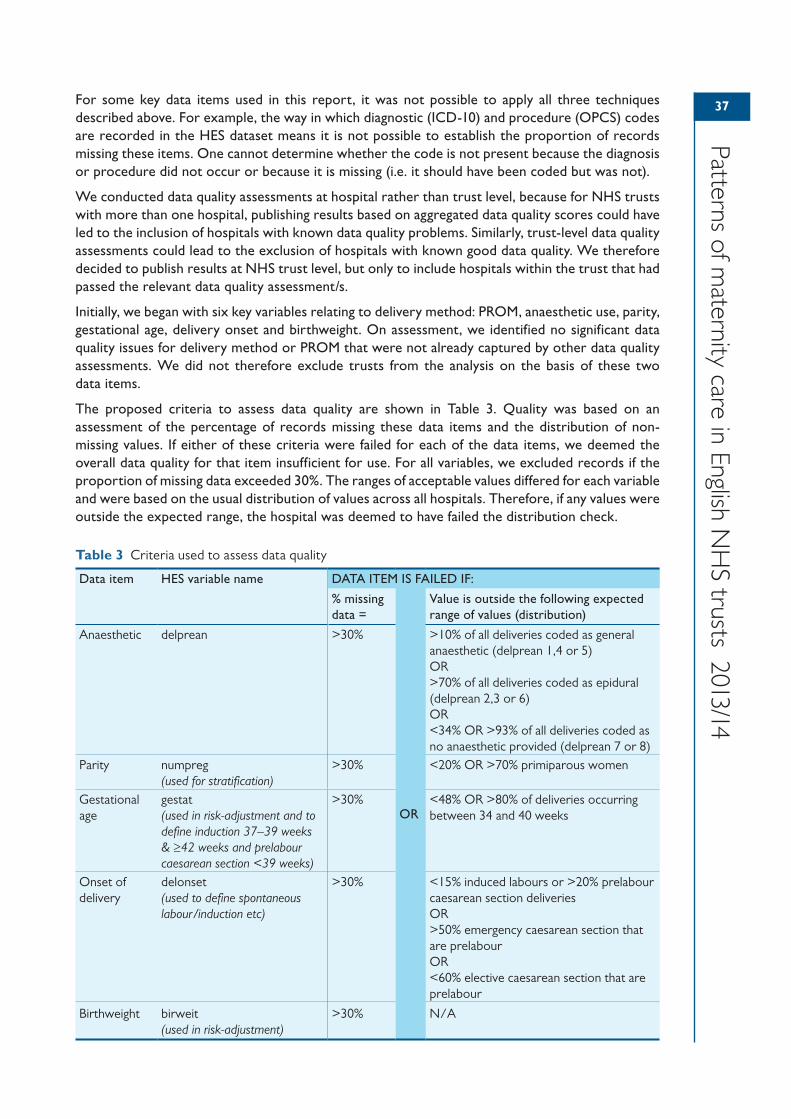
37
Patterns of maternity care in English N
HS trusts 2013/14
For some key data items used in this report, it was not possible to apply all three techniques described above. For example, the way in which diagnostic (ICD-10) and procedure (OPCS) codes are recorded in the HES dataset means it is not possible to establish the proportion of records missing these items. One cannot determine whether the code is not present because the diagnosis or procedure did not occur or because it is missing (i.e. it should have been coded but was not).
We conducted data quality assessments at hospital rather than trust level, because for NHS trusts with more than one hospital, publishing results based on aggregated data quality scores could have led to the inclusion of hospitals with known data quality problems. Similarly, trust-level data quality assessments could lead to the exclusion of hospitals with known good data quality. We therefore decided to publish results at NHS trust level, but only to include hospitals within the trust that had passed the relevant data quality assessment/s.
Initially, we began with six key variables relating to delivery method: PROM, anaesthetic use, parity, gestational age, delivery onset and birthweight. On assessment, we identified no significant data quality issues for delivery method or PROM that were not already captured by other data quality assessments. We did not therefore exclude trusts from the analysis on the basis of these two data items.
The proposed criteria to assess data quality are shown in Table 3. Quality was based on an assessment of the percentage of records missing these data items and the distribution of non-missing values. If either of these criteria were failed for each of the data items, we deemed the overall data quality for that item insufficient for use. For all variables, we excluded records if the proportion of missing data exceeded 30%. The ranges of acceptable values differed for each variable and were based on the usual distribution of values across all hospitals. Therefore, if any values were outside the expected range, the hospital was deemed to have failed the distribution check.
Table 3 Criteria used to assess data quality
Data item HES variable name DATA ITEM IS FAILED IF:
% missing data =
OR
Value is outside the following expected range of values (distribution)
Anaesthetic delprean >30% >10% of all deliveries coded as general anaesthetic (delprean 1,4 or 5)OR>70% of all deliveries coded as epidural (delprean 2,3 or 6)OR<34% OR >93% of all deliveries coded as no anaesthetic provided (delprean 7 or 8)
Parity numpreg(used for stratification)
>30% <20% OR >70% primiparous women
Gestational age
gestat(used in risk-adjustment and to define induction 37–39 weeks & ≥42 weeks and prelabour caesarean section <39 weeks)
>30% <48% OR >80% of deliveries occurring between 34 and 40 weeks
Onset of delivery
delonset(used to define spontaneous labour/induction etc)
>30% <15% induced labours or >20% prelabour caesarean section deliveriesOR>50% emergency caesarean section that are prelabourOR<60% elective caesarean section that are prelabour
Birthweight birweit(used in risk-adjustment)
>30% N/A
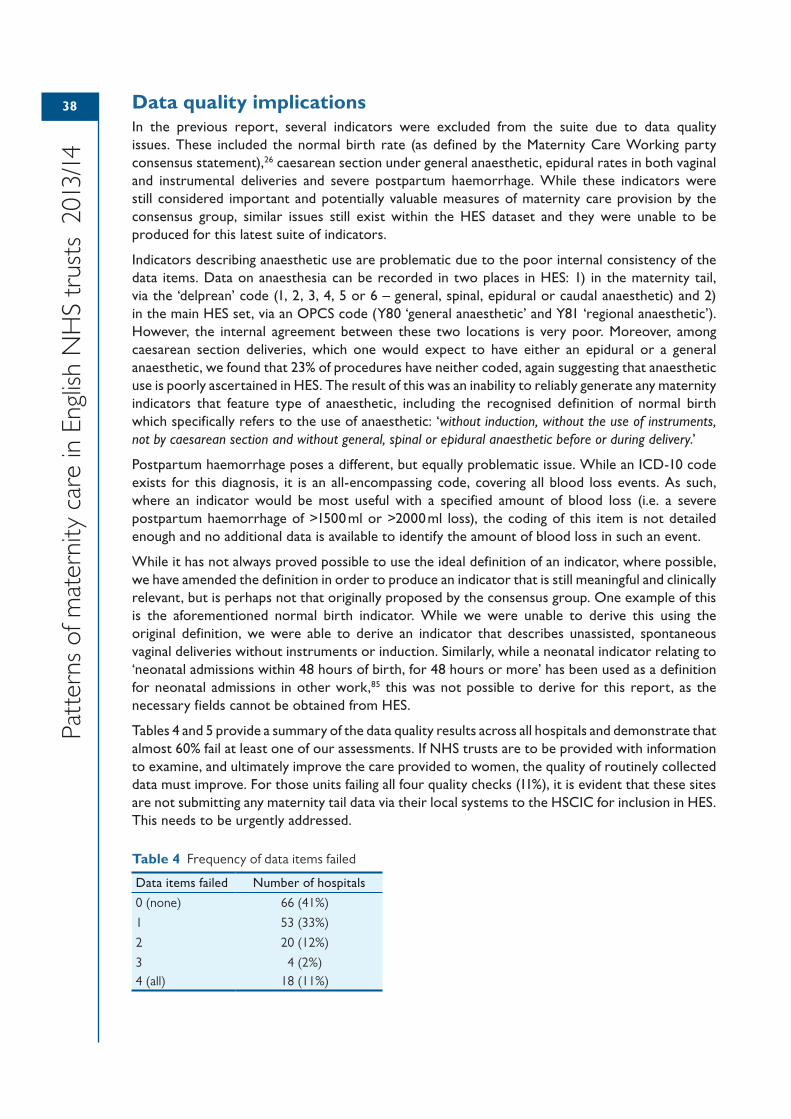
38
Patt
erns
of m
ater
nity
car
e in
Eng
lish
NH
S tr
usts
201
3/14
Data quality implicationsIn the previous report, several indicators were excluded from the suite due to data quality issues. These included the normal birth rate (as defined by the Maternity Care Working party consensus statement),26 caesarean section under general anaesthetic, epidural rates in both vaginal and instrumental deliveries and severe postpartum haemorrhage. While these indicators were still considered important and potentially valuable measures of maternity care provision by the consensus group, similar issues still exist within the HES dataset and they were unable to be produced for this latest suite of indicators.
Indicators describing anaesthetic use are problematic due to the poor internal consistency of the data items. Data on anaesthesia can be recorded in two places in HES: 1) in the maternity tail, via the ‘delprean’ code (1, 2, 3, 4, 5 or 6 – general, spinal, epidural or caudal anaesthetic) and 2) in the main HES set, via an OPCS code (Y80 ‘general anaesthetic’ and Y81 ‘regional anaesthetic’). However, the internal agreement between these two locations is very poor. Moreover, among caesarean section deliveries, which one would expect to have either an epidural or a general anaesthetic, we found that 23% of procedures have neither coded, again suggesting that anaesthetic use is poorly ascertained in HES. The result of this was an inability to reliably generate any maternity indicators that feature type of anaesthetic, including the recognised definition of normal birth which specifically refers to the use of anaesthetic: ‘without induction, without the use of instruments, not by caesarean section and without general, spinal or epidural anaesthetic before or during delivery.’
Postpartum haemorrhage poses a different, but equally problematic issue. While an ICD-10 code exists for this diagnosis, it is an all-encompassing code, covering all blood loss events. As such, where an indicator would be most useful with a specified amount of blood loss (i.e. a severe postpartum haemorrhage of >1500 ml or >2000 ml loss), the coding of this item is not detailed enough and no additional data is available to identify the amount of blood loss in such an event.
While it has not always proved possible to use the ideal definition of an indicator, where possible, we have amended the definition in order to produce an indicator that is still meaningful and clinically relevant, but is perhaps not that originally proposed by the consensus group. One example of this is the aforementioned normal birth indicator. While we were unable to derive this using the original definition, we were able to derive an indicator that describes unassisted, spontaneous vaginal deliveries without instruments or induction. Similarly, while a neonatal indicator relating to ‘neonatal admissions within 48 hours of birth, for 48 hours or more’ has been used as a definition for neonatal admissions in other work,85 this was not possible to derive for this report, as the necessary fields cannot be obtained from HES.
Tables 4 and 5 provide a summary of the data quality results across all hospitals and demonstrate that almost 60% fail at least one of our assessments. If NHS trusts are to be provided with information to examine, and ultimately improve the care provided to women, the quality of routinely collected data must improve. For those units failing all four quality checks (11%), it is evident that these sites are not submitting any maternity tail data via their local systems to the HSCIC for inclusion in HES. This needs to be urgently addressed.
Table 4 Frequency of data items failed
Data items failed Number of hospitals
0 (none) 66 (41%)
1 53 (33%)
2 20 (12%)
3 4 (2%)4 (all) 18 (11%)
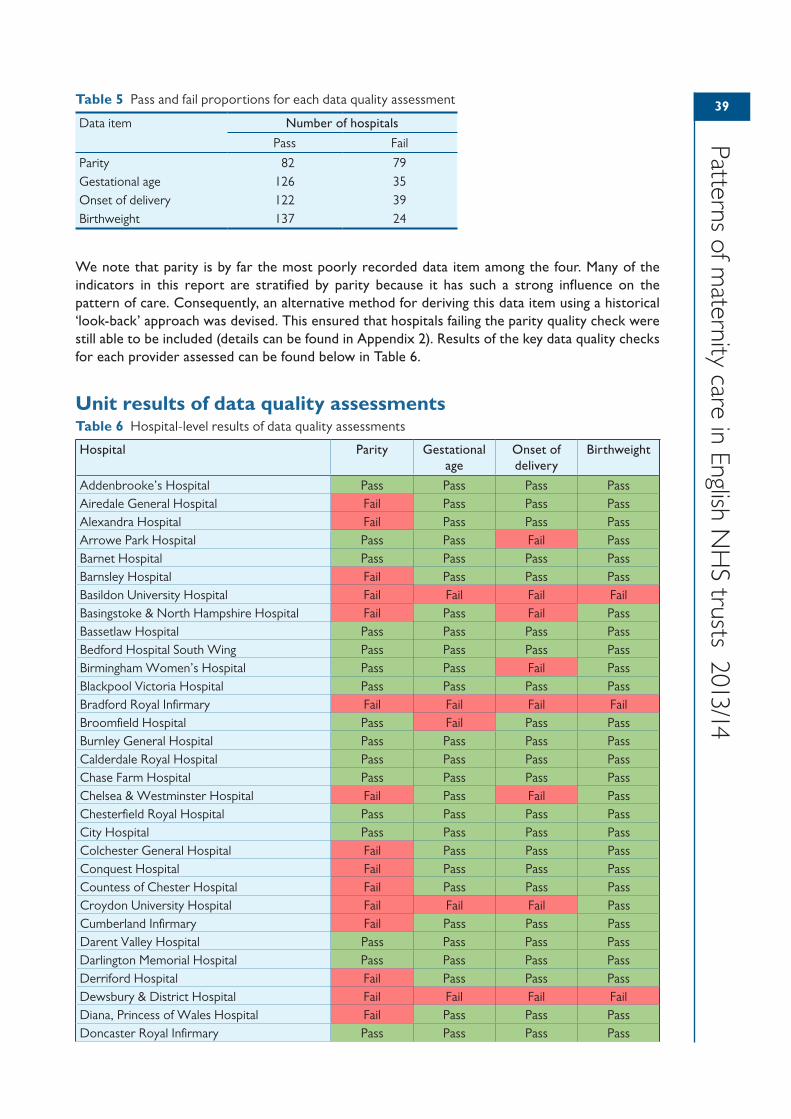
39
Patterns of maternity care in English N
HS trusts 2013/14
We note that parity is by far the most poorly recorded data item among the four. Many of the indicators in this report are stratified by parity because it has such a strong influence on the pattern of care. Consequently, an alternative method for deriving this data item using a historical ‘look-back’ approach was devised. This ensured that hospitals failing the parity quality check were still able to be included (details can be found in Appendix 2). Results of the key data quality checks for each provider assessed can be found below in Table 6.
Unit results of data quality assessmentsTable 6 Hospital-level results of data quality assessments
Hospital Parity Gestational age
Onset of delivery
Birthweight
Addenbrooke’s Hospital Pass Pass Pass PassAiredale General Hospital Fail Pass Pass PassAlexandra Hospital Fail Pass Pass PassArrowe Park Hospital Pass Pass Fail PassBarnet Hospital Pass Pass Pass PassBarnsley Hospital Fail Pass Pass PassBasildon University Hospital Fail Fail Fail FailBasingstoke & North Hampshire Hospital Fail Pass Fail PassBassetlaw Hospital Pass Pass Pass PassBedford Hospital South Wing Pass Pass Pass PassBirmingham Women’s Hospital Pass Pass Fail PassBlackpool Victoria Hospital Pass Pass Pass PassBradford Royal Infirmary Fail Fail Fail FailBroomfield Hospital Pass Fail Pass PassBurnley General Hospital Pass Pass Pass PassCalderdale Royal Hospital Pass Pass Pass PassChase Farm Hospital Pass Pass Pass PassChelsea & Westminster Hospital Fail Pass Fail PassChesterfield Royal Hospital Pass Pass Pass PassCity Hospital Pass Pass Pass PassColchester General Hospital Fail Pass Pass PassConquest Hospital Fail Pass Pass PassCountess of Chester Hospital Fail Pass Pass PassCroydon University Hospital Fail Fail Fail PassCumberland Infirmary Fail Pass Pass PassDarent Valley Hospital Pass Pass Pass PassDarlington Memorial Hospital Pass Pass Pass PassDerriford Hospital Fail Pass Pass PassDewsbury & District Hospital Fail Fail Fail FailDiana, Princess of Wales Hospital Fail Pass Pass PassDoncaster Royal Infirmary Pass Pass Pass Pass
Table 5 Pass and fail proportions for each data quality assessment
Data item Number of hospitals
Pass Fail
Parity 82 79Gestational age 126 35Onset of delivery 122 39Birthweight 137 24
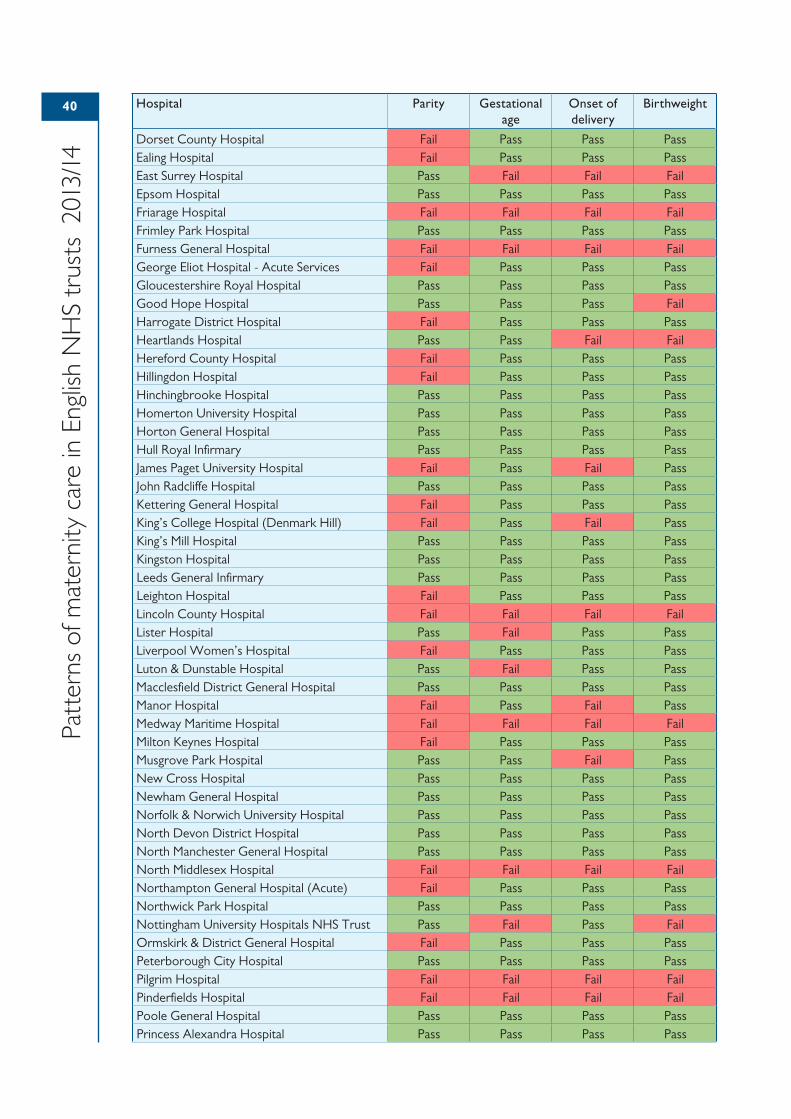
40
Patt
erns
of m
ater
nity
car
e in
Eng
lish
NH
S tr
usts
201
3/14
Hospital Parity Gestational age
Onset of delivery
Birthweight
Dorset County Hospital Fail Pass Pass PassEaling Hospital Fail Pass Pass PassEast Surrey Hospital Pass Fail Fail FailEpsom Hospital Pass Pass Pass PassFriarage Hospital Fail Fail Fail FailFrimley Park Hospital Pass Pass Pass PassFurness General Hospital Fail Fail Fail FailGeorge Eliot Hospital - Acute Services Fail Pass Pass PassGloucestershire Royal Hospital Pass Pass Pass PassGood Hope Hospital Pass Pass Pass FailHarrogate District Hospital Fail Pass Pass PassHeartlands Hospital Pass Pass Fail FailHereford County Hospital Fail Pass Pass PassHillingdon Hospital Fail Pass Pass PassHinchingbrooke Hospital Pass Pass Pass PassHomerton University Hospital Pass Pass Pass PassHorton General Hospital Pass Pass Pass PassHull Royal Infirmary Pass Pass Pass PassJames Paget University Hospital Fail Pass Fail PassJohn Radcliffe Hospital Pass Pass Pass PassKettering General Hospital Fail Pass Pass PassKing’s College Hospital (Denmark Hill) Fail Pass Fail PassKing’s Mill Hospital Pass Pass Pass PassKingston Hospital Pass Pass Pass PassLeeds General Infirmary Pass Pass Pass PassLeighton Hospital Fail Pass Pass PassLincoln County Hospital Fail Fail Fail FailLister Hospital Pass Fail Pass PassLiverpool Women’s Hospital Fail Pass Pass PassLuton & Dunstable Hospital Pass Fail Pass PassMacclesfield District General Hospital Pass Pass Pass PassManor Hospital Fail Pass Fail PassMedway Maritime Hospital Fail Fail Fail FailMilton Keynes Hospital Fail Pass Pass PassMusgrove Park Hospital Pass Pass Fail PassNew Cross Hospital Pass Pass Pass PassNewham General Hospital Pass Pass Pass PassNorfolk & Norwich University Hospital Pass Pass Pass PassNorth Devon District Hospital Pass Pass Pass PassNorth Manchester General Hospital Pass Pass Pass PassNorth Middlesex Hospital Fail Fail Fail FailNorthampton General Hospital (Acute) Fail Pass Pass PassNorthwick Park Hospital Pass Pass Pass PassNottingham University Hospitals NHS Trust Pass Fail Pass FailOrmskirk & District General Hospital Fail Pass Pass PassPeterborough City Hospital Pass Pass Pass PassPilgrim Hospital Fail Fail Fail FailPinderfields Hospital Fail Fail Fail FailPoole General Hospital Pass Pass Pass PassPrincess Alexandra Hospital Pass Pass Pass Pass
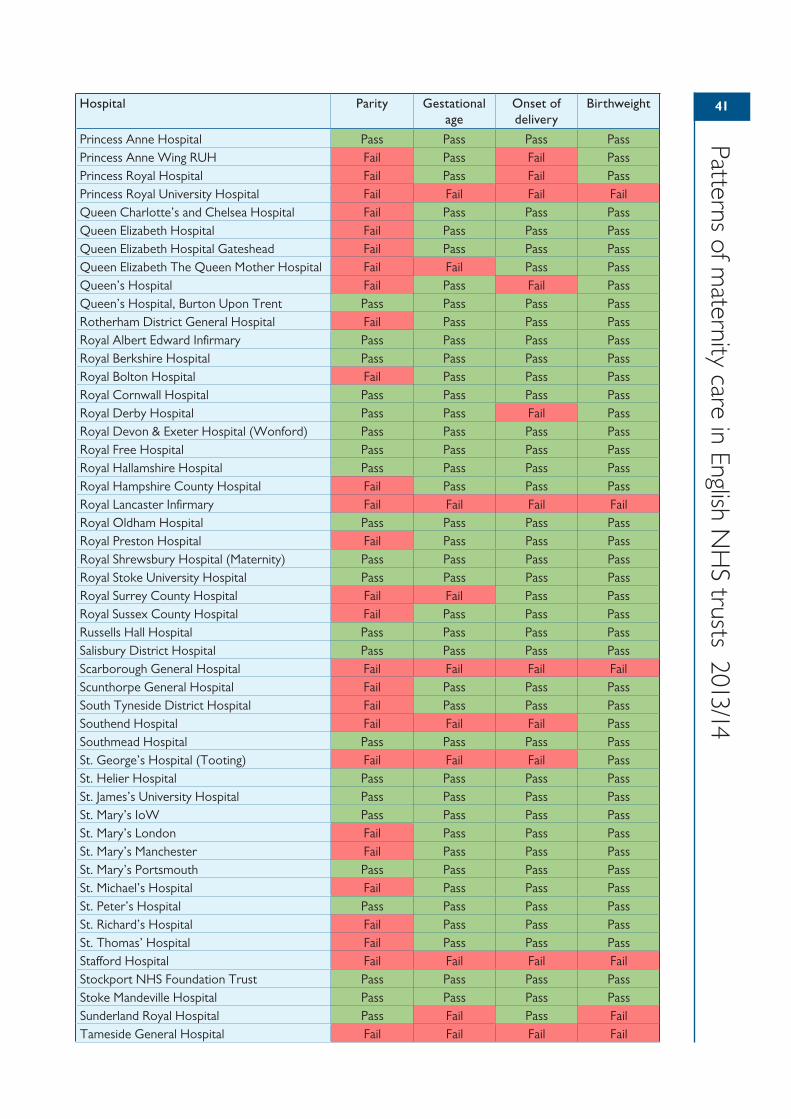
41
Patterns of maternity care in English N
HS trusts 2013/14
Hospital Parity Gestational age
Onset of delivery
Birthweight
Princess Anne Hospital Pass Pass Pass PassPrincess Anne Wing RUH Fail Pass Fail PassPrincess Royal Hospital Fail Pass Fail PassPrincess Royal University Hospital Fail Fail Fail FailQueen Charlotte’s and Chelsea Hospital Fail Pass Pass PassQueen Elizabeth Hospital Fail Pass Pass PassQueen Elizabeth Hospital Gateshead Fail Pass Pass PassQueen Elizabeth The Queen Mother Hospital Fail Fail Pass PassQueen’s Hospital Fail Pass Fail PassQueen’s Hospital, Burton Upon Trent Pass Pass Pass PassRotherham District General Hospital Fail Pass Pass PassRoyal Albert Edward Infirmary Pass Pass Pass PassRoyal Berkshire Hospital Pass Pass Pass PassRoyal Bolton Hospital Fail Pass Pass PassRoyal Cornwall Hospital Pass Pass Pass PassRoyal Derby Hospital Pass Pass Fail PassRoyal Devon & Exeter Hospital (Wonford) Pass Pass Pass PassRoyal Free Hospital Pass Pass Pass PassRoyal Hallamshire Hospital Pass Pass Pass PassRoyal Hampshire County Hospital Fail Pass Pass PassRoyal Lancaster Infirmary Fail Fail Fail FailRoyal Oldham Hospital Pass Pass Pass PassRoyal Preston Hospital Fail Pass Pass PassRoyal Shrewsbury Hospital (Maternity) Pass Pass Pass PassRoyal Stoke University Hospital Pass Pass Pass PassRoyal Surrey County Hospital Fail Fail Pass PassRoyal Sussex County Hospital Fail Pass Pass PassRussells Hall Hospital Pass Pass Pass PassSalisbury District Hospital Pass Pass Pass PassScarborough General Hospital Fail Fail Fail FailScunthorpe General Hospital Fail Pass Pass PassSouth Tyneside District Hospital Fail Pass Pass PassSouthend Hospital Fail Fail Fail PassSouthmead Hospital Pass Pass Pass PassSt. George’s Hospital (Tooting) Fail Fail Fail PassSt. Helier Hospital Pass Pass Pass PassSt. James’s University Hospital Pass Pass Pass PassSt. Mary’s IoW Pass Pass Pass PassSt. Mary’s London Fail Pass Pass PassSt. Mary’s Manchester Fail Pass Pass PassSt. Mary’s Portsmouth Pass Pass Pass PassSt. Michael’s Hospital Fail Pass Pass PassSt. Peter’s Hospital Pass Pass Pass PassSt. Richard’s Hospital Fail Pass Pass PassSt. Thomas’ Hospital Fail Pass Pass PassStafford Hospital Fail Fail Fail FailStockport NHS Foundation Trust Pass Pass Pass PassStoke Mandeville Hospital Pass Pass Pass PassSunderland Royal Hospital Pass Fail Pass FailTameside General Hospital Fail Fail Fail Fail
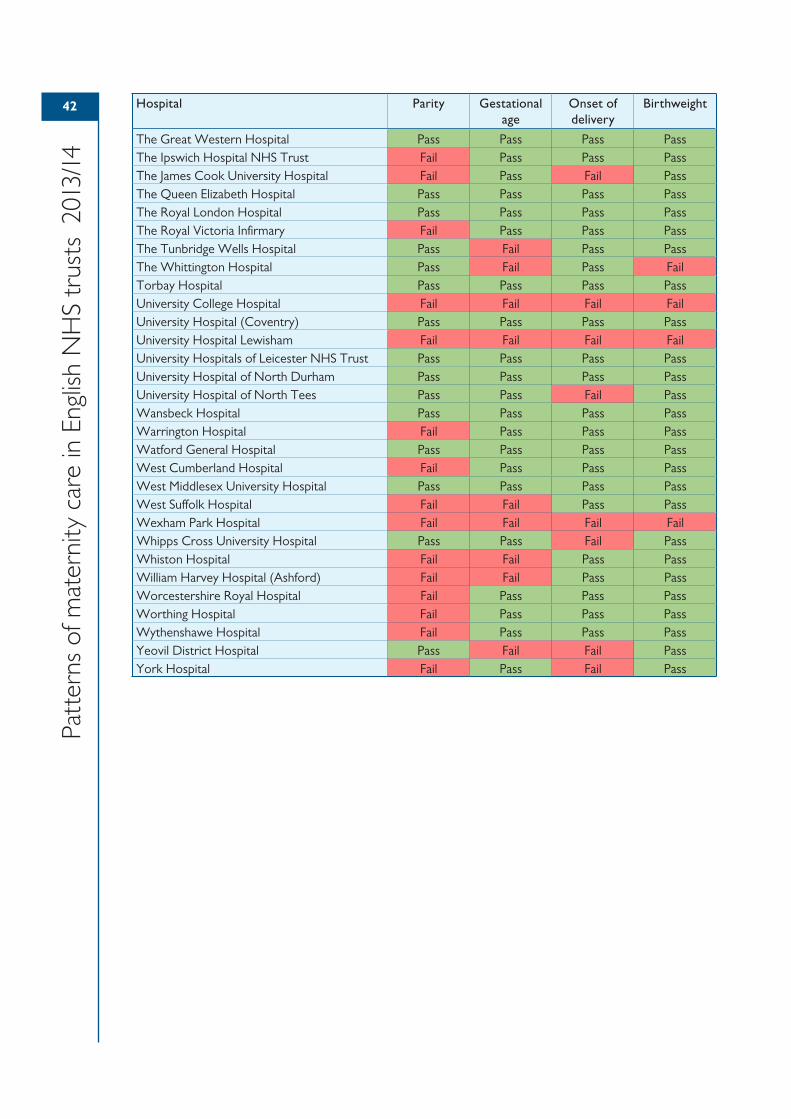
42
Patt
erns
of m
ater
nity
car
e in
Eng
lish
NH
S tr
usts
201
3/14
Hospital Parity Gestational age
Onset of delivery
Birthweight
The Great Western Hospital Pass Pass Pass PassThe Ipswich Hospital NHS Trust Fail Pass Pass PassThe James Cook University Hospital Fail Pass Fail PassThe Queen Elizabeth Hospital Pass Pass Pass PassThe Royal London Hospital Pass Pass Pass PassThe Royal Victoria Infirmary Fail Pass Pass PassThe Tunbridge Wells Hospital Pass Fail Pass PassThe Whittington Hospital Pass Fail Pass FailTorbay Hospital Pass Pass Pass PassUniversity College Hospital Fail Fail Fail FailUniversity Hospital (Coventry) Pass Pass Pass PassUniversity Hospital Lewisham Fail Fail Fail FailUniversity Hospitals of Leicester NHS Trust Pass Pass Pass PassUniversity Hospital of North Durham Pass Pass Pass PassUniversity Hospital of North Tees Pass Pass Fail PassWansbeck Hospital Pass Pass Pass PassWarrington Hospital Fail Pass Pass PassWatford General Hospital Pass Pass Pass PassWest Cumberland Hospital Fail Pass Pass PassWest Middlesex University Hospital Pass Pass Pass PassWest Suffolk Hospital Fail Fail Pass PassWexham Park Hospital Fail Fail Fail FailWhipps Cross University Hospital Pass Pass Fail PassWhiston Hospital Fail Fail Pass PassWilliam Harvey Hospital (Ashford) Fail Fail Pass PassWorcestershire Royal Hospital Fail Pass Pass PassWorthing Hospital Fail Pass Pass PassWythenshawe Hospital Fail Pass Pass PassYeovil District Hospital Pass Fail Fail PassYork Hospital Fail Pass Fail Pass
43435 Key recommendations
For NHS trusts• NHS maternity services should examine the trust-level figures that have been published
online (https://indicators.rcog.org.uk/). These indicators should be used as a basis for reflection on current practice and the causes of local variation. The results could be used to identify ‘peer’ units for comparison.
• Maternity services should aim to enter complete data into the HES maternity tail. Units should also ensure standard coding definitions are followed to improve consistency, such as the distinction between induction and augmentation. Clinicians must take ownership of their own data in order to drive up quality.
For commissioners• Local commissioners and clinicians in consultation with patient groups should review the areas
of maternity care described in this report and agree what steps will be taken to improve local outcomes.
For researchers• Research is required to clarify ‘acceptable ranges’ of performance for intrapartum care
processes and outcomes.
• There is a need for improved understanding of the relationships between different process and outcome indicators.
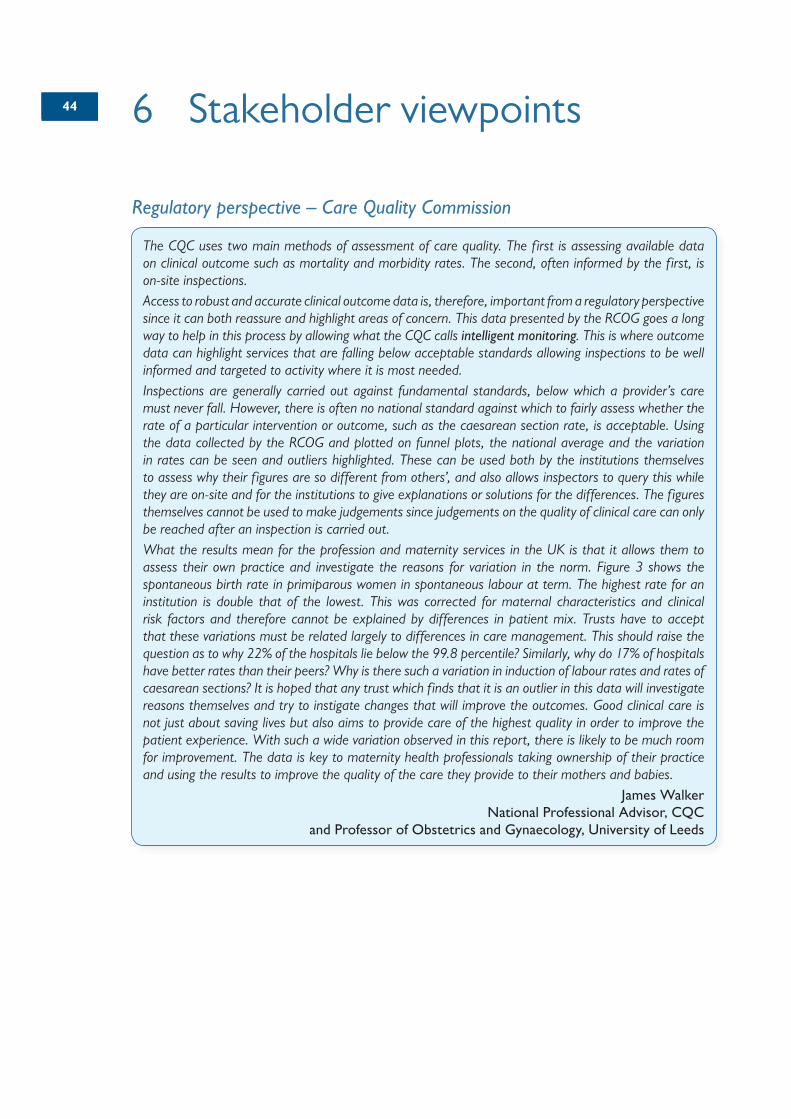
4444 6 Stakeholder viewpoints
Regulatory perspective – Care Quality Commission
The CQC uses two main methods of assessment of care quality. The first is assessing available data on clinical outcome such as mortality and morbidity rates. The second, often informed by the f irst, is on-site inspections.Access to robust and accurate clinical outcome data is, therefore, important from a regulatory perspective since it can both reassure and highlight areas of concern. This data presented by the RCOG goes a long way to help in this process by allowing what the CQC calls intelligent monitoring. This is where outcome data can highlight services that are falling below acceptable standards allowing inspections to be well informed and targeted to activity where it is most needed.Inspections are generally carried out against fundamental standards, below which a provider’s care must never fall. However, there is often no national standard against which to fairly assess whether the rate of a particular intervention or outcome, such as the caesarean section rate, is acceptable. Using the data collected by the RCOG and plotted on funnel plots, the national average and the variation in rates can be seen and outliers highlighted. These can be used both by the institutions themselves to assess why their f igures are so different from others’, and also allows inspectors to query this while they are on-site and for the institutions to give explanations or solutions for the differences. The figures themselves cannot be used to make judgements since judgements on the quality of clinical care can only be reached after an inspection is carried out.What the results mean for the profession and maternity services in the UK is that it allows them to assess their own practice and investigate the reasons for variation in the norm. Figure 3 shows the spontaneous birth rate in primiparous women in spontaneous labour at term. The highest rate for an institution is double that of the lowest. This was corrected for maternal characteristics and clinical risk factors and therefore cannot be explained by differences in patient mix. Trusts have to accept that these variations must be related largely to differences in care management. This should raise the question as to why 22% of the hospitals lie below the 99.8 percentile? Similarly, why do 17% of hospitals have better rates than their peers? Why is there such a variation in induction of labour rates and rates of caesarean sections? It is hoped that any trust which f inds that it is an outlier in this data will investigate reasons themselves and try to instigate changes that will improve the outcomes. Good clinical care is not just about saving lives but also aims to provide care of the highest quality in order to improve the patient experience. With such a wide variation observed in this report, there is likely to be much room for improvement. The data is key to maternity health professionals taking ownership of their practice and using the results to improve the quality of the care they provide to their mothers and babies.
James WalkerNational Professional Advisor, CQC
and Professor of Obstetrics and Gynaecology, University of Leeds
45
Patterns of maternity care in English N
HS trusts 2013/14
A maternity service-user’s perspective
Being an expectant mother for the f irst time was an equally exciting and frightening period for me. It was awe-inspiring to see my body making life but at the same time I was acutely aware I was embarking into the unknowns of pregnancy and labour, where anything could happen. I chose to give birth at a hospital as for me this was the place I felt the safest.Like many expectant mothers I started looking for information on anything that could help me prepare for labour, in addition to the advice I received from the midwives and doctors. Understanding the type of care I was likely to receive was on top of the list of things in my mind. How likely was I to be induced, or end up with a perineal tear, or have a caesarean at a particular hospital versus another? Would they allow me to move during labour or involve me in any decision making, and myriad other questions. I came across websites like ‘Which? Birth Choice’ and ‘NHS Choices’ that addressed some of these questions but I was disappointed at the lack of clarity. I felt there was missing detail and I was none the wiser. At the end of my research, it seemed I didn’t know much about the performance of the maternity unit I would give birth in.A few months later I was delighted to see RCOG’s report on Patterns of maternity care in English NHS hospitals, as it meant that expectant mothers in the future will have more information than I did. The report contains measurements that are important indicators for the performance of maternity units (such as percentages of possible types of deliveries, e.g. assisted, caesarean sections or natural, percentages of labour-related injuries, etc.) and they begin to paint a picture of the maternity services in England. The picture is complicated as services seem to differ a lot from place to place. This could be due to different clinical practices, different patient populations but perhaps most importantly due to incomplete data.Eventually one could envisage the use of such information to help regulate and equalise maternity services across the country and possibly create a ‘gold standard’ of clinical practice. Also one could imagine expectant mothers using such information to choose the place of birth that best suits their needs. But before any of that could happen, this report showcases the urgent need for consistent and complete data gathering across maternity units. The picture may still be muddled somewhat but it is the f irst and most important step towards better maternity services within the NHS.
Anastasia LiapiWomen’s Voices Involvement Panel and consensus group member, RCOG
46
Patt
erns
of m
ater
nity
car
e in
Eng
lish
NH
S tr
usts
201
3/14
A local commissioning perspective – Clinical Commissioning Group
Two years ago commissioners, providers and clinicians in Cheshire and Merseyside began a debate about improving outcomes and reducing variation in maternity services across our sub-region. The catalyst for this was the evidence presented in the f irst report on Patterns of maternity care in English NHS hospitals by the Royal College of Obstetricians and Gynaecologists (RCOG). We were guided in interrogating this data by Dr David Richmond, the current President of the RCOG and a local clinician, and by David Rowlands, who works locally as a Consultant Obstetrician and Gynaecologist and also for the Cheshire and Merseyside Strategic Clinical Network. We noted that there was variation in the experience of people who use maternity services in regard to clinical outcomes, safety and quality, and collectively resolved to do something about it. We gained agreement with our local providers of maternity services that they would waive the anonymity that the f irst report afforded them, on the basis that we wanted to work collaboratively to resolve a commonly shared set of challenges.The first report on Patterns of maternity care in English NHS hospitals set off a series of events in our area that has led to commissioners, providers and clinicians coming together to explore how we can develop a high-quality, clinically and financially sustainable whole system model of care for women’s and children’s services including maternity, neonatal and paediatric services. At the time of writing, we are currently establishing a Cheshire and Merseyside Women’s and Children’s Services Partnership as a Vanguard site under the NHS’s New Models of Care programme, established after the publication of the Five Year Forward View. The publication of the second report therefore comes at a good time for us; it will enable us to revisit the standardised quality dashboard that has been produced, based on the RCOG report, that we will expect all providers of maternity services in Cheshire and Merseyside to use. The quality dashboard is also an assurance tool for commissioners and clinicians, enabling us to ask the right questions about maternity services and collectively seek improvement.The second report on Patterns of maternity care in English NHS trusts presents commissioners, providers and clinicians with probably the best and most reliable evidence base on clinical outcomes in maternity care. This report needs to be used by us all to create constructive conversations about reducing variation and improving outcomes in maternity services. The report should be a starting point for further enquiry by commissioners, providers and clinicians about why different outcomes exist across maternity services; how these outcomes can be improved without regression to the mean; and how, through collaboration, cooperation and coproduction, we can deliver better outcomes, better services for our populations. There are many drivers for change in maternity services and a signif icant and growing evidence base to support a need for change. This report will add to that evidence.
Simon BanksChief Officer, NHS Halton Clinical Commissioning Group
47
Patterns of maternity care in English N
HS trusts 2013/14
A national commissioning perspective – NHS England
‘In God we trust, all others must bring data.’ This quotation is attributed to William Deming who was the inspiration for the Japanese post-war economic transformation. Deming’s work has since been successfully applied to outcome improvement in healthcare most notably by Virginia Mason Hospital. With this publication, the RCOG have brought us important data which shine a spotlight on our maternity services and by controlling for some relevant demographic variables, this report helps us identify where unwarranted variation exists. Clinicians will rightly feel proud where their trust has performed well and will want to understand the reasons for any poor outcomes. These responses are an opportunity to galvanise support for departmental improvement initiatives. The temptation when reading and interpreting these data is to only look at one’s own institution. We should however aim to derive learning nationally from good and bad outcomes. The Kirkup Report illustrates how easy it is for maternity units to work in silos and fail to recognise where variation in outcomes are unwarranted, and the CQC reports show that very few maternity services are universally excellent in everything they do. It is therefore important that we develop a culture of peer unit support through networks where we can share best practice and help units address areas where improvement is required. It is also important that we look beyond our hospitals to understand how the maternity health system functions, and work with commissioners and arms-length bodies such as Public Health England and Health Education England to drive continual improvement. I would therefore urge obstetricians to engage with the work of networks in interpreting these data and use their knowledge, leadership skills and expertise to collaborate with other stakeholders regionally to help address unwarranted variation and drive continuous improvement.
Matthew JollyNational Clinical Director for The Maternity Review and Women’s Health, NHS England
48
Patt
erns
of m
ater
nity
car
e in
Eng
lish
NH
S tr
usts
201
3/14
A midwifery perspective
The Royal College of Midwives welcomes this second iteration looking at the variation in maternity clinical indicators. Each provider will now have two sets of data to view as they seek to improve the care provided for all women and to refine clinical decision making and services. By their very nature, most of these data relate to the use of biomedical interventions and outcomes in maternity care, but that should not reduce the signif icance or importance for midwives. These clinical indicators relating to their own trust will build a more comprehensive picture as midwives continue to provide holistic care and shape multi-disciplinary discussions on local delivery of maternity services. This in turn will enable discussions with women and their families and support informed choice.Two areas of particular relevance for midwives are the rates of spontaneous vaginal births (given the definition followed), and unplanned maternal readmission after birth. Are there questions that need to be asked and do these relate to women’s preparation for labour and birth and to the extent of midwifery support that they receive throughout labour and postnatal care? The level and variation of unplanned maternal readmission following vaginal births, highlighted through this analysis, continues to reaffirm the RCM’s concerns at planning and provision of postnatal care. Models of care with robust community midwifery play a major role in reducing negative outcomes. As we progress in our understanding of variation across trusts, it is important to review this information in the light of changes to models of care and local policies and ensure that the highest standards are being met while changes are pursued.We hope that the introduction of the national maternity services data set will lead to greater provision of quality data, which eventually will include other indicators that impact on women’s care. The RCM would like revisions to the data set (when they occur) to provide information enabling a repeat of some of the work in the birth place project, so that outcomes by place of f irst care for the woman when in labour can be reassessed. It is important that this and other sets of clinical indicators promote discussion and are read with caution for trusts who fall above or below the outer funnel, as well as those closer to the English average. Any discussion on the positioning in outcomes for individual maternity services must take place on a multi-disciplinary basis and recognise the unique importance of effective team working in the provision of safe and quality care.
Mervi JokinenPractice and Standards Development Advisor, Royal College of Midwives
Louise SilvertonDirector for Midwifery, Royal College of Midwives
49
Patterns of maternity care in English N
HS trusts 2013/14
An international perspective
Obstetric care deals with one of the most important events in human life, the start of new life. Both in our individual lives, from a perspective of equity as well as from a societal perspective a healthy start for each new human is crucial. Assessment of the quality of obstetric care is therefore an obvious necessity, but surprisingly such practice has not been routine in perinatal health systems. With the presentation of the second report on clinical indicators, the RCOG should be congratulated on an initiative that, together with Scandinavian countries and The Netherlands, is leading in the world.In obstetrics, effectiveness of our tests and treatments is largely unknown. Undeniably, enormous progress has been made since Archie Cochrane in 1979 famously awarded our specialty of obstetrics the wooden spoon for being the least evidence based medical specialty. In obstetrics, bad outcomes are rare, while interventions, even if they are unnecessary, can be perceived as invaluable acts of heroism both by the care-receivers and the care-givers.Objective assessment of the quality of obstetric care in a larger setting is therefore a necessity, and one way of dealing with that is to benchmark ourselves as compared to our colleagues. The set of indicators reported here can help us to improve clinical care. The proportion of episiotomy procedures in women having instrumental deliveries, for example, is above 90% in the majority of the trusts, and this is in line with current evidence. On the other hand, the percentage of prelabour caesarean sections performed before 39 weeks of gestation, (which we know increases the risk of neonatal morbidity and mortality) is at almost 25% - disturbingly high, with a considerable number of trusts touching over 30%. This might be a topic to address, for example by analysing which factors contribute to this pattern, and how we can improve on this.The clinical indicators also allow a comparison with published literature. We should not forget that benchmarking alongside our peers in itself is not enough, and that we should compare ourselves to published literature. For example, the percentage of caesarean sections among induced labours here is reported as 29.9% for nulliparous women and 12.6% for multiparous, while in a meta-analysis reporting on randomised clinical trials assessing induction of labour, this rate was 15%,37 thus allowing further benchmark. Apart from the RCOG initiative on quality management through clinical indicators, the UK should also be commended for their leading role in clinical trials.Similar initiatives are in place in Australia, but are less well developed. While the annual report of the National Perinatal Epidemiology and Statistics Unit at the University of New South Wales does report general metrics on perinatal outcomes, practice variation is not reported publically on a named basis. International variation in, for example, caesarean section rates is considerable and driven by factors including cultural differences, differences in models of care and litigation. These are likely greater influences on variation than ethnicity and other biological issues. A next step is to explore such differences through international benchmarking.
Ben Willem MolProfessor of Obstetrics and Gynaecology, The Robinson Research Institute, School of
Paediatrics and Reproductive Health, University of Adelaide, Australia
50
Patt
erns
of m
ater
nity
car
e in
Eng
lish
NH
S tr
usts
201
3/14
A methodological perspective
In response to comment and discussion following publication of the f irst report, in this, the second report of Patterns of maternity care in English NHS trusts, the clinical indicators team have modif ied some of the original indicators, expanded the number of indicators reported and also focused on data quality by implementing more exacting data quality requirements and publishing the hospital-level results of their data quality assessment. Their continuing emphasis on providing national analysis to support maternity service quality improvement along with these new developments in reporting is to be welcomed.It is evident from the findings, particularly of the expanded data quality assessment, that alongside using the indicator f indings to support service quality improvements trusts must also pay attention to the quality of data they submit to the Hospital Episode Statistics (HES) system and the new national Maternity Services Data Set (MSDS) which is now on stream. The fact that only 41% of all maternity hospitals in England reported data of suff icient quality to HES, on all four of the most basic descriptors of a pregnant woman and her birth outcome (i.e. parity, onset of delivery, gestational age at delivery and birthweight), is of considerable concern.With regard to the variations in the indicators reported, there are four possible explanations for the f indings. The first is that the differences are not real but due to data errors. The remaining three assume that there are no data errors but that the variations seen are real and due to: chance, confounding by case-mix differences or variations in clinical practice between trusts. In an ideal world, only once the f irst three explanations are adequately dealt with can we assume that any remaining variation is due to differences in clinical practice. Unfortunately back in the real world it is likely that we are dealing with all four explanations to some degree simultaneously, but this should not stop actions resulting as a consequence of the f indings.The analysts have addressed the issue of chance by providing control limits in their funnel plots. They have adjusted for those elements of case-mix (demographic and clinical risk factors) for which they have data. However, given the quality of other aspects of the HES data, the quality of the clinical risk factor data is of concern and a further limitation is the number of clinical risk factors for which data are collected in HES.The indicators team have assessed the extent of data errors as far as they are able with the data available to them by using robust methods of assessing data quality. However, only trusts themselves can undertake the coal-face validation of their HES returns by undertaking quality checks of their own internal electronic data against the information contained in individual clinical notes. It is to be hoped that the naming of individual hospitals will prompt this examination alongside close scrutiny of the actual indicator f indings in the published trust-level indicator data. The focus of trust activities should not be solely on examining data quality but this must form part of the response of individual trusts to their results in this report and the trust-level indicator data available online.This second report of Patterns of maternity care shines a spotlight on aspects of care which need to be addressed to improve the services provided to women and their babies and also to improve the quality of maternity services data.
Jenny KurinczukProfessor of Perinatal Epidemiology and Director, National Perinatal Epidemiology Unit,
University of Oxford
Marian KnightNIHR Professor of Maternal and Child Population Health, National Perinatal Epidemiology
Unit, University of Oxford
5151References
1. Berwick DM. Controlling variation in health care: a consultation from Walter Shewhart. Med Care 1991;29(12):1212–25.
2. RCOG. Patterns of Maternity Care in English NHS Hospitals. London: RCOG, 2013.3. NHS England, Care Quality Commission, Public Health England, et al. NHS Five Year Forward
View, 2014.4. Office for National Statistics. Characteristics of Birth 2, England and Wales, Table 7, 2013.5. Knight M, Tuffnell D, Kenyon S, et al. Saving Lives, Improving Mothers’ Care - Surveillance of
maternal deaths in the UK 2011–13 and lessons learned to inform maternity care from the UK and Ireland Confidential Enquiries into Maternal Deaths and Morbidity 2009–13. Oxford: National Perinatal Epidemiology Unit, University of Oxford, 2015.
6. Manktelow BM, Smith LK, Evans TA, et al. Perinatal Mortality Surveillance Report: UK Perinatal Deaths for births from January to December 2013. Leicester: The Infant Mortality and Morbidity Group, Department of Health Sciences, University of Leicester, 2015.
7. Boseley S. Call to review baby death rates at more than 20 NHS trusts and boards. The Guardian, 2015, 16th December.
8. Public Health England, NHS England, RightCare. The NHS Atlas of Variation in Healthcare: reducing unwarranted variation to increase value and improve quality. London: Public Health England, 2015.
9. Care Quality Commission. Maternity Services Survey 2015. http://www.cqc.org.uk/content/maternity-services-survey-2015.
10. Office for National Statistics. Characteristics of Mother 1, England and Wales, 2013. http://www.ons.gov.uk/ons/rel/vsob1/characteristics-of-Mother-1--england-and-wales/2013/index.html.
11. Office for National Statistics. Characteristics of Mother 2, England and Wales, 2013. http://www.ons.gov.uk/ons/rel/vsob1/characteristics-of-mother-2--england-and-wales/2013/index.html.
12. Public Health England. http://www.noo.org.uk/NOO_about_obesity/maternal_obesity.13. Kirkup B. The Report of the Morecambe Bay Investigation: an independent investigation into the
management, delivery and outcomes of care provided by the maternity and neonatal services at the University Hospitals of Morecambe Bay NHS Foundation Trust from January 2004 to June 2013. 2015.
14. World Health Organization. International Classification of Diseases, 10th edition (ICD-10). http://apps.who.int/classifications/icd10/browse/2016/en.
15. Office of Population, Censuses and Surveys. Classification of Surgical Operations and Procedures, 4th revision (OPCS). http://systems.hscic.gov.uk/data/clinicalcoding/codingstandards/opcs4.
16. Health and Social Care Information Centre. Maternity Services Dataset. http://www.hscic.gov.uk/maternityandchildren/maternity.
17. Healthcare Quality Improvement Partnership. Tender for National Maternity and Perinatal Clinical Audit. http://www.hqip.org.uk/news-events/news/tender-for-national-maternity-and-perinatal-clinical-audit/.
18. Robson MS, Scudamore IW, Walsh SM. Using the medical audit cycle to reduce cesarean section rates. Am J Obstet Gynecol 1996;174(1 Pt 1):199–205.
19. Main EK. Reducing cesarean birth rates with data-driven quality improvement activities. Pediatrics 1999;103(1 Suppl E):374–83.
20. Robson M. The Ten Group Classification System (TGCS) - a common starting point for more detailed analysis. BJOG 2015;122(5):701.
52
Patt
erns
of m
ater
nity
car
e in
Eng
lish
NH
S tr
usts
201
3/14
21. RCM. Trends in Freestanding Midwife-led Units in England and Wales 2001–2013. London: Royal College of Midwives, 2013.
22. NHS Organisation Data Service. http://systems.hscic.gov.uk/data/ods.23. Department of Health. English Indices of Deprivation. https://www.gov.uk/government/
collections/english-indices-of-deprivation.24. Spiegelhalter DJ. Funnel plots for comparing institutional performance. Stat Med
2005;24(8):1185–202.25. Spiegelhalter DJ. Handling over-dispersion of performance indicators. Qual Saf Health Care
2005;14(5):347–51.26. RCM, RCOG, NCT. Making Normal Birth a Reality. Consensus statement from the Maternity
Care Working Party: our shared views about the need to recognise, facilitate and audit normal birth, 2007.
27. Dodwell M. Normal birth rates for England. Perspective - NCT’s Journal on Preparing Parents for Birth and Early Parenthood 2012(16):16–17.
28. Sandall J, Murrells T, Dodwell M, et al. The Efficient Use of the Maternity Workforce and the Implications for Safety and Quality in Maternity Care: a population-based, cross-sectional study. Southampton (UK), 2014.
29. Dodwell M, Newburn M. Normal Birth as a Measure of the Quality of Care: evidence on safety, effectiveness and women’s experiences. London: NCT, 2010.
30. Birthplace in England Collaborative Group, Brocklehurst P, Hardy P, et al. Perinatal and maternal outcomes by planned place of birth for healthy women with low risk pregnancies: the Birthplace in England national prospective cohort study. BMJ 2011;343:d7400.
31. NICE. CG70: Inducing Labour (2008). http://www.nice.org.uk/guidance/cg70.32. Health and Social Care Information Centre. NHS Maternity Statistics - England, 2013–14.
http://www.hscic.gov.uk/catalogue/PUB16725.33. ISD Scotland. Births in Scottish Hospitals (Year ending 31st March 2015). 2015.34. Nippita TA, Trevena JA, Patterson JA, et al. Variation in hospital rates of induction of labour:
a population-based record linkage study. BMJ Open 2015;5(9):e008755.35. Martin JA, Hamilton BE, Osterman MJK, et al. National Vital Statistics Reports (vol. 64). Births:
Final Data for 2013. http://www.cdc.gov/nchs/data/nvsr/nvsr64/nvsr64_01.pdf.36. Glantz JC. Rates of labor induction and primary cesarean delivery do not correlate with rates
of adverse neonatal outcome in level I hospitals. J Matern Fetal Neonatal Med 2011;24(4):636–42.37. Mishanina E, Rogozinska E, Thatthi T, et al. Use of labour induction and risk of cesarean
delivery: a systematic review and meta-analysis. CMAJ 2014;186(9):665–73.38. Wood S, Cooper S, Ross S. Does induction of labour increase the risk of caesarean section?
A systematic review and meta-analysis of trials in women with intact membranes. BJOG 2014;121(6):674–85; discussion 85.
39. Darney BG, Snowden JM, Cheng YW, et al. Elective induction of labor at term compared with expectant management: maternal and neonatal outcomes. Obstet Gynecol 2013;122(4):761–9.
40. Cheng YW, Sparks TN, Laros RK, Jr., et al. Impending macrosomia: will induction of labour modify the risk of caesarean delivery? BJOG 2012;119(4):402–9.
41. Stock SJ, Ferguson E, Duffy A, et al. Outcomes of elective induction of labour compared with expectant management: population based study. BMJ 2012;344:e2838.
42. Gulmezoglu AM, Crowther CA, Middleton P, et al. Induction of labour for improving birth outcomes for women at or beyond term. Cochrane Database Syst Rev 2012;6:CD004945.
43. Allen VM, O’Connell CM, Farrell SA, et al. Economic implications of method of delivery. Am J Obstet Gynecol 2005;193(1):192–7.
44. Perinatal Institute. Growth Assessment Protocol (GAP). https://www.perinatal.org.uk/GAP/.
53
Patterns of maternity care in English N
HS trusts 2013/14
45. Vogel JP, Betran AP, Vindevoghel N, et al. Use of the Robson classification to assess caesarean section trends in 21 countries: a secondary analysis of two WHO multicountry surveys. Lancet Glob Health 2015;3(5):e260–70.
46. Feng XL, Xu L, Guo Y, et al. Factors influencing rising caesarean section rates in China between 1988 and 2008. Bull World Health Organ 2012;90(1):30–9, 39A.
47. Lavender T, Hofmeyr GJ, Neilson JP, et al. Caesarean section for non-medical reasons at term. Cochrane Database Syst Rev 2012;3:CD004660.
48. Bragg F, Cromwell DA, Edozien LC, et al. Variation in rates of caesarean section among English NHS trusts after accounting for maternal and clinical risk: cross sectional study. BMJ 2010;341:c5065.
49. Deneux-Tharaux C, Carmona E, Bouvier-Colle MH, et al. Postpartum maternal mortality and cesarean delivery. Obstet Gynecol 2006;108(3 Pt 1):541–8.
50. Landon MB, Hauth JC, Leveno KJ, et al. Maternal and perinatal outcomes associated with a trial of labor after prior cesarean delivery. N Engl J Med 2004;351(25):2581–9.
51. Yang Q, Wen SW, Oppenheimer L, et al. Association of caesarean delivery for first birth with placenta praevia and placental abruption in second pregnancy. BJOG 2007;114(5):609–13.
52. Villar J, Valladares E, Wojdyla D, et al. Caesarean delivery rates and pregnancy outcomes: the 2005 WHO global survey on maternal and perinatal health in Latin America. Lancet 2006;367(9525):1819–29.
53. Churchill H, Savage W, Francome C. Caesarean birth in Britain. 2nd ed. Middlesex University Press; 2006.
54. Shorten A. Maternal and neonatal effects of caesarean section. BMJ 2007;335(7628):1003–4.55. NICE. CG132: Caesarean Section (2011). https://www.nice.org.uk/guidance/cg132.56. ACOG. Cesarean Delivery on Maternal Request. http://www.acog.org/Resources-And-
Publications/Committee-Opinions/Committee-on-Obstetric-Practice/Cesarean-Delivery-on-Maternal-Request.
57. Vidic Z, Blickstein I, Stucin Gantar I, et al. Timing of elective cesarean section and neonatal morbidity: a population-based study. J Matern Fetal Neonatal Med 2015:1–3.
58. Finn D, O’Neill SM, Collins A, et al. Neonatal outcomes following elective caesarean delivery at term: a hospital-based cohort study. J Matern Fetal Neonatal Med 2016;29(6):904–10.
59. RCOG. Birth after Previous Caesarean Birth (Green-top Guideline No. 45), 2015.60. MacDorman M, Declercq E, Menacker F. Recent trends and patterns in cesarean and vaginal
birth after cesarean (VBAC) deliveries in the United States. Clin Perinatol 2011;38(2):179–92.61. Homer CS, Kurinczuk JJ, Spark P, et al. Planned vaginal delivery or planned caesarean
delivery in women with extreme obesity. BJOG 2011;118(4):480–7.62. Knight HE, Gurol-Urganci I, van der Meulen JH, et al. Vaginal birth after caesarean
section: a cohort study investigating factors associated with its uptake and success. BJOG 2014;121(2):183–92.
63. RCOG. Operative Vaginal Delivery (Green-top Guideline No. 26), 2007.64. O’Mahony F, Hofmeyr GJ, Menon V. Choice of instruments for assisted vaginal delivery.
Cochrane Database Syst Rev 2010(11):CD005455.65. NICE. CG190: Intrapartum Care for Healthy Women and Babies (2014). https://www.nice.org.
uk/guidance/cg190.66. Graham ID, Carroli G, Davies C, et al. Episiotomy rates around the world: an update. Birth
2005;32(3):219–23.67. Gurol-Urganci I, Cromwell DA, Edozien LC, et al. Third- and fourth-degree perineal tears
among primiparous women in England between 2000 and 2012: time trends and risk factors. BJOG 2013;120(12):1516–25.
54
Patt
erns
of m
ater
nity
car
e in
Eng
lish
NH
S tr
usts
201
3/14
68. Trochez R, Waterfield M, Freeman RM. Hands on or hands off the perineum: a survey of care of the perineum in labour (HOOPS). Int Urogynecol J 2011;22(10):1279–85.
69. McLeod NL, Gilmour DT, Joseph KS, et al. Trends in major risk factors for anal sphincter lacerations: a 10-year study. J Obstet Gynaecol Can 2003;25(7):586–93.
70. RCOG. Third- and Fourth-degree Perineal Tears, Management (Green-top Guideline No. 29), 2015.
71. NHS Litigation Authority. 10 Years of Maternity Claims, 2012.72. Hartmann K, Viswanathan M, Palmieri R, et al. Outcomes of routine episiotomy: a
systematic review. JAMA 2005;293(17):2141–8.73. Dudding TC, Vaizey CJ, Kamm MA. Obstetric anal sphincter injury: incidence, risk factors,
and management. Ann Surg 2008;247(2):224–37.74. Blunt I, Bardsley M, Grove A, et al. Classifying emergency 30-day readmissions in England
using routine hospital data 2004–2010: what is the scope for reduction? Emerg Med J 2015;32(1):44–50.
75. Young PC, Korgenski K, Buchi KF. Early readmission of newborns in a large health care system. Pediatrics 2013;131(5):e1538–44.
76. Liu S, Heaman M, Joseph KS, et al. Risk of maternal postpartum readmission associated with mode of delivery. Obstet Gynecol 2005;105(4):836–42.
77. Lydon-Rochelle M, Holt VL, Martin DP, et al. Association between method of delivery and maternal rehospitalization. JAMA 2000;283(18):2411–16.
78. Evans R, Zorlu G, Boseley S. Flaws in Hospital Episode Statistics revealed by FoI requests. The Guardian, 2010, 10th June.
79. Knight HE, Gurol-Urganci I, Mahmood TA, et al. Evaluating maternity care using national administrative health datasets: how are statistics affected by the quality of data on method of delivery? BMC Health Serv Res 2013;13:200.
80. Kirkman MA, Mahattanakul W, Gregson BA, et al. The accuracy of hospital discharge coding for hemorrhagic stroke. Acta Neurol Belg 2009;109(2):114–19.
81. Nouraei SA, O’Hanlon S, Butler CR, et al. A multidisciplinary audit of clinical coding accuracy in otolaryngology: financial, managerial and clinical governance considerations under payment-by-results. Clin Otolaryngol 2009;34(1):43–51.
82. Johal A, Mitchell D, Lees T, et al. Use of Hospital Episode Statistics to investigate abdominal aortic aneurysm surgery. B J Surg 2012;99(1):66–72.
83. Robson M, Murphy M, Byrne F. Quality assurance: The 10-Group Classification System (Robson classification), induction of labor, and cesarean delivery. Int J Gynaecol Obstet 2015;131 Suppl 1:S23–7.
84. Cromwell DA, Knight HE, Gurol-Urganci I. Parity derived for pregnant women using historical administrative hospital data: accuracy varied among patient groups. J Clin Epidemiol 2014;67(5):578–85.
85. Brocklehurst P. Trial Protocol: A multicentre randomised controlled trial of an intelligent system to support decision making in the management of labour using the cardiotocogram (INFANT). HTA project number: 06/38/01. http://www.ucl.ac.uk/cctu/researchareas/womenshealth/infant/documents/protocol.
5555Appendix 1Contributors
Consensus GroupJan van der Meulen (Chair) Professor of Clinical Epidemiology; London School of Hygiene and
Tropical MedicineAlan Cameron Vice President; Clinical Quality, Royal College of Obstetricians and
GynaecologistsFran Carroll Research Fellow; Lindsay Stewart Centre for Audit and Clinical
Informatics, Royal College of Obstetricians and GynaecologistsDavid Cromwell Reader in Health Services Research; London School of Hygiene and
Tropical Medicine, and Director; Clinical Effectiveness Unit, The Royal College of Surgeons of England
Anita Dougall Director; Clinical Quality, Royal College of Obstetricians and Gynaecologists
Emma Gordon Women’s Voices Involvement Panel representativeIpek Gurol-Urganci Lecturer in Health Services Research; London School of Hygiene and
Tropical MedicineSara Johnson Executive Director; Quality and Knowledge, Royal College of
Obstetricians and GynaecologistsMervi Jokinen Practice Development Advisor; Learning, Research and Professional
Development, Royal College of MidwivesTony Kelly Consultant Obstetrician & Gynaecologist; Honorary Clinical Senior
Lecturer & Associate Medical Director for Quality & Innovation, Brighton & Sussex University Hospitals
Sara Kenyon Reader in Evidence Based Maternity Care, Public Health, Epidemiology and Biostatistics; School of Health and Population Sciences, University of Birmingham
Mark Kilby Professor of Fetal Medicine and Clinical Lead in Fetal Medicine; President of the British Maternal & Fetal Medicine Society, Birmingham Women’s Foundation Trust
Hannah Knight Manager; Lindsay Stewart Centre for Audit and Clinical Informatics, Royal College of Obstetricians and Gynaecologists
Anastasia Liapi Women’s Voices Involvement Panel representativeMarie McDonald Director of Nursing for Adult Services; Guy’s & St. Thomas’
Foundation Trust and practising midwifeEdward Morris Consultant Obstetrician & Gynaecologist; Norfolk and Norwich
University HospitalAris Papageorghiou Consultant Obstetrician and Gynaecologist; Clinical Director, St
George’s, University of LondonDavid Richmond President; Royal College of Obstetricians and GynaecologistsMichael Robson Consultant Obstetrician and Gynaecologist; The National Maternity
Hospital, DublinHelen Scholefield Consultant Obstetrician; Liverpool Women’s Foundation TrustGordon Smith Professor & Head of Department; Obstetrics and Gynaecology,
Cambridge University
56
Patt
erns
of m
ater
nity
car
e in
Eng
lish
NH
S tr
usts
201
3/14
Clinical Interpretation GroupEd Prosser-Snelling Specialist Registrar in Obstetrics and Gynaecology; Norfolk and
Norwich University HospitalCharles Bircher Specialist Registrar in Obstetrics and Gynaecology; Norfolk and
Norwich University HospitalRuta Gada Consultant Obstetrician; Ipswich Hospital NHS Trust
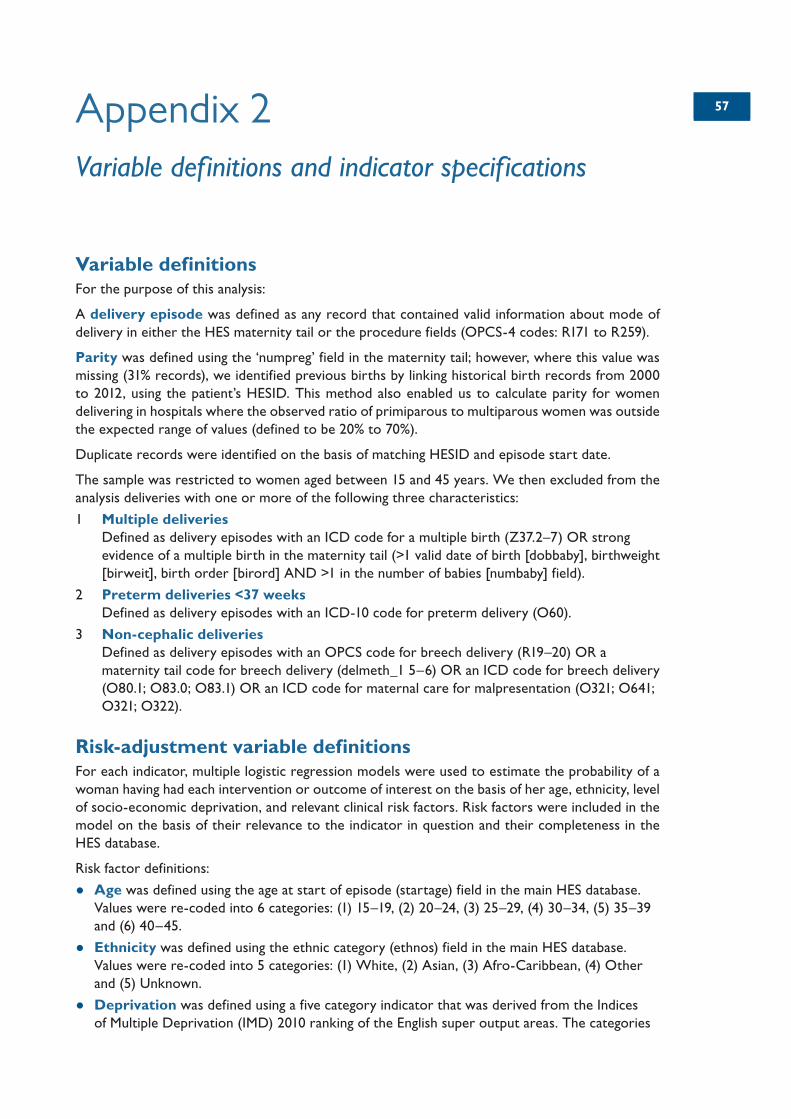
5757Appendix 2Variable definitions and indicator specifications
Variable definitionsFor the purpose of this analysis:
A delivery episode was defined as any record that contained valid information about mode of delivery in either the HES maternity tail or the procedure fields (OPCS-4 codes: R171 to R259).
Parity was defined using the ‘numpreg’ field in the maternity tail; however, where this value was missing (31% records), we identified previous births by linking historical birth records from 2000 to 2012, using the patient’s HESID. This method also enabled us to calculate parity for women delivering in hospitals where the observed ratio of primiparous to multiparous women was outside the expected range of values (defined to be 20% to 70%).
Duplicate records were identified on the basis of matching HESID and episode start date.
The sample was restricted to women aged between 15 and 45 years. We then excluded from the analysis deliveries with one or more of the following three characteristics:
1 Multiple deliveries Defined as delivery episodes with an ICD code for a multiple birth (Z37.2–7) OR strong evidence of a multiple birth in the maternity tail (>1 valid date of birth [dobbaby], birthweight [birweit], birth order [birord] AND >1 in the number of babies [numbaby] field).
2 Preterm deliveries <37 weeks Defined as delivery episodes with an ICD-10 code for preterm delivery (O60).
3 Non-cephalic deliveries Defined as delivery episodes with an OPCS code for breech delivery (R19–20) OR a maternity tail code for breech delivery (delmeth_1 5–6) OR an ICD code for breech delivery (O80.1; O83.0; O83.1) OR an ICD code for maternal care for malpresentation (O321; O641; O321; O322).
Risk-adjustment variable definitionsFor each indicator, multiple logistic regression models were used to estimate the probability of a woman having had each intervention or outcome of interest on the basis of her age, ethnicity, level of socio-economic deprivation, and relevant clinical risk factors. Risk factors were included in the model on the basis of their relevance to the indicator in question and their completeness in the HES database.
Risk factor definitions:
• Age was defined using the age at start of episode (startage) field in the main HES database. Values were re-coded into 6 categories: (1) 15–19, (2) 20–24, (3) 25–29, (4) 30–34, (5) 35–39 and (6) 40–45.
• Ethnicity was defined using the ethnic category (ethnos) field in the main HES database. Values were re-coded into 5 categories: (1) White, (2) Asian, (3) Afro-Caribbean, (4) Other and (5) Unknown.
• Deprivation was defined using a five category indicator that was derived from the Indices of Multiple Deprivation (IMD) 2010 ranking of the English super output areas. The categories
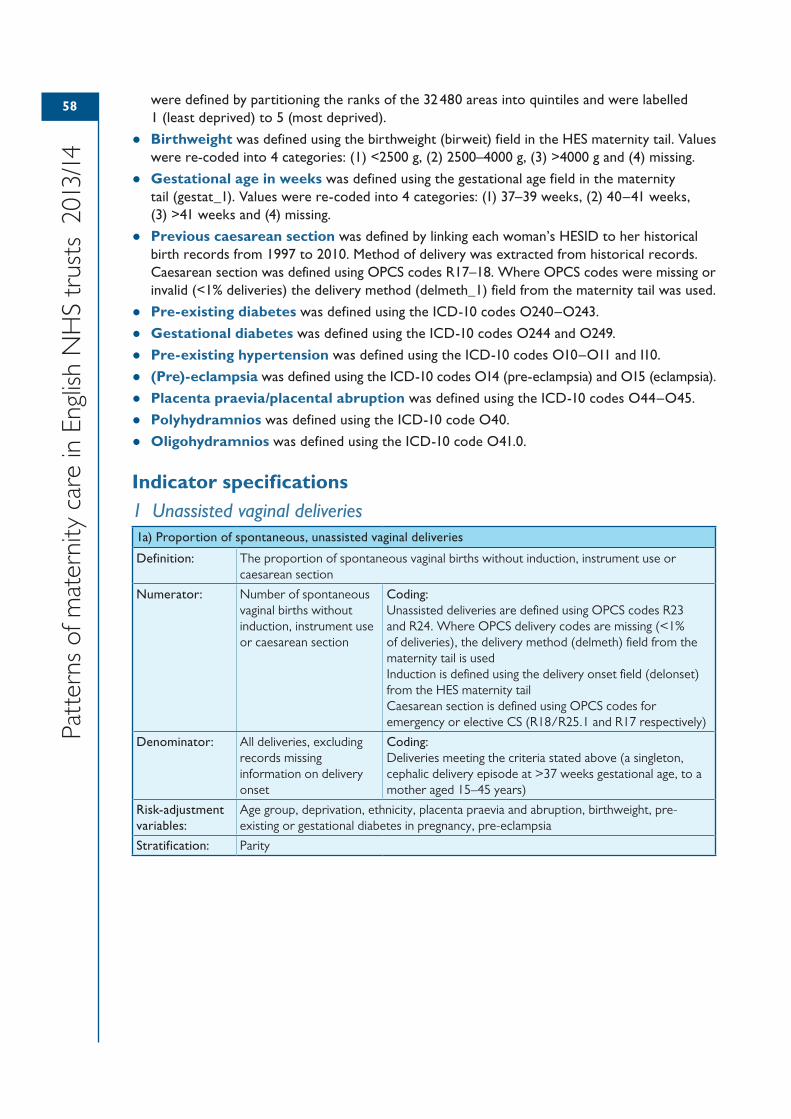
58
Patt
erns
of m
ater
nity
car
e in
Eng
lish
NH
S tr
usts
201
3/14
were defined by partitioning the ranks of the 32 480 areas into quintiles and were labelled 1 (least deprived) to 5 (most deprived).
• Birthweight was defined using the birthweight (birweit) field in the HES maternity tail. Values were re-coded into 4 categories: (1) <2500 g, (2) 2500–4000 g, (3) >4000 g and (4) missing.
• Gestational age in weeks was defined using the gestational age field in the maternity tail (gestat_1). Values were re-coded into 4 categories: (1) 37–39 weeks, (2) 40–41 weeks, (3) >41 weeks and (4) missing.
• Previous caesarean section was defined by linking each woman’s HESID to her historical birth records from 1997 to 2010. Method of delivery was extracted from historical records. Caesarean section was defined using OPCS codes R17–18. Where OPCS codes were missing or invalid (<1% deliveries) the delivery method (delmeth_1) field from the maternity tail was used.
• Pre-existing diabetes was defined using the ICD-10 codes O240–O243.
• Gestational diabetes was defined using the ICD-10 codes O244 and O249.
• Pre-existing hypertension was defined using the ICD-10 codes O10–O11 and I10.
• (Pre)-eclampsia was defined using the ICD-10 codes O14 (pre-eclampsia) and O15 (eclampsia).
• Placenta praevia/placental abruption was defined using the ICD-10 codes O44–O45.
• Polyhydramnios was defined using the ICD-10 code O40.
• Oligohydramnios was defined using the ICD-10 code O41.0.
Indicator specifications1 Unassisted vaginal deliveries1a) Proportion of spontaneous, unassisted vaginal deliveries
Definition: The proportion of spontaneous vaginal births without induction, instrument use or caesarean section
Numerator: Number of spontaneous vaginal births without induction, instrument use or caesarean section
Coding:Unassisted deliveries are defined using OPCS codes R23 and R24. Where OPCS delivery codes are missing (<1% of deliveries), the delivery method (delmeth) field from the maternity tail is usedInduction is defined using the delivery onset field (delonset) from the HES maternity tailCaesarean section is defined using OPCS codes for emergency or elective CS (R18/R25.1 and R17 respectively)
Denominator: All deliveries, excluding records missing information on delivery onset
Coding:Deliveries meeting the criteria stated above (a singleton, cephalic delivery episode at >37 weeks gestational age, to a mother aged 15–45 years)
Risk-adjustment variables:
Age group, deprivation, ethnicity, placenta praevia and abruption, birthweight, pre-existing or gestational diabetes in pregnancy, pre-eclampsia
Stratification: Parity
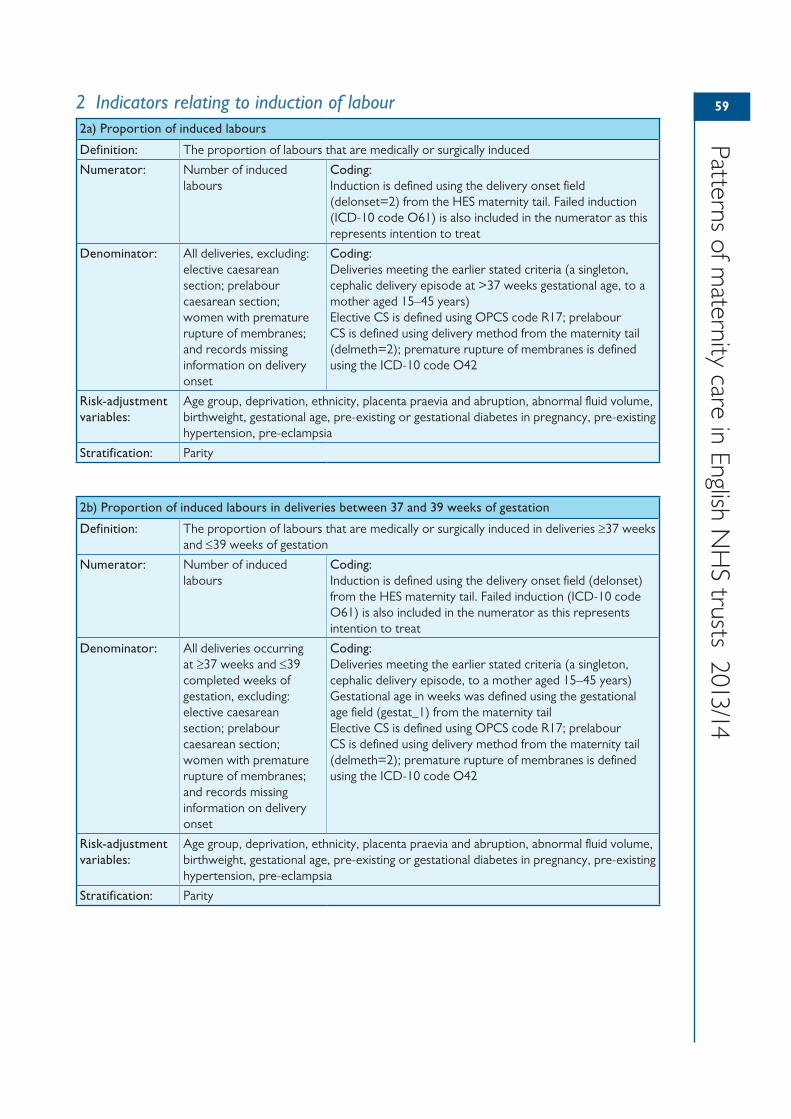
59
Patterns of maternity care in English N
HS trusts 2013/14
2 Indicators relating to induction of labour2a) Proportion of induced labours
Definition: The proportion of labours that are medically or surgically induced
Numerator: Number of induced labours
Coding:Induction is defined using the delivery onset field (delonset=2) from the HES maternity tail. Failed induction (ICD-10 code O61) is also included in the numerator as this represents intention to treat
Denominator: All deliveries, excluding: elective caesarean section; prelabour caesarean section; women with premature rupture of membranes; and records missing information on delivery onset
Coding:Deliveries meeting the earlier stated criteria (a singleton, cephalic delivery episode at >37 weeks gestational age, to a mother aged 15–45 years)Elective CS is defined using OPCS code R17; prelabour CS is defined using delivery method from the maternity tail (delmeth=2); premature rupture of membranes is defined using the ICD-10 code O42
Risk-adjustment variables:
Age group, deprivation, ethnicity, placenta praevia and abruption, abnormal fluid volume, birthweight, gestational age, pre-existing or gestational diabetes in pregnancy, pre-existing hypertension, pre-eclampsia
Stratification: Parity
2b) Proportion of induced labours in deliveries between 37 and 39 weeks of gestation
Definition: The proportion of labours that are medically or surgically induced in deliveries ≥37 weeks and ≤39 weeks of gestation
Numerator: Number of induced labours
Coding:Induction is defined using the delivery onset field (delonset) from the HES maternity tail. Failed induction (ICD-10 code O61) is also included in the numerator as this represents intention to treat
Denominator: All deliveries occurring at ≥37 weeks and ≤39 completed weeks of gestation, excluding: elective caesarean section; prelabour caesarean section; women with premature rupture of membranes; and records missing information on delivery onset
Coding:Deliveries meeting the earlier stated criteria (a singleton, cephalic delivery episode, to a mother aged 15–45 years)Gestational age in weeks was defined using the gestational age field (gestat_1) from the maternity tailElective CS is defined using OPCS code R17; prelabour CS is defined using delivery method from the maternity tail (delmeth=2); premature rupture of membranes is defined using the ICD-10 code O42
Risk-adjustment variables:
Age group, deprivation, ethnicity, placenta praevia and abruption, abnormal fluid volume, birthweight, gestational age, pre-existing or gestational diabetes in pregnancy, pre-existing hypertension, pre-eclampsia
Stratification: Parity
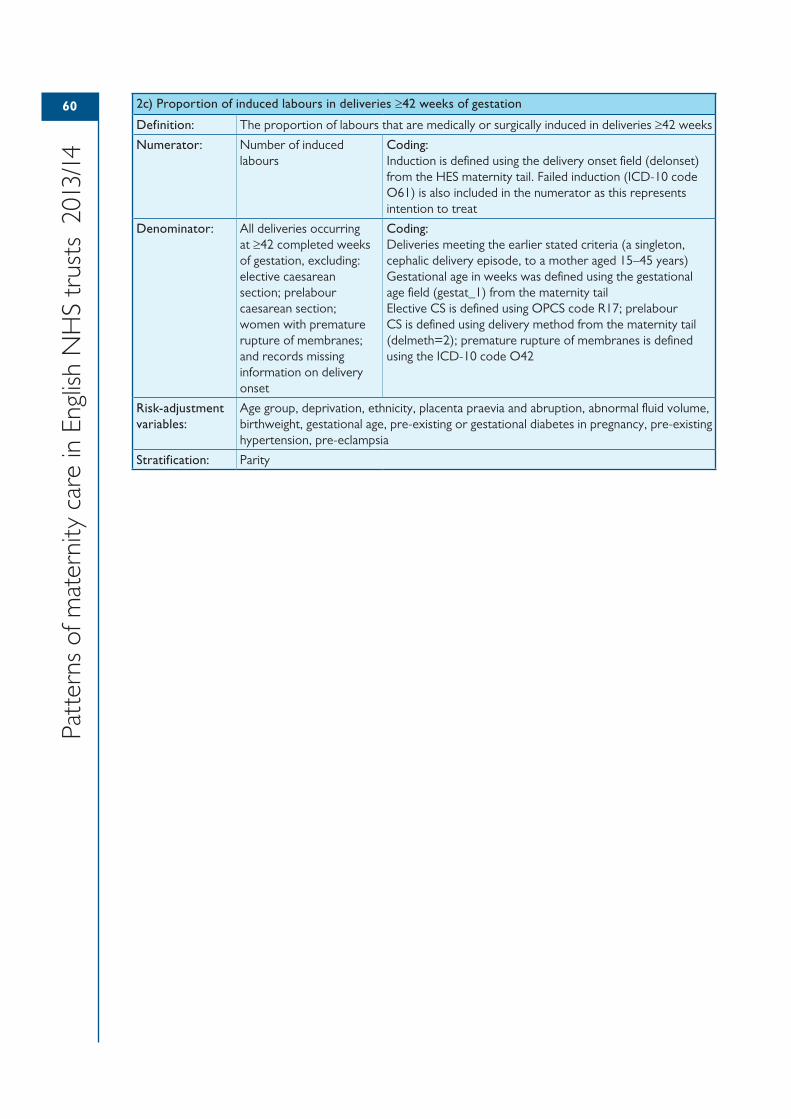
60
Patt
erns
of m
ater
nity
car
e in
Eng
lish
NH
S tr
usts
201
3/14
2c) Proportion of induced labours in deliveries ≥42 weeks of gestation
Definition: The proportion of labours that are medically or surgically induced in deliveries ≥42 weeks
Numerator: Number of induced labours
Coding:Induction is defined using the delivery onset field (delonset) from the HES maternity tail. Failed induction (ICD-10 code O61) is also included in the numerator as this represents intention to treat
Denominator: All deliveries occurring at ≥42 completed weeks of gestation, excluding: elective caesarean section; prelabour caesarean section; women with premature rupture of membranes; and records missing information on delivery onset
Coding:Deliveries meeting the earlier stated criteria (a singleton, cephalic delivery episode, to a mother aged 15–45 years)Gestational age in weeks was defined using the gestational age field (gestat_1) from the maternity tailElective CS is defined using OPCS code R17; prelabour CS is defined using delivery method from the maternity tail (delmeth=2); premature rupture of membranes is defined using the ICD-10 code O42
Risk-adjustment variables:
Age group, deprivation, ethnicity, placenta praevia and abruption, abnormal fluid volume, birthweight, gestational age, pre-existing or gestational diabetes in pregnancy, pre-existing hypertension, pre-eclampsia
Stratification: Parity
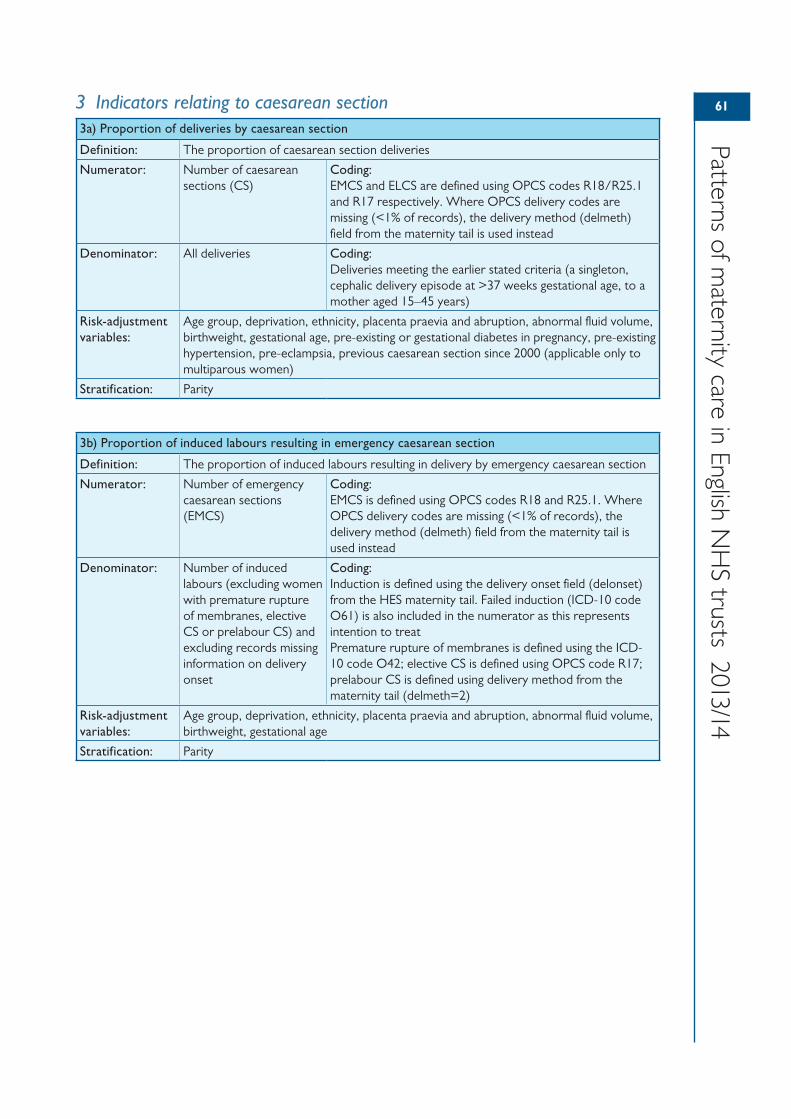
61
Patterns of maternity care in English N
HS trusts 2013/14
3 Indicators relating to caesarean section3a) Proportion of deliveries by caesarean section
Definition: The proportion of caesarean section deliveries
Numerator: Number of caesarean sections (CS)
Coding:EMCS and ELCS are defined using OPCS codes R18/R25.1 and R17 respectively. Where OPCS delivery codes are missing (<1% of records), the delivery method (delmeth) field from the maternity tail is used instead
Denominator: All deliveries Coding:Deliveries meeting the earlier stated criteria (a singleton, cephalic delivery episode at >37 weeks gestational age, to a mother aged 15–45 years)
Risk-adjustment variables:
Age group, deprivation, ethnicity, placenta praevia and abruption, abnormal fluid volume, birthweight, gestational age, pre-existing or gestational diabetes in pregnancy, pre-existing hypertension, pre-eclampsia, previous caesarean section since 2000 (applicable only to multiparous women)
Stratification: Parity
3b) Proportion of induced labours resulting in emergency caesarean section
Definition: The proportion of induced labours resulting in delivery by emergency caesarean section
Numerator: Number of emergency caesarean sections (EMCS)
Coding:EMCS is defined using OPCS codes R18 and R25.1. Where OPCS delivery codes are missing (<1% of records), the delivery method (delmeth) field from the maternity tail is used instead
Denominator: Number of induced labours (excluding women with premature rupture of membranes, elective CS or prelabour CS) and excluding records missing information on delivery onset
Coding:Induction is defined using the delivery onset field (delonset) from the HES maternity tail. Failed induction (ICD-10 code O61) is also included in the numerator as this represents intention to treatPremature rupture of membranes is defined using the ICD-10 code O42; elective CS is defined using OPCS code R17; prelabour CS is defined using delivery method from the maternity tail (delmeth=2)
Risk-adjustment variables:
Age group, deprivation, ethnicity, placenta praevia and abruption, abnormal fluid volume, birthweight, gestational age
Stratification: Parity
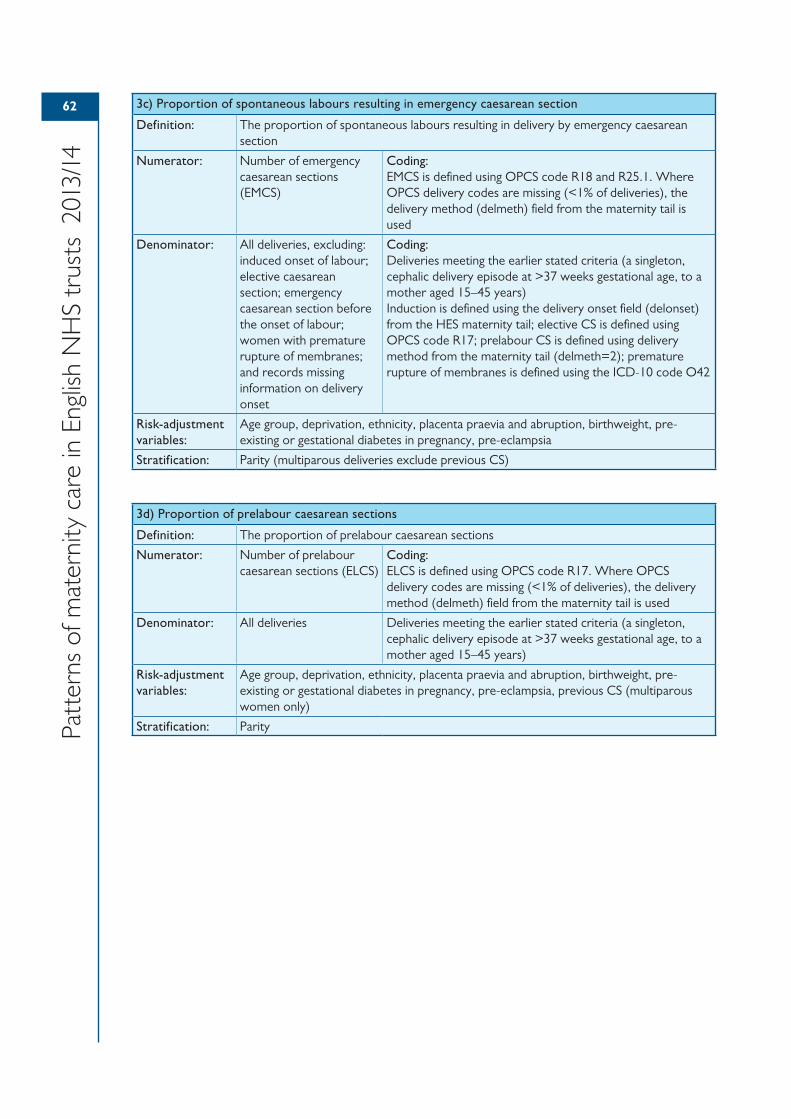
62
Patt
erns
of m
ater
nity
car
e in
Eng
lish
NH
S tr
usts
201
3/14
3c) Proportion of spontaneous labours resulting in emergency caesarean section
Definition: The proportion of spontaneous labours resulting in delivery by emergency caesarean section
Numerator: Number of emergency caesarean sections (EMCS)
Coding:EMCS is defined using OPCS code R18 and R25.1. Where OPCS delivery codes are missing (<1% of deliveries), the delivery method (delmeth) field from the maternity tail is used
Denominator: All deliveries, excluding: induced onset of labour; elective caesarean section; emergency caesarean section before the onset of labour; women with premature rupture of membranes; and records missing information on delivery onset
Coding:Deliveries meeting the earlier stated criteria (a singleton, cephalic delivery episode at >37 weeks gestational age, to a mother aged 15–45 years)Induction is defined using the delivery onset field (delonset) from the HES maternity tail; elective CS is defined using OPCS code R17; prelabour CS is defined using delivery method from the maternity tail (delmeth=2); premature rupture of membranes is defined using the ICD-10 code O42
Risk-adjustment variables:
Age group, deprivation, ethnicity, placenta praevia and abruption, birthweight, pre-existing or gestational diabetes in pregnancy, pre-eclampsia
Stratification: Parity (multiparous deliveries exclude previous CS)
3d) Proportion of prelabour caesarean sections
Definition: The proportion of prelabour caesarean sections
Numerator: Number of prelabour caesarean sections (ELCS)
Coding:ELCS is defined using OPCS code R17. Where OPCS delivery codes are missing (<1% of deliveries), the delivery method (delmeth) field from the maternity tail is used
Denominator: All deliveries Deliveries meeting the earlier stated criteria (a singleton, cephalic delivery episode at >37 weeks gestational age, to a mother aged 15–45 years)
Risk-adjustment variables:
Age group, deprivation, ethnicity, placenta praevia and abruption, birthweight, pre-existing or gestational diabetes in pregnancy, pre-eclampsia, previous CS (multiparous women only)
Stratification: Parity
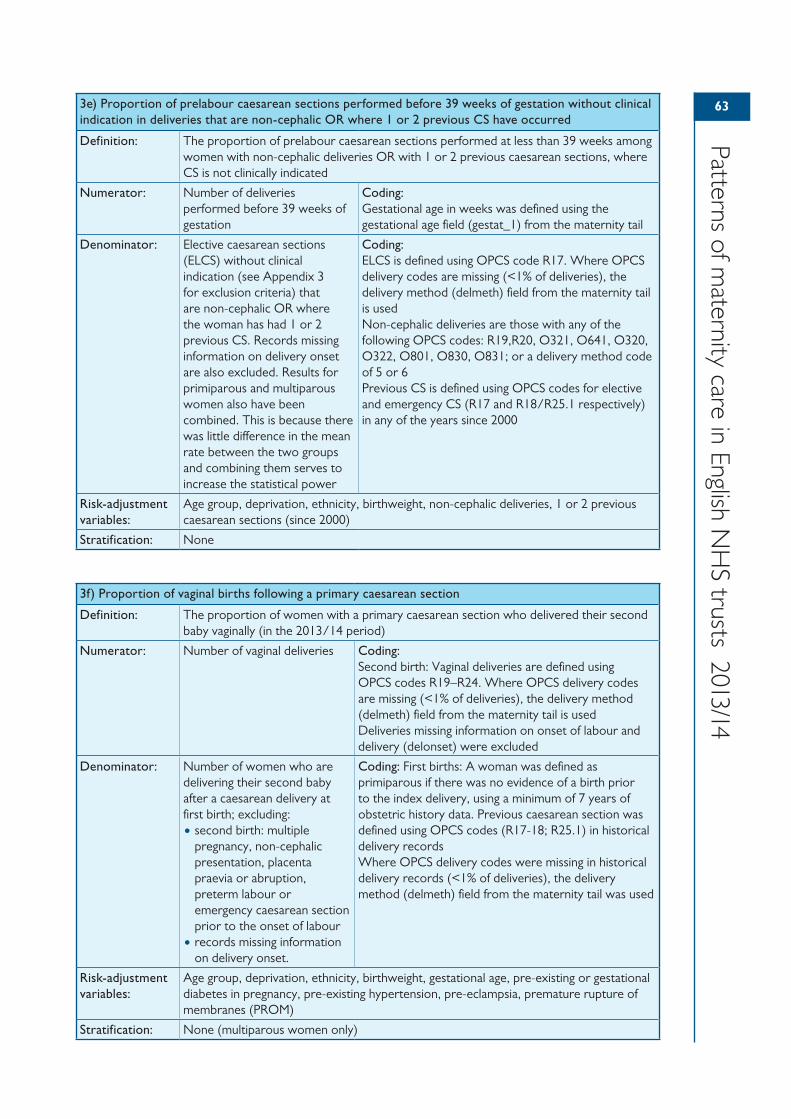
63
Patterns of maternity care in English N
HS trusts 2013/14
3e) Proportion of prelabour caesarean sections performed before 39 weeks of gestation without clinical indication in deliveries that are non-cephalic OR where 1 or 2 previous CS have occurred
Definition: The proportion of prelabour caesarean sections performed at less than 39 weeks among women with non-cephalic deliveries OR with 1 or 2 previous caesarean sections, where CS is not clinically indicated
Numerator: Number of deliveries performed before 39 weeks of gestation
Coding:Gestational age in weeks was defined using the gestational age field (gestat_1) from the maternity tail
Denominator: Elective caesarean sections (ELCS) without clinical indication (see Appendix 3 for exclusion criteria) that are non-cephalic OR where the woman has had 1 or 2 previous CS. Records missing information on delivery onset are also excluded. Results for primiparous and multiparous women also have been combined. This is because there was little difference in the mean rate between the two groups and combining them serves to increase the statistical power
Coding:ELCS is defined using OPCS code R17. Where OPCS delivery codes are missing (<1% of deliveries), the delivery method (delmeth) field from the maternity tail is usedNon-cephalic deliveries are those with any of the following OPCS codes: R19,R20, O321, O641, O320, O322, O801, O830, O831; or a delivery method code of 5 or 6Previous CS is defined using OPCS codes for elective and emergency CS (R17 and R18/R25.1 respectively) in any of the years since 2000
Risk-adjustment variables:
Age group, deprivation, ethnicity, birthweight, non-cephalic deliveries, 1 or 2 previous caesarean sections (since 2000)
Stratification: None
3f) Proportion of vaginal births following a primary caesarean section
Definition: The proportion of women with a primary caesarean section who delivered their second baby vaginally (in the 2013/14 period)
Numerator: Number of vaginal deliveries Coding:Second birth: Vaginal deliveries are defined using OPCS codes R19–R24. Where OPCS delivery codes are missing (<1% of deliveries), the delivery method (delmeth) field from the maternity tail is usedDeliveries missing information on onset of labour and delivery (delonset) were excluded
Denominator: Number of women who are delivering their second baby after a caesarean delivery at first birth; excluding:• second birth: multiple
pregnancy, non-cephalic presentation, placenta praevia or abruption, preterm labour or emergency caesarean section prior to the onset of labour
• records missing information on delivery onset.
Coding: First births: A woman was defined as primiparous if there was no evidence of a birth prior to the index delivery, using a minimum of 7 years of obstetric history data. Previous caesarean section was defined using OPCS codes (R17-18; R25.1) in historical delivery recordsWhere OPCS delivery codes were missing in historical delivery records (<1% of deliveries), the delivery method (delmeth) field from the maternity tail was used
Risk-adjustment variables:
Age group, deprivation, ethnicity, birthweight, gestational age, pre-existing or gestational diabetes in pregnancy, pre-existing hypertension, pre-eclampsia, premature rupture of membranes (PROM)
Stratification: None (multiparous women only)
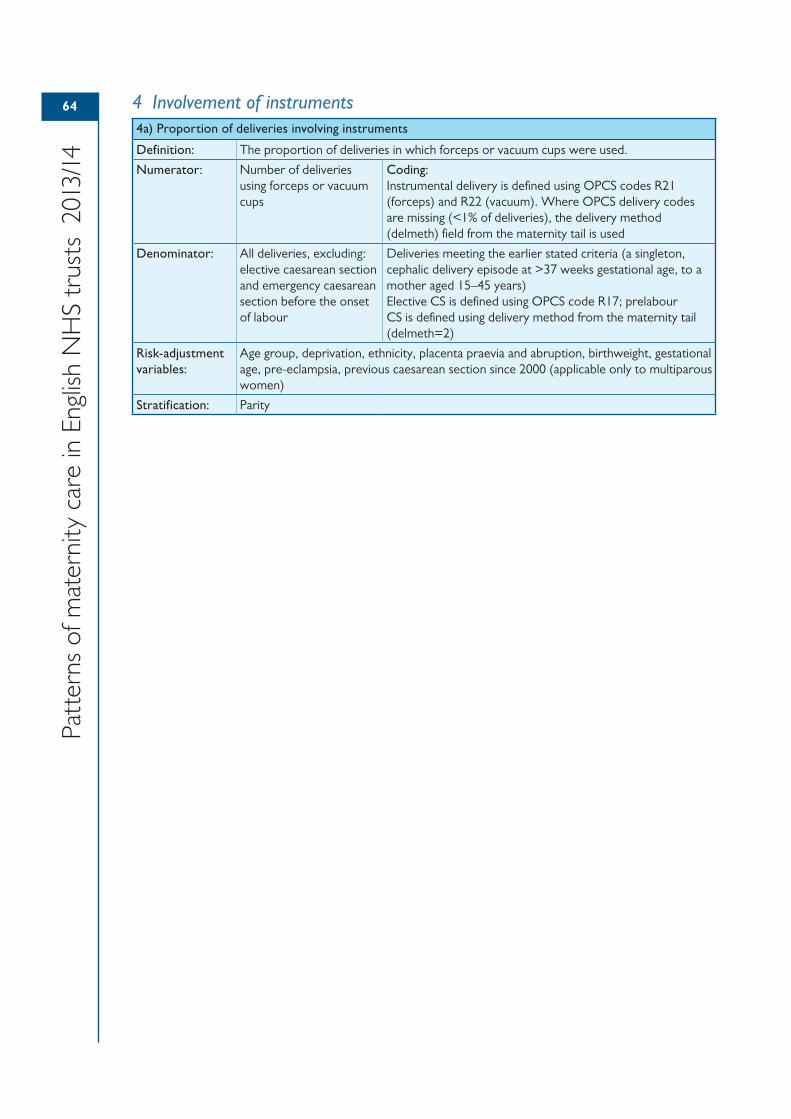
64
Patt
erns
of m
ater
nity
car
e in
Eng
lish
NH
S tr
usts
201
3/14
4 Involvement of instruments4a) Proportion of deliveries involving instruments
Definition: The proportion of deliveries in which forceps or vacuum cups were used.
Numerator: Number of deliveries using forceps or vacuum cups
Coding:Instrumental delivery is defined using OPCS codes R21 (forceps) and R22 (vacuum). Where OPCS delivery codes are missing (<1% of deliveries), the delivery method (delmeth) field from the maternity tail is used
Denominator: All deliveries, excluding: elective caesarean section and emergency caesarean section before the onset of labour
Deliveries meeting the earlier stated criteria (a singleton, cephalic delivery episode at >37 weeks gestational age, to a mother aged 15–45 years)Elective CS is defined using OPCS code R17; prelabour CS is defined using delivery method from the maternity tail (delmeth=2)
Risk-adjustment variables:
Age group, deprivation, ethnicity, placenta praevia and abruption, birthweight, gestational age, pre-eclampsia, previous caesarean section since 2000 (applicable only to multiparous women)
Stratification: Parity
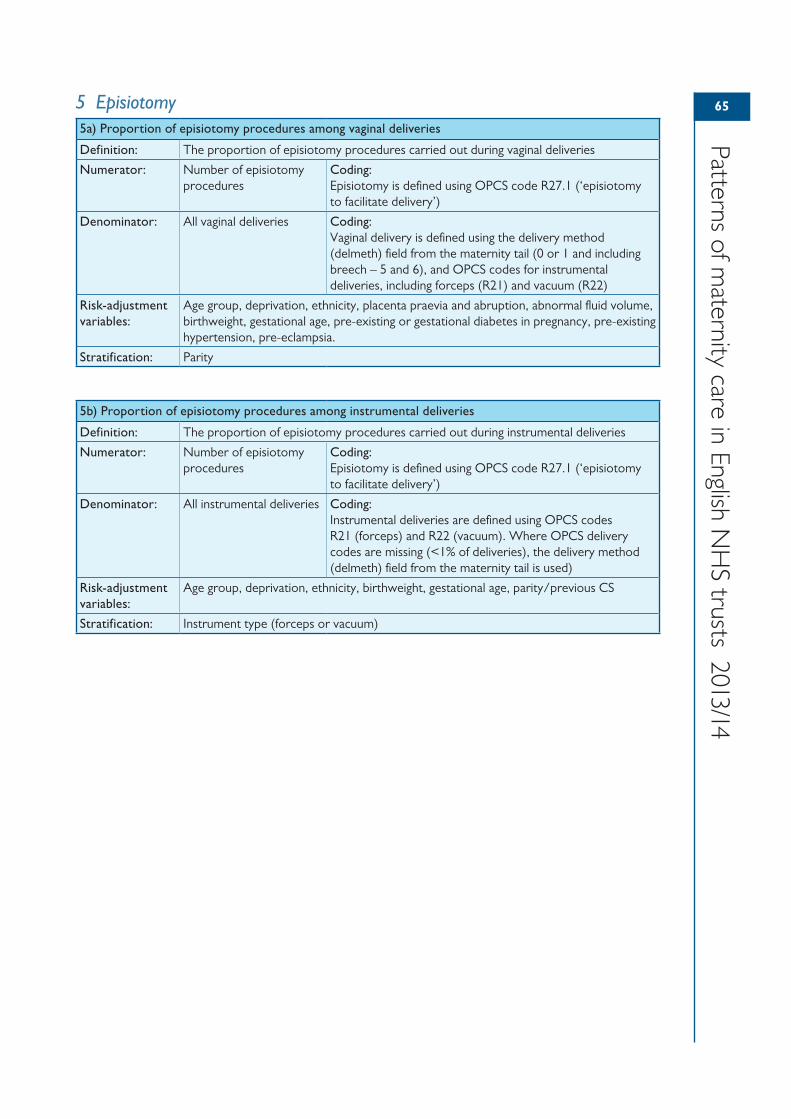
65
Patterns of maternity care in English N
HS trusts 2013/14
5 Episiotomy5a) Proportion of episiotomy procedures among vaginal deliveries
Definition: The proportion of episiotomy procedures carried out during vaginal deliveries
Numerator: Number of episiotomy procedures
Coding:Episiotomy is defined using OPCS code R27.1 (‘episiotomy to facilitate delivery’)
Denominator: All vaginal deliveries Coding:Vaginal delivery is defined using the delivery method (delmeth) field from the maternity tail (0 or 1 and including breech – 5 and 6), and OPCS codes for instrumental deliveries, including forceps (R21) and vacuum (R22)
Risk-adjustment variables:
Age group, deprivation, ethnicity, placenta praevia and abruption, abnormal fluid volume, birthweight, gestational age, pre-existing or gestational diabetes in pregnancy, pre-existing hypertension, pre-eclampsia.
Stratification: Parity
5b) Proportion of episiotomy procedures among instrumental deliveries
Definition: The proportion of episiotomy procedures carried out during instrumental deliveries
Numerator: Number of episiotomy procedures
Coding:Episiotomy is defined using OPCS code R27.1 (‘episiotomy to facilitate delivery’)
Denominator: All instrumental deliveries Coding:Instrumental deliveries are defined using OPCS codes R21 (forceps) and R22 (vacuum). Where OPCS delivery codes are missing (<1% of deliveries), the delivery method (delmeth) field from the maternity tail is used)
Risk-adjustment variables:
Age group, deprivation, ethnicity, birthweight, gestational age, parity/previous CS
Stratification: Instrument type (forceps or vacuum)
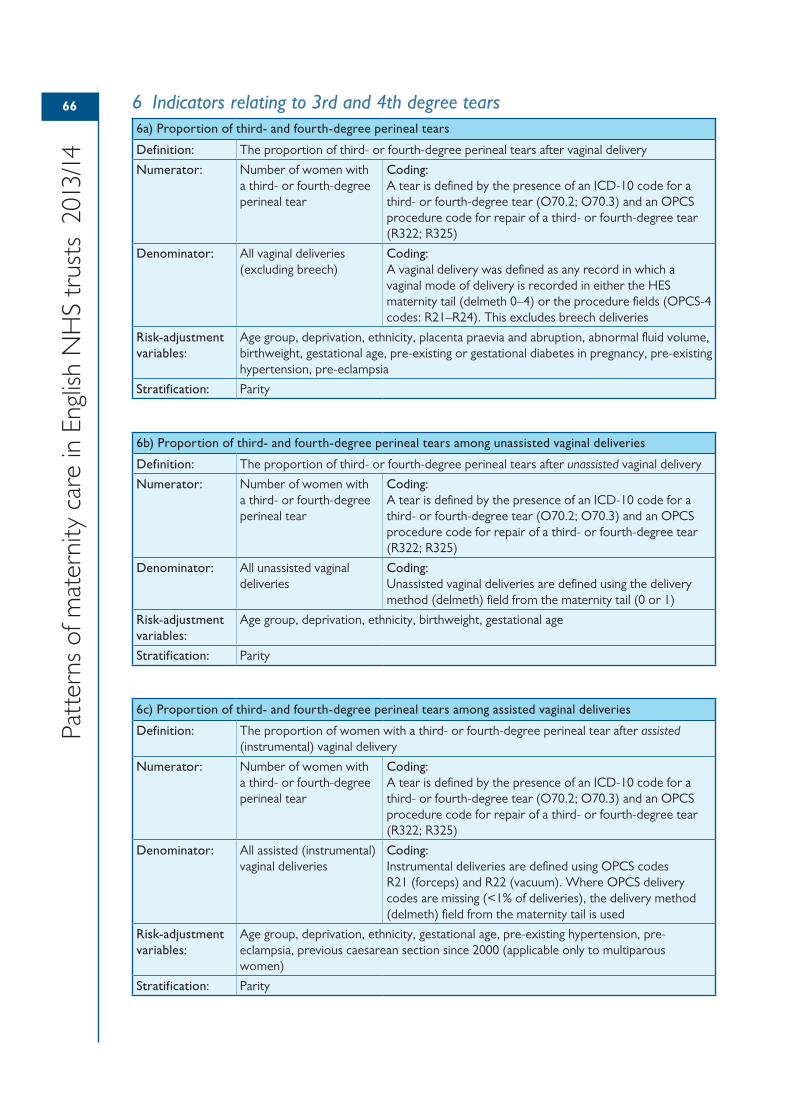
66
Patt
erns
of m
ater
nity
car
e in
Eng
lish
NH
S tr
usts
201
3/14
6 Indicators relating to 3rd and 4th degree tears6a) Proportion of third- and fourth-degree perineal tears
Definition: The proportion of third- or fourth-degree perineal tears after vaginal delivery
Numerator: Number of women with a third- or fourth-degree perineal tear
Coding:A tear is defined by the presence of an ICD-10 code for a third- or fourth-degree tear (O70.2; O70.3) and an OPCS procedure code for repair of a third- or fourth-degree tear (R322; R325)
Denominator: All vaginal deliveries (excluding breech)
Coding:A vaginal delivery was defined as any record in which a vaginal mode of delivery is recorded in either the HES maternity tail (delmeth 0–4) or the procedure fields (OPCS-4 codes: R21–R24). This excludes breech deliveries
Risk-adjustment variables:
Age group, deprivation, ethnicity, placenta praevia and abruption, abnormal fluid volume, birthweight, gestational age, pre-existing or gestational diabetes in pregnancy, pre-existing hypertension, pre-eclampsia
Stratification: Parity
6b) Proportion of third- and fourth-degree perineal tears among unassisted vaginal deliveries
Definition: The proportion of third- or fourth-degree perineal tears after unassisted vaginal delivery
Numerator: Number of women with a third- or fourth-degree perineal tear
Coding:A tear is defined by the presence of an ICD-10 code for a third- or fourth-degree tear (O70.2; O70.3) and an OPCS procedure code for repair of a third- or fourth-degree tear (R322; R325)
Denominator: All unassisted vaginal deliveries
Coding:Unassisted vaginal deliveries are defined using the delivery method (delmeth) field from the maternity tail (0 or 1)
Risk-adjustment variables:
Age group, deprivation, ethnicity, birthweight, gestational age
Stratification: Parity
6c) Proportion of third- and fourth-degree perineal tears among assisted vaginal deliveries
Definition: The proportion of women with a third- or fourth-degree perineal tear after assisted (instrumental) vaginal delivery
Numerator: Number of women with a third- or fourth-degree perineal tear
Coding:A tear is defined by the presence of an ICD-10 code for a third- or fourth-degree tear (O70.2; O70.3) and an OPCS procedure code for repair of a third- or fourth-degree tear (R322; R325)
Denominator: All assisted (instrumental) vaginal deliveries
Coding:Instrumental deliveries are defined using OPCS codes R21 (forceps) and R22 (vacuum). Where OPCS delivery codes are missing (<1% of deliveries), the delivery method (delmeth) field from the maternity tail is used
Risk-adjustment variables:
Age group, deprivation, ethnicity, gestational age, pre-existing hypertension, pre-eclampsia, previous caesarean section since 2000 (applicable only to multiparous women)
Stratification: Parity
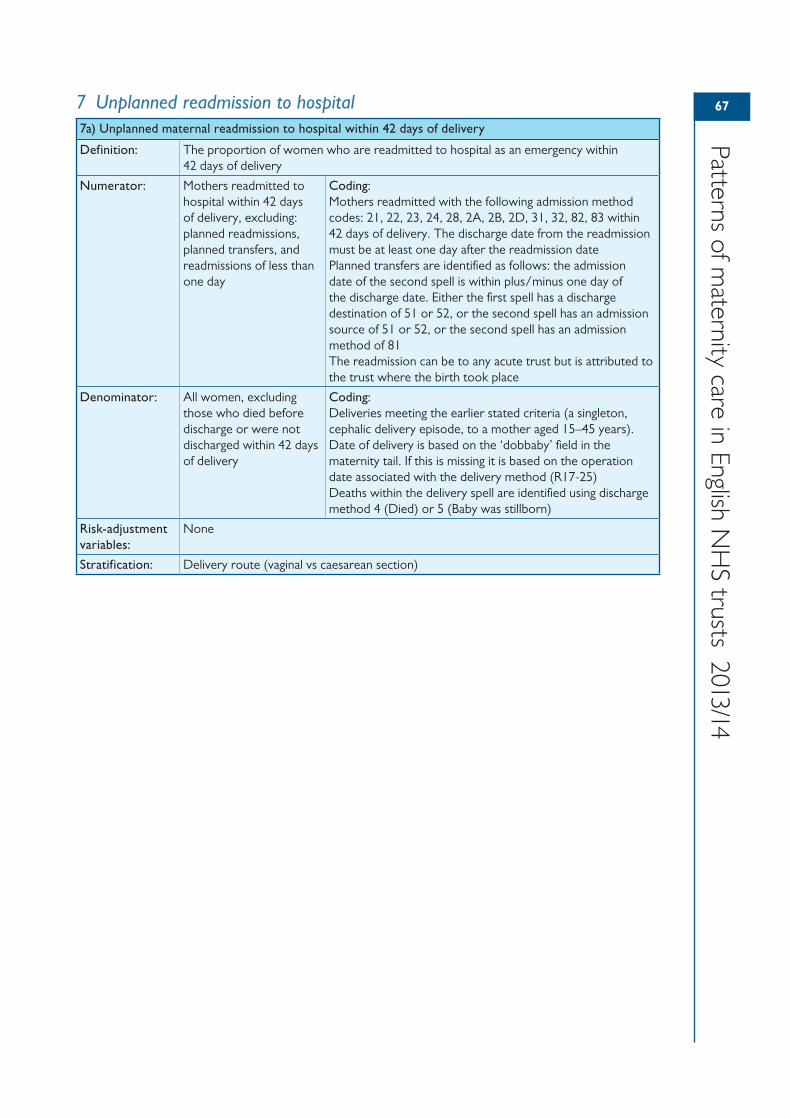
67
Patterns of maternity care in English N
HS trusts 2013/14
7 Unplanned readmission to hospital7a) Unplanned maternal readmission to hospital within 42 days of delivery
Definition: The proportion of women who are readmitted to hospital as an emergency within 42 days of delivery
Numerator: Mothers readmitted to hospital within 42 days of delivery, excluding: planned readmissions, planned transfers, and readmissions of less than one day
Coding:Mothers readmitted with the following admission method codes: 21, 22, 23, 24, 28, 2A, 2B, 2D, 31, 32, 82, 83 within 42 days of delivery. The discharge date from the readmission must be at least one day after the readmission datePlanned transfers are identified as follows: the admission date of the second spell is within plus/minus one day of the discharge date. Either the first spell has a discharge destination of 51 or 52, or the second spell has an admission source of 51 or 52, or the second spell has an admission method of 81The readmission can be to any acute trust but is attributed to the trust where the birth took place
Denominator: All women, excluding those who died before discharge or were not discharged within 42 days of delivery
Coding:Deliveries meeting the earlier stated criteria (a singleton, cephalic delivery episode, to a mother aged 15–45 years).Date of delivery is based on the ‘dobbaby’ field in the maternity tail. If this is missing it is based on the operation date associated with the delivery method (R17-25)Deaths within the delivery spell are identified using discharge method 4 (Died) or 5 (Baby was stillborn)
Risk-adjustment variables:
None
Stratification: Delivery route (vaginal vs caesarean section)
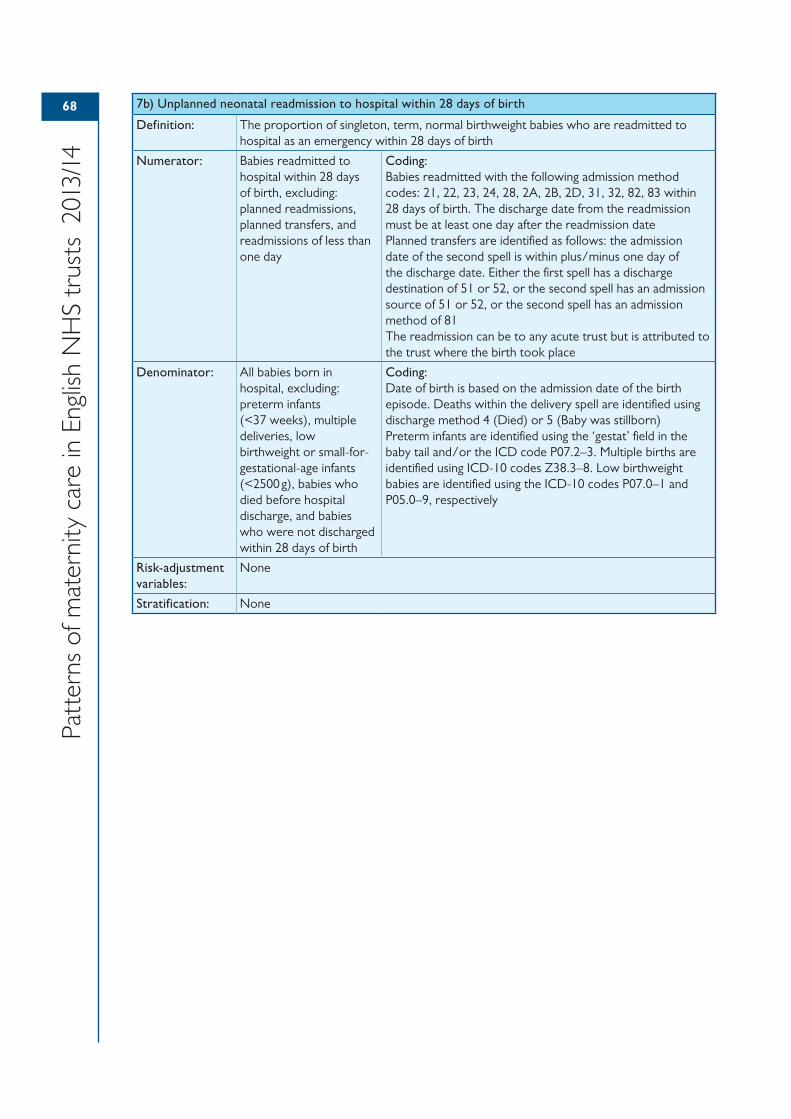
68
Patt
erns
of m
ater
nity
car
e in
Eng
lish
NH
S tr
usts
201
3/14
7b) Unplanned neonatal readmission to hospital within 28 days of birth
Definition: The proportion of singleton, term, normal birthweight babies who are readmitted to hospital as an emergency within 28 days of birth
Numerator: Babies readmitted to hospital within 28 days of birth, excluding: planned readmissions, planned transfers, and readmissions of less than one day
Coding:Babies readmitted with the following admission method codes: 21, 22, 23, 24, 28, 2A, 2B, 2D, 31, 32, 82, 83 within 28 days of birth. The discharge date from the readmission must be at least one day after the readmission datePlanned transfers are identified as follows: the admission date of the second spell is within plus/minus one day of the discharge date. Either the first spell has a discharge destination of 51 or 52, or the second spell has an admission source of 51 or 52, or the second spell has an admission method of 81The readmission can be to any acute trust but is attributed to the trust where the birth took place
Denominator: All babies born in hospital, excluding: preterm infants (<37 weeks), multiple deliveries, low birthweight or small-for-gestational-age infants (<2500 g), babies who died before hospital discharge, and babies who were not discharged within 28 days of birth
Coding:Date of birth is based on the admission date of the birth episode. Deaths within the delivery spell are identified using discharge method 4 (Died) or 5 (Baby was stillborn)Preterm infants are identified using the ‘gestat’ field in the baby tail and/or the ICD code P07.2–3. Multiple births are identified using ICD-10 codes Z38.3–8. Low birthweight babies are identified using the ICD-10 codes P07.0–1 and P05.0–9, respectively
Risk-adjustment variables:
None
Stratification: None
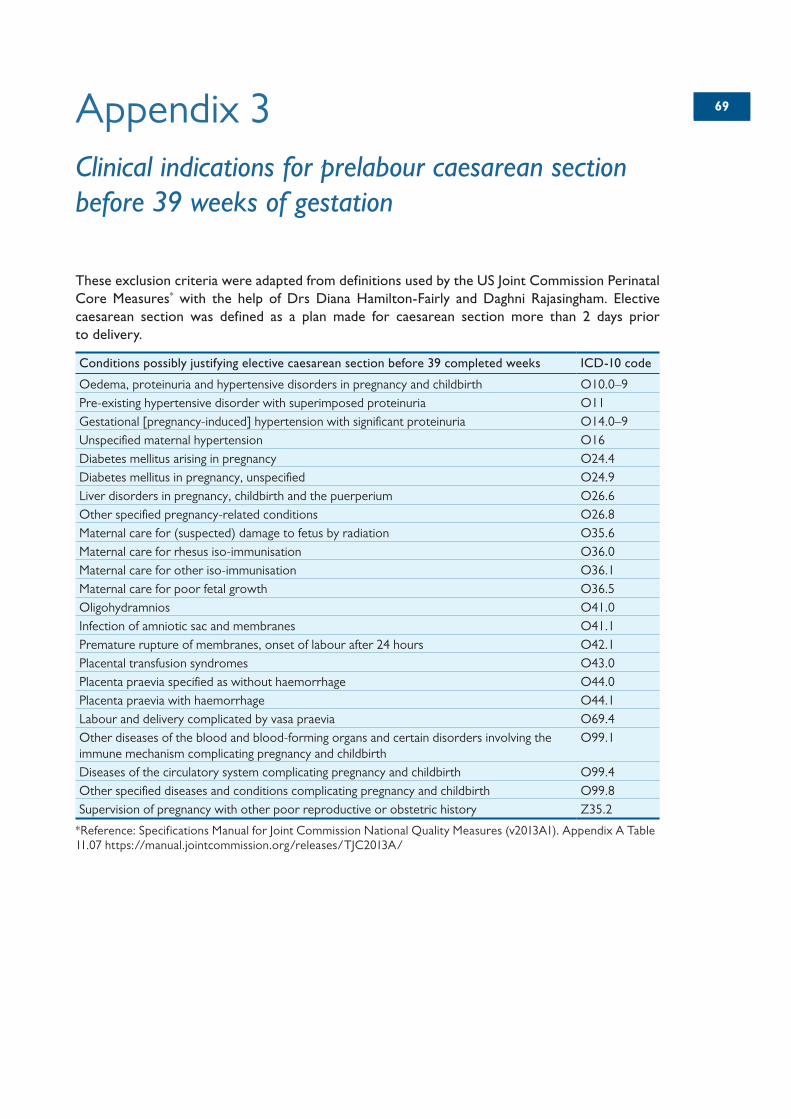
6969Appendix 3Clinical indications for prelabour caesarean section before 39 weeks of gestation
These exclusion criteria were adapted from definitions used by the US Joint Commission Perinatal Core Measures* with the help of Drs Diana Hamilton-Fairly and Daghni Rajasingham. Elective caesarean section was defined as a plan made for caesarean section more than 2 days prior to delivery.
Conditions possibly justifying elective caesarean section before 39 completed weeks ICD-10 code
Oedema, proteinuria and hypertensive disorders in pregnancy and childbirth O10.0–9Pre-existing hypertensive disorder with superimposed proteinuria O11Gestational [pregnancy-induced] hypertension with significant proteinuria O14.0–9Unspecified maternal hypertension O16Diabetes mellitus arising in pregnancy O24.4Diabetes mellitus in pregnancy, unspecified O24.9Liver disorders in pregnancy, childbirth and the puerperium O26.6Other specified pregnancy-related conditions O26.8Maternal care for (suspected) damage to fetus by radiation O35.6Maternal care for rhesus iso-immunisation O36.0Maternal care for other iso-immunisation O36.1Maternal care for poor fetal growth O36.5Oligohydramnios O41.0Infection of amniotic sac and membranes O41.1Premature rupture of membranes, onset of labour after 24 hours O42.1Placental transfusion syndromes O43.0Placenta praevia specified as without haemorrhage O44.0Placenta praevia with haemorrhage O44.1Labour and delivery complicated by vasa praevia O69.4Other diseases of the blood and blood-forming organs and certain disorders involving the immune mechanism complicating pregnancy and childbirth
O99.1
Diseases of the circulatory system complicating pregnancy and childbirth O99.4Other specified diseases and conditions complicating pregnancy and childbirth O99.8Supervision of pregnancy with other poor reproductive or obstetric history Z35.2
*Reference: Specifications Manual for Joint Commission National Quality Measures (v2013A1). Appendix A Table 11.07 https://manual.jointcommission.org/releases/TJC2013A/

70
Patt
erns
of m
ater
nity
car
e in
Eng
lish
NH
S tr
usts
201
3/14
Conditions suggesting delivery by emergency caesarean section ICD-10 code
Eclampsia O15.0–9Maternal care for unstable lie O32.0Maternal care for (suspected) central nervous system malformation in fetus O35.0Maternal care for (suspected) chromosomal abnormality in fetus O35.1Maternal care for intrauterine death O36.4Premature rupture of membranes, onset of labour within 24 hours O42.0Premature separation of placenta with coagulation defect O45.0Other premature separation of placenta O45.8–9Other antepartum haemorrhage O46.8–9Labour and delivery complicated by fetal stress [distress] O68