Embed Size (px)
Citation preview
UNITED STATESSECURITIES AND EXCHANGE COMMISSION
WASHINGTON, D.C. 20549
FORM 10-K
(Mark One)
☒ ANNUAL REPORT PURSUANT TO SECTION 13 or 15(d) OF THE SECURITIES EXCHANGE ACT OF 1934For the Fiscal Year Ended December 31, 2019.
-OR-
☐ TRANSITION REPORT PURSUANT TO SECTION 13 OR 15(d) OF THE SECURITIES EXCHANGE ACT OF 1934
Commission File Number 001-36087
PATTERN ENERGY GROUP INC.(Exact name of Registrant as specified in its charter)
Delaware 90-0893251(State or other jurisdiction of
incorporation or organization) (I.R.S. Employer
Identification No.)
1088 Sansome Street, San Francisco, CA 94111(Address of principal executive offices) (Zip Code)
Registrant’s telephone number, including area code: (415) 283-4000Securities registered pursuant to Section 12(b) of the Act:
Title of Each Class Trading Symbol Name of Each Exchange on Which RegisteredClass A Common Stock, par value $0.01 per share PEGI Nasdaq Global Select Market
Toronto Stock ExchangeSecurities registered pursuant to Section 12 (g) of the Act: None
Indicate by check mark if the registrant is a well-known seasoned issuer, as defined in Rule 405 of the Securities Act. Yes ☒ No ☐
Indicate by check mark if the registrant is not required to file reports pursuant to Section 13 or Section 15(d) of the Act. Yes ☐ No ☒
Indicate by check mark whether the registrant (1) has filed all reports required to be filed by Section 13 or 15(d) of the Securities Exchange Act of 1934 during the preceding 12 months (orfor such shorter period that the registrant was required to file such reports), and (2) has been subject to such filing requirements for the past 90 days. Yes ☒ No ☐
Indicate by check mark whether the registrant has submitted electronically every Interactive Data File required to be submitted pursuant to Rule 405 of Regulation S-T (§232.405 of thischapter) during the preceding 12 months (or for such shorter period that the registrant was required to submit such files). Yes ☒ No ☐
Indicate by check mark whether the registrant is a large accelerated filer, an accelerated filer, a non-accelerated filer, a smaller reporting company, or emerging growth company. See thedefinitions of “large accelerated filer,” “accelerated filer,” “smaller reporting company,” and "emerging growth company" in Rule 12b-2 of the Exchange Act.
Large accelerated filer ☒ Accelerated filer ☐
Non-accelerated filer ☐ Smaller reporting company ☐
Emerging growth company ☐
If an emerging growth company, indicate by check mark if the registrant has elected not to use the extended transition period for complying with any new or revised financial accountingstandards provided pursuant to Section 13(a) of the Exchange Act. ☐
Indicate by check mark whether the registrant is a shell company (as defined in Rule 12b-2 of the Exchange Act.) Yes ☐ No ☒
The aggregate market value of the voting stock and non-voting stock held by non-affiliates of the registrant based upon the last trading price of the registrant’s Class A common stock asreported on the Nasdaq Global Select Market on June 28, 2019 was approximately $2.0 billion. This excludes 10,821,578 shares of Class A common stock held by directors, officers, andPublic Sector Pension Investment Board. Exclusion of shares does not reflect a determination that persons are affiliates for any other purpose.
The registrant’s Class A common stock is listed on the Nasdaq Global Select Market and on the Toronto Stock Exchange under the symbol "PEGI."
On February 26, 2020, the registrant had 98,218,625 shares of Class A common stock, $0.01 par value per share, outstanding.
DOCUMENTS INCORPORATED BY REFERENCEThe information required by Part III (Items 10, 11, 12, 13 and 14) in this Form 10-K will be either incorporated by reference from the registrant’s definitive proxy statement for its 2020annual meeting of stockholders or provided by amendment to this Form 10-K filed with the U.S. Securities and Exchange Commission within 120 days after the end of the fiscal year to whichthis report relates.
TABLE OF CONTENTS
PART I Item 1. Business. 8Item 1A. Risk Factors. 23Item 1B. Unresolved Staff Comments. 52Item 2. Properties. 52Item 3. Legal Proceedings. 52Item 4. Mine Safety Disclosures. 54
PART II Item 5. Market for Registrant’s Common Equity and Related Stockholder Matters. 55Item 6. Selected Financial Data. 58Item 7. Management’s Discussion and Analysis of Financial Condition and Results of Operations. 59Item 7A. Quantitative and Qualitative Disclosures about Market Risk. 80Item 8. Financial Statements and Supplementary Data. 80Item 9. Changes in and Disagreements With Accountants on Accounting and Financial Disclosure. 80Item 9A. Controls and Procedures. 80Item 9B. Other Information. 81
PART III Item 10. Directors, Executive Officers and Corporate Governance. 82Item 11. Executive Compensation. 82Item 12. Security Ownership of Certain Beneficial Owners and Management and Related Stockholder Matters. 82Item 13. Certain Relationships and Related Transactions, and Director Independence. 82Item 14. Principal Accounting Fees and Services. 82
PART IV Item 15. Exhibits and Financial Statement Schedule. 83Item 16. Form 10-K Summary S-122
2
CAUTIONARY NOTICE REGARDING FORWARD-LOOKING STATEMENTS
This Annual Report on Form 10-K ("Form 10-K") contains statements that may constitute forward-looking statements. You can identify these statements by forward-lookingwords such as "anticipate," "believe," "could," "estimate," "expect," "intend," "may," "plan," "potential," "should," "will," "would," or similar words. You should readstatements that contain these words carefully because they discuss our current plans, strategies, prospects, and expectations concerning our business, operating results,financial condition, and other similar matters. While we believe that these forward-looking statements are reasonable as and when made, there may be events in the futurethat we are not able to predict accurately or control, and there can be no assurance that future developments affecting our business will be those that we anticipate. Ourforward-looking statements involve significant risks and uncertainties (some of which are beyond our control) and assumptions that could cause actual results to differmaterially from our historical experience and our present expectations or projections. Important factors that could cause our actual results to differ from those in theforward-looking statements, include but are not limited to, those summarized below and further described in Part I, Item 1A "Risk Factors:"
• our electricity generation, our projections thereof and factors affecting production, including wind, solar and other conditions, other weather conditions,availability and curtailment;
• our ability to manage exposure to project development risks;
• our ability to complete acquisitions and dispositions of power projects;
• our ability to complete construction of construction projects and transition them into financially successful operating projects;
• fluctuations in supply, demand, prices and other conditions for electricity, other commodities and renewable energy credits (RECs);
• changes in law, including applicable tax laws;
• public response to and changes in the local, state, provincial and federal regulatory framework affecting renewable energy projects, including those related totaxation, the U.S. federal production tax credit (PTC), investment tax credit (ITC) and potential reductions in Renewable Portfolio Standards (RPS) requirements;
• the ability of our counterparties to satisfy their financial commitments or business obligations;
• the availability of financing, including tax equity financing, for our power projects;
• an increase in interest rates and the discontinuation of LIBOR;
• our substantial short-term and long-term indebtedness, including additional debt in the future;
• competition from other power project developers;
• development constraints, including the availability of interconnection and transmission;
• potential environmental liabilities and the cost and conditions of compliance with applicable environmental laws and regulations;
• our ability to operate our business efficiently, manage capital expenditures and costs effectively and generate cash flow;
• our ability to retain and attract executive officers and key employees;
• our ability to keep pace with and take advantage of new technologies;
• the effects of litigation, including administrative and other proceedings or investigations, relating to power projects in development, under construction and thosein operation;
• conditions in energy markets as well as financial markets generally, which will be affected by interest rates, foreign currency exchange rate fluctuations andgeneral economic conditions;
• the effectiveness of our currency risk management program;
• the effective life and cost of maintenance of our wind turbines, solar panels and other equipment;
• the increased costs of, and tariffs on, spare parts;
• scarcity of necessary equipment;
• negative public or community response to power projects;
• the value of collateral in the event of liquidation; and
• other factors discussed under "Risk Factors."
3
On November 3, 2019, we entered into an Agreement and Plan of Merger (Merger Agreement) with Pacific US Inc. (Parent), a Delaware corporation which is anindirect wholly-owned subsidiary of Canada Pension Plan Investment Board (CPP Investments), and with Pacific BidCo US Inc.(BidCo), a Delaware corporation and awholly-owned subsidiary of Parent, pursuant to which BidCo will merge with and into us and we will be the surviving corporation and become a wholly owned subsidiaryof Parent. CPP Investment Board Private Holdings (4) Inc. has provided to us a limited guarantee of certain obligations of Parent under the Merger Agreement. Actualresults may vary materially from those expressed or implied by forward-looking statements based on a number of factors related to the pending acquisition of us, including,without limitation:
(1) risks related to the consummation of the merger, including the risks that (a) the merger may not be consummated within the anticipated time period, or at all, (b) theparties may fail to obtain shareholder approval of the Merger Agreement and (c) other conditions to the consummation of the merger under the Merger Agreement maynot be satisfied. A special meeting of our stockholders has been scheduled for March 10, 2020 to consider the merger with Parent. A shareholder advisory firm hasrecommended that shareholders vote against the merger with Parent and certain stockholders have publicly expressed opposition to the proposed transaction. Our boardof directors continues to reiterate its recommendation that stockholders vote “for” the merger with Parent. No assurances can be given that our stockholders will vote toapprove the merger with Parent;
(2) the effects that any termination of the Merger Agreement may have on us or our business, including the risks that (a) our Class A common stock price may declinesignificantly if the merger is not completed, (b) the Merger Agreement may be terminated in circumstances requiring us to pay Parent a termination fee, or (c) thecircumstances of the termination, including the possible imposition of a 12-month tail period during which the termination fee could be payable upon certainsubsequent transactions, may have a chilling effect on alternatives to the merger;
(3) the effects that the announcement or pendency of the merger may have on us and our business, including the risks that as a result (a) our business, operating results orstock price may suffer, (b) our current plans and operations may be disrupted, (c) our ability to retain or recruit key employees may be adversely affected, (d) ourbusiness relationships (including with suppliers, off-takers, and business partners) may be adversely affected, (e) we are not able to access the debt or equity marketson favorable terms, or at all, or (f) our management’s or employees’ attention may be diverted from other important matters;
(4) the effect of limitations that the Merger Agreement places on our ability to operate our business or engage in alternative transactions;
(5) the nature, cost and outcome of pending and future litigation and other legal proceedings, including proceedings related to the merger instituted against us and others;
(6) the risk that the merger and related transactions may involve unexpected costs, liabilities or delays; and
(7) other economic, business, competitive, legal, regulatory, and/or tax factors.
Readers are cautioned not to place undue reliance on forward-looking statements, which speak only as of the date hereof. We undertake no obligation to publicly update orrevise any forward-looking statements after the date they are made, whether as a result of new information, future events or otherwise.
Statistical Data
The statistical data used throughout this Form 10-K, other than data relating specifically solely to us, are based upon independent industry publications, governmentpublications, reports by market research firms or other published independent sources. We did not commission any of these publications or reports. These publicationsgenerally state that they have obtained information from sources believed to be reliable, but do not guarantee the accuracy or completeness of such information. While webelieve that each of these studies and publications is reliable, we have not independently verified such data and make no representation as to the accuracy of suchinformation.
Currency Information
In this Form 10-K, reference to "C$" and "Canadian dollars" are to the lawful currency of Canada, references to "JPY" and "Japanese Yen" are to the lawful currency ofJapan and references to "$", "US$" and "U.S. dollars" are to the lawful currency of the United States. All dollar amounts herein are in U.S. dollars, unless otherwise noted.
MEANING OF CERTAIN REFERENCES
4

Unless the context provides otherwise, references herein to “we,” “our,” “us,” “our company” and “Pattern” refer to Pattern Energy Group Inc., a Delaware corporation,together with its consolidated subsidiaries. In addition, unless the context requires otherwise, any reference in this Form 10-K to:
• “Amazon Wind” refers to Fowler Ridge IV Wind Farm LLC, a wind project located in Benton County, Indiana;
• “Armow” refers to SP Armow Wind Ontario LP, a wind project located in Kincardine, Ontario, Canada;
• “Belle River” refers to SP Belle River Wind LP, a wind project located in Lakeshore, Ontario, Canada;
• “Broadview” collectively refers to Broadview Finco Pledgor LLC (Broadview Project), consisting of Broadview Energy KW, LLC and BroadviewEnergy JN, LLC, a wind project located in Curry County, New Mexico, and Western Interconnect;
• “El Arrayán” refers to Parque Eólico El Arrayán SpA, a wind farm located in Ovalle, Chile (we disposed of our interests in El Arrayán on August 20,2018);
• “ERCOT” refers to the Electric Reliability Council of Texas;
• “FERC” refers to the U.S. Federal Energy Regulatory Commission;
• “FIT” refers to feed-in-tariff regime;
• “FPA” refers to the Federal Power Act;
• “Futtsu” refers to GK Green Power Futtsu, a solar project located in Chiba Prefecture, Japan;
• “GPG” refers to Green Power Generation GK which consists primarily of 100% ownership in Ohorayama, Otsuki and Kanagi, and a consolidatedcontrolling interest in Futtsu;
• “GPI” refers to Green Power Investment Corporation;
• “Grady” refers to Grady Wind Energy Center LLC, a wind project located in Curry County, New Mexico;
• “Grand” refers to Grand Renewable Wind LP, a wind project located in Haldimand County, Ontario, Canada;
• “Gulf Wind” refers to Pattern Gulf Wind LLC, a wind project located in Kenedy County, Texas;
• “Hatchet Ridge” refers to Hatchet Ridge Wind, LLC, a wind project located in Shasta County, California;
• “Henvey Inlet” refers to Henvey Inlet Wind LP, a wind project located in Henvey Inlet First Nation Reserve No. 2 Lands, Ontario, Canada;
• “Identified ROFO Projects” refers to projects that we have identified as development projects, owned by either of the Pattern Development Companiesand subject to our Project Purchase Rights. See Identified ROFO Projects list in Item 1. Business;
• “IPPs” refers to independent power producers;
• “ISOs” refers to independent system organizations, which are organizations that administer wholesale electricity markets;
• “ITCs” refers to investment tax credits;
• “K2” refers to K2 Wind Ontario Limited Partnership, a wind project located in Ashfield-Colborne-Wawanosh, Ontario, Canada (we disposed of ourinterests in K2 on December 31, 2018);
• “Kanagi” refers to GK Green Power Kanagi, a solar wind project located in Shimane Prefecture, Japan;
• “kWh” refers to kilowatt hour;
• “Logan's Gap” refers to Logan's Gap Wind LLC, a wind project located Comanche County, Texas;
• “Lost Creek” refers to Lost Creek Wind, LLC, a wind project located in DeKalb County, Missouri;
• “Meikle” refers to Meikle Wind Energy L.P., a wind project located in Peace Region, British Columbia, Canada;
• “MSM” refers to Mont Sainte-Marguerite Wind Farm Limited Partnership, a wind project located in Chaudiére-Appalaches, Quebec, Canada;
• “Multilateral Management Services Agreement” (MSA) refers to the amended and restated multilateral services agreement between us and each of thePattern Development Companies;
5
• “MW” refers to megawatts;
• “MWh” refers to megawatt hours;
• “Non-Competition Agreement” refers to the second amended and restated non-competition agreement between us and each of the Pattern DevelopmentCompanies in which we and each of the Pattern Development Companies have agreed to various arrangements with respect to how we may and may notcompete with each other;
• “North Kent” refers to North Kent Wind 1 LP, a wind project located in Chatham-Kent, Ontario, Canada;
• “Ocotillo” refers to Ocotillo Express LLC, a wind project located in Imperial County, California;
• “Ohorayama” refers to GK Green Power Otsuki, a wind project located in Kochi Prefecture, Japan;
• “Otsuki” refers to GK Otsuki Wind Power (formerly known as Otsuki Wind Power Corporation), a wind project located in Kochi Prefecture, Japan;
• “Panhandle 1” refers to Pattern Panhandle Wind LLC, a wind project located in Carson County, Texas;
• “Panhandle 2” refers to Pattern Panhandle Wind 2 LLC, a wind project located in Carson County, Texas;
• “Pattern Canada Operations Holdings ULC” consists primarily of 100% ownership of St. Joseph, a consolidated controlling interest in Henvey Inlet,Meikle and MSM, and a noncontrolling interest in Armow, Belle River, Grand, K2 (which we disposed of on December 31, 2018), North Kent, and SouthKent, each of which are accounted for as unconsolidated investments;
• “Pattern Development” refers to Pattern Energy Group 2 LP, a Delaware limited partnership, and, where the context so requires, its subsidiaries. We holdan approximate 29% ownership interest in Pattern Development;
• “Pattern Development Companies” refers collectively to Pattern Energy Group LP and Pattern Development and their respective subsidiaries;
• “Pattern Development Companies Purchase Rights” refer collectively to our right to acquire Pattern Energy Group LP or substantially all of its assets, ascontemplated by the Amended and Restated Purchase Rights Agreement between us and Pattern Energy Group LP (Pattern Energy Group LP PurchaseRight) and to our right to acquire Pattern Development or substantially all of its assets, as contemplated by the Amended and Restated Purchase RightsAgreement between us and Pattern Development (Pattern Development Purchase Right);
• “Pattern Energy Group LP” refers to Pattern Energy Group One LP, a Delaware limited partnership, and, where the context so requires, its subsidiaries;
• “Pattern US Operations Holdings LLC” consists primarily of 100% ownership interest of Gulf Wind, Hatchet Ridge, Lost Creek, Ocotillo, Santa Isabeland Spring Valley, and a consolidated controlling interest in Amazon Wind, Broadview, Grady, Logan's Gap, Panhandle 1, Panhandle 2, Post Rock,Stillwater and Western Interconnect;
• “Post Rock” refers to Post Rock Wind Power Project, LLC, a wind project located in Ellsworth and Lincoln counties, Kansas;
• “PPAs” refer to power purchase agreements;
• “Preferred Shares” refer to Series A Perpetual Preferred Stock issued in October 2019;
• “Project Purchase Rights” refers collectively to our right of first offer with respect to power projects that Pattern Energy Group LP decides to sell, ascontemplated by the Amended and Restated Purchase Rights Agreement between us and Pattern Energy Group LP, and our right of first offer with respectto power projects that Pattern Development decides to sell, as contemplated by the Amended and Restated Purchase Rights Agreement between us andPattern Development (in each case including any Identified ROFO Projects);
• “PSAs” or “power sale agreements” refer to PPAs and/or hedging arrangements, as applicable;
• “PSP Investments” refers to the Public Sector Pension Investment Board;
• “Purchase Rights” refers collectively to the Project Purchase Rights, and the Pattern Development Companies Purchase Rights, as contemplated by theAmended and Restated Purchase Rights Agreement between us and Pattern Energy Group LP and the Amended and Restated Purchase Rights Agreementbetween us and Pattern Development;
• “RECs” refers to renewable energy credits;
• “Riverstone” refers to Riverstone Holdings LLC;
6

• “ROFO” refers to right of first offer;
• “RPS” refers to Renewable Portfolio Standards;
• “Santa Isabel” refers to Pattern Santa Isabel LLC, a wind project located in Santa Isabel, Puerto Rico;
• “Sarbanes-Oxley Act” refers to the Sarbanes-Oxley Act of 2002;
• “South Kent” refers to South Kent Wind LP, a wind project located in Chatham-Kent, Ontario, Canada;
• “Spring Valley” refers to Spring Valley Wind LLC, a wind project located in White Pine County, Nevada;
• “St. Joseph” refers to St. Joseph Windfarm Inc., a wind project located in Montcalm, Manitoba, Canada;
• “Stillwater” refers to Stillwater Wind, LLC, a wind project located in Stillwater County, Montana;
• “Tsugaru” refers to Green Power Tsugaru GK, a wind project located in Aomori Prefecture, Japan;
• “Tsugaru Holdings” refers to Green Power Tsugaru Holdings GK, which consists primarily of 100% ownership of Tsugaru; and
• “Western Interconnect” refers to Western Interconnect LLC, a transmission line located in Curry County, New Mexico.
7
PART I
Item 1. Business.
Overview
We are a vertically integrated renewable energy company with a mission to transform the world to renewable energy. Our business consists of (i) an operating businesssegment which is comprised of a portfolio of high-quality renewable energy power projects located in many attractive markets that produces long-term stable cash flowsand (ii) ownership interests in an upstream development platform aligned with our operating business which provides us access to a pipeline of projects and potential forhigher returns through project development.
Through our operating business segment, we hold ownership interests in 28 renewable energy projects with an operating capacity that totals approximately 4.4 gigawatts(GW) which are located in the United States, Canada and Japan. Our projects use proven, best-in-class technology and have contracted to sell all or a majority of theiroutput pursuant to long-term, fixed-price PSAs. Approximately 88% of the electricity expected to be generated by our projects in which we have an owned interest will besold under PSAs that have a weighted average remaining contract life of approximately 13 years as of December 31, 2019.
We own an approximate 29% interest in Pattern Development which engages in the development of projects around the world primarily in the United States, Canada,Mexico and Japan. Pattern Development seeks to promote environmental stewardship and works closely with communities to create renewable energy projects. Ourarrangements with Pattern Development include rights of first offer, shared services, and overlap of executive officers. We have sought to align our interests to provide usaccess to a pipeline of development projects that we have an ability to acquire to grow our business, or (through our approximate 29% interest) to share in returns realizedby Pattern Development when it sells projects to third parties. Pattern Development has more than a 10 GW pipeline of development projects.
We were incorporated in the state of Delaware in October 2012 and conducted an initial public offering in October 2013.
Proposed Merger
On November 3, 2019, we entered into an Agreement and Plan of Merger (Merger Agreement) with Pacific US Inc. (Parent), a Delaware corporation which is an indirectwholly-owned subsidiary of Canada Pension Plan Investment Board (CPP Investments), and with Pacific BidCo US Inc. (BidCo), a Delaware corporation and a wholly-owned subsidiary of Parent, pursuant to which Parent has agreed to acquire us for $26.75 per share in an all-cash transaction. The transaction is expected to close shortlyfollowing receipt of shareholder approval. A shareholders’ meeting has been scheduled for March 10, 2020. CPP Investment Board Private Holdings (4) Inc. has providedto us a limited guarantee of certain obligations of Parent under the Merger Agreement.
We have filed a definitive proxy statement with the Securities and Exchange Commission and Canadian securities regulatory authorities on February 4, 2020 whichcontains additional information related to the Merger Agreement and the proposed merger.
Our Core Values and Financial Objectives
We intend to maximize long-term value for our stockholders in an environmentally responsible manner and with respect for the communities in which we operate. Ourbusiness is built around three core values of creative energy and spirit, pride of ownership, and a team-first attitude, which guide us in:
• creating a safe and high-integrity work environment for our employees;
• applying rigorous analysis to all aspects of our business in a timely, disciplined and functionally integrated manner to understand patterns in wind and solarregimes, technology developments, market trends and regulatory, financial and legal constraints; and
• working proactively with our stakeholders to address environmental and community concerns, which we believe is a socially responsible approach that alsobenefits our business by reducing operating risks at our projects.
Our financial objectives, which we believe will maximize long-term value for our stockholders, are to:
• produce stable and sustainable cash available for distribution;
• selectively grow our project portfolio and our dividend per Class A share of common stock; and
• maintain a strong balance sheet and flexible capital structure.
8

We accomplish our core values and financial objectives through delivering top-tier operating fleet performance, maintaining growth through acquisitions and developmentfrom Pattern Development Companies, continuing improvements in business strategy, and maintaining a prudent capital structure and financial flexibility, as discussedfurther below in "-Our Business Strategy."
Structure of Our Company
Our Operating Business Segment
Overview
We hold interests in 28 renewable energy projects and operate, on behalf of ourselves and others, an aggregate renewable energy portfolio of approximately 4.4 GW in theUnited States, Canada and Japan. Each of such projects use best-in-class equipment from top-tier suppliers and has contracted to sell all or a majority of its output pursuantto long-term, fixed-price PSAs. As a portfolio, as of December 31, 2019, our assets are characterized by:
• an approximate 13 year weighted average remaining contract life under our PSAs;
• 88% of electricity to be generated by our projects will be sold under PSAs;
• an ‘A+’ weighted average off-taker credit rating; and
• 4.4-year average age of fleet, primarily using GE and Siemens turbines.
We seek to own high quality projects that have gone through a rigorous review prior to construction. As a result, and in order to meet our own investment targets and ourlenders' financing criteria, our projects generally have the following characteristics:
• multiple years of on-site wind and solar data tied to one or more long-term wind and solar energy reference sources;
9

• long-term contractually secured real estate property and easement rights;
• right to firm interconnection to the electricity grid;
• all requisite construction and operating permits and regulatory approvals;
• fixed-price turbine supply and construction contracts with guaranteed completion dates;
• an operations and maintenance service program based on on-site personnel and central operations management. See “- Management, Operations, Maintenanceand Administration of Projects in which We Have an Owned Interest” below; and
• safety, environmental and community programs that support the project.
The following table provides an overview of our renewable energy projects in which we have an owned interest:
OperatingProject(1) Location
Commencement ofCommercialOperations
RatedCapacity in
MW(2) Our OwnedCapacity(3) Type
ContractedVolume(4) Counterparty
Counterparty CreditRating(5)
ContractExpiration
Pattern US Operations Holdings LLC Amazon Wind (7) Indiana 2015 150 116 PPA 100% Amazon.com, Inc. AA-/A3 2028
Broadview(7) New Mexico 2017 324 272 PPA 100% Southern California
Edison BBB/Baa2 2037
Futtsu Solar Japan 2016 29 29 PPA 100% TEPCO Energy Partner BB+/Ba1 2036
Grady New Mexico 2019 220 101 PPA 100% Sacramento Municipal
Utility District Unrated 2044
Gulf Wind (7)(8) Texas 2009 283 283 Market —% N/A(8) N/A(8) 2019
Hatchet Ridge California 2010 101 101 PPA 100% Pacific Gas & Electric D/NA 2025
Kanagi Solar Japan 2016 10 10 PPA 100% Chugoku Electric Power
Company NR/A3 2036
Logan's Gap (7) Texas 2015 200 164 PPA 58% Wal-Mart Stores, Inc. AA/Aa2 2025
Logan's Gap (7) Hedge 17% Merrill Lynch
Commodities, Inc. A-/A3 2028
Lost Creek (7) Missouri 2010 150 150 PPA 100% Associated ElectricCooperative, Inc. AA/A1 2030
Ocotillo California 2012 265 265 PPA 100% San Diego Gas & Electric BBB+/Baa1 2033
Ohorayama Japan 2018 33 33 PPA 100% Shikoku Electric Power
Company A-/NA 2038
Otsuki Japan 2006 12 12 PPA 100% Shikoku Electric Power
Company A-/NA 2026
Panhandle 1 Texas 2014 218 172 Hedge 80% Citigroup Energy Inc. BBB+/A3 2027
Panhandle 2 Texas 2014 182 75 Hedge 80% Morgan Stanley BBB+/A3 2027
Post Rock (7) Kansas 2012 201 120 PPA 100% Westar Energy, Inc. A-/Baa1 2032
Santa Isabel Puerto Rico 2012 101 101 PPA 100% Puerto Rico Electric
Power Authority NR/Ca 2032
Spring Valley Nevada 2012 152 152 PPA 100% NV Energy A/Baa2 2032
Stillwater Montana 2018 80 35 PPA 100% Northwestern BBB/Baa2 2043
Tsugaru Japan 2020 122 122 PPA 100% Tohoku Electric Power
Company Unrated 2040
10

OperatingProject(1) Location
Commencement ofCommercialOperations
RatedCapacity in
MW(2) Our OwnedCapacity(3) Type
ContractedVolume(4) Counterparty
Counterparty CreditRating(5)
ContractExpiration
Pattern Canada Operations Holdings ULC
Armow Ontario 2015 180 90 PPA 100% Independent Electricity
System Operator(6) NA/Aa3 2035
Belle River Ontario 2017 100 22 PPA 100% Independent Electricity
System Operator(6) NA/Aa3 2036
Grand Ontario 2014 149 67 PPA 100% Independent Electricity
System Operator(6) NA/Aa3 2034
Henvey Inlet Ontario 2019 300 150 PPA 100% Independent Electricity
System Operator(6) NA/Aa3 2039
Meikle British
Columbia 2017 179 91 PPA 100% BC Hydro NA/Aaa 2042
Mont Sainte-Marguerite Quebec 2018 143 73 PPA 100% Hydro-Quebec NA/Aa2 2043
North Kent Ontario 2018 100 35 PPA 100% Independent Electricity
System Operator(6) NA/Aa3 2036
South Kent Ontario 2014 270 135 PPA 100% Independent Electricity
System Operator(6) NA/Aa3 2034
St. Joseph Manitoba 2011 138 138 PPA 100% Manitoba Hydro A+/Aa2 2039
4,392 3,114
(1) Represent wind projects unless otherwise noted.(2) Rated capacity represents the maximum electricity generating capacity of a project in MW. As a result of weather and other conditions, a project will not operate at its rated capacity at all times and the
amount of electricity generated may be less than its rated capacity. The amount of electricity generated may vary based on a variety of factors.(3) Owned capacity represents the maximum, or rated, electricity generating capacity of the project in MW multiplied by our percentage ownership interest in the distributable cash flow of the project.(4) Represents the approximate percentage of a project’s total estimated average annual MWh of electricity generation contracted under power purchase agreements or hedge arrangements.(5) Reflects the counterparty’s or counterparty guarantor's corporate credit ratings issued by either Standard and Poor's (S&P) or Moody’s, or both S&P and Moody's, as of December 31, 2019.(6) Independent Electricity System Operator (IESO) acts as the settlement agent under the respective PPA.(7) Projects that are maintained through self-performance of maintenance and service activities.(8) In 2018, the Company committed to a plan to repower its Gulf Wind facility, which is expected to be completed in mid-2020. In December 2019, the Gulf Wind facility entered into a 20-year PPA with
Austin Energy for the sale of 63% of the electricity generation upon completion of such repowering.
Management, Operations, Maintenance and Administration of Operating Projects in which We Have an Owned Interest
For each of our projects in the United States and Canada, we provide management, operations and administrative services. This includes management from our 24/7operations center located in Houston, Texas, and on-site personnel at all facility sites. For our projects in Japan, management, operations and administrative services areprovided by an affiliate of GPI, an entity owned by Pattern Development.
Our projects are maintained through:
• service arrangements with reputable external third-parties;
• our self-performance of maintenance and service activities; or
• a combination of both of the above.
11
Over time, we expect to increase our operational responsibility, including self-performing maintenance and service work with our own technicians instead of utilizingservice providers, which we believe will continue to help us reduce our costs. As service arrangements expire at the facilities where we utilize external third-parties, weintend to determine on a case-by-case basis the most appropriate approach of either entering into new service arrangements with the same or a different external third-partyor transitioning to self-performance of maintenance and service activities.
Our Interest in Pattern Development
Overview
As of December 31, 2019, we own an approximate 29% interest in Pattern Development, a leading developer of renewable energy projects focusing on wind, solar, storage,and transmission with core markets in the U.S., Canada, Japan and Mexico. As discussed below, we have sought to align Pattern Development with our interests to provideus access to a pipeline of projects we have an opportunity to acquire and the benefits of potential higher returns in the upstream business of project development.
Pattern Development’s Project Development Process
Pattern Development has a development pipeline of more than 10 GW of projects. Pattern Development’s project development business involves the execution of a processwhich involves a combination of working with financing parties to obtain access to capital, managing capital obtained in a disciplined manner, and applying developmentexperience and expertise to develop a renewable energy opportunity to create value. Pattern Development believes a focus on executing complex projects provides it acompetitive advantage.
Pattern Development has established and seeks to maintain relationships with financial institutions to help provide sources of capital.
Key elements of Pattern Development’s efforts to manage capital obtained in a disciplined manner include:
• Selecting good opportunities in which to invest;
• Minimizing the capital at risk during the early development stages;
• De-risking projects through long-term offtake contracts and other arrangements so that, during the construction phase, projects have the potential to be sold (ifneeded) for good development returns; and
• Minimizing the duration of the relatively higher capital outlays that are required once a project has achieved an advanced stage.
Pattern Development has experience and expertise in each of the following areas which it applies as part of its process: origination, negotiation, political and communityengagement, permitting, scientific and strategic analysis capabilities, and risk management. Pattern Development also has established and seeks to maintain relationshipswith key contractors and offtake counterparties.
Alignment between Us and Pattern Development
We have sought to align Pattern Development’s interests and our interests, including through each of the following arrangements:
• Our investment in Pattern Development. We have the right, but not the obligation, to make capital commitments of up to $300 million to Pattern Development as apart of an approximately $1 billion of capital commitments which Pattern Development has secured from long-term focused investors. Through February 28,2020, we have invested a total of $190 million into Pattern Development, representing an approximate 29% ownership interest.
However, as a part of our arrangements with Pattern Development, while we have the right to participate in all future capital calls by Pattern Development, we arenot obligated to participate, and while our interest in Pattern Development would be diluted on a proportional basis if we chose not to participate in a capital call,(except as set forth in the following paragraph) other negative consequences (such as application of a punitive discount to our investment) would not apply.
In 2019, in order to better manage its working capital, Pattern Development entered into a subscription facility with a lender. Such facility is supported by aguarantee and pledge of the uncalled capital commitments of certain Pattern Development investors in the Riverstone investment vehicles (RS Investors). We,however, were not required to provide a guarantee, pledge, or other credit support for the subscription facility.
In the event a default or other specified event occurred under the Pattern Development subscription facility, the lender has the right to call upon these uncalledcapital commitments of the RS Investors and use proceeds to repay outstanding obligations under the subscription facility. Under this scenario, the lender wouldissue a capital call to the RS Investors but not to us. However,
12

if this occurred and the other RS Investors funded such capital call, our interests in Pattern Development would be diluted. To mitigate the possibility of suchdilution, certain loan procedures were put in place which included:
• Pattern Development is required to seek our consent before Pattern Development is permitted to request borrowings and letter of credit issuances underits subscription facility (Facility Draws);
• If we do not consent to a Facility Draw, Pattern Development would not be able to use its subscription facility; and
• If, however, we provide consent to a Facility Draw and Pattern Development makes such Facility Draw, such consent also essentially acts as acommitment from us to fund our pro rata share of the Facility Draw if ever called upon, and if we fail to fund such capital call (after having consented tosuch Facility Draw), we would be subject to a 3:1 penalty dilution.
• Project Purchase Rights. Pursuant to contractual arrangements we have with Pattern Development, we have (among other things) a right of first offer with respectto power projects that Pattern Development decides to sell. See also “- Identified ROFO Projects” below.
In the event Pattern Development does not accept the proposal we make under our rights of first offer, Pattern Development is (with limited exceptions) notpermitted to sell such project to a third-party unless the price is at least 110% of the offer price we made, and in the event Pattern Development is unable to enterinto an agreement to sell such project to a third-party at such clearing price, Pattern Development is obligated to sell such project to us at 96% of our original offerprice.
• Our Executive Officers Oversee the Business Operations of Pattern Development. Under the shared service arrangements discussed further below, our executiveofficers provide executive management services to Pattern Development. Such executive officers, who are employed and compensated by us, devote such of theirtime that is prudent to carry out those executive responsibilities.
• Shared Services Arrangements. Under the MSA, we have shared services arrangements with each of Pattern Development and Pattern Energy Group LP. Sucharrangements are intended to allow each of us, Pattern Development, and Pattern Energy Group LP to make their respective personnel available to others in thegroup to provide certain shared services. Under these arrangements, Pattern Development makes available its personnel to assist us in managing, operating,maintaining, and administering our projects in Japan.
Most of the employees engaged in project development are currently employed by Pattern Energy Group LP; however, under the MSA, each of PatternDevelopment and us have the right to require such employees to become their or our employees, respectively, who could then continue to provide shared services.Furthermore, even if Pattern Development exercised such right to cause the employees of Pattern Energy Group LP to become its employees, under the MSA, wehave the right to cause such employees at Pattern Development to become our employees.
We seek to manage conflicts of interest which arise through these arrangements. Material transactions between us and Pattern Development are subject to our corporategovernance guidelines which require prior approval of any such material transaction by the conflicts committee, which is comprised solely of independent members of ourboard of directors. The conflicts committee retains independent advisors to assist it in consideration of such transactions which may include a financial advisor and outsidecounsel. Those of our executive officers who have economic interests in Pattern Development do not participate in the negotiation of such transactions.
Identified ROFO Projects
Below is a summary of the Identified ROFO Projects that we may acquire from Pattern Development in connection with our Project Purchase Rights.
Capacity (MW)
IdentifiedROFO Projects Status Location
ConstructionStart (1)
CommercialOperations (2)
ContractType Rated (3)
PatternDevelopment
Owned (4)
Pattern Development
Sumita Late stage development Japan 2020 2022 PPA 100 55
Ishikari Late stage development Japan 2020 2023 PPA 112 112
Tohoku Project(s) Mid-stage development Japan 2021/2022 2024/2025 PPA 453 319
Corona Wind Project(s) Late stage development New Mexico 2020 2021 PPA 400 340
1,065 826
(1) Represents year of actual or anticipated commencement of construction.
13
(2) Represents year of actual or anticipated commencement of commercial operations.(3) Rated capacity represents the maximum electricity generating capacity of a project in MW. As a result of weather and other conditions, a project will not operate at its rated capacity at all times and the
amount of electricity generated may be less than its rated capacity. The amount of electricity generated may vary based on a variety of factors.(4) Pattern Development-Owned capacity represents the maximum, or rated, electricity generating capacity of the project in MW multiplied by Pattern Development's percentage ownership interest in the
distributable cash flow of the project.
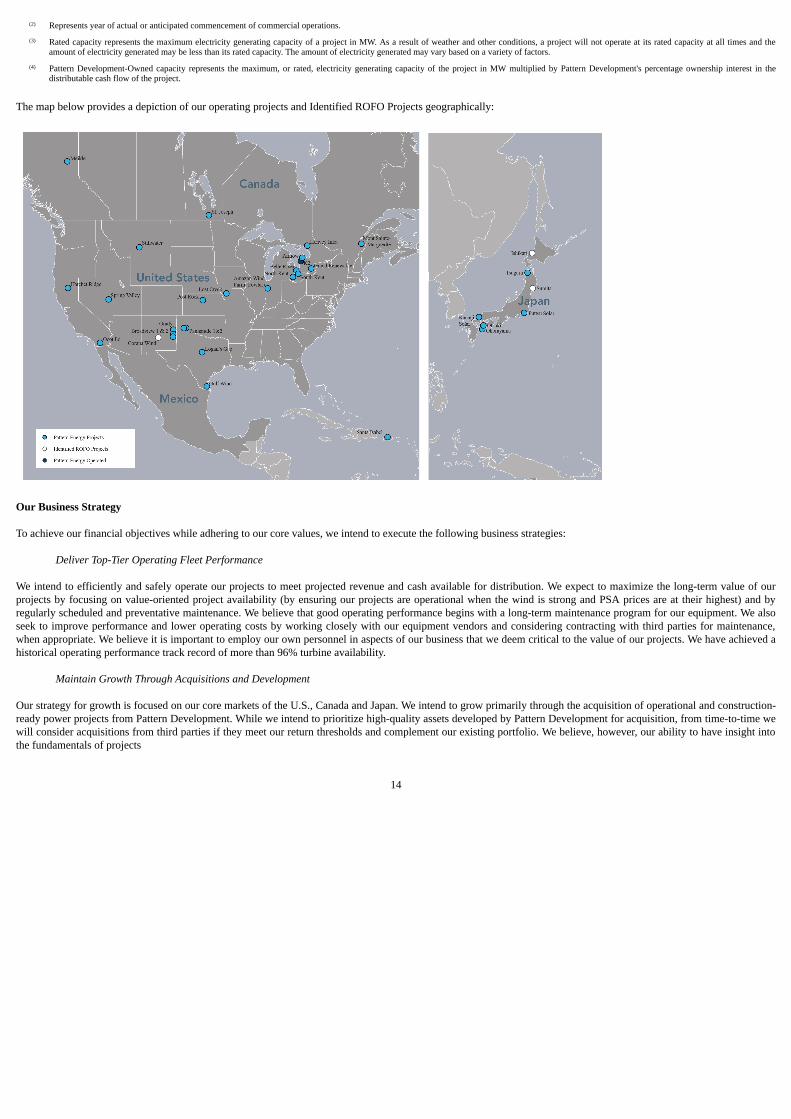
The map below provides a depiction of our operating projects and Identified ROFO Projects geographically:
Our Business Strategy
To achieve our financial objectives while adhering to our core values, we intend to execute the following business strategies:
Deliver Top-Tier Operating Fleet Performance
We intend to efficiently and safely operate our projects to meet projected revenue and cash available for distribution. We expect to maximize the long-term value of ourprojects by focusing on value-oriented project availability (by ensuring our projects are operational when the wind is strong and PSA prices are at their highest) and byregularly scheduled and preventative maintenance. We believe that good operating performance begins with a long-term maintenance program for our equipment. We alsoseek to improve performance and lower operating costs by working closely with our equipment vendors and considering contracting with third parties for maintenance,when appropriate. We believe it is important to employ our own personnel in aspects of our business that we deem critical to the value of our projects. We have achieved ahistorical operating performance track record of more than 96% turbine availability.
Maintain Growth Through Acquisitions and Development
Our strategy for growth is focused on our core markets of the U.S., Canada and Japan. We intend to grow primarily through the acquisition of operational and construction-ready power projects from Pattern Development. While we intend to prioritize high-quality assets developed by Pattern Development for acquisition, from time-to-time wewill consider acquisitions from third parties if they meet our return thresholds and complement our existing portfolio. We believe, however, our ability to have insight intothe fundamentals of projects
14
developed by Pattern Development, together with our alignment due to our ownership interest in Pattern Development, would generally make their projects more attractiveand less risky to pursue. We expect that projects we may acquire in the future will represent a logical extension of our existing business, and that incremental assumptionsof risk in what we pursue will require commensurate expectations of higher returns. As a result, our near-term growth strategy will remain focused on largely contractedcash flows with creditworthy counterparties and operating or in-construction projects.
We expect that our ownership interest in, and aligned interests with, Pattern Development will provide us with the opportunity to acquire projects that Pattern Developmentdevelops. However, through our ownership interest in Pattern Development, we can also achieve growth from Pattern Development’s sale of assets to third parties,particularly where our available liquidity is committed to other acquisitions or investments or where projects are developed outside of our core markets. We believe ourownership interest in Pattern Development provides us greater flexibility to achieve returns while continuing to support Pattern Development in the execution of itsbusiness plan.
From time to time, we may also consider the disposal of a project, particularly if we believe we can utilize funds realized from such a disposal in a more productive manneror generate a higher return on investment.
Continuous Improvements
As part of our continuous business improvement strategy, we look to create an efficient and scalable corporate organization capable of growth.
• Efficiency. We seek to improve our margins through the expansion of our self-perform maintenance initiative as service agreements expire at projects, applyingtechnological advances which emerge to deliver incremental efficiencies for turbines or projects such as blade modifications or upgrading software, each at a costthat delivers positive returns over the length of the project.
• Scale. We also intend to improve our existing assets and business processes to reduce the marginal cost of overhead. We can achieve this through areas such assystem enhancements and increased automation. We have implemented new systems as a result of this review which we expect will deliver incrementalefficiencies and margin expansion from overhead savings and improved workflow. We intend to continue to manage overhead costs though additional back officeoptimization.
Maintain a Prudent Capital Structure and Financial Flexibility
We intend to maintain a conservative approach to our capital structure to protect our ability to meet our financial obligations, pay our regular dividends and to fundinvestments for future growth. Power projects by their nature require significant capital investment, and as a result, we seek to protect our business through carefulmanagement of our capital structure.
The foundation of our capital structure is built on project finance arrangements intended to ensure risk segmentation across our large project portfolio, and our practice hasbeen to structure our project finance arrangements comprised of a mix of debt, tax equity and equity to conform to investment grade-like credit standards. Specifically, weseek to structure our project finance arrangements to:
• match assets with liabilities based on a project’s off-take tenor and currency denomination;
• fix or hedge project debt on a long-term basis;
• amortize our third-party project finance capital within the tenor of the off-take arrangement; and
• apply conservative debt service coverage or tax equity structuring standards.
Our project capital structure is supplemented with a corporate capital layer that primarily relies on equity capital. Our corporate indebtedness is modest, and intended toensure broad capital access. In addition, our strategic partnership with PSP Investments is intended to expand capital access and improve flexibility in managing capitalrequirements. See “- Other Key Relationships - PSP Investments” below.
We seek to ensure financial flexibility and stability through our corporate revolving credit facility, maturity staging, minimization of interest rate exposure, and maintenanceof our credit ratings. We intend to use our available liquidity strategically, with a priority placed on our available liquidity for committed project acquisitions or investmentcommitments. Our foreign currency denominated project dividends are further managed through a short-to-long term foreign exchange program. We believe this approach,together with a strategic consideration of project-level financial restructuring and recapitalization opportunities, will contribute to our ability to maintain and, over time,increase our cash available for distribution.
15
Work Closely with Our Stakeholders
We believe that close working relationships with our various stakeholders, including suppliers, PSA counterparties, regulators, the local communities where we are located,environmental organizations, as well as with Pattern Development and other developers, allow us to better support our existing projects and will help us access futurerenewable energy project opportunities.
Industry
Wind and solar energy are the two fastest growing sources of electricity generation in North America and globally over the past decade, and projections by the InternationalEnergy Agency indicate renewable energy will continue to grow at a faster rate than fossil fuels over the next two decades. Corporations signed contracts to purchase 44%more renewable energy globally in 2019 compared to 2018, bringing the record total to approximately 20 GW of renewable energy PPAs. Membership in the RE100, whichis a global initiative with more than 200 companies making a commitment to go '100% renewable' by an average target date of 2028, grew by over a third during 2019.
Falling technology costs and strong public support for renewable energy contributes to the trend of increasing demand from corporate purchasers and favorable governmentpolicy. The 13th annual report by Lazard on the levelized cost of energy for electricity generating technologies shows a continued decline in the cost of utility-scale windand solar energy, with unsubsidized costs at or below the marginal costs of conventional generation under certain circumstances. Given increased demand, falling costs, andthe inherent stability of the cost of renewable energy sources, we believe that our markets present substantial growth opportunities. We require a relatively small share of alarge market to meet our growth objectives, and we believe we can achieve growth through the acquisition of operational and construction-ready projects from PatternDevelopment and other third parties.
Our Markets
The United States of America
The United States remains a strong growth market for renewable energy and a target for clean energy investment, attracting nearly a fifth of the global total over the 2004-2018 time frame. In 2018, with approximately $64 billion in total clean energy investment, the U.S. only trailed China. The percent of electricity generation from windenergy in the U.S. grew to approximately 7% at the end of 2018, up from 6% in 2017, and electricity generation from photovoltaic (PV) solar was approximately 2%.Electricity generation from coal fell to 27% in 2018, down from 44% in 2009, while the share of natural gas generation grew to 35% from 24% during the same period.
Government Incentives and Tax Credits
Renewable energy sources in the U.S. have benefited from various federal and state governmental incentives, such as PTCs and ITCs. Under the ConsolidatedAppropriations Act, federal PTCs and ITCs for wind energy were extended with a five-year phase down for wind projects commencing construction after December 31,2014 and before December 31, 2019. In the final month of 2019, the PTCs for onshore wind projects were extended through the end of 2020. Notwithstanding the benefitsof the tax incentives, the continued reduction in levelized cost of energy provides an environment in which renewables are expected to be highly competitive relative toconventional generation resources. We expect to become less impacted by and less dependent on these forms of government support.
Bloomberg New Energy Finance finds onshore wind to have the lowest levelized cost of electricity range in the U.S. with PV solar not far behind and projected to overtakeonshore wind as the lowest-cost electricity fuel source in the next several years. The falling costs of wind and solar technology have contributed to accelerating demandfrom corporate purchasers. In 2019, corporations in the U.S. signed PPAs totaling approximately 14 GW of renewable energy, more than all global activity in the previousyear.
State RPSs also continue to drive demand for utility-scale renewable energy. Roughly a 50% increase in renewable energy generation is needed by 2030 to meet state RPSdemand, averaging approximately 5 GW of additions per year. More than half of all RPS states have raised their overall RPS targets or carve-outs since initial RPSadoption. Since the start of 2018, 10 states increased their RPS targets, while New York established an offshore wind procurement target.
Japan
The Japanese market is one of the world’s largest electricity markets, with the country ranking fourth in the world in 2018 for clean energy transactions and for newinstalled renewable capacity. Out of a total 290 GW capacity installed at the end of 2018, generating 1,090,074 GWh, onshore wind and utility-scale PV solar accounted forapproximately 16% of installed capacity and only approximately 8% of energy generation, representing a large opportunity for continued deployment of wind and solar.The Japanese government has placed a greater emphasis on the development of renewable resources following the nuclear meltdown at the Fukushima Daiichi plant in2011.
16

The Japanese government set a target in 2015 to have 22% to 24% of its generation come from renewable energy by 2030. In 2018, the Japanese government released itsFifth Strategic Energy Plan that unites the 2030 energy targets and a 2050 energy scenario aimed at decarbonization. The plan designates renewable energy as a corefoundation of the energy generation mix for meeting the carbon reduction scenarios of 2050. The FIT program originally established in 2012 that offered fixed-term, fixed-price contracts for up to 20 years to renewable power projects remains in place. While the predetermined fixed-price for large solar projects has been replaced with areverse auction system, the tariff price for onshore wind power remains predetermined at JPY19 per kWh for FY2019 but will reduce by a further JPY1 per kWh inFY2020 (ending March 2021), after which it is expected to also be replaced with a reverse auction system.
In November 2018, the Japanese government passed a new law allowing offshore wind projects to be developed in the open sea outside of port areas and associated rulesand regulations along with development zone designations. Like solar, the tariff price will be determined through a reverse auction mechanism. Previously awardedoffshore projects in port areas will continue to be eligible for the fixed rate of JPY36 per kWh. As such, there remains a strong incentive for continued investment in theJapanese renewables market, particularly for onshore projects and now additionally with offshore projects due to the passage of the new open sea offshore wind law.
Canada and Other
Canadian clean energy policy is executed mostly at the provincial level. Ontario remains Canada’s leading market for wind energy with 5,076 MW of installed wind energygenerating capacity as of December 2018, accounting for nearly 40% of the country’s total installed capacity. We are the largest operator of installed wind capacity in thecountry with 1,529 MW in operational contracts, and have capitalized on these operating assets through refinancing opportunities that bolster strong existing contractedrevenue streams. Potential growth opportunities exist through Saskatchewan's 30% wind generation target for 2020, which would add approximately 2 GW of new windcapacity, and competitive pricing and strong public support of wind energy in Alberta.
Pattern Development continues to develop and construct renewable energy projects in Mexico. In the event of third-party sales, we may realize benefits due to ourownership interest in Pattern Development.
Environmental, Social and Governance
We are committed to protecting our workforce and the public, to respecting the communities and cultures where we develop and operate projects, and to minimizing ourenvironmental impacts. We have three value statements to emphasize these commitments and each one has an underlying management system - the Safety ManagementSystem, the Community Management System, and the Environmental Management System - that provides a programmatic foundation to meeting these commitments. Ourmanagement systems are linked on our sustainability website located at www.patternenergy.com/invest/sustainability. In 2019, we released our 2018 Pattern EnergySustainability Report which is located at www.patternenergy.com/invest/esg-report that details more of our environmental, social and governance values and achievements.
Other Key Relationships
Pattern Energy Group LP
Pattern Energy Group LP is a legacy entity that was involved in the original formation of our company. It was also the sponsor entity at the time of our initial publicoffering and, until 2018, owned an equity interest in our company. Together with us and Pattern Development, Pattern Energy Group LP is a party to the MSA. See “- OurInterest in Pattern Development - Alignment of Interest between Us and Pattern Development - Shared Services Arrangements” above. Pattern Energy Group LP hasnotified us of its intention to wind down operations in an orderly manner.
17
PSP Investments
In June 2017, we entered into a strategic joint venture agreement with PSP Investments. The joint venture agreement provides that PSP Investments has the right to co-invest alongside us, up to an aggregate amount of approximately $500 million, in energy projects we may acquire from the Pattern Development Companies, cooperatewith us to complete third-party acquisitions (including possibly arranging for or providing bridge loans and construction financing), and we may add a person that has beendesignated by PSP Investments to our board of directors. This relationship provides us the ability to increase our portfolio with limited capital investment. Together withPSP Investments, we acquired each of Belle River, Meikle and MSM from Pattern Energy Group LP and Grady and Stillwater from Pattern Development. In addition, in2017, we sold a portion of our interest in the Panhandle 2 wind project to PSP Investments. PSP Investments is also an indirect investor in Pattern Development. PSPInvestments does not hold voting rights in Pattern Development. Additionally, as of February 26, 2020, PSP Investments holds approximately 9.5% of our outstandingClass A common stock.
Competitive Strengths
We believe we compete with other industry participants by having a high quality portfolio of projects which are positioned to generate stable long-term cash flows withaccess to low-cost project-level debt and strong stakeholder relationships. Further, we believe our investment in Pattern Development provides us with a source of attractiveinvestment returns, as well as access to a pipeline of acquisition opportunities that because of our Project Purchase Rights are generally not otherwise available to thebroader market, unless the project is not attractive to us.
Our business benefits from high quality assets that are broadly diversified across markets, regulatory regimes and counterparties, making it less dependent on performanceof single assets or areas. Our operating platform and associated management team provide us with a world class operations platform with experience in how to efficientlyrun and continuously optimize our operating business. This experience and knowledge in turn is used to facilitate enhanced pricing and improved costing on new assets thatare being developed by Pattern Development, thereby creating a continuous cycle of knowledge transfer.
Our management team is highly experienced in renewables development with a good reputation in the industry that has helped to produce many successes in dealexecution, financing and development and construction management.
We compete with other wind and solar power, infrastructure funds and renewable energy companies, as well as conventional power companies, to acquire profitableconstruction-ready and operating projects. In addition, competitive conditions may be substantially affected by various forms of energy legislation and regulationconsidered from time to time by federal, state, provincial and local legislatures and administrative agencies.
Customers
We sell our electricity and RECs primarily to local utilities under long-term, fixed-price PPAs or, in limited instances, local liquid ISO markets. For the year endedDecember 31, 2019, customers representing over 10% of our total revenue were San Diego Gas & Electric and Southern California Edison Company with 11% and 11%,respectively.
Suppliers
There are a limited number of turbine equipment suppliers, including General Electric, Vestas and Siemens-Gamesa; however, we believe that current manufacturingquality and competitive dynamics are strong and that parts and supply capacity is adequate. Our equipment supply strategy is largely based on maintaining strongrelationships with leading equipment suppliers to secure our supply needs.
Other important suppliers include global and regional engineering, procurement (EPC) and construction contractors with whom we contract to perform civil engineering,electrical work and other infrastructure construction for our projects.
While we do self-perform some turbine service and maintenance activities, a significant amount of our service work is currently performed by the original equipmentmanufacturers, primarily Siemens-Gamesa and General Electric, as well as other qualified independent service providers. All our service providers are generally wellrecognized in the renewable service business. While we expect over time to increase self-perform activities, we do expect to continue to utilize both original equipmentmanufacturers and qualified independent service companies for a substantial amount of our service and maintenance needs. See “- Our Operating Projects - Management,Operations, Maintenance and Administration of Our Operating Projects” above.
18
Regulatory Matters
Our operations are subject to regulation by various federal and state government agencies, including, but not limited to, the following:
U.S. Federal Energy Regulatory Commission (FERC)
Our current projects in operation in the United States are operating as Exempt Wholesale Generators (EWGs) as defined under the Public Utility Holding Company Act of2005, as amended, (PUHCA) and therefore are exempt from certain regulation under PUHCA. Certain of our operating projects in the United States are, however, publicutilities under the Federal Power Act subject to rate regulation by FERC. Future projects in the United States will also likely be subject to such rate regulation once they areplaced into service. Our projects in the United States that are subject to FERC rate regulation are required to obtain acceptance of their rate schedules for wholesale sales ofenergy (i.e., not retail sales to consumers), capacity and ancillary services, including their ability to charge “market-based rates.”
Independent System Operators (ISOs)
Most of our North American projects are located in regions in which the wholesale electric markets are administered by ISOs and Regional Transmission Organizations(RTOs).
North American Electric Reliability Corporation
All of our current operating projects located in North America are also subject to the reliability standards of the North American Electric Reliability Corporation (NERC).If we fail to comply with the mandatory reliability standards, we could be subject to sanctions, including substantial monetary penalties.
Regulatory Matters - Canada
All of our current operating projects in Canada are subject to exclusive provincial regulatory authority with respect to the generation and production of electricity, whichvaries across provincial jurisdictions. In Canada, activities related to owning and operating wind projects and participating in wholesale and retail energy markets aremostly regulated at the provincial level. In Ontario, for example, electricity generation facilities must be licensed by the Ontario Energy Board and may also be required tocomplete registrations and maintain market participant status with the IESO, in which case they must agree to be bound by and comply with the provisions of the marketrules for the Ontario electricity market as well as the mandatory reliability standards of the NERC.
Regulatory Matters - Japan
All of our current operating projects in Japan are governed by the Ministry of Economy, Trade and Industry (METI). METI has administrative jurisdiction and is theauthority that grants licenses to transmission and distribution operators, administers the registration of retailers, and the filings of power generators. The Electricity and GasMarket Surveillance Commission was established by the METI to conduct monitoring of the electricity market and enforces strict regulations to ensure neutrality of theelectricity market. The Agency for Natural Resources and Energy, a part of the METI, is responsible for Japan's policies regarding energy and natural resources.
Environmental Regulation
Our operations are required to comply with various environmental regulations in each of the jurisdictions in which we operate. These existing and future laws andregulations may impact existing and new projects, require us to obtain and maintain permits and approvals, comply with all environmental laws and regulations applicablewithin each jurisdiction and implement environmental programs and procedures to monitor and control risks associated with the construction, operation anddecommissioning of regulated or permitted energy assets, all of which involve a significant investment of time and resources. Existing initiatives and rules, some of whichcould potentially have a material effect (either positive or negative) on us, are as follows:
19

Avian/Bat Regulations and Wind Turbine Siting Guidelines
We are subject to numerous environmental regulations and guidelines related to threatened and endangered species and their habitats, as well as avian and bat species, forthe ongoing operations of our facilities. Environmental laws in the U.S., including the Endangered Species Act, the Migratory Bird Treaty Act, and the Bald and GoldenEagle Protection Act as well as similar environmental laws in Canada (such as the federal Species at Risk Act and the Migratory Birds Convention Act and the OntarioEndangered Species Act, 2007), among others, provide for the protection of migratory birds, eagles and bats and endangered species of birds and bats and their habitats. Inaddition to regulations, voluntary wind turbine siting guidelines established by the U.S. Fish and Wildlife Service set forth siting, monitoring and coordination protocolsthat are designed to support wind development in the U.S. while also protecting both birds and bats and their habitats.
Regulation of Greenhouse Gas (GHG) Emissions
The U.S. Congress and certain states and regions, as well as the Government of Canada and its provinces, have taken and continue to take certain actions, such as finalizingregulation or setting targets and goals, regarding the reduction of GHG emissions and the increase of renewable energy generation.
Environmental Matters— Domestic
We are required to obtain a range of environmental permits and other approvals to build and operate our projects, including, but not limited to, those described below fromU.S. federal, state and local governmental authorities. In addition to being subject to these regulatory requirements, we could experience and have experienced significantopposition from third parties when we initially apply for permits or when there is an appeal proceeding after permits are issued. The delay or denial of a permit or theimposition of conditions that are costly or difficult to comply with can impair or even prevent the development of a project or can increase the cost so substantially that theproject is no longer attractive to us.
Federal Clean Water Act
Frequently, our U.S. projects are located near wetlands, and we are required to obtain permits under the Clean Water Act for the discharge of dredged or fill material intowaters of the United States, including wetlands and streams. The Clean Water Act also requires that we mitigate any loss of wetland functions and values that accompaniesour activities, obtain permits under the Clean Water Act for water discharges, such as storm water runoff associated with construction activities, and to follow a variety ofbest management practices to ensure that water quality is protected and impacts are minimized.
Federal Bureau of Land Management Permits
As some of our U.S. projects are located on lands administered by the Bureau of Land Management, we are required to obtain rights-of-way from the Bureau of LandManagement. The Bureau of Land Management encourages the development of wind power within acceptable areas, consistent with Environmental Policy Act of 2005 andthe Bureau of Land Management’s energy and mineral policy.
National Environmental Policy Act
Our U.S. projects may also be subject to environmental review under the U.S. National Environmental Policy Act (NEPA) which requires federal agencies to evaluate theenvironmental impact of all "major federal actions" significantly affecting the quality of the human environment. The granting of a land lease, a federal permit or similarauthorization for a major development project, or the interconnection of a significant private project into a federal project generally is considered a "major federal action"that requires review under NEPA. As part of the NEPA review, the federal agency considers a broad array of environmental impacts, including impacts on air quality, waterquality, wildlife, historical and archaeological resources, geology, socioeconomics and aesthetics and alternatives to the project. A federal agency may decide to deny apermit based on its environmental review under NEPA, though in most cases a project would be redesigned to reduce impacts or agree to provide some form of mitigationto offset impacts before a denial is issued.
National Historic Preservation Act
U.S. federal agencies consider a project’s impact on historical or archeological resources under the U.S. National Historic Preservation Act and may require us to conductarcheological surveys or take other measures to protect these resources. The National Historic Preservation Act requires federal agencies to evaluate the impact of allfederally funded or permitted projects on historic properties (buildings, archaeological sites, etc.)
20

Other State and Local Programs
In addition to federal requirements, our U.S. projects, and any future U.S. projects we may acquire, are subject to a variety of state environmental review and permittingrequirements. Many states where our projects are located, or may in the future be located, have laws that require state agencies to evaluate a broad array of environmentalimpacts before granting state permits. The state environmental review process often resembles the federal NEPA process and may be more stringent than the federal review.Our projects also often require state law based permits in addition to federal permits.
Our projects also are subject to local environmental and regulatory requirements, including county and municipal land use, zoning, building and transportationrequirements. Local or state regulatory agencies may require modeling and measurement of permissible sound levels in connection with the permitting and approval of ourprojects. Local or state agencies also may require us to develop decommissioning plans for dismantling the project at the end of its functional life and establish financialassurances for carrying out the decommissioning plan.
Environmental Matters—Canada
We are required to obtain a range of environmental permits and other approvals to build and operate our Canadian projects, including, but not limited to, those describedbelow from applicable Canadian federal, provincial, First Nations and municipal governmental authorities. In addition to being subject to these regulatory requirements, wecould experience opposition from third parties, including, but not limited to, environmental non-governmental organizations, neighborhood groups, municipalities and FirstNations when the permits were initially applied for or when there is an appeal proceeding after permits are issued. The delay or denial of a permit or the imposition ofconditions that are costly or difficult to comply with can impair or even prevent the development of a project or can increase the cost so substantially that the project is nolonger attractive to us.
Ontario Renewable Energy Approvals
Projects in Ontario are generally subject to Ontario’s Environmental Protection Act, which requires proponents of significant renewable energy projects to obtain aRenewable Energy Approval (REA). The REA application requires a variety of studies on environmental, archeological and heritage issues. Significant public consultation,as well as consultation with indigenous communities, is also required. Before issuing a REA, the Ontario Ministry of the Environment, Conservation and Parks (MOECP)evaluates a broad range of potential impacts, including on wildlife, wetlands and water resources, communities, scenic areas, species and heritage resources, as well asimpacts on people. This review can be time consuming and expensive, and an approval can be rejected or approved with conditions that are costly or difficult to complywith. REAs are also subject to appeal by third parties and can result and have resulted in lengthy appeal tribunal hearings. An exception to the requirement to obtain a REApermit as described above exists where the proposed project is being developed, constructed, and operated on federal reserve lands under the jurisdiction of a First Nation.In this circumstance, the First Nation may impose an environmental protection regime which would closely mirror the REA process, but it would be administered andmonitored for compliance by the First Nation as opposed to MOECP.
Quebec Environmental Impact Assessment
Quebec`s Environmental Impact Assessment (EIA) is a required permit for wind energy projects with a nameplate capacity above 10 MW. The EIA requires a variety ofstudies related to environmental, archeological and heritage issues. Significant public consultation, as well as consultation with indigenous communities, is also required.The culmination of this permitting process is the issuing of a project specific decree by the provincial council of ministers which may include conditions related to theconstruction and operation of a project that may be costly or difficult to comply with. Before issuing the decree, the Quebec Ministry of Environment evaluates a broadrange of potential impacts, including on wildlife, wetlands and water resources, communities, scenic areas, species and heritage resources, as well as impacts on people.
Quebec Commission for the Protection of Agricultural Land
In addition to the EIA process, the other major permit in Quebec is granted by the Quebec Commission for the Protection of Agricultural Land. This permit is only requiredon land that is zoned agricultural. This permitting body may impose conditions on proponents to minimize footprints during both the construction phase and the operationsphase.
21
Manitoba Environment Act
The Manitoba Environment Act requires proponents of significant projects to submit a proposal with the Manitoba Conservation Environmental Assessment & LicensingBranch, and to comply with Manitoba’s environmental assessment process under the Environment Act. This process will consider a similar range of impacts on theenvironment, the heritage and scenic values of an area and on people, communities and wildlife as the Ontario process, and brings with it similar risks.
British Columbia Environmental Assessment Act
When a major project is proposed in British Columbia, it must undergo an environmental assessment (EA) process. This process ensures that any potential environmental,economic, social, heritage and health effects that may occur during the lifetime of a major project are thoroughly assessed. The EA process is managed by theEnvironmental Assessment Office (EAO), a regulatory agency within the provincial government that works with and seeks input from environmental scientists, indigenousgroups, proponents, the public, local governments, and federal and provincial agencies to ensure adverse effects are considered.
The EAO follows a defined process in the Environmental Assessment Act to conduct the assessment of a major project. The outcome of the process is the preparation of adetailed Assessment Report which is reviewed by the province for a determination as to whether the proposed project should proceed.
Endangered Species Legislation
Our Canadian renewable energy projects may be subject to endangered species legislation, either federally or provincially, which prohibits and imposes stringent penaltiesfor harming endangered or threatened species and their habitats. Our projects may also be subject to the Migratory Birds Convention Act, which protects the habitat ofmigratory species, and which may also trigger federal "Species at Risk" requirements. Because the operation of wind turbines may result in injury or fatalities to birds andbats, avian and bat risk assessments are generally required both prior to permits being issued for projects and after commercial operations. Permits, authorizations oragreements may also be required under federal or provincial endangered species legislation if any species that are listed as endangered or threatened, or their habitats, areaffected.
Other Approvals
Our Canadian projects, and any future projects we may acquire, are subject to a variety of other federal, provincial and municipal permitting and zoning requirements. Mostprovinces where our projects are located or may be located have laws that require provincial agencies to evaluate a broad array of environmental impacts before grantingpermits and approvals. These agencies evaluate similar issues as the permitting regimes above, including impact on wildlife, historic sites, aesthetics, wetlands and waterresources, scenic areas, endangered and threatened species and communities. In addition, federal government approvals dealing with, among other things, aeronautics,fisheries, navigation or species protection may be required and could in some cases trigger additional environmental assessment requirements. Additional requirementsrelated to the permitting of transmission lands may be applicable in some cases. Our projects are also subject to certain municipal requirements, including land use andzoning requirements, as well as requirements for building permits and other municipal approvals that can be difficult or costly to comply with and impair or prevent thedevelopment of a project.
Environmental Matters - Japan
We are required to obtain a range of environmental permits and other approvals from various governmental agencies in Japan, including at the prefectural and municipallevel, to develop, construct and operate our projects, including, but not limited to, the items described below.
Ministry of the Environment
The Ministry of the Environment is a Cabinet-level ministry within the government of Japan that is responsible for domestic and global environmental conservation,pollution control and nature conservation.
Environmental Impact Assessment Law
The Environmental Impact Assessment Law is applied to wind power projects that may significantly impact the environment. Depending on the size of the project, anenvironmental impact assessment would be required by the project owner prior to development with the intent of incorporating environmental considerations into theproject design.
22
Management, Disposal and Remediation of Hazardous Substances
We own and lease real property and may be subject to requirements regarding the storage, use and disposal of petroleum products and hazardous substances, including spillprevention, control and counter-measure requirements. If our owned or leased properties are contaminated, whether during or prior to our ownership or operation, we couldbe responsible for the costs of investigation and cleanup and for any related liabilities, including claims for damage to property, persons or natural resources. Thatresponsibility may arise even if we were not at fault and did not cause or were not aware of the contamination. In addition, waste we generate is at times sent to third-partydisposal facilities. If those facilities become contaminated, we and any other persons who arranged for the disposal or treatment of hazardous substances at those sites maybe jointly and severally responsible for the costs of investigation and remediation, as well as for any claims for damage to third parties, their property or natural resources.
Employees
As of December 31, 2019, we had approximately 228 full-time employees. None of our employees are represented by a labor union or covered by any collective bargainingagreement.
Available Information
We make our United States Securities and Exchange Commission (SEC) filings, including our annual report on Form 10-K, quarterly reports on Form 10-Q, current reportson Form 8-K, and any amendments to those reports, available free of charge on our website, www.patternenergy.com, as soon as reasonably practicable after thosedocuments are electronically filed with or furnished to the SEC. The information and materials available on our website are not incorporated by reference into this Form 10-K. The SEC maintains a website that contains reports, proxy and information statements, and other information regarding registrants that file electronically with the SEC atwww.sec.gov.
Item 1A. Risk Factors.
RISK FACTORS
You should carefully consider the following risks, together with other information provided to you in this Form 10-K. If any of the following risks were to occur, ourbusiness prospects, financial condition, results of operations and liquidity could be materially adversely affected. In that case, we might have to decrease, or may not beable to pay, dividends on our Class A shares, the trading price of our Class A shares could decline and you could lose all or part of your investment. The risks describedbelow are not the only risks facing our company. Risks and uncertainties not currently known to us or that we currently deem to be immaterial also may materiallyadversely affect our business prospects, financial condition and results of operations and liquidity.
Risks Related to the Agreement and Plan of Merger We Have Entered Into
The announcement and pendency of our agreement to be acquired could have an adverse effect on our business.
On November 3, 2019, we entered into an Agreement and Plan of Merger (Merger Agreement) with Pacific US Inc. (Parent), a Delaware corporation which is an indirectwholly-owned subsidiary of Canada Pension Plan Investment Board (CPP Investments), and with Pacific BidCo US Inc.(BidCo), a Delaware corporation and a wholly-owned subsidiary of Parent, pursuant to which BidCo will merge with and into us and we will be the surviving corporation and become a wholly owned subsidiary ofParent. CPP Investment Board Private Holdings (4) Inc. has provided to us a limited guarantee of certain obligations of Parent under the Merger Agreement. Upon theterms and subject to the conditions set forth in the Merger Agreement, at the effective time of the merger, each share of our Class A common stock issued and outstandingimmediately prior to the effective time of the merger will be cancelled and automatically converted into the right to receive $26.75 in cash, without interest and subject toany applicable withholding taxes.
Uncertainty about the effect of the proposed merger on our employees, suppliers, off-takers, and business partners may have an adverse effect on our business andoperations that may be material to our company. Our employees may experience uncertainty about their roles following the merger. There is no assurance we will be able toattract and retain key talent, including senior leaders, to the same extent that we have previously been able to attract and retain employees. Any loss or distraction of suchemployees could have a material adverse effect on our business and operations. In addition, we have diverted, and will continue to divert, significant management resourcestowards the completion of the merger, which could materially adversely affect our business and operations.
23
While the proposed merger is pending, our suppliers, off-takers, or business partners may delay or defer certain business decisions with respect to us, or seek to change orrenegotiate their relationships with us as a result of the merger. Such parties may also experience uncertainty associated with the merger which may affect current or futurebusiness relationships with us. Uncertainty may cause such parties to be more cautious in their arrangements with us, and such parties may seek to change existing businessrelationships. During this period, we may also face challenges in accessing debt or equity markets on favorable terms, or at all. Any such effects could result in an adverseeffect on our business, operations and financial condition in a way that may be material to our company, regardless of whether the merger is completed.
Pursuant to the terms of the Merger Agreement, we are subject to certain restrictions on the conduct of our business, including the ability in certain cases to enter intocontracts, acquire or dispose of assets, incur indebtedness or incur capital expenditures, until the merger becomes effective or the Merger Agreement is terminated. Theserestrictions may prevent us from taking actions with respect to our business that we may consider advantageous and result in our inability to respond effectively tocompetitive pressures and industry developments, and may otherwise harm our business and operations.
The failure to complete the merger could adversely affect our business and financial condition.
Completion of the merger with Parent is subject to several conditions beyond our control that may prevent, delay or otherwise adversely affect its completion in a materialway, including the approval of our stockholders. A special meeting of our stockholders has been scheduled for March 10, 2020 to consider the merger with Parent. Ashareholder advisory firm has recommended that shareholders vote against the merger with Parent and certain stockholders have publicly expressed opposition to theproposed transaction. Our board of directors continues to reiterate its recommendation that stockholders vote “for” the merger with Parent. No assurances can be given thatour stockholders will vote to approve the merger with Parent.
If the merger or a similar transaction is not completed (or CPP Investment Board Private Holdings (4) Inc. does not fulfill its obligations under the limited guarantee it hasprovided of the obligations of Parent under the Merger Agreement), the share price of our Class A common stock may drop to the extent that the current market price of ourClass A common stock reflects an assumption that a transaction will be completed. In addition, under circumstances specified in the Merger Agreement, we may berequired to pay a termination fee of $79 million in the event the merger is not consummated. Further, a failure to complete the merger may result in negative publicity and anegative impression of us in the investment community. Any disruption to our business resulting from the announcement and pendency of the merger and from intensifyingcompetition from our competitors, including any adverse changes in our relationships with our employees, suppliers, off-takers, and business partners, could continue oraccelerate in the event of a failure to complete the merger. In addition, even if we fail to complete the merger, we will still incur certain significant costs associated with themerger, primarily consisting of legal fees, accounting fees, financial advisory, financial printing and other related costs. There can be no assurance that our business, keyrelationships or financial condition will not be adversely affected, as compared to the condition prior to the announcement of the merger, if the merger is not consummated.
We have become the target of securities class action lawsuits, and may become the target of derivative lawsuits, that could result in substantial costs and may delay orprevent the Merger Agreement from being consummated.
Several complaints related to the merger contemplated by the Merger Agreement have been filed to date. The complaints are captioned: Stephen Donnell v. Pattern EnergyGroup Inc. et al., Case No. 1:19-cv-11680, which was filed by a purported shareholder in the United States District Court for the Southern District of New York onDecember 20, 2019; Richard Baum v. Pattern Energy Group Inc. et al., Case No. 1:19-cv-02360-UNA, which was filed on behalf of a putative class of our publicshareholders in the United States District Court for the District of Delaware on December 27, 2019; Phillip Krieger v. Pattern Energy Group Inc. et al., Case No. 3:19-cv-08437, which was filed on behalf of a putative class of our public shareholders in the United States District Court for the Northern District of California on December 27,2019; John Thompson v. Pattern Energy Group Inc. et al., Case No. 1:19-cv-02369-UNA, which was filed on behalf of a putative class of our public shareholders in theUnited States District Court for the District of Delaware on December 30, 2019; David Frieman v. Pattern Energy Group Inc. et al., Case No. 1:20-cv-00171, which wasfiled by a purported shareholder in the United States District Court for the Southern District of New York on January 8, 2020; Phil Burge v. Pattern Energy Group Inc. etal., Case No. 1:20-cv-00213, which was filed by a purported shareholder in the United States District Court for the Eastern District of New York on January 10, 2020;Bushansky v. Pattern Energy Group Inc. et al., Case No. 3:20-cv-00401, which was filed by a purported shareholder in the United States District Court for the NorthernDistrict of California on January 21, 2020; Wilhelmson v. Pattern Energy Group Inc. et al., Case No. 3:20-cv-00797, which was filed by a purported shareholder in theUnited States District Court for the Northern District of California on February 3, 2020; and The Arbitrage Fund et al. v. Pattern Energy Group Inc. et al., Case No. 1:20-cv-00275, which was filed on behalf of a putative class of our public shareholders in the United States District Court for the District of Delaware on February 25, 2020.Defending against these claims can result in substantial costs and divert management time and resources, even if the lawsuits are without merit as we believe. An adversejudgment could result in monetary damages, which could have a negative impact on our business, results of operations and financial condition. Additionally, if a plaintiff issuccessful in obtaining an injunction prohibiting
24
consummation of the Merger Agreement, the injunction may delay or prevent the merger from being completed, which may adversely affect our business, results ofoperations and financial condition. See also Item 3 “Legal Proceedings.” No assurances can be given that additional similar lawsuits or derivative lawsuits will not be filedwhich may make similar or additional claims, such as breach of fiduciary duties by our officers and/or directors, which would subject us to similar risks.
Risks Related to the Business Segments in which We Operate
Electricity generated from wind and solar energy depends heavily on suitable wind and solar conditions, respectively. If such conditions are unfavorable or below ourexpectations, our projects’ electricity generation and the revenue generated from our projects may be substantially below our expectations.
The revenue generated by our projects is principally dependent on the number of MWh generated in a given time period. The quantity of electricity generation fromrenewable energy projects depends heavily on environmental conditions, which are variable. Variability in wind and solar conditions can cause our project revenues to varysignificantly from period to period. We base our decisions about which projects to acquire as well as our electricity generation estimates, in part, on the findings of long-term wind, solar and other meteorological studies conducted on the project site and its region. For wind projects, such studies, measure the wind’s speed, prevailingdirection and seasonal variations, and projections of wind resources rely upon assumptions about turbine placement, wind turbine power curves, and interference betweenturbines. Similarly for solar projects, such studies measure solar irradiation and seasonal variations, and projections of solar resources rely upon assumptions about panelplacement, solar array incidence, and shading. Effects of vegetation, land use and terrain, which involve uncertainty and require us to exercise considerable judgment, alsomay have significant effects on electricity generated by a project. We may make incorrect assumptions in conducting these wind, solar and other meteorological studies.Any of these factors could cause our projects to generate less electricity than we expect and reduce our revenue from electricity sales, which could have a material adverseeffect on our business prospects, financial condition and results of operations.
Even if an operating project’s historical wind and solar resources are consistent with our long-term estimates, the unpredictable nature of meteorological conditions canresult in daily, monthly and yearly material deviations from the average amount of such renewable resource we may anticipate during a particular period. If such resourcesat a project are materially below the average levels we expect for a particular period, our revenue from electricity sales from the project could correspondingly be less thanexpected. A diversified portfolio of projects utilizing different renewable resources located in different geographical areas tends to reduce the magnitude of the deviation,but material deviations may still occur. Our cash available for distribution is most directly affected by the volume of electricity generated and sold by our projects.However, for a static portfolio of projects, our consolidated expenses, including operating expenses and interest payments on indebtedness, have less variability than thevolume of electricity generated and sold. Accordingly, decreases in the volume of electricity generated and sold by our projects typically result in a proportionately greaterdecrease in our cash available for distribution. See Item 7 “Management’s Discussion and Analysis of Financial Condition and Results of Operation-Factors thatSignificantly Affect our Business-Factors Affecting our Operational Results-Electricity Sales of Our Operating Projects.”
A reduction in electricity generation and sales, whether due to the inaccuracy of wind or solar energy assessments or otherwise, could lead to a number of material adverseconsequences for our business, including:
• our projects’ failure to produce sufficient electricity to meet our commitments under our PPAs, hedge arrangements or contracts for sale of RECs, which could resultin our having to purchase electricity or RECs on the open market to cover our obligations or result in the payment of damages or the termination of a PPA;
• our projects not generating sufficient cash flow to make payments of principal and interest as they become due on project-related debt, distributing sufficient cashflow to pay dividends to holders of our Class A shares, or service our corporate debt. For example, certain of our projects have experienced lower than expectedproduction and merchant power prices, as well as congestion on transmission systems upon which such projects rely upon, resulting in those projects failing to passfinancial tests that measure cumulative cash distributions to the members. This has in the past, and may in the future, result in a temporary change of the cashpercentage to be directed to the tax equity members until the shortfall is remedied. See “-Risks Related to Ownership of our Class A Shares - Our cash available fordistribution to holders of our Class A shares may be reduced as a result of restrictions on our subsidiaries’ cash distributions to us under the terms of theirindebtedness, or in the event certain specified events occurred under our tax equity arrangements that change the percentage of cash distributions to be made to thetax equity investors;” and
• our projects’ hedging arrangements being ineffective or more costly.
We have invested in Pattern Development which exposes us directly to project development risks.
Since July 2017, we have funded an aggregate of $190 million in capital contributions into Pattern Development in which we hold an approximate 29% ownership interest.We have the right, but not the obligation, to participate in subsequent capital calls for a total commitment of up to $300 million, and if we do not participate in all futurecapital calls, (including any capital calls which may be made
25
in connection with funding payment obligations under a subscription facility agreement Pattern Development has entered into with certain lenders to it), our ownershipinterest in Pattern Development will decrease.
As a result of our investment in Pattern Development, we are exposed directly to project development risks, including permitting challenges, failure to secure PPAs, failureto procure the requisite financing, equipment or interconnection, or an inability to satisfy the conditions to effectiveness of project agreements such as PPAs. In the eventwe elected to participate in additional capital calls or otherwise decided to invest in other project development opportunities, we would further expose ourselves directly tosuch project development risks. Generally, project development may entail risks of making investments in projects that cannot profitably be built, and we are, and if weinvested further could be further, exposed to significant investment activities that require significant capital prior to having certainty that a project can move forward. Wemay lose money invested without generating returns, particularly since a large portion of such investments go into overhead which cannot be recovered, some of theprojects Pattern Development has invested in are large that require significant capital investment without assurances they will generate returns, and Pattern Developmentholds a significant number of turbines the value of which may diminish (if they are not timely utilized) as the phase down of PTCs for wind projects continues. In addition,even if we don't lose money invested, we face uncertainty in the timing of the receipt of the return of capital and/or return on capital we have invested (if any). See “Theenergy industry in the markets in which we operate, as well as the market we are looking to expand into, benefit from governmental support that is subject to change.Regulatory uncertainly in the clean energy sector, including with respect to environmental and tax policies, may have adverse impacts on the renewable energy industry andour business.” As time progresses from the time of our initial investment in Pattern Development, the market would expect us to begin generating returns from suchinvestment. No assurances can be given that we will be successful in project development activities we undertake, whether through the investment in Pattern Developmentor otherwise, which can diminish our capital available for investment in operating power projects, adversely impact our business prospects, financial condition and resultsof operations, and adversely impact the price of our Class A shares.
A prolonged environment of low prices for natural gas, other conventional fuel sources, or competing renewable resources could have a material adverse effect on ourlong-term business prospects, financial condition and results of operations.
Historically low prices for traditional fossil fuels, particularly natural gas, and competing renewable resources could cause demand for our wind and solar power todecrease and adversely affect the price of the electricity we generate for sale on a spot-market basis. Excessive building of competing renewable resources in a limitedgeographic area (particularly in portions of ERCOT) has, and may continue to, result in congestion and curtailment which in turn has, and could continue to, adverselyaffect pricing available on the spot-market. See Item 7A "Quantitative and Qualitative Disclosures about Market Risk-Commodity Price Risk." Low spot-market powerprices, combined with other factors, could have a material adverse effect on our results of operations and cash available for distribution. Additionally, cheaper conventionalfuel sources or competing renewable resources could also have a negative impact on the power prices we are able to negotiate upon the expiration of our current power saleagreements or upon entering into a power sale agreement for a subsequently acquired power project. As a result, the price of our electricity or RECs subject to the openmarket could be materially and adversely affected, which could, in turn, have a material adverse effect on our results of operations and cash available for distribution.
Climate change may have the long-term effect of changing meteorological patterns at our projects which could have a material adverse effect on our businessprospects, financial condition, results of operations and ability to make cash distributions to our investors
Climate change may have the long-term effect of changing meteorological patterns, including wind and factors that affect solar irradiation (such as cloud cover), at ourprojects. Changing meteorological patterns could cause changes in expected electricity generation. These events could also degrade equipment or components and theinterconnection and transmission facilities’ lives or maintenance costs. We may face decreased revenues from a project and increased project expense which could have amaterial adverse effect on our business prospects, financial condition, results of operations and ability to make cash distributions to our investors.
Our projects rely on a limited number of key power purchasers.
There are a limited number of possible power purchasers for electricity and RECs produced in a given geographic location. Because our projects depend on sales ofelectricity and RECs to certain key power purchasers, our projects are highly dependent upon these power purchasers and such power purchasers fulfilling their contractualobligations under their respective PPAs. Upon a power purchase arrangement coming to the end of its term, no assurances can be given that we will be able to enter intonew arrangements with the same or another power purchaser, if we did not enter into a new arrangement that merchant prices for power would be as favorable as the pricesunder the prior power purchase arrangements, or even if we are able to enter into a new arrangement that the terms of such arrangement would be upon terms as favorableto us as the prior power purchase arrangements.
In addition, our projects’ power purchasers may not comply with their contractual payment obligations or may become subject to insolvency or liquidation proceedingsduring the term of the relevant contracts, and, in such event, we may not be able to find another purchaser on similar or favorable terms or at all. We are also exposed to thecreditworthiness of our power purchasers and there is no guarantee that
26
any power purchaser will maintain its credit rating, if any. For example, the power purchasers at our 101 MW Santa Isabel project in Puerto Rico and at our 101 MWHatchet Ridge project in California have been experiencing difficulties as further described in the risk factors below. To the extent that any of our projects’ powerpurchasers are, or are controlled by, governmental entities, our projects may also be subject to legislative or other political action that impairs their contractual performance.
We also note that our key power purchasers may seek to renegotiate or terminate PPAs prior to the end of their term that were contracted for at a time when the prices forpower were higher than they may currently be in the relevant markets by asserting that we have not performed our obligations under our contractual commitments under aPPA. Each such situation individually or in the aggregate could have a material adverse effect on our business prospects, financial condition and results of operations.
The power purchasers at our Santa Isabel project in Puerto Rico and our Hatchet Ridge project in California have been experiencing difficulties that may affect theseprojects.
Our 101 MW Santa Isabel project located in Puerto Rico sells 100% of its electricity generation to Puerto Rico Electric Power Authority (PREPA) under a 20-year PPA. InJuly 2017, PREPA filed a voluntary petition for relief in the U.S. District Court for the District of Puerto Rico. Our 101 MW Hatchet Ridge project located in Californiasells 100% of its electricity generation to Pacific Gas & Electric Company (PG&E) under a 15-year PPA. On January 29, 2019, PG&E filed for reorganization underChapter 11 of the U.S bankruptcy code. While each of PREPA and PG&E have through February 21, 2020, made payments of all amounts due under the respective PPAsfor production, including both pre-petition receivables of $2 million (except for an immaterial amount of pre-petition receivables for Hatchet Ridge for which we have fileda claim) and post-petition receivables, no assurances can be given that either PREPA or PG&E will pay future receivables. Furthermore, under the Puerto Rico Oversight,Management, and Economic Stability Act (or PROMESA) applicable to PREPA, and the U.S bankruptcy code applicable to PG&E, each of PREPA and PG&E willeventually need to determine whether to assume or reject its respective PPA, subject to court approval. A rejection of a PPA would likely have a material adverse effect onour business prospects, financial condition and results of operations. PREPA has initiated a process to renegotiate the terms of the PPA with us and the negotiations areongoing. No assurances can be given with respect to the outcome of such negotiations which may result in terms less favorable than the existing PPA. The fact of PREPA’sinsolvency and its filing for bankruptcy each constituted an event of default under its financing agreement. However, in August 2017, the lender issued a letter withdrawingthe event of default associated with the PREPA insolvency. Pursuant to our agreement with the lender, the Santa Isabel project may not make distributions to us until suchtime as lender consents (which will not be unreasonably withheld if PREPA assumes the PPA). The fact of PG&E’s insolvency and its filing under the U.S. bankruptcycode does not in and of itself constitute an event of default under the project’s financing agreements. In both cases, a failure to make future payments under either PPA orrejection of a PPA would constitute events of default under each projects’ financing agreements. No assurances can be given that PREPA or PG&E, as the case may be, willdetermine to assume the respective PPA, will not take actions that separately constitute an event of default under our financing agreements, or that Santa Isabel or HatchetRidge will be able to remain current with respect to its payments under the financing agreements. In any such event, an event of default under the financing agreementswould occur and the lenders may decide in such circumstance to accelerate and declare the entire amount of debt under the respective financing agreement immediately dueand payable. Even though each of the Santa Isabel and Hatchet Ridge financing agreements are non-recourse to us, they are secured by each respective project and anyexercise of remedies by the respective lenders could have a material adverse effect on our business prospects, financial condition and results of operations.
Operation and maintenance problems at our renewable energy projects including natural events may cause our electricity generation to fall below our expectations.
Our electricity generation production depends upon our ability to maintain the working order of our wind turbines, solar arrays, transmission lines and balance of the plant.A natural disaster, severe weather, accident, failure of major equipment, shortage of or inability to acquire critical replacement or spare parts, failure in the operation of anytransmission facilities that we may operate or utilize, including the failure of interconnection to available electricity transmission or distribution networks, could require usto shut down or curtail our turbines, solar arrays or related equipment and facilities, impeding our ability to operate our facilities and decreasing electricity generationproduction and our associated revenues. For example, a hurricane in September 2017 resulted in damage to PREPA’s transmission and distribution assets that caused ourSanta Isabel project in Puerto Rico to be shut-in until mid-February 2018, and a typhoon in September 2019 resulted in damage to some of the solar panels at our Futtsusolar facility in Japan causing a reduction of generation at such facility for several months until repairs could be made. In addition, several of our projects had previouslyexperienced blade failures, and no assurances can be given that potential equipment deficiencies will not in fact continue to occur, that we will always have warrantycoverage for any such defects, that the warranty provider would fulfill its obligations under such warranty coverage (including any liquidated damages compensationprovisions), that we will have adequate insurance (or insurance at all) to cover business interruption or other costs incurred, or that any such effects will not have a materialadverse effect on our business prospects, financial condition and results of operation.
27

We typically enter into warranty agreements with the turbine manufacturer for two to ten-year terms; however, such agreements are typically subject to an aggregatemaximum liability cap. In addition, we have a 20-year performance ratio guarantee from the EPC contractor for our solar facilities in Japan, subject to an annualperformance loss factor and adjustments for solar irradiation and temperature, which effectively provides a production guarantee for such solar facilities. However, therecan be no guarantee that such manufacturers or contractors, or other third-party service provider, will be able to fulfill its contractual obligations. In addition, suchagreements can vary as to what equipment maintenance risks are fully assumed by the service provider and what equipment failure risks will be repaired at the owner’scost.
As warranty terms with the manufacturer expire, we have entered and intend to continue entering into revised long-term turbine manufacturer service arrangements atcertain of our projects pursuant to which the turbine manufacturer continues to provide routine and corrective maintenance service, but we are responsible for a portion ofthe maintenance and repairs, including replacement of major component parts at certain sites. While the revised service arrangements reduce fixed contract costs, in theevent of unexpectedly high turbine component failures for which we as owner have assumed responsibility, we may face decreased revenues of a project and increasedproject expense which could have a material adverse effect on our business prospects, financial condition, results of operations and ability to make cash distributions to ourinvestors. We expect over time in the future to continue taking on additional risks as an owner, including increased self-performance of maintenance and service work withour own technicians instead of utilizing service providers, which will have expected cost benefits, but will similarly come with additional increased risks and reduced thirdparty warranty and guarantee protections.
Replacement and spare parts for wind turbines and key pieces of electrical equipment at both our wind and solar projects may be difficult or costly to acquire or may beunavailable. Sources for some significant spare parts and other equipment are often located outside of the jurisdictions in which our power projects operate. Additionally,our operating projects generally do not hold spare substation main transformers. These transformers are designed specifically for each power project, and order lead timescan be lengthy. If one of our projects had to replace any of its substation main transformers, it would be unable to sell all of its power until a replacement is installed. To theextent we experience a prolonged interruption at one of our operating projects due to natural events or operational problems and such events are not fully covered byinsurance, our electricity generation levels and revenues could materially decrease, which could have a material adverse effect on our business prospects, financialcondition and results of operation.
Our operations are subject to numerous environmental, health and safety laws and regulations.
Our projects are subject to numerous environmental, health and safety laws and regulations in each of the jurisdictions in which our projects operate or will operate. Theselaws and regulations, and associated best management practices, require that our projects obtain and maintain permits and approvals and engage in review processes andimplement environmental, health and safety programs and procedures to control risks associated with the siting, construction, operation and decommissioning of powerprojects. To obtain permits and other approvals, some projects are, in certain cases, required to undergo environmental impact assessments and undertake programs toprotect and maintain local endangered or threatened species. For example, in connection with a permit we obtained at our Spring Valley wind facility, we had to adopt amitigation plan with respect to injuries and fatalities to golden eagles, and were required to establish a process in the event of incidents, including reporting to the U.S. Fishand Wildlife Service. In addition, in connection with certain of our projects in Canada, plans to mitigate bat incidents were required to be adopted during the permittingprocess, and aspects of such plans have from time to time been implemented when bat incidents exceeded certain predetermined thresholds (such as raising cut in speedsfor turbines during certain hours when bats are active). If such programs are not successful, our projects could be subject to increased levels of mitigation, operationalcurtailment, penalties or revocation of our permits.
Violations of environmental and other laws, regulations and permit requirements, including certain violations of laws protecting wetlands, migratory birds, bald and goldeneagles and threatened or endangered species, may also result in criminal sanctions or injunctions. In addition, if our projects do not comply with applicable laws,regulations or permit requirements, or if there are endangered or threatened species fatalities at our projects, we may be required to pay penalties or fines or curtail or ceaseoperations of the affected projects.
Certain environmental laws impose liability on current and previous owners and operators of real property for the cost of removal or remediation of hazardous substances,even if the owner or operator did not know of, or was not responsible for, the release of such hazardous substances. In addition to actions brought by governmentalagencies, private plaintiffs may also bring claims arising from the presence of hazardous substances on a property or exposure to such substances. Our projects’ liabilities atproperties we own or operate arising from past releases of, or exposure to, hazardous substances could have a material adverse effect on our business prospects, financialcondition and results of operations.
Environmental, health and safety laws, regulations and permit requirements (or other similar requirements, such as requirements related to noise) may change and becomemore stringent. Any such changes could require our projects to incur additional material costs or cause our projects to suffer adverse consequences. For example, theMinistry of Environment in Ontario has established regulatory requirements
28
governing noise restrictions for wind farms which are an integral part of the permitting framework for our projects in certain jurisdictions. In the event of changes in eitherthe regulatory requirements or permitting framework, there is risk that our projects that were designed for compliance within the existing framework and requirements fornoise could be exposed to more stringent requirements (particularly if changes to requirements are made after receiving confirmation that a project had met previouslyexisting requirements through acoustic testing). These risks are enhanced because testing for compliance with noise requirements is technically complex, carries somedegree of uncertainty, and does not have significant precedent in that market. In the event of a determination of noncompliance, there is risk that the necessary mitigation,which would likely need to occur during periods of higher wind speeds, could require curtailment of energy production at the facility, with a resulting reduction inrevenues.
Our projects’ costs of complying with current and future environmental, health and safety laws, regulations and permit requirements (or other similar requirements), andany liabilities, fines or other sanctions resulting from violations of them, could have a material adverse effect on our business prospects, financial condition and results ofoperations.
Construction projects may not be completed on time, and construction costs could increase to levels that make a project too expensive to complete or make the returnon investment in that project less than expected.
There may be delays or unexpected developments in completing construction projects. Whether such delays or unexpected developments occur at construction projects weown or (because we own an approximate 29% interest in Pattern Development) construction projects at Pattern Development, construction costs at projects which exceedexpectations could reduce or eliminate the returns expected from such projects. Construction projects are typically designed and constructed under fixed-price and scheduleengineering, procurement, and construction contracts with reputable construction and equipment suppliers, and would typically have liquidated damages provisions fornon-performance by the contractors subject to specified limitations on the amount of damages that can recover from the contractor. Significant construction delays orconstruction cost increases may occur as a result of underperformance of these contractors and equipment suppliers, as well as other suppliers, to the projects. Noassurances can be given that disputes with project construction providers will not arise in the future. While we and Pattern Development will attempt to reach a settlement ifdisputes do arise, no assurances can be given that we or Pattern Development would actually reach a settlement or that any such settlement amount would be covered by theremaining budgeted project contingencies. If an equitable settlement cannot be reached, arbitration or legal action could be commenced, and any final judgment or decisioncould result in increased costs which could make the return on investment in the project less than expected. Henvey Inlet, a 300 MW wind project located in Ontario, hadexperienced significant cost overruns and delays during its development by Pattern Energy Group LP, and we entered into certain cost sharing arrangements abovespecified cap amounts with Pattern Energy Group LP in connection with our acquisition of Henvey Inlet from Pattern Energy Group LP in 2019.
Additionally, various other factors could contribute to construction-cost overruns and construction delays, including:
• inclement weather conditions;
• failure to receive generating equipment or other critical components and equipment necessary to maintain the operating capacity of our projects, in a timely manneror at all;
• failure to complete interconnection to transmission networks, which relies on several third parties, including interconnection facilities provided by local utilities;
• failure to maintain all necessary rights to land access and use;
• failure to receive quality and timely performance of third-party services;
• failure to maintain environmental and other permits or approvals;
• failure to meet domestic content requirements;
• appeals of environmental and other permits or approvals that are held;
• lawful or unlawful protests by or work stoppages resulting from local community objections to a project;
• shortage of skilled labor or key construction equipment on the part of contractors;
• geopolitical risks including risk of tax and tariff law changes;
• adverse environmental and geological conditions; and
• force majeure or other events out of our control.
Any of these factors could give rise to construction delays and construction costs in excess of expectations. These circumstances could prevent construction projects fromcommencing operations or from meeting original expectations about how much electricity they will
29
generate or the returns they will achieve. In addition, substantial delays could cause defaults under financing agreements or under PPAs that require completion of projectconstruction by a certain date at specified performance levels or could result in the loss or reduction of expected tax benefits. An inability to transition construction projectsinto financially successful operating projects by either us or Pattern Development would have a material adverse effect on our business prospects, financial condition andresults of operations and our ability to pay dividends.
The expansion of our international operations into Japan subjects us to a number of risks, and if we are unable to effectively manage these risks, and similar risks ifwe expand into other markets outside of the United States and Canada, our business prospects, financial condition and results of operations and liquidity could bematerially and adversely affected.
In March 2018, we entered into the Japanese renewables market, and our 206 MW portfolio of projects in Japan consists of two operating solar projects (Futtsu andKanagi), two operating wind projects (Ohorayama and Otsuki), and one in-construction wind project (Tsugaru). We expect our portfolio and operations in Japan to continueto grow. The expansion of our operations into markets outside of the United States and Canada exposes us to risks relating to political, regulatory, labor, and tax conditionsin these foreign countries. In addition, we are exposed to risks including:
• difficulty with staffing and managing overseas operations, which may be exacerbated as a result of distance, time zone, language, and cultural differences;
• difficulties and costs relating to compliance with different commercial, legal and regulatory requirements;
• failure to develop appropriate risk management and internal control structures tailored to overseas operations;
• challenges in coordinating and integrating systems, policies, and procedures, such as operational, financial and accounting, and information technology;
• the need to devote a significant amount of our management’s time and effort to integrate and coordinate the international operations with our other operations; and
• fluctuations in currency exchange rates.
If we are unable to effectively manage these risks, they could materially and adversely affect our business prospects, financial condition, and results of operations andliquidity.
Our projects rely on interconnections to transmission lines and other transmission facilities that are owned and operated by third parties which exposes us to risks. Ourprojects are also exposed to interconnection and transmission facility development and curtailment risks, which may delay the completion of any construction projectsor reduce the return to us on those investments.
Our projects depend upon interconnection to electric transmission lines owned and operated by regulated utilities to deliver the electricity we generate. A failure or delay inthe operation or development of these interconnection or transmission facilities could result in our losing revenues because such a failure or delay could limit the amount ofpower our operating projects deliver or delay the completion of any construction projects. For example, we have experienced situations where the substation to which aproject was required to deliver power under its PPA had been shut down for maintenance and we needed to then take steps to mitigate the transmission outage at thedelivery substation, including making alternative transmission arrangements to deliver power at an alternative substation through alternative short term transmission andrevenue arrangements and selling environmental attributes to a third party. If similar circumstances occurred in the future, there could be no assurances that we would beable to make alternative transmission arrangements or the revenues produced from any alternative arrangements would be equivalent to the revenues that would have beengenerated had such transmission outage not occurred. Furthermore, individual alternative arrangements made to mitigate the transmission outage may present their ownrisks, such as possible curtailment risks on the alternative transmission arrangements or pricing risks in the merchant power market, which could adversely affect theoverall efficacy of any mitigation efforts. If we were unable to mitigate potential losses, other future sustained transmission outages at a delivery substation could have amaterial adverse effect on our business prospects, financial condition and results of operations.
In addition, certain of our operating projects’ generation of electricity may be curtailed without compensation (or, in some cases, choose to continue operating but acceptnegative power prices) due to transmission limitations or limitations on the electricity grid’s ability to accommodate intermittent electricity generating sources, reducing ourrevenues and impairing our ability to capitalize fully on a particular project’s potential. Such a failure or curtailment at levels above our expectations could have a materialadverse effect on our business prospects, financial condition and results of operations. For example, in certain geographic areas of the ERCOT market in Texas,construction of renewable energy projects has exceeded the available capacity of the existing transmission infrastructure resulting in localized congestion on transmissionfacilities utilized by certain of our projects. While these projects may have financial hedges that partially protect revenues against movement in broader power markets,such instruments generally do not provide protection against
30
localized congestion impacts, which are borne by the projects. In addition, planned or forced outages of transmission circuits in such strained areas of the grid can, and has,compounded the adverse impact on our operations. While efforts to construct additional transmission facilities are underway, there is no assurance that such additionalfacilities will be sufficient to relieve congestion, or that construction of new generation facilities will not continue to exceed the capacity of any added transmission in thefuture.
In addition to the risks described above regarding the broader electric grid, many of our projects also own private transmission lines to deliver our power to availableelectricity transmission or distribution networks. In some cases, these facilities may span significant distances. A failure in our operation of these facilities that causes thefacilities to be temporarily out of service, or subject to reduced service, could result in lost revenues because it could limit the amount of electricity our operating projectsare able to deliver. In addition, in many of the markets in which we operate or are looking to expand operations, should there be any excess capacity available in thosegenerator lead facilities, and should a third party request access to such capacity, the relevant regulatory authority in such jurisdiction, such as FERC in the United States, orother authorities might, require our projects to provide service over such facilities for that excess capacity to the requesting third party at regulated rates. Should this occurin markets with such regulations, the projects could be subject to additional regulatory risks and costly compliance burdens associated with being considered the owner andoperator of a transmission facility.
New projects being developed that we may acquire may need governmental approvals and permits, including environmental approvals and permits, for constructionand operation. Any failure to obtain or maintain in effect necessary permits could adversely affect the amount of our growth.
The design, construction and operation of wind, solar and transmission projects are highly regulated, require various governmental approvals and permits, includingenvironmental approvals and permits, and may be subject to the imposition of related conditions that vary by jurisdiction. In some cases, these approvals and permitsrequire periodic renewal and a subsequently issued permit may not be consistent with the permit initially issued. In other cases, these permits may require compliance withterms that can change over time. We cannot predict whether all permits required for a given project will be granted or whether the conditions associated with the permits, assuch conditions may change over time, will be achievable. The denial or loss of a permit essential to a project, or the imposition of impractical or burdensome conditionsupon renewal or over time, could impair our ability to construct and operate a project. In addition, we cannot predict whether seeking the permits will attract significantopposition or whether the permitting process will be lengthened due to complexities, legal claims or appeals. Delay in the review and permitting process for a project canimpair or delay the ability to develop, construct, or acquire a project or increase the cost such that the project is no longer attractive to us.
In developing certain of our projects, Pattern Energy Group LP experienced delays in obtaining non-appealable permits and we, Pattern Energy Group LP, and/or PatternDevelopment may experience delays in the future. For example, when we acquired our Ocotillo project, it was then the subject of four active lawsuits brought by a varietyof project opponents, all of which challenged the prior issuance of Ocotillo’s primary environmental analysis and right-of-way entitlement. We had commenced commercialoperations at the Ocotillo project in anticipation of securing favorable rulings on these lawsuits. In Ontario, in prior years anti-wind advocacy groups have opposed theRenewable Energy Approval environmental permit granted to our South Kent, Grand, and Armow wind projects by commencing proceedings before the OntarioEnvironmental Review Tribunal. Each of these appeals ultimately was unsuccessful and dismissed by the Tribunal.
We are subject to the risk of being unable to complete construction of projects, or continue operation of our projects, if any of the key permits are revoked or permitconditions are violated. If this were to occur at any current or future project, we would likely lose a significant portion of our investment in the project and could incur aloss as a result, which would have a material adverse effect on our business prospects, financial condition and results of operations.
The loss of one or more of our or Pattern Development's executive officers or key employees may adversely affect the ability to effectively complete the development ofprojects, implement our growth strategy, complete construction projects on schedule, or manage our operating projects.
We depend on our experienced management team and (because we own an approximate 29% interest in Pattern Development) Pattern Development’s officers and keyemployees. The loss of one or more of our or Pattern Development's executives or key employees could have a negative impact on us, our business, or ability to grow. Wealso depend on the ability of ourselves and Pattern Development to retain and motivate key employees and attract qualified new employees. Because the renewable powerindustry is relatively new, there is a scarcity of experienced employees in the industry. We and Pattern Development may not be able to replace departing members of theirmanagement teams or key employees. Integrating new executives into management teams and training new employees with no prior experience in the power industry couldprove disruptive to projects, require a disproportionate amount of resources and management attention and ultimately prove unsuccessful. An inability to attract and retainsufficient technical and managerial personnel could limit the ability of us or Pattern Development to effectively manage, complete the development of projects, implementour growth strategy,
31

complete any construction projects on schedule and within budget, or manage our operating projects, which could have a material adverse effect on our business prospects,financial condition and results of operations.
The employee transfer may adversely affect our costs.
Under the Multilateral Management Services Agreement, we continue to have the option to cause the employees of Pattern Energy Group LP to become our employees. Werefer to this event as the Pattern Energy Group LP employee transfer, and we may effect such employee transfer after the earliest to occur of (1) notice from Pattern EnergyGroup LP that it will be completing a wind-down, (2) June 16, 2020, and (3) the failure of Pattern Energy Group LP to provide the resources and services called for underthe Multilateral Management Services Agreement after notice and opportunities to cure. The Merger Agreement requires us to use commercially reasonable efforts to causesuch transfer to occur prior to closing of such transaction, but is not a condition to the transaction.
In addition, while Pattern Development currently only has employees through its ownership of interests in GPI in Japan, the Multilateral Management Services Agreementprovides for certain circumstances pursuant to which we can require Pattern Development to cause its employees (if any) to become our employees. We refer to this eventas the Pattern Development employee transfer. In addition, we may consider agreeing to hybrid type arrangements with Pattern Development in which, for example, certainkey employees performing development activities at Pattern Energy Group LP become employees of Pattern Development (with us retaining a right to later require suchpersons to become our employees as a part of a Pattern Development employee transfer) and the remainder of the Pattern Energy Group LP employees becoming ouremployees as a part of the Pattern Energy Group LP employee transfer. Following the occurrence of any of a Pattern Energy Group LP employee transfer event to us, aPattern Development employee transfer event to us (in the event Pattern Development has employees), or a hybrid type of arrangement with respect to employees, wewould incur increased costs associated with employing a larger number of employees, and there is no assurance that the utilization of services from Pattern Energy GroupLP and Pattern Development will be sufficient to cover the costs of the employees which could then have a material adverse effect on our business prospects, financialcondition and results of operation.
Our use and enjoyment of real property rights for our projects may be adversely affected by the rights of lienholders and leaseholders that are superior to those of thegrantors of those real property rights to our projects.
Our projects generally are, and any of our future projects are likely to be, located on land occupied pursuant to long-term easements, leases and rights-of-way. Theownership interests in the land subject to these easements, leases and rights-of-way may be subject to mortgages securing loans or other liens (such as tax liens) and othereasements, lease rights and rights-of-way of third parties (such as leases of oil or mineral rights) that were created prior to our projects’ easements, leases and rights-of-way.As a result, certain of our projects’ rights under these easements, lease rights or rights-of-way may be subject, and subordinate, to the rights of those third parties. Weperform title searches, obtain title insurance and enter into non-disturbance agreements to protect ourselves against these risks. Such efforts may, however, be inadequate toprotect our operating projects against all risk of loss of our rights to use the land on which our projects are located, which could have a material adverse effect on ourbusiness prospects, financial condition and results of operations. In addition, certain lands, such as lands under the jurisdiction of the United States Department of Interior'sBureau of Land Management (BLM), are subject to contractual rights that permit the BLM to periodically adjust rent due on properties and other obligations, such as theamount of required reclamation security, to market terms. Any such loss or curtailment of our rights to use the land on which our projects are located, any increase in rentdue, or any increase in other obligations with respect to such lands could have a material adverse effect on our business prospects, financial condition and results ofoperations.
Our operating projects are, and other future projects may be, subject to various governmental regulations, approvals, and compliance requirements that regulate thesale of electricity, which could have a material adverse effect on our business prospects, financial condition and results of operations.
Our current projects in operation in the United States are operating as EWGs as defined under PUHCA and therefore are exempt from certain regulation under PUHCA.Other than Gulf Wind, Panhandle 1, Panhandle 2, and Logan’s Gap, our operating projects in the United States are, however, public utilities under the Federal Power Actsubject to rate regulation by FERC. Our future projects in the United States will also likely be subject to such rate regulation once they are placed into service. Our projectsin the United States that are subject to FERC rate regulation are required to obtain acceptance of their rate schedules for wholesale sales of energy (i.e., not retail sales toconsumers), capacity and ancillary services, including their ability to charge “market-based rates.” FERC may revoke or revise an entity’s authorization to make wholesalesales at market-based rates if FERC subsequently determines that such entity and its affiliates can exercise horizontal or vertical market power, create barriers to entry orengage in abusive affiliate transactions or market manipulation. In addition, public utilities in the United States are subject to FERC reporting requirements that imposeadministrative burdens and that, if violated, can expose the company to criminal and civil penalties or other risks.
32
Most of our North American projects are located in regions in which the wholesale electric markets are administered by ISOs and RTOs. Several of our current operatingprojects are subject to CAISO which is the ISO that prescribes tariff and business practice manuals for the terms of participation in the California energy market; theERCOT, which is the ISO that prescribes protocols and business practice manuals for and terms of participation in the Texas energy market; and IESO, which is the ISOthat administers the wholesale electricity market in Ontario. The Southwest Power Pool is the integrated RTO and regional market administrator for our Post Rock project.Lost Creek is in the Associated Electric Cooperative, Inc., a subregion of the SERC Reliability Corporation. Amazon Wind is in the PJM RTO. Spring Valley and StillwaterWind are located in the Northwest Power Pool which is a sub-region of the Western Electricity Coordinating Council (WECC). Many of these entities can impose rules,restrictions and terms of service that are quasi-regulatory in nature and can have a material adverse impact on our business. For example, ISOs and RTOs have developedbid-based locational pricing rules for the energy markets that they administer. In addition, most ISOs and RTOs have also developed bidding, scheduling and marketbehavior rules, both to curb the potential exercise of market power by electricity generating companies and to ensure certain market functions and system reliability. Theseactions could materially adversely affect our ability to sell, and the price we receive for, our energy, capacity and ancillary services.
All of our current operating projects located in North America are also subject to the reliability standards of the NERC. If we fail to comply with the mandatory reliabilitystandards, we could be subject to sanctions, including substantial monetary penalties. Although our U.S. projects are not subject to state utility regulation because ourprojects sell power exclusively on a wholesale basis, we are subject to certain state regulations that may affect the sale of electricity from our projects, the operations of ourprojects, as well as the potential for state electricity taxes. All of our current operating projects in Canada are subject to exclusive provincial regulatory authority withrespect to the generation and production of electricity, which varies across provincial jurisdictions. Changes in regulatory treatment at the state and provincial level aredifficult to predict and could have a significant impact on our ability to operate and on our financial condition and results of operations.
Our industry could be subject to increased regulatory oversight or changes in government policies that could have adverse effects.
Our industry could be subject to increased regulatory oversight. Changing regulatory policies and other actions by governments and third parties with respect to curtailmentof electricity generation, electricity grid management restrictions, interconnection rules, wholesale electricity market design and transmission may all have the effect oflimiting the revenues from, and increasing the operating costs of, our projects which could have a material adverse effect on our business, financial condition and results ofoperations.
Due to regulatory restructuring initiatives at the federal, provincial and state levels, the electricity industry has undergone changes over the past several years. Futuregovernment initiatives will further change the electricity industry. Some of these initiatives may delay or reverse the movement towards competitive markets. We cannotpredict the future design of wholesale power markets or the ultimate effect that on-going regulatory changes will have on our business prospects, financial condition andresults of operations.
In addition, renewable energy policies may also change dramatically as a result of changes in government or political climate. For example, the current administration inOntario made pledges during the 2018 election process to wind down certain contracts for renewable power projects that are in the pre-construction phase. We currentlyhave no information to suggest that power contracts for operating projects in Ontario will be affected by these changes or by future policy changes. However, no assurancescan be given that the current administration will not seek to amend renewable power contracts for operating projects, which could include contracts for our projects inOntario, and which could have a material adverse effect on our business prospects, financial condition and results of operations, if it were to occur.
Our projects are not able to insure against all potential risks and may become subject to higher insurance premiums.
Our projects are exposed to the risks inherent in the construction and operation of wind, solar and transmission power projects, such as breakdowns, manufacturing defects,natural disasters, terrorist attacks and sabotage. We are also exposed to environmental risks. We have insurance policies covering certain risks associated with our business.Our insurance policies do not, however, cover losses as a result of certain force majeure events or terrorism. In addition, our insurance policies for our projects may coverlosses as a result of certain types of natural disasters or sabotage, among other things, but such coverage is not always available in the insurance market on commerciallyreasonable terms and is often capped at predetermined limits that may not be adequate. Our insurance policies are subject to annual review by our insurers and may not berenewed on similar or favorable terms or at all. A serious uninsured loss or a loss significantly exceeding the limits of our insurance policies could have a material adverseeffect on our business prospects, financial condition and results of operations.
Currency exchange rate fluctuations may have an impact on our financial results and condition.
We have exposures to currency exchange rate fluctuations, primarily the Canadian dollar and Japanese yen, related to owning and operating part of our business outside ofthe United States. A portion of our revenue for the years ended December 31, 2019, 2018 and 2017 was
33
denominated in currencies other than the U.S. dollar, and we expect net revenue from non-U.S. dollar markets to continue to represent a portion of our net revenue. Wemanage our currency exposure through a variety of methods, including efforts to match our asset and liabilities in the same currencies, mainly by raising local currencydebt. In addition, we may use foreign currency forward contracts to, in part, manage short and medium term fluctuations in our dividends from our facilities located outsidethe United States. However, any measures that we have implemented or may implement in the future to reduce the effect of currency exchange rate fluctuations and otherrisks of our global operations may not be effective or may be expensive. We cannot provide assurance that currency exchange rate fluctuations will not otherwise have amaterial adverse effect on our financial condition or results of operations or cause significant fluctuations in quarterly and annual results of operations.
Foreign currency translation risk arises upon the translation of balance sheet and statement of operations items of our non-U.S. dollar denominated subsidiaries whosefunctional currency is a currency other than the U.S. dollar into the functional currency and reporting currency of us (which is the U.S. dollar) for purposes of preparing theconsolidated financial statements included elsewhere in this Form 10-K presented in U.S. dollars. The assets and liabilities of our non-U.S. dollar denominated subsidiariesare translated at the closing rate at the date of reporting and statement of operations items are translated at the average rate for the period. All resulting exchange differencesare recognized in a separate component of equity, “Foreign currency translation, net of tax,” and are recorded in “Other comprehensive income (loss), net of tax.” Theseforeign currency translation differences may have significant negative or positive impacts. Our foreign currency translation risk mainly relates to our operations in Canadaand Japan.
In addition, foreign currency transaction risk arises when we or our subsidiaries enter into transactions where the settlement occurs in a currency other than the functionalcurrency of us or our subsidiary. Exchange differences (gains and losses) arising on the settlement of monetary items or on translation of monetary items at rates differentfrom those at which they were translated on initial recognition during the period or in previous financial statements are recognized the consolidated statements of operationsin the period in which they arise. In order to reduce significant foreign currency transaction risk from our operating and investing activity, we may use foreign currencyforward and foreign currency option contracts to hedge forecasted cash inflows and outflows. Furthermore, most non-U.S. dollar denominated debts are held by non-U.S.dollar denominated subsidiaries in the same functional currency of those subsidiary operations.
Impairment in the carrying value of long-lived assets and goodwill could negatively affect our operating results and reduce our earnings.
We have a significant amount of long-lived assets and goodwill on our consolidated balance sheets. Under generally accepted accounting principles, we periodicallyevaluate long-lived assets for potential impairment whenever events or changes in circumstances have occurred that indicate that impairment may exist, or the carryingamount of the long-lived asset may not be recoverable. An impairment loss is recognized if the carrying amount of a long-lived asset is not recoverable based on itsestimated future discounted cash flows. Goodwill must be evaluated for impairment annually or more frequently if events indicate it is warranted. If the carrying value ofan asset exceeds current fair value, the goodwill may be considered impaired and may be required to be reduced to fair value by a non-cash charge to earnings. Events andconditions that could result in impairment in the value of our long-lived assets and goodwill include cash flow or operating losses at a project, other negative events orlong-term outlook for a project, a more-likely-than-not expectation of selling or disposing of a project, cost factors that have negative effect on earnings and cash flows at aproject, changes in business conditions or strategy, as well as (particularly for goodwill) significantly deteriorating industry, market, and general economic conditions.Impairment in the carrying value of long-lived assets and goodwill could negatively affect our operating results and reduce our earnings. For example, during 2018, uponentering an agreement to sell the El Arrayán project in Chile, we classified the related assets and liabilities as held for sale and recorded an impairment loss of $7 million.
Our cross-border operations require us to comply with anti-corruption laws and regulations of the U.S. government and various non-U.S. jurisdictions.
Doing business in multiple countries requires us and our subsidiaries to comply with the laws and regulations of the U.S. government and various non-U.S. jurisdictions.Our failure to comply with these rules and regulations may expose us to liabilities. These laws and regulations may apply to our companies, individual directors, officers,employees and agents and may restrict our operations, trade practices, investment decisions and partnering activities. In particular, our non-U.S. operations are subject toU.S. and foreign anti-corruption laws and regulations, such as the Foreign Corrupt Practices Act of 1977 (FCPA). The FCPA prohibits U.S. companies and their officers,directors, employees and agents acting on their behalf from corruptly offering, promising, authorizing or providing anything of value to foreign officials for the purposes ofinfluencing official decisions or obtaining or retaining business or otherwise obtaining favorable treatment. The FCPA also requires companies to make and keep books,records and accounts that accurately and fairly reflect transactions and dispositions of assets and to maintain a system of adequate internal accounting controls. As part ofour business, we deal with state-owned business enterprises, the employees and representatives of which may be considered foreign officials for purposes of the FCPA. Asa result, business dealings between our employees or our agents and any such foreign official could expose our company to the risk of violating anti-corruption laws even ifsuch business practices may be customary or are not otherwise prohibited between
34
our company and a private third-party. Violations of these legal requirements are punishable by criminal fines and imprisonment, civil penalties, disgorgement of profits,injunctions, debarment from government contracts as well as other remedial measures. We have established policies and procedures designed to assist us and our personnelin complying with applicable U.S. and non-U.S. laws and regulations; however, we cannot assure stockholders that these policies and procedures will completely eliminatethe risk of a violation of these legal requirements, and any such violation (inadvertent or otherwise) could have a material adverse effect on our business prospects, financialcondition and results of operations.
We own, and in the future may acquire, certain projects in joint ventures, and our joint venture partners’ interests may conflict with our and our stockholders’interests.
We own certain projects in joint ventures (including Henvey Inlet, South Kent, Armow, Grand, Belle River, and North Kent, in which we have a 50%, 50% , 50%, 45%,21.7%, and 35% interest, respectively), and, in the future, we may acquire or invest in additional projects with a joint venture partner. In addition, our strategic jointpartnership arrangements with PSP Investments include arrangements in which PSP Investments may co-invest in ROFO projects based on a process that is controlled byus, and we can elect the percentage interest to offer to PSP Investments in each project, which is expected to range from 30% to 49.9%. Under such arrangements, PSPInvestments has to date co-invested (and we have joint venture arrangements with them) in each of (a) Meikle and Mont Sainte-Marguerite in which we have a 51% limitedpartner interest and PSP Investments holds the remaining limited partner interests, (b) Belle River in which we and PSP Investments each have a 21.7% limited partnerinterest, and (c) Grady, Panhandle 2 and Stillwater in which we have 51% of the Class B interests and PSP Investments holds the remaining Class B interests. Joint venturesinherently involve a lesser degree of control over business operations, which could result in an increase in the financial, legal, operational or compliance risks associatedwith a project, including, but not limited to, variances in accounting and internal control requirements. To the extent we do not have a controlling interest in a project, or tothe extent we have granted our joint venture partner veto rights, our joint venture partners could take actions that decrease the value of our investment and lower our overallreturn. In addition, conflicts of interest may arise in the future between our company and our stockholders, on the one hand, and our joint venture partners, on the otherhand, where our joint venture partners’ business interests are inconsistent with our and our stockholders’ interests. Further, disagreements or disputes between us and ourjoint venture partners may arise which could result in litigation, increase our expenses and potentially limit the time and effort our officers and directors are able to devoteto our business, all of which could have a material adverse effect on our business prospects, financial condition and results of operations.
An inability of Pattern Development to obtain the requisite financing to develop and construct projects could have a material adverse effect on our ability to grow ourbusiness.
Power project development is a capital intensive, high-risk business that relies heavily on and, therefore, is subject to the availability of debt and equity financing sources tofund projected construction and other projected capital expenditures. As a result, in order to successfully develop a power project, Pattern Development (in which we holdan approximate 29% interest) from which we may seek to acquire power projects, must obtain at-risk funds sufficient to complete the development phase of their projects.Any significant disruption in the credit and capital markets, or a significant increase in interest rates, could make it difficult for Pattern Development to successfullydevelop attractive projects. If Pattern Development, or other development companies from which we seek to acquire projects, are unable to raise funds when needed, theability to grow our project portfolio may be limited, which could have a material adverse effect on our ability to implement our growth strategy and, ultimately, ourbusiness prospects, financial condition and results of operations.
Steps we take in response to developments in the market, such as the potential inclusion of energy storage and battery systems in our projects, expose us to risks.
Steps we may need to take in response to developments in the market expose us to risks. For example, in order to remain competitive as an IPP in the market, we may needto leverage utilization of energy storage technologies (such as batteries) in our projects. The applications for energy storage and battery systems include the provision ofbackup power, grid independence, peak demand reduction, demand response, reducing intermittency of renewable generation, energy shifting and/or arbitrage, andwholesale electric market services. However, large scale energy storage technologies are at a relatively nascent stage, and any system deployed may be relatively expensivewhich may impact economic expectations for our projects, and may not deliver the performance expected. As a result, our returns may be below our expectations. Inaddition, energy technologies are rapidly advancing, and future evolutions in these products may render any such systems and technologies we may install or retrofit intoour projects inefficient or obsolete, which may cause them to be uncompetitive. In addition, energy storage systems are complex, and defects or a failure of such systems toperform as expected may pose risks related to health, safety, and the environment. Any of such risks, or other risks that may be posed by the need to respond todevelopments in the market to remain competitive, could materially and adversely affect our business prospects, financial condition, and results of operations and liquidity.
35

Security breaches, including cybersecurity breaches, and other disruptions could compromise our business operations and critical and proprietary information andexpose us to liability, which could adversely affect our business prospects, financial condition and reputation.
In the ordinary course of our business, we store sensitive data and proprietary information regarding our business, employees, shareholders, offtakers, service providers,business partners and other individuals in our data center and on our network. Additionally, we use and are dependent upon information technology systems that utilizesophisticated operational systems and network infrastructure to run our projects. Through our 24/7 operations control center, we can for our projects in the U.S. andCanada, among other things, monitor and control each wind turbine, monitor regional and local climate, track real time market prices and, for some of our projects, monitorcertain environmental activities. The confidentiality, integrity and availability of information technology systems is critical to our operations. Despite security measures wehave employed, including certain measures implemented pursuant to mandatory NERC Critical Infrastructure Protection standards, our infrastructure may be increasinglysubject to attacks by hackers or terrorists as a result of the rise in the sophistication and volume of cyberattacks. Also, our information and information technology systemsmay be breached due to commodity malware, human error, malfeasance or other malfunctions and disruptions. Any such attack or breach could: (i) compromise ourturbines, wind farms and solar facilities thereby adversely affecting generation and transmission to the grid; (ii) adversely affect our operations; (iii) corrupt data; or (iv)result in unauthorized access to the information stored on our networks, including, company proprietary information and employee data causing the information to bepublicly disclosed, lost or stolen or result in incidents that could result in harmful effects on the environment and human health, including loss of life. Any such attack,breach, access, disclosure or other loss of information could result in lost revenue, the inability to conduct critical business functions, legal claims or proceedings, fines andregulatory penalties, increased regulation, increased protection costs for enhanced cybersecurity systems or personnel, damage to our reputation and/or the rendering of ourdisclosure controls and procedures ineffective, all of which could adversely affect our business prospects, financial condition and reputation.
Risks Related to Future Growth and Acquisitions
The growth of our business depends in part on locating and acquiring interests in additional attractive independent power and transmission projects.
Our business strategy includes acquiring power projects that are either operational, construction-ready, or (in limited circumstances outside of activities conducted byPattern Development) under development. We intend to pursue opportunities to acquire projects from third-party owners where we may submit bids from time to time, andfrom Pattern Development pursuant to our Purchase Rights.
Various factors could affect the availability of attractive projects to grow our business, including:
• competing bids for a project, including a project subject to our Purchase Rights, from other owners, including companies that may have substantially greater capitaland other resources than we do;
• fewer acquisition opportunities than we expect from both third-parties and Pattern Development, which could result from, among other things, available projectshaving less desirable economic returns or higher risk profiles than we believe suitable for our business plan and investment strategy. After, in part, consideration ofsuch factors, in each of 2018 and 2019 we have waived our Purchase Rights with respect to various projects at each of the Pattern Development Companies;
• failure by Pattern Development to complete the development of (i) an Identified ROFO Project, which could result from, among other things, permittingchallenges, failure to procure the requisite financing, equipment or interconnection, local opposition to the project which may entail litigation, or an inability tosatisfy the conditions to effectiveness of project agreements such as PPAs and (ii) any of the other projects in its respective development pipeline, in a timelymanner, or at all, in either case, which could limit our acquisition opportunities under our Purchase Rights and/or the value of our investment in PatternDevelopment; and
• our failure to exercise our respective Purchase Rights or acquire assets from Pattern Development.
Any of these factors could prevent us from executing our growth strategy or otherwise have a material adverse effect on our business prospects, financial condition andresults of operations. See also “- We have invested in Pattern Development which exposes us directly to project development risks.”
Additionally, even if we consummate acquisitions that we believe will be accretive to cash available for distribution per share, those acquisitions may in fact result in adecrease in cash available for distribution per Class A share as a result of incorrect assumptions in our evaluation of such acquisitions, unforeseen consequences or otherexternal events beyond our control. Furthermore, if we consummate any future acquisitions, our capitalization and results of operations may change significantly, andstockholders will not generally have
36
the opportunity to evaluate the economic, financial and other relevant information that we consider in determining the application of capital and other resources.
Capital market conditions can have an effect on both our timing and ability to consummate future acquisitions. We must also potentially anticipate obtaining fundsfrom equity or debt financings to complete construction or pay capital costs of an acquired project which exposes us to financing risks.
Financing acquisitions of projects requires capital which has in the past been raised partially or wholly through the issuance of additional Class A shares, notes or otherequity linked or debt instruments. However, no assurances can be given that we will be able to access the capital markets on commercially reasonable terms whenacquisition opportunities arise. Our ability to access the equity and debt capital markets is dependent on, among other factors, the overall state of the capital markets andinvestor appetite for investment in clean energy projects in general and our Class A shares and our debt securities in particular. Volatility in the market price of our Class Ashares or our credit rating may prevent or limit our ability to utilize our equity or debt securities as a source of capital to help fund acquisition opportunities.
During 2019, the prices for our Class A shares traded on the Nasdaq Global Select Market ranged from a high of $28.50 to a low of $18.14. On February 26, 2020, the lastreported sale price of our Class A shares on such market was $27.66 and we have a BB-/Ba3 credit rating from Standard & Poor’s and Moody’s, respectively. In addition,we evaluate the loan market and private investment market as potential sources of capital to finance acquisitions. Similar to the capital markets, no assurances can be giventhat we will be able to access such markets on commercially reasonable terms when acquisition opportunities arise to obtain financing, or at all. An inability to obtainfinancing on commercially reasonable terms could significantly limit our timing and ability to consummate future acquisitions, and to effectuate our growth strategy. Inaddition, the issuance of additional Class A shares or other types of equity linked securities in connection with acquisitions, particularly if consummated at depressed pricelevels or consummated at price levels that declined significantly between the signing and closing of an acquisition, could cause significant shareholder dilution, expose usto risks of being unable to consummate an acquisition we had agreed to, and reduce the cash distribution per share if the acquisitions are not sufficiently accretive.
We must also potentially anticipate obtaining funds from equity or debt financings, including tax equity transactions, or from other sources in order to fund any requiredconstruction and other capital costs of the acquired projects. The availability of tax equity financing may be affected by external events which we do not control, such aschanges in tax law.
In the event we determine it is not economical to utilize, or we are unable to utilize our equity or debt securities as a source of capital to fund acquisition opportunities, or asa source of capital to complete any construction outstanding or pay capital costs of acquired projects, we may need to consider utilizing other sources of capital, such ascash on hand, borrowings under our existing credit facilities, or arranging additional credit facilities, none of which may be available or may not be available at attractiveterms. Our inability to effectively consummate future acquisitions, or to finance construction or other capital costs cost-effectively, could have a material adverse effect onour ability to grow our business.
Acquisition and disposal of power projects involves numerous risks.
Our strategy includes acquiring power projects. The acquisition of power projects involves numerous risks, many of which may not be able to be discovered through ourdue diligence process, including exposure to previously existing liabilities and unanticipated costs associated with the pre-acquisition period; difficulty in integrating theacquired projects into our existing business; operational deficiencies or problematic wind or solar characteristics; and, if the projects are in new markets, the risks ofentering markets where we have limited experience. A failure to achieve the financial returns we expect when we acquire power projects could have a material adverseeffect on our ability to implement our growth strategy and, ultimately, our business prospects, financial condition and results of operations.
Furthermore, from time to time, we may believe it in the best interests of ourselves and our stockholders to dispose of power projects. For example, during 2018 wedisposed of interests in each of the El Arrayán and K2 project. Reasons for a disposal may include limited opportunities in a market, changes in business environment orlaw which reduces the attractiveness of a market, excessive competition in the market, changes in business strategy, or a belief we can utilize funds realized from such adisposal in a more productive manner or generate a higher return on investment. The disposal of power projects involves numerous risks, many of which are outside of ourcontrol, including the ability to locate an attractive buyer of a power project, the management attention required to devote to the disposal, the ability to obtain a favorableprice for a power project, the length of time required to complete the disposal process, and the potential difficulty of re-entering a market in the future after exiting amarket. In addition, in connection with the disposal of projects we may agree to indemnities or other provisions which expose us to potential ongoing liability after thedisposal which exposes us to risks. No assurances can be given that we would be successful in consummating any disposal in a timely manner (or at all), that we wouldachieve an attractive
37

(or positive) financial return from the disposal, or that we would be successful in re-deploying funds generated from any disposal in a manner that would generate higherreturns.
Our ability to grow our cash available for distribution is substantially dependent on our ability to make acquisitions on economically favorable terms.
Our goal of growing our cash available for distribution and increasing dividends to our Class A stockholders is substantially dependent on our ability to make and financeacquisitions on terms that result in an increase in cash available for distribution per Class A share. To grow our cash available for distribution per Class A share throughacquisitions, we must be able to acquire new generation assets, such as the Identified ROFO Projects, on economically favorable terms. If we are unable to make accretiveacquisitions from Pattern Development or third parties because we are unable to identify attractive acquisition opportunities, negotiate acceptable purchase contracts, obtainfinancing on economically acceptable terms or are outbid by competitors, we may not be able to realize our targeted growth in cash available for distribution per Class Ashare.
The energy industry in the markets in which we operate, as well as the markets we are looking to expand into, benefit from governmental support that is subject tochange. Regulatory uncertainty in the clean energy sector, including with respect to environmental and tax policies, may have adverse impacts on the renewable energyindustry and our business.
The energy industry (including both fossil fuel and renewable energy sources) in the markets in which we operate and are looking to expand into benefits in general fromvarious forms of governmental support. Renewable energy sources in Canada benefit from federal and provincial incentives, such as RPS programs, accelerated costrecovery deductions, the availability of off-take contracts through RFP and standard offer programs including the Hydro-Quebec call for tenders, the Ontario feed-in tariffand large renewable procurement programs (which operated until late 2018), and other commercially oriented incentives. Renewable energy sources in the United Stateshave benefited from various federal and state governmental incentives, such as PTCs, ITCs, ITC cash grants, loan guarantees, RPS programs, property tax abatements andaccelerated tax depreciation. PTCs and ITCs for wind and solar energy on the federal level were extended in December 2015, subject to phase down for wind projects thatbegan construction by 2019 and solar projects that begin construction by 2021. In 2012, Japan introduced a feed-in-tariff program that offered fixed term, fixed pricecontracts of up to 20 years to renewable power projects. It is expected that the fixed feed-in-tariff program will fade out from March 2021. The Mexican congress hasestablished a mandate that at least 35% of its energy consumption be supplied by clean sources by 2024.
While such developments extending various forms of governmental support provide general benefits to the wind and solar power industries in which we operate, to theextent that these governmental incentive programs may be amended or changed in the future, particularly if amendments or changes are unexpected or unfavorable andafter we have developed long-term business plans and strategies based upon them, it could adversely affect the price of electricity sold to power purchasers generated bydeveloped or planned renewable energy projects, decrease demand for renewable energy, or reduce the number of projects available to us for acquisition, any of whichcould have a material adverse effect on our ability to implement our growth strategy and, ultimately, our business prospects, financial condition and results of operations.For example, the U.S. Environmental Protection Agency (EPA) under the current U.S. administration repealed the Clean Power Plan in 2019, a regulation issued by theEPA under the prior U.S. administration aimed at reducing use of existing coal fired electricity generation facilities and increasing renewable generation in order to reducegreenhouse gas emissions. The current U.S. administration has also proposed and taken actions to implement other policies that have created regulatory uncertainty in therenewable energy sector, including the sectors in which we operate, and may lead to a reduction or removal of various renewable energy programs and initiatives designedto curtail climate change. Such a reduction or removal of incentives may diminish the markets in which we operate. As a part of comprehensive income tax reform in 2017,the corporate tax rate was reduced, and while such reductions have certain positive impacts on our financial results as applied to our own corporate taxes, a reduction in thecorporate tax rate could also have adverse consequences, such as diminishing the capacity of potential investors in our projects to benefit from incentives and reduce thevalue of accelerated depreciation deductions. In addition, as a part of comprehensive tax reform in 2017, there were proposed amendments in Congress that would haveadversely affected the value and ability to preserve benefits of PTCs and ITCs for wind and solar energy on the federal level. While these amendments were in large partnot adopted, no assurances can be given that there will not be future efforts to make amendments that could adversely affect the value and benefits of the PTC. The currentU.S. administration has also made public statements and taken actions regarding overturning or modifying policies of or regulations enacted by the prior administration thatplaced limitations on coal and gas electric generation, mining and/or exploration. Efforts to overturn federal and state laws, regulations or policies that are supportive ofrenewable energy generation or that remove costs or other limitations on other types of generation that compete with renewable energy projects could materially andadversely affect our business prospects, financial condition or results of operations.
Wind power procurement in Canada is a provincial matter, with relatively irregular, infrequent and competitive procurement windows.
Each province in Canada has its own regulatory framework and renewable energy policy, with few material federal policies to drive the growth of renewable energy.Renewable energy developers must anticipate the future policy direction in each of the provinces, and secure
38
viable projects before they can bid to procure a PPA through highly competitive PPA auctions. Most markets are relatively small. Renewable energy procurement maychange dramatically as a result of changes in the provincial government or political climate. For example, the current administration in Ontario has made pledges to revampthe province’s energy policies (such as the cap-and-trade program) and taken steps to cancel and wind down certain contracts for renewable power projects that are in thepre-construction phase. Further, the Ontario government enacted legislation in late 2018 to repeal the Green Energy Act which was a significant part of the framework forrenewables development in the province since its enactment in 2009. These measures were taken in connection with specific pledges made by the incoming governmentduring the election process.
We face competition primarily from infrastructure funds and IPPs focused on renewable energy generation.
We believe our primary competitors are infrastructure funds and some IPPs, including other wind companies, focused on renewable energy generation. We compete withthese companies to acquire well-developed projects with projected stable cash flows that can be built in a cost-effective manner. We also compete with other renewableenergy developers and operators for the limited pool of personnel with requisite industry knowledge and experience. Furthermore, in past years, there have been times ofincreased demand for wind turbines, solar panels and their related components, causing such suppliers to have difficulty meeting the demand. If these conditions return inthe future, such suppliers may give priority to other market participants, including our competitors, who may have resources greater than ours.
We compete with other renewable energy companies (and power companies in general) for the lowest cost financing, which provides the highest returns for our projects.Once we have acquired a construction project and put it into operation, we may compete on price if we sell electricity into power markets at wholesale market prices.Depending on the regulatory framework and market dynamics of a region, we may also compete with other wind power companies and other renewable energy generators,when our projects bid on or negotiate for long-term power sale agreements or sell electricity or RECs into the spot-market.
We have no control over where our competitors may erect wind power projects. Our competitors may erect wind power projects adjacent to our wind projects that maycause upwind array losses to occur at our wind projects. Upwind array losses reflect the diminished wind resource available at a project resulting from interference withavailable wind caused by adjacent wind turbines. An adjacent wind power project that causes upwind array losses could have a material adverse effect on our revenues andresults of operations.
Any change in power consumption levels could have a material adverse effect on our business prospects, financial condition and results of operations.
The amount of wind and solar power consumed by the electric utility industry is affected primarily by the overall demand for electricity, environmental and othergovernmental regulations and the price and availability of fuels such as nuclear, coal, natural gas and oil as well as other sources of renewable energy. Slow growth inoverall demand for electricity or a long-term reduction in the demand for renewable energy could have a material adverse effect on our plan to grow our business and could,in turn, have a material adverse effect on our business prospects, financial condition and results of operations. A decline in prices for fossil fuels could cause demand forwind and/or solar power to decrease and adversely affect the demand for our products. For example, low natural gas prices have led, in some instances, to increased naturalgas consumption by electricity-generating utilities in lieu of other power sources. To the extent renewable energy becomes less cost-competitive on an overall basis as aresult of a lack of governmental incentives, cheaper alternatives or otherwise, demand for wind and solar power could decrease.
Some states and provinces with renewable energy targets have met their targets, or will meet them in the near future, which could cause demand for new wind andsolar power capacity to decrease.
State RPS programs in the United States represent roughly half of all growth in non-hydro renewable electricity generation since 2000. Enactment of new RPS policies haswaned but states have continued to hone existing policies. More than half of all RPS states have raised their overall RPS targets or carve-outs since initial RPS adoption.Since the start of 2018, ten states increased their RPS targets, while New York established an offshore wind procurement target and Ohio lowered its target. It has beenestimated that eight states will reach their final RPS target year within the next few years, seven states in 2025 to 2026, and ten states have targets extending to 2030 orbeyond.
While some Canadian provinces have increased their renewable energy targets - Saskatchewan 50% by 2030 and Alberta 30% by 2030 - others have reduced their demandfor renewables, including Ontario, which has halted its Large Renewable Procurement Process. Additionally, in Canada, hydro power dominates when it comes to meetingrenewable energy targets.
39
As a result of achieving targets, and if such U.S. states and Canadian provinces do not increase non-hydro renewable energy targets in the future, demand for additionalwind and solar power generating capacity could decrease, which could have a material adverse effect on our business prospects, financial condition, and results ofoperations.
Since initially announcing Japan’s 2030 Energy Targets in June 2015, Japan has made significant progress towards meeting the renewable energy target of 22% to 24%.While the target for nuclear power remains unmet, and the ability to ever reach it is questionable, solar power has already exceeded its goal, and if Japan were to limitfuture renewable energy growth to the current numbers, the push for continued growth could be limited which could have an adverse effect on our business prospects.
In spite of our Pattern Development Purchase Rights, it is possible that Pattern Development might be sold to third parties. In addition, each of our Project PurchaseRights and Pattern Development Purchase Rights may expire, and the Second Amended and Restated Non-Competition Agreement with Pattern Energy Group LP andPattern Development might terminate.
To the extent we do not exercise our Pattern Development Purchase Rights (or upon their expiration), Pattern Development or substantially all of its assets may be sold tothird parties, including our competitors. Even if we are interested in exercising the Pattern Development Purchase Rights, Pattern Development may seek a purchaser at aninopportune time for us, or we may not be able to reach an agreement on pricing or other terms. If we are unable to reach an agreement with Pattern Development, or itsequity owners or if we decline to make an offer, Pattern Development, or its equity owners may seek alternative buyers, which could have a material adverse effect on ourability to implement our growth strategy and, ultimately, our business prospects, financial condition and results of operations.
In addition, our Project Purchase Right with Pattern Development and our Pattern Development Purchase Rights terminate upon winding-up of Pattern Development.Following termination of our Project Purchase Right and Pattern Development Purchase Rights, Pattern Development will be under no obligation to offer any of its projectsto us, which could have a material adverse effect on our ability to implement our growth strategy and ultimately on our business prospects, financial condition and results ofoperations.
Once our Purchase Rights with Pattern Development terminate, the Second Amended and Restated Non-Competition Agreement with respect to Pattern Development willalso terminate. In addition, we also have the right to terminate the Second Amended and Restated Non-Competition Agreement upon the earlier of wind-up of PatternDevelopment or the valid rejection by Pattern Development of three or more first rights project offers representing a cumulative net capacity of at least 600 MWs. Underthe Second Amended and Restated Non-Competition Agreement, (among other things) Pattern Development is granted an exclusive right, with certain exceptions, topursue all power generation, storage or transmission development projects in the U.S., Canada and Mexico that have not completed construction, but this does not restrictus from acquiring any company or business that is principally engaged in the business of owning and operating renewable energy facilities. In addition, at any time thatTokyo, Japan-based GPI is majority owned by either us, Pattern Energy Group LP or Pattern Development, such majority owner (which is currently Pattern Development)is granted exclusive development rights, with certain exceptions, over power generation, storage or transmission projects in Japan.
While we also have each of a Project Purchase Right with Pattern Energy Group LP and a Pattern Energy Group LP Purchase Right, we do not expect to acquire additionalprojects from Pattern Energy Group LP which is in the process of winding up.
We may decide to further expand our acquisitions of non-wind power projects which may present unforeseen challenges.
With the consummation of the acquisition of the 35-mile 345 kV Western Interconnect transmission line as a part of the acquisition of the Broadview projects in April2017, and the consummation of the acquisitions of the Kanagi Solar and Futtsu Solar projects (representing in aggregate 39 MW of owned-capacity in solar) in March2018, we have expanded our operations into other types of projects besides wind power. In the future, we may further expand our acquisitions of non-wind power projects,including additional acquisitions of transmission, solar, or other types of power projects. There can be no assurance that we will be able to identify other attractive non-wind acquisition opportunities or acquire such projects at a price and on terms that are attractive or that, once acquired, such projects will operate profitably. Additionally,these acquisitions could expose us further to increased operating costs, unforeseen liabilities or risks, and regulatory and environmental concerns associated with expandingfurther into new sectors of the power industry, including requiring a disproportionate amount of our management’s attention and resources, which could have an adverseimpact on our business. A failure to successfully integrate such acquisitions into our existing project portfolio as a result of unforeseen operational difficulties or otherwise,could have a material adverse effect on our business prospects, financial condition and results of operations.
We are subject to risks associated with litigation or administrative proceedings that could materially impact our operations, including proceedings in the future relatedto power projects we subsequently acquire.
We are subject to risks and costs, including potential negative publicity, associated with lawsuits, in particular, with respect to environmental claims, claims contesting theconstruction or operation of our projects, or shareholder suits. See Item 3 "Legal Proceedings.” The result
40
of, and costs associated with, defending any such lawsuit, regardless of the merits and eventual outcome, may be material and could have a material adverse effect on ouroperations. In the future, we may be involved in legal proceedings, disputes, administrative proceedings, claims and other litigation that arise in the ordinary course ofbusiness related to a power project that we subsequently acquire. For example, individuals and interest groups may sue to challenge the issuance of a permit for a powerproject or seek to enjoin construction or operation of a power project. We may also become subject to claims from individuals who live in the proximity of our powerprojects based on alleged negative health effects, such as acoustics caused by wind turbines or alleged contamination of groundwater, or claims of nuisance caused by apower project as a result of alleged unsightliness or potential decrease in property values. In addition, we have been and may subsequently become subject to legalproceedings or claims contesting the construction or operation of our power projects. In addition, indigenous communities in the United States and Canada, includingNative Americans and First Nations, are becoming more involved in the development of wind power projects and have certain treaty rights that can negatively affect theviability of power projects.
Legal proceedings or disputes could delay our ability to complete construction of a power project in a timely manner, or at all, or materially increase the costs associatedwith commencing or continuing commercial operations at a power project. Settlement of claims and unfavorable outcomes or developments relating to these proceedings ordisputes, such as judgments for monetary damages, injunctions or denial or revocation of permits, could have a material adverse effect on our ability to implement ourgrowth strategy and, ultimately, our business prospects, financial condition and results of operations.
Risks Related to Our Financial Activities
The Series A Perpetual Preferred Stock gives the holders thereof liquidation and distribution preferences, certain rights relating to our business and management, andunder certain circumstances, the conversion of such shares potentially causing dilution to our common stockholders.
In October 2019, we issued 10.4 million shares of Series A Perpetual Preferred Stock (the Preferred Shares), which rank senior to our Class A common stock with respectto distribution rights and rights upon liquidation. Subject to certain exceptions, so long as any Preferred Shares remain outstanding, we may not declare any dividend ordistribution on our Class A common stock unless all accumulated and unpaid dividends have been declared and paid on the Preferred Shares. In the event of our liquidation,winding-up or dissolution, the holders of the Preferred Shares would have the right to receive proceeds from any such transaction before the holders of the Class A commonstock. The payment of the liquidation preference could result in common stockholders not receiving any consideration if we were to liquidate, dissolve or wind up, eithervoluntarily or involuntarily. Additionally, the existence of the liquidation preference may reduce the value of the Class A common stock, make it harder for us to sell sharesof Class A common stock in offerings in the future, or, in certain circumstances, prevent or delay a change of control.
In connection with the issuance of the Preferred Shares, we entered into an agreement with the purchasers of the Preferred Shares (the Purchasers), pursuant to which wegranted certain of the Purchasers certain limited information rights, consent rights and rights with respect to future issuances of preferred stock by us. In addition, theCertificate of Designations governing the Preferred Shares provides the holders of the Preferred Shares with the right to vote on a one-to-one as-converted basis with ourcommon stockholders on matters submitted to a stockholder vote, subject to certain limitations. Also, so long as any Preferred Shares are outstanding, the affirmative voteor consent of the holders of two-thirds of the outstanding Preferred Shares, voting together as a separate class, will be necessary to (subject to certain exceptions): (i)amend, alter or repeal any provision of the Certificate of Designations that would adversely affect the rights, preferences, privileges or voting powers of the holders of thePreferred Shares or (ii) issue any additional shares of Preferred Shares or any stock ranking senior to the Preferred Shares. These restrictions may adversely affect ourability to finance our future operations or capital needs or to engage in other business activities.
Furthermore, our option to convert the Preferred Shares into Class A common stock beginning on or after the five-year anniversary of the issuance of the Preferred Shares,or the option of the holders to elect to convert the Preferred Shares upon the occurrence of certain types of change of control transactions, may cause substantial dilution toholders of the Class A common stock. In addition, under certain types of change of control, holders may be entitled to receive specified premiums upon a conversion or aredemption, as applicable, which could be significant. The net effect of the possible dilution and/or premium in connection with certain types of change of controltransactions could deter or delay potential change of control transactions and/or adversely impact our cash flow and financial position. Because our Board of Directors isentitled to designate the powers and preferences of preferred stock without a vote of our Class A common stockholders, subject to Nasdaq rules and regulations, our ClassA common stockholders will have no control over what designations and preferences our future preferred stock, if any, will have.
In the event the Merger Agreement is consummated, such merger would constitute a “Permitted Private Change of Control” as defined in the Certificate of Designationsgoverning the Preferred Shares. As a result, the proposed merger, if consummated, would result in certain adjustments to the terms of the Preferred Shares, including anincrease in dividend rate and certain adjustments to the
41
contingent dividends. The proposed merger, if consummated, will not give rise to the rights upon a Change of Control Event (as defined in the Certificate of Designationsgoverning the Preferred Shares).
Our substantial amount of indebtedness may adversely affect our ability to operate our business and impair our ability to pay dividends.
Our consolidated indebtedness not including financing costs as of December 31, 2019 was approximately $3.4 billion. Despite our current consolidated debt levels, we orour subsidiaries may still incur substantially more debt or take other actions which would intensify the risks discussed below.
Our substantial indebtedness could have important consequences, including, for example:
• failure to comply with the covenants in the agreements governing these obligations could result in an event of default under those agreements, or, under certaincircumstances, cross-default to other debt instruments, which could be difficult to cure, or result in our bankruptcy;
• in the event a project is unable to meet its debt service obligations through its own project cash flows, excess cash flow from other projects may be required to helpservice such obligations, thereby reducing funds available to pay dividends;
• in the event a project is unable to meet its debt service obligations, it may result in a foreclosure on the project collateral and loss of the project;
• our limited financial flexibility could reduce our ability to plan for and react to unexpected opportunities;
• our substantial debt service obligations make us vulnerable to adverse changes in general economic, credit and capital markets, industry and competitiveconditions and adverse changes in government regulation, and place us at a disadvantage compared with competitors with less debt; and
• the need to repay or otherwise refinance maturing indebtedness which we may not be able to do on favorable terms or at all. For example, we have issued $225million of 4.0% convertible senior notes which mature on July 15, 2020 and we have issued $350 million of 5.875% unsecured senior notes which mature onFebruary 1, 2024.
Any of these consequences could have a material adverse effect on our business prospects, financial condition and results of operations. If we do not comply with ourobligations under our debt instruments, we may be required to refinance all or part of our existing debt, borrow additional amounts or sell securities, which we may not beable to do on favorable terms or at all. In addition, increases in interest rates and changes in debt covenants may reduce the amounts that we can borrow, reduce our cashflows and increase the equity investment we may be required to make to complete any construction of our projects. These increases could cause some of our projects tobecome economically unattractive. If we are unable to raise additional capital or generate sufficient operating cash flow to repay our indebtedness, we could be in defaultunder our lending agreements and could be required to delay construction of our projects, forgo acquisition opportunities for additional projects, reduce overhead costs,reduce the scope of our projects or abandon or sell some or all of our projects, all of which could have a material adverse effect on our business prospects, financialcondition and results of operations.
Our indebtedness may limit the amount of cash flow available to invest in the ongoing needs of our business which could have a material adverse effect on businessprospects, financial condition and results of operations.
Subject to interim operating covenants under the Merger Agreement and the limits contained in our revolving credit facility, we may incur substantial additional debt fromtime to time to finance working capital, capital expenditures, investments or acquisitions, or for other purposes. If we do so, the risks related to our level of indebtednesscould intensify. Specifically, a high level of indebtedness could have important consequences due to the adverse ways in which it affects us, including the following:
• requiring us to dedicate a substantial portion of our cash flow from operations to payments on our indebtedness, thereby reducing the availability of our cash flowto fund working capital, capital expenditures, dividend payments, development activity, acquisitions and other general corporate purposes;
• increasing our vulnerability to adverse general economic or industry conditions;
• limiting our flexibility in planning for, or reacting to, changes in our business or the industries in which we operate;
• making us more vulnerable to increases in interest rates, as borrowings under our revolving credit facility are at variable rates;
• limiting our ability to obtain additional financing in the future for working capital or other purposes; and
• placing us at a competitive disadvantage compared to our competitors that have less indebtedness.
42

Our ability to comply with restrictions and covenants under the terms of our indebtedness may be affected by events beyond our control, including prevailing economic,financial and industry conditions. As a result, there can be no assurance that we will be able to comply with these restrictions and covenants, and any such default under ourdebt agreements could have a material adverse effect on our business by, among other things, limiting our ability to take advantage of financing, merger and acquisition orother corporate opportunities.
Despite our current consolidated debt levels, we and our subsidiaries may be able to incur substantial additional debt in the future, subject to interim operating covenantsunder the Merger Agreement, the restrictions contained in our revolving credit facility and our future debt instruments, some of which may be secured debt. Although theinterim operating covenants under the Merger Agreement and our revolving credit facility contains restrictions on the incurrence of additional indebtedness, theserestrictions are subject to a number of qualifications and exceptions and could be amended or waived, and the indebtedness incurred in compliance with these restrictionscould be substantial and may also be secured. Accordingly, we may, in compliance with these restrictions, incur additional debt, secure existing or future debt, recapitalizeour debt or take a number of other actions that are not limited by the terms of our existing indebtedness and that could have the effect of intensifying the risks discussedabove.
We may not have the ability to raise the funds necessary to make payments in cash which may be required under the terms of the notes we have issued upon conversionsettlement, repayment at maturity, or upon exercise of a repurchase obligation, and our debt agreements may limit our ability to pay cash upon conversion, repurchaseor redemption of these notes.
Holders of the convertible notes we issued in July 2015 have the right to require us to repurchase all or a portion of their convertible notes upon the occurrence of afundamental change at a repurchase price equal to 100% of the principal amount of the notes to be repurchased, plus accrued and unpaid interest, if any. In addition, uponconversion of the convertible notes, unless we elect to deliver solely our Class A shares to settle such conversion (other than paying cash in lieu of delivering any fractionalshare), we will be required to make cash payments in respect of the convertible notes being converted. In addition, holders of the senior notes we issued in January 2017may have the right to require us to repurchase all or a portion of their notes upon a change of control triggering event at a repurchase price equal to 101% of the principalamount of the notes to be repurchased, plus accrued and unpaid interest, if any.
While we have plans to address such provisions in the convertible notes and senior notes as a result of the transactions contemplated by the Merger Agreement, in the eventthe Merger Agreement was not consummated, we may not have enough available cash or be able to obtain financing at the time we are required to make repurchases ofnotes surrendered therefor, pay cash at their maturity, or (with respect to convertible notes) pay cash upon conversion settlement. In addition, our ability to repurchase thenotes or to pay cash upon conversions of the convertible notes may be limited by law, regulatory authority or agreements governing our indebtedness. Our failure torepurchase notes at a time when the repurchase is required by the indenture or (with respect to the convertible notes) to pay any cash payable on future conversions of theconvertible notes pursuant to the indenture would constitute a default under the indenture governing the issuance of the respective notes. A fundamental change, change ofcontrol triggering event, or a default under the indenture could also lead to a default under agreements governing our or our subsidiaries’ indebtedness. If the repayment ofthe related indebtedness were to be accelerated after any applicable notice or grace periods, we may not have sufficient funds to repay the indebtedness and repurchase thenotes or make cash payments upon redemptions thereof.
The conditional conversion feature of the convertible notes we have issued, if triggered, may adversely affect our financial condition and operating results.
The convertible notes we issued in July 2015 have a conditional conversion feature. In the event the conditional conversion feature of the convertible notes is triggered,holders of convertible notes will be entitled to convert such notes at any time during specified periods at their option. If one or more holders elect to convert theirconvertible notes, unless we elect to satisfy our conversion obligation by delivering solely our Class A shares (other than paying cash in lieu of delivering any fractionalshare), we would be required to settle a portion or all of our conversion obligation through the payment of cash, which could adversely affect our liquidity.
Provisions in the indentures governing our outstanding notes may deter or prevent a business combination that may be favorable to investors.
While we have plans to address fundamental change and change of control triggering event provisions in the convertible notes and senior notes, respectively, as a result ofthe transactions contemplated by the Merger Agreement, in the event the Merger Agreement was not consummated and if a fundamental change occurs prior to the maturitydate of the convertible notes we issued in July 2015 or a change of control triggering event occurs prior to the maturity date of the senior notes we issued in January 2017,holders of such notes may have the right, at their option, to require us to repurchase all or a portion of their respective notes. In addition, if a make-whole fundamentalchange occurs prior to the maturity date of the convertible notes, we will in some cases be required to increase the conversion rate for a holder that elects to convert itsconvertible notes in connection with such make-whole fundamental change. Furthermore, our indentures prohibit us from engaging in certain mergers or acquisitionsunless, among other things, the surviving entity assumes our obligations
43
thereunder. These and other provisions in our indentures could deter or prevent a third party from acquiring us even when the acquisition may be favorable to investors.
If our subsidiaries default on their obligations under their project-level debt, we may decide to make payments to lenders to prevent foreclosure on the collateralsecuring the project-level debt, which would, without such payments, cause us to lose certain of our projects.
Our subsidiaries incur various types of debt. Non-recourse debt is repayable solely from the applicable project’s revenues and is secured by the project’s physical assets,major contracts, cash accounts and, in many cases, our ownership interest in the project subsidiary. Limited recourse debt is debt where we have provided a limitedguarantee, and recourse debt is debt where we have provided a full guarantee, which means if our subsidiaries default on these obligations, we will be liable directly tothose lenders, although in the case of limited recourse debt only to the extent of our limited recourse obligations. To satisfy these obligations, we may be required to useamounts distributed by our other subsidiaries as well as other sources of available cash, reducing our cash available to execute our business plan and pay dividends toholders of our Class A shares. In addition, if our subsidiaries default on their obligations under non-recourse financing agreements, we may decide to make payments toprevent the lenders of these subsidiaries from foreclosing on the relevant collateral. Such a foreclosure would result in our losing our ownership interest in the subsidiary orin some or all of its assets. The loss of our ownership interest in one or more of our subsidiaries or some or all of their assets could have a material adverse effect on ourbusiness prospects, financial condition and results of operations and, in turn, on our cash available for distribution.
We are subject to indemnity and guarantee obligations.
We provide a variety of indemnities in the ordinary course of business to contractual counterparties and to our lenders and other financial partners. For example, the HatchetRidge indemnity indemnifies MetLife Capital, Limited Partnership, the owner participant, under the Hatchet Ridge Wind Lease Financing against certain tax losses. Inaddition, we have entered into tax equity partnership agreements in connection with nine of our projects which also provide for specific allocations in certaincircumstances.
Our failure to pay any of these indemnities would enable the applicable project lenders to foreclose on the project collateral. The payments we may be obligated to makepursuant to these indemnities could have a material adverse effect on our business prospects, financial condition and results of operations and, in turn, on our cash availablefor distribution.
Our variable rate indebtedness subjects us to interest rate risk, which could cause our debt service obligations to increase significantly.
Certain borrowings under our revolving credit facility and certain of our project level indebtedness are subject to variable rates of interest, primarily based on theInternational Continental Exchange London Interbank Offered Rate (LIBOR) or Canadian Dollar Offered Rate (CDOR). In addition, certain of our Japanese entities haveentered into a credit facility with variable rates of interest based upon the Tokyo Interbank Offered Rate (TIBOR). Borrowings with variable rates of interest, expose us tointerest rate risk. Such rates tend to fluctuate based on general economic conditions, general interest rates, Federal Reserve rates and the supply of and demand for credit inthe relevant interbanking market. Increases in the interest rate generally, and particularly when coupled with any significant variable rate indebtedness, could materiallyadversely impact our interest expenses. If interest rates were to increase, our debt service obligations on the variable rate indebtedness would increase even though theamount borrowed remained the same, and our net income and cash flows, including cash available for servicing our indebtedness, will correspondingly decrease. Ahypothetical increase or decrease in interest rates by 1% would have a $4 million impact on interest expense for the year ended 2019. As of December 31, 2019, $350million was outstanding under our revolving credit facility and the Japan credit facility. To the extent we borrow under such facilities, we are not required to enter intointerest rate swaps to hedge such indebtedness. If we decide not to enter into hedges on such indebtedness, our interest expense on such indebtedness will fluctuate based onLIBOR, CDOR, TIBOR or other variable interest rates. Consequently, we may have difficulties servicing such unhedged indebtedness and funding our other fixed costs,and our available cash flow for general corporate requirements may be materially adversely affected. In the future, we may enter into interest rate swaps that involve theexchange of floating for fixed rate interest payments in order to reduce interest rate volatility. However, we may not maintain interest rate swaps with respect to all of ourvariable rate indebtedness, and any swaps we enter into may not fully mitigate our interest rate risk.
In addition, in July 2017, the head of the United Kingdom Financial Conduct Authority announced the desire to phase out the use of LIBOR by the end of 2021. If LIBORceases to exist, we may need to renegotiate our revolving credit facility and certain of our project level indebtedness that bear interest based on LIBOR or to endeavor, inthe case of our revolving credit facility, with the applicable agents thereunder, to amend such facilities to substitute LIBOR with an alternative rate of interest that gives dueconsideration to the then-prevailing market convention for syndicated loans in the U.S., subject to notice to all lenders and the absence of objection by the “requiredlenders.” Any change in accordance with the aforementioned procedures, or the conversion of loans to base rate or prime rate loans, could have an adverse impact on ourcost of capital. Currently, there is no definitive information regarding the future utilization of LIBOR or
44
of any particular replacement rate. As such, the potential effect of any such event on our business, financial condition, cash flows and results of operations cannot yet bedetermined.
Our hedging activities may not adequately manage our exposure to commodity and financial risk, which could result in significant losses or require us to use cashcollateral to meet margin requirements, each of which could have a material adverse effect on our business prospects, financial condition, results of operations andliquidity, which could impair our ability to execute favorable financial hedges in the future.
Certain of the electricity we generate is sold on the open market at spot-market prices. In order to stabilize all or a portion of the revenue from such sales, we have entered,and may in the future enter, into financial swaps, day-ahead sales transaction or other hedging arrangements. We may acquire additional assets in the future with similarhedging agreements. In an effort to stabilize our revenue from electricity sales from these projects, we evaluate the electricity sale options for each of our projects,including the appropriateness of entering into a PPA, a physical sale, a financial swap, or combination of these arrangements. If we sell our electricity into an ISO marketwithout a PPA, we may enter into a physical sale or financial swap to stabilize all or a portion of our estimated revenue stream. Under the term of our existing physicalsales, we are obligated to physically deliver electricity to a common delivery point. Under these arrangements, we sell the electricity produced at our facility to the ISO atthe project node and buy electricity at the common delivery point to meet the delivery obligations under the physical sale. The delivery obligations under the physical saleare for specified volumes in each hour for an overall quantity that we estimate we are highly likely to produce. Under the terms of our existing financial swaps, we are notobligated to physically deliver or purchase electricity. Instead, we receive payments for specified quantities of electricity based on a fixed price and are obligated to pay ourcounterparty the real time market price for the same quantities of electricity. These financial swaps cover quantities of electricity that we estimate we are highly likely toproduce. Gains or losses under the physical sales and financial swaps are designed to be offset by decreases or increases in our revenues from real time market sales ofelectricity in liquid ISO markets. However, the actual amount of electricity we generate from operations may be materially different from our estimates for a variety ofreasons, including variable wind conditions and wind turbine availability. If a project does not generate the volume of electricity covered by the associated physical sale orfinancial swap contract, we could incur significant losses if electricity prices in the market rise substantially above the fixed price provided for in the physical sale orfinancial swap. If a project generates more electricity than is contracted in the physical sale or financial swap, the excess production will not be hedged and the relatedrevenues will be exposed to market price fluctuations. These risks will further increase as we increase power market trading activities.
We would also incur financial losses as a result of adverse changes in the mark-to-market values of the financial swaps or if the counterparties to our hedging contracts failto make payments when due. We could also experience a reduction in cash flow if we are required to post margin in the form of cash collateral to secure our delivery orpayment obligations under these hedging agreements. We are not currently required to post cash collateral or issue letters of credit to backstop our obligations under ourhedging arrangements after commercial operation has been achieved, but we may be required to do so in the future. If we were required to do so, our available cash oravailable borrowing capacity under the credit facilities under which these letters of credit are issued would be correspondingly reduced.
We enter into PPAs when we sell our electricity into markets other than deregulated ISO markets or where we believe it is otherwise advisable. Under a PPA, we contract tosell all or a fixed proportion of the electricity generated by one of our projects, sometimes bundled with RECs and capacity or other environmental attributes, to a powerpurchaser which is often a utility or large commercial entity. We do this to stabilize our revenues from that project. We are exposed to the risk that the power purchaser willfail to perform under a PPA, with the result that we will have to sell our electricity at the market price sometime in the future, which could be substantially lower than theprice provided in the applicable PPA. In most instances, we also commit to sell minimum levels of generation on an annual basis to the power purchaser. If the projectgenerates less than the committed minimum volumes, we may be required to buy the shortfall of electricity (or RECs and other environmental attributes) on the openmarket or make payments of liquidated damages or be in default under a PPA, which could result in its termination.
We sometimes seek to sell forward a portion of our RECs or other environmental attributes to fix the revenues from those attributes and hedge against future declines inprices of RECs or other environmental attributes. If our projects do not generate the amount of electricity required to earn the RECs or other environmental attributes soldforward or if for any reason the electricity we generate does not produce RECs or other environmental attributes for a particular state, we may be required to make up theshortfall of RECs or other environmental attributes through purchases on the open market or make payments of liquidated damages. Further, current market conditions maylimit our ability to hedge sufficient volumes of our anticipated RECs or other environmental attributes, leaving us exposed to the risk of falling prices for RECs or otherenvironmental attributes. Future prices for RECs or other environmental attributes are also subject to the risk that regulatory changes will adversely affect prices.
45
Risks Related to Ownership of our Class A Shares
We are a holding company with no operations of our own, and we depend on our power projects for cash to fund all of our operations and expenses, including to makedividend payments.
Our operations are conducted almost entirely through our power projects and our ability to generate cash to meet our debt service obligations or to pay dividends isdependent on the earnings and the receipt of funds from our project subsidiaries through distributions or intercompany loans. Our power projects’ ability to generateadequate cash depends on a number of factors, including wind conditions, timely completion of any construction projects, the price of electricity, payments by key powerpurchasers, increased competition, foreign currency exchange rates, compliance with all applicable laws and regulations and other factors. See Item 1A "Risk Factors-RisksRelated to the Business Segments in which We Operate.” Our ability to declare and pay regular quarterly cash dividends is subject to our obtaining sufficient cashdistributions from our project subsidiaries after the payment of operating costs, debt service and other expenses. See Item 5 “Market for Registrant’s Common Equity andRelated Stockholder Matters-Cash Dividend to Investors.” We may lack sufficient available cash to pay dividends to holders of our Class A shares due to shortfallsattributable to a number of operational, commercial or other factors, including insufficient cash flow generation by our projects, as well as unknown liabilities, the costassociated with governmental regulation, increases in our operating or general and administrative expenses, principal and interest payments on our and our subsidiaries’outstanding debt, tax expenses, working capital requirements and anticipated cash needs.
Our cash available for distribution to holders of our Class A shares may be reduced as a result of restrictions on our subsidiaries’ cash distributions to us under theterms of their indebtedness, or in the event certain specified events occurred under our tax equity arrangements that change the percentage of cash distributions to bemade to the tax equity investors.
We intend to declare and pay regular quarterly cash dividends on all of our outstanding Class A shares. However, in any period, our ability to pay dividends to holders ofour Class A shares depends on the performance of our subsidiaries and their ability to distribute cash to us, as well as all of the other factors discussed under Item 5“Market for Registrant’s Common Equity and Related Stockholder Matters-Cash Dividend to Investors.” The ability of our subsidiaries to make distributions to us may berestricted by, among other things, the provisions of existing and future indebtedness and the provisions of existing and future tax equity arrangements.
Restrictions on distributions to us by our subsidiaries under our revolving credit facility and the agreements governing their respective project-level debt could limit ourability to pay anticipated dividends to holders of our Class A shares. These agreements contain financial tests and covenants that our subsidiaries must satisfy prior tomaking distributions. We may agree to similar restrictions on distributions under future debt instruments we may enter into in connection with future note or bond offerings.If any of our subsidiaries is unable to satisfy these restrictions or is otherwise in default under such agreements, it would be prohibited from making distributions to us thatcould, in turn, limit our ability to pay dividends to holders of our Class A shares. For example, factors such as low wind conditions and curtailment contributed to certain ofour projects not satisfying financial tests required to permit distributions to us during certain quarters in each of 2018 and 2019. The terms of our project indebtednesstypically require commencement of commercial operations prior to our ability to receive cash distributions from a project. The terms of any such indebtedness alsotypically include cash management or similar provisions, pursuant to which revenues generated by projects subject to such indebtedness are immediately, or upon theoccurrence of certain events, swept into an account for the benefit of the lenders under such debt agreements. As a result, project revenues typically only become availableto us after the funding of reserve accounts for, among other things, operations and maintenance expenses, debt service, taxes and insurance at the project level. In someinstances, projects may be required to sweep cash to reserve funds intended to mitigate the results of pending litigation or other potentially adverse events.
In addition, the terms of operating agreements for our wind facilities with tax equity investors, which include Panhandle 1, Panhandle 2, Post Rock, Logan’s Gap, AmazonWind, Broadview, Stillwater, Grady and Gulf Wind, generally provide for specified allocations of distributions between the tax equity investors and ourselves which changeat a specified point when the tax equity investor has realized a target after tax internal rate of return. In the event this change has not occurred by a targeted date, the taxequity investor begins to receive a greater allocation of distributions until the targeted rate of return has been achieved. In addition, the operating agreements also providefor earlier increases in the percentage of distributable cash to be allocated to the tax equity investors if the project fails to achieve certain defined minimum performancelevels that are likely to cause the tax equity investors to not achieve the targeted after tax return by the targeted date and for increases under certain circumstances to matchallocations of taxable income that are made to mitigate a negative capital account balance for such tax equity investors. As a result, in the event our share of distributablecash from these projects is changed as a result of one of these events, our distributions from such wind facilities may be less than expected that could, in turn, limit ourability to pay dividends to holders of our Class A shares.
Some of our wind facilities with tax equity investors have experienced lower than expected production and merchant power prices resulting in each of those projects failingto pass financial tests that measure cumulative cash distributions to the members. This resulted in each
46
of 2018 and 2019, and could additionally result in 2020, in a change of the cash percentage allocated to the tax equity members which will continue until the shortfall isremedied.
If our projects do not generate sufficient cash available for distribution, we may be required to reduce or eliminate our dividend, or fund dividends from working capital orother sources of liquidity, which may not be available, any of which could have a material adverse effect on the price of our Class A shares and on our ability to paydividends at anticipated levels or at all.
Our ability to pay regular dividends on our Class A shares is subject to the discretion of our Board of Directors, and our cash dividend policy is subject to change. Inaddition, subject to certain exceptions, so long as any Preferred Shares remain outstanding, we may not declare any dividend or distribution on our Class A sharesunless all accumulated and unpaid dividends have been declared and paid on the Preferred Shares.
Holders of our Class A shares have no contractual or other legal right to receive cash dividends from us on a quarterly or other basis and, while we currently intend to atleast maintain our current dividend, our cash dividend policy is subject to all the risks inherent in our business and may be changed at any time.
The payment of future dividends on our Class A shares is at the discretion of our Board of Directors and depends on, among other things, our earnings, financial condition,capital requirements, level of indebtedness, statutory and contractual restrictions applying to the payment of dividends, consideration of factors such as our payout ratio,and other considerations that our Board of Directors deems relevant. During 2019, 2018 and 2017, our payout ratios which is a percentage of dividends paid (on an accrualbasis) compared to our cash available for distribution for such periods were 96%, 99% and 100%, respectively. Our Board of Directors has the authority to establish cashreserves for the prudent conduct of our business, and the establishment of or increase in those reserves could result in a reduction in cash available for distribution to paydividends on our Class A shares at anticipated levels. Accordingly, we may not be able to make, or may have to reduce or eliminate, the payment of dividends on our ClassA shares, which could adversely affect the market price of our Class A shares.
In addition, subject to certain exceptions, so long as any Preferred Shares remain outstanding, we may not declare any dividend or distribution on our Class A shares unlessall accumulated and unpaid dividends have been declared and paid on the Preferred Shares. See Item 1A "Risk Factors - Risks Related to Our Financial Activities - TheSeries A Perpetual Preferred Stock gives the holders thereof liquidation and distribution preferences, certain rights relating to our business and management, and undercertain circumstances, the conversion of such shares potentially causing dilution to our common stockholders.” Upon declaration by our Board of Directors, the PreferredShares will pay cumulative cash dividends at an annual rate of 5.625% (Base Dividend), based on a $25.00 liquidation preference. The Base Dividend increases by 0.5%every year starting on the third anniversary of issuance to a maximum of four escalations, or 7.625%. Preferred Shares are entitled to receive as an additional contingentdividend, 12.6% of distributions made by Pattern Development to us (the Dividend Passthrough). The Dividend Passthrough payable is capped and shall not exceed $3.25per Preferred Share. Unless the full accumulated Base Dividend and any Dividend Passthrough have been declared and paid (or a sum sufficient set aside for suchpayment), dividends may not be declared, paid, or set aside for the Class A shares.
If we fail to maintain proper and effective internal controls, our ability to produce accurate and timely financial statements could be impaired and investors’ views ofus could be harmed.
U.S. securities laws require, among other things, that we maintain effective internal control over financial reporting and disclosure controls and procedures. We mustperform system and process evaluation and testing of our internal control over financial reporting to allow management to report on the effectiveness of our internal controlover financial reporting, as required by Section 404 of the Sarbanes-Oxley Act.
If we identify deficiencies in our internal control over financial reporting that are deemed to be a material weakness or results in multiple material weaknesses (even if suchmaterial weakness or material weaknesses do not result in a misstatement of our financial statements), it could adversely affect investor perceptions of our company. Furthermore, if there was a failure in the effectiveness of our internal controls over financial reporting which results in misstatements in our financial statements, it couldcause us to fail to meet our reporting obligations, could cause the market price of our shares to decline, and we could be subject to sanctions or investigations by the stockexchanges on which we list, the SEC, the Canadian Securities Administrators or other regulatory authorities, and could adversely affect our ability to access the capitalmarkets.
47
We are an SEC foreign issuer under Canadian securities laws and, therefore, are exempt from certain requirements of Canadian securities laws applicable to otherCanadian reporting issuers.
Although we are a reporting issuer in Canada, we are an SEC foreign issuer under Canadian securities laws and are exempt from certain Canadian securities laws relating tocontinuous disclosure obligations and proxy solicitation if we comply with certain reporting requirements applicable in the United States, provided that the relevantdocuments filed with the SEC are filed in Canada and sent to our Class A stockholders in Canada to the extent and in the manner and within the time required by applicableU.S. requirements. In some cases, the disclosure obligations applicable in the United States are different or less onerous than the comparable disclosure requirementsapplicable in Canada for a Canadian reporting issuer that is not exempt from Canadian disclosure obligations. Therefore, there may be less or different publicly availableinformation about us than would be available if we were a Canadian reporting issuer that is not exempt from such Canadian disclosure obligations.
Pattern Energy Group LP’s and Pattern Development’s general partners and their officers and directors have fiduciary or other obligations to act in the best interestsof the owners of such entities, which could result in a conflict of interest with us and our stockholders.
We are party to the Multilateral Management Services Agreement, pursuant to which each of our executive officers (including our Chief Executive Officer) is a sharedexecutive and devotes time to each of our company, Pattern Energy Group LP, and Pattern Development as needed to conduct the respective businesses. As a result, insome instances these shared executives have fiduciary and other duties to these Pattern Development Companies. Conflicts of interest may arise in the future between ourcompany (including our stockholders), and Pattern Energy Group LP and Pattern Development (and their respective owners and affiliates). Our directors and executiveofficers owe fiduciary duties to the holders of our shares. However, Pattern Energy Group LP’s and Pattern Development’s general partners and their officers and directorsalso have a fiduciary duty to act in the best interest of Pattern Energy Group LP’s and Pattern Development’s limited partners, respectively, which interest may differ fromor conflict with that of our company and our other stockholders.
The share ownership of each of PSP Investments and the holders of the Preferred Shares may limit other stockholders’ ability to influence corporate matters, and theinterests of such stockholder may differ from or conflict with the interests of other stockholders.
PSP Investments holds approximately 9.5% of the voting power of our shares. We also have joint venture arrangements with PSP Investments pursuant to which PSPInvestments has acquired interests in six of our projects (which number may increase in the future). In addition, under such joint venture arrangements, we may add aperson that has been designated by PSP Investments to our Board of Directors. PSP Investments is also an indirect investor in Pattern Development. Because of thesevarious arrangements, the interests of PSP Investments may differ from or conflict with the interests of our other stockholders.
In October 2019, we issued 10.4 million Preferred Shares which were placed in a private placement to certain institutional investors, led by CBRE Caledon. The Certificateof Designations governing the Preferred Shares provides the holders of the Preferred Shares with the right to vote on a one-to-one as-converted basis with our commonstockholders on matters submitted to a stockholder vote, subject to certain limitations (including that the voting rights of the holders of the Preferred Shares in the aggregateshall not in any event exceed 9.99% of the voting stock of the Company, and to the extent the voting rights of holders of the Preferred Shares are so limited by such votingcap, the vote of all such holders shall be reduced on a pro rata basis). The Preferred Shares give the holders thereof liquidation and distribution preferences, certain rightsrelating to our business and management, and under certain circumstances, the conversion of such shares potentially causing dilution to our common stockholders.
As a result, each of PSP Investments and together the holders of the Preferred Shares have significant influence over all matters that require approval by our stockholders,including the election of directors. Their voting power (together with the voting power of other large holders of 5% or more of our Class A shares) may limit otherstockholders’ ability to influence this and other corporate matters.
Certain of our executive officers will continue to have an economic interest in, and all of our executive officers will continue to provide services to, Pattern EnergyGroup LP and Pattern Development, which could result in conflicts of interest.
All of our executive officers provide services to Pattern Energy Group LP and Pattern Development pursuant to the terms of the Multilateral Management ServicesAgreement between our company, Pattern Energy Group LP, and Pattern Development, and, as a result, in some instances, have fiduciary or other obligations to suchPattern Development Companies. However, neither our President nor our Chief Financial Officer receive compensation from, or have an economic interest in, either PatternEnergy Group LP or (assuming the Merger Agreement is not consummated) Pattern Development. Additionally, while none of our Chief Executive Officer, Executive VicePresident, Business Development, and Executive Vice President, Chief Legal Officer, receive compensation from either Pattern Energy Group LP or Pattern Development,such officers have economic interests in such Pattern Development Companies and, accordingly, the benefit to such Pattern Development Companies from a transactionbetween such Pattern Development Company and our company will
48
proportionately inure to their benefit as holders of economic interests in such Pattern Development Company. Each of Pattern Energy Group LP and Pattern Developmentare related parties under the applicable securities laws governing related party transactions and, as a result, any material transaction between our company and PatternEnergy Group LP or Pattern Development is subject to our corporate governance guidelines, which require prior approval of any such material transaction by the conflictscommittee, which is comprised solely of independent members of our Board of Directors. Those of our executive officers who have economic interests in Pattern EnergyGroup LP or Pattern Development may be conflicted when advising the conflicts committee or otherwise participating in the negotiation or approval of such transactions.These executive officers have significant project- and industry-specific expertise that could prove beneficial to the conflicts committee’s decision-making process and theabsence of such strategic guidance could have a material adverse effect on our company’s ability to evaluate any such transaction and, in turn, on our business prospects,financial condition and results of operations.
Riverstone is under no obligation to offer us an opportunity to participate in any business opportunities that it may consider from time to time, including those in theenergy industry, and, as a result, Riverstone’s existing and future portfolio companies may compete with us for investment or business opportunities.
Assuming the Merger Agreement is not consummated, conflicts of interest could arise in the future between us, on the one hand, and Riverstone, including its portfoliocompanies, on the other hand, concerning among other things, potential competitive business activities or business opportunities. Riverstone is a private equity firm in thebusiness of making investments in entities primarily in the energy industry. As a result, Riverstone’s existing and future portfolio companies (other than Pattern EnergyGroup LP and Pattern Development, which are subject to the Second Amended and Restated Non-Competition Agreement) may compete with us for investment orbusiness opportunities. These conflicts of interest may not be resolved in our favor.
Subject to the terms of the Second Amended and Restated Non-Competition Agreement with, and our respective Purchase Rights granted to us by, each of Pattern EnergyGroup LP and Pattern Development, we have expressly renounced any interest or expectancy in, or in being offered an opportunity to participate in, any businessopportunity that may be from time to time presented to Riverstone or any of its officers, directors, agents, stockholders, members or partners or business opportunities thatsuch parties participate in or desire to participate in, even if the opportunity is one that we might reasonably have pursued or had the ability or desire to pursue if granted theopportunity to do so, and no such person shall be liable to us for breach of any fiduciary or other duty, as a director or officer or controlling stockholder or otherwise, byreason of the fact that such person pursues or acquires any such business opportunity, directs any such business opportunity to another person or fails to present any suchbusiness opportunity, or information regarding any such business opportunity, to us unless, in the case of any such person who is our director or officer, any such businessopportunity is expressly offered to such director or officer solely in his or her capacity as our director or officer. In view of Riverstone’s policies and practices with respectto the apportionment of business opportunities presented to the investment funds managed or advised by it and their respective portfolio companies, a business opportunitypresented to such fund or portfolio company may generally be pursued by such fund (or other Riverstone funds, as applicable) or directed to any such portfolio company.
As a result, Riverstone may become aware, from time to time, of certain business opportunities, such as acquisition opportunities, and may direct such opportunities toother businesses in which it has invested, in which case we may not become aware of or otherwise have the ability to pursue such opportunities. Further, such businessesmay choose to compete with us for these opportunities. As a result, our renouncing our interest and expectancy in any business opportunity that may be from time to timepresented to Riverstone could adversely impact our business or prospects if attractive business opportunities are procured by such parties for their own benefit rather thanfor ours.
Our actual or perceived failure to deal appropriately with conflicts of interest with the Pattern Development Companies could damage our reputation, increase ourexposure to potential litigation and have a material adverse effect on our business prospects, financial condition and results of operations.
Our conflicts committee is required to review, and make recommendations to the full Board of Directors regarding, any transactions involving the acquisition of an asset orinvestment in an opportunity offered to us by Pattern Energy Group LP or Pattern Development to determine whether the offer is fair and reasonable (including anyacquisitions by us of assets of Pattern Energy Group LP or Pattern Development pursuant to our respective Purchase Rights). In addition, we have established certaingovernance procedures between ourselves and Pattern Development to manage conflicts issues which may arise between ourselves and Pattern Development, which includehaving the chair of the conflicts committee, or his designee, attend regularly scheduled meetings of the Pattern Development board at which the development pipeline willbe reviewed and anticipated funding needs will be discussed, and regular reporting of reasonably expected potential conflicts between us and Pattern Development to theconflicts committee.
However, our establishment of a conflicts committee and governance procedures for our Pattern Development investment may not prevent holders of our shares from filingderivative claims against us related to these conflicts of interest and related party transactions. Regardless
49
of the merits of their claims, we may be required to expend significant management time and financial resources on the defense of such claims. Additionally, to the extentwe fail to appropriately deal with any such conflicts, it could negatively impact our reputation and ability to raise additional funds and the willingness of counterparties todo business with us, all of which could have a material adverse effect on our business prospects, financial condition and results of operations.
Market interest and foreign exchange rates may have an effect on the value of our Class A shares.
One of the factors that influences the price of our Class A shares will be the effective dividend yield of our Class A shares (i.e., the yield as a percentage of the then marketprice of our Class A shares) relative to market interest rates. Further increases in market interest rates, which currently remain relatively low compared to historical rates,may lead prospective purchasers of our Class A shares to expect a higher dividend yield and, our inability to increase our dividend as a result of an increase in borrowingcosts, insufficient cash available for distribution or otherwise, could result in selling pressure on, and a decrease in the market price of, our Class A shares as investors seekalternative investments with higher yield. Additionally, we intend to pay a regular quarterly dividend in U.S. dollars and, as a result, to the extent the value of the U.S.dollar dividend decreases relative to Canadian dollars, the market price of our Class A shares in Canada could decrease.
The price of our Class A shares may fluctuate significantly, and stockholders could lose all or part of their investment.
Volatility in the market price of our shares may prevent stockholders from being able to sell their Class A shares at or above the price stockholders paid for their shares. Themarket price of our Class A shares could fluctuate significantly for various reasons, including, in addition to the realization of any risks described under this "Risk Factors"section:
• we do not consummate the Merger Agreement;
• the public’s reaction to our press releases, our other public announcements and our filings with the Canadian securities regulators and the SEC;
• changes in, or failure to meet, earnings estimates or recommendations by research analysts who track our Class A shares or the stock of other companies in ourindustry;
• the failure of research analysts to cover our Class A shares;
• changes in accounting standards, policies, guidance, interpretations or principles;
• sales of Class A shares by us or members of our management team;
• the granting or exercise of employee stock options; and
• volume of trading in our Class A shares.
Volatility in the stock markets has had a significant impact on the market price of securities issued by many companies, including companies in our industry. The changesfrequently appear to occur without regard to the operating performance of the affected companies. Hence, the price of our Class A shares could fluctuate based upon factorsthat have little or nothing to do with our company, and these fluctuations could materially reduce the share price of our Class A shares and cause stockholders to lose all orpart of their investment. Further, in the past, market fluctuations and price declines in a company’s stock have led to securities class action litigation. If such a suit were toarise, it could have a substantial cost and divert our resources regardless of the outcome.
We incur increased costs and demands upon management as a result of complying with the laws and regulations affecting public companies, which could harm ouroperating results.
As a public company, we incur significant legal, accounting, investor relations and other expenses, including costs associated with public company reporting requirements.We also have incurred and will incur costs associated with current corporate governance requirements, Section 404 and other provisions of the Sarbanes-Oxley Act and theDodd-Frank Wall Street Reform and Consumer Protection Act of 2010, as well as rules implemented by the SEC, the Canadian Securities Administrators and the stockexchanges on which our Class A shares are traded.
The expenses incurred by public companies for reporting and corporate governance purposes have increased dramatically over time. Greater expenditures may be necessaryin the future with the advent of new laws and regulations pertaining to public companies. If we are not able to comply with these requirements in a timely manner, themarket price of our Class A shares could decline and we could be subject to sanctions or investigations by the SEC, the Canadian Securities Administrators, the applicablestock exchanges or other regulatory authorities, which would require additional financial and management resources.
50
As a result of the FPA and FERC’s regulations in respect of transfers of control, absent prior authorization by FERC, we cannot convey, and an investor in ourcompany will generally not be permitted to obtain, a direct and/or indirect voting interest in 10% or more of our issued and outstanding voting securities, and aviolation of this limitation could result in civil or criminal penalties under the FPA and possible further sanctions imposed by FERC under the FPA.
We are a holding company with U.S. operating subsidiaries that are “public utilities” (as defined in the FPA) and, therefore, subject to FERC’s jurisdiction under the FPA.As a result, the FPA requires us to (i) obtain prior authorization from FERC to transfer an amount of our voting securities sufficient to convey direct or indirect control overany of our public utility subsidiaries or (ii) qualify for a blanket authorization granted under or an exemption from FERC’s regulations in respect of transfers of control.Similar restrictions apply to purchasers of our voting securities who are a “holding company” under the PUHCA, in a holding company system that includes a transmittingutility or an electric utility, or an “electric holding company,” regardless of whether our voting securities were purchased in our initial public offering, subsequent offeringsby us, in open market transactions or otherwise. A purchaser of our voting securities would be a “holding company” under the PUHCA and an electric holding company ifthe purchaser acquired direct or indirect control over 10% or more of our voting securities or if FERC otherwise determined that the purchaser could directly or indirectlyexercise control over our management or policies (e.g., as a result of contractual board or approval rights). Under the PUHCA, a “public-utility company” is defined toinclude an “electric utility company,” which is any company that owns or operates facilities used for the generation, transmission or distribution of electric energy for sale,and which includes EWGs such as our U.S. operating subsidiaries. Accordingly, absent prior authorization by FERC or an increase to the applicable percentage ownershipunder a blanket authorization, for the purposes of sell-side transactions by us and buy-side transactions involving purchasers of our securities that are electric holdingcompanies, no purchaser can acquire 10% or more of our issued and outstanding voting securities. A violation of these regulations by us, as seller, or an investor, as apurchaser of our securities, could subject the party in violation to civil or criminal penalties under the FPA, including civil penalties of up to approximately $1.29 millionper day per violation (which amount is adjusted annually to account for inflation) and other possible sanctions imposed by FERC under the FPA.
As a result of the FPA and FERC’s regulations in respect of transfers of control, and consistent with the requirements for blanket authorizations granted thereunder orexemptions therefrom, absent prior authorization by FERC, no purchaser of our Class A common stock in the open market, or in subsequent offerings of our votingsecurities, will be permitted to purchase an amount of our securities that would cause such purchaser and its affiliate and associate companies to collectively hold 10% ormore of our voting securities outstanding. Additionally, investors should manage their investment in us in a manner consistent with FERC’s regulations in respect ofobtaining direct or indirect “control” of our company. Accordingly, absent prior authorization by FERC, investors in our Class A common stock are advised not to acquire adirect and/or indirect voting interest in 10% or more of our issued and outstanding voting securities, whether in connection with an offering by us in open market purchasesor otherwise.
Provisions of our organizational documents, Delaware law, and certain contractual provisions we are subject to might discourage, delay or prevent a change of controlof our company or changes in our management and, as a result, depress the trading price of our Class A shares.
Our amended and restated certificate of incorporation and amended and restated bylaws contain provisions that could discourage, delay or prevent a change in control ofour company or changes in our management that the stockholders of our company may deem advantageous. These provisions:
• authorize the issuance of blank check preferred stock that our Board of Directors could issue to increase the number of outstanding shares and to discourage atakeover attempt;
• prohibit our stockholders from calling a special meeting of stockholders;
• prohibit stockholder action by written consent, which requires all stockholder actions to be taken at a meeting of our stockholders;
• provide that the Board of Directors is expressly authorized to adopt, or to alter or repeal our bylaws; and
• establish advance notice requirements for nominations for election to our Board of Directors or for proposing matters that can be acted upon by stockholders atstockholder meetings.
These anti-takeover defenses and contractual provisions could discourage, delay or prevent a transaction involving a change in control of our company. These provisionscould also discourage proxy contests and make it more difficult for stockholders to elect directors of their choosing and cause us to take corporate actions other than thosedesired.
51

Future sales of our shares in the public market could lower our Class A share price, and any additional capital raised by us through the sale of equity or convertibledebt securities may dilute stockholders’ ownership in us and may adversely affect the market price of our Class A shares.
While we did not conduct a follow-on offering of our Class A shares in 2019, we had conducted such offerings in each of the years from 2014 to 2017. We also have an “at-the-market” equity distribution program pursuant to which approximately $144 million in aggregate offering price of our Class A shares remains available to be soldthereunder. In October 2019, we issued 10.4 million Preferred Shares, and our option to convert the Preferred Shares into Class A shares beginning on or after the five-yearanniversary of the issuance of the Preferred Shares, or the option of the holders to elect to convert the Preferred Shares upon the occurrence of certain types of change ofcontrol transactions, may cause substantial dilution to holders of the Class A shares. In addition, previously in July 2015, we issued $225 million aggregate principalamount of 4.00% Convertible Senior Notes due 2020. If we sell additional large numbers of our Class A shares, (or securities convertible into our Class A shares), if weissue a large number of shares of our Class A shares in connection with future acquisitions, financings, or other circumstances, or if other significant stockholders sell largenumbers of their holdings of our Class A shares or securities convertible into our Class A shares, the market price of our Class A shares could decline significantly.
We cannot predict the size of future issuances of our Class A shares, sales of our Class A shares, or sales of securities convertible into our Class A shares, or the effect, ifany, that any such future issuances or sales will have on the market price of our shares. Sales of substantial amounts of our shares (including sales pursuant to PSPInvestments' registration rights and shares issued in connection with an acquisition) or securities convertible into our shares, or the perception that such sales could occur,may adversely affect prevailing market prices for our Class A shares.
Item 1B. Unresolved Staff Comments.
None.
Item 2. Properties.
Leased Facilities
Our corporate headquarters and executive offices are located in San Francisco, California and we additionally lease office spaces in Houston, Texas; San Diego, California;and Toronto, Ontario, Canada.
Our Projects
We hold interests in 28 wind and solar power projects. Our projects are located in the United States, Canada and Japan. We have a total operating portfolio ofapproximately 4.4 GW and owned capacity of approximately 3.1 GW. We typically finance our wind and solar projects through project entity specific debt secured by eachproject's assets with no recourse to us. For details on our operating wind and solar power projects, please see Item 1 "Business - Our Operating Business Segment" in thisForm 10-K.
Item 3. Legal Proceedings.
Several complaints related to the merger contemplated by the Merger Agreement have been filed to date. The complaints are captioned: Stephen Donnell v. Pattern EnergyGroup Inc. et al., Case No. 1:19-cv-11680, which was filed by a purported shareholder in the United States District Court for the Southern District of New York onDecember 20, 2019; Richard Baum v. Pattern Energy Group Inc. et al., Case No. 1:19-cv-02360-UNA, which was filed on behalf of a putative class of our publicshareholders in the United States District Court for the District of Delaware on December 27, 2019; Phillip Krieger v. Pattern Energy Group Inc. et al., Case No. 3:19-cv-08437, which was filed on behalf of a putative class of our public shareholders in the United States District Court for the Northern District of California on December 27,2019; John Thompson v. Pattern Energy Group Inc. et al., Case No. 1:19-cv-02369-UNA, which was filed on behalf of a putative class of our public shareholders in theUnited States District Court for the District of Delaware on December 30, 2019; David Frieman v. Pattern Energy Group Inc. et al., Case No. 1:20-cv-00171, which wasfiled by a purported shareholder in the United States District Court for the Southern District of New York on January 8, 2020; Phil Burge v. Pattern Energy Group Inc. etal., Case No. 1:20-cv-00213, which was filed by a purported shareholder in the United States District Court for the Eastern District of New York on January 10, 2020;Bushansky v. Pattern Energy Group Inc. et al., Case No. 3:20-cv-00401, which was filed by a purported shareholder in the United States District Court for the NorthernDistrict of California on January 21, 2020; Wilhelmson v. Pattern Energy Group Inc.
52

et al., Case No. 3:20-cv-00797, which was filed by a purported shareholder in the United States District Court for the Northern District of California on February 3, 2020;and The Arbitrage Fund et al. v. Pattern Energy Group Inc. et al., Case No. 1:20-cv-00275, which was filed on behalf of a putative class of our public shareholders in theUnited States District Court for the District of Delaware on February 25, 2020 (collectively the “Merger Litigations”). The Merger Litigations generally name as defendantsus, as well as certain of our officers and directors. The Baum complaint also asserts claims against CPP Investments. The Merger Litigations generally allege thatdefendants violated federal securities laws by failing to disclose material information in the version of the merger proxy statement filed with the SEC on December 13,2019. Each of the Merger Litigations seeks, among other things, to enjoin the merger with CPP Investments and recover damages, as well as an award of the plaintiffs’attorneys’ fees and costs of the litigation. We believe that the claims asserted are wholly without merit. No assurances can be given that similar additional lawsuits orderivative lawsuits will not be filed which may make similar or additional claims (such as breach of fiduciary duties by our officers and/or directors).
We are also subject, from time to time, to various routine legal proceedings and claims arising out of the normal course of business. These proceedings primarily involvedisputes with construction contractors that are not material, claims from landowners related to calculation of land royalties, and warranty claims we initiate againstequipment suppliers. The outcome of these legal proceedings and claims cannot be predicted with certainty. Nevertheless, we believe the outcome of any of such currentlyexisting normal course of business proceedings, even if determined adversely, would not be material.
53

Item 4. Mine Safety Disclosures.
Not applicable.
54

PART II
Item 5. Market for Registrant’s Common Equity and Related Stockholder Matters.
Our Class A common stock is traded on the National Association of Securities Dealers Automated Quotations (Nasdaq) Global Select Market and on the Toronto StockExchange (TSX) under the trading symbol “PEGI.” On February 26, 2020, the last reported sale price of our Class A common stock on the Nasdaq Global Select Marketwas $27.66 per share and on the TSX was C$36.88 per share.
On May 9, 2016, we entered into an Equity Distribution Agreement. Pursuant to the terms of the Equity Distribution Agreement, we may offer and sell shares of our ClassA common stock, par value $0.01 per share, from time to time through the Agents, as our sales agents for the offer and sale of the shares, up to an aggregate sales price of$200 million. For the year ended December 31, 2019, we did not sell shares under the Equity Distribution Agreement.
Holders of Record
Because many of our shares of Class A common stock are held by brokers and other institutions on behalf of stockholders, we are unable to estimate the total number ofstockholders represented by these record holders. As of February 26, 2020, there were approximately 35 stockholders of record of our Class A common stock.
55
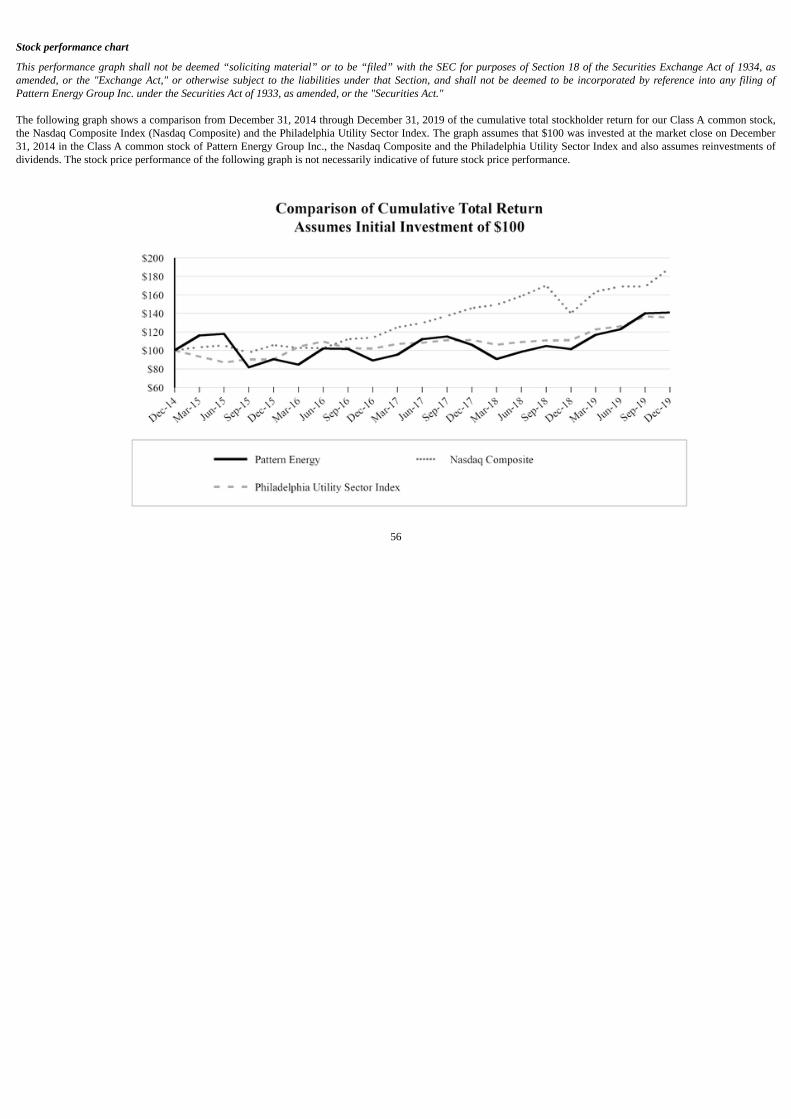
Stock performance chart
This performance graph shall not be deemed “soliciting material” or to be “filed” with the SEC for purposes of Section 18 of the Securities Exchange Act of 1934, asamended, or the "Exchange Act," or otherwise subject to the liabilities under that Section, and shall not be deemed to be incorporated by reference into any filing ofPattern Energy Group Inc. under the Securities Act of 1933, as amended, or the "Securities Act."
The following graph shows a comparison from December 31, 2014 through December 31, 2019 of the cumulative total stockholder return for our Class A common stock,the Nasdaq Composite Index (Nasdaq Composite) and the Philadelphia Utility Sector Index. The graph assumes that $100 was invested at the market close on December31, 2014 in the Class A common stock of Pattern Energy Group Inc., the Nasdaq Composite and the Philadelphia Utility Sector Index and also assumes reinvestments ofdividends. The stock price performance of the following graph is not necessarily indicative of future stock price performance.
56
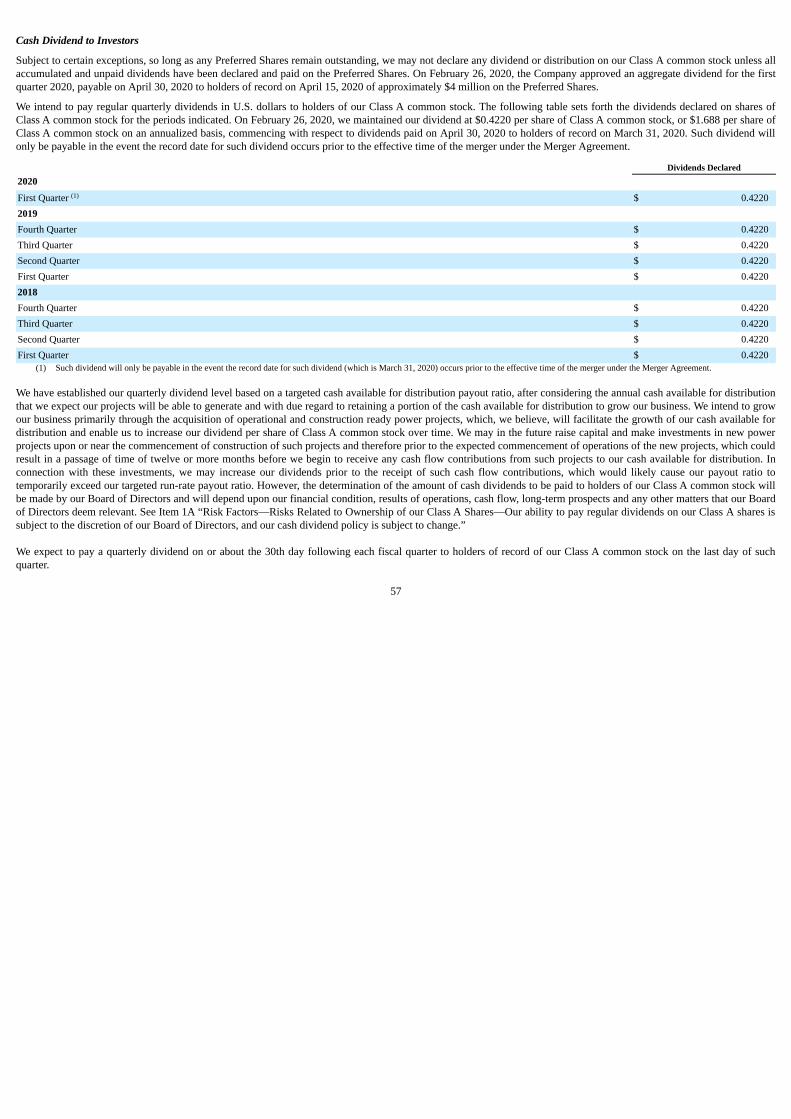
Cash Dividend to Investors
Subject to certain exceptions, so long as any Preferred Shares remain outstanding, we may not declare any dividend or distribution on our Class A common stock unless allaccumulated and unpaid dividends have been declared and paid on the Preferred Shares. On February 26, 2020, the Company approved an aggregate dividend for the firstquarter 2020, payable on April 30, 2020 to holders of record on April 15, 2020 of approximately $4 million on the Preferred Shares.
We intend to pay regular quarterly dividends in U.S. dollars to holders of our Class A common stock. The following table sets forth the dividends declared on shares ofClass A common stock for the periods indicated. On February 26, 2020, we maintained our dividend at $0.4220 per share of Class A common stock, or $1.688 per share ofClass A common stock on an annualized basis, commencing with respect to dividends paid on April 30, 2020 to holders of record on March 31, 2020. Such dividend willonly be payable in the event the record date for such dividend occurs prior to the effective time of the merger under the Merger Agreement.
Dividends Declared2020 First Quarter (1) $ 0.42202019Fourth Quarter $ 0.4220Third Quarter $ 0.4220Second Quarter $ 0.4220First Quarter $ 0.42202018Fourth Quarter $ 0.4220Third Quarter $ 0.4220Second Quarter $ 0.4220First Quarter $ 0.4220
(1) Such dividend will only be payable in the event the record date for such dividend (which is March 31, 2020) occurs prior to the effective time of the merger under the Merger Agreement.
We have established our quarterly dividend level based on a targeted cash available for distribution payout ratio, after considering the annual cash available for distributionthat we expect our projects will be able to generate and with due regard to retaining a portion of the cash available for distribution to grow our business. We intend to growour business primarily through the acquisition of operational and construction ready power projects, which, we believe, will facilitate the growth of our cash available fordistribution and enable us to increase our dividend per share of Class A common stock over time. We may in the future raise capital and make investments in new powerprojects upon or near the commencement of construction of such projects and therefore prior to the expected commencement of operations of the new projects, which couldresult in a passage of time of twelve or more months before we begin to receive any cash flow contributions from such projects to our cash available for distribution. Inconnection with these investments, we may increase our dividends prior to the receipt of such cash flow contributions, which would likely cause our payout ratio totemporarily exceed our targeted run-rate payout ratio. However, the determination of the amount of cash dividends to be paid to holders of our Class A common stock willbe made by our Board of Directors and will depend upon our financial condition, results of operations, cash flow, long-term prospects and any other matters that our Boardof Directors deem relevant. See Item 1A “Risk Factors—Risks Related to Ownership of our Class A Shares—Our ability to pay regular dividends on our Class A shares issubject to the discretion of our Board of Directors, and our cash dividend policy is subject to change.”
We expect to pay a quarterly dividend on or about the 30th day following each fiscal quarter to holders of record of our Class A common stock on the last day of suchquarter.
57
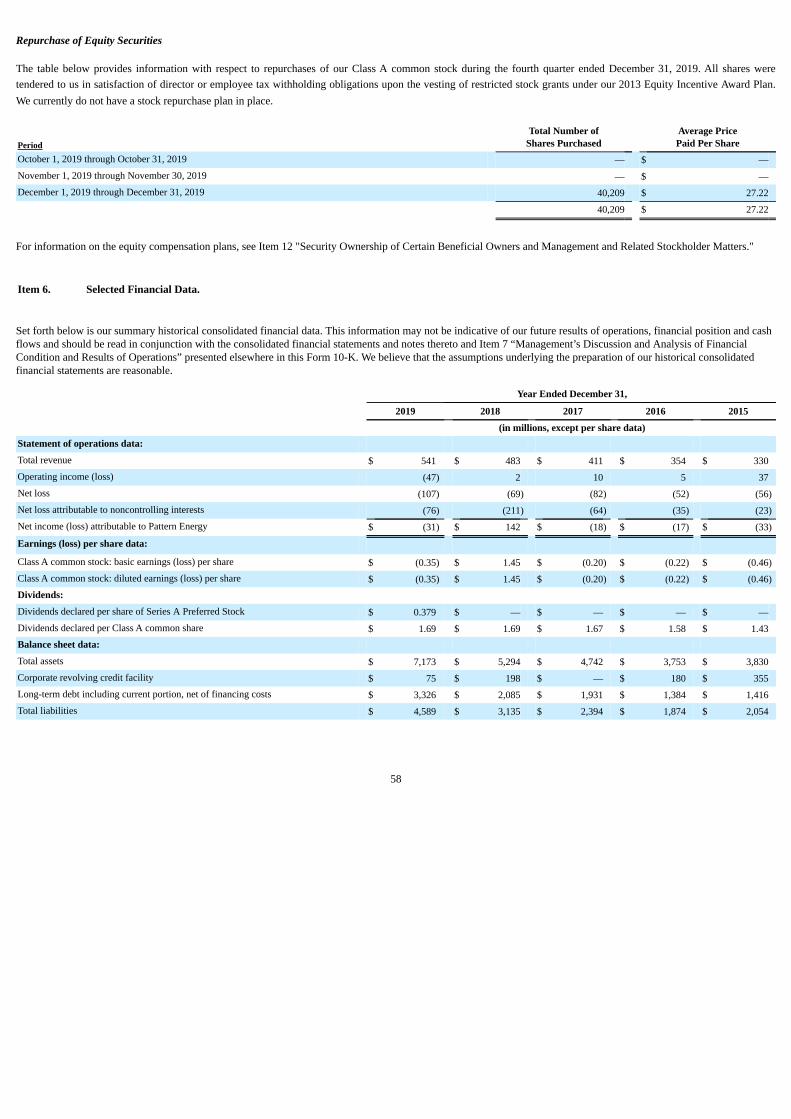
Repurchase of Equity Securities
The table below provides information with respect to repurchases of our Class A common stock during the fourth quarter ended December 31, 2019. All shares weretendered to us in satisfaction of director or employee tax withholding obligations upon the vesting of restricted stock grants under our 2013 Equity Incentive Award Plan.We currently do not have a stock repurchase plan in place.
Period Total Number of
Shares Purchased Average PricePaid Per Share
October 1, 2019 through October 31, 2019 — $ —November 1, 2019 through November 30, 2019 — $ —December 1, 2019 through December 31, 2019 40,209 $ 27.22
40,209 $ 27.22
For information on the equity compensation plans, see Item 12 "Security Ownership of Certain Beneficial Owners and Management and Related Stockholder Matters."
Item 6. Selected Financial Data.
Set forth below is our summary historical consolidated financial data. This information may not be indicative of our future results of operations, financial position and cashflows and should be read in conjunction with the consolidated financial statements and notes thereto and Item 7 “Management’s Discussion and Analysis of FinancialCondition and Results of Operations” presented elsewhere in this Form 10-K. We believe that the assumptions underlying the preparation of our historical consolidatedfinancial statements are reasonable.
Year Ended December 31,
2019 2018 2017 2016 2015
(in millions, except per share data)Statement of operations data: Total revenue $ 541 $ 483 $ 411 $ 354 $ 330Operating income (loss) (47) 2 10 5 37Net loss (107) (69) (82) (52) (56)Net loss attributable to noncontrolling interests (76) (211) (64) (35) (23)Net income (loss) attributable to Pattern Energy $ (31) $ 142 $ (18) $ (17) $ (33)
Earnings (loss) per share data: Class A common stock: basic earnings (loss) per share $ (0.35) $ 1.45 $ (0.20) $ (0.22) $ (0.46)Class A common stock: diluted earnings (loss) per share $ (0.35) $ 1.45 $ (0.20) $ (0.22) $ (0.46)Dividends: Dividends declared per share of Series A Preferred Stock $ 0.379 $ — $ — $ — $ —Dividends declared per Class A common share $ 1.69 $ 1.69 $ 1.67 $ 1.58 $ 1.43Balance sheet data: Total assets $ 7,173 $ 5,294 $ 4,742 $ 3,753 $ 3,830Corporate revolving credit facility $ 75 $ 198 $ — $ 180 $ 355Long-term debt including current portion, net of financing costs $ 3,326 $ 2,085 $ 1,931 $ 1,384 $ 1,416Total liabilities $ 4,589 $ 3,135 $ 2,394 $ 1,874 $ 2,054
58

Item 7. Management’s Discussion and Analysis of Financial Condition and Results of Operations
The following discussion and analysis of our financial condition and results of operations should be read in conjunction with our financial statements and related notesincluded elsewhere in this Form 10-K. The following discussion contains “forward-looking statements” that reflect our future plans, estimates, beliefs and expectedperformance. Our actual results may differ materially from those currently anticipated and expressed in such forward-looking statements as a result of a number of factors,including those we discuss under Item 1A “Risk Factors” elsewhere in this Form 10-K. We caution that assumptions, expectations, projections, intentions or beliefs aboutfuture events may, and often do, vary from actual results and the differences can be material. See “Cautionary Notice Regarding Forward-Looking Statements.”
Overview
We are a vertically integrated renewable energy company with a mission to transition the world to renewable energy. Our business consists of both (i) an operating businesssegment, which is comprised of a portfolio of renewable energy power projects and (ii) a development investment segment, which principally consists of our 29%ownership interest in Pattern Development, an upstream development platform. Prior to 2018, we had one reportable segment. The development investment segment wasacquired in July 2017 and had insignificant operations. As such, the 2017 comparative period is not included in our discussion and analysis below as it is not material ormeaningful. A discussion of the 2017 comparative period is included in our Form 10-K for the year ending December 31, 2018 filed with the SEC on March 1, 2019.
Through our operating business segment, we hold ownership interests in 28 renewable energy projects with a total operating portfolio capacity of approximately 4.4 GW inthe United States, Canada and Japan. Projects in which we have an owned interest use proven, best-in-class technology and have contracted to sell all or a majority of theiroutput pursuant to long-term, fixed-price PSAs. Approximately 88% of the electricity to be generated by our projects will be sold under our PSAs which have a weightedaverage remaining contract life of approximately 13 years as of December 31, 2019.
Our development investment segment engages in the upstream development of renewable power projects around the world currently spanning the United States, Canada,Mexico and Japan. Our current relationship with Pattern Development, which includes our Identified ROFO Projects, shared services and overlap of executive officers,provides alignment with our operating business segment and provides us access to a pipeline of development projects we have an ability to acquire to grow our business, orthrough our ownership interest, share in returns in the event a development project is sold to third parties. Pattern Development has more than a 10 GW pipeline ofdevelopment projects.
We intend to maximize long-term value for our stockholders in an environmentally responsible manner and with respect for the communities in which we operate. Ourbusiness is built around three core values of creative energy and spirit, pride of ownership and a team-first attitude, which guide us in creating a safe, high-integrity workenvironment, applying rigorous analysis to all aspects of our business and proactively working with our stakeholders to address environmental and community concerns.Our financial objectives, which we believe will maximize long-term value for our stockholders, are to produce stable and sustainable cash available for distribution,selectively grow our project portfolio and our dividend per Class A share and maintain a strong balance sheet and flexible capital structure.
The discussion and analysis below has been organized as follows:
• 2019 Significant Activity
• Factors that Significantly Affect our Business
◦ Trends Affecting our Industry
◦ Factors Affecting our Operational Results
• Key Performance Metrics
• Consolidated Results of Operations
• Results of Operating Business Segment
• Results of Development Investment Segment
59

• Liquidity and Capital Resources
◦ Sources of Liquidity
◦ Uses of Liquidity
◦ Covenants, Distribution Conditions and Events of Default
• Critical Accounting Policies and Estimates
2019 Significant Activity
In December 2019, we began construction on the repowering of Gulf Wind and entered into a financing agreement for a construction loan of up to $270 million for suchrepowering. Upon completion, Gulf Wind will generate approximately 271 MW of capacity. Gulf Wind also entered into a 20-year PPA with Austin Energy for the majorityof its energy production, with the remaining production expected to be sold at merchant power prices. The construction loan bears interest at LIBOR plus 0.75% andmatures on September 30, 2020.
In November 2019, we entered into an Agreement and Plan of Merger (Merger Agreement) with Pacific US Inc. (Parent), a Delaware corporation which is an indirectwholly-owned subsidiary of Canada Pension Plan Investment Board (CPP Investments), and with Pacific BidCo US Inc. (BidCo), a Delaware corporation and a wholly-owned subsidiary of Parent, pursuant to which Parent has agreed to acquire us for $26.75 per share in an all-cash transaction. The transaction is expected to close shortlyfollowing receipt of shareholder approval. A shareholders’ meeting has been scheduled for March 10, 2020. CPP Investment Board Private Holdings (4) Inc. has providedto us a limited guarantee of certain obligations of Parent under the Merger Agreement.
In October 2019, we consummated the purchase of 101 MW of owned capacity in Grady, a 220 MW Pattern Development project located in Curry County, New Mexico,for total cash consideration of approximately $84 million, net of cash acquired.
In October 2019, we consummated the purchase of 150 MW of owned capacity in Henvey Inlet, a 300 MW Pattern Energy Group LP project located in Henvey Inlet FirstNation Reserve No. 2 Lands, Ontario, Canada, for total cash consideration of approximately $172 million, net of cash acquired.
In October 2019, we consummated an earnout acquisition agreement with Pattern Energy Group LP to acquire 100% of Pattern Energy Group LP's earnout rights in certaintransmission and wind projects under development at Pattern Development, which represent 25% of the profits interest in such projects, for a purchase priceof approximately $10 million.
In October 2019, we issued 10.4 million shares of Series A Perpetual Preferred Stock with a value of $260 million issued at a 1.5% discount (Preferred Shares). ThePreferred Shares are entitled to receive, when as and if declared by our board of directors, cumulative cash dividends at an initial annual rate of 5.625%, based on the$25.00 per share liquidation preference. The annual dividend rate shall increase by 0.5% every year, absent the occurrence of certain events, starting on the thirdanniversary of issuance date to a maximum of four escalations, or 7.625%. The Preferred Shares are entitled to receive, when as and if declared by our board of directors,12.6% of any cash distributions, including the return of capital, made by Pattern Development to us or any of our subsidiaries not to exceed $3.25 per Preferred Share. Wereceived net proceeds of $256 million, which we used to fund the acquisition of Henvey Inlet, partially repay borrowings under the revolving credit facility and pay relatedexpenses and fees.
In July 2019, we entered into a $250 million bank loan with a three-year maturity. The non-amortizing bank loan will bear interest at LIBOR plus an applicable marginranging from 1.175% to 1.425%. Proceeds from the bank loan were used to repay a portion of our revolving credit facility.
In July 2019, we acquired 22 MW of owned capacity in Belle River and 35 MW of owned capacity in North Kent from Pattern Energy Group LP for which our total cashconsideration, including the acquisition of certain loan receivables at such projects, was $44 million. The 100 MW Belle River facility is located in Lakeshore, Ontario,Canada, and the 100 MW North Kent facility is located in Chatham-Kent, Ontario, Canada.
Factors that Significantly Affect our Business
Our results of operations in the near-term, as well as our ability to grow our business and revenue from electricity sales over time, could be impacted by a number offactors, including trends affecting our industry and factors affecting our operating results as discussed below:
60

Trends Affecting our Industry
The growth in the industry is largely attributable to renewable energy’s increasing cost competitiveness with other power generation technologies, the advantages of windand solar power over other renewable energy sources and growing public support for renewable energy driven by energy security and environmental concerns.
We believe that the key drivers for the long-term growth of renewable power include:
• consistent multi-year trend of total global investment in new renewable electricity generation sources being twice that of investment in conventional fossil generation;
• efficiency and capital cost improvements in wind, solar and other renewable energy technologies, enabling wind, solar and other forms of renewable energy to competesuccessfully in more markets;
• improvements in wind, solar and other renewable energy technologies which, when paired with cheap natural gas, continues to drive down power prices;
• significant ongoing demand created by corporate and industrial buyers directly procuring renewable electricity on a large scale;
• increasing deployment of storage technologies resulting in enhanced reliability and provision of grid services by utility scale wind and solar providers;
• increased demand for renewable energy resulting from regulatory or policy initiatives. Notable initiatives include country, state or provincial RPS programs;
• governmental incentives for renewable energy including feed-in-tariff regimes, carbon credits and the U.S. federal based PTCs or ITCs, which are subject to phasedown for wind projects that begin construction by 2019 and solar projects that begin construction by 2021, that improve the cost competitiveness of renewable energycompared to traditional sources;
• environmental and social factors supporting increasing levels of wind, solar and other renewable technologies in the generation mix;
• regulatory barriers, market pressure and public acceptance challenges increasing the time, cost and difficulty of permitting new fossil fuel-fired facilities, notably coal,and nuclear facilities;
• decommissioning of aging coal-fired and nuclear facilities is expected to leave a gap in electricity supply to be filled by cost-effective renewable and natural gasgeneration;
• policy initiatives at both the state and federal levels to include externalities, such as the cost of carbon pollution, methane leakage and water usage in conventionalfossil fuel-fired electricity generation, over time will increase costs of conventional generation; and
• ongoing shift within the portfolios of U.S based investor-owned utilities toward lower carbon emitting sources of power.
In general, we continue to believe that there will be additional acquisition and asset recycling opportunities in the short-term and that the longer-term growth trend willcontinue.
Our Outlook
Our near-term growth strategy will continue to focus on wind and solar power projects. We expect that most of our short-term growth will come from opportunities toacquire or invest in the Identified ROFO Projects, but we will evaluate unaffiliated third-party asset acquisition opportunities as well. In addition, we will continue toevaluate further investment in Pattern Development as discussed below.
Factors Affecting our Operational Results
The primary factors that will affect our financial results are (i) electricity sales of our operating projects, (ii) impact of derivative instruments, (iii) acquisitions, divestituresand investments, (iv) project operations (v) debt financing, (vi) congestion in the Texas market, and (vii) general and administrative costs.
Electricity Sales of our Operating Projects
Our projects are generally unaffected by short-term trends given that 88% of the electricity to be generated by our projects is to be sold under our fixed-price PPAs. OurPPA portfolio provides long-term revenue security with an average remaining contract life of 13 years as of December 31, 2019. Revenue from project sites is determinedby the contracted price of electricity and any environmental attributes we sell under our PPAs multiplied by the amount of metered electricity that we produce. Actualenergy production will vary based on the prevailing environmental conditions and technical constraints that exist at each facility.
61
We base our estimates of each project’s capacity to generate electricity on the findings of our internal and external experts’ long-term meteorological studies, which includedata collected from measurement equipment on the property and relevant reference wind and solar data from other sources, as well as expected performance of ourequipment over time. The result of our meteorological analysis is a probabilistic assessment of a project’s likely annual output. A P50 level of annual production indicateswe believe a 50% probability exists that the electricity generated from a project will exceed a specified aggregate amount of electricity generation during a given year. TheP50 production level provides the foundation for our base case expectation; however, in reality, there can be significant variability between annual production and the P50.In addition to annual P50 variability, we also expect seasonal variability to occur. Variability increases as the period of review shortens, so it is likely that we willexperience more variability in daily, monthly, or quarterly production than we do for annual production. Therefore, our periodic cash flow and payout ratios will also reflectmore variability during periods shorter than a year. As a result, we use our available liquidity as well as certain project level cash reserves to help manage short-termproduction and cash flow variability.
Our electricity generation is also dependent on the equipment that we use. We have selected high-quality equipment with a goal of having a concentration of equipmentfrom top-tier manufacturers. With a combination of scale and developing in-house operating capability, we have structured our projects such that we may expect highavailability and long-term production from the equipment. Given our manufacturers’ global fleet sizes and strong balance sheets, the warranties that we secure for ourturbines and our operating approach, we are confident in our expectations for reliable long-term turbine operation.
Impact of Derivative Instruments
Where possible, we employ a variety of derivative instruments to manage our exposure to fluctuations in electricity prices, interest rates and foreign currency exchangerates. We have experienced in the past, and expect to record in the future, substantial volatility in the components of our net income that relate to the mark-to-marketadjustments on our undesignated cash flow hedges.
We believe that mark-to-market adjustments that we make to the fair value of our derivative assets and liabilities are generally mirrored by changes in the economic valueof the related operating or financial assets, such as our wind projects and our project loans, for which the application of accounting principles generally accepted in theUnited States (U.S. GAAP) does not permit us to record such economic gains and losses. For this reason, and because one of our principal financial objectives is to producestable and sustainable cash available for distribution, we believe that the economic value to our shareholders reflected in these derivative instruments, outweighs the risk ofvolatility in net income that we expect to report. Accordingly, we believe it is useful to investors to consider supplemental performance metrics that we report, such asadjusted earnings before interest, taxes, depreciation, amortization and accretion (Adjusted EBITDA) and cash available for distribution, where we have subtracted andadded back, as applicable, the unrealized gains and losses arising from mark-to-market adjustments on our derivative instruments.
Acquisitions, Divestitures and Investments
Our ability to grow our cash available for distribution is substantially dependent on our ability to make acquisitions. During 2019, our acquisitions of Belle River, NorthKent, Grady and Henvey Inlet increased our operating capacity by 308 MW, or 11%. From time to time, we may also consider the disposal of a project, particularly if webelieve we can utilize funds realized from such a disposal in a more productive manner or generate a higher return on investment. During 2018, our disposals of El Arrayánand our minority interest in K2 decreased our operating capacity 171 MW, or 6%. In December 2019, we closed construction financing and started construction on therepowering at our Gulf Wind facility. The repowering will consist of replacing the current wind turbines with 118 Siemens Gamesa turbines, which will generate 271 MWof capacity once completed. Additionally, Gulf Wind entered into a new 20-year PPA for a majority of the production, with the remaining output to be sold at merchantpower prices.
As of December 31, 2019, we have funded approximately $190 million in aggregate and hold an approximate 29% ownership interest in Pattern Development. Ourinvestment in Pattern Development facilitates additional long-term capital for Pattern Development to support the growth in the development pipeline thereby providing uswith additional potential acquisition opportunities in the future, or the potential to share in returns for sales to third parties, through our 29% ownership interest in PatternDevelopment. Strategic benefits include a strengthened link to Pattern Development's development pipeline and increased return on investment expectations commensuratewith increased development risk. To the extent we invest in Pattern Development, we will be initially exposed to capital requirements and development risk prior to havingcertainty that a project can move forward. As projects are successfully completed, we anticipate that our return on our capital investment will increase. However, there arerisks in project development including, but not limited to, permitting challenges, failure to secure PPAs, failure to procure the requisite financing, equipment orinterconnection, or an inability to satisfy the conditions to effectiveness of project agreements such as PPAs.
Our aggregate owned capacity is approximately 3.1 GW. We expect that the acquisition of operational power projects from the Pattern Development Companies and otherthird parties will continue to contribute to our operational results.
62
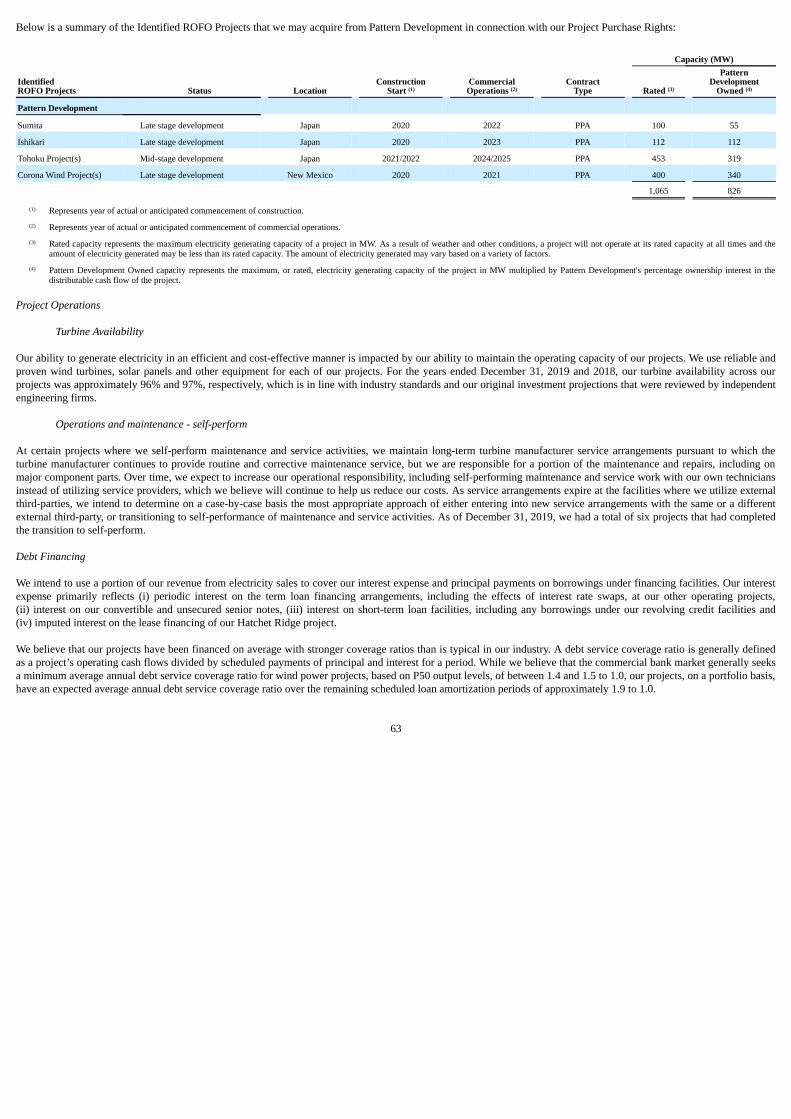
Below is a summary of the Identified ROFO Projects that we may acquire from Pattern Development in connection with our Project Purchase Rights:
Capacity (MW)
IdentifiedROFO Projects Status Location
ConstructionStart (1)
CommercialOperations (2)
ContractType Rated (3)
PatternDevelopment
Owned (4)
Pattern Development
Sumita Late stage development Japan 2020 2022 PPA 100 55
Ishikari Late stage development Japan 2020 2023 PPA 112 112
Tohoku Project(s) Mid-stage development Japan 2021/2022 2024/2025 PPA 453 319
Corona Wind Project(s) Late stage development New Mexico 2020 2021 PPA 400 340
1,065 826
(1) Represents year of actual or anticipated commencement of construction.(2) Represents year of actual or anticipated commencement of commercial operations.(3) Rated capacity represents the maximum electricity generating capacity of a project in MW. As a result of weather and other conditions, a project will not operate at its rated capacity at all times and the
amount of electricity generated may be less than its rated capacity. The amount of electricity generated may vary based on a variety of factors.(4) Pattern Development Owned capacity represents the maximum, or rated, electricity generating capacity of the project in MW multiplied by Pattern Development's percentage ownership interest in the
distributable cash flow of the project.
Project Operations
Turbine Availability
Our ability to generate electricity in an efficient and cost-effective manner is impacted by our ability to maintain the operating capacity of our projects. We use reliable andproven wind turbines, solar panels and other equipment for each of our projects. For the years ended December 31, 2019 and 2018, our turbine availability across ourprojects was approximately 96% and 97%, respectively, which is in line with industry standards and our original investment projections that were reviewed by independentengineering firms.
Operations and maintenance - self-perform
At certain projects where we self-perform maintenance and service activities, we maintain long-term turbine manufacturer service arrangements pursuant to which theturbine manufacturer continues to provide routine and corrective maintenance service, but we are responsible for a portion of the maintenance and repairs, including onmajor component parts. Over time, we expect to increase our operational responsibility, including self-performing maintenance and service work with our own techniciansinstead of utilizing service providers, which we believe will continue to help us reduce our costs. As service arrangements expire at the facilities where we utilize externalthird-parties, we intend to determine on a case-by-case basis the most appropriate approach of either entering into new service arrangements with the same or a differentexternal third-party, or transitioning to self-performance of maintenance and service activities. As of December 31, 2019, we had a total of six projects that had completedthe transition to self-perform.
Debt Financing
We intend to use a portion of our revenue from electricity sales to cover our interest expense and principal payments on borrowings under financing facilities. Our interestexpense primarily reflects (i) periodic interest on the term loan financing arrangements, including the effects of interest rate swaps, at our other operating projects,(ii) interest on our convertible and unsecured senior notes, (iii) interest on short-term loan facilities, including any borrowings under our revolving credit facilities and(iv) imputed interest on the lease financing of our Hatchet Ridge project.
We believe that our projects have been financed on average with stronger coverage ratios than is typical in our industry. A debt service coverage ratio is generally definedas a project’s operating cash flows divided by scheduled payments of principal and interest for a period. While we believe that the commercial bank market generally seeksa minimum average annual debt service coverage ratio for wind power projects, based on P50 output levels, of between 1.4 and 1.5 to 1.0, our projects, on a portfolio basis,have an expected average annual debt service coverage ratio over the remaining scheduled loan amortization periods of approximately 1.9 to 1.0.
63
Congestion in the Texas market
In addition to the risks we face in broad commodity markets, many of our projects, especially in ERCOT, also face project-specific risks related to transmission systemlimitations which can result in local or nodal prices that are lower than the broader market prices (congestion). In the case of adverse congestion, our revenues arenegatively impacted, and our financial hedges do not protect us from these impacts, since under those contracts, this risk is fully allocated to our projects and not to thecounterparty (e.g. we sell our power at the lower local price, but still have to buy power for the counterparty at the higher broad market or hub price). In the past, theseimpacts have been material to our economic results, and we expect that congestion will continue to be a material risk, in the future.
General and Administrative Cost
In addition to reducing our project expense through restructuring service agreements and a transition to self-perform, we are also focused on measures to reduce our generaland administrative expenses, including our net related party charges to and from Pattern Development Companies. We are investing in a number of efficiency initiatives(principally automation and other process improvements) in accounting, procurement, human resources, loan administration, and asset management, among others, that webelieve will also result in a lower administrative cost structure.
Key performance metrics
We regularly review a number of financial measurements and operating metrics to evaluate our operating performance, engage in financial planning, measure our growthand make strategic acquisition and investment decisions. In addition to traditional U.S. GAAP performance measures, such as total revenue, cost of revenue, and net loss,our management uses supplemental performance operating metrics such as MWh sold, average realized electricity price, and non-GAAP measures, including AdjustedEBITDA and cash available for distribution.
Adjusted EBITDA
We define Adjusted EBITDA as net income (loss) before net interest expense, income taxes, and depreciation, amortization and accretion, including our proportionate shareof net income (loss) before interest expense, income taxes, and depreciation, amortization and accretion of unconsolidated investments. Adjusted EBITDA also excludesthe effect of certain mark-to-market adjustments, gain or loss related to acquisitions, divestitures, or refinancing transactions, adjustments from unconsolidated investments,and infrequent items not related to normal or ongoing operations. In calculating Adjusted EBITDA, we exclude mark-to-market adjustments to the value of our derivativesbecause we believe that it is useful for investors to understand, as a supplement to net income (loss) and other traditional measures of operating results, the results of ouroperations without regard to periodic, and sometimes material, fluctuations in the market value of such assets or liabilities.
Adjustments from unconsolidated investments represent distributions received in excess of the carrying amount of our investment and suspended equity earnings or losses,during periods of suspension of recognition of equity method earnings. When we receive distributions in excess of the carrying value of our investment and we are notliable for the obligations of the investee nor otherwise committed to provide financial support, we will: 1) suspend recognition of equity method earnings (losses), 2) recordsuch excess distributions as earnings (loss) in unconsolidated investments, net in the period the distributions occur; and 3) suspend equity in earnings (losses) or equity inother comprehensive income of unconsolidated investments, if applicable.
Management believes Adjusted EBITDA assists investors and analysts in comparing our operating performance across reporting periods on a consistent basis by excludingitems that our management believes are not indicative of our core operating performance and to compare our business to that of our peers. Using Adjusted EBITDA, whichis a non-U.S. GAAP measure, enables our management to evaluate our operating performance, our ability to meet debt service and other capital obligations and to measurethe effectiveness of our overall capital structure. The most directly comparable U.S. GAAP measure to Adjusted EBITDA is net income (loss).
However, Adjusted EBITDA has limitations as an analytical tool. Some of these limitations include:
• Adjusted EBITDA
• does not reflect our cash expenditures or future requirements for capital expenditures or contractual commitments;
• does not reflect changes in, or cash requirements for, our working capital needs;
• does not reflect the significant interest expense, or the cash requirements necessary to service interest or principal payments, on our debt, or ourproportional interest in the interest expense of our unconsolidated investments or the cash requirements necessary to service interest or principalpayments on the debt borne by our unconsolidated investments;
64
• does not reflect our income taxes or the cash requirement to pay our taxes; or our proportional interest in income taxes of our unconsolidated investmentsor the cash requirements necessary to pay the taxes of our unconsolidated investments;
• does not reflect depreciation, amortization and accretion which are non-cash charges; or our proportional interest in depreciation, amortization andaccretion of our unconsolidated investments. The assets being depreciated, amortized and accreted will often have to be replaced in the future, andAdjusted EBITDA does not reflect any cash requirements for such replacements; and
• does not reflect the effect of certain mark-to-market adjustments and non-recurring items or our proportional interest in the mark-to-market adjustments atour unconsolidated investments.
• We do not have control, nor have any legal claim to the portion of the unconsolidated investees' revenues and expenses allocable to our joint venture partners. Aswe do not control, but do exercise significant influence, we account for the unconsolidated investments in accordance with the equity method of accounting. Netearnings from these investments are reflected within our consolidated statements of operations in "Earnings in unconsolidated investments, net." Adjustmentsrelated to our proportionate share from unconsolidated investments include only our proportionate amounts of interest expense, income taxes, depreciation,amortization and accretion, and mark-to-market adjustments included in "Earnings in unconsolidated investments, net;" and
• Other companies in our industry may calculate Adjusted EBITDA differently than we do, limiting its usefulness as a comparative measure.
Because of these limitations, Adjusted EBITDA should not be considered in isolation or as a substitute for performance measures calculated in accordance with U.S.GAAP. You should not consider Adjusted EBITDA as an alternative to net income (loss), as determined in accordance with U.S. GAAP.
Cash Available for Distribution
We define cash available for distribution as Adjusted EBITDA further adjusted to (i) subtract unconsolidated investment earnings, (ii) subtract interest expense, less non-cash items, (iii) subtract distributions to noncontrolling interests, (iv) subtract principal payments paid from operating cash flows, (v) subtract current income taxes, (vi)subtract non-expansionary capital expenditures, (vii) subtract preferred dividends, (viii) add distributions from unconsolidated investments, (ix) add net release of restrictedcash, (x) add stock-based compensation, (xi) add pay-go contributions, and (xii) add or subtract other items as necessary to present the cash flows we deem representativeof our core business operations.
Management believes that cash available for distribution is indicative of our core operating performance. As a result, during the year ended December 31, 2018, wechanged our key metric, cash available for distribution, from a liquidity metric to a performance metric. For the periods presented, we reconcile Adjusted EBITDA and cashavailable for distribution to net income (loss), the most directly comparable GAAP financial measure. The change to a performance metric did not change the amount ofcash available for distribution previously reported. Cash available for distribution is a supplemental performance measure used by management and external users of ourfinancial statements to measure our performance across reporting periods on a consistent basis by excluding items that our management believes are not indicative of ourcore operating performance and to compare our business to that of our peers. Cash available for distribution serves as an important measure of our performance and enablesour management to evaluate our ability to meet dividend expectations, the amount of internal capital available for new investment opportunities that can enhance our abilityto grow our dividends over time, and the suitability of our corporate debt levels.
However, cash available for distribution has limitations as an analytical tool. Some of the limitations are:
• Cash available for distribution:
◦ excludes depreciation, amortization and accretion;
◦ does not capture the level of capital expenditures necessary to maintain the operating performance of our projects or complete the construction ofacquired projects;
◦ is not reduced for principal payments on our project indebtedness except to the extent they are paid from operating cash flows during a period;
◦ excludes preferred stock dividends; and
◦ excludes the effect of certain other cash flow items, all of which could have a material effect on our financial condition and results from operations.
65
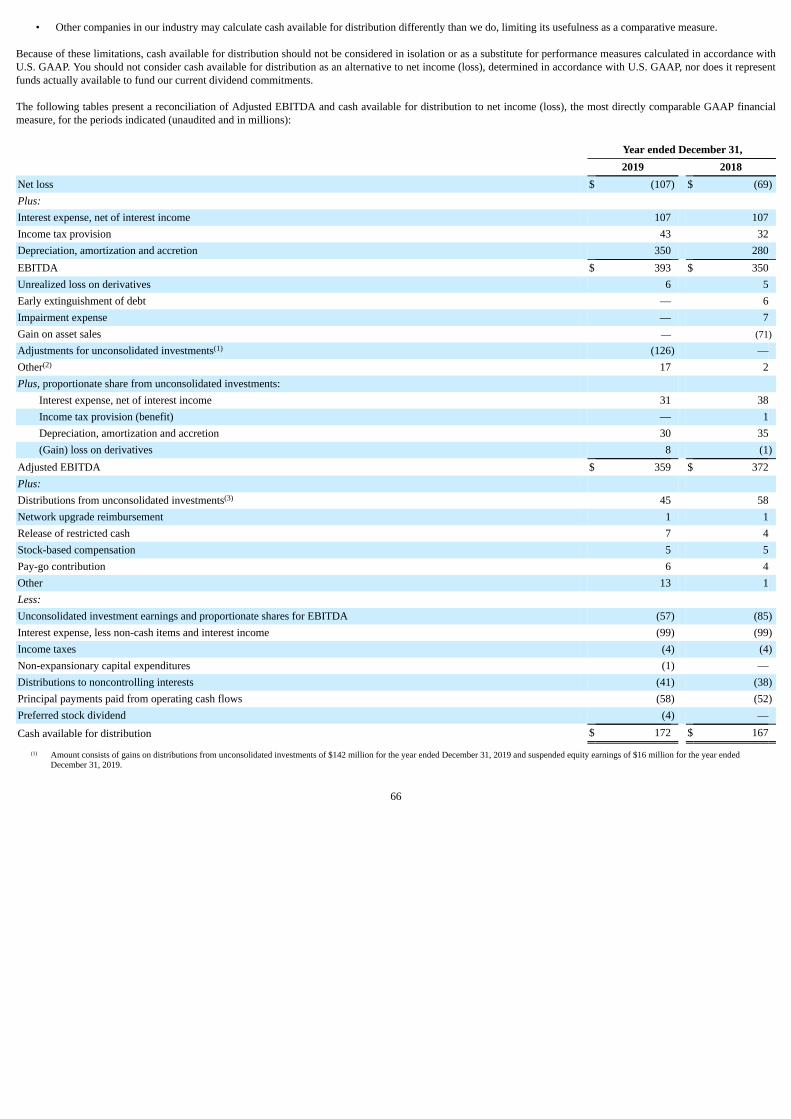
• Other companies in our industry may calculate cash available for distribution differently than we do, limiting its usefulness as a comparative measure.
Because of these limitations, cash available for distribution should not be considered in isolation or as a substitute for performance measures calculated in accordance withU.S. GAAP. You should not consider cash available for distribution as an alternative to net income (loss), determined in accordance with U.S. GAAP, nor does it representfunds actually available to fund our current dividend commitments.
The following tables present a reconciliation of Adjusted EBITDA and cash available for distribution to net income (loss), the most directly comparable GAAP financialmeasure, for the periods indicated (unaudited and in millions):
Year ended December 31, 2019 2018Net loss $ (107) $ (69)Plus: Interest expense, net of interest income 107 107Income tax provision 43 32Depreciation, amortization and accretion 350 280EBITDA $ 393 $ 350Unrealized loss on derivatives 6 5Early extinguishment of debt — 6Impairment expense — 7Gain on asset sales — (71)
Adjustments for unconsolidated investments(1) (126) —Other(2) 17 2Plus, proportionate share from unconsolidated investments:
Interest expense, net of interest income 31 38Income tax provision (benefit) — 1Depreciation, amortization and accretion 30 35(Gain) loss on derivatives 8 (1)
Adjusted EBITDA $ 359 $ 372Plus: Distributions from unconsolidated investments(3) 45 58Network upgrade reimbursement 1 1Release of restricted cash 7 4Stock-based compensation 5 5Pay-go contribution 6 4Other 13 1Less: Unconsolidated investment earnings and proportionate shares for EBITDA (57) (85)Interest expense, less non-cash items and interest income (99) (99)Income taxes (4) (4)Non-expansionary capital expenditures (1) —Distributions to noncontrolling interests (41) (38)Principal payments paid from operating cash flows (58) (52)Preferred stock dividend (4) —
Cash available for distribution $ 172 $ 167
(1) Amount consists of gains on distributions from unconsolidated investments of $142 million for the year ended December 31, 2019 and suspended equity earnings of $16 million for the year endedDecember 31, 2019.
66
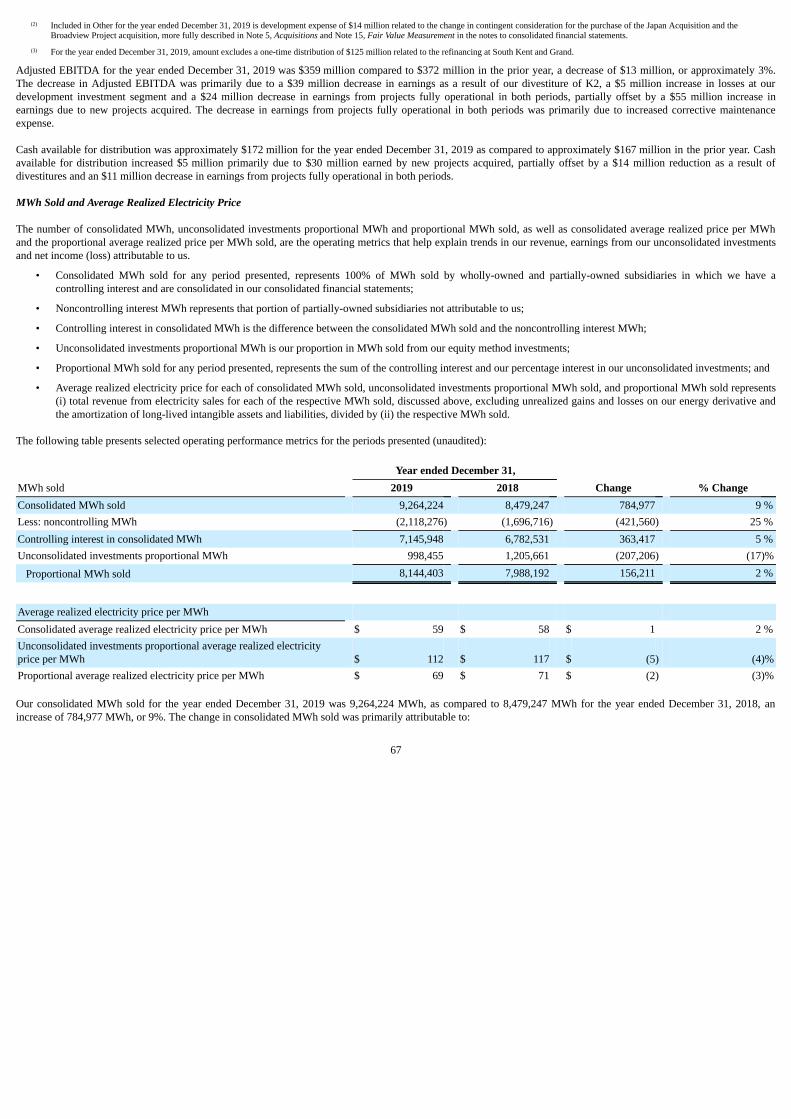
(2) Included in Other for the year ended December 31, 2019 is development expense of $14 million related to the change in contingent consideration for the purchase of the Japan Acquisition and theBroadview Project acquisition, more fully described in Note 5, Acquisitions and Note 15, Fair Value Measurement in the notes to consolidated financial statements.
(3) For the year ended December 31, 2019, amount excludes a one-time distribution of $125 million related to the refinancing at South Kent and Grand.
Adjusted EBITDA for the year ended December 31, 2019 was $359 million compared to $372 million in the prior year, a decrease of $13 million, or approximately 3%.The decrease in Adjusted EBITDA was primarily due to a $39 million decrease in earnings as a result of our divestiture of K2, a $5 million increase in losses at ourdevelopment investment segment and a $24 million decrease in earnings from projects fully operational in both periods, partially offset by a $55 million increase inearnings due to new projects acquired. The decrease in earnings from projects fully operational in both periods was primarily due to increased corrective maintenanceexpense.
Cash available for distribution was approximately $172 million for the year ended December 31, 2019 as compared to approximately $167 million in the prior year. Cashavailable for distribution increased $5 million primarily due to $30 million earned by new projects acquired, partially offset by a $14 million reduction as a result ofdivestitures and an $11 million decrease in earnings from projects fully operational in both periods.
MWh Sold and Average Realized Electricity Price
The number of consolidated MWh, unconsolidated investments proportional MWh and proportional MWh sold, as well as consolidated average realized price per MWhand the proportional average realized price per MWh sold, are the operating metrics that help explain trends in our revenue, earnings from our unconsolidated investmentsand net income (loss) attributable to us.
• Consolidated MWh sold for any period presented, represents 100% of MWh sold by wholly-owned and partially-owned subsidiaries in which we have acontrolling interest and are consolidated in our consolidated financial statements;
• Noncontrolling interest MWh represents that portion of partially-owned subsidiaries not attributable to us;
• Controlling interest in consolidated MWh is the difference between the consolidated MWh sold and the noncontrolling interest MWh;
• Unconsolidated investments proportional MWh is our proportion in MWh sold from our equity method investments;
• Proportional MWh sold for any period presented, represents the sum of the controlling interest and our percentage interest in our unconsolidated investments; and
• Average realized electricity price for each of consolidated MWh sold, unconsolidated investments proportional MWh sold, and proportional MWh sold represents(i) total revenue from electricity sales for each of the respective MWh sold, discussed above, excluding unrealized gains and losses on our energy derivative andthe amortization of long-lived intangible assets and liabilities, divided by (ii) the respective MWh sold.
The following table presents selected operating performance metrics for the periods presented (unaudited):
Year ended December 31, MWh sold 2019 2018 Change % ChangeConsolidated MWh sold 9,264,224 8,479,247 784,977 9 %Less: noncontrolling MWh (2,118,276) (1,696,716) (421,560) 25 %Controlling interest in consolidated MWh 7,145,948 6,782,531 363,417 5 %Unconsolidated investments proportional MWh 998,455 1,205,661 (207,206) (17)%
Proportional MWh sold 8,144,403 7,988,192 156,211 2 %
Average realized electricity price per MWh Consolidated average realized electricity price per MWh $ 59 $ 58 $ 1 2 %Unconsolidated investments proportional average realized electricityprice per MWh $ 112 $ 117 $ (5) (4)%Proportional average realized electricity price per MWh $ 69 $ 71 $ (2) (3)%
Our consolidated MWh sold for the year ended December 31, 2019 was 9,264,224 MWh, as compared to 8,479,247 MWh for the year ended December 31, 2018, anincrease of 784,977 MWh, or 9%. The change in consolidated MWh sold was primarily attributable to:
67
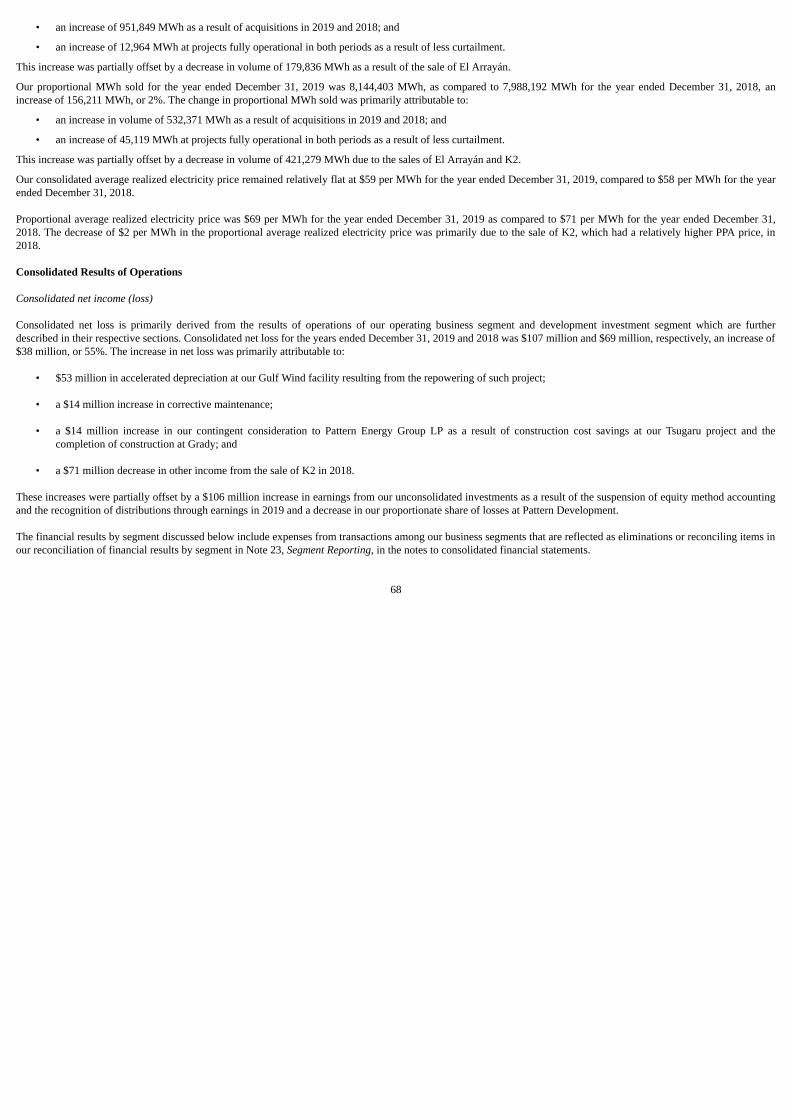
• an increase of 951,849 MWh as a result of acquisitions in 2019 and 2018; and
• an increase of 12,964 MWh at projects fully operational in both periods as a result of less curtailment.
This increase was partially offset by a decrease in volume of 179,836 MWh as a result of the sale of El Arrayán.
Our proportional MWh sold for the year ended December 31, 2019 was 8,144,403 MWh, as compared to 7,988,192 MWh for the year ended December 31, 2018, anincrease of 156,211 MWh, or 2%. The change in proportional MWh sold was primarily attributable to:
• an increase in volume of 532,371 MWh as a result of acquisitions in 2019 and 2018; and
• an increase of 45,119 MWh at projects fully operational in both periods as a result of less curtailment.
This increase was partially offset by a decrease in volume of 421,279 MWh due to the sales of El Arrayán and K2.
Our consolidated average realized electricity price remained relatively flat at $59 per MWh for the year ended December 31, 2019, compared to $58 per MWh for the yearended December 31, 2018.
Proportional average realized electricity price was $69 per MWh for the year ended December 31, 2019 as compared to $71 per MWh for the year ended December 31,2018. The decrease of $2 per MWh in the proportional average realized electricity price was primarily due to the sale of K2, which had a relatively higher PPA price, in2018.
Consolidated Results of Operations
Consolidated net income (loss)
Consolidated net loss is primarily derived from the results of operations of our operating business segment and development investment segment which are furtherdescribed in their respective sections. Consolidated net loss for the years ended December 31, 2019 and 2018 was $107 million and $69 million, respectively, an increase of$38 million, or 55%. The increase in net loss was primarily attributable to:
• $53 million in accelerated depreciation at our Gulf Wind facility resulting from the repowering of such project;
• a $14 million increase in corrective maintenance;
• a $14 million increase in our contingent consideration to Pattern Energy Group LP as a result of construction cost savings at our Tsugaru project and thecompletion of construction at Grady; and
• a $71 million decrease in other income from the sale of K2 in 2018.
These increases were partially offset by a $106 million increase in earnings from our unconsolidated investments as a result of the suspension of equity method accountingand the recognition of distributions through earnings in 2019 and a decrease in our proportionate share of losses at Pattern Development.
The financial results by segment discussed below include expenses from transactions among our business segments that are reflected as eliminations or reconciling items inour reconciliation of financial results by segment in Note 23, Segment Reporting, in the notes to consolidated financial statements.
68

Results of Operating Business Segment
The following table and discussion provides selected financial information of our operating business segment for the periods presented (in millions, except percentages):
Year ended December 31, 2019 vs. 2018
2019 2018 $ Change % Change
Total revenue $ 532 $ 475 $ 57 12 %Total cost of revenue 515 428 87 20Total operating expenses 10 2 8 400Total other (income) expense (84) 72 (156) (217)Net income before income tax 91 (27) 118 (437)Income tax provision 11 11 — —Net income 80 (38) 118 (311)Net loss attributable to noncontrolling interests (76) (211) 135 (64)Net income attributable to Pattern Energy $ 156 $ 173 $ (17) (10)%
Year Ended December 31, 2019 Compared to Year Ended December 31, 2018
Total Revenue
Total revenue for the year ended December 31, 2019 was $532 million compared to $475 million for the year ended December 31, 2018, an increase of $57 million, orapproximately 12%. The increase in total revenue for the year ended December 31, 2019 as compared to the prior year was primarily attributable to:
• $59 million from new projects acquired in 2019 and 2018; and
• $19 million from projects fully operational in both periods, mainly due to a decrease in unrealized loss on our energy derivative and less curtailment, partiallyoffset by unfavorable merchant prices at certain projects in the ERCOT market.
These increases in revenues were offset by a $21 million decrease in revenue due to the divestiture of El Arrayán in 2018.
Cost of revenue
Cost of revenue for the year ended December 31, 2019 was $515 million compared to $428 million for the year ended December 31, 2018, an increase of $87 million, orapproximately 20%. The increase in cost of revenue during 2019 as compared to 2018 was primarily attributable to:
• a $37 million increase attributable to costs associated with new projects for depreciation and project expense;
• a $62 million increase attributable to projects fully operational in both periods, mainly due to a $53 million increase in depreciation primarily as a result of theGulf Wind repower and a $12 million increase in corrective maintenance repairs related to blade maintenance and gearbox repairs.
These increases in costs were offset by a $12 million decrease in project expense and depreciation due to the divestiture of El Arrayán in 2018.
Operating expenses
Operating expenses for the year ended December 31, 2019 were $10 million compared to $2 million for the year ended December 31, 2018, an increase of $8 million, orapproximately 400%. The increase in operating expenses during 2019 as compared to 2018 was primarily attributable to an increase in the contingent consideration payableto Pattern Energy Group LP as a result of construction cost savings at our Tsugaru project.
69
Other expense
Other income for the year ended December 31, 2019 was $84 million compared to other expense of $72 million for the year ended December 31, 2018, an increase of $156million, or approximately 217%. The increase was primarily attributable to:
• a $150 million increase in equity in earnings of unconsolidated investments, net, which is primarily attributable to a one-time $125 million distribution from SouthKent and Grand recognized in earnings as a result of suspension method accounting partially offset by the sale of K2 in 2018.
Income tax provision
We were subject to taxation in the United States, Canada and Japan.
The income tax provision for our operating business segment remained flat at $11 million for the year ended December 31, 2019 and for the year ended December 31,2018.
Noncontrolling interests
The net loss attributable to noncontrolling interests was $76 million for the year ended December 31, 2019 compared to a $211 million net loss attributable tononcontrolling interests for the year ended December 31, 2018. The decreased loss of $135 million, or approximately 64%, was primarily attributable to the Tax Cuts andJobs Act (“the Tax Act”) effective January 1, 2018 which resulted in significantly lower portions of the hypothetical liquidation proceeds to compensate certainnoncontrolling interest investors for tax gains on the hypothetical sale calculated at the lowered corporate income tax rate of 21% compared to the rate of 35% previouslyutilized as a result of the Tax Act. As a result, for the year ended December 31, 2018, a $150 million one-time adjustment is included in net loss attributable tononcontrolling interests as a result of the decrease in the federal corporate income tax rate.
Development Investment Segment
For the years ended December 31, 2019 and 2018, our loss in Pattern Development was as follows (in millions):
Loss in Pattern Development Year ended December 31, 2019 2018
Pattern Development net loss (unaudited) $ (93) $ (121)Our ownership portion of the net loss (unaudited) (27) (35)Intra-entity gain elimination (1) (18) (5)
Loss in earnings of Pattern Development $ (45) $ (40)
(1) Intra-entity eliminations, primarily related to our proportionate share of gains on sale of projects recognized by Pattern Development, are reflected as eliminations within the Corporate, Other andEliminations segment within our reconciliation of financial results by segment in Note 23, Segment Reporting.
Results of the Development Investment Segment
The following table and discussion provide selected financial information of our development investment segment for the periods presented and is unaudited (in millions,except percentages):
Year Ended December 31, 2019(1) 2018(1) $ Change % ChangeTotal revenue $ 72 $ 39 $ 33 85 %Total cost of revenue 53 34 19 56 %Development expense 27 11 16 145 %Operating loss (26) (33) 7 (21)%Net loss $ (27) $ (35) 8 (23)%
(1) Amounts represent our proportionate share in Pattern Development. As discussed above, the development investment segment was acquired in July 2017 and had insignificant operations. As such, the 2017comparative period is not material or meaningful.
70
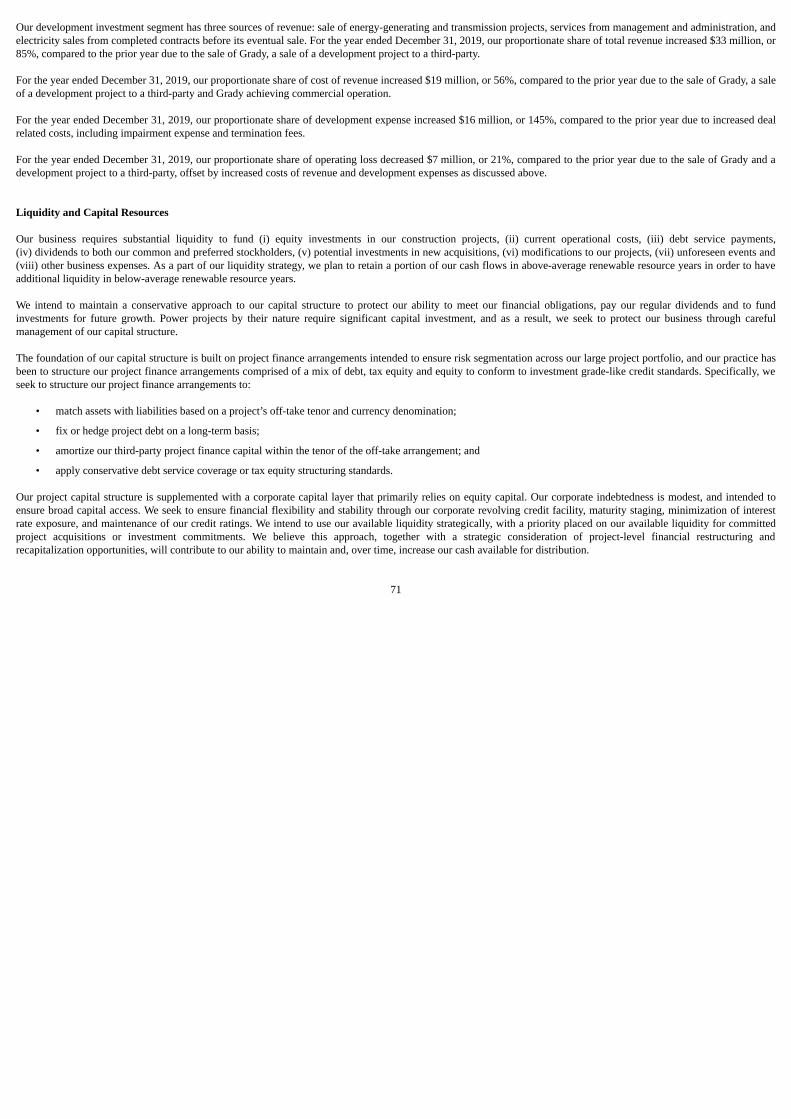
Our development investment segment has three sources of revenue: sale of energy-generating and transmission projects, services from management and administration, andelectricity sales from completed contracts before its eventual sale. For the year ended December 31, 2019, our proportionate share of total revenue increased $33 million, or85%, compared to the prior year due to the sale of Grady, a sale of a development project to a third-party.
For the year ended December 31, 2019, our proportionate share of cost of revenue increased $19 million, or 56%, compared to the prior year due to the sale of Grady, a saleof a development project to a third-party and Grady achieving commercial operation.
For the year ended December 31, 2019, our proportionate share of development expense increased $16 million, or 145%, compared to the prior year due to increased dealrelated costs, including impairment expense and termination fees.
For the year ended December 31, 2019, our proportionate share of operating loss decreased $7 million, or 21%, compared to the prior year due to the sale of Grady and adevelopment project to a third-party, offset by increased costs of revenue and development expenses as discussed above.
Liquidity and Capital Resources
Our business requires substantial liquidity to fund (i) equity investments in our construction projects, (ii) current operational costs, (iii) debt service payments,(iv) dividends to both our common and preferred stockholders, (v) potential investments in new acquisitions, (vi) modifications to our projects, (vii) unforeseen events and(viii) other business expenses. As a part of our liquidity strategy, we plan to retain a portion of our cash flows in above-average renewable resource years in order to haveadditional liquidity in below-average renewable resource years.
We intend to maintain a conservative approach to our capital structure to protect our ability to meet our financial obligations, pay our regular dividends and to fundinvestments for future growth. Power projects by their nature require significant capital investment, and as a result, we seek to protect our business through carefulmanagement of our capital structure.
The foundation of our capital structure is built on project finance arrangements intended to ensure risk segmentation across our large project portfolio, and our practice hasbeen to structure our project finance arrangements comprised of a mix of debt, tax equity and equity to conform to investment grade-like credit standards. Specifically, weseek to structure our project finance arrangements to:
• match assets with liabilities based on a project’s off-take tenor and currency denomination;
• fix or hedge project debt on a long-term basis;
• amortize our third-party project finance capital within the tenor of the off-take arrangement; and
• apply conservative debt service coverage or tax equity structuring standards.
Our project capital structure is supplemented with a corporate capital layer that primarily relies on equity capital. Our corporate indebtedness is modest, and intended toensure broad capital access. We seek to ensure financial flexibility and stability through our corporate revolving credit facility, maturity staging, minimization of interestrate exposure, and maintenance of our credit ratings. We intend to use our available liquidity strategically, with a priority placed on our available liquidity for committedproject acquisitions or investment commitments. We believe this approach, together with a strategic consideration of project-level financial restructuring andrecapitalization opportunities, will contribute to our ability to maintain and, over time, increase our cash available for distribution.
71
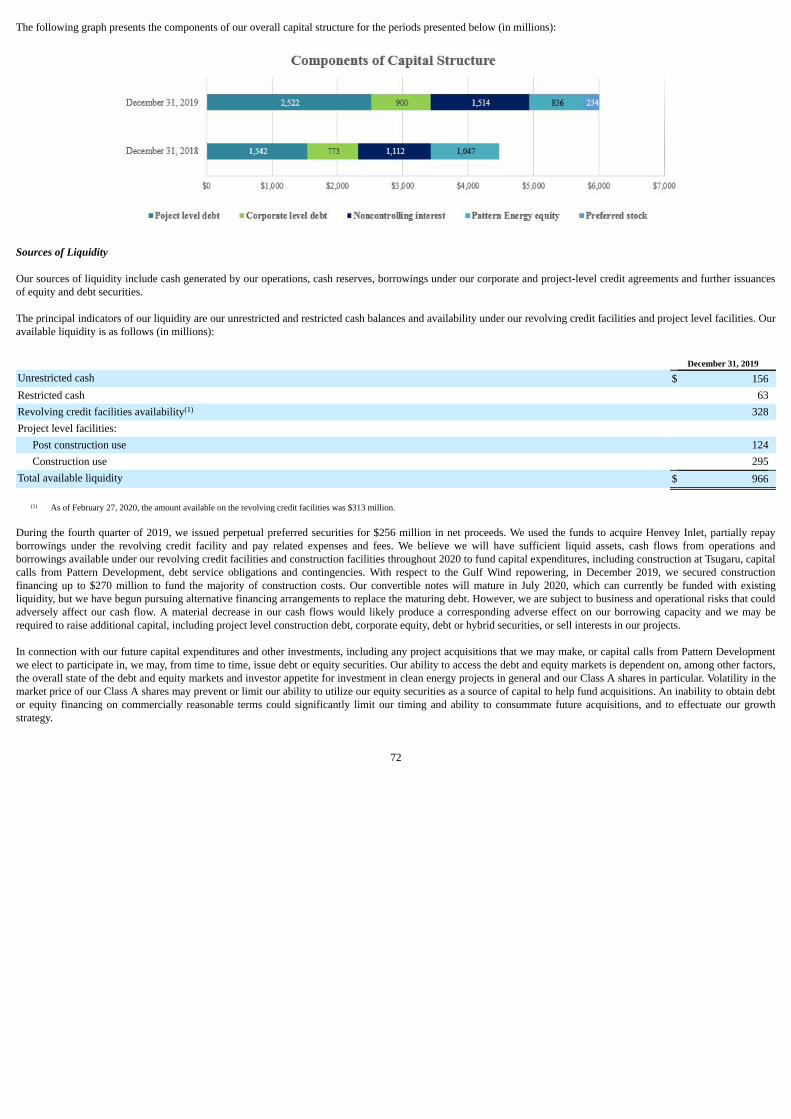
The following graph presents the components of our overall capital structure for the periods presented below (in millions):
Sources of Liquidity
Our sources of liquidity include cash generated by our operations, cash reserves, borrowings under our corporate and project-level credit agreements and further issuancesof equity and debt securities.
The principal indicators of our liquidity are our unrestricted and restricted cash balances and availability under our revolving credit facilities and project level facilities. Ouravailable liquidity is as follows (in millions):
December 31, 2019
Unrestricted cash $ 156Restricted cash 63Revolving credit facilities availability(1) 328Project level facilities:
Post construction use 124Construction use 295
Total available liquidity $ 966
(1) As of February 27, 2020, the amount available on the revolving credit facilities was $313 million.
During the fourth quarter of 2019, we issued perpetual preferred securities for $256 million in net proceeds. We used the funds to acquire Henvey Inlet, partially repayborrowings under the revolving credit facility and pay related expenses and fees. We believe we will have sufficient liquid assets, cash flows from operations andborrowings available under our revolving credit facilities and construction facilities throughout 2020 to fund capital expenditures, including construction at Tsugaru, capitalcalls from Pattern Development, debt service obligations and contingencies. With respect to the Gulf Wind repowering, in December 2019, we secured constructionfinancing up to $270 million to fund the majority of construction costs. Our convertible notes will mature in July 2020, which can currently be funded with existingliquidity, but we have begun pursuing alternative financing arrangements to replace the maturing debt. However, we are subject to business and operational risks that couldadversely affect our cash flow. A material decrease in our cash flows would likely produce a corresponding adverse effect on our borrowing capacity and we may berequired to raise additional capital, including project level construction debt, corporate equity, debt or hybrid securities, or sell interests in our projects.
In connection with our future capital expenditures and other investments, including any project acquisitions that we may make, or capital calls from Pattern Developmentwe elect to participate in, we may, from time to time, issue debt or equity securities. Our ability to access the debt and equity markets is dependent on, among other factors,the overall state of the debt and equity markets and investor appetite for investment in clean energy projects in general and our Class A shares in particular. Volatility in themarket price of our Class A shares may prevent or limit our ability to utilize our equity securities as a source of capital to help fund acquisitions. An inability to obtain debtor equity financing on commercially reasonable terms could significantly limit our timing and ability to consummate future acquisitions, and to effectuate our growthstrategy.
72
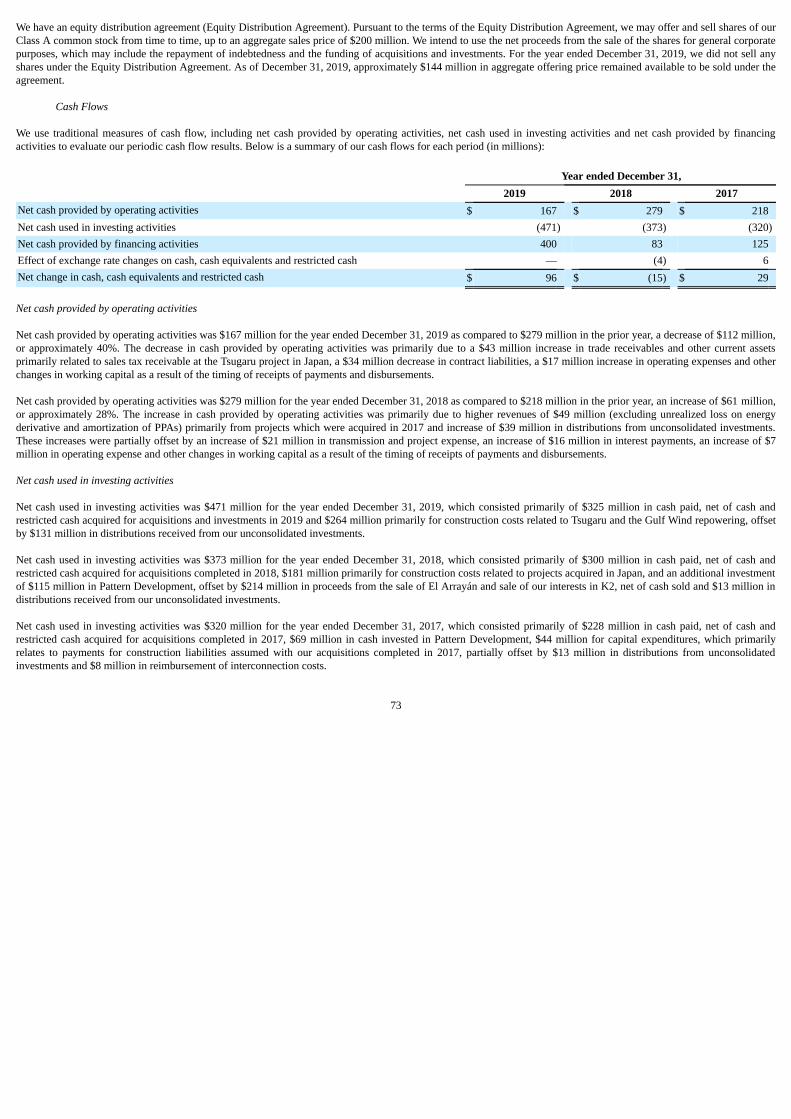
We have an equity distribution agreement (Equity Distribution Agreement). Pursuant to the terms of the Equity Distribution Agreement, we may offer and sell shares of ourClass A common stock from time to time, up to an aggregate sales price of $200 million. We intend to use the net proceeds from the sale of the shares for general corporatepurposes, which may include the repayment of indebtedness and the funding of acquisitions and investments. For the year ended December 31, 2019, we did not sell anyshares under the Equity Distribution Agreement. As of December 31, 2019, approximately $144 million in aggregate offering price remained available to be sold under theagreement.
Cash Flows
We use traditional measures of cash flow, including net cash provided by operating activities, net cash used in investing activities and net cash provided by financingactivities to evaluate our periodic cash flow results. Below is a summary of our cash flows for each period (in millions):
Year ended December 31, 2019 2018 2017Net cash provided by operating activities $ 167 $ 279 $ 218Net cash used in investing activities (471) (373) (320)Net cash provided by financing activities 400 83 125Effect of exchange rate changes on cash, cash equivalents and restricted cash — (4) 6Net change in cash, cash equivalents and restricted cash $ 96 $ (15) $ 29
Net cash provided by operating activities
Net cash provided by operating activities was $167 million for the year ended December 31, 2019 as compared to $279 million in the prior year, a decrease of $112 million,or approximately 40%. The decrease in cash provided by operating activities was primarily due to a $43 million increase in trade receivables and other current assetsprimarily related to sales tax receivable at the Tsugaru project in Japan, a $34 million decrease in contract liabilities, a $17 million increase in operating expenses and otherchanges in working capital as a result of the timing of receipts of payments and disbursements.
Net cash provided by operating activities was $279 million for the year ended December 31, 2018 as compared to $218 million in the prior year, an increase of $61 million,or approximately 28%. The increase in cash provided by operating activities was primarily due to higher revenues of $49 million (excluding unrealized loss on energyderivative and amortization of PPAs) primarily from projects which were acquired in 2017 and increase of $39 million in distributions from unconsolidated investments.These increases were partially offset by an increase of $21 million in transmission and project expense, an increase of $16 million in interest payments, an increase of $7million in operating expense and other changes in working capital as a result of the timing of receipts of payments and disbursements.
Net cash used in investing activities
Net cash used in investing activities was $471 million for the year ended December 31, 2019, which consisted primarily of $325 million in cash paid, net of cash andrestricted cash acquired for acquisitions and investments in 2019 and $264 million primarily for construction costs related to Tsugaru and the Gulf Wind repowering, offsetby $131 million in distributions received from our unconsolidated investments.
Net cash used in investing activities was $373 million for the year ended December 31, 2018, which consisted primarily of $300 million in cash paid, net of cash andrestricted cash acquired for acquisitions completed in 2018, $181 million primarily for construction costs related to projects acquired in Japan, and an additional investmentof $115 million in Pattern Development, offset by $214 million in proceeds from the sale of El Arrayán and sale of our interests in K2, net of cash sold and $13 million indistributions received from our unconsolidated investments.
Net cash used in investing activities was $320 million for the year ended December 31, 2017, which consisted primarily of $228 million in cash paid, net of cash andrestricted cash acquired for acquisitions completed in 2017, $69 million in cash invested in Pattern Development, $44 million for capital expenditures, which primarilyrelates to payments for construction liabilities assumed with our acquisitions completed in 2017, partially offset by $13 million in distributions from unconsolidatedinvestments and $8 million in reimbursement of interconnection costs.
73
Net cash provided by financing activities
Net cash provided by financing activities for the year ended December 31, 2019 was $400 million. Net cash provided by financing activities consisted primarily of thefollowing:
• $1.1 billion in proceeds from the corporate revolving credit facility and long-term debt;
• $256 million in proceeds from the issuance of the Preferred Shares; and
• $28 million in contributions from noncontrolling interest.
Net cash provided by financing activities was partially offset by:
• $711 million in repayments of the corporate revolving credit facility and long-term debt;
• $165 million of dividend payments;
• $41 million in distributions to noncontrolling interest; and
• $21 million in payments of contingent consideration.
Net cash provided by financing activities for the year ended December 31, 2018 was $83 million. Net cash provided by financing activities consisted primarily of thefollowing:
• $788 million in proceeds from debt and revolving credit facilities; and
• $98 million in contributions from noncontrolling interest.
Net cash provided by financing activities was partially offset by:
• $588 million in repayments of debt and revolving credit facilities;
• $165 million of dividend payments;
• $38 million in distributions to noncontrolling interests; and
• $9 million in payments for deferred financing costs primarily associated with the issuance of debt associated with Tsugaru Holdings.
Net cash used in financing activities for the year ended December 31, 2017 was $125 million. Net cash used in financing activities consisted primarily of the following:
• $694 million in net proceeds from the issuance of long-term debt;
• $237 million in net proceeds from equity issuances, net of expenses;
• $333 million in draws on the corporate revolving credit facility; and
• $58 million in proceeds from the partial sale of Panhandle 2.
Net cash provided by financing activities were partially offset by:
• $513 million in repayments of the corporate revolving credit facility;
• $483 million in repayment of long-term debt;
• $145 million in dividend payments;
• $20 million in distributions to noncontrolling interests;
• $16 million in financing fee payments; and
• $14 million in termination of designated derivatives payment.
74
Uses of Liquidity
Cash Dividends to Holders of Preferred Shares
The Preferred Shares are entitled to receive, when declared by our board of directors, cumulative cash dividends at an annual rate of 5.625%, based on the $25.00 per shareliquidation preference. The annual dividend rate shall increase by 0.5% every year starting on the third anniversary of the issuance date to a maximum of four escalations,or 7.625%. The Preferred Shares are further entitled to receive 12.6% of any cash distributions, including the return of capital, made by Pattern Development to us or any ofour subsidiaries not to exceed $3.25 per Preferred Share. Subject to certain exceptions, so long as any Preferred Shares remains outstanding, no dividend or distributionmay be declared or paid on stock on parity with the Preferred Shares, our Class A shares or any other shares of stock junior to the Preferred Shares, unless all accumulatedand unpaid dividends for all preceding full fiscal quarters have been declared and paid with respect to the Preferred Shares.
On February 26, 2020, we approved an aggregate dividend for the first quarter 2020 payable on April 30, 2020 to holders of record on April 15, 2020 of $4 million on thePreferred Shares.
Cash Dividends to Investors
We intend to pay regular quarterly dividends in U.S. dollars to holders of our Class A common stock. On February 26, 2020, we maintained our dividend at $0.4220 perClass A share, or $1.688 per Class A share on an annualized basis, commencing with respect to dividends to be paid on April 30, 2020 to holders of record on March 31,2020. Such dividend will only be payable in the event the record date for such dividend occurs prior to the effective time of the merger under the Merger Agreement. Cashpaid for dividends for the year-ended December 31, 2019 was $165 million.
We expect to pay a quarterly dividend on or about the 30th day following each fiscal quarter to holders of record of our Class A common stock on the last day of suchquarter.
Capital Expenditures and Investments
In 2019, total cash used for capital expenditures was $264 million. We do not include capital expenditures at our projects held at our unconsolidated equity investments.Cash paid for acquisitions and capital to Pattern Development was $326 million.
We expect to make investments in additional projects and provide further capital to Pattern Development. Additionally, we expect to incur approximately $197 million in2020 related to the construction of Tsugaru and re-powering at our Gulf Wind project, all of which is included in the "Contractual Obligations" table below. In addition, forthe year ending December 31, 2020, we have budgeted an additional $8 million for other expansion capital expenditures.
We also evaluate, from time to time, third-party acquisition opportunities. We believe that we will have sufficient cash and capacity from revolving credit facilities andconstruction loans to complete the funding of future commitments, but this may be affected by any other acquisitions or investments that we make. To the extent that wemake any such investments or acquisitions, we will evaluate capital markets and other corporate financing sources available to us at the time. In addition, we will makeinvestments, from time to time, at our operating projects. Operational capital expenditures are those capital expenditures required to maintain our long-term operatingcapacity. Capital expenditures for the projects are generally made at the project level using project cash flows and project reserves, although funding for major capitalexpenditures may be provided by additional project debt or equity. Therefore, the distributions that we receive from the projects may be made net of certain capitalexpenditures needed at the projects.
Contractual Obligations
We have a variety of contractual obligations and other commercial commitments that represent prospective cash requirements. See also Note 10, Debt, and Note 21,Commitments and Contingencies, in the notes to consolidated financial statements for additional discussion of contractual obligations.
75

The following table summarizes estimates of future commitments related to the various agreements that we have entered into as of December 31, 2019 (in millions):
Contractual Obligations Less Than
1 Year 1-3 Years 3-5 Years More Than
5 Years Total
Corporate revolving credit facility $ 75 $ 25 $ — $ — $ 100Corporate-level debt principal payments 225 — — 350 575Corporate-level interest payments on debt instruments 38 54 32 2 126Project-level debt principal payments 205 530 443 1,569 2,747Project-level interest payments on debt instruments 82 155 134 427 798Transmission service agreements 36 72 72 710 890Land agreements 13 26 26 417 482Service and maintenance agreements 37 64 51 49 201Construction and other commitments 249 10 10 73 342Asset retirement obligations 21 — — 242 263
Total $ 981 $ 936 $ 768 $ 3,839 $ 6,524
Credit Agreements for Equity Method Investments
Below is a summary of our proportion of debt in unconsolidated investments, as of December 31, 2019 (in millions):
Total
Entity Debt Percentage of
Ownership Our Portion ofUnconsolidated
Entity Debt
Belle River $ 173 22% $ 38North Kent 169 35% 59South Kent 695 50% 348Grand 326 45% 147Armow 359 50% 180Pattern Development 100 29% 29Unconsolidated investments - debt $ 1,822 $ 801
Off-Balance Sheet Arrangements
As of December 31, 2019, we did not have any significant off-balance sheet arrangements, as defined in Item 303(a)(4)(ii) of Regulation S-K.
Covenants, Distribution Conditions and Events of Default
Corporate-Level Debt
Corporate Revolving Credit Facility
Our corporate revolving credit facility has customary covenants, prepayment provisions and events of default. The most restrictive of such provisions is the maintenancecoverage ratio that requires the subsidiary borrowers to maintain a leverage ratio (the ratio of borrower debt to borrower cash flow) that does not exceed 5.50:1.00 and aninterest coverage ratio (the ratio of borrower cash flow to borrower interest expense) that is not less than 1.75:1.00.
In addition, certain of our subsidiaries are subject to usual and customary affirmative and negative covenants under our corporate revolving credit facility. Specifically, withlimited exceptions, such subsidiaries are prohibited from distributing funds to us unless the following conditions are met: (i) no event of default under the corporate creditfacility has occurred and is continuing or would be caused by such distribution and (ii) the corporate credit facility borrowers are in compliance with the leverage ratio testand the interest coverage ratio test, both before and after giving effect to such distribution. As of December 31, 2019, we were in compliance with all covenants containedin our corporate revolving credit facility.
76

Convertible Notes
The indenture for the convertible notes contains customary terms and covenants, including that upon certain events of default occurring and continuing, either the trustee orthe holders of not less than 25% in aggregate principal amount of the convertible notes then outstanding may declare the unpaid principal of the convertible notes andaccrued and unpaid interest, if any, thereon immediately due and payable. In the case of certain events of bankruptcy, insolvency or reorganization relating to us, theprincipal amount of the convertible notes together with accrued and unpaid interest, if any, thereon will automatically become and be immediately due and payable.
The indenture for the convertible notes also has provisions relating to repurchases upon a “fundamental change” as defined therein. The merger contemplated by the MergerAgreement would be a “fundamental change,” if consummated.
Unsecured Senior Notes
Under the unsecured senior notes issued in January 2017, we have agreed to certain restrictions on our or the subsidiary guarantor's ability to incur secured debt and ourability to consolidate, merge or sell all or substantially all of our assets. These covenants are subject to a number of important limitations and exceptions.
Consolidated Project-Level Debt and Unconsolidated Investments Project-Level Debt
Under the respective credit agreements for each of Hatchet Ridge, St. Joseph, Santa Isabel, Ocotillo, Western Interconnect, Meikle, MSM, Tsugaru, Futtsu, Ohorayama,Gulf Wind, and Henvey Inlet, our projects are subject to certain covenants, events of default and distribution conditions. In addition, the respective credit agreements foreach of our unconsolidated investments South Kent, North Kent, Belle River, Grand, and Armow contain certain covenants, events of default and distribution conditions.While terms may vary between the individual credit agreements, the most significant and restrictive include restrictions on the project’s ability to incur debt, grant liens, sellor lease assets, transfer equity interests, dissolve, pay distributions and change its business.
In general, the distribution conditions included in the credit agreements are as follows:
• to the extent the project has letter of credit facilities under the project debt, there are no letter of credit loans outstanding;
• to the extent the project has reserve requirements, accounts are fully funded;
• any mandatory prepayment required has been made;
• no default has occurred and such distribution will not result in an event of default; and
• the applicable project has met its debt service coverage ratio.
Japan Credit Facility
GPG is party to a revolving credit facility that has customary covenants, prepayment provisions and events of default. The most restrictive of such provisions is to maintaina leverage ratio (the ratio of borrower debt to borrower cash flow) that does not exceed 5.00:1.00 and an interest coverage ratio (the ratio of borrower cash flow to borrowerinterest expense) that is not less than 3.00:1.00.
Tsugaru Holdings is party to a back-leverage credit facility that has customary covenants, prepayment provisions and events of default. The most restrictive of suchprovisions is a restriction on distributions outside of the company until the loan has been fully repaid.
Distributions from Unconsolidated Investments
In general, distributions result from excess cash flows from our unconsolidated investments, which represent revenues received from the sale of electricity, as reduced byoperating expenses, interest and principal payments on project level debt provided that specified distribution requirements are met under the project loan agreement. Projectfinancing arrangements typically limit the timing of such distributions from the project entity to the same frequency as the scheduled principal and interest payments madeby such project entity, which is usually on a quarterly basis although some financing arrangements instead call for monthly or semiannual payments. Distributions from ourunconsolidated investments may be affected by the underlying performance of each project entity, and significant underperformance of the project could result indistributions not being made for some period of time. Overall, however, we expect that we will receive distributions throughout the term of the project's PPA.
77

Tax Equity Partnership
Generally, tax equity partnerships have specific commercial terms that dictate distributions of cash and allocation of tax items among the partners, who are divided into oneof two categories: tax equity and cash investor. A disproportionate share of income and cash is given to tax equity in order for them to achieve a target after-tax yield or“flip” near year 10 of project operations. The target yield and flip term vary by agreement and are dependent on project performance. Prior to the flip, tax items (income,PTCs) are commonly allocated 99% to the tax equity. On the other hand, distributable cash is divided among the partners in percentages that do not match the tax items.Cash distribution percentages can be temporarily increased for tax equity in the event that certain cumulative distribution thresholds are not achieved. This has occurred forcertain projects in 2019 and may occur for additional projects in 2020. Once tax equity reaches their target yield, the allocations and distributions “flip” to differentamounts. After the flip, income and cash are typically allocated 5% to the tax equity and 95% to the cash investor. REC sales are often specially addressed in eachagreement with most of the cash and income directed to the cash investor both pre and post-flip.
Tax equity partnership imposes a range of affirmative and negative covenants that are similar to what a term lender would require, such as, financial reporting, insurancemaintenance and prudent operator standards. Most of these restrictions end once the flip point occurs and any deficit restoration obligation of the tax equity has beeneliminated. There are also covenants that specifically seek to preserve the tax attributes of the project that are not customary for project term lenders.
If tax equity suffers any losses or damages as the result of a breach of representation, covenant, or other obligation by the cash investor in its capacity as managing member,tax equity may provide notice to the cash investor and require that any distributions otherwise required to be paid to the cash investor shall, instead, be paid to tax equity tocover any damages.
Critical Accounting Policies and Estimates
Our discussion and analysis of our financial condition and results of operations are based on our consolidated historical financial statements that are included elsewhere inthis Form 10-K, which have been prepared in accordance with U.S. GAAP. In applying the critical accounting policies set forth below, our management uses its judgmentto determine the appropriate assumptions to be used in making certain estimates. These estimates are based on management’s experience, the terms of existing contracts,management’s observance of trends in the renewable energy industry, information provided by our power purchasers and information available to management from otheroutside sources, as appropriate. These estimates are subject to an inherent degree of uncertainty.
We use estimates, assumptions and judgments for certain items, including the calculation of our acquisitions, noncontrolling interest balances, and derivatives. Theseestimates, assumptions and judgments are derived and continually evaluated based on available information, experience and various assumptions we believe to bereasonable under the circumstances. To the extent these estimates are materially incorrect and need to be revised, our operating results may be materially adversely affected.
Acquisitions
Accounting Standards Update (ASU) 2017-01, Clarifying the Definition of a Business (ASU 2017-01) provides a screen to determine when a set of assets and activitiesshould not be considered a business. Under ASU 2017-01, we perform an initial screening test that, if met, results in the conclusion that the set is not a business. If theinitial screening test is not met, we evaluate whether the set is a business based on whether there are inputs and a substantive process in place. The definition of a businessimpacts whether we consolidate an acquisition under business combination guidance or asset acquisition guidance. When the acquisition is recognized as an equity methodinvestment, the definition of a business impacts whether equity method goodwill can be recognized.
Business Combinations, Asset Acquisitions, and Equity Method Investments
When we acquire a controlling interest in an entity deemed to be a business, the purchase is accounted for using the acquisition method, and the fair value of the purchaseconsideration is allocated to the tangible and intangible assets acquired and the liabilities assumed based on their estimated fair values. Contingent consideration, if anyexists, is also recognized and measured at fair value as of the acquisition date. The excess, if any, of the fair value of the purchase consideration over the fair values of theidentifiable net assets is recorded as goodwill. Conversely, the excess, if any, of the net fair value of the identifiable net assets over the fair value of the purchaseconsideration is recorded as a gain. Transaction costs associated with business combinations are expensed as incurred.
78

When we acquire assets and liabilities that do not constitute a business or a variable interest entity (VIE) of which we are the primary beneficiary, the fair value of thepurchase consideration, including transaction costs of the asset acquisition, is assumed to be equal to the fair value of the net assets acquired. The purchase consideration,including the transaction costs, is allocated to the individual assets and liabilities assumed based on their relative fair values. Contingent consideration associated with theacquisition is generally recognized only when the contingency is resolved. No goodwill is recognized in an asset acquisition.
When we acquire assets and liabilities that do not constitute a business but meet the definition of a VIE of which we are the primary beneficiary, the purchase is accountedfor using the acquisition method described above for business combination, except that no goodwill is recognized. To the extent that there is difference between thepurchase consideration and the VIE's identifiable assets and liabilities recorded and measured at fair value, the difference is recognized as a gain or loss.
When we acquire a noncontrolling interest in an entity where we are not the primary beneficiary, do not control any of the ongoing activities of the entity, and do not meetconsolidation requirements of Accounting Standards Codification (ASC) 810, Consolidation, and ASU 2015-02, Consolidation (Topic 810): Amendments to theConsolidation Analysis, the investment is initially recognized as an equity method investment at cost. Any difference between the cost of an investment and the amount ofunderlying equity in net assets of an investee are considered basis differences. Basis difference related to the property, plant and equipment are amortized over the estimatedeconomic useful life of the underlying long-lived assets, while basis difference related to the PPA are amortized over the remaining term of the PPA. Transaction costsassociated with equity method investments are included in the investment.
Additionally, if the projects in which we hold these investments recognize an impairment under the provisions of ASC 360, Property, Plant and Equipment, we wouldrecord our impairment loss and would evaluate our investment for an other than temporary decline in value under ASC 323, Investments—Equity Method and JointVentures.
Significant judgment is required in determining the acquisition date fair value of the assets acquired and liabilities assumed using either an income, market, or cost-basedvaluation method. The valuations require management to make significant estimates and assumptions. These estimates and assumptions are inherently uncertain, and as aresult, actual results may differ from estimates. Significant estimates include, but are not limited to, revenue and operating expense growth, future expected cash flows, anddiscount rates.
For business combinations, during the measurement period, which is one year from the acquisition date, we may record adjustments to the assets acquired and liabilitiesassumed. Upon the conclusion of the measurement period, any subsequent adjustments are recorded to earnings.
The allocation of the purchase price directly affects the following items in our consolidated financial statements:
• The amount of purchase price allocated to the various tangible and intangible assets, liabilities and noncontrolling interests on our consolidated balance sheets;
• The amounts of purchase price allocated to the value of above-market and below-market power purchase agreement, which is subsequently amortized to electricitysales over the remaining terms of each respective arrangement; and
• The period of time over which tangible and intangible assets are depreciated or amortized varies, and thus, changes in the amounts allocated to these assets willhave a direct impact on our results of operations.
Noncontrolling Interests
Noncontrolling interests represent the portion of our net income (loss), net assets and comprehensive income (loss) that is not allocable to us and is calculated based on ourownership percentage, for certain projects.
For those projects where economic benefits are not allocated based on pro rata ownership percentage, we have determined that the appropriate methodology for calculatingthe noncontrolling interest balances that reflects the substantive economic arrangements in the operating agreements is a balance sheet approach using the hypotheticalliquidation at book value (HLBV) method.
Under the HLBV method, the amounts reported as noncontrolling interests in the consolidated balance sheets represent the amounts third-party investors wouldhypothetically receive at each balance sheet reporting date under the liquidation provisions of the operating partnership agreements, assuming the net assets of our projectswere liquidated at amounts determined in accordance with U.S. GAAP and distributed to the investors. Therefore, the noncontrolling interest balances in these projects arereported as a component of equity in the consolidated balance sheets.
79
The third-party interests in the results of operations for those projects using HLBV is determined as the difference in noncontrolling interests in the consolidated balancesheets at the start and end of each reporting period, after taking into account any capital transactions between our projects and the third-party investors.
Factors used in the HLBV calculation include U.S. GAAP income, taxable income, capital contributions, production tax credits, and distributions, and the stipulatedtargeted equity investor return specified in the projects' operating agreements.
Changes in these factors could have a significant impact on the amounts that investors would receive upon a hypothetical liquidation. The use of the HLBV methodology toallocate income to the noncontrolling interest holders may create volatility in our consolidated statements of operations as the application of HLBV can drive changes in netincome or loss attributable to noncontrolling interests from quarter to quarter.
Derivatives
We enter into derivative transactions primarily for the purpose of reducing exposure to fluctuations in interest rates, foreign currency exchange rates and electricity prices.We have entered into interest rate swap agreements and have designated certain of these derivatives as cash flow hedges of expected interest payments on variable rate debt.We also enter into foreign exchange currency transactions to hedge the distributions in Canadian dollars and Japanese yen from our operational Canadian and Japaneseproject entities. These foreign exchange currency derivatives currently do not qualify for hedge accounting. We may also enter into interest rate caps. Currently, we do nothold interest rate cap arrangements. Furthermore, we have energy derivative agreements that do not qualify for hedge accounting.
We recognize our derivative instruments at fair value in the consolidated balance sheets, unless the derivative instruments qualify for the normal purchase normal sale(NPNS) scope exception to derivative accounting. Accounting for changes in the fair value of a derivative instrument depends on whether the derivative instrument hasbeen designated as part of a hedging relationship and on the type of hedging relationship.
For derivative instruments that are designated as cash flow hedges, the change in unrealized losses on cash flow hedges, net of tax is reported as a component of othercomprehensive income (loss). Changes in the fair value of these derivatives are subsequently reclassified into earnings in the period that the hedged transaction affectsearnings. The ineffective portion of change, if any, in fair value is recorded as a component of net income (loss) on the consolidated statements of operations. The change infair value for undesignated derivative instruments is reported as a component of net income (loss) on the consolidated statements of operations. Certain of our energyderivative agreements qualify for the NPNS scope exception and therefore are not accounted for as derivatives.
Energy prices are subject to wide swings as supply and demand are impacted by, among many other unpredictable items, weather, market liquidity, generating facilityavailability, customer usage, storage, and transmission and transportation constraints. Interest rate risk exists primarily on variable-rate debt for which the cash flows varybased upon fluctuations in interest rates. Also, foreign currency exchange rates are subject to fluctuations in market movements and can be impacted by, among otherfactors, economic conditions, inflation rate, political stability and public debt. We do not hedge all of our commodity price, foreign currency exchange rate and interest raterisks, thereby exposing the unhedged portion to changes in market prices.
Market price quotations for certain electricity and natural gas trading hubs related to energy derivative agreements are not as readily obtainable due to the lengths of thecontracts. Given that limited market data exists for these contracts, as well as for those contracts that are not actively traded, we use forward price curves derived fromthird-party models based on perceived pricing relationships to major trading hubs that are based on unobservable inputs. The estimated fair value of energy derivativeagreements is a function of underlying forward energy prices, related volatility, counterparty creditworthiness, and duration of the contracts. The assumptions used in thevaluation models are critical and any changes in assumptions could have a significant impact on the estimated fair value of the contract.
Income Taxes
We are subject to income taxes in the U.S. (federal and state) and numerous foreign jurisdictions. Tax laws, regulations, and administrative practices in various jurisdictionsmay be subject to significant change, with or without notice, due to economic, political, and other conditions, and significant judgment is required in evaluating andestimating our provision and accruals for these taxes. There are transactions that occur during the ordinary course of business for which the ultimate tax determination isuncertain. Our effective tax rates could be affected by numerous factors, such as intercompany transactions, the relative amount of our foreign earnings, the applicability ofspecial tax regimes, losses incurred in jurisdictions for which we may not be able to realize the related tax benefit, changes in foreign currency exchange rates, acquisitions(including integrations) and investments and how they are financed, changes in our deferred tax assets and liabilities and their valuation, and changes in laws, regulations,administrative practices and interpretations related to tax and accounting.
Item 7A.
Quantitative and Qualitative Disclosures about Market Risk.
We have significant exposure to commodity prices, interest rates and foreign currency exchange rates, as described below. To mitigate these market risks, we have enteredinto multiple derivatives. We have not applied hedge accounting treatment to all of our derivatives, therefore we are required to mark some of our derivatives to marketthrough earnings on a periodic basis, which will result in non-cash adjustments to our earnings and may result in volatility in our earnings, in addition to potential cashsettlements for any losses.
Commodity Price Risk
We manage our commodity price risk for electricity sales primarily through the use of fixed price long-term power purchase agreements with creditworthy counterparties.Our financial results reflect approximately 491,576 MWh of electricity sales in the year ended December 31, 2019 that were subject to spot market pricing. A hypotheticalincrease or decrease of 10% or $3.18 per MWh in the merchant market prices would have increased or decreased revenue by $2 million for the year ended December 31,2019.
In addition to the risks we face in broad commodity markets, many of our projects, especially in ERCOT, also face project-specific risks related to transmission systemlimitations which can result in local prices that are lower than the broader market prices (congestion). In the case of adverse congestion, our revenues are negativelyimpacted, and our financial hedges do not protect us from these impacts, since under those contracts, this risk is fully allocated to our projects and not to the counterparty(e.g. we sell our power at the lower local price, but still have to buy power for the counterparty at the higher broad market or hub price). In the past, these impacts havebeen material to our economic results, and we expect that congestion will continue to be a material risk in the future.
Interest Rate Risk
As of December 31, 2019, our long-term debt includes both fixed and variable rate debt. As long-term debt is not carried at fair value on the consolidated balance sheets,changes in fair value would impact earnings and cash flows only if we were to reacquire all or a portion of these instruments prior to their maturity. The fair market value ofour outstanding convertible senior notes, or "debentures," is subject to interest rate risk, market price risk and other factors due to the convertible feature of the debentures.The fair market value of the debentures will generally increase as interest rates fall and decrease as interest rates rise. In addition, the fair market value of the debentureswill generally increase as the market price of our Class A common stock increases and decrease as the market price of our Class A common stock falls. The interest andmarket value changes affect the fair market value of the debentures, but do not impact our financial position, cash flows or results of operations due to the fixed nature ofthe debt obligations, except to the extent that changes in the fair value of

the debentures or value of Class A common stock permit the holders of the debentures to convert into shares. As of December 31, 2019, the estimated fair value of our debtwas $3.4 billion and the carrying value of our debt was $3.4 billion. The fair value of variable interest rate long-term debt is approximated by its carrying cost. Ahypothetical increase or decrease in market interest rates by 1% would have resulted in a $34 million decrease or $43 million increase in the fair value of our fixed ratedebt.
We are exposed to fluctuations in interest rate risk as a result of our variable rate debt and outstanding amounts due under our revolving credit facilities. As ofDecember 31, 2019, $350 million was outstanding under our revolving credit facilities. A hypothetical increase or decrease in interest rates by 1% would have a $4 millionimpact on interest expense for the year ended 2018.
We may use a variety of derivative instruments, with respect to our variable rate debt, to manage our exposure to fluctuations in interest rates, including interest rate swapsand interest rate caps. As a result, our interest rate risk is limited to the unhedged portion of the variable rate debt. As of December 31, 2019, the unhedged portion of ourvariable rate debt was $537 million. A hypothetical increase or decrease in interest rates by 1% would have a $5 million impact to interest expense for the year endedDecember 31, 2019.
Foreign Currency Exchange Rate Risk
Our wind power projects are located in the United States, Canada and Japan. As a result, our financial results could be significantly affected by factors such as changes inforeign currency exchange rates or weak economic conditions in the foreign markets in which we operate. When the U.S. dollar strengthens against foreign currencies, therelative value in revenue earned in the respective foreign currency decreases. When the U.S. dollar weakens against foreign currencies, the relative value in revenue earnedin the respective foreign currency increases. A majority of our power sale agreements and operating expenditures are transacted in U.S. dollars, with a growing portiontransacted in currencies other than the U.S. dollar, primarily the Canadian dollar. For the year ended December 31, 2019, our financial results included C$204 million of netincome and ¥1,046 million of net loss from our Canadian and Japanese operations, respectively. A hypothetical increase or decrease of 10% in exchange rates between theCanadian and U.S. dollar would have increased or decreased net earnings of our Canadian and Japanese operations by $16 million and $10 million for the years endedDecember 31, 2019 and 2018, respectively.
We have established a currency risk management program. The objective of the program is to mitigate the foreign exchange rate risk arising from transactions or cash flowsthat have a direct or underlying exposure in non-U.S. dollar denominated currencies in order to reduce volatility in our cash flow, which may have an adverse impact to ourshort-term liquidity or financial condition. For the year ended December 31, 2019, we recognized a gain on foreign currency forward contracts of $4 million in gain (loss)on derivatives in the consolidated statements of operations due to the strengthening of the U.S. dollar.
As of December 31, 2019, a 10% devaluation in the Canadian dollar and Japanese yen to the United States dollar would result in our consolidated balance sheets beingnegatively impacted by a $307 million cumulative translation adjustment in accumulated other comprehensive loss.
Item 8. Financial Statements and Supplementary Data.
The financial statements and schedules are listed in Part IV, Item 15 of this Form 10-K, beginning at page F-1, Index to Consolidated Financial Statements, and areincorporated by reference herein.
Item 9. Changes in and Disagreements with Accountants on Accounting and Financial Disclosure.
None.
Item 9A. Controls and Procedures.
Evaluation of Disclosure Controls and Procedures
Our management, with the participation of our chief executive officer and chief financial officer, has evaluated the effectiveness of our disclosure controls and proceduresas defined in Rules 13a-15(e) and 15d-15(e) under the Securities Exchange Act of 1934, as amended (Exchange Act), as of the end of the period covered by this Form 10-K.
80
Based on this evaluation, our chief executive officer and chief financial officer concluded that, as of December 31, 2019, our disclosure controls and procedures aredesigned at a reasonable assurance level and are effective to provide reasonable assurance that information we are required to disclose in reports that we file or submitunder the Exchange Act is recorded, processed, summarized, and reported within the time periods specified in the SEC’s rules and forms, and that such information isaccumulated and communicated to our management, including our chief executive officer and chief financial officer, as appropriate, to allow timely decisions regardingrequired disclosure.
Inherent Limitations Over Disclosure Controls and Procedures
In designing and evaluating the disclosure controls and procedures, management recognizes that any controls and procedures, no matter how well designed and operated,can provide only reasonable assurance of achieving the desired control objectives. In addition, the design of disclosure controls and procedures must reflect the fact thatthere are resource constraints and that management is required to apply its judgment in evaluating the benefits of possible controls and procedures relative to their costs.
Management’s Annual Report on Internal Control over Financial Reporting
Our management is responsible for establishing and maintaining adequate internal control over financial reporting, as defined in Rule 13a-15(f) under the Exchange Act.Management conducted an assessment of the effectiveness of our internal control over financial reporting based on the criteria set forth in Internal Control - IntegratedFramework issued by the Committee of Sponsoring Organizations of the Treadway Commission (2013 framework).
Based on this evaluation, management concluded that our internal control over financial reporting was effective as of December 31, 2019. Our independent registeredpublic accounting firm, PricewaterhouseCoopers LLP, has issued an audit report on our internal control over financial reporting, which appears herein.
Changes in Internal Control Over Financial Reporting
Management continuously reviews internal control over financial reporting, and accordingly may, from time to time, make changes aimed at enhancing their effectivenessto ensure that its systems evolve with its business. There were no changes in our internal control over financial reporting during the quarter ended December 31, 2019 thathave materially affected, or are reasonably likely to materially affect our internal control over financial reporting.
Item 9B. Other Information.
None
81

PART III
Certain information required by Part III is omitted from this Form 10-K because the registrant intends to file with the U.S. Securities and Exchange Commission adefinitive proxy statement pursuant to Regulation 14A in connection with the solicitation of proxies for the Company’s Annual Meeting of Stockholders, or the 2020 ProxyStatement, within 120 days after the end of the fiscal year covered by this Form 10-K, and certain information included therein is incorporated herein by reference. In theevent the registrant does not file the 2020 Proxy Statement within such period, the registrant intends to provide such Part III information by amendment to this AnnualReport on Form 10-K filed by April 29, 2020.
Item 10. Directors, Executive Officers and Corporate Governance.
The information required under this Item 10 will be either incorporated by reference from our definitive proxy statement for our 2020 annual meeting of stockholders orprovided by amendment to this Annual Report on Form 10-K filed by April 29, 2020.
Item 11. Executive Compensation.
The information required under this Item 11 will be either incorporated by reference from our definitive proxy statement for our 2020 annual meeting of stockholders orprovided by amendment to this Annual Report on Form 10-K filed by April 29, 2020.
Item 12. Security Ownership of Certain Beneficial Owners and Management and Related Stockholder Matters.
The information required under this Item 12 will be either incorporated by reference from our definitive proxy statement for our 2020 annual meeting of stockholders orprovided by amendment to this Annual Report on Form 10-K filed by April 29, 2020.
Item 13. Certain Relationships and Related Transactions, and Director Independence.
The information required under this Item 13 will be either incorporated by reference from our definitive proxy statement for our 2020 annual meeting of stockholders orprovided by amendment to this Annual Report on Form 10-K filed by April 29, 2020.
Item 14. Principal Accounting Fees and Services.
The information required under this Item 14 will be either incorporated by reference from our definitive proxy statement for our 2020 annual meeting of stockholders orprovided by amendment to this Annual Report on Form 10-K filed by April 29, 2020.
82
PART IV
Item 15. Exhibits and Financial Statement Schedule.
(a) Documents filed as part of this report
(1) Consolidated financial statements—Pattern Energy Group Inc.
Report of Independent Registered Public Accounting Firm F-2
Consolidated Balance Sheets as of December 31, 2019 and December 31, 2018 F-4
Consolidated Statements of Operations for the years ended December 31, 2019, 2018 and 2017 F-5
Consolidated Statements of Comprehensive Income (Loss) for the years ended December 31, 2019, 2018 and 2017 F-6
Consolidated Statement of Stockholders’ Equity for the years ended December 31, 2019, 2018 and 2017 F-7
Consolidated Statements of Cash Flows for the years ended December 31, 2019, 2018 and 2017 F-8
Notes to Consolidated Financial Statements F-10
Financial statements—Equity Method Investments
a) South Kent Wind LP Financial Statements as of December 31, 2019 and December 31, 2018 (unaudited), and for the years ended December 31, 2019,2018 (unaudited) and 2017 S-1
b) Grand Renewable Wind LP Financial Statements as of December 31, 2019 and December 31, 2018 (unaudited), and for the years ended December 31,2019, 2018 (unaudited) and 2017 S-23
c) SP Armow Wind Ontario LP Financial Statements as of December 31, 2019 (unaudited) and December 31, 2018 (unaudited), and for the years endedDecember 31, 2019 (unaudited), 2018 (unaudited) and 2017 S-47
d) K2 Wind Ontario LP Financial Statements for the period January 1, 2018 to December 30, 2018 (unaudited) and the year ended December 31, 2017 S-69
e) Pattern Energy Group 2 LP Financial Statements as of December 31, 2019 and December 31, 2018, and for the years ended December 31, 2019, 2018 andfor the period from July 27, 2017 to December 31, 2017 S-84
(2) Financial statements Schedule—Pattern Energy Group Inc. Parent
Schedule I - Condensed Parent Company Financial Statements as of December 31, 2019 and December 31, 2018, and for the years ended December 31,2019, 2018, 2017 S-117
(3) Exhibits
83

The following documents are filed or furnished as part of this Form 10-K. The Company will furnish a copy of any exhibit listed to requesting stockholders uponpayment of the Company’s reasonable expenses in furnishing those materials.
Exhibit No. Description Of Exhibits
2.1
Agreement and Plan of Merger among Pattern Energy Group Inc., Pacific US Inc. and Pacific BidCo US Inc., dated as of November 3, 2019 (Incorporated by referenceto Exhibit 2.1 to the Company's Current Report on Form 8-K dated November 3, 2019)
3.1 Amended and Restated Certificate of Incorporation of Pattern Energy Group Inc. (Incorporated by reference to Exhibit 3.1 to the Company's Registration Statement onForm S-1/A dated September 20, 2013 (Registration No. 333-190538)).
3.2 Amended and Restated Bylaws of Pattern Energy Group Inc. (Incorporated by reference to Exhibit 3.2 to the Company's Registration Statement on Form S-1/A datedSeptember 3, 2013 (Registration No. 333-190538)).
3.3
Certificate of Designations of Rights and Preferences, Series A Perpetual Preferred Stock, dated as of October 25, 2019 (Incorporated by reference to Exhibit 3.1 to theCompany's Current Report on Form 8-K dated October 25, 2019)
4.1 Form of Class A Stock Certificate (Incorporated by reference to Exhibit 3.2 to the Company's Registration Statement on Form S-1/A dated September 3, 2013(Registration No. 333-190538)).
4.2 Form of Senior Indenture (Incorporated by reference to Exhibit 4.3 to the Company's Registration Statement on Form S-3 dated August 14, 2017 (Registration No. 333-219970)).
4.3 Form of Subordinated Indenture (Incorporated by reference to Exhibit 4.5 to the Company's Registration Statement on Form S-3 dated August 14, 2017 (RegistrationNo. 333-219970)).
4.4
Indenture, dated July 28, 2015, among Pattern Energy Group Inc., as issuer, Pattern US Finance Company LLC, as subsidiary guarantor, and Deutsche Bank TrustCompany Americas, as trustee, related to 4.00% Convertible Senior Notes due 2020 (Incorporated by reference to Exhibit 4.1 to the Company’s Current Report on Form8-K dated July 28, 2015).
4.5
Indenture, dated as of January 25, 2017, among Pattern Energy Group Inc., Pattern US Finance Company LLC, as guarantor, and Deutsche Bank Trust CompanyAmericas, as trustee, related to 5.875% Senior Notes due 2024 (Incorporated by reference to Exhibit 4.1 to the Company's Current Report on Form 8-K dated January20, 2017).
4.6 Description of the Company's securities registered pursuant to Section 12 of the Securities Exchange Act of 1934, as amended.
10.1 Second Amended and Restated Credit and Guaranty Agreement, among Pattern US Finance Company LLC, Pattern Canada Finance Company ULC, as borrowers,certain subsidiaries of the borrowers, the lenders party thereto from time to time, Royal Bank of Canada, as Swingline Lender, Administrative Agent and CollateralAgent, Bank of Montreal, as Syndication Agent, Royal Bank of Canada, Bank of Montreal, Morgan Stanley Bank, N.A., Citibank N.A. and Bank of America, N.A. eachas LC Issuing Bank, and Citibank, N.A. as Documentation Agent, dated as of November 21, 2017 (the “Amended and Restated Credit and Guaranty Agreement")(Incorporated by reference to Exhibit 10.1 to the Company's Current Report on Form 8-K dated November 22, 2017).
10.2 Pattern Energy Group Inc. Amended and Restated 2013 Equity Incentive Award Plan (Incorporated by reference to Exhibit B to the Company's Definitive ProxyStatement on Schedule 14A dated April 14, 2017).
10.3 Form of Pattern Energy Group Inc. 2013 Incentive Bonus Plan. (Incorporated by reference to Exhibit 10.3 to the Company's Registration Statement on Form S-1/Adated September 3, 2013 (Registration No. 333-190538)).
10.4 Form of Stock Option Agreement under 2013 Equity Incentive Award Plan (Incorporated by reference to Exhibit 10.4 to the Company's Registration Statement on FormS-1/A dated September 3, 2013 (Registration No. 333-190538)).
10.5 Form of Restricted Stock Agreement under 2013 Equity Incentive Award Plan. (Incorporated by reference to Exhibit 10.6 to the Company's Quarterly Report on Form10-Q for the period ended March 31, 2018).
10.6 Form of Restricted Stock Unit Agreement under 2013 Equity Incentive Award Plan. (Incorporated by reference to Exhibit 10.6 to the Company's Registration Statementon Form S-1/A dated September 3, 2013 (Registration No. 333-190538)).
10.7 Form of Deferred Restricted Stock Unit Agreement under 2013 Equity Incentive Award Plan. (Incorporated by reference to Exhibit 10.2 to the Company's CurrentReport on Form 8-K dated November 22, 2017).
10.8
Form of TSR Performance Restricted Stock Agreement under 2013 Equity Incentive Award Plan (Incorporated by reference to Exhibit 10.7 to the Company's QuarterlyReport on Form 10-Q for the period ended March 31, 2018).
10.9 Form of Indemnification Agreement between the Registrant and each of its Executive Officers and Directors. (Incorporated by reference to Exhibit 10.7 to theCompany's Registration Statement on Form S-1/A dated September 3, 2013 (Registration No. 333-190538)).
10.10
Management, Operation and Maintenance Agreement, dated as of December 20, 2013, by and between Pattern Panhandle Wind 2 LLC and Pattern Operators LP (PH2MOMA) (Incorporated by reference to Exhibit 14 to the Company's Current Report on Form 8-K dated December 20, 2013).
84
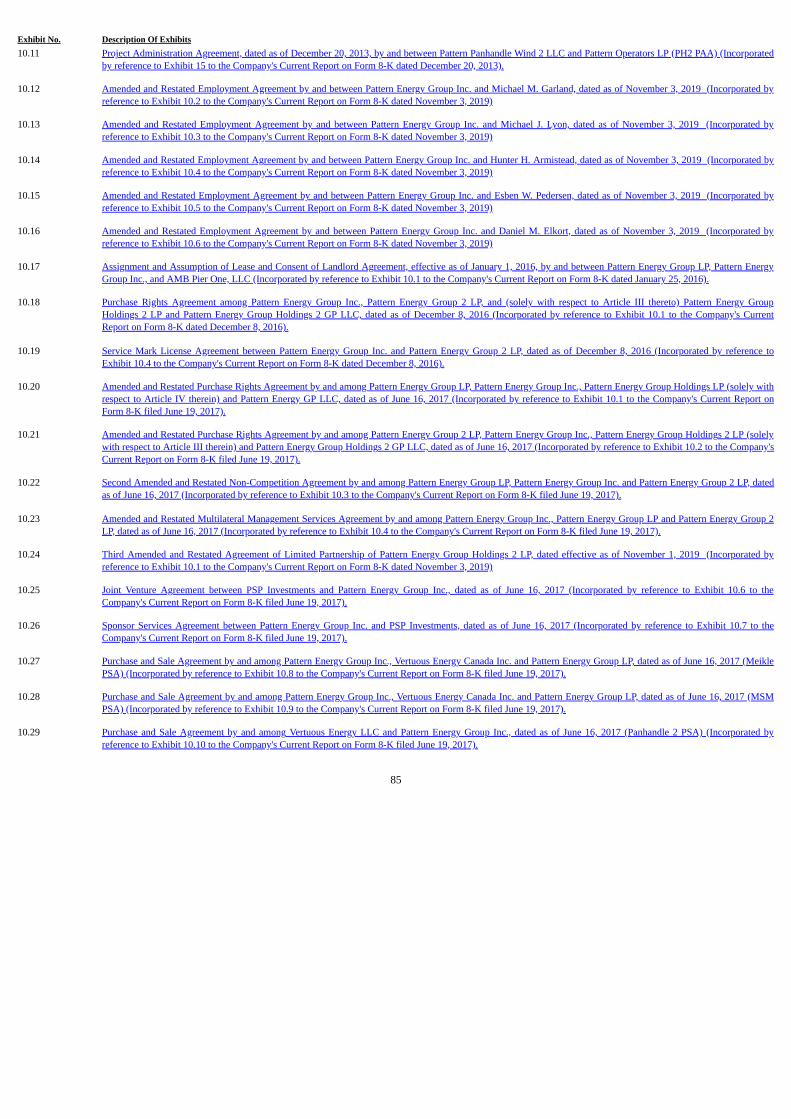
Exhibit No. Description Of Exhibits10.11 Project Administration Agreement, dated as of December 20, 2013, by and between Pattern Panhandle Wind 2 LLC and Pattern Operators LP (PH2 PAA) (Incorporated
by reference to Exhibit 15 to the Company's Current Report on Form 8-K dated December 20, 2013).
10.12
Amended and Restated Employment Agreement by and between Pattern Energy Group Inc. and Michael M. Garland, dated as of November 3, 2019 (Incorporated byreference to Exhibit 10.2 to the Company's Current Report on Form 8-K dated November 3, 2019)
10.13
Amended and Restated Employment Agreement by and between Pattern Energy Group Inc. and Michael J. Lyon, dated as of November 3, 2019 (Incorporated byreference to Exhibit 10.3 to the Company's Current Report on Form 8-K dated November 3, 2019)
10.14
Amended and Restated Employment Agreement by and between Pattern Energy Group Inc. and Hunter H. Armistead, dated as of November 3, 2019 (Incorporated byreference to Exhibit 10.4 to the Company's Current Report on Form 8-K dated November 3, 2019)
10.15
Amended and Restated Employment Agreement by and between Pattern Energy Group Inc. and Esben W. Pedersen, dated as of November 3, 2019 (Incorporated byreference to Exhibit 10.5 to the Company's Current Report on Form 8-K dated November 3, 2019)
10.16
Amended and Restated Employment Agreement by and between Pattern Energy Group Inc. and Daniel M. Elkort, dated as of November 3, 2019 (Incorporated byreference to Exhibit 10.6 to the Company's Current Report on Form 8-K dated November 3, 2019)
10.17
Assignment and Assumption of Lease and Consent of Landlord Agreement, effective as of January 1, 2016, by and between Pattern Energy Group LP, Pattern EnergyGroup Inc., and AMB Pier One, LLC (Incorporated by reference to Exhibit 10.1 to the Company's Current Report on Form 8-K dated January 25, 2016).
10.18
Purchase Rights Agreement among Pattern Energy Group Inc., Pattern Energy Group 2 LP, and (solely with respect to Article III thereto) Pattern Energy GroupHoldings 2 LP and Pattern Energy Group Holdings 2 GP LLC, dated as of December 8, 2016 (Incorporated by reference to Exhibit 10.1 to the Company's CurrentReport on Form 8-K dated December 8, 2016).
10.19
Service Mark License Agreement between Pattern Energy Group Inc. and Pattern Energy Group 2 LP, dated as of December 8, 2016 (Incorporated by reference toExhibit 10.4 to the Company's Current Report on Form 8-K dated December 8, 2016).
10.20
Amended and Restated Purchase Rights Agreement by and among Pattern Energy Group LP, Pattern Energy Group Inc., Pattern Energy Group Holdings LP (solely withrespect to Article IV therein) and Pattern Energy GP LLC, dated as of June 16, 2017 (Incorporated by reference to Exhibit 10.1 to the Company's Current Report onForm 8-K filed June 19, 2017).
10.21
Amended and Restated Purchase Rights Agreement by and among Pattern Energy Group 2 LP, Pattern Energy Group Inc., Pattern Energy Group Holdings 2 LP (solelywith respect to Article III therein) and Pattern Energy Group Holdings 2 GP LLC, dated as of June 16, 2017 (Incorporated by reference to Exhibit 10.2 to the Company'sCurrent Report on Form 8-K filed June 19, 2017).
10.22
Second Amended and Restated Non-Competition Agreement by and among Pattern Energy Group LP, Pattern Energy Group Inc. and Pattern Energy Group 2 LP, datedas of June 16, 2017 (Incorporated by reference to Exhibit 10.3 to the Company's Current Report on Form 8-K filed June 19, 2017).
10.23
Amended and Restated Multilateral Management Services Agreement by and among Pattern Energy Group Inc., Pattern Energy Group LP and Pattern Energy Group 2LP, dated as of June 16, 2017 (Incorporated by reference to Exhibit 10.4 to the Company's Current Report on Form 8-K filed June 19, 2017).
10.24
Third Amended and Restated Agreement of Limited Partnership of Pattern Energy Group Holdings 2 LP, dated effective as of November 1, 2019 (Incorporated byreference to Exhibit 10.1 to the Company's Current Report on Form 8-K dated November 3, 2019)
10.25
Joint Venture Agreement between PSP Investments and Pattern Energy Group Inc., dated as of June 16, 2017 (Incorporated by reference to Exhibit 10.6 to theCompany's Current Report on Form 8-K filed June 19, 2017).
10.26
Sponsor Services Agreement between Pattern Energy Group Inc. and PSP Investments, dated as of June 16, 2017 (Incorporated by reference to Exhibit 10.7 to theCompany's Current Report on Form 8-K filed June 19, 2017).
10.27
Purchase and Sale Agreement by and among Pattern Energy Group Inc., Vertuous Energy Canada Inc. and Pattern Energy Group LP, dated as of June 16, 2017 (MeiklePSA) (Incorporated by reference to Exhibit 10.8 to the Company's Current Report on Form 8-K filed June 19, 2017).
10.28
Purchase and Sale Agreement by and among Pattern Energy Group Inc., Vertuous Energy Canada Inc. and Pattern Energy Group LP, dated as of June 16, 2017 (MSMPSA) (Incorporated by reference to Exhibit 10.9 to the Company's Current Report on Form 8-K filed June 19, 2017).
10.29
Purchase and Sale Agreement by and among Vertuous Energy LLC and Pattern Energy Group Inc., dated as of June 16, 2017 (Panhandle 2 PSA) (Incorporated byreference to Exhibit 10.10 to the Company's Current Report on Form 8-K filed June 19, 2017).
85
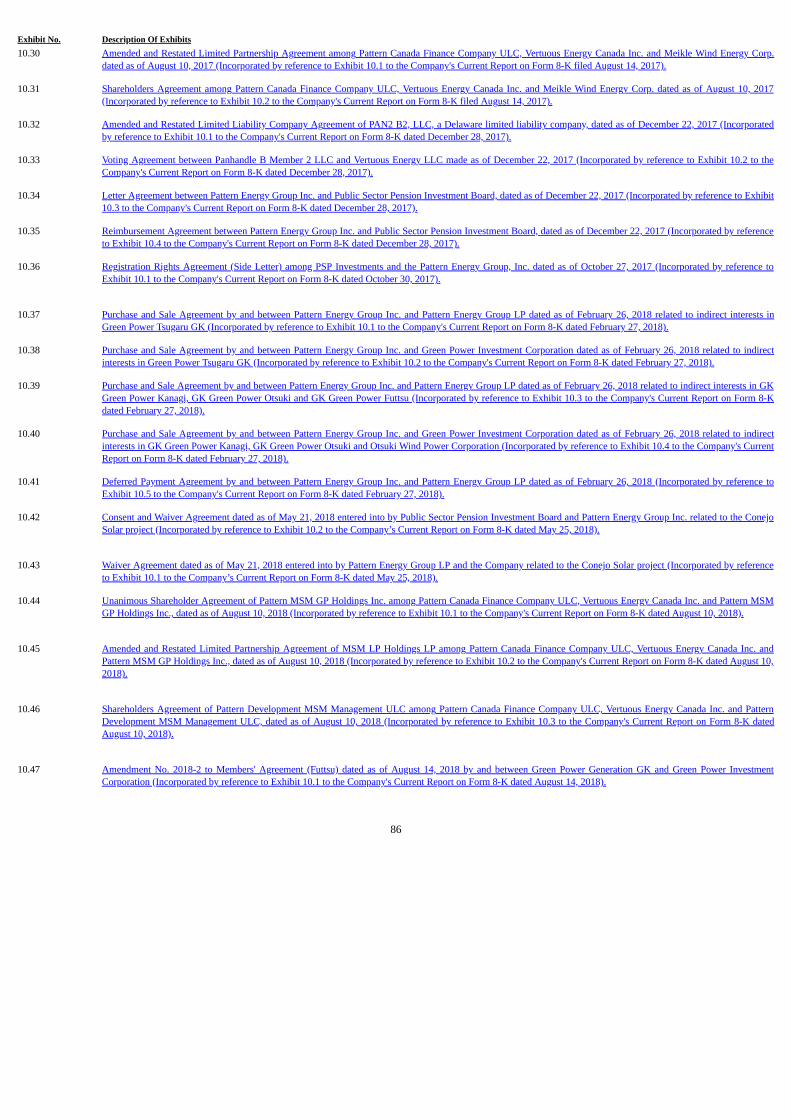
Exhibit No. Description Of Exhibits10.30 Amended and Restated Limited Partnership Agreement among Pattern Canada Finance Company ULC, Vertuous Energy Canada Inc. and Meikle Wind Energy Corp.
dated as of August 10, 2017 (Incorporated by reference to Exhibit 10.1 to the Company's Current Report on Form 8-K filed August 14, 2017).
10.31 Shareholders Agreement among Pattern Canada Finance Company ULC, Vertuous Energy Canada Inc. and Meikle Wind Energy Corp. dated as of August 10, 2017(Incorporated by reference to Exhibit 10.2 to the Company's Current Report on Form 8-K filed August 14, 2017).
10.32
Amended and Restated Limited Liability Company Agreement of PAN2 B2, LLC, a Delaware limited liability company, dated as of December 22, 2017 (Incorporatedby reference to Exhibit 10.1 to the Company's Current Report on Form 8-K dated December 28, 2017).
10.33
Voting Agreement between Panhandle B Member 2 LLC and Vertuous Energy LLC made as of December 22, 2017 (Incorporated by reference to Exhibit 10.2 to theCompany's Current Report on Form 8-K dated December 28, 2017).
10.34
Letter Agreement between Pattern Energy Group Inc. and Public Sector Pension Investment Board, dated as of December 22, 2017 (Incorporated by reference to Exhibit10.3 to the Company's Current Report on Form 8-K dated December 28, 2017).
10.35
Reimbursement Agreement between Pattern Energy Group Inc. and Public Sector Pension Investment Board, dated as of December 22, 2017 (Incorporated by referenceto Exhibit 10.4 to the Company's Current Report on Form 8-K dated December 28, 2017).
10.36
Registration Rights Agreement (Side Letter) among PSP Investments and the Pattern Energy Group, Inc. dated as of October 27, 2017 (Incorporated by reference toExhibit 10.1 to the Company's Current Report on Form 8-K dated October 30, 2017).
10.37
Purchase and Sale Agreement by and between Pattern Energy Group Inc. and Pattern Energy Group LP dated as of February 26, 2018 related to indirect interests inGreen Power Tsugaru GK (Incorporated by reference to Exhibit 10.1 to the Company's Current Report on Form 8-K dated February 27, 2018).
10.38
Purchase and Sale Agreement by and between Pattern Energy Group Inc. and Green Power Investment Corporation dated as of February 26, 2018 related to indirectinterests in Green Power Tsugaru GK (Incorporated by reference to Exhibit 10.2 to the Company's Current Report on Form 8-K dated February 27, 2018).
10.39
Purchase and Sale Agreement by and between Pattern Energy Group Inc. and Pattern Energy Group LP dated as of February 26, 2018 related to indirect interests in GKGreen Power Kanagi, GK Green Power Otsuki and GK Green Power Futtsu (Incorporated by reference to Exhibit 10.3 to the Company's Current Report on Form 8-Kdated February 27, 2018).
10.40
Purchase and Sale Agreement by and between Pattern Energy Group Inc. and Green Power Investment Corporation dated as of February 26, 2018 related to indirectinterests in GK Green Power Kanagi, GK Green Power Otsuki and Otsuki Wind Power Corporation (Incorporated by reference to Exhibit 10.4 to the Company's CurrentReport on Form 8-K dated February 27, 2018).
10.41
Deferred Payment Agreement by and between Pattern Energy Group Inc. and Pattern Energy Group LP dated as of February 26, 2018 (Incorporated by reference toExhibit 10.5 to the Company's Current Report on Form 8-K dated February 27, 2018).
10.42
Consent and Waiver Agreement dated as of May 21, 2018 entered into by Public Sector Pension Investment Board and Pattern Energy Group Inc. related to the ConejoSolar project (Incorporated by reference to Exhibit 10.2 to the Company’s Current Report on Form 8-K dated May 25, 2018).
10.43
Waiver Agreement dated as of May 21, 2018 entered into by Pattern Energy Group LP and the Company related to the Conejo Solar project (Incorporated by referenceto Exhibit 10.1 to the Company’s Current Report on Form 8-K dated May 25, 2018).
10.44
Unanimous Shareholder Agreement of Pattern MSM GP Holdings Inc. among Pattern Canada Finance Company ULC, Vertuous Energy Canada Inc. and Pattern MSMGP Holdings Inc., dated as of August 10, 2018 (Incorporated by reference to Exhibit 10.1 to the Company's Current Report on Form 8-K dated August 10, 2018).
10.45
Amended and Restated Limited Partnership Agreement of MSM LP Holdings LP among Pattern Canada Finance Company ULC, Vertuous Energy Canada Inc. andPattern MSM GP Holdings Inc., dated as of August 10, 2018 (Incorporated by reference to Exhibit 10.2 to the Company's Current Report on Form 8-K dated August 10,2018).
10.46
Shareholders Agreement of Pattern Development MSM Management ULC among Pattern Canada Finance Company ULC, Vertuous Energy Canada Inc. and PatternDevelopment MSM Management ULC, dated as of August 10, 2018 (Incorporated by reference to Exhibit 10.3 to the Company's Current Report on Form 8-K datedAugust 10, 2018).
10.47
Amendment No. 2018-2 to Members' Agreement (Futtsu) dated as of August 14, 2018 by and between Green Power Generation GK and Green Power InvestmentCorporation (Incorporated by reference to Exhibit 10.1 to the Company's Current Report on Form 8-K dated August 14, 2018).
86

Exhibit No. Description Of Exhibits10.48
Memorandum of Understanding dated as of August 16, 2018 entered into by Pattern Gulf Wind Holdings LLC and Pattern Western Development LLC (Incorporated byreference to Exhibit 10.1 to the Company's Current Report on Form 8-K dated August 28, 2018).
10.49
Purchase and Sale Agreement by and among Pattern Energy Group Inc., Vertuous Energy LLC, and Pattern Energy Group 2 LP, dated as of November 20, 2018(Stillwater) (Incorporated by reference to Exhibit 10.1 to the Company's Current Report on Form 8-K dated November 20, 2018.
10.50
Amended and Restated Limited Liability Company Agreement of Stillwater New B Member LLC, between Pattern US Finance Company LLC and Vertuous EnergyLLC (Incorporated by reference to Exhibit 10.2 to the Company's Current Report on Form 8-K dated November 20, 2018).
10.51
Reimbursement Agreement between Pattern Energy Group Inc. and Public Sector Pension Investment Board, dated as of November 20, 2018 (Incorporated by referenceto Exhibit 10.3 to the Company's Current Report on Form 8-K dated November 20, 2018).
10.52
Letter Agreement dated as of March 4, 2019 between Pattern Western Development LLC and Pattern Gulf Wind Holdings LLC (Incorporated by reference to Exhibit10.1 to the Company's Current Report on Form 8-K dated March 7, 2019).
10.53
Intellectual Property Rights Purchase and Transfer Agreement effective March 26, 2019 between the Company and Pattern Energy Group LP (Incorporated by referenceto Exhibit 10.1 to the Company's Current Report on Form 8-K dated March 29, 2019).
10.54
Amendment No. 1 to Second Amended and Restated Credit and Guaranty Agreement dated March 5, 2018 (Incorporated by reference to Exhibit 10.1 to the Company’sCurrent Report on Form 8-K dated March 5, 2018)
10.55
Amendment No. 2 to Second Amended and Restated Credit and Guaranty Agreement dated July 31, 2019 (Incorporated by reference to Exhibit 10.2 to the Company’sCurrent Report on Form 8-K dated August 6, 2019)
10.56
Purchase and Sale Agreement by and among Pattern Energy Group Inc., Vertuous Energy Trust and Pattern Energy Group LP, dated as of August 2, 2019 (Belle River)(Incorporated by reference to Exhibit 10.3 to the Company’s Current Report on Form 8-K dated August 6, 2019)
10.57
Purchase and Sale Agreement by and among Pattern Energy Group Inc. and Pattern Energy Group LP, dated as of August 2, 2019 (North Kent) (Incorporated byreference to Exhibit 10.4 to the Company’s Current Report on Form 8-K dated August 6, 2019)
10.58
Amended and Restated Limited Partnership Agreement among Pattern Canada Finance Company ULC, Vertuous Energy Trust and Pattern Belle River GP Holdings Inc.dated as of August 2, 2019 (Incorporated by reference to Exhibit 10.5 to the Company’s Current Report on Form 8-K dated August 6, 2019)
10.59
Unanimous Shareholders Agreement among Pattern Canada Finance Company ULC, Vertuous Energy Trust and Pattern Belle River GP Holdings Inc. dated as ofAugust 2, 2019 (Incorporated by reference to Exhibit 10.6 to the Company’s Current Report on Form 8-K dated August 6, 2019)
10.60
Purchase and Sale Agreement by and among Pattern Energy Group Inc., Vertuous Energy LLC, Pattern Grady Holdings LLC and Pattern Energy Group 2 LP, dated as ofOctober 10, 2019 (Grady PSA)(Incorporated by reference to Exhibit 10.1 to the Company's Current Report on Form 8-K dated October 10, 2019)
10.61
Second Amended and Restated Limited Liability Company Agreement of Grady B Member LLC, between Pattern US Finance Company LLC and Vertuous EnergyLLC, dated as of October 10, 2019 (Incorporated by reference to Exhibit 10.2 to the Company's Current Report on Form 8-K dated October 10, 2019)
10.62
Reimbursement Agreement between Pattern Energy Group Inc. and Public Sector Pension Investment Board, dated as of October 10, 2019 (Incorporated by reference toExhibit 10.3 to the Company's Current Report on Form 8-K dated October 10, 2019)
10.63
Purchase and Sale Agreement by and among Pattern Canada Finance Company ULC and Pattern Energy Group LP, dated as of October 10, 2019 (Henvey Inlet PSA)(Incorporated by reference to Exhibit 10.4 to the Company's Current Report on Form 8-K dated October 10, 2019)
10.64
Henvey Inlet Consent and ROFO Agreement between Public Sector Pension Investment Board and Pattern Energy Group Inc., dated as of October 1, 2019 (HenveyInlet ROFO Agreement)(Incorporated by reference to Exhibit 10.5 to the Company's Current Report on Form 8-K dated October 10, 2019)
10.65
Purchase and Sale Agreement by and among Pattern Renewables LP and Pattern US Finance Company LLC, dated as of October 10, 2019 (Earnout AcquisitionAgreement)(Incorporated by reference to Exhibit 10.6 to the Company's Current Report on Form 8-K dated October 10, 2019)
10.66
Securities Purchase and Rights Agreement among Pattern Energy Group Inc. and each of the purchasers of Series A Preferred Stock listed therein, dated as of October10, 2019 (Incorporated by reference to Exhibit 10.7 to the Company's Current Report on Form 8-K dated October 10, 2019)
21.1** Subsidiaries of the Company
23.1** Consent of Independent Registered Public Accounting Firm
87

Exhibit No. Description Of Exhibits
23.2** Consent of Independent Registered Public Accounting Firm
23.3** Consent of PricewaterhouseCoopers LLP
23.4** Consent of PricewaterhouseCoopers LLP
24.1 Powers of Attorney (included in the signature pages to this filing).
31.1**
Certifications of the Chief Executive Officer pursuant to Exchange Act Rules 13a-14(a) and15d-14(a), as adopted pursuant to Section 302 of the Sarbanes-Oxley Act of2002
31.2**
Certifications of the Chief Financial Officer pursuant to Exchange Act Rules 13a-14(a) and15d-14(a), as adopted pursuant to Section 302 of the Sarbanes-Oxley Act of2002
32*
Certifications of the Company’s Chief Executive Officer and Chief Financial Officer pursuant to 18 U.S.C. Section 1350, as adopted pursuant to Section 906 of theSarbanes-Oxley Act of 2002.
101.INS** XBRL Instance Document
101.SCH** XBRL Taxonomy Extension Schema Document
101.CAL** XBRL Taxonomy Extension Calculation Linkbase Document
101.DEF** XBRL Taxonomy Extension Definition Linkbase Document
101.LAB** XBRL Taxonomy Extension Label Linkbase Document
101.PRE** XBRL Taxonomy Extension Presentation Linkbase Document
104 Cover Page Interactive Data File (formatted as Inline XBRL and Contained in Exhibit 101)
* These certifications accompany this Report pursuant to Section 906 of the Sarbanes-Oxley Act of 2002 and shall not be deemed “filed” by the Company for purposesof Section 18 of the Exchange Act.
** Filed herewith.
88

SIGNATURES
Pursuant to the requirements of Section 13 or 15(d) of the Securities Exchange Act of 1934, the registrant has duly caused this report to be signed on its behalf by theundersigned, thereunto duly authorized.
Date: March 2, 2020 Pattern Energy Group Inc. By /s/ Michael M. Garland Michael M. Garland Chief Executive Officer
POWER OF ATTORNEY
KNOW ALL PERSONS BY THESE PRESENTS, that each person whose signature appears below constitutes and appoints each of Kim H. Liou, Michael J. Lyon, andEsben W. Pedersen and each of them, as his or her true and lawful attorneys-in-fact and agents, with full power of substitution and re-substitution, for him or her and in hisor her name, place and stead, in any and all capacities, to sign any and all amendments to this Annual Report on Form 10-K, and to file the same, with all exhibits thereto,and other documents in connection therewith, with the Securities and Exchange Commission, granting unto said attorneys-in-fact and agents, and each of them, full powerand authority to do and perform each and every act and thing requisite and necessary to be done in connection therewith, as fully to all intents and purposes as he or shemight or could do in person, hereby ratifying and confirming that all said attorneys-in-fact and agents, or any of them or their or his or her substitute or substitutes, maylawfully do or cause to be done by virtue hereof.
Pursuant to the requirements of the Securities Exchange Act of 1934, this Annual Report on Form 10-K has been signed by the following persons on behalf of the registrantand in the capacities and on the dates indicated:
89

Signature Title Date
/s/ MICHAEL M. GARLAND Chief Executive Officer
and Director ofPattern Energy Group Inc.
(Principal Executive Officer)
March 2, 2020
Michael M. Garland
/s/ ALAN R. BATKIN Director and Chairman of
Pattern Energy Group Inc. March 2, 2020
Alan R. Batkin
/s/ THE LORD BROWNE OF MADINGLEY Director of Pattern Energy Group Inc. March 2, 2020
The Lord Browne of Madingley
/s/ RICHARD A. GOODMAN Director of Pattern Energy Group Inc. March 2, 2020
Richard A. Goodman
/s/ DOUGLAS G. HALL Director of Pattern Energy Group Inc. March 2, 2020
Douglas G. Hall
/s/ PATRICIA M. NEWSON Director of Pattern Energy Group Inc. March 2, 2020
Patricia M. Newson
/s/ MONA K. SUTPHEN Director of Pattern Energy Group Inc. March 2, 2020
Mona K. Sutphen
/s/ ESBEN W. PEDERSEN Chief Financial Officer ofPattern Energy Group Inc.
(Principal Financial Officer)
March 2, 2020
Esben W. Pedersen
/s/ RICHARD A. OSTBERG Senior Vice President, Chief Accounting OfficerPattern Energy Group Inc.
(Principal Accounting Officer)
March 2, 2020
Richard A. Ostberg
90

INDEX TO CONSOLIDATED FINANCIAL STATEMENTS
Report of Independent Registered Public Accounting Firm F-2
Consolidated Balance Sheets as of December 31, 2019 and December 31, 2018 F-4
Consolidated Statements of Operations for the years ended December 31, 2019, 2018 and 2017 F-5
Consolidated Statements of Comprehensive Income (Loss) for the years ended December 31, 2019, 2018 and 2017 F-6Consolidated Statement of Stockholders’ Equity for the years ended December 31, 2019, 2018 and 2017 F-7
Consolidated Statements of Cash Flows for the years ended December 31, 2019, 2018 and 2017 F-8
Notes to Consolidated Financial Statements F-10
F-1

Report of Independent Registered Public Accounting Firm
To the Board of Directors and Stockholders of Pattern Energy Group Inc.
Opinions on the Financial Statements and Internal Control over Financial Reporting
We have audited the accompanying consolidated balance sheets of Pattern Energy Group Inc. and its subsidiaries (the “Company”) as of December 31, 2019 and 2018, andthe related consolidated statements of operations, of comprehensive income (loss), of stockholders' equity and of cash flows for the years then ended, including the relatednotes and financial statement schedule listed in the index appearing under Item 15(a)(2) as of December 31, 2019 and 2018 and for the years then ended (collectivelyreferred to as the “consolidated financial statements”). We also have audited the Company's internal control over financial reporting as of December 31, 2019, based oncriteria established in Internal Control - Integrated Framework (2013) issued by the Committee of Sponsoring Organizations of the Treadway Commission (COSO).
In our opinion, the consolidated financial statements referred to above present fairly, in all material respects, the financial position of the Company as of December 31,2019 and 2018, and the results of its operations and its cash flows for the years then ended in conformity with accounting principles generally accepted in the United Statesof America. Also in our opinion, the Company maintained, in all material respects, effective internal control over financial reporting as of December 31, 2019, based oncriteria established in Internal Control - Integrated Framework (2013) issued by the COSO.
Change in Accounting Principle
As discussed in Note 2 to the consolidated financial statements, the Company changed the manner in which it accounts for leases in 2019.
Basis for Opinions
The Company's management is responsible for these consolidated financial statements, for maintaining effective internal control over financial reporting, and for itsassessment of the effectiveness of internal control over financial reporting, included in Management’s Annual Report on Internal Control over Financial Reportingappearing under Item 9A. Our responsibility is to express opinions on the Company’s consolidated financial statements and on the Company's internal control overfinancial reporting based on our audits. We are a public accounting firm registered with the Public Company Accounting Oversight Board (United States) (PCAOB) and arerequired to be independent with respect to the Company in accordance with the U.S. federal securities laws and the applicable rules and regulations of the Securities andExchange Commission and the PCAOB.
We conducted our audits in accordance with the standards of the PCAOB. Those standards require that we plan and perform the audits to obtain reasonable assurance aboutwhether the consolidated financial statements are free of material misstatement, whether due to error or fraud, and whether effective internal control over financial reportingwas maintained in all material respects.
Our audits of the consolidated financial statements included performing procedures to assess the risks of material misstatement of the consolidated financial statements,whether due to error or fraud, and performing procedures that respond to those risks. Such procedures included examining, on a test basis, evidence regarding the amountsand disclosures in the consolidated financial statements. Our audits also included evaluating the accounting principles used and significant estimates made by management,as well as evaluating the overall presentation of the consolidated financial statements. Our audit of internal control over financial reporting included obtaining anunderstanding of internal control over financial reporting, assessing the risk that a material weakness exists, and testing and evaluating the design and operatingeffectiveness of internal control based on the assessed risk. Our audits also included performing such other procedures as we considered necessary in the circumstances. Webelieve that our audits provide a reasonable basis for our opinions.
Definition and Limitations of Internal Control over Financial Reporting
A company’s internal control over financial reporting is a process designed to provide reasonable assurance regarding the reliability of financial reporting and thepreparation of financial statements for external purposes in accordance with generally accepted accounting principles. A company’s internal control over financial reportingincludes those policies and procedures that (i) pertain to the maintenance of records that, in reasonable detail, accurately and fairly reflect the transactions and dispositionsof the assets of the company; (ii) provide reasonable assurance that transactions are recorded as necessary to permit preparation of financial statements in accordance withgenerally accepted accounting principles, and that receipts and expenditures of the company are being made only in accordance with authorizations of management anddirectors of the company; and (iii) provide reasonable assurance regarding prevention or timely detection of unauthorized acquisition, use, or disposition of the company’sassets that could have a material effect on the financial statements.
Because of its inherent limitations, internal control over financial reporting may not prevent or detect misstatements. Also, projections of any evaluation of effectiveness tofuture periods are subject to the risk that controls may become inadequate because of changes in conditions, or that the degree of compliance with the policies or proceduresmay deteriorate.
Critical Audit Matters
The critical audit matters communicated below are matters arising from the current period audit of the consolidated financial statements that were communicated orrequired to be communicated to the audit committee and that (i) relate to accounts or disclosures that are material to the consolidated financial statements and (ii) involvedour especially challenging, subjective, or complex judgments. The communication of critical audit matters does not alter in any way our opinion on the consolidatedfinancial statements, taken as a whole, and we are not, by communicating the critical audit matters below, providing separate opinions on the critical audit matters or on theaccounts or disclosures to which they relate.
Hypothetical Liquidation at Book Value (HLBV) Calculation for the Grady Project As described in Notes 2 and 5 to the consolidated financial statements, on October 10, 2019, the Company acquired a 51% ownership interest in Grady B Member LLC,which owns 100% of the Class B Units in Grady Energy Holdings LLC, which owns 100% of the membership interests in Grady Wind Energy Center, LLC (“Grady”) foraggregate consideration of $84 million, net of cash acquired. The Company consolidates Grady and reports its 51% of the Class B membership interest as controllingequity; and 49% of the Class B membership interest as noncontrolling interest combined with another acquired noncontrolling interest totals $295 million. As disclosed bymanagement, for those projects where economic benefits are not allocated based on pro rata ownership percentage, management has determined that the appropriatemethodology for calculating the noncontrolling interest balances that reflects the substantive economic arrangements in the operating agreements is a balance sheetapproach using the hypothetical liquidation at book value (HLBV) method.
The principal considerations for our determination that performing procedures relating to the HLBV calculation for the Grady project is a critical audit matter are there wassignificant complexity and judgment by management in applying the HLBV method to determine the amount the noncontrolling membership interests would hypotheticallyreceive at each balance sheet reporting date under the liquidation provisions of the operating agreement. This in turn led to a high degree of auditor judgment, subjectivityand effort in performing procedures and in evaluating the accuracy of the HLBV independent estimate against applicable operating agreements in the initial year. Inaddition, the audit effort involved the use of professionals with specialized skill and knowledge to assist in performing these procedures and evaluating the audit evidenceobtained.
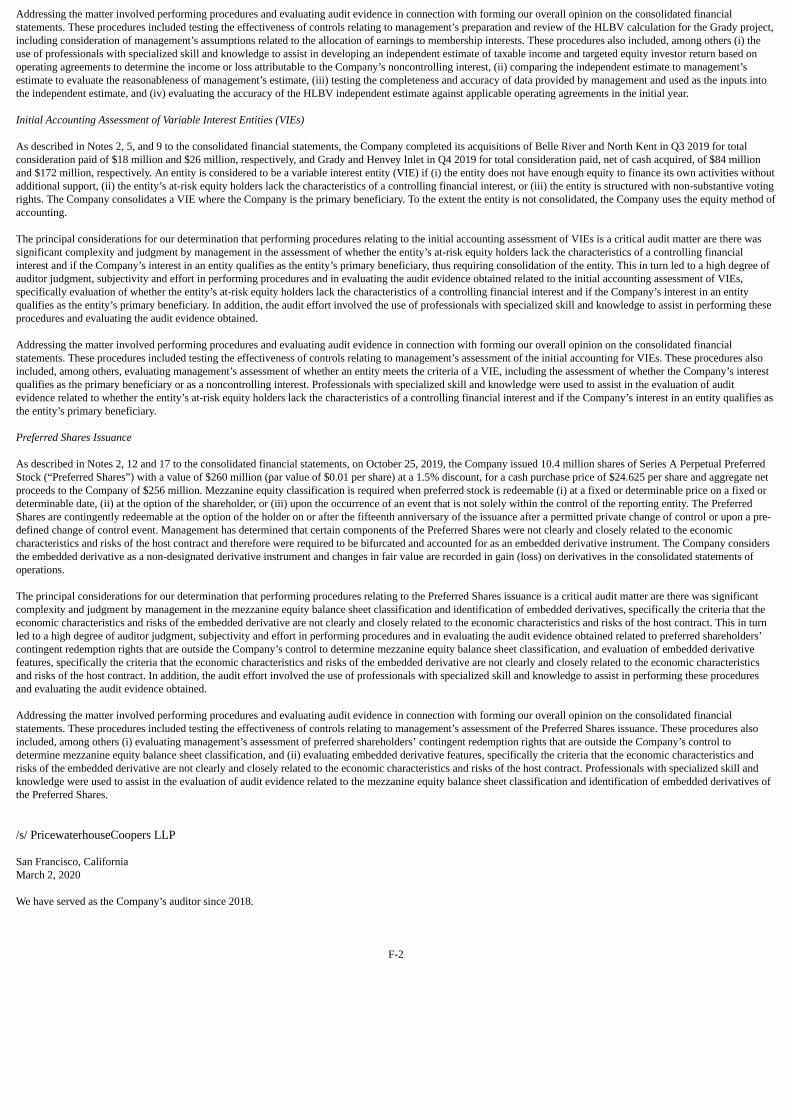
Addressing the matter involved performing procedures and evaluating audit evidence in connection with forming our overall opinion on the consolidated financialstatements. These procedures included testing the effectiveness of controls relating to management’s preparation and review of the HLBV calculation for the Grady project,including consideration of management’s assumptions related to the allocation of earnings to membership interests. These procedures also included, among others (i) theuse of professionals with specialized skill and knowledge to assist in developing an independent estimate of taxable income and targeted equity investor return based onoperating agreements to determine the income or loss attributable to the Company’s noncontrolling interest, (ii) comparing the independent estimate to management’sestimate to evaluate the reasonableness of management’s estimate, (iii) testing the completeness and accuracy of data provided by management and used as the inputs intothe independent estimate, and (iv) evaluating the accuracy of the HLBV independent estimate against applicable operating agreements in the initial year.
Initial Accounting Assessment of Variable Interest Entities (VIEs)
As described in Notes 2, 5, and 9 to the consolidated financial statements, the Company completed its acquisitions of Belle River and North Kent in Q3 2019 for totalconsideration paid of $18 million and $26 million, respectively, and Grady and Henvey Inlet in Q4 2019 for total consideration paid, net of cash acquired, of $84 millionand $172 million, respectively. An entity is considered to be a variable interest entity (VIE) if (i) the entity does not have enough equity to finance its own activities withoutadditional support, (ii) the entity’s at-risk equity holders lack the characteristics of a controlling financial interest, or (iii) the entity is structured with non-substantive votingrights. The Company consolidates a VIE where the Company is the primary beneficiary. To the extent the entity is not consolidated, the Company uses the equity method ofaccounting.
The principal considerations for our determination that performing procedures relating to the initial accounting assessment of VIEs is a critical audit matter are there wassignificant complexity and judgment by management in the assessment of whether the entity’s at-risk equity holders lack the characteristics of a controlling financialinterest and if the Company’s interest in an entity qualifies as the entity’s primary beneficiary, thus requiring consolidation of the entity. This in turn led to a high degree ofauditor judgment, subjectivity and effort in performing procedures and in evaluating the audit evidence obtained related to the initial accounting assessment of VIEs,specifically evaluation of whether the entity’s at-risk equity holders lack the characteristics of a controlling financial interest and if the Company’s interest in an entityqualifies as the entity’s primary beneficiary. In addition, the audit effort involved the use of professionals with specialized skill and knowledge to assist in performing theseprocedures and evaluating the audit evidence obtained.
Addressing the matter involved performing procedures and evaluating audit evidence in connection with forming our overall opinion on the consolidated financialstatements. These procedures included testing the effectiveness of controls relating to management’s assessment of the initial accounting for VIEs. These procedures alsoincluded, among others, evaluating management’s assessment of whether an entity meets the criteria of a VIE, including the assessment of whether the Company’s interestqualifies as the primary beneficiary or as a noncontrolling interest. Professionals with specialized skill and knowledge were used to assist in the evaluation of auditevidence related to whether the entity’s at-risk equity holders lack the characteristics of a controlling financial interest and if the Company’s interest in an entity qualifies asthe entity’s primary beneficiary.
Preferred Shares Issuance
As described in Notes 2, 12 and 17 to the consolidated financial statements, on October 25, 2019, the Company issued 10.4 million shares of Series A Perpetual PreferredStock (“Preferred Shares”) with a value of $260 million (par value of $0.01 per share) at a 1.5% discount, for a cash purchase price of $24.625 per share and aggregate netproceeds to the Company of $256 million. Mezzanine equity classification is required when preferred stock is redeemable (i) at a fixed or determinable price on a fixed ordeterminable date, (ii) at the option of the shareholder, or (iii) upon the occurrence of an event that is not solely within the control of the reporting entity. The PreferredShares are contingently redeemable at the option of the holder on or after the fifteenth anniversary of the issuance after a permitted private change of control or upon a pre-defined change of control event. Management has determined that certain components of the Preferred Shares were not clearly and closely related to the economiccharacteristics and risks of the host contract and therefore were required to be bifurcated and accounted for as an embedded derivative instrument. The Company considersthe embedded derivative as a non-designated derivative instrument and changes in fair value are recorded in gain (loss) on derivatives in the consolidated statements ofoperations.
The principal considerations for our determination that performing procedures relating to the Preferred Shares issuance is a critical audit matter are there was significantcomplexity and judgment by management in the mezzanine equity balance sheet classification and identification of embedded derivatives, specifically the criteria that theeconomic characteristics and risks of the embedded derivative are not clearly and closely related to the economic characteristics and risks of the host contract. This in turnled to a high degree of auditor judgment, subjectivity and effort in performing procedures and in evaluating the audit evidence obtained related to preferred shareholders’contingent redemption rights that are outside the Company’s control to determine mezzanine equity balance sheet classification, and evaluation of embedded derivativefeatures, specifically the criteria that the economic characteristics and risks of the embedded derivative are not clearly and closely related to the economic characteristicsand risks of the host contract. In addition, the audit effort involved the use of professionals with specialized skill and knowledge to assist in performing these proceduresand evaluating the audit evidence obtained.
Addressing the matter involved performing procedures and evaluating audit evidence in connection with forming our overall opinion on the consolidated financialstatements. These procedures included testing the effectiveness of controls relating to management’s assessment of the Preferred Shares issuance. These procedures alsoincluded, among others (i) evaluating management’s assessment of preferred shareholders’ contingent redemption rights that are outside the Company’s control todetermine mezzanine equity balance sheet classification, and (ii) evaluating embedded derivative features, specifically the criteria that the economic characteristics andrisks of the embedded derivative are not clearly and closely related to the economic characteristics and risks of the host contract. Professionals with specialized skill andknowledge were used to assist in the evaluation of audit evidence related to the mezzanine equity balance sheet classification and identification of embedded derivatives ofthe Preferred Shares.
/s/ PricewaterhouseCoopers LLP
San Francisco, CaliforniaMarch 2, 2020
We have served as the Company’s auditor since 2018.
F-2

Report of Independent Registered Public Accounting Firm
To the Stockholders and the Board of Directors of Pattern Energy Group Inc.
Opinion on the Financial Statements
We have audited the accompanying consolidated statements of operations, comprehensive income (loss), stockholders' equity and cash flows for the year ended December31, 2017 of Pattern Energy Group Inc. (the Company), and the related notes and financial statement Schedule I listed in the Index at Item 15(a)(2) (collectively referred toas the “consolidated financial statements”). In our opinion, the consolidated financial statements present fairly, in all material respects, the results of Pattern Energy GroupInc.’s operations and its cash flows for the year ended December 31, 2017, in conformity with U.S. generally accepted accounting principles.
We did not audit the financial statements of SP Armow Wind Ontario LP, South Kent Wind LP and Grand Renewable Wind LP partnerships in which the Company has a50%, 50% and 45% interest, respectively. In the consolidated financial statements, the Company’s equity in the net earnings (losses) of SP Armow Wind Ontario LP, SouthKent Wind LP and Grand Renewable Wind LP is stated at $46,000,000 for the year ended December 31, 2017. The statements for SP Armow Wind Ontario LP, South KentWind LP and Grand Renewable Wind LP were audited by other auditors whose reports have been furnished to us, and our opinion, insofar as it relates to the amountsincluded for SP Armow Wind Ontario LP, South Kent Wind LP and Grand Renewable Wind LP, is based solely on the reports of the other auditors.
Basis for Opinion
These financial statements are the responsibility of the Company’s management. Our responsibility is to express an opinion on the Company’s financial statements based onour audit. We are a public accounting firm registered with the PCAOB and are required to be independent with respect to the Company in accordance with the U.S. federalsecurities laws and the applicable rules and regulations of the Securities and Exchange Commission and the PCAOB. We conducted our audit in accordance with thestandards of the PCAOB. Those standards require that we plan and perform the audit to obtain reasonable assurance about whether the financial statements are free ofmaterial misstatement, whether due to error or fraud. Our audit included performing procedures to assess the risks of material misstatement of the financial statements,whether due to error or fraud, and performing procedures that respond to those risks. Such procedures included examining, on a test basis, evidence regarding the amountsand disclosures in the financial statements. Our audit also included evaluating the accounting principles used and significant estimates made by management, as well asevaluating the overall presentation of the financial statements. We believe that our audit provides a reasonable basis for our opinion.
/s/ Ernst & Young LLP
We served as the Company’s auditor from 2012 to 2018
San Francisco, California
March 1, 2018
F-3
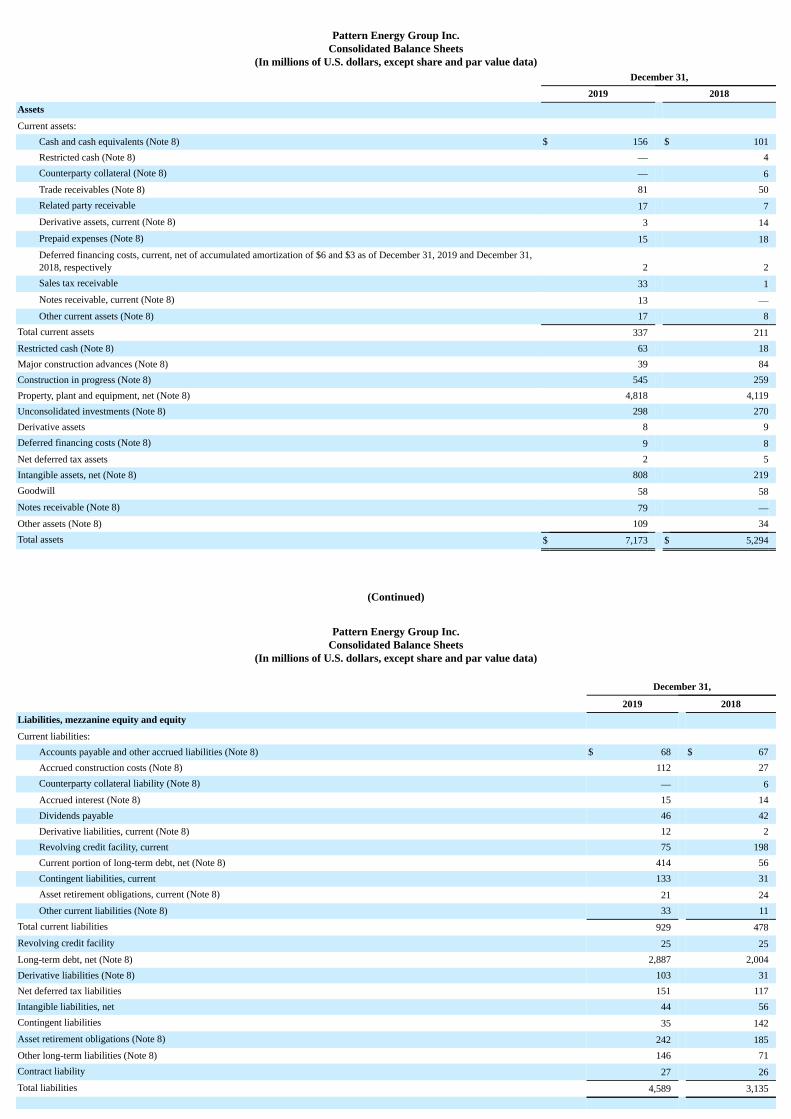
Pattern Energy Group Inc.Consolidated Balance Sheets
(In millions of U.S. dollars, except share and par value data) December 31,
2019 2018Assets
Current assets:Cash and cash equivalents (Note 8) $ 156 $ 101Restricted cash (Note 8) — 4Counterparty collateral (Note 8) — 6Trade receivables (Note 8) 81 50Related party receivable 17 7Derivative assets, current (Note 8) 3 14Prepaid expenses (Note 8) 15 18Deferred financing costs, current, net of accumulated amortization of $6 and $3 as of December 31, 2019 and December 31,2018, respectively 2 2Sales tax receivable 33 1Notes receivable, current (Note 8) 13 —Other current assets (Note 8) 17 8
Total current assets 337 211Restricted cash (Note 8) 63 18Major construction advances (Note 8) 39 84Construction in progress (Note 8) 545 259Property, plant and equipment, net (Note 8) 4,818 4,119Unconsolidated investments (Note 8) 298 270Derivative assets 8 9Deferred financing costs (Note 8) 9 8Net deferred tax assets 2 5Intangible assets, net (Note 8) 808 219Goodwill 58 58Notes receivable (Note 8) 79 —Other assets (Note 8) 109 34Total assets $ 7,173 $ 5,294
(Continued)
Pattern Energy Group Inc.Consolidated Balance Sheets
(In millions of U.S. dollars, except share and par value data)
December 31,
2019 2018Liabilities, mezzanine equity and equity
Current liabilities:Accounts payable and other accrued liabilities (Note 8) $ 68 $ 67Accrued construction costs (Note 8) 112 27Counterparty collateral liability (Note 8) — 6Accrued interest (Note 8) 15 14Dividends payable 46 42Derivative liabilities, current (Note 8) 12 2Revolving credit facility, current 75 198Current portion of long-term debt, net (Note 8) 414 56Contingent liabilities, current 133 31Asset retirement obligations, current (Note 8) 21 24Other current liabilities (Note 8) 33 11
Total current liabilities 929 478Revolving credit facility 25 25Long-term debt, net (Note 8) 2,887 2,004Derivative liabilities (Note 8) 103 31Net deferred tax liabilities 151 117Intangible liabilities, net 44 56Contingent liabilities 35 142Asset retirement obligations (Note 8) 242 185Other long-term liabilities (Note 8) 146 71Contract liability 27 26Total liabilities 4,589 3,135
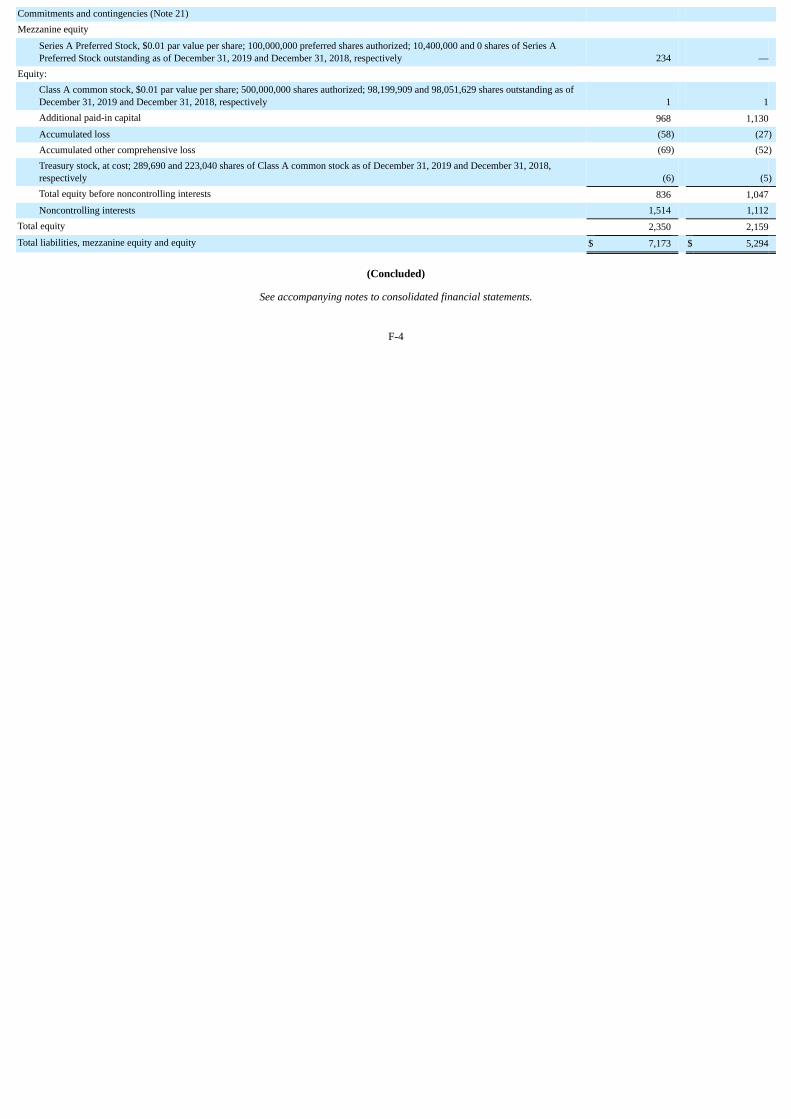
Commitments and contingencies (Note 21)Mezzanine equity
Series A Preferred Stock, $0.01 par value per share; 100,000,000 preferred shares authorized; 10,400,000 and 0 shares of Series APreferred Stock outstanding as of December 31, 2019 and December 31, 2018, respectively 234 —
Equity:Class A common stock, $0.01 par value per share; 500,000,000 shares authorized; 98,199,909 and 98,051,629 shares outstanding as ofDecember 31, 2019 and December 31, 2018, respectively 1 1Additional paid-in capital 968 1,130Accumulated loss (58) (27)Accumulated other comprehensive loss (69) (52)Treasury stock, at cost; 289,690 and 223,040 shares of Class A common stock as of December 31, 2019 and December 31, 2018,respectively (6) (5)Total equity before noncontrolling interests 836 1,047Noncontrolling interests 1,514 1,112
Total equity 2,350 2,159Total liabilities, mezzanine equity and equity $ 7,173 $ 5,294
(Concluded)
See accompanying notes to consolidated financial statements.
F-4

Pattern Energy Group Inc.Consolidated Statements of Operations
(In millions of U.S. dollars, except share data)
Year ended December 31,
2019 2018 2017
Revenue: Electricity sales $ 517 $ 464 $ 402
Other revenue 24 19 9
Total revenue 541 483 411
Cost of revenue: Project expense 166 143 130
Transmission costs 25 26 19
Depreciation, amortization and accretion 318 250 199
Total cost of revenue 509 419 348
Gross profit 32 64 63
Operating expenses: General and administrative 47 40 39
Development expense 14 — —
Related party general and administrative 18 15 14
Impairment expense — 7 —
Total operating expenses 79 62 53
Operating income (loss) (47) 2 10
Other income (expense): Interest expense (111) (109) (102)
Gain (loss) on derivatives 6 17 (10)
Earnings in unconsolidated investments, net 107 1 42
Early extinguishment of debt — (6) (9)
Net earnings (loss) on transactions (14) 69 (1)
Other income (expense), net (5) (11) —
Total other expense (17) (39) (80)
Net loss before income tax (64) (37) (70)Income tax provision 43 32 12
Net loss (107) (69) (82)Net loss attributable to noncontrolling interests (76) (211) (64)
Net income (loss) attributable to Pattern Energy (31) 142 (18)Series A preferred stock dividends (4) — —
Net income (loss) attributable to common shareholders $ (35) $ 142 $ (18)
Weighted average number of common shares outstanding Basic 97,603,555 97,456,407 89,179,343
Diluted 97,603,555 97,651,501 89,179,343
Net income (loss) per share attributable to Pattern Energy Basic $ (0.35) $ 1.45 $ (0.20)
Diluted $ (0.35) $ 1.45 $ (0.20)
See accompanying notes to consolidated financial statements.
F-5

Pattern Energy Group Inc.Consolidated Statements of Comprehensive Income (Loss)
(In millions of U.S. Dollars)
Year ended December 31,
2019 2018 2017Net loss $ (107) $ (69) $ (82)Other comprehensive income (loss):
Change in foreign currency translation, net of tax impact of zero, zero and $(4), respectively 21 (37) 15Cash flow hedge activity:
Change in unrealized losses on cash flow hedges, net of tax impact of $3, $3 and ($1),respectively (28) (4) (3)Reclassifications to net loss, net of tax impact of $(1), $(1) and $(1), respectively 3 5 11
Total change in cash flow hedge activity (25) 1 8Other comprehensive income related to equity method investee net of tax impact of $1, less than $1 and$(5), respectively (1) 2 14Total other comprehensive income (loss), net of tax (5) (34) 37Comprehensive loss (112) (103) (45)Less comprehensive loss attributable to noncontrolling interests, net of tax impact of less than $1 millionfor all years presented (64) (219) (63)Comprehensive income (loss) attributable to Pattern Energy (48) 116 $ 18Series A preferred stock dividends (4) — —Comprehensive income (loss) attributable to common shareholders $ (52) $ 116 $ 18
See accompanying notes to consolidated financial statements.
F-6
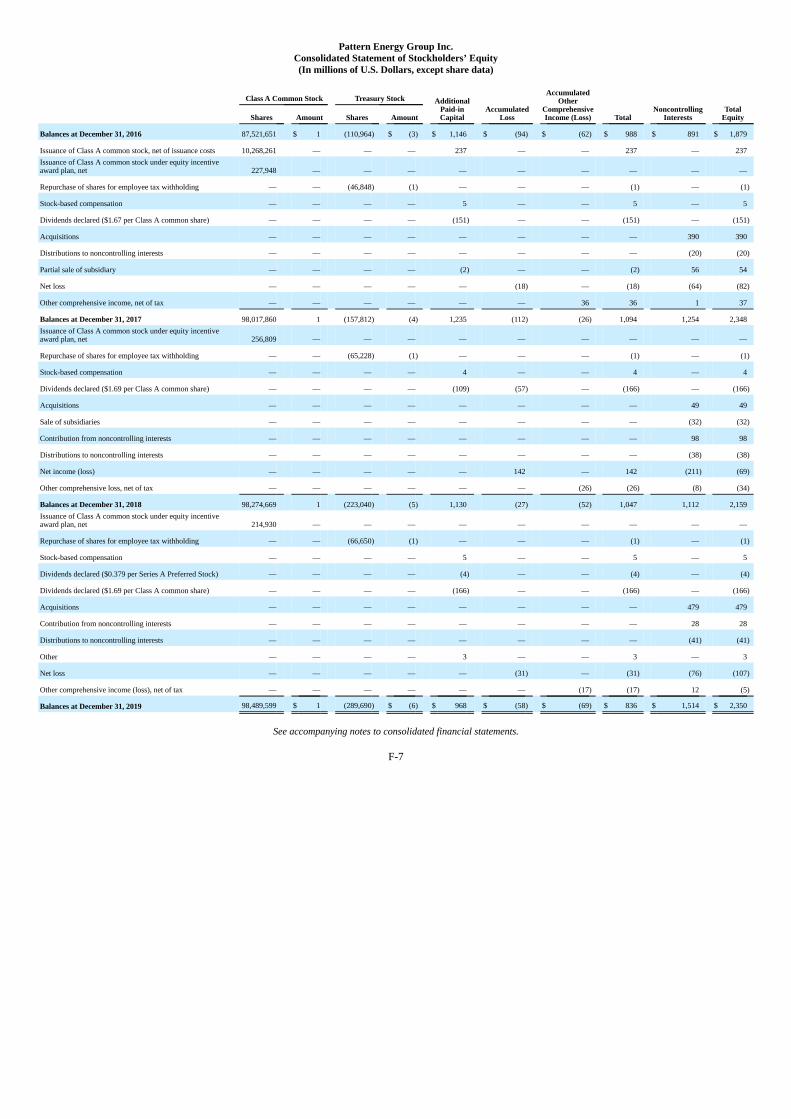
Pattern Energy Group Inc.Consolidated Statement of Stockholders’ Equity(In millions of U.S. Dollars, except share data)
Class A Common Stock Treasury Stock AdditionalPaid-inCapital
Accumulated
Loss
AccumulatedOther
ComprehensiveIncome (Loss)
Total
Noncontrolling
Interests
Total
Equity Shares Amount Shares Amount
Balances at December 31, 2016 87,521,651 $ 1 (110,964) $ (3) $ 1,146 $ (94) $ (62) $ 988 $ 891 $ 1,879
Issuance of Class A common stock, net of issuance costs 10,268,261 — — — 237 — — 237 — 237Issuance of Class A common stock under equity incentiveaward plan, net 227,948 — — — — — — — — —
Repurchase of shares for employee tax withholding — — (46,848) (1) — — — (1) — (1)
Stock-based compensation — — — — 5 — — 5 — 5
Dividends declared ($1.67 per Class A common share) — — — — (151) — — (151) — (151)
Acquisitions — — — — — — — — 390 390
Distributions to noncontrolling interests — — — — — — — — (20) (20)
Partial sale of subsidiary — — — — (2) — — (2) 56 54
Net loss — — — — — (18) — (18) (64) (82)
Other comprehensive income, net of tax — — — — — — 36 36 1 37
Balances at December 31, 2017 98,017,860 1 (157,812) (4) 1,235 (112) (26) 1,094 1,254 2,348Issuance of Class A common stock under equity incentiveaward plan, net 256,809 — — — — — — — — —
Repurchase of shares for employee tax withholding — — (65,228) (1) — — — (1) — (1)
Stock-based compensation — — — — 4 — — 4 — 4
Dividends declared ($1.69 per Class A common share) — — — — (109) (57) — (166) — (166)
Acquisitions — — — — — — — — 49 49
Sale of subsidiaries — — — — — — — — (32) (32)
Contribution from noncontrolling interests — — — — — — — — 98 98
Distributions to noncontrolling interests — — — — — — — — (38) (38)
Net income (loss) — — — — — 142 — 142 (211) (69)
Other comprehensive loss, net of tax — — — — — — (26) (26) (8) (34)
Balances at December 31, 2018 98,274,669 1 (223,040) (5) 1,130 (27) (52) 1,047 1,112 2,159Issuance of Class A common stock under equity incentiveaward plan, net 214,930 — — — — — — — — —
Repurchase of shares for employee tax withholding — — (66,650) (1) — — — (1) — (1)
Stock-based compensation — — — — 5 — — 5 — 5
Dividends declared ($0.379 per Series A Preferred Stock) — — — — (4) — — (4) — (4)
Dividends declared ($1.69 per Class A common share) — — — — (166) — — (166) — (166)
Acquisitions — — — — — — — — 479 479
Contribution from noncontrolling interests — — — — — — — — 28 28
Distributions to noncontrolling interests — — — — — — — — (41) (41)
Other — — — — 3 — — 3 — 3
Net loss — — — — — (31) — (31) (76) (107)
Other comprehensive income (loss), net of tax — — — — — — (17) (17) 12 (5)
Balances at December 31, 2019 98,489,599 $ 1 (289,690) $ (6) $ 968 $ (58) $ (69) $ 836 $ 1,514 $ 2,350
See accompanying notes to consolidated financial statements.
F-7
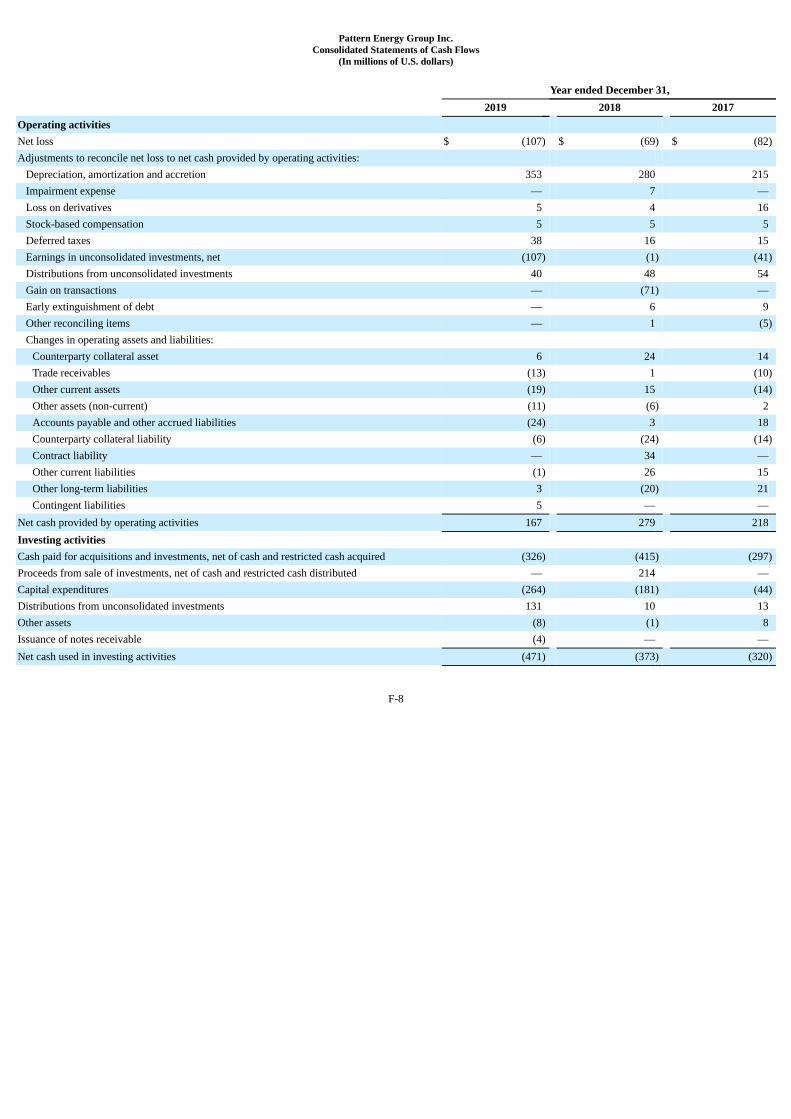
Pattern Energy Group Inc.Consolidated Statements of Cash Flows
(In millions of U.S. dollars)
Year ended December 31, 2019 2018 2017Operating activities Net loss $ (107) $ (69) $ (82)Adjustments to reconcile net loss to net cash provided by operating activities:
Depreciation, amortization and accretion 353 280 215Impairment expense — 7 —Loss on derivatives 5 4 16Stock-based compensation 5 5 5Deferred taxes 38 16 15Earnings in unconsolidated investments, net (107) (1) (41)Distributions from unconsolidated investments 40 48 54Gain on transactions — (71) —Early extinguishment of debt — 6 9Other reconciling items — 1 (5)Changes in operating assets and liabilities:
Counterparty collateral asset 6 24 14Trade receivables (13) 1 (10)Other current assets (19) 15 (14)Other assets (non-current) (11) (6) 2Accounts payable and other accrued liabilities (24) 3 18Counterparty collateral liability (6) (24) (14)Contract liability — 34 —Other current liabilities (1) 26 15Other long-term liabilities 3 (20) 21Contingent liabilities 5 — —
Net cash provided by operating activities 167 279 218Investing activities Cash paid for acquisitions and investments, net of cash and restricted cash acquired (326) (415) (297)Proceeds from sale of investments, net of cash and restricted cash distributed — 214 —Capital expenditures (264) (181) (44)Distributions from unconsolidated investments 131 10 13Other assets (8) (1) 8Issuance of notes receivable (4) — —Net cash used in investing activities (471) (373) (320)
F-8
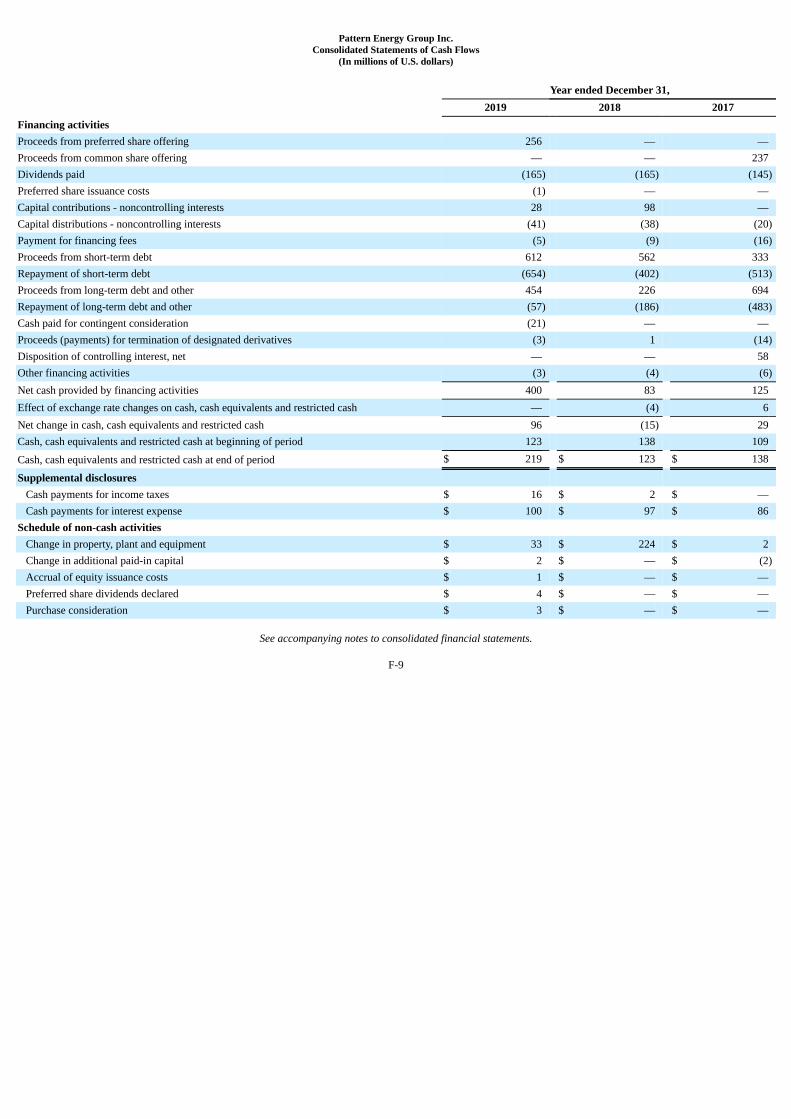
Pattern Energy Group Inc.Consolidated Statements of Cash Flows
(In millions of U.S. dollars)
Year ended December 31, 2019 2018 2017Financing activities Proceeds from preferred share offering 256 — —Proceeds from common share offering — — 237Dividends paid (165) (165) (145)Preferred share issuance costs (1) — —Capital contributions - noncontrolling interests 28 98 —Capital distributions - noncontrolling interests (41) (38) (20)Payment for financing fees (5) (9) (16)Proceeds from short-term debt 612 562 333Repayment of short-term debt (654) (402) (513)Proceeds from long-term debt and other 454 226 694Repayment of long-term debt and other (57) (186) (483)Cash paid for contingent consideration (21) — —Proceeds (payments) for termination of designated derivatives (3) 1 (14)Disposition of controlling interest, net — — 58Other financing activities (3) (4) (6)Net cash provided by financing activities 400 83 125Effect of exchange rate changes on cash, cash equivalents and restricted cash — (4) 6Net change in cash, cash equivalents and restricted cash 96 (15) 29Cash, cash equivalents and restricted cash at beginning of period 123 138 109
Cash, cash equivalents and restricted cash at end of period $ 219 $ 123 $ 138
Supplemental disclosures Cash payments for income taxes $ 16 $ 2 $ —Cash payments for interest expense $ 100 $ 97 $ 86
Schedule of non-cash activities Change in property, plant and equipment $ 33 $ 224 $ 2Change in additional paid-in capital $ 2 $ — $ (2)Accrual of equity issuance costs $ 1 $ — $ —Preferred share dividends declared $ 4 $ — $ —Purchase consideration $ 3 $ — $ —
See accompanying notes to consolidated financial statements.
F-9

Pattern Energy Group Inc.Notes to Consolidated Financial Statements
1. Organization
Pattern Energy Group Inc. (Pattern Energy or the Company) is a vertically integrated renewable energy company with a mission to transition the world to renewable energy.Our business consists of (i) an operating business segment which is comprised of a portfolio of high-quality renewable energy power projects located in many attractivemarkets that produces long-term stable cash flows and (ii) ownership interests in an upstream development platform aligned with our operating business which provides usaccess to a pipeline of projects and potential for higher returns through project development.
The Company holds ownership interests in 28 renewable energy projects with an operating capacity that totals approximately 4.4 gigawatts (GW) which are located in theUnited States, Canada and Japan.
Pattern Energy was organized in the state of Delaware in October 2012. The Company issued 100 shares in October 2012 to Pattern Renewables LP, a 100% ownedsubsidiary of Pattern Energy Group LP and subsequently in October 2013 conducted an initial public offering.
Proposed Merger
On November 3, 2019, the Company entered into an Agreement and Plan of Merger (Merger Agreement) with Pacific US Inc. (Parent), a Delaware corporation which is anindirect wholly-owned subsidiary of Canada Pension Plan Investment Board (CPP Investments), and with Pacific BidCo US Inc. (BidCo), a Delaware corporation andwholly-owned subsidiary of Parent, pursuant to which Parent has agreed to acquire the Company for $26.75 per share in an all-cash transaction. The transaction is expectedto close shortly following receipt of shareholder approval. A shareholders’ meeting has been scheduled for March 10, 2020. For the year ended December 31, 2019, theCompany incurred approximately $10 million in transaction related costs as a result of the Merger Agreement.
Parent has obtained equity and debt financing commitments to finance the transactions contemplated by the Merger Agreement and to pay related fees and expenses,including a commitment from CPP Investments and certain institutional lenders. The obligations under such commitments are subject to a number of customary conditions.The Merger Agreement contains certain termination rights for the Company and Parent. Among such rights, and subject to certain limitations, either the Company or Parentmay terminate the Merger Agreement if not completed by August 4, 2020, subject to extension to November 4, 2020 at the option of either party should any regulatoryapprovals remain outstanding.
CPP Investments, Riverstone, and certain members of management concurrently entered into an agreement pursuant to which, at or following the completion of the MergerAgreement, CPP Investments, Riverstone, and certain members of management will combine Pattern Development under common ownership with the Company.
2. Summary of Significant Accounting Policies
Basis of Presentation and Principles of Consolidation
The accompanying consolidated financial statements have been prepared in accordance with the accounting principles generally accepted in the United States (U.S.GAAP). They include the results of wholly-owned and partially-owned subsidiaries in which the Company has a controlling interest with all significant intercompanyaccounts and transactions eliminated.
Use of Estimates
The preparation of financial statements in conformity with U.S. GAAP requires management to make estimates and assumptions that affect the reported amounts of assetsand liabilities, disclosures of contingent assets and liabilities at the date of the financial statements, and the reported amounts of revenues and expenses during the reportingperiod. Actual results could differ from those estimates, and such differences may be material to the consolidated financial statements.
Cash and Cash Equivalents
Cash and cash equivalents consist of cash in banks and highly liquid investments with original maturities of three months or less.
F-10
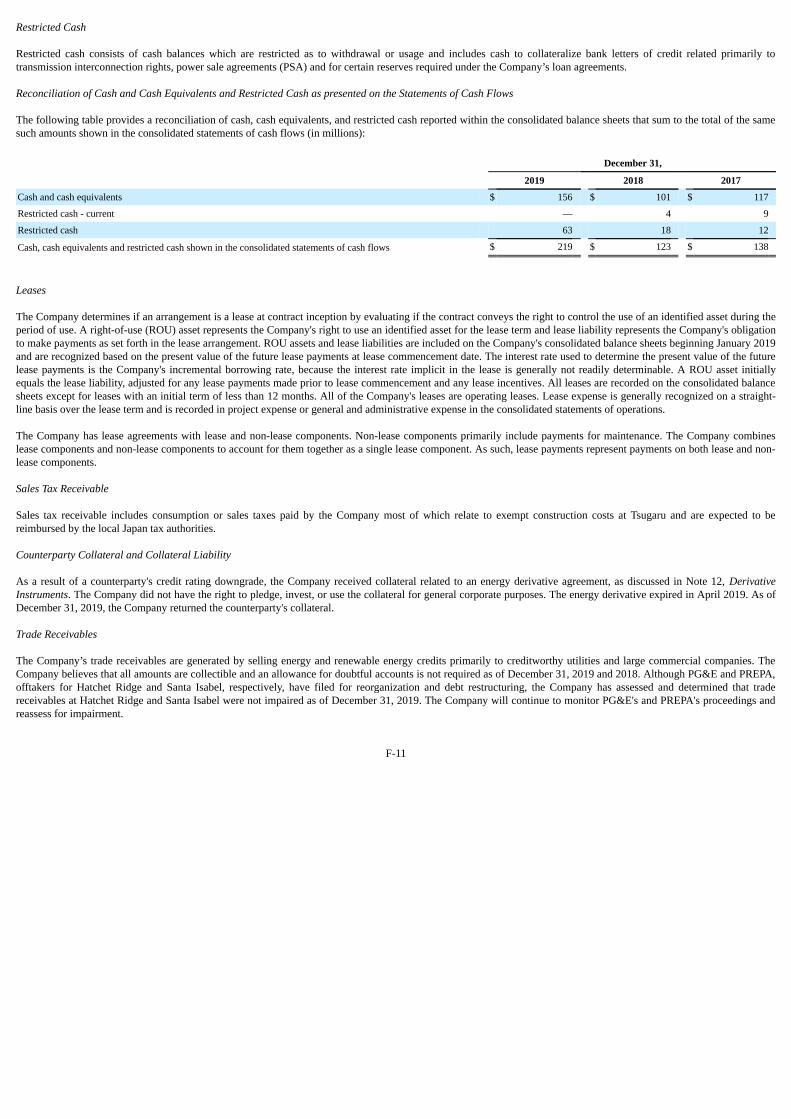
Restricted Cash
Restricted cash consists of cash balances which are restricted as to withdrawal or usage and includes cash to collateralize bank letters of credit related primarily totransmission interconnection rights, power sale agreements (PSA) and for certain reserves required under the Company’s loan agreements.
Reconciliation of Cash and Cash Equivalents and Restricted Cash as presented on the Statements of Cash Flows
The following table provides a reconciliation of cash, cash equivalents, and restricted cash reported within the consolidated balance sheets that sum to the total of the samesuch amounts shown in the consolidated statements of cash flows (in millions):
December 31,
2019 2018 2017
Cash and cash equivalents $ 156 $ 101 $ 117
Restricted cash - current — 4 9
Restricted cash 63 18 12
Cash, cash equivalents and restricted cash shown in the consolidated statements of cash flows $ 219 $ 123 $ 138
Leases
The Company determines if an arrangement is a lease at contract inception by evaluating if the contract conveys the right to control the use of an identified asset during theperiod of use. A right-of-use (ROU) asset represents the Company's right to use an identified asset for the lease term and lease liability represents the Company's obligationto make payments as set forth in the lease arrangement. ROU assets and lease liabilities are included on the Company's consolidated balance sheets beginning January 2019and are recognized based on the present value of the future lease payments at lease commencement date. The interest rate used to determine the present value of the futurelease payments is the Company's incremental borrowing rate, because the interest rate implicit in the lease is generally not readily determinable. A ROU asset initiallyequals the lease liability, adjusted for any lease payments made prior to lease commencement and any lease incentives. All leases are recorded on the consolidated balancesheets except for leases with an initial term of less than 12 months. All of the Company's leases are operating leases. Lease expense is generally recognized on a straight-line basis over the lease term and is recorded in project expense or general and administrative expense in the consolidated statements of operations.
The Company has lease agreements with lease and non-lease components. Non-lease components primarily include payments for maintenance. The Company combineslease components and non-lease components to account for them together as a single lease component. As such, lease payments represent payments on both lease and non-lease components.
Sales Tax Receivable
Sales tax receivable includes consumption or sales taxes paid by the Company most of which relate to exempt construction costs at Tsugaru and are expected to bereimbursed by the local Japan tax authorities.
Counterparty Collateral and Collateral Liability
As a result of a counterparty's credit rating downgrade, the Company received collateral related to an energy derivative agreement, as discussed in Note 12, DerivativeInstruments. The Company did not have the right to pledge, invest, or use the collateral for general corporate purposes. The energy derivative expired in April 2019. As ofDecember 31, 2019, the Company returned the counterparty's collateral.
Trade Receivables
The Company’s trade receivables are generated by selling energy and renewable energy credits primarily to creditworthy utilities and large commercial companies. TheCompany believes that all amounts are collectible and an allowance for doubtful accounts is not required as of December 31, 2019 and 2018. Although PG&E and PREPA,offtakers for Hatchet Ridge and Santa Isabel, respectively, have filed for reorganization and debt restructuring, the Company has assessed and determined that tradereceivables at Hatchet Ridge and Santa Isabel were not impaired as of December 31, 2019. The Company will continue to monitor PG&E's and PREPA's proceedings andreassess for impairment.
F-11
Major Construction Advances
Major construction advances represent advances to (i) suppliers for the manufacture of wind turbines, transmission lines, and solar panels in accordance with componentequipment supply agreements and (ii) builders in accordance with plant construction contracts. These construction advances are reclassified to construction in progresswhen the Company takes legal title to the equipment.
Derivatives
The Company may enter into interest rate swaps, interest rate caps, forwards and other agreements to manage its interest rate, electricity price and foreign exchange raterisk. The Company recognizes its derivative instruments as assets or liabilities at fair value in the consolidated balance sheets, unless the derivative instruments qualify forthe "normal purchase normal sale" (NPNS) scope exception to derivative accounting.
Contracts used in normal business operations that are settled by physical delivery, among other criteria, are eligible for and may be designated as NPNS. As NPNScontracts qualify for a scope exception to derivative accounting, contracts associated with the sale of energy are recognized as electricity sales when revenue recognitioncriteria are met and contracts associated with the production of electricity are recognized as project expense when incurred on the consolidated statements of operations.
The Company does not have contracts subject to master netting agreements with counterparties, as such assets and liabilities are presented gross on the consolidatedbalance sheets. Accounting for changes in the fair value of a derivative instrument depends on whether it has been designated as part of a hedging relationship and on thetype of hedging relationship. For derivative instruments that qualify and are designated as cash flow hedges, the change in unrealized losses on cash flow hedges, net of taxis reported as a component of other comprehensive income (loss) (OCI), and is reclassified into earnings in the same period or periods during which the hedged transactionaffects earnings. The ineffective portion of change in fair value is recorded as a component of net income (loss) on the consolidated statements of operations. The Companydiscontinues hedge accounting for its cash flow hedges prospectively when it has determined that the hedging relationship has materially changed since its inception orwhen the hedging instrument is no longer considered highly effective at offsetting the hedged risk. If the hedged transaction is no longer probable of occurring, any gain orloss previously deferred in OCI will be immediately recognized into earnings. If hedge accounting is discontinued for any other reason, any previously deferred gain or losswill remain in OCI and amortized into earnings as the hedged transaction affects future earnings. For undesignated derivative instruments, the change in fair value isreported as a component of net income (loss) on the consolidated statements of operations.
Fair Value of Financial Instruments
Accounting Standards Codification (ASC) 820, Fair Value Measurement, defines fair value as the price at which an asset could be exchanged or a liability transferred in anorderly transaction between knowledgeable, willing parties in the principal or most advantageous market for the asset or liability. Where available, fair value is based onobservable market prices or derived from such prices. Where observable prices or inputs are not available, valuation models are applied which may involve some level ofmanagement estimation and judgment, the degree of which is dependent on the price transparency for the instruments or market and the instruments’ complexity. SeeNote 15, Fair Value Measurement.
Deferred Financing Costs
Financing costs incurred with securing a construction loan are recorded in the Company’s consolidated balance sheets as an offset to the construction loan and amortizedover the contractual life of the loan to construction in progress using the effective interest method. Financing costs incurred with securing a term loan are recorded in theCompany’s consolidated balance sheets as an offset to the term loan and amortized to interest expense in the Company’s consolidated statements of operations over thecontractual life of the loan using the effective interest method. If the term loan has not been drawn on, financing costs incurred with securing the term loan are recorded inthe Company’s consolidated balance sheets as an asset.
Financing costs related to a revolving credit facility or a letter of credit facility are recorded in the Company’s consolidated balance sheets as an asset and amortized tointerest expense in the Company’s consolidated statements of operations on a straight-line basis over the contractual term of the arrangement.
F-12
Construction in Progress
Construction in progress represents the accumulation of project development costs and construction costs, including the costs incurred for the purchase of major equipmentsuch as turbines for which the Company has taken legal title, civil engineering, electrical and other related costs. Other capitalized costs include reclassified deferreddevelopment costs, amortization of intangible assets, amortization of deferred financing costs, capitalized interest and other costs required to place a project intocommercial operation. Deferred development costs represent the accumulated costs of initial permitting, environmental reviews, land rights and obligations and preliminarydesign and engineering work. The Company expenses all project development costs until a project is determined to be technically feasible and likely to achieve commercialsuccess, typically when a power purchase agreement has been negotiated. The Company begins capitalizing deferred development costs as a component of construction inprogress on the date the project commences construction. Once the project achieves commercial operation, the Company reclassifies the amounts recorded in constructionin progress to property, plant and equipment.
Property, Plant and Equipment
Property, plant and equipment represents the costs of completed and operational projects transferred from construction in progress, as well as other costs incurred forpurchasing assets such as land, computer equipment and software, furniture and fixtures, leasehold improvements and other equipment. Property, plant and equipment arestated at cost, less accumulated depreciation. Depreciation is calculated using the straight-line method over the respective assets’ useful lives. Wind farms for whichconstruction began before 2011 are depreciated over 20 years and wind farms for which construction began after 2011 are depreciated over 25 to 30 years. Solar facilitiesare depreciated over 25 years. Transmission assets are depreciated over 50 years. The remaining assets are depreciated over two to five years. Improvements to property,plant and equipment deemed to extend the useful economic life of an asset are capitalized. Repair and maintenance costs are expensed as incurred.
Intangible Assets and Intangible Liabilities
Long-lived intangible assets and intangible liabilities primarily include power purchase agreements (PPAs), land easements, land options, tax savings and mining rights.PPAs obtained through acquisitions are valued as of the acquisition date and the difference between the contract price and the estimated fair value is recorded as anintangible asset or liability. If the contract price is higher than the estimated fair value, the Company will recognize an intangible asset. If the contract price is lower than theestimated fair value, the Company will recognize an intangible liability. Land easements, land options and mining rights are recognized at the carryover basis from theseller as their carrying costs approximate fair value.
The Company generally amortizes PPAs using the straight-line method over the remaining term of the related PPA. The Company amortizes land easements, land options,tax savings and mining rights using the straight-line method over the term of their estimated useful lives, which represents the term of the land easements, land option, taxsavings and mining rights agreements, ranging from approximately 12 to 50 years. The Company periodically evaluates whether events or changes in circumstances haveoccurred that indicate the carrying amount of long-lived intangible assets may not be recoverable, or information indicates that impairment may exist.
Accounting for Impairment of Long-Lived Assets
The Company periodically evaluates long-lived assets for potential impairment whenever events or changes in circumstances have occurred that indicate that impairmentmay exist, or the carrying amount of the long-lived asset may not be recoverable. An impairment loss is recognized only if the carrying amount of a long-lived asset is notrecoverable based on its estimated future undiscounted cash flows. An impairment loss is calculated based on the excess of the carrying value of the long-lived asset overthe fair value of such long-lived asset, with the fair value determined based on an estimate of discounted future cash flows.
If the Company meets the criteria for assets held for sale, to calculate the fair value of the assets less costs to sell, the Company considers factors including current salesprices and any recent legitimate offers. If the estimated fair value less costs to sell of an asset is less than its current carrying value, the asset is written down to its estimatedfair value less costs to sell. Due to uncertainties in the estimation process, it is possible that actual results could differ from the estimates used in the Company's historicalanalysis. The Company's assumptions about project sale prices require significant judgment because the current market is highly sensitive to changes in economicconditions. The Company estimates the fair values of assets held for sale based on current market conditions and assumptions made by management, which may differ fromactual results and may result in additional impairments if market conditions deteriorate. When assets are classified as held for sale, the Company does not continue torecord depreciation or amortization for the respective assets. For the year ended December 31, 2018, the Company recognized impairment expense of $7 million related tothe sale of the Company's Chilean entities. See Note 4, Divested Operations. There was no impairment expense recognized for the years ended December 31, 2019 and2017.
F-13
Goodwill
The Company records goodwill when the purchase price of an acquired business exceeds its fair value as of the acquisition date. Goodwill is not amortized, but is subject toan assessment for impairment at least annually in the fourth quarter or more frequently if events occur or circumstances change that will more likely than not reduce the fairvalue of the reporting unit below its carrying amount.
The Company may first assess goodwill for qualitative factors to determine whether it is necessary to perform a quantitative impairment test. The qualitative analysisconsiders entity-specific and macroeconomic factors and their potential impact on the key assumptions used in the determination of the fair value of the reporting unit. Aquantitative impairment test is performed if the results of the qualitative assessment indicate that it is more likely than not that the fair value of the reporting unit is less thanits carrying value, or if a qualitative assessment is not performed. Quantitative tests compare the fair value of the asset to its carrying value.
Variable Interest Entities
VIEs are entities that do not qualify for a scope exception from the variable interest model and are therefore subject to consolidation under the variable interest model. Anentity is considered to be a VIE if (1) the entity does not have enough equity to finance its own activities without additional support, (2) the entity’s at-risk equity holderslack the characteristics of a controlling financial interest, or (3) the entity is structured with non-substantive voting rights. ASC 810, Consolidation, defines the criteria fordetermining the existence of VIEs and provides guidance for consolidation. The Company consolidates VIEs where the Company is the primary beneficiary. The primarybeneficiary of a VIE is the party that has the power to direct the activities that most significantly impact the performance of the entity and the obligation to absorb losses orthe right to receive benefits that could potentially be significant to the entity.
To the extent the entity does not meet the definition of a VIE, the ASC 810 guidance for voting interest entities (VOEs) is applied. The usual condition for a controllingfinancial interest, and therefore consolidation by the Company, is ownership of a majority voting interest of a corporation or a majority of kick-out rights for a limitedpartnership.
To the extent the entity is not consolidated under the VIE or VOE models, the Company uses the equity method of accounting. These amounts are included inunconsolidated investments in the consolidated balance sheets.
Acquisitions
Accounting Standards Update (ASU) 2017-01, Clarifying the Definition of a Business (ASU 2017-01) provides a screen test to determine when a set of assets and activitiesshould not be considered a business. Under ASU 2017-01, the Company will perform an initial screening test as of the acquisition date that, if met, results in the conclusionthat the set is not a business. If the initial screening test is not met, the Company evaluates whether the set is a business based on whether there are inputs and a substantiveprocess in place. The definition of a business impacts whether the Company consolidates an acquisition under business combination guidance or asset acquisition guidance.When the Company's acquisition is recognized as an equity method investment, the definition of a business impacts whether equity method goodwill can be recognized.
Business Combinations
The Company accounts for its business combinations by recognizing the identifiable assets acquired, the liabilities assumed, and any non-controlling interest in the acquireeat the acquisition date. The purchase is accounted for using the acquisition method, and the fair value of purchase consideration is allocated to the tangible and intangibleassets acquired and the liabilities assumed, based on their estimated fair values. Contingent consideration is also recognized and measured at fair value as of the acquisitiondate. The excess, if any, of the fair value of the purchase consideration over the fair values of the identifiable net assets is recorded as goodwill. Conversely, the excess, ifany, of the net fair values of the identifiable net assets over the fair value of the purchase consideration is recorded as a gain. Such valuations require management to makesignificant estimates and assumptions, especially with respect to intangible assets. These estimates and assumptions are inherently uncertain, and as a result, actual resultsmay differ from estimates. Significant estimates include, but are not limited to, future expected cash flows, useful lives and discount rates. During the measurement period,which is up to one year from the acquisition date, we may record adjustments to the assets acquired and liabilities assumed, with a corresponding offset to either goodwillor gain, depending on whether the fair value of purchase consideration is in excess of or less than net assets acquired. Upon the conclusion of the measurement period, anysubsequent adjustments are recorded to earnings. Transaction costs associated with business combinations are expensed as incurred.
F-14
Asset Acquisitions
When the Company acquires assets and liabilities that do not constitute a business or a VIE of which the Company is the primary beneficiary, the fair value of the purchaseconsideration, including the transaction costs of the asset acquisition, is assumed to be equal to the fair value of the net assets acquired. The purchase consideration,including the transaction costs, is allocated to the individual assets and liabilities assumed based on their relative fair values. Contingent consideration associated with theacquisition is generally recognized only when the contingency is resolved. No goodwill is recognized in an asset acquisition.
When the Company acquires assets and liabilities that do not constitute a business but meet the definition of a VIE of which the Company is the primary beneficiary, thepurchase is accounted for using the acquisition method described above for business combinations, except that no goodwill is recognized. To the extent that there isdifference between the purchase consideration and the VIE's identifiable assets and liabilities recorded and measured at fair value, the difference is recognized as a gain orloss.
Equity Method Investments
When the Company acquires a noncontrolling interest in an entity where it is not the primary beneficiary, does not control any of the ongoing activities of the entity, anddoes not meet consolidation requirements of ASC 810 and ASU 2015-02, Consolidation (Topic 810): Amendments to the Consolidation Analysis, the investment is initiallyrecognized as an equity method investment at cost. Any difference between the cost of an investment and the amount of underlying equity in net assets of an investee areconsidered basis differences. Basis differences related to the property, plant and equipment are amortized over the estimated economic useful life of the underlying long-lived assets while basis differences related to the PPA are amortized over the remaining term of the PPA. Transactions costs associated with equity method investments areincluded in the investment.
When the Company receives distributions in excess of the carrying value of its investment, and the Company is not liable for the obligations of the investee nor otherwisecommitted to provide financial support, the Company recognizes such excess distributions as equity method earnings in the period the distributions occur. Additionally,when the Company's carrying value in an unconsolidated investment is zero and the Company is not liable for the obligations of the investee nor otherwise committed toprovide financial support, the Company will not recognize equity in earnings (losses) or equity in other comprehensive income of unconsolidated investments. When theinvestee subsequently reports income, the Company does not record its share of such income until it equals the amount of distributions in excess of the carrying value thatwere previously recognized in income and previously unrecognized losses. During the years ended December 31, 2019, 2018, and 2017, the Company had no suchobligations, commitments or requirements to provide additional funding for unconsolidated investments with carrying values below zero during such years. Profits or lossesrelated to intra-entity transactions with an equity method investment are eliminated until realized by the Company.
As a result, equity income or loss reported on the Company's income statement for certain unconsolidated investments may differ from a mathematical calculation of netincome or loss attributable to the Company's equity interest based upon the factor of its equity interest and the net income or loss attributable to equity owners as shown oninvestee companies' income statements.
To the extent that cumulative comprehensive income exceeds cumulative distributions received, the Company records the distribution as distributions from unconsolidatedinvestments on the Company's consolidated statements of cash flows within operating cash flows. All other distributions are recorded as distributions from unconsolidatedinvestments on the Company's consolidated statements of cash flows within investing activities.
Noncontrolling Interests
Noncontrolling interests represent the portion of the Company’s net income (loss), net assets and comprehensive income (loss) that is not allocable to the Company and iscalculated based on ownership percentage, for applicable projects.
For the noncontrolling interests in the Company’s Panhandle 1, Panhandle 2, Post Rock, Logan's Gap, Amazon Wind, Broadview Holdings, Stillwater, and Grady, theCompany has determined that the operating partnership agreements do not allocate economic benefits pro rata to its two classes of investors and the appropriatemethodology for calculating the noncontrolling interest balance that reflects the substantive profit sharing arrangement is a balance sheet approach using the hypotheticalliquidation at book value (HLBV) method.
F-15
Under the HLBV method, the amounts reported as noncontrolling interest in the consolidated balance sheets and consolidated statements of operations represent theamounts the third party would hypothetically receive at each balance sheet reporting date under the liquidation provisions of the operating partnership agreement assumingthe net assets of the projects were liquidated at recorded amounts determined in accordance with U.S. GAAP and distributed to the investors. The noncontrolling interest inthe results of operations and comprehensive income (loss) is determined as the difference in noncontrolling interests in the consolidated balance sheets at the start and endof each reporting period, after taking into account any capital transactions between the projects and the third party. The noncontrolling interest balances in the projects arereported as a component of equity in the consolidated balance sheets.
Asset Retirement Obligation
The Company records asset retirement obligations (AROs) for the estimated costs of decommissioning turbines, removing above-ground installations and restoring sites, atthe time when a contractual decommissioning obligation is incurred. AROs represent the present value of the expected costs and timing of the related decommissioningactivities. The ARO assets and liabilities are recorded in property, plant and equipment and other long-term liabilities, respectively, in the consolidated balance sheets. TheCompany records accretion expense, which represents the increase in the asset retirement obligations, over the remaining or operational life of the associated wind project.Accretion expense is recorded as cost of revenue in the consolidated statements of operations using accretion rates based on credit adjusted risk-free interest rates. Changesresulting from revisions to the timing or amount of the original estimate of cash flows are recognized as an increase or a decrease in the asset retirement cost, or incomewhen the asset retirement cost is depleted.
Accounting for Re-powering
The Company's commitment to a plan to re-power a project represents the decision to abandon the existing long-lived asset. The decision to abandon a long-lived asset isviewed as an indicator of impairment, and as such a recoverability test is required. If the recoverability test indicates that the carrying value is not recoverable, the fair valueof the existing asset is compared to its net carrying value. If the fair value of the asset is less than its net carrying value, an impairment expense for the difference isrecorded. The remaining useful life of the existing asset represents the period between the date the Company is committed to a plan to abandon the asset and the removaldate. Due to the change in useful life, the Company will revise the estimated future cash flows of the asset retirement obligation. As a result, the Company will acceleratedepreciation expense and accretion expense. In 2018, the Company committed to a plan to repower its Gulf Wind facility, as such the Company performed a recoverabilitytest. The Company passed the recoverability test and did not recognize an impairment. The Company revised the depreciable life for the portion of the Gulf Wind facility itexpects to abandon by April 2020.
Contingent Liabilities
Contingent obligations that are acquired through business combinations are initially recorded at fair value on the date of acquisition while contingent obligations that areacquired through asset acquisitions are recorded when the contingency is resolved. Subsequent to the initial recognition of contingent obligations accounted for as abusiness combination, the Company accounts for these contingent obligations in a systematic and rational method in accordance with ASC 450, Contingencies.
The Company’s contingent liabilities related to turbine availability warranties with turbine manufacturers and turbine availability guarantees associated with long-termturbine service arrangements are reported at net realizable value. Pursuant to these warranties and guarantees, if a turbine operates at less than minimum availability duringthe warranty or guarantee period, the manufacturer or service provider is obligated to pay, as liquidated damages, an amount for each percent that the turbine operatesbelow the minimum availability threshold at the end of the warranty period. However, the Company does not recognize liquidated damages that remain contingent until theend of the warranty period. In addition, pursuant to certain of these warranties and guarantees, if a turbine operates at more than a specified availability during the warrantyor guarantee period, the Company has an obligation to pay a bonus to the turbine manufacturer or service provider at the end of the warranty period. The Company recordscontingent liabilities at each reporting period associated with these bonuses expected to be paid at the end of the warranty period.
Contract Liability
Contract liability presented on the consolidated balance sheets represents advance payments the Company has received under a power purchase agreement. As the powerpurchase agreement is an operating lease, the advanced lease payments will be recorded as lease revenue on a straight-line basis over the 25-year term of the agreement.
F-16
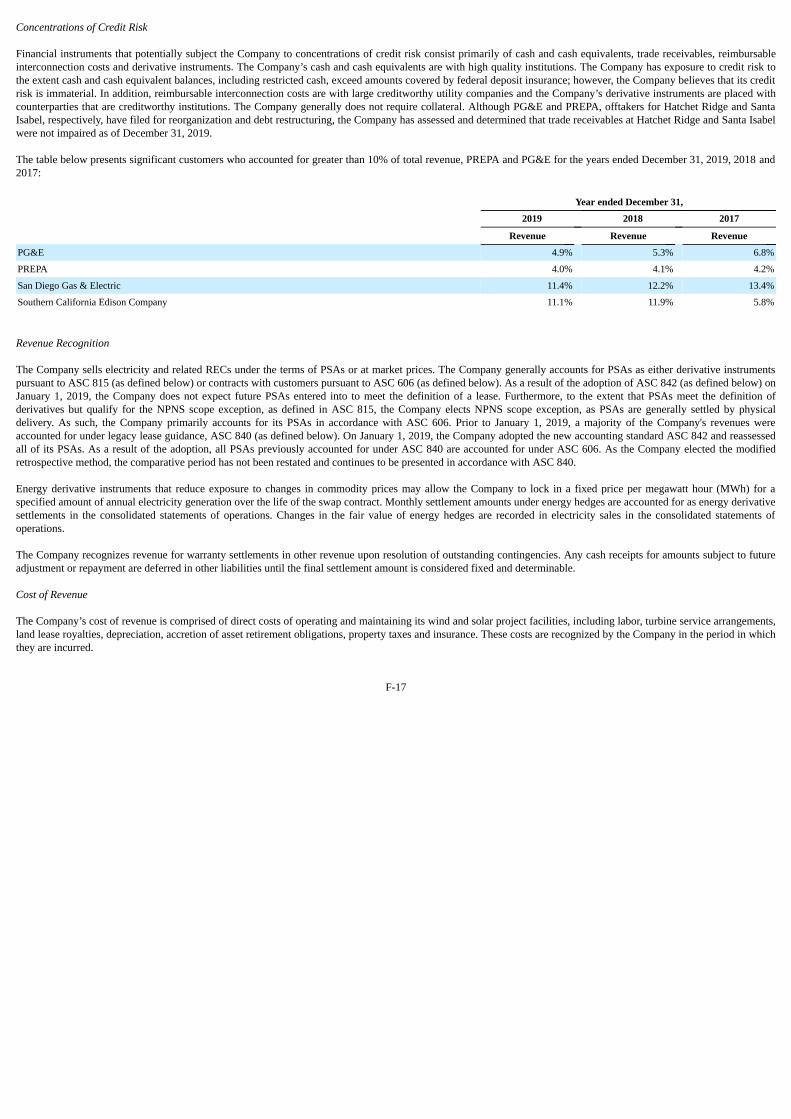
Concentrations of Credit Risk
Financial instruments that potentially subject the Company to concentrations of credit risk consist primarily of cash and cash equivalents, trade receivables, reimbursableinterconnection costs and derivative instruments. The Company’s cash and cash equivalents are with high quality institutions. The Company has exposure to credit risk tothe extent cash and cash equivalent balances, including restricted cash, exceed amounts covered by federal deposit insurance; however, the Company believes that its creditrisk is immaterial. In addition, reimbursable interconnection costs are with large creditworthy utility companies and the Company’s derivative instruments are placed withcounterparties that are creditworthy institutions. The Company generally does not require collateral. Although PG&E and PREPA, offtakers for Hatchet Ridge and SantaIsabel, respectively, have filed for reorganization and debt restructuring, the Company has assessed and determined that trade receivables at Hatchet Ridge and Santa Isabelwere not impaired as of December 31, 2019.
The table below presents significant customers who accounted for greater than 10% of total revenue, PREPA and PG&E for the years ended December 31, 2019, 2018 and2017:
Year ended December 31,
2019 2018 2017
Revenue Revenue Revenue
PG&E 4.9% 5.3% 6.8%
PREPA 4.0% 4.1% 4.2%
San Diego Gas & Electric 11.4% 12.2% 13.4%
Southern California Edison Company 11.1% 11.9% 5.8%
Revenue Recognition
The Company sells electricity and related RECs under the terms of PSAs or at market prices. The Company generally accounts for PSAs as either derivative instrumentspursuant to ASC 815 (as defined below) or contracts with customers pursuant to ASC 606 (as defined below). As a result of the adoption of ASC 842 (as defined below) onJanuary 1, 2019, the Company does not expect future PSAs entered into to meet the definition of a lease. Furthermore, to the extent that PSAs meet the definition ofderivatives but qualify for the NPNS scope exception, as defined in ASC 815, the Company elects NPNS scope exception, as PSAs are generally settled by physicaldelivery. As such, the Company primarily accounts for its PSAs in accordance with ASC 606. Prior to January 1, 2019, a majority of the Company's revenues wereaccounted for under legacy lease guidance, ASC 840 (as defined below). On January 1, 2019, the Company adopted the new accounting standard ASC 842 and reassessedall of its PSAs. As a result of the adoption, all PSAs previously accounted for under ASC 840 are accounted for under ASC 606. As the Company elected the modifiedretrospective method, the comparative period has not been restated and continues to be presented in accordance with ASC 840.
Energy derivative instruments that reduce exposure to changes in commodity prices may allow the Company to lock in a fixed price per megawatt hour (MWh) for aspecified amount of annual electricity generation over the life of the swap contract. Monthly settlement amounts under energy hedges are accounted for as energy derivativesettlements in the consolidated statements of operations. Changes in the fair value of energy hedges are recorded in electricity sales in the consolidated statements ofoperations.
The Company recognizes revenue for warranty settlements in other revenue upon resolution of outstanding contingencies. Any cash receipts for amounts subject to futureadjustment or repayment are deferred in other liabilities until the final settlement amount is considered fixed and determinable.
Cost of Revenue
The Company’s cost of revenue is comprised of direct costs of operating and maintaining its wind and solar project facilities, including labor, turbine service arrangements,land lease royalties, depreciation, accretion of asset retirement obligations, property taxes and insurance. These costs are recognized by the Company in the period in whichthey are incurred.
F-17

Stock-Based Compensation
The Company accounts for stock-based compensation related to stock options granted to employees by estimating the fair value of the stock-based awards using the Black-Scholes option-pricing model. The Black-Scholes option pricing model includes assumptions regarding dividend yields, expected volatility, expected option term, and risk-free interest rates. Expense is recognized by amortizing the fair value of the stock options granted using a straight-line method over the applicable vesting period. TheCompany estimates expected volatility based on the historical volatility of comparable publicly traded companies for a period that is equal to the expected term of theoptions. The risk-free interest rate is based on the U.S. treasury yield curve in effect at the time of grant for a period commensurate with the estimated expected term of thestock option. The expected term of options granted is derived using the "simplified" method as allowed under the provisions of the ASC 718, Compensation—StockCompensation, and represents the period of time that options granted are expected to be outstanding.
The Company accounts for stock-based compensation related to restricted stock award grants and restricted stock unit grants by amortizing the fair value of the restrictedstock award grants, which is the grant date market price, over the applicable vesting period. For certain restricted stock award grants, the Company measures the fair valueat the grant date using a Monte Carlo simulation model and amortizes the fair value over the longer of the requisite period or performance period. The Monte Carlosimulation model includes assumptions regarding dividend yields, expected volatility, risk-free interest rates and initial total shareholder return (TSR) performance.
The Company accounts for forfeitures as they occur. The forfeitures are not material. Stock-based compensation expense is recorded as a component of general andadministrative expenses in the Company’s consolidated statements of operations.
Income Taxes
The Company accounts for income taxes under the asset and liability method, which requires the recognition of deferred tax assets and liabilities for the expected future taxconsequences of events that have been included in the financial statements. Under this method, deferred tax assets and liabilities are determined on the basis of thedifferences between the financial statement and tax basis of assets and liabilities using enacted tax rates in effect for the year in which the differences are expected toreverse. The effect of a change in tax rates on deferred tax assets and liabilities is recognized in income in the period that includes the enactment date. TheCompany recognizes deferred tax assets to the extent that it believes these assets are more likely than not to be realized. In making such a determination, the Companyconsiders all available positive and negative evidence, including future reversals of existing taxable temporary differences, projected future taxable income, tax-planningand results of recent operations. If the Company determines that it would be able to realize its deferred tax assets in the future in excess of their net recorded amount, itwould make an adjustment to the deferred tax asset valuation allowance, which would reduce the provision for income taxes. The Company records uncertain tax positionsin accordance with ASC 740, Income Taxes, on the basis of a two-step process whereby (1) it determines whether it is more likely than not that the tax positions will besustained on the basis of the technical merits of the position and (2) for those tax positions that meet the more-likely-than-not recognition threshold, it recognizes the largestamount of tax benefit that is more than 50% likely to be realized upon ultimate settlement with the related tax authority. The Company has a policy to classify interest andpenalties associated with uncertain tax positions together with the related liability, and the expenses incurred related to such accruals, if any, are included in the provisionfor income taxes.
Mezzanine Equity
Mezzanine equity classification is required in accordance with ASC 480, Distinguishing Liabilities from Equity (ASC 480) when preferred stock is redeemable (1) at afixed or determinable price on a fixed or determinable date, (2) at the option of the shareholder or (3) upon the occurrence of an event that is not solely within the control ofthe reporting entity.
On October 25, 2019, the Company issued Preferred Shares (as defined in Note 17, Redeemable Preferred Stock) in a private placement. The Preferred Shares arecontingently redeemable at the option of the holder on or after the fifteenth anniversary of the issuance after a permitted private change of control or upon a pre-definedchange of control event. As a result of the holders' contingent redemption rights that are outside the Company's control, the Company has classified the Preferred Shares asmezzanine equity in the consolidated balance sheets. In accordance with ASC 480, subsequent adjustment of the carrying amount is not required until such time thatredemption is probable. At such time redemption becomes probable, the Company shall accrete changes in the redemption value over a period to the earliest redemptiondate using the interest method. As of December 31, 2019, the Company determined that redemption of the Preferred Shares was not probable.
F-18
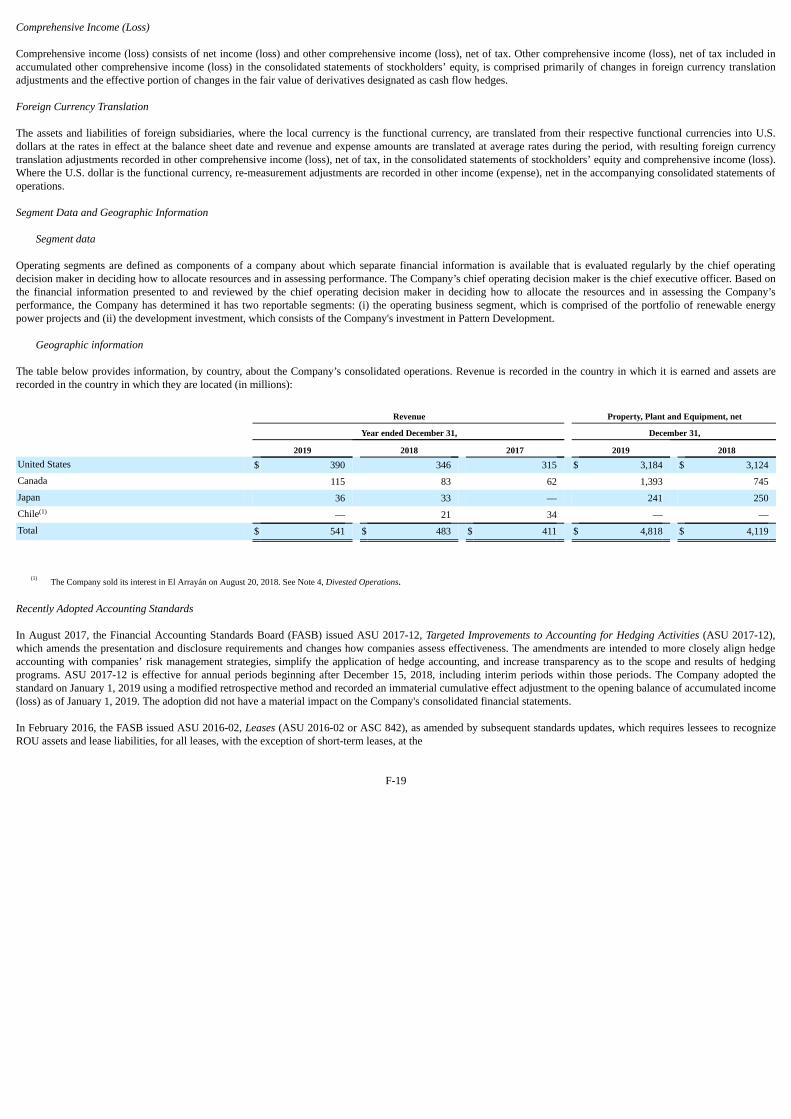
Comprehensive Income (Loss)
Comprehensive income (loss) consists of net income (loss) and other comprehensive income (loss), net of tax. Other comprehensive income (loss), net of tax included inaccumulated other comprehensive income (loss) in the consolidated statements of stockholders’ equity, is comprised primarily of changes in foreign currency translationadjustments and the effective portion of changes in the fair value of derivatives designated as cash flow hedges.
Foreign Currency Translation
The assets and liabilities of foreign subsidiaries, where the local currency is the functional currency, are translated from their respective functional currencies into U.S.dollars at the rates in effect at the balance sheet date and revenue and expense amounts are translated at average rates during the period, with resulting foreign currencytranslation adjustments recorded in other comprehensive income (loss), net of tax, in the consolidated statements of stockholders’ equity and comprehensive income (loss).Where the U.S. dollar is the functional currency, re-measurement adjustments are recorded in other income (expense), net in the accompanying consolidated statements ofoperations.
Segment Data and Geographic Information
Segment data
Operating segments are defined as components of a company about which separate financial information is available that is evaluated regularly by the chief operatingdecision maker in deciding how to allocate resources and in assessing performance. The Company’s chief operating decision maker is the chief executive officer. Based onthe financial information presented to and reviewed by the chief operating decision maker in deciding how to allocate the resources and in assessing the Company’sperformance, the Company has determined it has two reportable segments: (i) the operating business segment, which is comprised of the portfolio of renewable energypower projects and (ii) the development investment, which consists of the Company's investment in Pattern Development.
Geographic information
The table below provides information, by country, about the Company’s consolidated operations. Revenue is recorded in the country in which it is earned and assets arerecorded in the country in which they are located (in millions):
Revenue Property, Plant and Equipment, net
Year ended December 31, December 31,
2019 2018 2017 2019 2018United States $ 390 346 315 $ 3,184 $ 3,124Canada 115 83 62 1,393 745Japan 36 33 — 241 250Chile(1) — 21 34 — —Total $ 541 $ 483 $ 411 $ 4,818 $ 4,119
(1) The Company sold its interest in El Arrayán on August 20, 2018. See Note 4, Divested Operations.
Recently Adopted Accounting Standards
In August 2017, the Financial Accounting Standards Board (FASB) issued ASU 2017-12, Targeted Improvements to Accounting for Hedging Activities (ASU 2017-12),which amends the presentation and disclosure requirements and changes how companies assess effectiveness. The amendments are intended to more closely align hedgeaccounting with companies’ risk management strategies, simplify the application of hedge accounting, and increase transparency as to the scope and results of hedgingprograms. ASU 2017-12 is effective for annual periods beginning after December 15, 2018, including interim periods within those periods. The Company adopted thestandard on January 1, 2019 using a modified retrospective method and recorded an immaterial cumulative effect adjustment to the opening balance of accumulated income(loss) as of January 1, 2019. The adoption did not have a material impact on the Company's consolidated financial statements.
In February 2016, the FASB issued ASU 2016-02, Leases (ASU 2016-02 or ASC 842), as amended by subsequent standards updates, which requires lessees to recognizeROU assets and lease liabilities, for all leases, with the exception of short-term leases, at the
F-19
commencement date of each lease. Under the new guidance, lessor accounting is largely unchanged. ASU 2016-02 simplifies the accounting for sale and leasebacktransactions primarily because lessees must recognize lease assets and liabilities.
The Company adopted the new standard effective January 1, 2019 using a modified retrospective method and did not restate comparative periods. The most significantimpact of the adoption was the initial recognition of $65 million of ROU assets and $79 million of lease liabilities for operating leases primarily related to corporate officesand land leases in Japan. The difference between the ROU assets and lease liabilities was primarily due to adjustments to the ROU assets to offset a sublease liability and anintangible leasehold interest liability acquired as part of a past business combination. There was no cumulative-effect adjustment for the adoption and the adoption did nothave a significant effect on the Company's consolidated statements of operations. The Company elected the practical expedient related to land easements, allowing theCompany to carry forward the accounting treatment for land easements on certain existing agreements as its intangible assets. The Company elected to not separate leaseand non-lease components and instead treats them as a single lease component. The Company also elected to not record short-term leases with an initial term of 12 monthsor less on its consolidated balance sheets. Since the Company did not elect the package of practical expedients to carry forward historical lease classification, embeddedleases, or initial direct costs, the Company reassessed its PSAs and land arrangements and determined that all PSAs and the majority of land arrangements were notaccounted for as leases under the new standard. The Company further reassessed the PSAs under ASC 815, Derivatives and Hedging (ASC 815) and ASC 606, Revenuefrom Contracts with Customers (ASC 606) and determined all PSAs previously accounted for under the previous U.S. GAAP leasing standard, ASC 840, Leases (ASC840) should be accounted for under ASC 606. The reassessment of the PSAs did not have a material impact to the Company's consolidated financial statements. See Note3, Revenue and Note 13, Leases for further details.
Recently Issued Accounting Standards Not Yet Adopted
In October 2018, the FASB issued ASU 2018-17, Consolidation (Topic 810): Targeted Improvements to Related Party Guidance for Variable Interest Entities (ASU 2018-17). ASU 2018-17 requires reporting entities to consider indirect interests held through related parties under common control on a proportional basis rather than as theequivalent of a direct interest in its entirety for determining whether a decision-making fee is a variable interest. The standard is effective for all entities for financialstatements issued for fiscal years beginning after December 15, 2019, and interim periods within those fiscal years. Early adoption is permitted. Entities are required toapply the amendments in ASU 2018-17 retrospectively with a cumulative-effect adjustment to retained earnings at the beginning of the earliest period presented. TheCompany is currently evaluating this guidance to determine the impact it may have on its consolidated financial statements.
In August 2018, the FASB issued ASU 2018-13, Changes to the Disclosure Requirements for Fair Value Measurement (ASU 2018-13), which amends changes inunrealized gains and losses, the range and weighted average of significant unobservable inputs used to develop Level 3 fair value measurements, and the narrativedescription of measurement uncertainty which should be applied prospectively for only the most recent interim or annual period presented in the initial fiscal year ofadoption. ASU 2018-13 is effective for annual periods beginning after December 15, 2019, including interim periods within those periods. Early application is permitted.The adoption is not expected to have a material impact on the Company's consolidated financial statements.
In June 2016, the FASB issued ASU 2016-13, Financial Instruments —Credit Losses (Topic 326): Measurement of Credit Losses on Financial Instruments (ASU 2016-13),which requires the measurement of all expected credit losses for financial assets including trade receivables held at the reporting date based on historical experience, currentconditions, and reasonable and supportable forecasts. In November 2018, the FASB issued ASU 2018-19, Codification Improvements to Topic 326, Financial Instruments -Credit Losses, for the purposes of clarifying certain aspects of ASU 2016-13. In April 2019, the FASB issued ASU 2019-04, Codification Improvements to Topic 326,Financial Instruments - Credit Losses, Topic 815, Derivatives and Hedging, and Topic 825, Financial Instruments (ASU 2019-04), which clarifies the treatment of certaincredit losses. In May 2019, the FASB issued ASU 2019-05, Financial Instruments - Credit Losses (Topic 326): Targeted Transition Relief (ASU 2019-05), which providesan option to irrevocably elect to measure certain individual financial assets at fair value instead of amortized cost. In November 2019, the FASB issued ASU 2019-11,Codification Improvements to Topic 326, Financial Instruments - Credit Losses (ASU 2019-11), which provides guidance around how to report expected recoveries. ASU2016-13, ASU 2018-19, ASU 2019-04, ASU 2019-05 and ASU 2019-11 are effective for fiscal years, and interim periods within those fiscal years, beginning afterDecember 15, 2019. The adoption is not expected to have a material impact on the Company's consolidated financial statements.
In December 2019, the FASB issued ASU No 2019-12, Income Taxes (Topic 740): Simplifying the Accounting for Income Taxes (ASU 2019-12). ASU 2019-12 removescertain exceptions to the general principles in Topic 740. ASU 2019-12 is effective for fiscal years beginning after December 15, 2020, with early adoption permitted. TheCompany is currently evaluating this guidance to determine the impact it may have on its consolidated financial statements.
F-20
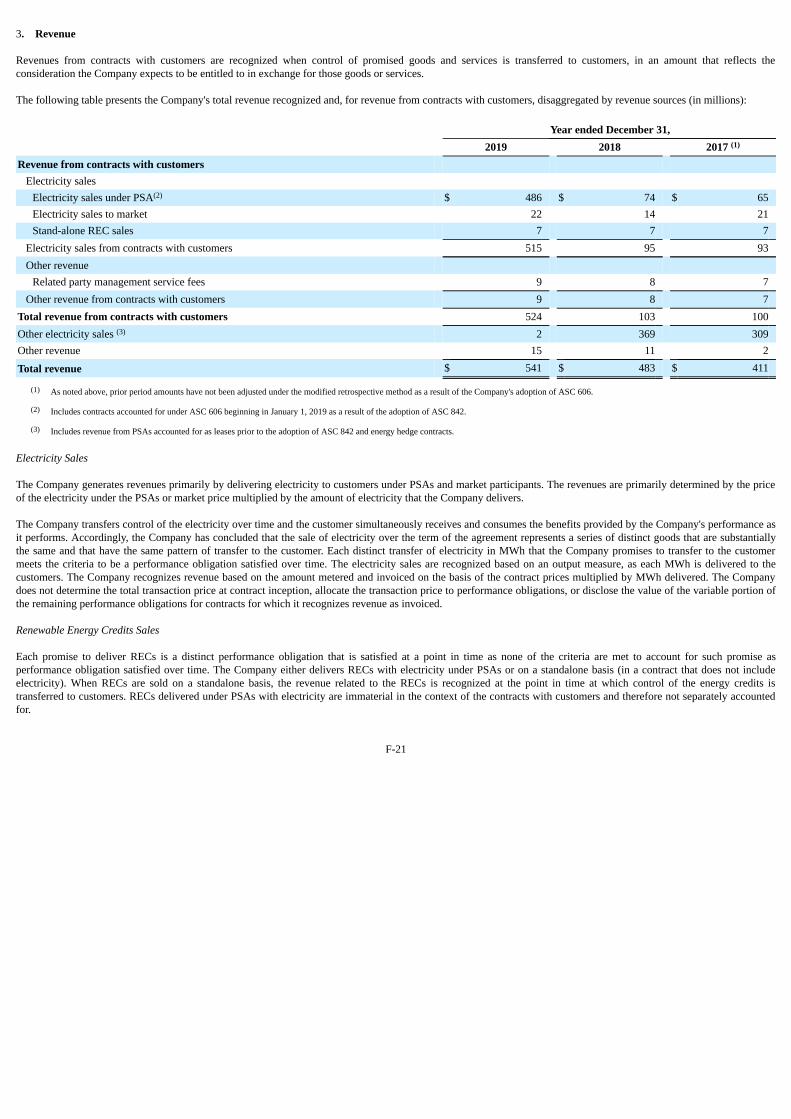
3. Revenue
Revenues from contracts with customers are recognized when control of promised goods and services is transferred to customers, in an amount that reflects theconsideration the Company expects to be entitled to in exchange for those goods or services.
The following table presents the Company's total revenue recognized and, for revenue from contracts with customers, disaggregated by revenue sources (in millions):
Year ended December 31, 2019 2018 2017 (1)
Revenue from contracts with customers Electricity sales
Electricity sales under PSA(2) $ 486 $ 74 $ 65Electricity sales to market 22 14 21Stand-alone REC sales 7 7 7
Electricity sales from contracts with customers 515 95 93Other revenue
Related party management service fees 9 8 7Other revenue from contracts with customers 9 8 7
Total revenue from contracts with customers 524 103 100Other electricity sales (3) 2 369 309Other revenue 15 11 2
Total revenue $ 541 $ 483 $ 411
(1) As noted above, prior period amounts have not been adjusted under the modified retrospective method as a result of the Company's adoption of ASC 606.
(2) Includes contracts accounted for under ASC 606 beginning in January 1, 2019 as a result of the adoption of ASC 842.
(3) Includes revenue from PSAs accounted for as leases prior to the adoption of ASC 842 and energy hedge contracts.
Electricity Sales
The Company generates revenues primarily by delivering electricity to customers under PSAs and market participants. The revenues are primarily determined by the priceof the electricity under the PSAs or market price multiplied by the amount of electricity that the Company delivers.
The Company transfers control of the electricity over time and the customer simultaneously receives and consumes the benefits provided by the Company's performance asit performs. Accordingly, the Company has concluded that the sale of electricity over the term of the agreement represents a series of distinct goods that are substantiallythe same and that have the same pattern of transfer to the customer. Each distinct transfer of electricity in MWh that the Company promises to transfer to the customermeets the criteria to be a performance obligation satisfied over time. The electricity sales are recognized based on an output measure, as each MWh is delivered to thecustomers. The Company recognizes revenue based on the amount metered and invoiced on the basis of the contract prices multiplied by MWh delivered. The Companydoes not determine the total transaction price at contract inception, allocate the transaction price to performance obligations, or disclose the value of the variable portion ofthe remaining performance obligations for contracts for which it recognizes revenue as invoiced.
Renewable Energy Credits Sales
Each promise to deliver RECs is a distinct performance obligation that is satisfied at a point in time as none of the criteria are met to account for such promise asperformance obligation satisfied over time. The Company either delivers RECs with electricity under PSAs or on a standalone basis (in a contract that does not includeelectricity). When RECs are sold on a standalone basis, the revenue related to the RECs is recognized at the point in time at which control of the energy credits istransferred to customers. RECs delivered under PSAs with electricity are immaterial in the context of the contracts with customers and therefore not separately accountedfor.
F-21
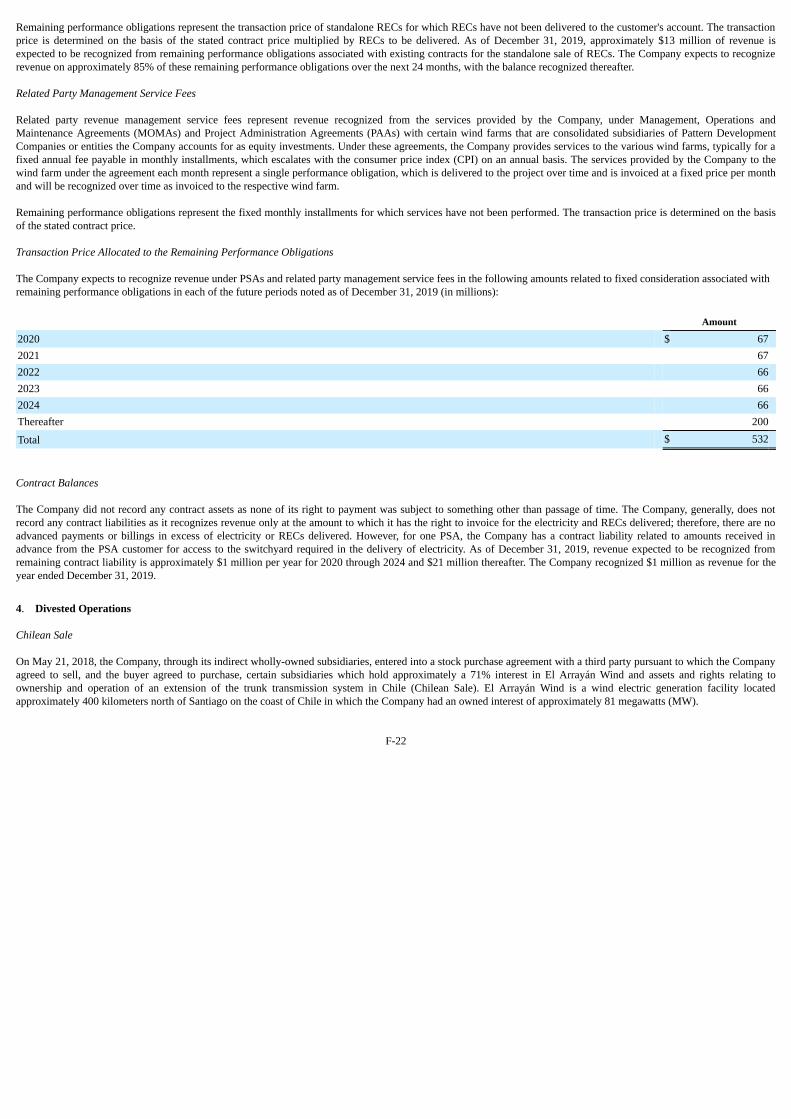
Remaining performance obligations represent the transaction price of standalone RECs for which RECs have not been delivered to the customer's account. The transactionprice is determined on the basis of the stated contract price multiplied by RECs to be delivered. As of December 31, 2019, approximately $13 million of revenue isexpected to be recognized from remaining performance obligations associated with existing contracts for the standalone sale of RECs. The Company expects to recognizerevenue on approximately 85% of these remaining performance obligations over the next 24 months, with the balance recognized thereafter.
Related Party Management Service Fees
Related party revenue management service fees represent revenue recognized from the services provided by the Company, under Management, Operations andMaintenance Agreements (MOMAs) and Project Administration Agreements (PAAs) with certain wind farms that are consolidated subsidiaries of Pattern DevelopmentCompanies or entities the Company accounts for as equity investments. Under these agreements, the Company provides services to the various wind farms, typically for afixed annual fee payable in monthly installments, which escalates with the consumer price index (CPI) on an annual basis. The services provided by the Company to thewind farm under the agreement each month represent a single performance obligation, which is delivered to the project over time and is invoiced at a fixed price per monthand will be recognized over time as invoiced to the respective wind farm.
Remaining performance obligations represent the fixed monthly installments for which services have not been performed. The transaction price is determined on the basisof the stated contract price.
Transaction Price Allocated to the Remaining Performance Obligations
The Company expects to recognize revenue under PSAs and related party management service fees in the following amounts related to fixed consideration associated withremaining performance obligations in each of the future periods noted as of December 31, 2019 (in millions):
Amount
2020 $ 672021 672022 662023 662024 66Thereafter 200
Total $ 532
Contract Balances
The Company did not record any contract assets as none of its right to payment was subject to something other than passage of time. The Company, generally, does notrecord any contract liabilities as it recognizes revenue only at the amount to which it has the right to invoice for the electricity and RECs delivered; therefore, there are noadvanced payments or billings in excess of electricity or RECs delivered. However, for one PSA, the Company has a contract liability related to amounts received inadvance from the PSA customer for access to the switchyard required in the delivery of electricity. As of December 31, 2019, revenue expected to be recognized fromremaining contract liability is approximately $1 million per year for 2020 through 2024 and $21 million thereafter. The Company recognized $1 million as revenue for theyear ended December 31, 2019.
4. Divested Operations
Chilean Sale
On May 21, 2018, the Company, through its indirect wholly-owned subsidiaries, entered into a stock purchase agreement with a third party pursuant to which the Companyagreed to sell, and the buyer agreed to purchase, certain subsidiaries which hold approximately a 71% interest in El Arrayán Wind and assets and rights relating toownership and operation of an extension of the trunk transmission system in Chile (Chilean Sale). El Arrayán Wind is a wind electric generation facility locatedapproximately 400 kilometers north of Santiago on the coast of Chile in which the Company had an owned interest of approximately 81 megawatts (MW).
F-22
On August 20, 2018, the Company completed the Chilean Sale for cash proceeds of $70 million. The Company measured impairment expense as the difference between thecarrying amount of the net assets and fair value less estimated costs to sell. As a result, the Company recorded a total impairment expense of $7 million for the year endedDecember 31, 2018 in the consolidated statements of operations. There was no impairment expense related to the Chilean Sale for the year ended December 31, 2017.
The operating results of El Arrayán Wind were included on the consolidated statements of operations through the date of sale.
5. Acquisitions
All acquisitions completed during 2019 and 2018 were in alignment with the Company's strategy to expand its portfolio of power generating projects.
Henvey Inlet Acquisition
On October 25, 2019, a subsidiary of the Company acquired (1) a 49.99% limited partnership interest in Henvey Inlet, (2) a 49.99% limited partnership interest in HIWProperty Holdings LP, (3) 100% of the issued and outstanding shares of Pattern Henvey Inlet GP Holdings Inc., which owns 50% of the issued and outstanding shares ofHenvey Inlet Wind GP Inc., which owns a 0.02% general partnership interest in Henvey Inlet, (4) 50% of the issued and outstanding shares of HIW Property Holdings GPInc., which owns a 0.02% general partnership interest in HIW Property Holdings LP and (5) two promissory notes receivable issued by Nigig Power Corporation. TheCompany paid aggregate consideration of $172 million, net of cash acquired, and assumed $724 million of debt. Henvey Inlet operates the approximately 300 MW windproject located on the Henvey Inlet First Nation Reserve No. 2, in Ontario, Canada, which commenced commercial operation in the third quarter of 2019. HIW PropertyHoldings LP owns real estate along Henvey Inlet's transmission line. Nigig Power Corporation, a wholly-owned subsidiary of Henvey Inlet First Nation, are joint venturepartners and own the remaining interests. The identifiable assets, operating contracts and liabilities assumed for the Henvey Inlet acquisition were recorded at fair value,which corresponded to the sum of the cash purchase price and the fair value of the other investors' noncontrolling interests. The noncontrolling interest was recorded at fairvalue estimated using the purchase price paid by such noncontrolling interest pursuant to the purchase and sale agreement. Henvey Inlet was determined to be a VIE, forwhich the Company is the primary beneficiary. The Company incurred transaction related expenses of less than $1 million which were recorded in net earnings (loss) ontransactions in the consolidated statements of operations for the year ended December 31, 2019.
Of the $172 million purchase price, the Company paid $78 million for the two promissory notes receivable which represented face value plus accrued interest. Thepromissory notes accrue interest at 10% per annum and are expected to be paid by September 30, 2025. The promissory notes were recognized at fair value.
Grady Acquisition
On October 10, 2019, the Company acquired a 51% ownership interest in Grady B Member LLC, which owns 100% of the Class B Units in Grady Energy Holdings LLC,which owns 100% of the membership interests in Grady for aggregate consideration of $84 million, net of cash acquired. Grady operates the approximately 220 MW windproject located in Curry County, New Mexico, which commenced commercial operation in the third quarter of 2019. PSP Investments purchased the remaining 49%ownership interest in Grady B Member LLC for $96 million. The identifiable assets, operating contracts and liabilities assumed for Grady were recorded at fair value,which corresponded to the sum of the cash purchase price and the fair value of the other investors' noncontrolling interests. The noncontrolling interest was recorded at fairvalue estimated using the purchase price paid by such noncontrolling interest pursuant to the purchase and sale agreement. Grady B Member LLC was determined to be aVIE, for which the Company is the primary beneficiary. The Company incurred transaction related expenses of $1 million which were recorded in net earnings (loss) ontransactions in the consolidated statements of operations for the year ended December 31, 2019.
The Company consolidates Grady and reports its 51% of the Class B membership interest as controlling equity; and 49% of the Class B membership interest asnoncontrolling interest combined with another acquired noncontrolling interest totals $295 million.
Stillwater Acquisition
On November 20, 2018, a subsidiary of the Company acquired 100% of Stillwater Wind LLC, an 80 MW wind project located in Stillwater County, Montana, for a totalconsideration of $111 million, net of cash acquired, in addition to $1 million of capitalized transaction-related expenses. PSP Investments and Allianz Renewable EnergyPartners of America, LLC, whom are noncontrolling interests, contributed $95 million of the total consideration.
The fair value of the purchase consideration, including transaction-related expenses of the asset acquisition, is allocated to the relative fair value of the individual assets,operating contracts and liabilities assumed. No gain or loss was recognized upon acquisition.
F-23
MSM Acquisition
On August 10, 2018, the Company subscribed for (1) a 51% limited partnership interest in MSM LP Holdings LP, which holds 99.98% of the economic interests in MSM.MSM operates the approximately 143 MW wind project located in the Chaudière-Appalaches region south of Québec City, Canada, which achieved commercial operationin the first quarter of 2018. The Company also acquired (1) 70% of the issued and outstanding shares in the capital of Pattern MSM GP Holdings Inc. and (2) 70% of theissued and outstanding shares in the capital of Pattern Development MSM Management ULC from Pattern Energy Group LP for aggregate consideration of $31 million, netof cash acquired.
MSM was determined to be a VIE, for which the Company is the primary beneficiary. The Company recorded the fair value of the individual assets, operating contracts andliabilities of the VIE, which did not meet the definition of a business. The noncontrolling interest was recorded at fair value estimated using the purchase price paid by PSPInvestments pursuant to the purchase and sale agreement. No gain or loss was recognized upon acquisition. The Company incurred transaction-related expenses of $1million which were recorded in net earnings (loss) on transactions in the consolidated statements of operations for the year ended December 31, 2018.
Japan Acquisitions
On March 7, 2018, the Company acquired (1) Tsugaru Holdings, which owns a 122 MW wind project company located in Aomori Prefecture, Japan that is expected tocommence commercial operations in early to mid-2020; (2) Ohorayama, a 33 MW wind project company located in Kochi Prefecture, Japan that commenced commercialoperations in March 2018; (3) Kanagi, a 10 MW solar project company located in Shimane Prefecture, Japan that commenced commercial operations in 2006; (4) Otsuki, a12 MW wind project company located in Kochi Prefecture, Japan that commenced commercial operations in 2006; and (5) Futtsu, a 29 MW solar project company locatedin Chiba Prefecture, Japan that commenced commercial operations in 2016 (collectively referred to as the Japan Acquisition) for total consideration of $264 million, net ofcash acquired, of which $106 million is a contingent payment. As part of the acquisition, the Company also assumed $181 million of debt. The Company incurredtransaction related expenses of $1 million which were recorded in net earnings (loss) on transactions in the consolidated statements of operations for the year endedDecember 31, 2018.
Contingent purchase consideration with a fair value of $103 million, subject to foreign currency exchange rate changes, is contingent upon term conversion of the Tsugaruconstruction loan or the commencement of commercial operations of Tsugaru. Both the term loan conversion and commencement of commercial operations are expected tooccur in 2020. Upon the term conversion of the Ohorayama construction loan in June 2018, the Company was obligated to make a $3 million payment, subject to foreigncurrency exchange rate changes, to Pattern Energy Group LP. The Company paid this consideration in July 2018. See Note 15, Fair Value Measurement for furtherdiscussion on the fair value of the contingent consideration. The Company recorded the fair value of the individual assets, operating contracts and assumed liabilities of theJapan acquisition. The noncontrolling interest was recorded at fair value estimated using a projected cash flow stream of distributable cash, discounted to present value witha discount rate reflecting the cost of equity adjusted for control premium. Deferred tax liabilities were established as part of acquisition accounting due to temporary tax tobook basis differences as a result of the step up in fair value related to property, plant and equipment, which established goodwill for $60 million. The valuation of certainassets and liabilities in the Japan Acquisition is final as of December 31, 2018. The Japan Acquisition provides the Company with an established presence in Japan tosupport future growth plans and provides diversification which is of benefit to the risk profile of the Company's overall operating project portfolio.
F-24
The aggregate purchase prices of the acquisitions were allocated as follows (in millions):
December 31,
2019 2018
Henvey Inlet(1) (3) Grady(1) (3) Japan Acquisition(1) MSM(2) Stillwater(2)
Purchase price
Cash paid for acquisitions, net of cash and restricted cash acquired $ 172 $ 84 $ 158 $ 31 $ 111
Contingent consideration — — 106 — —
$ 172 $ 84 $ 264 $ 31 $ 111
Allocation Property, plant and equipment, net $ 645 $ 332 $ 269 $ 270 $ 120
Construction in progress — — 179 — —
Notes receivable 80 — — — —
Intangibles 533 67 103 — —
Goodwill — — 60 — —
Other assets acquired 30 7 20 38 4
Debt (724) — (181) (196) —
Deferred tax liabilities — — (65) — —
Contract liability — — — (29) —
Other liabilities assumed (206) (27) (110) (14) (13)
Assets and liabilities assumed before noncontrolling interests 358 379 275 69 111
Less: noncontrolling interests (186) (295) (11) (38) —
Total consideration allocated to acquired assets and liabilities $ 172 $ 84 $ 264 $ 31 $ 111
(1) Business Combination(2) Asset Acquisition(3) The fair value estimates and assumptions for the assets acquired and liabilities assumed are subject to change as additional information is obtained for the estimates during the measurement period (up to
one year from the acquisition date).
Supplemental pro forma data (unaudited)
Grady and Henvey Inlet commenced operations in August and September 2019, respectively. Therefore, pro forma data for Grady and Henvey Inlet have not been providedas there is no material difference between pro forma data that give effects to the acquisitions of Grady and Henvey Inlet as if they had occurred on January 1, 2018 and theactual data reported for the year ended December 31, 2019.
Ohorayama commenced operations in March 2018 and until approximately one week before the Company's acquisition, Ohorayama was still under construction. Inaddition, Tsugaru is expected to commence commercial operations in early to mid-2020. Therefore, pro forma data for Ohorayama and Tsugaru have not been provided asthere is no material difference between pro forma data that give effects to the these acquisitions as if they had occurred on January 1, 2017 and the actual data reported forthe years ended December 31, 2018 and 2017.
F-25
The unaudited pro forma statement of operations data below gives effect to the acquisition of Kanagi, Otsuki and Futtsu as if they had occurred on January 1, 2017. The proforma net loss for the year ended December 31, 2018 was adjusted to exclude nonrecurring transaction related expenses of $1 million. The unaudited pro forma data ispresented for illustrative purposes only and is not intended to be indicative of actual results that would have been achieved had these acquisitions been consummated as ofJanuary 1, 2017. The unaudited pro forma data should not be considered representative of the Company’s future financial condition or results of operations.
Year ended December 31,
Unaudited pro forma data (in millions) 2018 2017Pro forma total revenue $ 487 $ 435Pro forma total expenses 556 520Pro forma net loss (69) (85)Less: pro forma net loss attributable to noncontrolling interest (211) (65)Pro forma net income (loss) attributable to Pattern Energy $ 142 $ (20)
Consolidated Statements of Operations Impact of Business Combinations
The following table presents the amounts included in the consolidated statements of operations for all business combinations, since their respective dates of acquisition (inmillions):
Year ended
December 31, 2019 December 31, 2018
Henvey Inlet Grady Japan Acquisition Japan Acquisition
Total revenue 18 11 36 33
Total expenses 13 9 52 34
Net income (loss) 5 2 (16) (1)
Less: net income (loss) attributable to noncontrolling interest 2 (2) 1 1
Net income (loss) attributable to Pattern Energy 3 4 (17) (2)
6. Property, Plant and Equipment
The following presents the categories within property, plant and equipment (in millions):
December 31,
2019 2018Operating wind farms $ 5,986 $ 4,972Transmission line 94 94Furniture, fixtures and equipment 19 16Land 4 —Subtotal 6,103 5,082Less: accumulated depreciation (1,285) (963)Property, plant and equipment, net $ 4,818 $ 4,119
The Company recorded depreciation expense related to property, plant and equipment of $310 million, $245 million and $195 million for the years ended December 31,2019, 2018 and 2017, respectively.
F-26
7. Intangible Assets and Liabilities and Goodwill
The following presents the major components of the long-lived intangible assets and liabilities (in millions):
December 31, 2019
Weighted Average
Remaining Life Gross AccumulatedAmortization Net
Intangible assets Power purchase agreement 19 $ 819 $ (49) $ 770Industrial revenue bond tax savings 24 22 (1) 21Other intangible assets 31 19 (2) 17
Total intangible assets $ 860 $ (52) $ 808
Intangible liabilities Power purchase agreement 13 60 (16) 44
Total intangible liabilities $ 60 $ (16) $ 44
December 31, 2018
Weighted Average
Remaining Life Gross AccumulatedAmortization Net
Intangible assets Power purchase agreement 15 $ 225 $ (31) $ 194Industrial revenue bond tax savings 23 13 (1) 12Other intangible assets 33 14 (1) 13
Total intangible assets $ 252 $ (33) $ 219
Intangible liability Power purchase agreement 14 $ 60 (13) $ 47Leasehold interest 22 9 — 9
Total intangible liabilities $ 69 $ (13) $ 56
Amortization of the PPA asset and PPA liability is reflected in electricity sales in the consolidated statements of operations, which resulted in net reduction ofapproximately $15 million, $9 million and $4 million in electricity sales for the years ended December 31, 2019, 2018 and 2017, respectively. For the years endedDecember 31, 2019, 2018 and 2017, the Company recorded amortization expense of $1 million, less than $1 million and less than $1 million related to other intangibleassets in depreciation, amortization and accretion in the consolidated statements of operations.
As a result of the Japan Acquisition, the Company recorded a $103 million intangible PPA asset resulting from market prices that are lower than the contractual prices. Inaddition, the Company recorded a $9 million intangible leasehold interest liability, as a result of higher market prices compared to the contractual prices.
The acquisition of Grady provided for future property tax savings as a result of the issuance of industrial revenue bonds during construction of Grady. The Companyconsidered the future tax savings an intangible asset and calculated the fair value of the asset at the acquisition date. The tax savings was calculated by forecasting thedifference between the property tax payments that Grady would be liable for if the industrial revenue bond structure was not in place and the actual payments in lieu of tax.The fair value of the property tax savings was $10 million, and recorded to intangible assets, net on the consolidated balance sheets at the acquisition date. Such value willbe amortized to depreciation, amortization and accretion in the consolidated statements of operations over the 26 year exemption period that remains as of the acquisitiondate. The Company recorded less than $1 million of amortization expense related to industrial revenue bond tax saving intangible asset in depreciation, amortization andaccretion in the consolidated statements of operations. In addition, as a result of the acquisition of Grady, the Company recorded a $57 million intangible PPA assetresulting from market prices that are lower than the contractual prices.
F-27
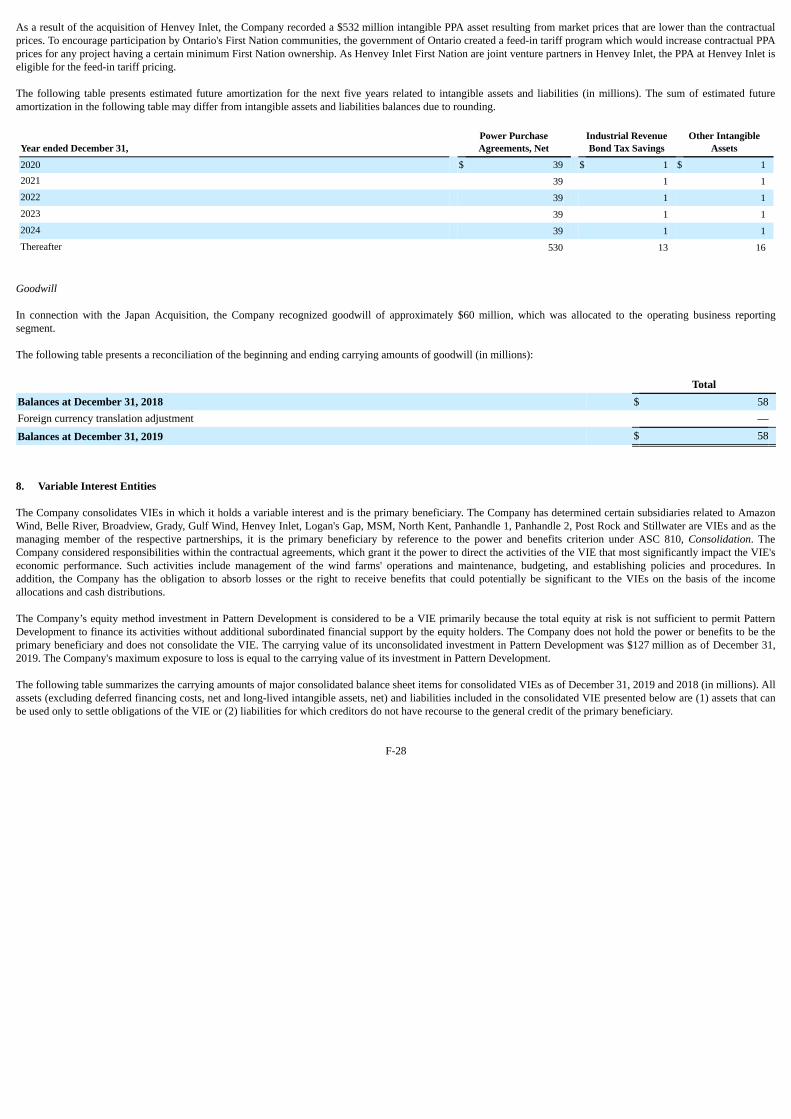
As a result of the acquisition of Henvey Inlet, the Company recorded a $532 million intangible PPA asset resulting from market prices that are lower than the contractualprices. To encourage participation by Ontario's First Nation communities, the government of Ontario created a feed-in tariff program which would increase contractual PPAprices for any project having a certain minimum First Nation ownership. As Henvey Inlet First Nation are joint venture partners in Henvey Inlet, the PPA at Henvey Inlet iseligible for the feed-in tariff pricing.
The following table presents estimated future amortization for the next five years related to intangible assets and liabilities (in millions). The sum of estimated futureamortization in the following table may differ from intangible assets and liabilities balances due to rounding.
Year ended December 31, Power PurchaseAgreements, Net
Industrial RevenueBond Tax Savings
Other IntangibleAssets
2020 $ 39 $ 1 $ 12021 39 1 12022 39 1 12023 39 1 12024 39 1 1Thereafter 530 13 16
Goodwill
In connection with the Japan Acquisition, the Company recognized goodwill of approximately $60 million, which was allocated to the operating business reportingsegment.
The following table presents a reconciliation of the beginning and ending carrying amounts of goodwill (in millions):
TotalBalances at December 31, 2018 $ 58Foreign currency translation adjustment —
Balances at December 31, 2019 $ 58
8. Variable Interest Entities
The Company consolidates VIEs in which it holds a variable interest and is the primary beneficiary. The Company has determined certain subsidiaries related to AmazonWind, Belle River, Broadview, Grady, Gulf Wind, Henvey Inlet, Logan's Gap, MSM, North Kent, Panhandle 1, Panhandle 2, Post Rock and Stillwater are VIEs and as themanaging member of the respective partnerships, it is the primary beneficiary by reference to the power and benefits criterion under ASC 810, Consolidation. TheCompany considered responsibilities within the contractual agreements, which grant it the power to direct the activities of the VIE that most significantly impact the VIE'seconomic performance. Such activities include management of the wind farms' operations and maintenance, budgeting, and establishing policies and procedures. Inaddition, the Company has the obligation to absorb losses or the right to receive benefits that could potentially be significant to the VIEs on the basis of the incomeallocations and cash distributions.
The Company’s equity method investment in Pattern Development is considered to be a VIE primarily because the total equity at risk is not sufficient to permit PatternDevelopment to finance its activities without additional subordinated financial support by the equity holders. The Company does not hold the power or benefits to be theprimary beneficiary and does not consolidate the VIE. The carrying value of its unconsolidated investment in Pattern Development was $127 million as of December 31,2019. The Company's maximum exposure to loss is equal to the carrying value of its investment in Pattern Development.
The following table summarizes the carrying amounts of major consolidated balance sheet items for consolidated VIEs as of December 31, 2019 and 2018 (in millions). Allassets (excluding deferred financing costs, net and long-lived intangible assets, net) and liabilities included in the consolidated VIE presented below are (1) assets that canbe used only to settle obligations of the VIE or (2) liabilities for which creditors do not have recourse to the general credit of the primary beneficiary.
F-28
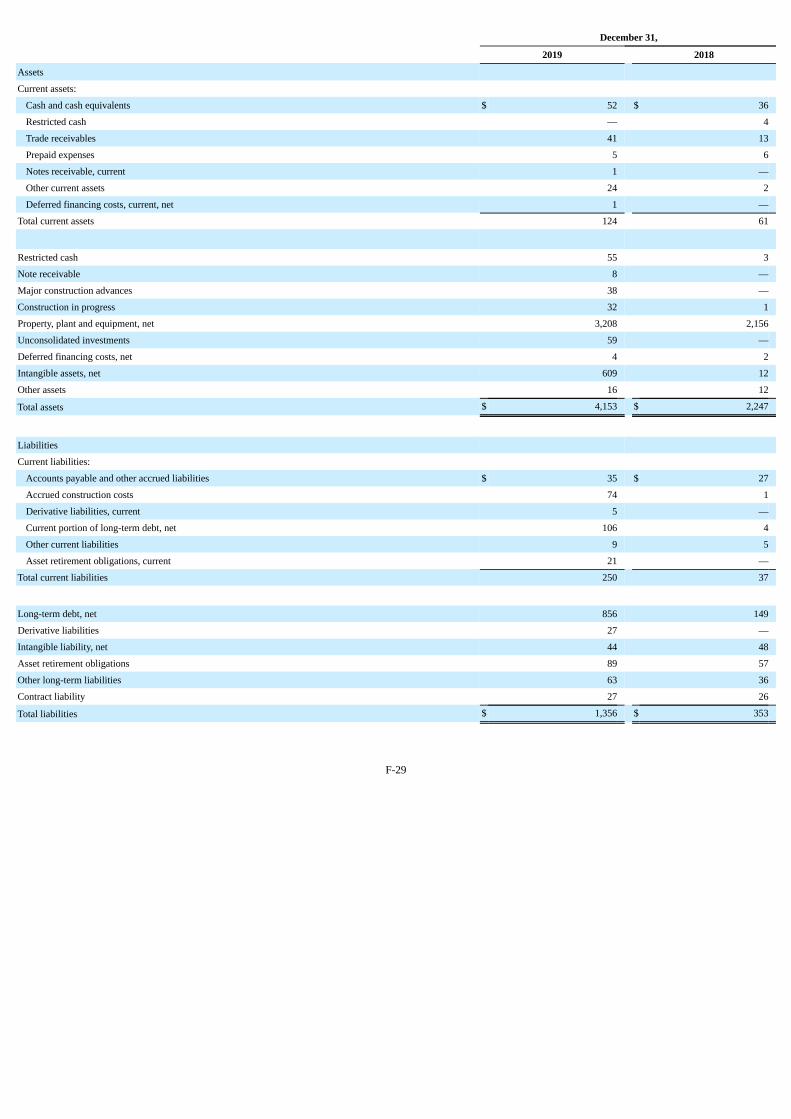
December 31,
2019 2018
Assets Current assets:
Cash and cash equivalents $ 52 $ 36
Restricted cash — 4
Trade receivables 41 13
Prepaid expenses 5 6
Notes receivable, current 1 —
Other current assets 24 2
Deferred financing costs, current, net 1 —
Total current assets 124 61
Restricted cash 55 3
Note receivable 8 —
Major construction advances 38 —
Construction in progress 32 1
Property, plant and equipment, net 3,208 2,156
Unconsolidated investments 59 —
Deferred financing costs, net 4 2
Intangible assets, net 609 12
Other assets 16 12
Total assets $ 4,153 $ 2,247
Liabilities Current liabilities:
Accounts payable and other accrued liabilities $ 35 $ 27
Accrued construction costs 74 1
Derivative liabilities, current 5 —
Current portion of long-term debt, net 106 4
Other current liabilities 9 5
Asset retirement obligations, current 21 —
Total current liabilities 250 37
Long-term debt, net 856 149
Derivative liabilities 27 —
Intangible liability, net 44 48
Asset retirement obligations 89 57
Other long-term liabilities 63 36
Contract liability 27 26
Total liabilities $ 1,356 $ 353
F-29
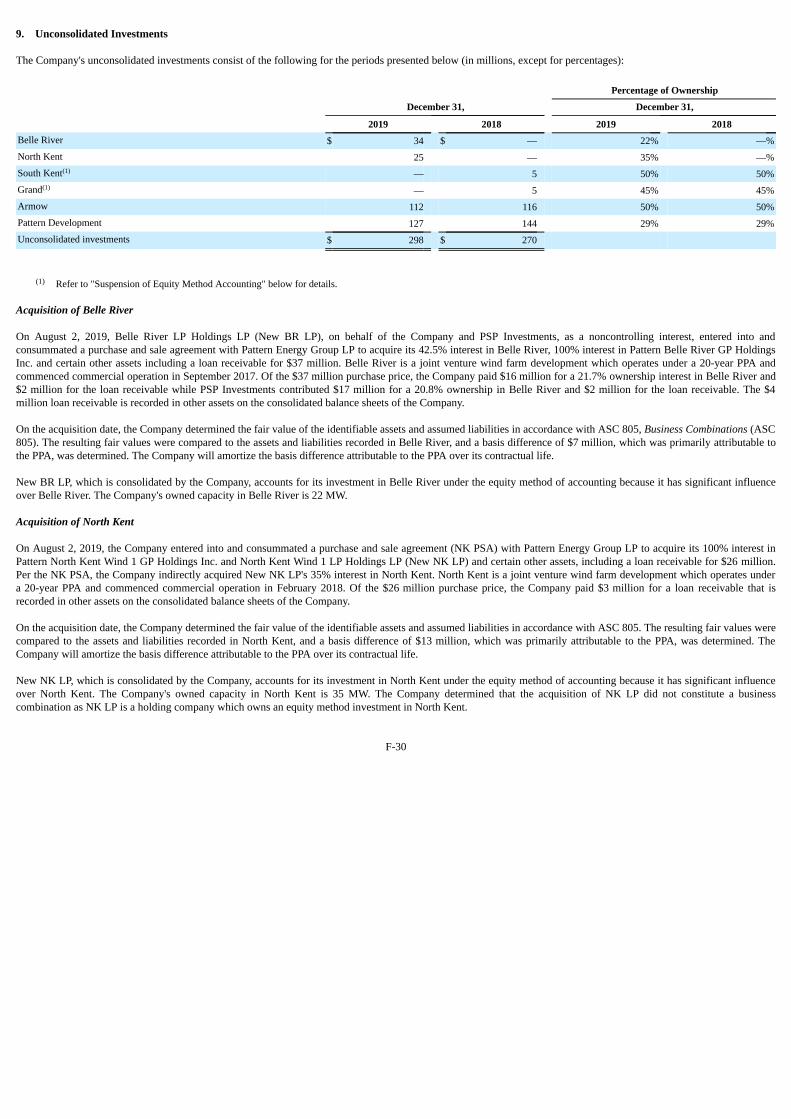
9. Unconsolidated Investments
The Company's unconsolidated investments consist of the following for the periods presented below (in millions, except for percentages):
December 31,
Percentage of Ownership
December 31,
2019 2018 2019 2018Belle River $ 34 $ — 22% —%North Kent 25 — 35% —%South Kent(1) — 5 50% 50%Grand(1) — 5 45% 45%Armow 112 116 50% 50%Pattern Development 127 144 29% 29%Unconsolidated investments $ 298 $ 270
(1) Refer to "Suspension of Equity Method Accounting" below for details.
Acquisition of Belle River
On August 2, 2019, Belle River LP Holdings LP (New BR LP), on behalf of the Company and PSP Investments, as a noncontrolling interest, entered into andconsummated a purchase and sale agreement with Pattern Energy Group LP to acquire its 42.5% interest in Belle River, 100% interest in Pattern Belle River GP HoldingsInc. and certain other assets including a loan receivable for $37 million. Belle River is a joint venture wind farm development which operates under a 20-year PPA andcommenced commercial operation in September 2017. Of the $37 million purchase price, the Company paid $16 million for a 21.7% ownership interest in Belle River and$2 million for the loan receivable while PSP Investments contributed $17 million for a 20.8% ownership in Belle River and $2 million for the loan receivable. The $4million loan receivable is recorded in other assets on the consolidated balance sheets of the Company.
On the acquisition date, the Company determined the fair value of the identifiable assets and assumed liabilities in accordance with ASC 805, Business Combinations (ASC805). The resulting fair values were compared to the assets and liabilities recorded in Belle River, and a basis difference of $7 million, which was primarily attributable tothe PPA, was determined. The Company will amortize the basis difference attributable to the PPA over its contractual life.
New BR LP, which is consolidated by the Company, accounts for its investment in Belle River under the equity method of accounting because it has significant influenceover Belle River. The Company's owned capacity in Belle River is 22 MW.
Acquisition of North Kent
On August 2, 2019, the Company entered into and consummated a purchase and sale agreement (NK PSA) with Pattern Energy Group LP to acquire its 100% interest inPattern North Kent Wind 1 GP Holdings Inc. and North Kent Wind 1 LP Holdings LP (New NK LP) and certain other assets, including a loan receivable for $26 million.Per the NK PSA, the Company indirectly acquired New NK LP's 35% interest in North Kent. North Kent is a joint venture wind farm development which operates undera 20-year PPA and commenced commercial operation in February 2018. Of the $26 million purchase price, the Company paid $3 million for a loan receivable that isrecorded in other assets on the consolidated balance sheets of the Company.
On the acquisition date, the Company determined the fair value of the identifiable assets and assumed liabilities in accordance with ASC 805. The resulting fair values werecompared to the assets and liabilities recorded in North Kent, and a basis difference of $13 million, which was primarily attributable to the PPA, was determined. TheCompany will amortize the basis difference attributable to the PPA over its contractual life.
New NK LP, which is consolidated by the Company, accounts for its investment in North Kent under the equity method of accounting because it has significant influenceover North Kent. The Company's owned capacity in North Kent is 35 MW. The Company determined that the acquisition of NK LP did not constitute a businesscombination as NK LP is a holding company which owns an equity method investment in North Kent.
F-30
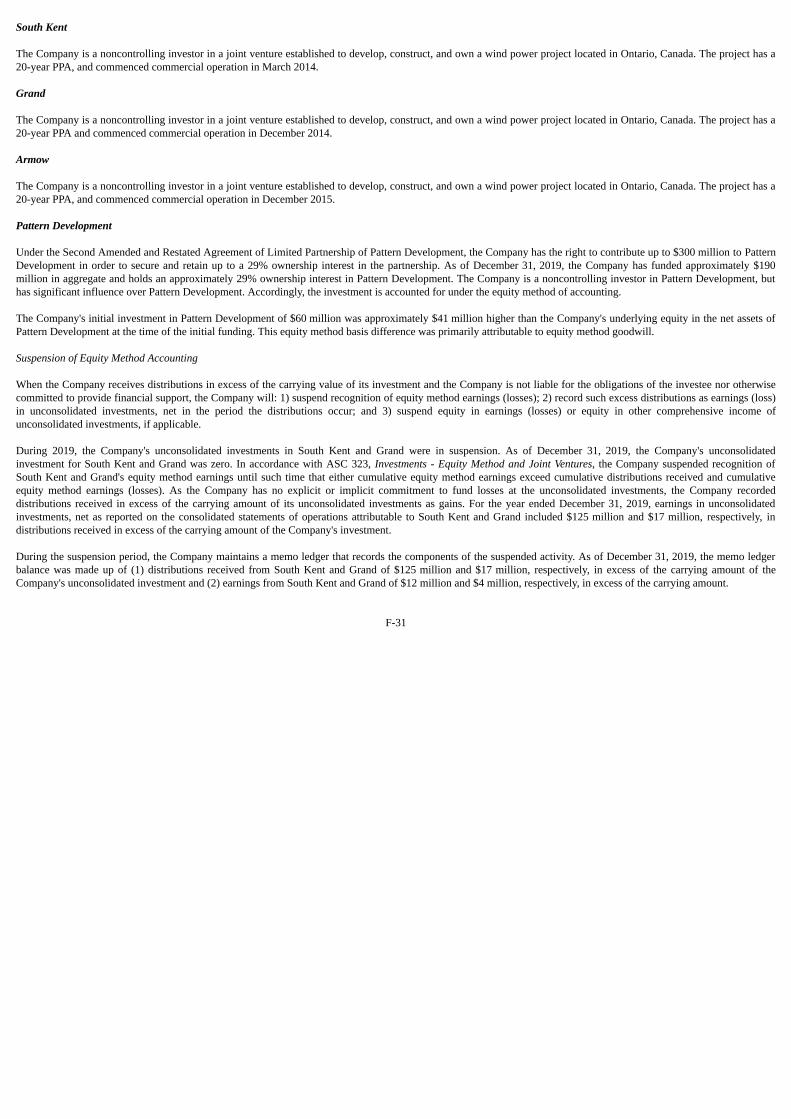
South Kent
The Company is a noncontrolling investor in a joint venture established to develop, construct, and own a wind power project located in Ontario, Canada. The project has a20-year PPA, and commenced commercial operation in March 2014.
Grand
The Company is a noncontrolling investor in a joint venture established to develop, construct, and own a wind power project located in Ontario, Canada. The project has a20-year PPA and commenced commercial operation in December 2014.
Armow
The Company is a noncontrolling investor in a joint venture established to develop, construct, and own a wind power project located in Ontario, Canada. The project has a20-year PPA, and commenced commercial operation in December 2015.
Pattern Development
Under the Second Amended and Restated Agreement of Limited Partnership of Pattern Development, the Company has the right to contribute up to $300 million to PatternDevelopment in order to secure and retain up to a 29% ownership interest in the partnership. As of December 31, 2019, the Company has funded approximately $190million in aggregate and holds an approximately 29% ownership interest in Pattern Development. The Company is a noncontrolling investor in Pattern Development, buthas significant influence over Pattern Development. Accordingly, the investment is accounted for under the equity method of accounting.
The Company's initial investment in Pattern Development of $60 million was approximately $41 million higher than the Company's underlying equity in the net assets ofPattern Development at the time of the initial funding. This equity method basis difference was primarily attributable to equity method goodwill.
Suspension of Equity Method Accounting
When the Company receives distributions in excess of the carrying value of its investment and the Company is not liable for the obligations of the investee nor otherwisecommitted to provide financial support, the Company will: 1) suspend recognition of equity method earnings (losses); 2) record such excess distributions as earnings (loss)in unconsolidated investments, net in the period the distributions occur; and 3) suspend equity in earnings (losses) or equity in other comprehensive income ofunconsolidated investments, if applicable.
During 2019, the Company's unconsolidated investments in South Kent and Grand were in suspension. As of December 31, 2019, the Company's unconsolidatedinvestment for South Kent and Grand was zero. In accordance with ASC 323, Investments - Equity Method and Joint Ventures, the Company suspended recognition ofSouth Kent and Grand's equity method earnings until such time that either cumulative equity method earnings exceed cumulative distributions received and cumulativeequity method earnings (losses). As the Company has no explicit or implicit commitment to fund losses at the unconsolidated investments, the Company recordeddistributions received in excess of the carrying amount of its unconsolidated investments as gains. For the year ended December 31, 2019, earnings in unconsolidatedinvestments, net as reported on the consolidated statements of operations attributable to South Kent and Grand included $125 million and $17 million, respectively, indistributions received in excess of the carrying amount of the Company's investment.
During the suspension period, the Company maintains a memo ledger that records the components of the suspended activity. As of December 31, 2019, the memo ledgerbalance was made up of (1) distributions received from South Kent and Grand of $125 million and $17 million, respectively, in excess of the carrying amount of theCompany's unconsolidated investment and (2) earnings from South Kent and Grand of $12 million and $4 million, respectively, in excess of the carrying amount.
F-31

Basis Amortization of Unconsolidated Investments
The cost basis of the net assets of the investment may be different than the Company's proportional interest in the equity of the investee. On the acquisition date, theCompany determines the fair value of the identifiable assets and assumed liabilities in accordance with ASC 805, Business Combinations. The resulting fair values arecompared with the assets and liabilities recorded in the investee's financial statements, and the resulting difference is basis difference. Basis differences for the Company'sinvestments were primarily attributable to property, plant and equipment, PPAs, and equity method goodwill. The Company amortizes the basis difference attributable toproperty, plant and equipment, and PPAs over their useful life and contractual life, respectively. The Company does not amortize equity method goodwill. For the yearsended December 31, 2019, 2018 and 2017, the Company recorded basis difference amortization for its unconsolidated investments of approximately $7 million, $11 millionand $11 million, respectively, in earnings in unconsolidated investments, net on the consolidated statements of operations.
F-32
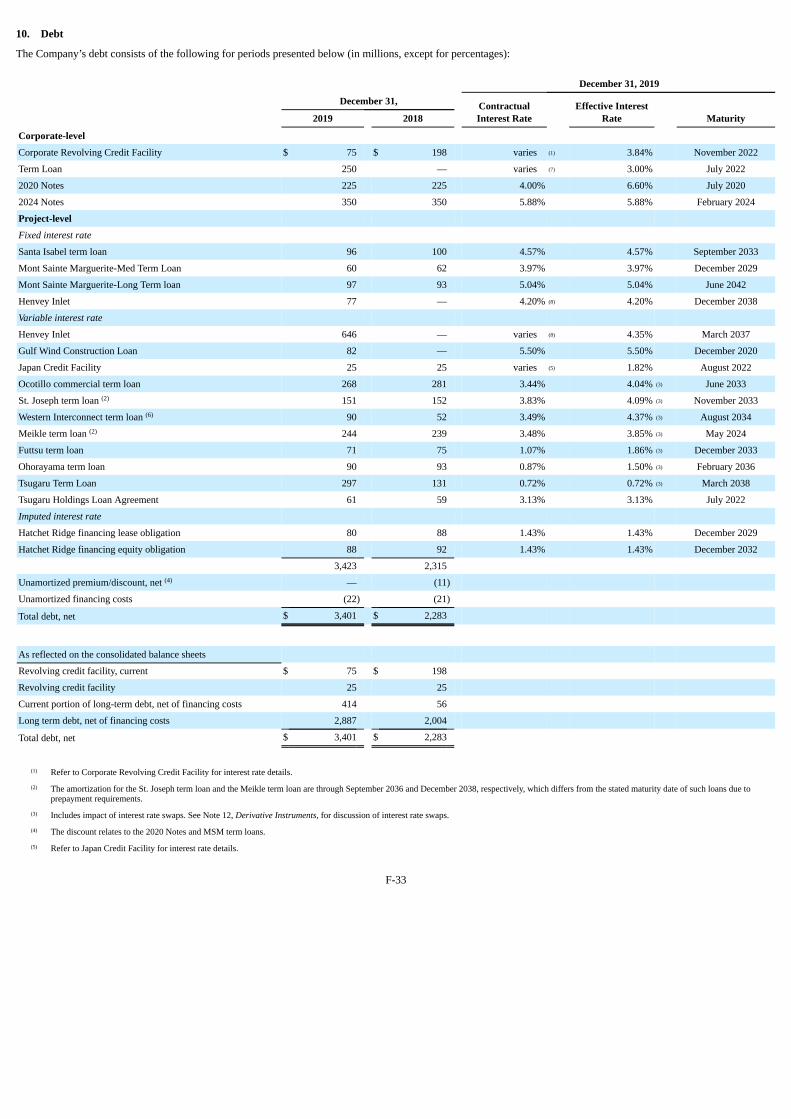
10. Debt
The Company’s debt consists of the following for periods presented below (in millions, except for percentages):
December 31, 2019
December 31, ContractualInterest Rate
Effective InterestRate
2019 2018 Maturity
Corporate-level Corporate Revolving Credit Facility $ 75 $ 198 varies (1) 3.84% November 2022
Term Loan 250 — varies (7) 3.00% July 2022
2020 Notes 225 225 4.00% 6.60% July 2020
2024 Notes 350 350 5.88% 5.88% February 2024
Project-level Fixed interest rate Santa Isabel term loan 96 100 4.57% 4.57% September 2033
Mont Sainte Marguerite-Med Term Loan 60 62 3.97% 3.97% December 2029
Mont Sainte Marguerite-Long Term loan 97 93 5.04% 5.04% June 2042
Henvey Inlet 77 — 4.20% (8) 4.20% December 2038
Variable interest rate Henvey Inlet 646 — varies (8) 4.35% March 2037
Gulf Wind Construction Loan 82 — 5.50% 5.50% December 2020
Japan Credit Facility 25 25 varies (5) 1.82% August 2022
Ocotillo commercial term loan 268 281 3.44% 4.04% (3) June 2033
St. Joseph term loan (2) 151 152 3.83% 4.09% (3) November 2033
Western Interconnect term loan (6) 90 52 3.49% 4.37% (3) August 2034
Meikle term loan (2) 244 239 3.48% 3.85% (3) May 2024
Futtsu term loan 71 75 1.07% 1.86% (3) December 2033
Ohorayama term loan 90 93 0.87% 1.50% (3) February 2036
Tsugaru Term Loan 297 131 0.72% 0.72% (3) March 2038
Tsugaru Holdings Loan Agreement 61 59 3.13% 3.13% July 2022
Imputed interest rate Hatchet Ridge financing lease obligation 80 88 1.43% 1.43% December 2029
Hatchet Ridge financing equity obligation 88 92 1.43% 1.43% December 2032
3,423 2,315 Unamortized premium/discount, net (4) — (11) Unamortized financing costs (22) (21) Total debt, net $ 3,401 $ 2,283
As reflected on the consolidated balance sheets Revolving credit facility, current $ 75 $ 198 Revolving credit facility 25 25 Current portion of long-term debt, net of financing costs 414 56 Long term debt, net of financing costs 2,887 2,004 Total debt, net $ 3,401 $ 2,283
(1) Refer to Corporate Revolving Credit Facility for interest rate details.(2) The amortization for the St. Joseph term loan and the Meikle term loan are through September 2036 and December 2038, respectively, which differs from the stated maturity date of such loans due to
prepayment requirements.(3) Includes impact of interest rate swaps. See Note 12, Derivative Instruments, for discussion of interest rate swaps.(4) The discount relates to the 2020 Notes and MSM term loans.(5) Refer to Japan Credit Facility for interest rate details.
F-33
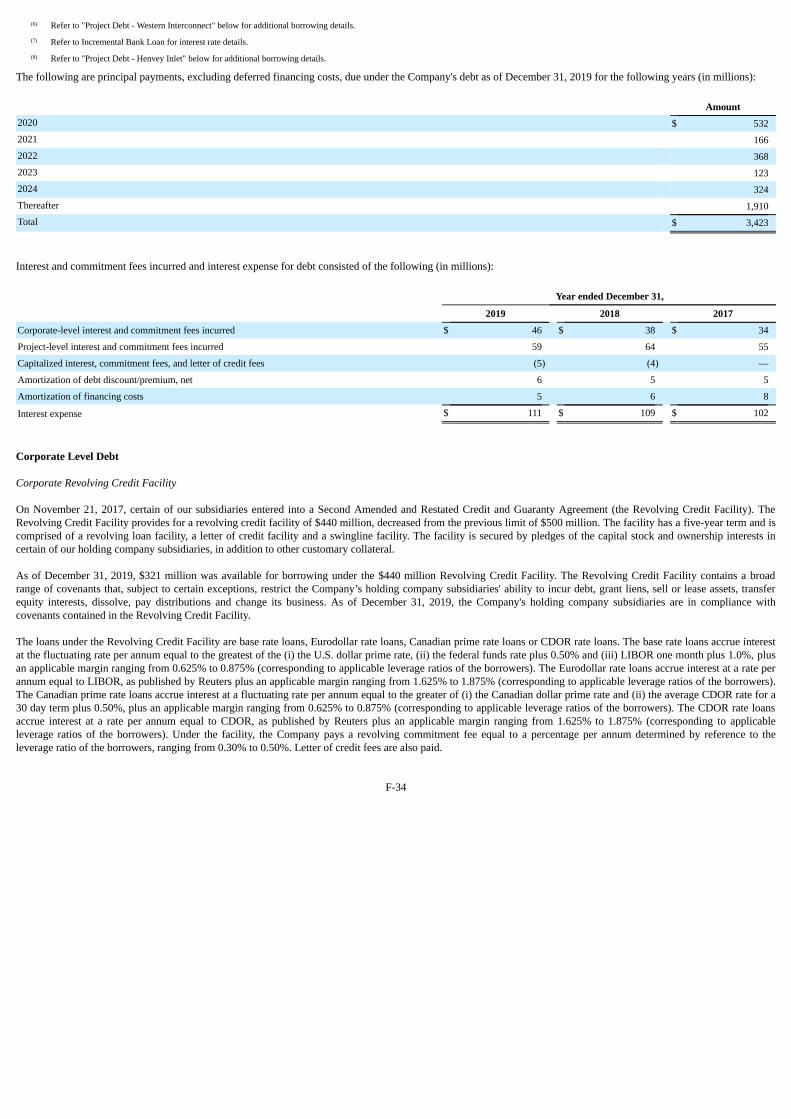
(6) Refer to "Project Debt - Western Interconnect" below for additional borrowing details.(7) Refer to Incremental Bank Loan for interest rate details.(8) Refer to "Project Debt - Henvey Inlet" below for additional borrowing details.
The following are principal payments, excluding deferred financing costs, due under the Company's debt as of December 31, 2019 for the following years (in millions):
Amount2020 $ 5322021 1662022 3682023 1232024 324Thereafter 1,910Total $ 3,423
Interest and commitment fees incurred and interest expense for debt consisted of the following (in millions):
Year ended December 31,
2019 2018 2017
Corporate-level interest and commitment fees incurred $ 46 $ 38 $ 34
Project-level interest and commitment fees incurred 59 64 55
Capitalized interest, commitment fees, and letter of credit fees (5) (4) —
Amortization of debt discount/premium, net 6 5 5
Amortization of financing costs 5 6 8
Interest expense $ 111 $ 109 $ 102
Corporate Level Debt
Corporate Revolving Credit Facility
On November 21, 2017, certain of our subsidiaries entered into a Second Amended and Restated Credit and Guaranty Agreement (the Revolving Credit Facility). TheRevolving Credit Facility provides for a revolving credit facility of $440 million, decreased from the previous limit of $500 million. The facility has a five-year term and iscomprised of a revolving loan facility, a letter of credit facility and a swingline facility. The facility is secured by pledges of the capital stock and ownership interests incertain of our holding company subsidiaries, in addition to other customary collateral.
As of December 31, 2019, $321 million was available for borrowing under the $440 million Revolving Credit Facility. The Revolving Credit Facility contains a broadrange of covenants that, subject to certain exceptions, restrict the Company’s holding company subsidiaries' ability to incur debt, grant liens, sell or lease assets, transferequity interests, dissolve, pay distributions and change its business. As of December 31, 2019, the Company's holding company subsidiaries are in compliance withcovenants contained in the Revolving Credit Facility.
The loans under the Revolving Credit Facility are base rate loans, Eurodollar rate loans, Canadian prime rate loans or CDOR rate loans. The base rate loans accrue interestat the fluctuating rate per annum equal to the greatest of the (i) the U.S. dollar prime rate, (ii) the federal funds rate plus 0.50% and (iii) LIBOR one month plus 1.0%, plusan applicable margin ranging from 0.625% to 0.875% (corresponding to applicable leverage ratios of the borrowers). The Eurodollar rate loans accrue interest at a rate perannum equal to LIBOR, as published by Reuters plus an applicable margin ranging from 1.625% to 1.875% (corresponding to applicable leverage ratios of the borrowers).The Canadian prime rate loans accrue interest at a fluctuating rate per annum equal to the greater of (i) the Canadian dollar prime rate and (ii) the average CDOR rate for a30 day term plus 0.50%, plus an applicable margin ranging from 0.625% to 0.875% (corresponding to applicable leverage ratios of the borrowers). The CDOR rate loansaccrue interest at a rate per annum equal to CDOR, as published by Reuters plus an applicable margin ranging from 1.625% to 1.875% (corresponding to applicableleverage ratios of the borrowers). Under the facility, the Company pays a revolving commitment fee equal to a percentage per annum determined by reference to theleverage ratio of the borrowers, ranging from 0.30% to 0.50%. Letter of credit fees are also paid.
F-34
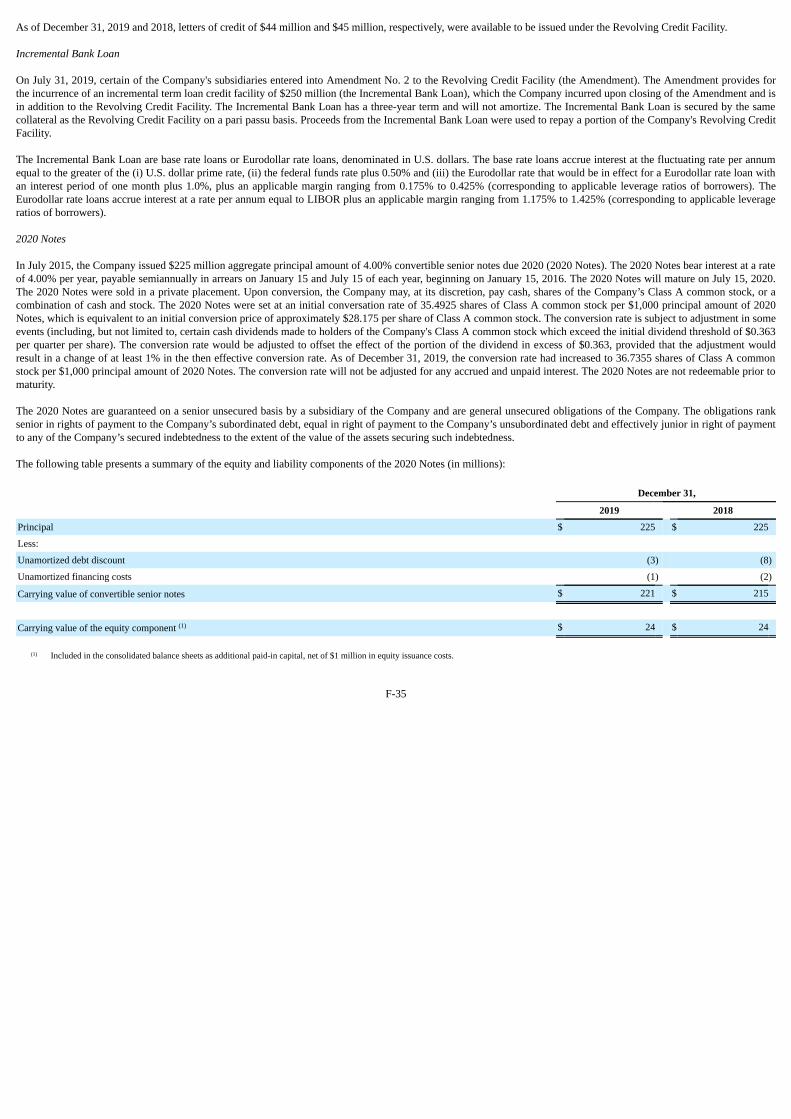
As of December 31, 2019 and 2018, letters of credit of $44 million and $45 million, respectively, were available to be issued under the Revolving Credit Facility.
Incremental Bank Loan
On July 31, 2019, certain of the Company's subsidiaries entered into Amendment No. 2 to the Revolving Credit Facility (the Amendment). The Amendment provides forthe incurrence of an incremental term loan credit facility of $250 million (the Incremental Bank Loan), which the Company incurred upon closing of the Amendment and isin addition to the Revolving Credit Facility. The Incremental Bank Loan has a three-year term and will not amortize. The Incremental Bank Loan is secured by the samecollateral as the Revolving Credit Facility on a pari passu basis. Proceeds from the Incremental Bank Loan were used to repay a portion of the Company's Revolving CreditFacility.
The Incremental Bank Loan are base rate loans or Eurodollar rate loans, denominated in U.S. dollars. The base rate loans accrue interest at the fluctuating rate per annumequal to the greater of the (i) U.S. dollar prime rate, (ii) the federal funds rate plus 0.50% and (iii) the Eurodollar rate that would be in effect for a Eurodollar rate loan withan interest period of one month plus 1.0%, plus an applicable margin ranging from 0.175% to 0.425% (corresponding to applicable leverage ratios of borrowers). TheEurodollar rate loans accrue interest at a rate per annum equal to LIBOR plus an applicable margin ranging from 1.175% to 1.425% (corresponding to applicable leverageratios of borrowers).
2020 Notes
In July 2015, the Company issued $225 million aggregate principal amount of 4.00% convertible senior notes due 2020 (2020 Notes). The 2020 Notes bear interest at a rateof 4.00% per year, payable semiannually in arrears on January 15 and July 15 of each year, beginning on January 15, 2016. The 2020 Notes will mature on July 15, 2020.The 2020 Notes were sold in a private placement. Upon conversion, the Company may, at its discretion, pay cash, shares of the Company’s Class A common stock, or acombination of cash and stock. The 2020 Notes were set at an initial conversation rate of 35.4925 shares of Class A common stock per $1,000 principal amount of 2020Notes, which is equivalent to an initial conversion price of approximately $28.175 per share of Class A common stock. The conversion rate is subject to adjustment in someevents (including, but not limited to, certain cash dividends made to holders of the Company's Class A common stock which exceed the initial dividend threshold of $0.363per quarter per share). The conversion rate would be adjusted to offset the effect of the portion of the dividend in excess of $0.363, provided that the adjustment wouldresult in a change of at least 1% in the then effective conversion rate. As of December 31, 2019, the conversion rate had increased to 36.7355 shares of Class A commonstock per $1,000 principal amount of 2020 Notes. The conversion rate will not be adjusted for any accrued and unpaid interest. The 2020 Notes are not redeemable prior tomaturity.
The 2020 Notes are guaranteed on a senior unsecured basis by a subsidiary of the Company and are general unsecured obligations of the Company. The obligations ranksenior in rights of payment to the Company’s subordinated debt, equal in right of payment to the Company’s unsubordinated debt and effectively junior in right of paymentto any of the Company’s secured indebtedness to the extent of the value of the assets securing such indebtedness.
The following table presents a summary of the equity and liability components of the 2020 Notes (in millions):
December 31,
2019 2018
Principal $ 225 $ 225
Less: Unamortized debt discount (3) (8)
Unamortized financing costs (1) (2)
Carrying value of convertible senior notes $ 221 $ 215
Carrying value of the equity component (1) $ 24 $ 24
(1) Included in the consolidated balance sheets as additional paid-in capital, net of $1 million in equity issuance costs.
F-35

Project Debt
The Company typically finances its wind projects through project entity specific debt secured by each project's assets with no recourse to the Company. Typically, thesefinancing arrangements provide for a construction loan, which upon completion may be converted into a term loan or repaid through capital contributions from theCompany and tax equity investors.
Collateral for project level facilities typically include each project's tangible assets and contractual rights and cash on deposit with the depository agents. Each loanagreement contains a broad range of covenants that, subject to certain exceptions, restrict each project's ability to incur debt, grant liens, sell or lease certain assets, transferequity interests, dissolve, make distributions and change their business. As of December 31, 2019, all projects were in compliance with their financing covenants.
Henvey Inlet
In October 2019, the Company acquired Henvey Inlet, which included the acquisition of all outstanding balances of a term-converted construction loan facility that consistsof a floating-rate tranche and a fixed-rate tranche. The Company did not acquire the letter of credit facility, which was a component of Henvey Inlet's construction creditfacility. At December 31, 2019, outstanding borrowings under the floating-rate tranche was $646 million and outstanding borrowings under the fixed-rate tranche was $77million . The floating rate tranche bears interest at CDOR plus an applicable margin between 1.625% and 2.25% and matures on March 31, 2037. The fixed rate tranchebears interest at 4.20% and matures on December 31, 2038.
Gulf Wind
In September 2019, Gulf Wind entered into a non-amortizing short-term bridge loan (Gulf Bridge Loan) of $22 million. The Gulf Bridge Loan matures on or before theearliest to occur of December 31, 2019 or the date additional project financing has been secured. On December 30, 2019, Gulf Wind entered into a financing agreement fora construction loan for up to $270 million of borrowings to fund Gulf Wind's repowering (Gulf Wind Construction Loan) and bears interest at LIBOR plus 0.75%. Initialfunds received from the Gulf Wind Construction Loan were used to repay the Gulf Bridge Loan. The Gulf Wind Construction Loan matures on September 20, 2020 butmay be extended to December 31, 2020. As of December 31, 2019, outstanding borrowings under the Gulf Wind Construction Loan were $82 million.
Western Interconnect
In December 2018, the Company refinanced Western Interconnect project's term loan of $52 million along with an associated letter of credit of $4 million and entered intoa new term loan with a total loan capacity of $90 million expected to mature in August 2034 with an associated letter of credit of $5 million. The incremental borrowing of$38 million occurred during the second quarter of 2019. The refinancing was treated as an extinguishment of debt for which the Company recognized a loss onextinguishment of debt of $2 million in other income (expense), net on the consolidated statements of operations for the year ended December 31, 2018. The $2 million losson extinguishment includes $1 million paid to existing lenders. As of December 31, 2019, outstanding borrowings under this term loan were $90 million.
Spring Valley
In December 2018, the Company prepaid 100% of the outstanding balance of the Spring Valley project's term loan of $119 million. A $4 million loss on the debtextinguishment was recorded in other income (expense), net in the consolidated statements of operations, primarily due to expensing previously recorded amounts indeferred financing costs. As a result of the early extinguishment of debt, the Company lost its cash flow hedge accounting treatment on the related interest rate swaps. SeeNote 12, Derivative Instruments, for additional information.
Japan Credit Facility
In August 2018, GPG entered into a credit agreement for a revolving credit facility (the Japan Credit Facility). Under the Japan Credit Facility, GPG may borrow up to $32million and the Japan Credit Facility matures in August 2022. The base rate is based on the Japan Credit Facility Tokyo Interbank Offered Rate (TIBOR) plus an applicablemargin between 1.75% and 2.25% plus an annual commitment fee of 0.30%. As of December 31, 2019, $7 million was available for borrowing.
F-36

Tsugaru Facility
In March 2018, Tsugaru entered into a credit agreement for a construction facility (Tsugaru Construction Loan), a term facility, a letter of credit facility (the LC Facility)and a Japanese consumption tax facility (the JCT Facility) (collectively, the Tsugaru Facility). Under the Tsugaru Facility, up to $371 million may be borrowed to fund theconstruction of Tsugaru which automatically converts to a term facility upon the earlier of completion of construction of the project (expected to be March 2020) orSeptember 2020 (the Term Conversion Date). The Tsugaru Construction Loan, including the term facility and LC Facility, mature 18 years following the Term ConversionDate, not later than March 2039. The interest rate on the Tsugaru Construction Loan and term facility is TIBOR plus 0.65%. The LC Facility establishes a $20 million debtservice reserve account letter of credit and an $8 million operations and maintenance reserve account letter of credit with amounts outstanding under the letters of creditowing interest at a rate of 1.10% and fees on the undrawn amounts of 0.30%. The JCT Facility provides for up to $34 million to pay Japanese consumption taxes arisingfrom payment of project costs, with an interest rate of TIBOR plus 0.30% and a maturity date corresponding to the Term Conversion Date. A commitment fee of 0.3% isowed on any available amounts under the Construction Facility and the JCT Facility and on any undrawn amounts on the letters of credit up to the Term Conversion Date.Collateral for the credit facility includes Tsugaru's tangible assets and contractual rights and cash on deposit with the depository agent. The credit agreement contains abroad range of covenants that, subject to certain exceptions, restrict Tsugaru's ability to incur debt, grant liens, sell or lease certain assets, transfer equity interests, dissolve,make distributions or change its business. As of December 31, 2019, outstanding borrowings under the Tsugaru Construction Loan totaled $297 million.
Tsugaru Holdings Loan Agreement
In March 2018, Tsugaru Holdings entered into a loan agreement (Tsugaru Holdings Loan Agreement) that provides for borrowings of up to $70 million during the Tsugaruconstruction period, until no later than September 2020. The interest rate on outstanding borrowings under the Tsugaru Holdings Loan Agreement is TIBOR plus 3.0% withprincipal due July 2022 and a commitment fee of 0.50% on the unused portion of the Tsugaru Holdings Loan Agreement. The Tsugaru Holdings Loan Agreement is subjectto certain covenants and is secured by the membership interests and other rights. As of December 31, 2019, outstanding borrowings under the Tsugaru Holdings LoanAgreement totaled $61 million.
Financing Lease Obligations
In December 2010, Hatchet Ridge entered into a sale-leaseback agreement to finance the project facility for 22 years. The Company evaluated the agreement in accordancewith ASC 840 and ASC 360, Property Plant and Equipment, and determined that due to continuing involvement with the project facility, the Company is precluded fromtreating the agreement as a sale-lease back transaction and accounts for the agreement as a financing lease obligation. The Company's historical accounting for thistransaction was not impacted when the Company adopted ASC 842.
Collateral for the agreement includes Hatchet Ridge’s tangible assets and contractual rights and cash on deposit with the depository agent. Its loan agreement contains abroad range of covenants that, subject to certain exceptions, restrict Hatchet Ridge’s ability to incur debt, grant liens, sell or lease assets, transfer equity interests, dissolve,pay distributions and change its business.
Payments under the financing lease for the years ended December 31, 2019, 2018 and 2017, were $15 million, $15 million and $13 million, respectively.
Industrial Revenue Bonds
The acquisitions of Grady, Broadview and Western Interconnect provided for future property tax savings during the operational phase of the projects as a result of theissuance of industrial revenue bonds (IRB) by certain municipalities of the State of New Mexico (Municipalities).
Pursuant to each of the IRB-related agreements, titles to the projects transferred from the Company to the Municipalities and simultaneously leased back to the Company.Under each of the 30-year lease agreements with the Municipalities, the Company retains all benefits and risks of ownership of the projects and has a bargain purchaserequirement at the end of the lease term. Therefore, the Company is deemed the owner of the leased project assets.
F-37

The Company, as an indirect holder of the bond through its consolidated subsidiaries, earns interest at 4.5% per annum on any principal amounts advanced, receivableannually in arrears from the Municipalities. This interest income is directly offset by the lease payments which are due from the Company to the Municipalities at the sametime and in the same amount as the interest income earned on the IRB. Principal payments are not due to the Company prior to the IRB's maturity date; however, earlyredemption is permissible. As of December 31, 2019, the Company has investments in IRB receivables for $37 million which includes accrued interest of $1 million forGrady, Broadview and Western Interconnect. Under terms of each IRB transaction, there is a contractual right of offset for the payments receivable under the IRB,including interest income, with the Company's lease payments to the Municipalities. The receivable and payments are due at the same time and as such, no cash paymentsare made by either party. As a result, the Company has netted the IRB receivable asset of $37 million with the related lease liability of $37 million, which includes $1million of lease expense, within the consolidated balance sheets.
11. Asset Retirement Obligations
The Company’s asset retirement obligations represent the estimated cost of decommissioning the turbines, removing above-ground installations and restoring sites at theend of their estimated economic useful life.
In the third quarter of 2018, the Company committed to a plan to re-power its Gulf Wind project by the end of 2020. In connection with the decision to repower the facilityand accelerate decommissioning of the existing facilities, the Company received updated cost information. This initiated a new decommissioning cost study for which theCompany revised its estimated future cash flows to reflect the updated costs and timing for its asset retirement obligations. The Company recognized the revision byincreasing the carrying amount of the liability for the asset retirement obligation and the carrying amount of the related property, plant and equipment. The change inestimate did not result in any charge to net income (loss) for the year ended December 31, 2018.
The following table presents a reconciliation of the beginning and ending aggregate carrying amounts of asset retirement obligations (in millions):
December 31,
2019 2018Beginning asset retirement obligations $ 209 $ 57
Net additions during the year (1) 49 67Foreign currency translation adjustment 1 (2)Divested operations — (3)Revision in estimated cash flows (4) 85Accretion expense 8 5
Ending asset retirement obligations $ 263 $ 209
(1) Reflects non-cash additions due to acquisitions and construction during the years ended December 31, 2019 and 2018. See Note 5, Acquisitions, for discussion of acquisitions.
12. Derivative Instruments
The Company employs a variety of derivative instruments to manage its exposure to fluctuations in electricity prices, interest rates and foreign currency exchange rates.Energy prices are subject to swings as supply and demand are impacted by, among many other unpredictable items, weather, market liquidity, generating facilityavailability, customer usage, storage, and transmission and transportation constraints. Interest rate risk exists primarily on variable-rate debt for which the cash flows varybased upon movement in interest rates. Additionally, the Company is exposed to foreign currency exchange rate risk primarily from its business operations in Canada andJapan. The Company’s objectives for holding these derivative instruments include reducing, eliminating and efficiently managing the economic impact of these exposuresas effectively as possible. The Company does not hedge all of its electricity price risk, interest rate risks, and foreign currency exchange rate risks, thereby exposing theunhedged portions to changes in market prices.
As of December 31, 2019, the Company had other energy-related contracts that did not meet the definition of a derivative instrument or qualified for the NPNS exceptionand were therefore exempt from fair value accounting treatment.
The following tables present the fair values of the Company's derivative instruments on a gross basis as reflected on the Company’s consolidated balance sheets (inmillions):
December 31, 2019
Derivative Assets Derivative Liabilities
Current Long-Term Current Long-Term
Fair Value of Designated Derivatives: Interest rate swaps $ — $ — $ 11 $ 84
Fair Value of Undesignated Derivatives: Foreign currency forward contracts 2 8 1 —
Embedded derivative — — — 19
Congestion revenue rights 1 — — —
Total Fair Value $ 3 $ 8 $ 12 $ 103
December 31, 2018
Derivative Assets Derivative Liabilities
Current Long-Term Current Long-Term
Fair Value of Designated Derivatives: Interest rate swaps $ — $ 3 $ 2 $ 25
Fair Value of Undesignated Derivatives: Interest rate swaps — — — 4
Energy derivative 7 — — —
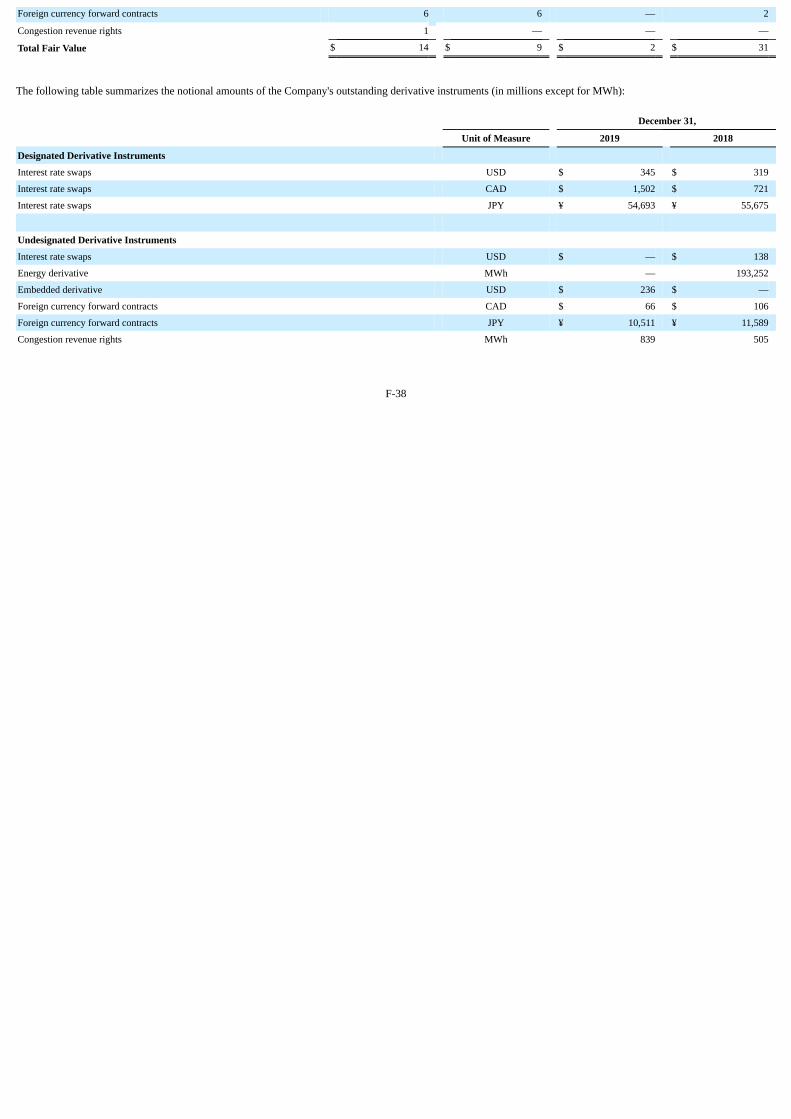
Foreign currency forward contracts 6 6 — 2
Congestion revenue rights 1 — — —
Total Fair Value $ 14 $ 9 $ 2 $ 31
The following table summarizes the notional amounts of the Company's outstanding derivative instruments (in millions except for MWh):
December 31,
Unit of Measure 2019 2018
Designated Derivative Instruments Interest rate swaps USD $ 345 $ 319
Interest rate swaps CAD $ 1,502 $ 721
Interest rate swaps JPY ¥ 54,693 ¥ 55,675
Undesignated Derivative Instruments Interest rate swaps USD $ — $ 138
Energy derivative MWh — 193,252
Embedded derivative USD $ 236 $ —
Foreign currency forward contracts CAD $ 66 $ 106
Foreign currency forward contracts JPY ¥ 10,511 ¥ 11,589
Congestion revenue rights MWh 839 505
F-38
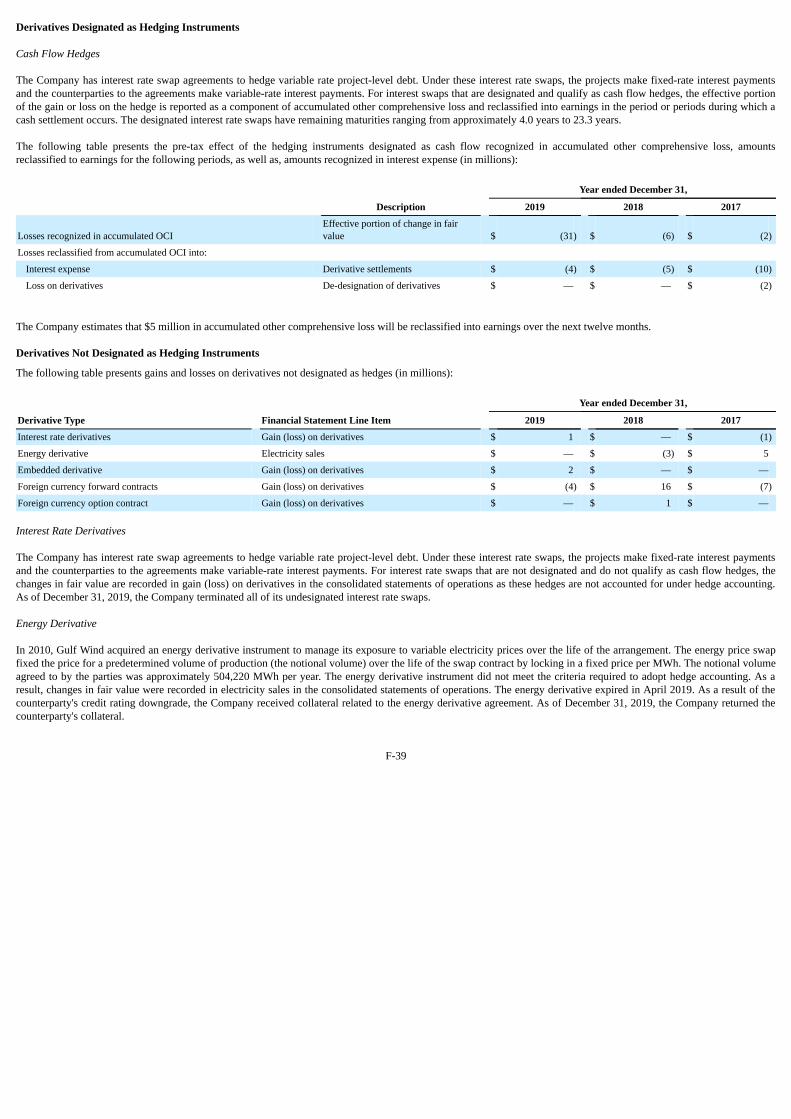
Derivatives Designated as Hedging Instruments
Cash Flow Hedges
The Company has interest rate swap agreements to hedge variable rate project-level debt. Under these interest rate swaps, the projects make fixed-rate interest paymentsand the counterparties to the agreements make variable-rate interest payments. For interest swaps that are designated and qualify as cash flow hedges, the effective portionof the gain or loss on the hedge is reported as a component of accumulated other comprehensive loss and reclassified into earnings in the period or periods during which acash settlement occurs. The designated interest rate swaps have remaining maturities ranging from approximately 4.0 years to 23.3 years.
The following table presents the pre-tax effect of the hedging instruments designated as cash flow recognized in accumulated other comprehensive loss, amountsreclassified to earnings for the following periods, as well as, amounts recognized in interest expense (in millions):
Year ended December 31,
Description 2019 2018 2017
Losses recognized in accumulated OCI Effective portion of change in fairvalue $ (31) $ (6) $ (2)
Losses reclassified from accumulated OCI into: Interest expense Derivative settlements $ (4) $ (5) $ (10)
Loss on derivatives De-designation of derivatives $ — $ — $ (2)
The Company estimates that $5 million in accumulated other comprehensive loss will be reclassified into earnings over the next twelve months.
Derivatives Not Designated as Hedging Instruments
The following table presents gains and losses on derivatives not designated as hedges (in millions):
Year ended December 31,
Derivative Type Financial Statement Line Item 2019 2018 2017
Interest rate derivatives Gain (loss) on derivatives $ 1 $ — $ (1)
Energy derivative Electricity sales $ — $ (3) $ 5
Embedded derivative Gain (loss) on derivatives $ 2 $ — $ —
Foreign currency forward contracts Gain (loss) on derivatives $ (4) $ 16 $ (7)
Foreign currency option contract Gain (loss) on derivatives $ — $ 1 $ —
Interest Rate Derivatives
The Company has interest rate swap agreements to hedge variable rate project-level debt. Under these interest rate swaps, the projects make fixed-rate interest paymentsand the counterparties to the agreements make variable-rate interest payments. For interest rate swaps that are not designated and do not qualify as cash flow hedges, thechanges in fair value are recorded in gain (loss) on derivatives in the consolidated statements of operations as these hedges are not accounted for under hedge accounting.As of December 31, 2019, the Company terminated all of its undesignated interest rate swaps.
Energy Derivative
In 2010, Gulf Wind acquired an energy derivative instrument to manage its exposure to variable electricity prices over the life of the arrangement. The energy price swapfixed the price for a predetermined volume of production (the notional volume) over the life of the swap contract by locking in a fixed price per MWh. The notional volumeagreed to by the parties was approximately 504,220 MWh per year. The energy derivative instrument did not meet the criteria required to adopt hedge accounting. As aresult, changes in fair value were recorded in electricity sales in the consolidated statements of operations. The energy derivative expired in April 2019. As a result of thecounterparty's credit rating downgrade, the Company received collateral related to the energy derivative agreement. As of December 31, 2019, the Company returned thecounterparty's collateral.
F-39
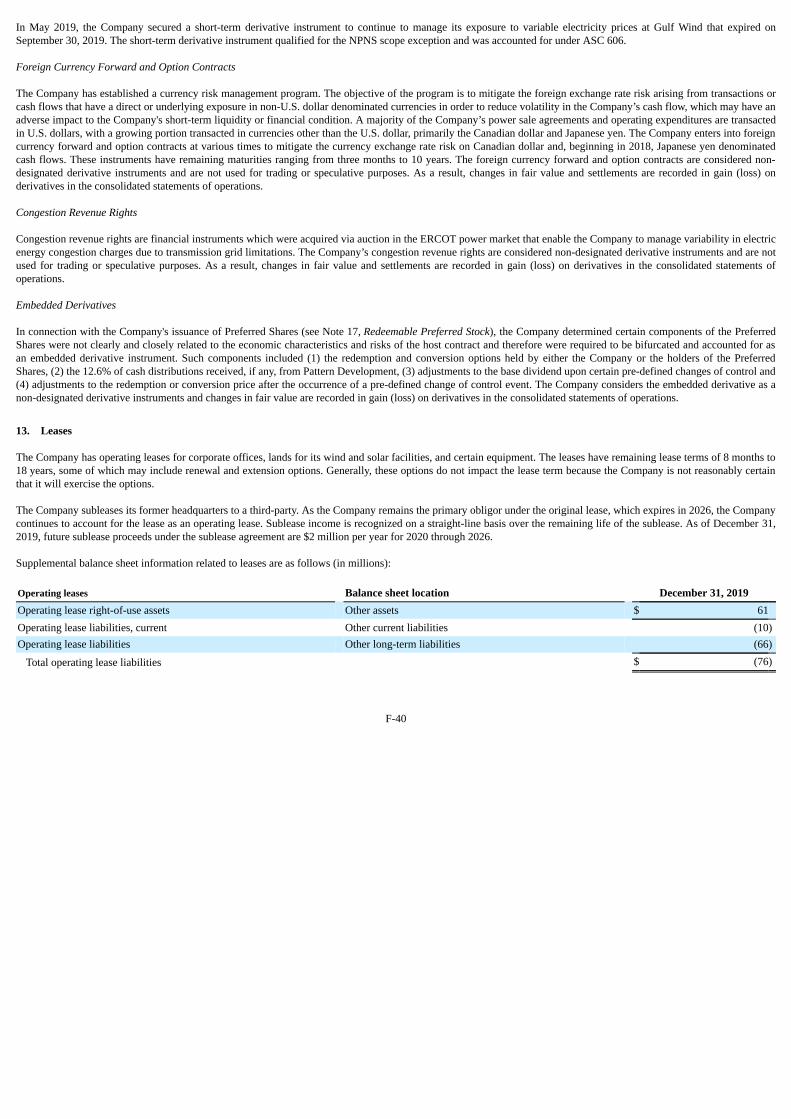
In May 2019, the Company secured a short-term derivative instrument to continue to manage its exposure to variable electricity prices at Gulf Wind that expired onSeptember 30, 2019. The short-term derivative instrument qualified for the NPNS scope exception and was accounted for under ASC 606.
Foreign Currency Forward and Option Contracts
The Company has established a currency risk management program. The objective of the program is to mitigate the foreign exchange rate risk arising from transactions orcash flows that have a direct or underlying exposure in non-U.S. dollar denominated currencies in order to reduce volatility in the Company’s cash flow, which may have anadverse impact to the Company's short-term liquidity or financial condition. A majority of the Company’s power sale agreements and operating expenditures are transactedin U.S. dollars, with a growing portion transacted in currencies other than the U.S. dollar, primarily the Canadian dollar and Japanese yen. The Company enters into foreigncurrency forward and option contracts at various times to mitigate the currency exchange rate risk on Canadian dollar and, beginning in 2018, Japanese yen denominatedcash flows. These instruments have remaining maturities ranging from three months to 10 years. The foreign currency forward and option contracts are considered non-designated derivative instruments and are not used for trading or speculative purposes. As a result, changes in fair value and settlements are recorded in gain (loss) onderivatives in the consolidated statements of operations.
Congestion Revenue Rights
Congestion revenue rights are financial instruments which were acquired via auction in the ERCOT power market that enable the Company to manage variability in electricenergy congestion charges due to transmission grid limitations. The Company’s congestion revenue rights are considered non-designated derivative instruments and are notused for trading or speculative purposes. As a result, changes in fair value and settlements are recorded in gain (loss) on derivatives in the consolidated statements ofoperations.
Embedded Derivatives
In connection with the Company's issuance of Preferred Shares (see Note 17, Redeemable Preferred Stock), the Company determined certain components of the PreferredShares were not clearly and closely related to the economic characteristics and risks of the host contract and therefore were required to be bifurcated and accounted for asan embedded derivative instrument. Such components included (1) the redemption and conversion options held by either the Company or the holders of the PreferredShares, (2) the 12.6% of cash distributions received, if any, from Pattern Development, (3) adjustments to the base dividend upon certain pre-defined changes of control and(4) adjustments to the redemption or conversion price after the occurrence of a pre-defined change of control event. The Company considers the embedded derivative as anon-designated derivative instruments and changes in fair value are recorded in gain (loss) on derivatives in the consolidated statements of operations.
13. Leases
The Company has operating leases for corporate offices, lands for its wind and solar facilities, and certain equipment. The leases have remaining lease terms of 8 months to18 years, some of which may include renewal and extension options. Generally, these options do not impact the lease term because the Company is not reasonably certainthat it will exercise the options.
The Company subleases its former headquarters to a third-party. As the Company remains the primary obligor under the original lease, which expires in 2026, the Companycontinues to account for the lease as an operating lease. Sublease income is recognized on a straight-line basis over the remaining life of the sublease. As of December 31,2019, future sublease proceeds under the sublease agreement are $2 million per year for 2020 through 2026.
Supplemental balance sheet information related to leases are as follows (in millions):
Operating leases Balance sheet location December 31, 2019Operating lease right-of-use assets Other assets $ 61Operating lease liabilities, current Other current liabilities (10)Operating lease liabilities Other long-term liabilities (66)
Total operating lease liabilities $ (76)
F-40
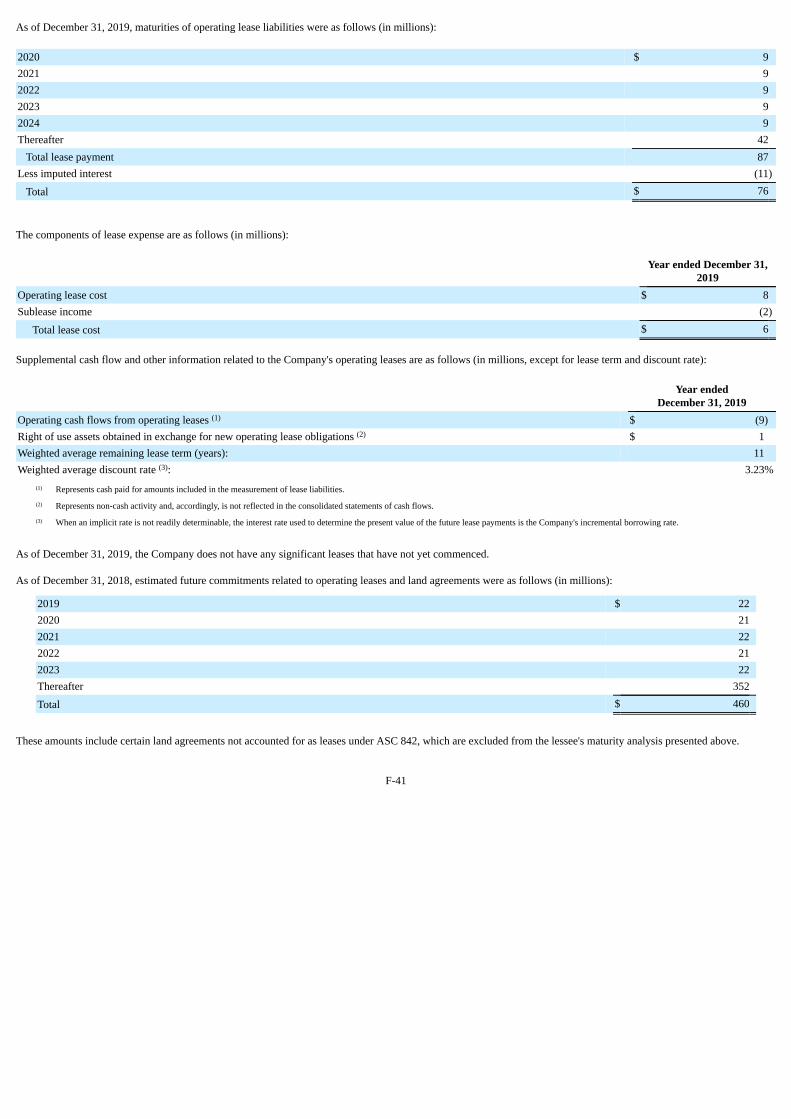
As of December 31, 2019, maturities of operating lease liabilities were as follows (in millions):
2020 $ 92021 92022 92023 92024 9Thereafter 42
Total lease payment 87Less imputed interest (11)
Total $ 76
The components of lease expense are as follows (in millions):
Year ended December 31,
2019Operating lease cost $ 8Sublease income (2)
Total lease cost $ 6
Supplemental cash flow and other information related to the Company's operating leases are as follows (in millions, except for lease term and discount rate):
Year ended
December 31, 2019Operating cash flows from operating leases (1) $ (9)Right of use assets obtained in exchange for new operating lease obligations (2) $ 1Weighted average remaining lease term (years): 11Weighted average discount rate (3): 3.23%
(1) Represents cash paid for amounts included in the measurement of lease liabilities.(2) Represents non-cash activity and, accordingly, is not reflected in the consolidated statements of cash flows.(3) When an implicit rate is not readily determinable, the interest rate used to determine the present value of the future lease payments is the Company's incremental borrowing rate.
As of December 31, 2019, the Company does not have any significant leases that have not yet commenced.
As of December 31, 2018, estimated future commitments related to operating leases and land agreements were as follows (in millions):
2019 $ 222020 212021 222022 212023 22Thereafter 352
Total $ 460
These amounts include certain land agreements not accounted for as leases under ASC 842, which are excluded from the lessee's maturity analysis presented above.
F-41
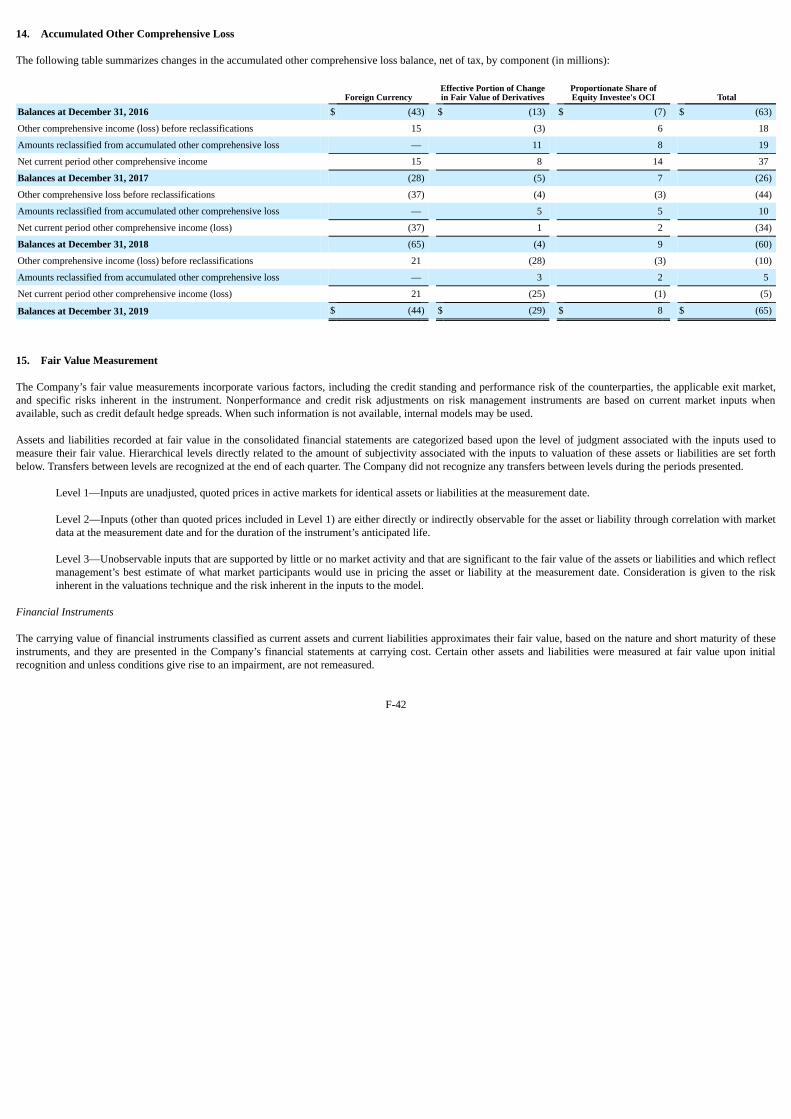
14. Accumulated Other Comprehensive Loss
The following table summarizes changes in the accumulated other comprehensive loss balance, net of tax, by component (in millions):
Foreign Currency Effective Portion of Changein Fair Value of Derivatives
Proportionate Share ofEquity Investee's OCI Total
Balances at December 31, 2016 $ (43) $ (13) $ (7) $ (63)
Other comprehensive income (loss) before reclassifications 15 (3) 6 18
Amounts reclassified from accumulated other comprehensive loss — 11 8 19
Net current period other comprehensive income 15 8 14 37
Balances at December 31, 2017 (28) (5) 7 (26)
Other comprehensive loss before reclassifications (37) (4) (3) (44)
Amounts reclassified from accumulated other comprehensive loss — 5 5 10
Net current period other comprehensive income (loss) (37) 1 2 (34)
Balances at December 31, 2018 (65) (4) 9 (60)
Other comprehensive income (loss) before reclassifications 21 (28) (3) (10)
Amounts reclassified from accumulated other comprehensive loss — 3 2 5
Net current period other comprehensive income (loss) 21 (25) (1) (5)
Balances at December 31, 2019 $ (44) $ (29) $ 8 $ (65)
15. Fair Value Measurement
The Company’s fair value measurements incorporate various factors, including the credit standing and performance risk of the counterparties, the applicable exit market,and specific risks inherent in the instrument. Nonperformance and credit risk adjustments on risk management instruments are based on current market inputs whenavailable, such as credit default hedge spreads. When such information is not available, internal models may be used.
Assets and liabilities recorded at fair value in the consolidated financial statements are categorized based upon the level of judgment associated with the inputs used tomeasure their fair value. Hierarchical levels directly related to the amount of subjectivity associated with the inputs to valuation of these assets or liabilities are set forthbelow. Transfers between levels are recognized at the end of each quarter. The Company did not recognize any transfers between levels during the periods presented.
Level 1—Inputs are unadjusted, quoted prices in active markets for identical assets or liabilities at the measurement date.
Level 2—Inputs (other than quoted prices included in Level 1) are either directly or indirectly observable for the asset or liability through correlation with marketdata at the measurement date and for the duration of the instrument’s anticipated life.
Level 3—Unobservable inputs that are supported by little or no market activity and that are significant to the fair value of the assets or liabilities and which reflectmanagement’s best estimate of what market participants would use in pricing the asset or liability at the measurement date. Consideration is given to the riskinherent in the valuations technique and the risk inherent in the inputs to the model.
Financial Instruments
The carrying value of financial instruments classified as current assets and current liabilities approximates their fair value, based on the nature and short maturity of theseinstruments, and they are presented in the Company’s financial statements at carrying cost. Certain other assets and liabilities were measured at fair value upon initialrecognition and unless conditions give rise to an impairment, are not remeasured.
F-42
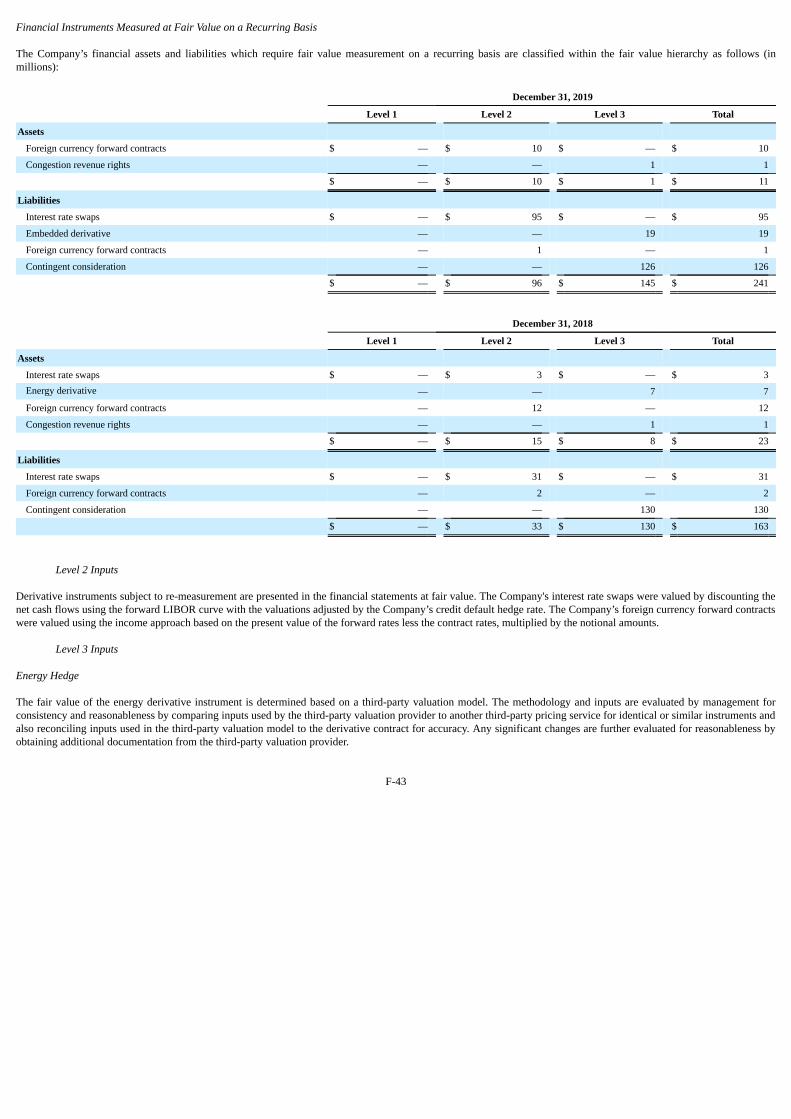
Financial Instruments Measured at Fair Value on a Recurring Basis
The Company’s financial assets and liabilities which require fair value measurement on a recurring basis are classified within the fair value hierarchy as follows (inmillions):
December 31, 2019
Level 1 Level 2 Level 3 Total
Assets Foreign currency forward contracts $ — $ 10 $ — $ 10
Congestion revenue rights — — 1 1
$ — $ 10 $ 1 $ 11
Liabilities Interest rate swaps $ — $ 95 $ — $ 95
Embedded derivative — — 19 19
Foreign currency forward contracts — 1 — 1
Contingent consideration — — 126 126
$ — $ 96 $ 145 $ 241
December 31, 2018
Level 1 Level 2 Level 3 Total
Assets Interest rate swaps $ — $ 3 $ — $ 3Energy derivative — — 7 7
Foreign currency forward contracts — 12 — 12
Congestion revenue rights — — 1 1
$ — $ 15 $ 8 $ 23
Liabilities Interest rate swaps $ — $ 31 $ — $ 31
Foreign currency forward contracts — 2 — 2
Contingent consideration — — 130 130
$ — $ 33 $ 130 $ 163
Level 2 Inputs
Derivative instruments subject to re-measurement are presented in the financial statements at fair value. The Company's interest rate swaps were valued by discounting thenet cash flows using the forward LIBOR curve with the valuations adjusted by the Company’s credit default hedge rate. The Company’s foreign currency forward contractswere valued using the income approach based on the present value of the forward rates less the contract rates, multiplied by the notional amounts.
Level 3 Inputs
Energy Hedge
The fair value of the energy derivative instrument is determined based on a third-party valuation model. The methodology and inputs are evaluated by management forconsistency and reasonableness by comparing inputs used by the third-party valuation provider to another third-party pricing service for identical or similar instruments andalso reconciling inputs used in the third-party valuation model to the derivative contract for accuracy. Any significant changes are further evaluated for reasonableness byobtaining additional documentation from the third-party valuation provider.
F-43
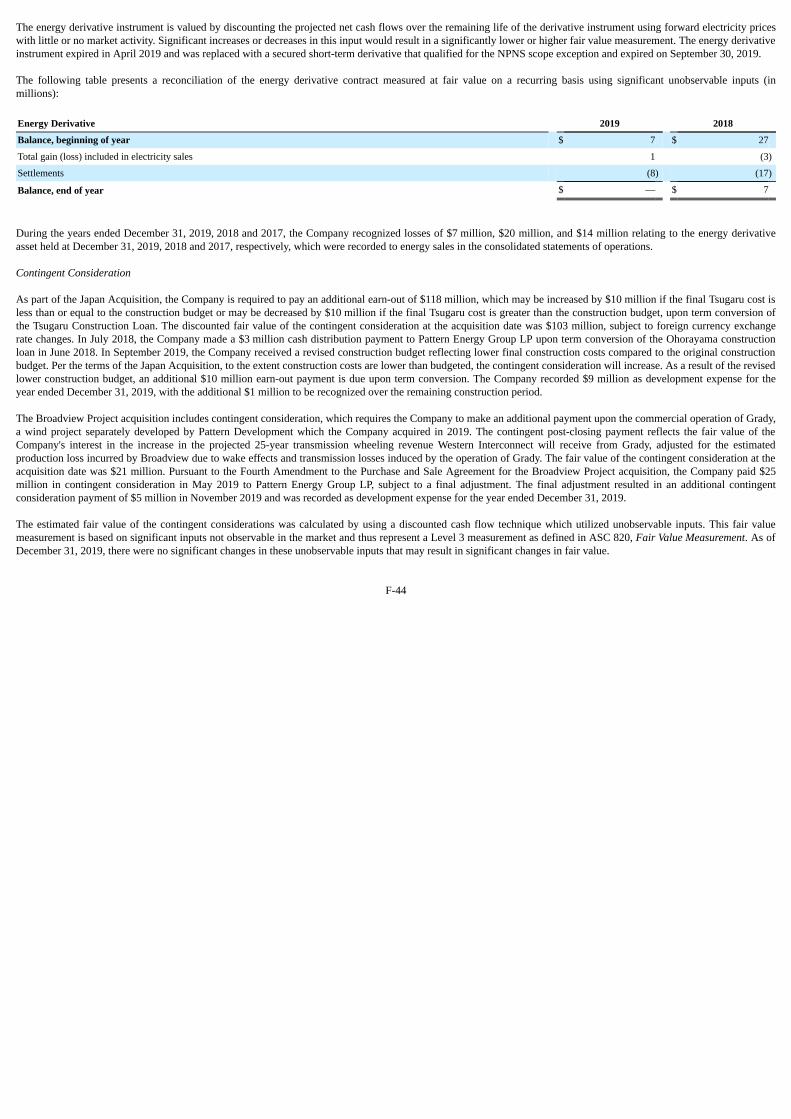
The energy derivative instrument is valued by discounting the projected net cash flows over the remaining life of the derivative instrument using forward electricity priceswith little or no market activity. Significant increases or decreases in this input would result in a significantly lower or higher fair value measurement. The energy derivativeinstrument expired in April 2019 and was replaced with a secured short-term derivative that qualified for the NPNS scope exception and expired on September 30, 2019.
The following table presents a reconciliation of the energy derivative contract measured at fair value on a recurring basis using significant unobservable inputs (inmillions):
Energy Derivative 2019 2018
Balance, beginning of year $ 7 $ 27
Total gain (loss) included in electricity sales 1 (3)
Settlements (8) (17)
Balance, end of year $ — $ 7
During the years ended December 31, 2019, 2018 and 2017, the Company recognized losses of $7 million, $20 million, and $14 million relating to the energy derivativeasset held at December 31, 2019, 2018 and 2017, respectively, which were recorded to energy sales in the consolidated statements of operations.
Contingent Consideration
As part of the Japan Acquisition, the Company is required to pay an additional earn-out of $118 million, which may be increased by $10 million if the final Tsugaru cost isless than or equal to the construction budget or may be decreased by $10 million if the final Tsugaru cost is greater than the construction budget, upon term conversion ofthe Tsugaru Construction Loan. The discounted fair value of the contingent consideration at the acquisition date was $103 million, subject to foreign currency exchangerate changes. In July 2018, the Company made a $3 million cash distribution payment to Pattern Energy Group LP upon term conversion of the Ohorayama constructionloan in June 2018. In September 2019, the Company received a revised construction budget reflecting lower final construction costs compared to the original constructionbudget. Per the terms of the Japan Acquisition, to the extent construction costs are lower than budgeted, the contingent consideration will increase. As a result of the revisedlower construction budget, an additional $10 million earn-out payment is due upon term conversion. The Company recorded $9 million as development expense for theyear ended December 31, 2019, with the additional $1 million to be recognized over the remaining construction period.
The Broadview Project acquisition includes contingent consideration, which requires the Company to make an additional payment upon the commercial operation of Grady,a wind project separately developed by Pattern Development which the Company acquired in 2019. The contingent post-closing payment reflects the fair value of theCompany's interest in the increase in the projected 25-year transmission wheeling revenue Western Interconnect will receive from Grady, adjusted for the estimatedproduction loss incurred by Broadview due to wake effects and transmission losses induced by the operation of Grady. The fair value of the contingent consideration at theacquisition date was $21 million. Pursuant to the Fourth Amendment to the Purchase and Sale Agreement for the Broadview Project acquisition, the Company paid $25million in contingent consideration in May 2019 to Pattern Energy Group LP, subject to a final adjustment. The final adjustment resulted in an additional contingentconsideration payment of $5 million in November 2019 and was recorded as development expense for the year ended December 31, 2019.
The estimated fair value of the contingent considerations was calculated by using a discounted cash flow technique which utilized unobservable inputs. This fair valuemeasurement is based on significant inputs not observable in the market and thus represent a Level 3 measurement as defined in ASC 820, Fair Value Measurement. As ofDecember 31, 2019, there were no significant changes in these unobservable inputs that may result in significant changes in fair value.
F-44
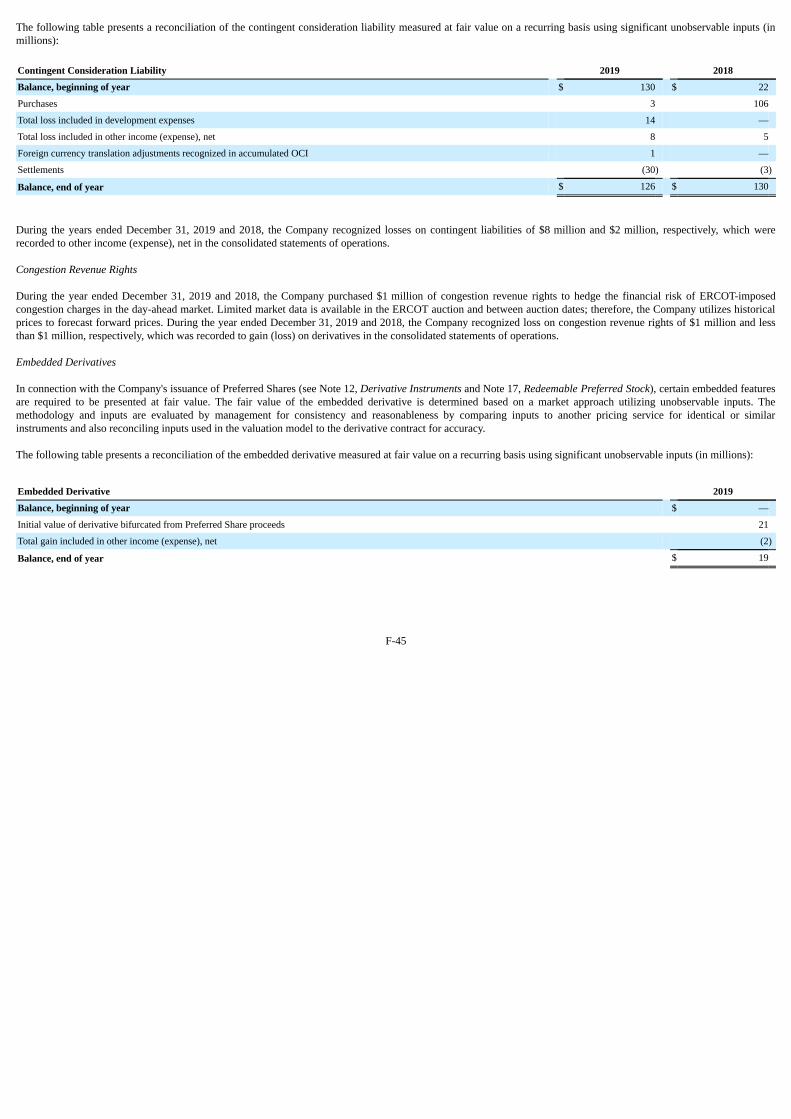
The following table presents a reconciliation of the contingent consideration liability measured at fair value on a recurring basis using significant unobservable inputs (inmillions):
Contingent Consideration Liability 2019 2018
Balance, beginning of year $ 130 $ 22
Purchases 3 106
Total loss included in development expenses 14 —
Total loss included in other income (expense), net 8 5
Foreign currency translation adjustments recognized in accumulated OCI 1 —
Settlements (30) (3)
Balance, end of year $ 126 $ 130
During the years ended December 31, 2019 and 2018, the Company recognized losses on contingent liabilities of $8 million and $2 million, respectively, which wererecorded to other income (expense), net in the consolidated statements of operations.
Congestion Revenue Rights
During the year ended December 31, 2019 and 2018, the Company purchased $1 million of congestion revenue rights to hedge the financial risk of ERCOT-imposedcongestion charges in the day-ahead market. Limited market data is available in the ERCOT auction and between auction dates; therefore, the Company utilizes historicalprices to forecast forward prices. During the year ended December 31, 2019 and 2018, the Company recognized loss on congestion revenue rights of $1 million and lessthan $1 million, respectively, which was recorded to gain (loss) on derivatives in the consolidated statements of operations.
Embedded Derivatives
In connection with the Company's issuance of Preferred Shares (see Note 12, Derivative Instruments and Note 17, Redeemable Preferred Stock), certain embedded featuresare required to be presented at fair value. The fair value of the embedded derivative is determined based on a market approach utilizing unobservable inputs. Themethodology and inputs are evaluated by management for consistency and reasonableness by comparing inputs to another pricing service for identical or similarinstruments and also reconciling inputs used in the valuation model to the derivative contract for accuracy.
The following table presents a reconciliation of the embedded derivative measured at fair value on a recurring basis using significant unobservable inputs (in millions):
Embedded Derivative 2019
Balance, beginning of year $ —
Initial value of derivative bifurcated from Preferred Share proceeds 21
Total gain included in other income (expense), net (2)
Balance, end of year $ 19
F-45
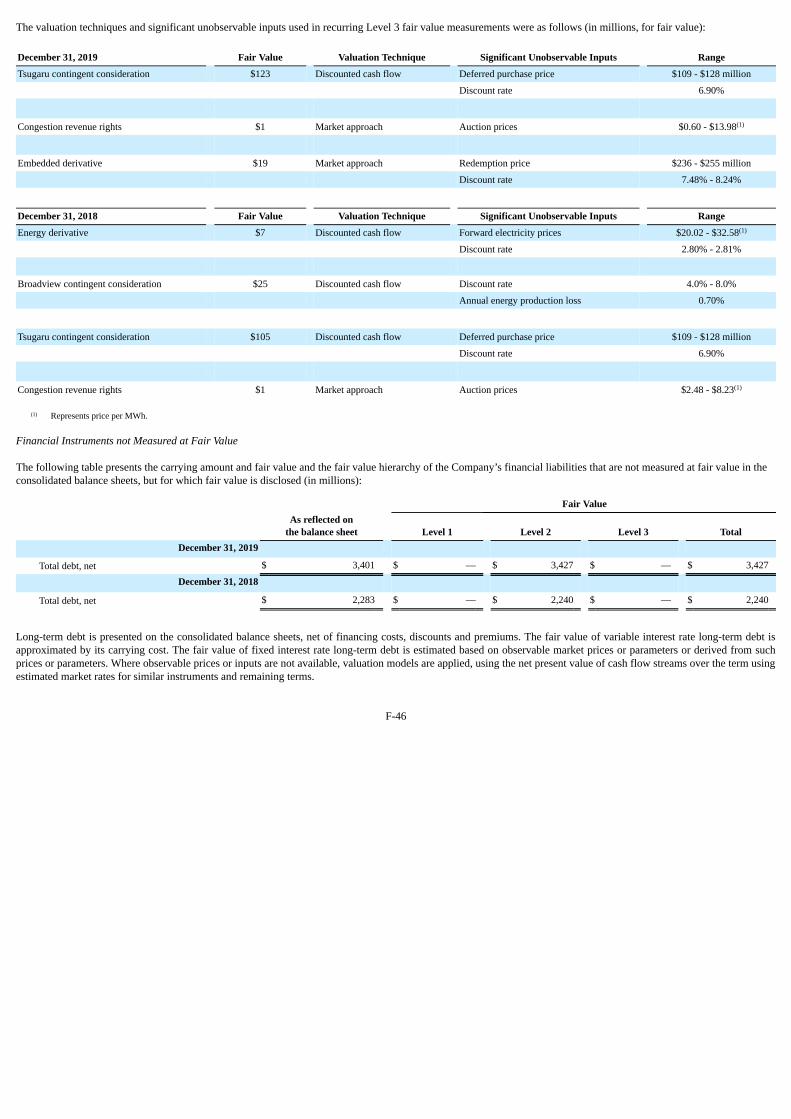
The valuation techniques and significant unobservable inputs used in recurring Level 3 fair value measurements were as follows (in millions, for fair value):
December 31, 2019 Fair Value Valuation Technique Significant Unobservable Inputs Range
Tsugaru contingent consideration $123 Discounted cash flow Deferred purchase price $109 - $128 million
Discount rate 6.90%
Congestion revenue rights $1 Market approach Auction prices $0.60 - $13.98(1)
Embedded derivative $19 Market approach Redemption price $236 - $255 million
Discount rate 7.48% - 8.24%
December 31, 2018 Fair Value Valuation Technique Significant Unobservable Inputs Range
Energy derivative $7 Discounted cash flow Forward electricity prices $20.02 - $32.58(1)
Discount rate 2.80% - 2.81%
Broadview contingent consideration $25 Discounted cash flow Discount rate 4.0% - 8.0%
Annual energy production loss 0.70%
Tsugaru contingent consideration $105 Discounted cash flow Deferred purchase price $109 - $128 million
Discount rate 6.90%
Congestion revenue rights $1 Market approach Auction prices $2.48 - $8.23(1)
(1) Represents price per MWh.
Financial Instruments not Measured at Fair Value
The following table presents the carrying amount and fair value and the fair value hierarchy of the Company’s financial liabilities that are not measured at fair value in theconsolidated balance sheets, but for which fair value is disclosed (in millions):
Fair Value
As reflected on
the balance sheet Level 1 Level 2 Level 3 TotalDecember 31, 2019
Total debt, net $ 3,401 $ — $ 3,427 $ — $ 3,427
December 31, 2018 Total debt, net $ 2,283 $ — $ 2,240 $ — $ 2,240
Long-term debt is presented on the consolidated balance sheets, net of financing costs, discounts and premiums. The fair value of variable interest rate long-term debt isapproximated by its carrying cost. The fair value of fixed interest rate long-term debt is estimated based on observable market prices or parameters or derived from suchprices or parameters. Where observable prices or inputs are not available, valuation models are applied, using the net present value of cash flow streams over the term usingestimated market rates for similar instruments and remaining terms.
F-46
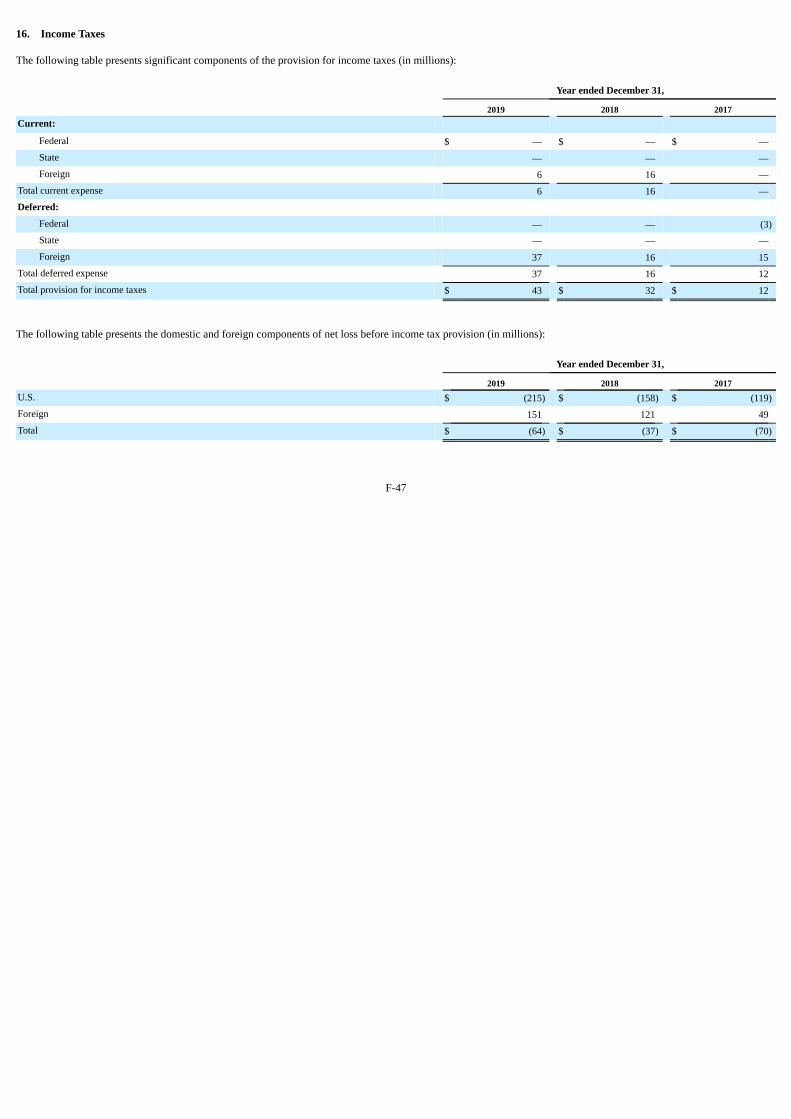
16. Income Taxes
The following table presents significant components of the provision for income taxes (in millions):
Year ended December 31,
2019 2018 2017Current:
Federal $ — $ — $ —State — — —Foreign 6 16 —
Total current expense 6 16 —Deferred:
Federal — — (3)State — — —Foreign 37 16 15
Total deferred expense 37 16 12Total provision for income taxes $ 43 $ 32 $ 12
The following table presents the domestic and foreign components of net loss before income tax provision (in millions):
Year ended December 31,
2019 2018 2017U.S. $ (215) $ (158) $ (119)Foreign 151 121 49Total $ (64) $ (37) $ (70)
F-47

The following table presents a reconciliation of the statutory U.S. federal income tax rate to the Company’s effective tax rate, as a percentage of income before taxes for thefollowing periods:
Year ended December 31,
2019 2018 2017Computed tax at statutory rate 21.0 % 21.0 % 35.0 %Adjustment for income in non-taxable entities allocable to noncontrolling interests (25.1)% (125.2)% (32.6)%Foreign rate differential
Tax rate differential on pre-tax book income (12.1)% (16.1)% 6.4 %Dual taxpaying entities outside basis difference (57.5)% (78.5)% (23.0)%Local tax on branch profits/(losses)—Puerto Rico 0.2 % (0.1)% 0.1 %
Permanent book/tax differences (domestic only) (0.7)% 0.5 % (0.1)%Valuation allowance change (99.3)% 38.9 % 47.7 %Subpart F income (3.2)% (7.9)% (3.5)%Capital gain exclusion - sale of partnership interest 13.6 % 24.7 % — %§162(m) - Officer's compensation (1.1)% — % — %Contingent consideration accretion (8.9)% (4.9)% — %Deferred tax adjustment 27.7 % — % — %Impairment — % 1.4 % — %Tax credits 78.4 % 61.7 % 31.6 %Effect of U.S. tax rate change under Tax Cuts and Jobs Act — % — % (78.1)%Other 0.1 % (2.5)% (0.1)%Effective income tax rate (66.9)% (87.0)% (16.6)%
F-48
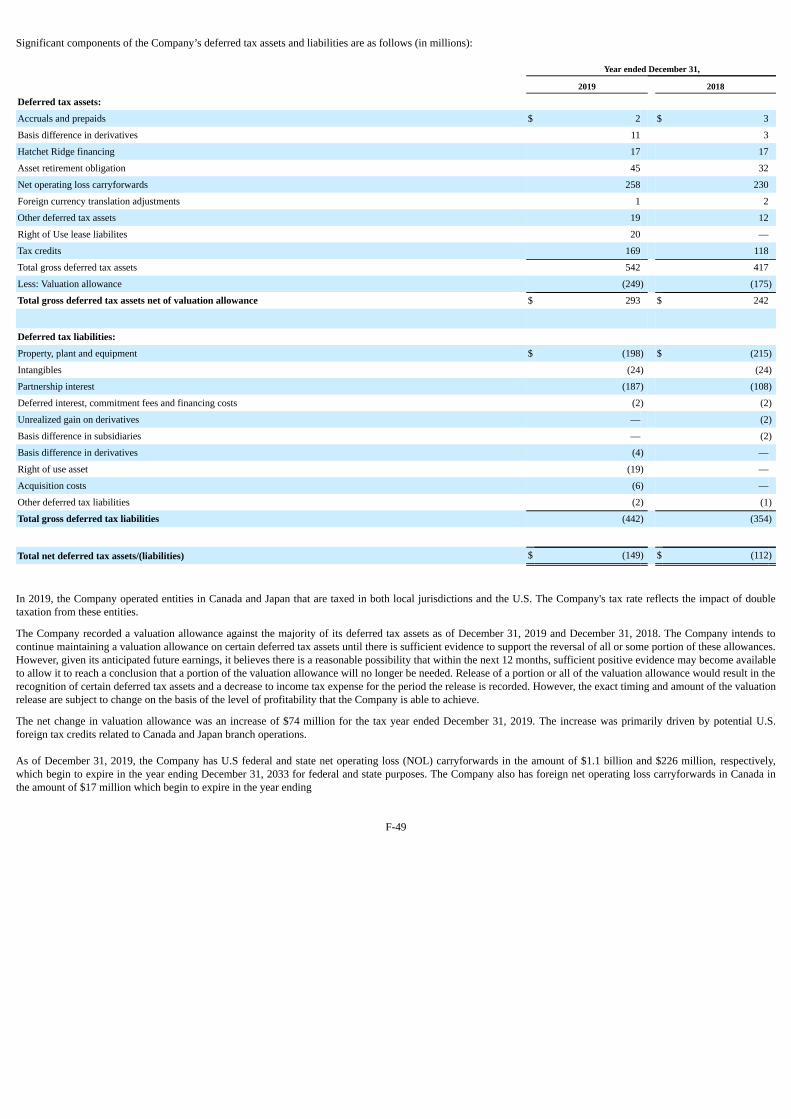
Significant components of the Company’s deferred tax assets and liabilities are as follows (in millions):
Year ended December 31,
2019 2018
Deferred tax assets: Accruals and prepaids $ 2 $ 3
Basis difference in derivatives 11 3
Hatchet Ridge financing 17 17
Asset retirement obligation 45 32
Net operating loss carryforwards 258 230
Foreign currency translation adjustments 1 2
Other deferred tax assets 19 12
Right of Use lease liabilites 20 —
Tax credits 169 118
Total gross deferred tax assets 542 417
Less: Valuation allowance (249) (175)
Total gross deferred tax assets net of valuation allowance $ 293 $ 242
Deferred tax liabilities: Property, plant and equipment $ (198) $ (215)
Intangibles (24) (24)
Partnership interest (187) (108)
Deferred interest, commitment fees and financing costs (2) (2)
Unrealized gain on derivatives — (2)
Basis difference in subsidiaries — (2)
Basis difference in derivatives (4) —
Right of use asset (19) —
Acquisition costs (6) —
Other deferred tax liabilities (2) (1)
Total gross deferred tax liabilities (442) (354)
Total net deferred tax assets/(liabilities) $ (149) $ (112)
In 2019, the Company operated entities in Canada and Japan that are taxed in both local jurisdictions and the U.S. The Company's tax rate reflects the impact of doubletaxation from these entities.
The Company recorded a valuation allowance against the majority of its deferred tax assets as of December 31, 2019 and December 31, 2018. The Company intends tocontinue maintaining a valuation allowance on certain deferred tax assets until there is sufficient evidence to support the reversal of all or some portion of these allowances.However, given its anticipated future earnings, it believes there is a reasonable possibility that within the next 12 months, sufficient positive evidence may become availableto allow it to reach a conclusion that a portion of the valuation allowance will no longer be needed. Release of a portion or all of the valuation allowance would result in therecognition of certain deferred tax assets and a decrease to income tax expense for the period the release is recorded. However, the exact timing and amount of the valuationrelease are subject to change on the basis of the level of profitability that the Company is able to achieve.
The net change in valuation allowance was an increase of $74 million for the tax year ended December 31, 2019. The increase was primarily driven by potential U.S.foreign tax credits related to Canada and Japan branch operations.
As of December 31, 2019, the Company has U.S federal and state net operating loss (NOL) carryforwards in the amount of $1.1 billion and $226 million, respectively,which begin to expire in the year ending December 31, 2033 for federal and state purposes. The Company also has foreign net operating loss carryforwards in Canada inthe amount of $17 million which begin to expire in the year ending
F-49
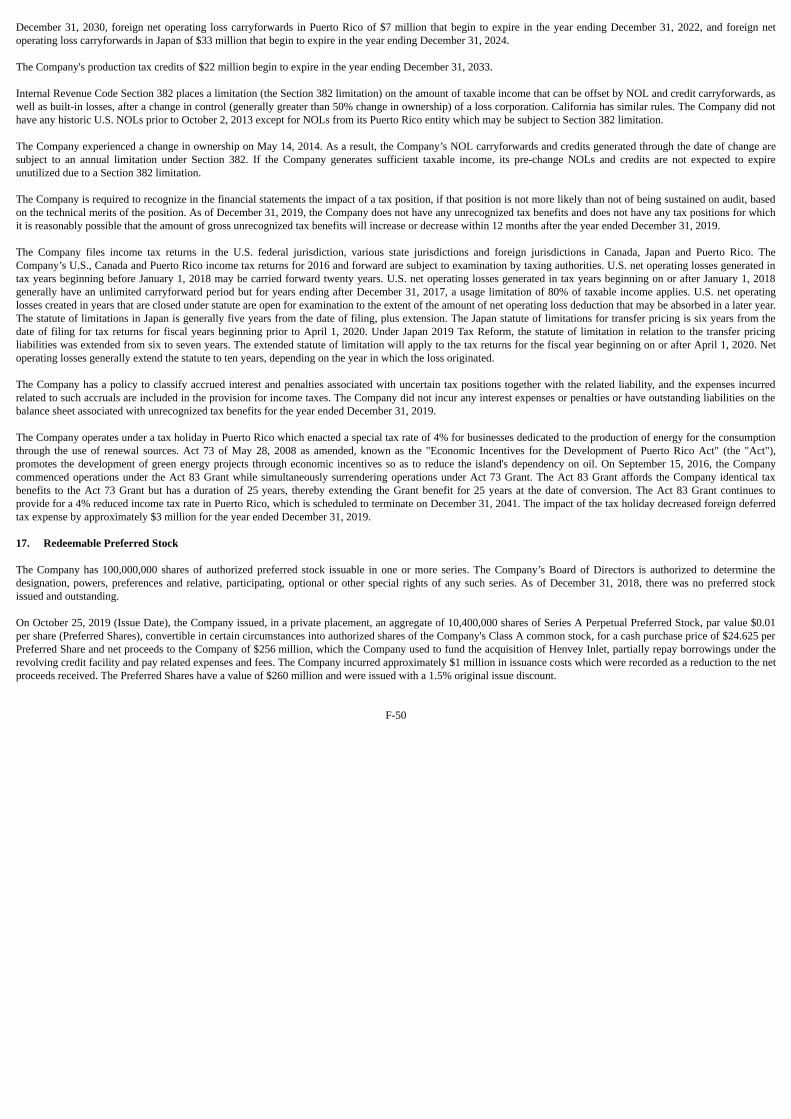
December 31, 2030, foreign net operating loss carryforwards in Puerto Rico of $7 million that begin to expire in the year ending December 31, 2022, and foreign netoperating loss carryforwards in Japan of $33 million that begin to expire in the year ending December 31, 2024.
The Company's production tax credits of $22 million begin to expire in the year ending December 31, 2033.
Internal Revenue Code Section 382 places a limitation (the Section 382 limitation) on the amount of taxable income that can be offset by NOL and credit carryforwards, aswell as built-in losses, after a change in control (generally greater than 50% change in ownership) of a loss corporation. California has similar rules. The Company did nothave any historic U.S. NOLs prior to October 2, 2013 except for NOLs from its Puerto Rico entity which may be subject to Section 382 limitation.
The Company experienced a change in ownership on May 14, 2014. As a result, the Company’s NOL carryforwards and credits generated through the date of change aresubject to an annual limitation under Section 382. If the Company generates sufficient taxable income, its pre-change NOLs and credits are not expected to expireunutilized due to a Section 382 limitation.
The Company is required to recognize in the financial statements the impact of a tax position, if that position is not more likely than not of being sustained on audit, basedon the technical merits of the position. As of December 31, 2019, the Company does not have any unrecognized tax benefits and does not have any tax positions for whichit is reasonably possible that the amount of gross unrecognized tax benefits will increase or decrease within 12 months after the year ended December 31, 2019.
The Company files income tax returns in the U.S. federal jurisdiction, various state jurisdictions and foreign jurisdictions in Canada, Japan and Puerto Rico. TheCompany’s U.S., Canada and Puerto Rico income tax returns for 2016 and forward are subject to examination by taxing authorities. U.S. net operating losses generated intax years beginning before January 1, 2018 may be carried forward twenty years. U.S. net operating losses generated in tax years beginning on or after January 1, 2018generally have an unlimited carryforward period but for years ending after December 31, 2017, a usage limitation of 80% of taxable income applies. U.S. net operatinglosses created in years that are closed under statute are open for examination to the extent of the amount of net operating loss deduction that may be absorbed in a later year.The statute of limitations in Japan is generally five years from the date of filing, plus extension. The Japan statute of limitations for transfer pricing is six years from thedate of filing for tax returns for fiscal years beginning prior to April 1, 2020. Under Japan 2019 Tax Reform, the statute of limitation in relation to the transfer pricingliabilities was extended from six to seven years. The extended statute of limitation will apply to the tax returns for the fiscal year beginning on or after April 1, 2020. Netoperating losses generally extend the statute to ten years, depending on the year in which the loss originated.
The Company has a policy to classify accrued interest and penalties associated with uncertain tax positions together with the related liability, and the expenses incurredrelated to such accruals are included in the provision for income taxes. The Company did not incur any interest expenses or penalties or have outstanding liabilities on thebalance sheet associated with unrecognized tax benefits for the year ended December 31, 2019.
The Company operates under a tax holiday in Puerto Rico which enacted a special tax rate of 4% for businesses dedicated to the production of energy for the consumptionthrough the use of renewal sources. Act 73 of May 28, 2008 as amended, known as the "Economic Incentives for the Development of Puerto Rico Act" (the "Act"),promotes the development of green energy projects through economic incentives so as to reduce the island's dependency on oil. On September 15, 2016, the Companycommenced operations under the Act 83 Grant while simultaneously surrendering operations under Act 73 Grant. The Act 83 Grant affords the Company identical taxbenefits to the Act 73 Grant but has a duration of 25 years, thereby extending the Grant benefit for 25 years at the date of conversion. The Act 83 Grant continues toprovide for a 4% reduced income tax rate in Puerto Rico, which is scheduled to terminate on December 31, 2041. The impact of the tax holiday decreased foreign deferredtax expense by approximately $3 million for the year ended December 31, 2019.
17. Redeemable Preferred Stock
The Company has 100,000,000 shares of authorized preferred stock issuable in one or more series. The Company’s Board of Directors is authorized to determine thedesignation, powers, preferences and relative, participating, optional or other special rights of any such series. As of December 31, 2018, there was no preferred stockissued and outstanding.
On October 25, 2019 (Issue Date), the Company issued, in a private placement, an aggregate of 10,400,000 shares of Series A Perpetual Preferred Stock, par value $0.01per share (Preferred Shares), convertible in certain circumstances into authorized shares of the Company's Class A common stock, for a cash purchase price of $24.625 perPreferred Share and net proceeds to the Company of $256 million, which the Company used to fund the acquisition of Henvey Inlet, partially repay borrowings under therevolving credit facility and pay related expenses and fees. The Company incurred approximately $1 million in issuance costs which were recorded as a reduction to the netproceeds received. The Preferred Shares have a value of $260 million and were issued with a 1.5% original issue discount.
F-50
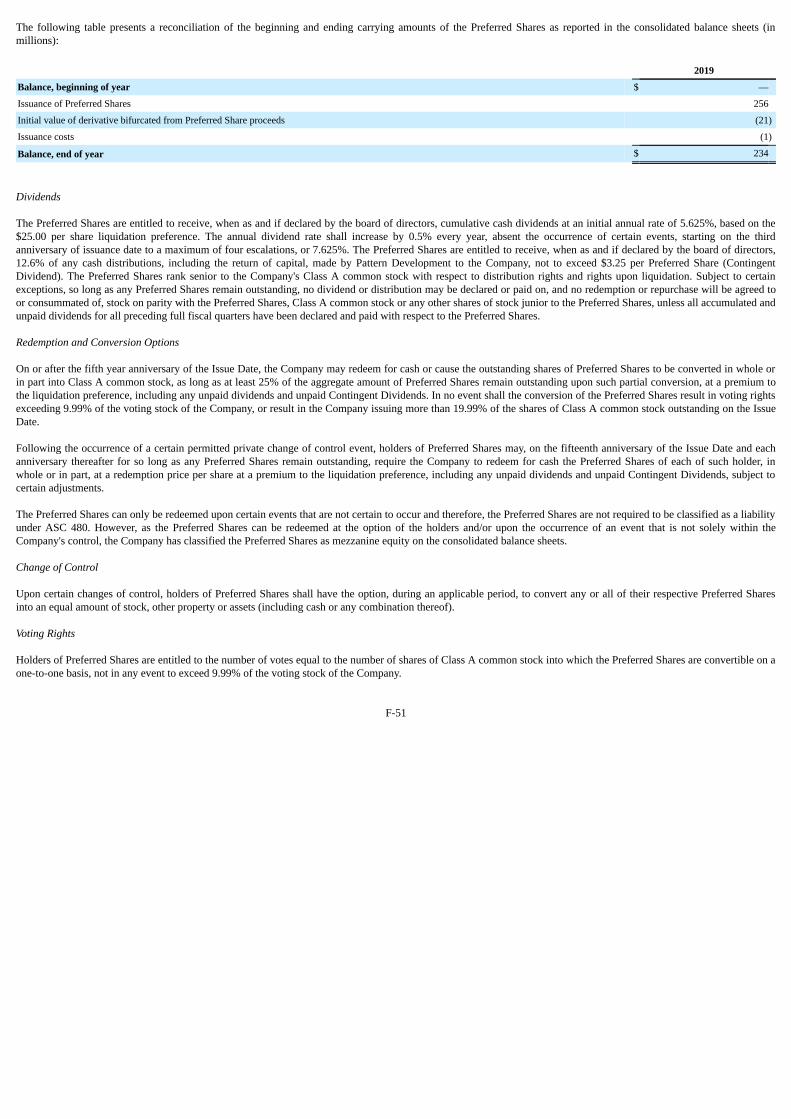
The following table presents a reconciliation of the beginning and ending carrying amounts of the Preferred Shares as reported in the consolidated balance sheets (inmillions):
2019
Balance, beginning of year $ —
Issuance of Preferred Shares 256
Initial value of derivative bifurcated from Preferred Share proceeds (21)
Issuance costs (1)
Balance, end of year $ 234
Dividends
The Preferred Shares are entitled to receive, when as and if declared by the board of directors, cumulative cash dividends at an initial annual rate of 5.625%, based on the$25.00 per share liquidation preference. The annual dividend rate shall increase by 0.5% every year, absent the occurrence of certain events, starting on the thirdanniversary of issuance date to a maximum of four escalations, or 7.625%. The Preferred Shares are entitled to receive, when as and if declared by the board of directors,12.6% of any cash distributions, including the return of capital, made by Pattern Development to the Company, not to exceed $3.25 per Preferred Share (ContingentDividend). The Preferred Shares rank senior to the Company's Class A common stock with respect to distribution rights and rights upon liquidation. Subject to certainexceptions, so long as any Preferred Shares remain outstanding, no dividend or distribution may be declared or paid on, and no redemption or repurchase will be agreed toor consummated of, stock on parity with the Preferred Shares, Class A common stock or any other shares of stock junior to the Preferred Shares, unless all accumulated andunpaid dividends for all preceding full fiscal quarters have been declared and paid with respect to the Preferred Shares.
Redemption and Conversion Options
On or after the fifth year anniversary of the Issue Date, the Company may redeem for cash or cause the outstanding shares of Preferred Shares to be converted in whole orin part into Class A common stock, as long as at least 25% of the aggregate amount of Preferred Shares remain outstanding upon such partial conversion, at a premium tothe liquidation preference, including any unpaid dividends and unpaid Contingent Dividends. In no event shall the conversion of the Preferred Shares result in voting rightsexceeding 9.99% of the voting stock of the Company, or result in the Company issuing more than 19.99% of the shares of Class A common stock outstanding on the IssueDate.
Following the occurrence of a certain permitted private change of control event, holders of Preferred Shares may, on the fifteenth anniversary of the Issue Date and eachanniversary thereafter for so long as any Preferred Shares remain outstanding, require the Company to redeem for cash the Preferred Shares of each of such holder, inwhole or in part, at a redemption price per share at a premium to the liquidation preference, including any unpaid dividends and unpaid Contingent Dividends, subject tocertain adjustments.
The Preferred Shares can only be redeemed upon certain events that are not certain to occur and therefore, the Preferred Shares are not required to be classified as a liabilityunder ASC 480. However, as the Preferred Shares can be redeemed at the option of the holders and/or upon the occurrence of an event that is not solely within theCompany's control, the Company has classified the Preferred Shares as mezzanine equity on the consolidated balance sheets.
Change of Control
Upon certain changes of control, holders of Preferred Shares shall have the option, during an applicable period, to convert any or all of their respective Preferred Sharesinto an equal amount of stock, other property or assets (including cash or any combination thereof).
Voting Rights
Holders of Preferred Shares are entitled to the number of votes equal to the number of shares of Class A common stock into which the Preferred Shares are convertible on aone-to-one basis, not in any event to exceed 9.99% of the voting stock of the Company.
F-51
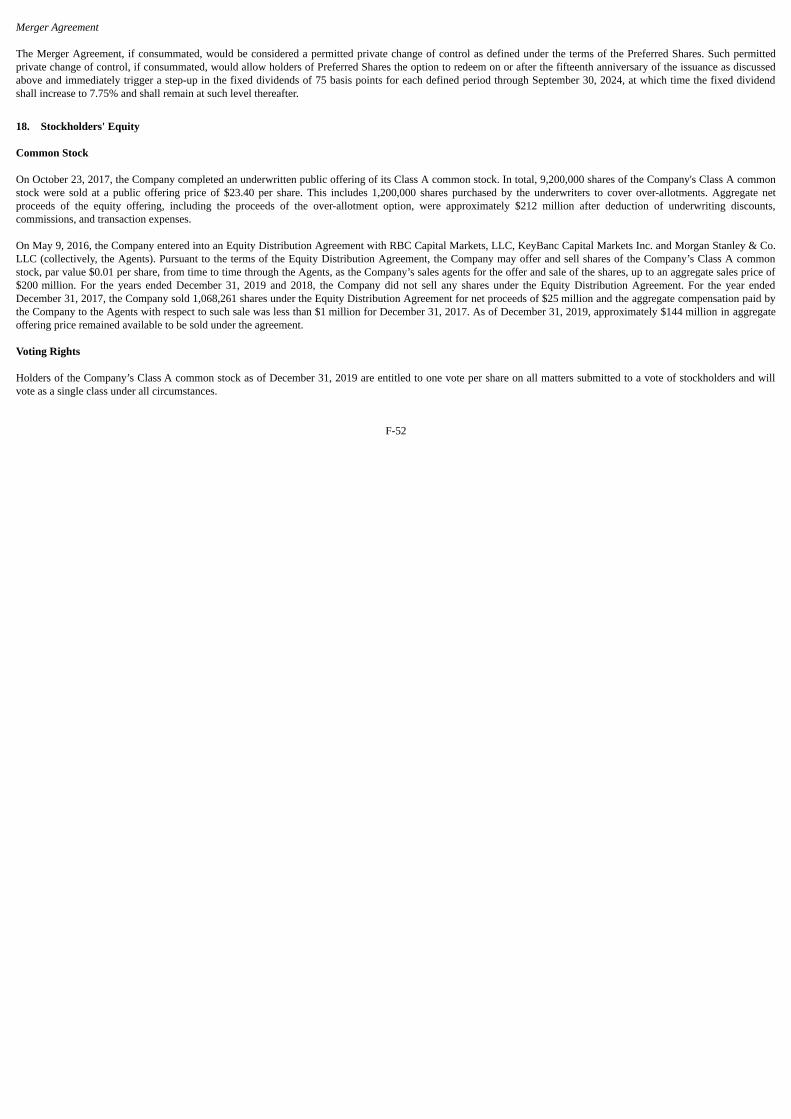
Merger Agreement
The Merger Agreement, if consummated, would be considered a permitted private change of control as defined under the terms of the Preferred Shares. Such permittedprivate change of control, if consummated, would allow holders of Preferred Shares the option to redeem on or after the fifteenth anniversary of the issuance as discussedabove and immediately trigger a step-up in the fixed dividends of 75 basis points for each defined period through September 30, 2024, at which time the fixed dividendshall increase to 7.75% and shall remain at such level thereafter.
18. Stockholders' Equity
Common Stock
On October 23, 2017, the Company completed an underwritten public offering of its Class A common stock. In total, 9,200,000 shares of the Company's Class A commonstock were sold at a public offering price of $23.40 per share. This includes 1,200,000 shares purchased by the underwriters to cover over-allotments. Aggregate netproceeds of the equity offering, including the proceeds of the over-allotment option, were approximately $212 million after deduction of underwriting discounts,commissions, and transaction expenses.
On May 9, 2016, the Company entered into an Equity Distribution Agreement with RBC Capital Markets, LLC, KeyBanc Capital Markets Inc. and Morgan Stanley & Co.LLC (collectively, the Agents). Pursuant to the terms of the Equity Distribution Agreement, the Company may offer and sell shares of the Company’s Class A commonstock, par value $0.01 per share, from time to time through the Agents, as the Company’s sales agents for the offer and sale of the shares, up to an aggregate sales price of$200 million. For the years ended December 31, 2019 and 2018, the Company did not sell any shares under the Equity Distribution Agreement. For the year endedDecember 31, 2017, the Company sold 1,068,261 shares under the Equity Distribution Agreement for net proceeds of $25 million and the aggregate compensation paid bythe Company to the Agents with respect to such sale was less than $1 million for December 31, 2017. As of December 31, 2019, approximately $144 million in aggregateoffering price remained available to be sold under the agreement.
Voting Rights
Holders of the Company’s Class A common stock as of December 31, 2019 are entitled to one vote per share on all matters submitted to a vote of stockholders and willvote as a single class under all circumstances.
F-52
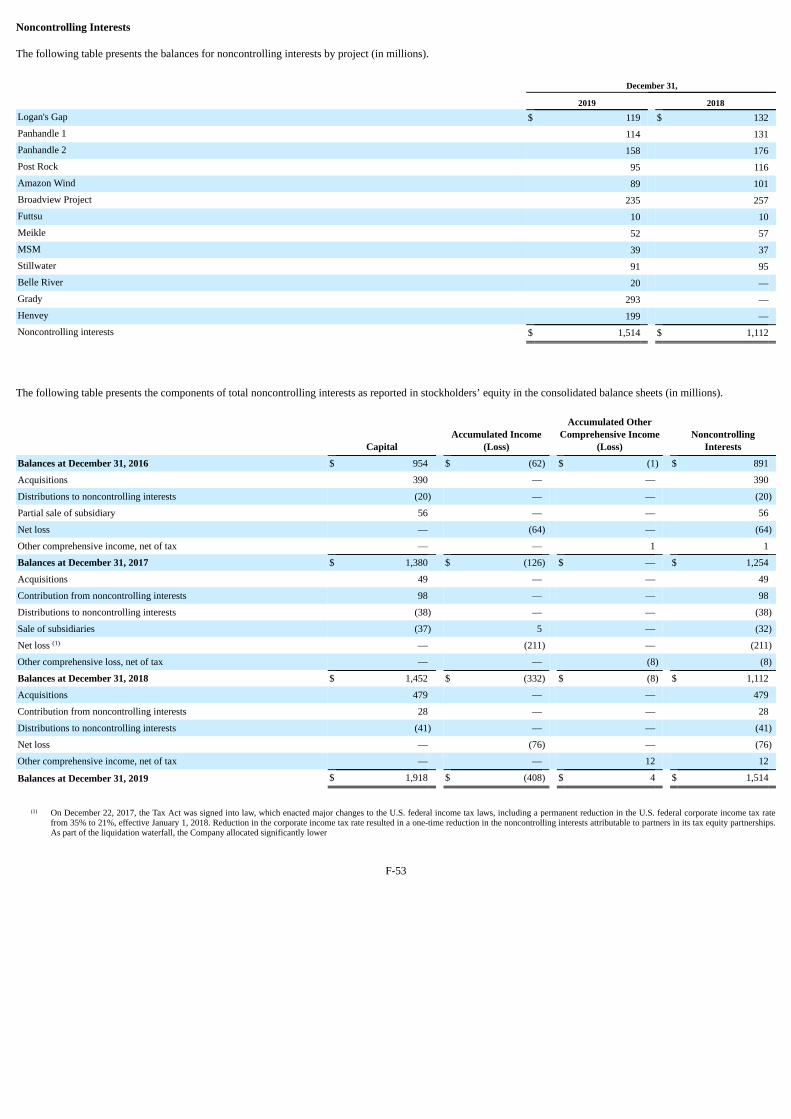
Noncontrolling Interests
The following table presents the balances for noncontrolling interests by project (in millions).
December 31,
2019 2018Logan's Gap $ 119 $ 132Panhandle 1 114 131Panhandle 2 158 176Post Rock 95 116Amazon Wind 89 101Broadview Project 235 257Futtsu 10 10Meikle 52 57MSM 39 37Stillwater 91 95Belle River 20 —Grady 293 —Henvey 199 —Noncontrolling interests $ 1,514 $ 1,112
The following table presents the components of total noncontrolling interests as reported in stockholders’ equity in the consolidated balance sheets (in millions).
Capital Accumulated Income
(Loss)
Accumulated OtherComprehensive Income
(Loss) Noncontrolling
Interests
Balances at December 31, 2016 $ 954 $ (62) $ (1) $ 891
Acquisitions 390 — — 390
Distributions to noncontrolling interests (20) — — (20)
Partial sale of subsidiary 56 — — 56
Net loss — (64) — (64)
Other comprehensive income, net of tax — — 1 1
Balances at December 31, 2017 $ 1,380 $ (126) $ — $ 1,254
Acquisitions 49 — — 49
Contribution from noncontrolling interests 98 — — 98
Distributions to noncontrolling interests (38) — — (38)
Sale of subsidiaries (37) 5 — (32)
Net loss (1) — (211) — (211)
Other comprehensive loss, net of tax — — (8) (8)
Balances at December 31, 2018 $ 1,452 $ (332) $ (8) $ 1,112
Acquisitions 479 — — 479
Contribution from noncontrolling interests 28 — — 28
Distributions to noncontrolling interests (41) — — (41)
Net loss — (76) — (76)
Other comprehensive income, net of tax — — 12 12
Balances at December 31, 2019 $ 1,918 $ (408) $ 4 $ 1,514
(1) On December 22, 2017, the Tax Act was signed into law, which enacted major changes to the U.S. federal income tax laws, including a permanent reduction in the U.S. federal corporate income tax ratefrom 35% to 21%, effective January 1, 2018. Reduction in the corporate income tax rate resulted in a one-time reduction in the noncontrolling interests attributable to partners in its tax equity partnerships.As part of the liquidation waterfall, the Company allocated significantly lower
F-53

portions of the hypothetical liquidation proceeds to compensate certain noncontrolling interest investors for tax gains on the hypothetical sale calculated at the lowered rate of 21% as compared to the rate of35% that was previously utilized. For the year ended December 31, 2018, included in net loss attributable to noncontrolling interests is a one-time adjustment of $150 million as a result of the decrease inthe federal corporate income tax rate.
Pay-go Contribution
Broadview and Grady include a partial pay as you go (Pay-go) funding arrangement under which, when the actual annual MWh production of Broadview and Gradyexceeds a certain production threshold, the tax equity investors are obligated to make a cash contribution ("Pay-go contribution") to the Company. The Pay-go arrangementresulted in a lower initial investment by the tax equity partners and provided them with some protection from potential underperformance. For the year ended December 31,2019, the actual MWh production of Broadview and Grady exceeded the production threshold which resulted in a Pay-go contribution receivable from the tax equitypartners in the amount of approximately $6 million. The Company classified the receivable as a component of noncontrolling interests in the accompanying consolidatedbalance sheets. The Company expects to receive the Pay-go contribution by the end of the first quarter of 2020. For the year ended December 31, 2018, the actual MWhproduction of Broadview exceeded the production threshold which resulted in a Pay-go contribution of approximately $4 million.
Allocations of Distributions and Tax Allocations for Tax Equity Partnerships
Generally, tax equity partnerships have specific commercial terms that dictate distributions of cash and allocation of tax items among the partners, who are divided into oneof two categories: tax equity and cash investor. A disproportionate share of income and cash is given to tax equity in order for them to achieve a target after-tax yield or“flip” near year 10 of project operations. The target yield and flip term vary by agreement and are dependent on project performance. Prior to the flip, tax items (income,US Federal production tax credits) are commonly allocated 99% to the tax equity. On the other hand, distributable cash is divided among the partners in percentages that donot match the tax items. Cash distribution percentages can be temporarily increased for tax equity in the event that certain cumulative distribution thresholds are notachieved. Once tax equity reaches their target yield, the allocations and distributions “flip” to different amounts. After the flip, income and cash are typically allocated 5%to the tax equity and 95% to the cash investor. REC sales are often specially addressed in each agreement with most of the cash and income directed to the cash investorboth pre and post-flip.
Tax equity partnerships imposes a range of affirmative and negative covenants that are similar to what a term lender would require, such as financial reporting, insurancemaintenance and prudent operator standards. Most of these restrictions end once the flip point occurs and any deficit restoration obligation of the tax equity has beeneliminated. There are also covenants that specifically seek to preserve the tax attributes of the project that are not customary for project term lenders.
If tax equity suffers any losses or damages as the result of a breach of representation, covenant, or other obligation by the cash investor in its capacity as managing member,tax equity may provide notice to the cash investor and require that any distributions otherwise required to be paid to the cash investor shall, instead, be paid to tax equity tocover any damages.
19. Equity Incentive Award Plan
Under the Amended and Restated 2013 Equity Incentive Award Plan (2013 Plan), the Company may issue 3,000,000 aggregate number of shares of Class A common stockfor equity awards including incentive and nonqualified stock options, restricted stock awards (RSAs) and restricted stock units (RSUs) to employees, directors andconsultants. RSAs provide the holder with immediate voting rights, but are restricted in all other respects until released. RSUs generally entitle the holders the right toreceive the underlying shares of the Company's Class A common stock upon vesting. Upon cessation of services to the Company, any nonvested RSAs and RSUs will beforfeited. All nonvested RSAs and RSUs accrue dividends and distributions, which are subject to vesting and paid in cash upon release. Accrued dividends anddistributions are forfeitable to the extent that the underlying awards do not vest. As of December 31, 2019, there were 1,565,076 aggregate number of Class A sharesavailable for issuance under the 2013 Plan.
Stock-Based Compensation
Stock-based compensation expenses related to, RSAs, RSUs and stock options are recorded as a component of general and administrative expenses in the Company’sconsolidated statements of operations and totaled $5 million, $5 million and $5 million for the years ended December 31, 2019, 2018 and 2017, respectively.
F-54
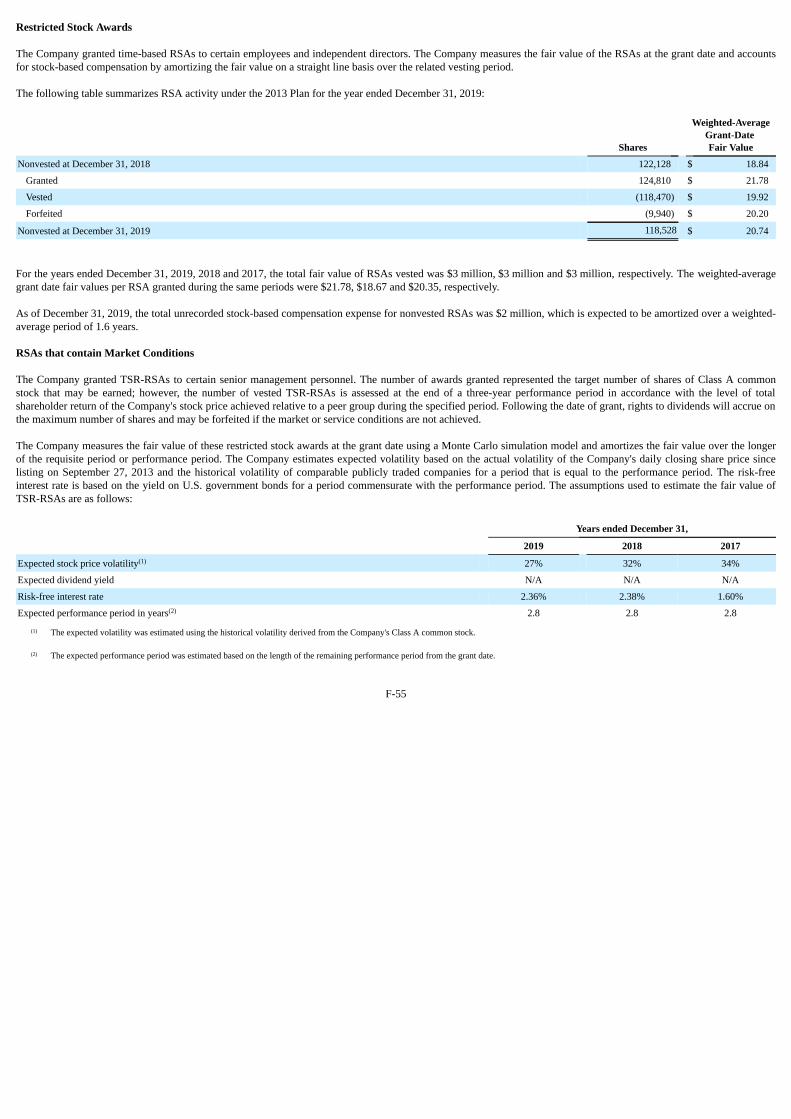
Restricted Stock Awards
The Company granted time-based RSAs to certain employees and independent directors. The Company measures the fair value of the RSAs at the grant date and accountsfor stock-based compensation by amortizing the fair value on a straight line basis over the related vesting period.
The following table summarizes RSA activity under the 2013 Plan for the year ended December 31, 2019:
Shares
Weighted-AverageGrant-Date Fair Value
Nonvested at December 31, 2018 122,128 $ 18.84
Granted 124,810 $ 21.78
Vested (118,470) $ 19.92
Forfeited (9,940) $ 20.20
Nonvested at December 31, 2019 118,528 $ 20.74
For the years ended December 31, 2019, 2018 and 2017, the total fair value of RSAs vested was $3 million, $3 million and $3 million, respectively. The weighted-averagegrant date fair values per RSA granted during the same periods were $21.78, $18.67 and $20.35, respectively.
As of December 31, 2019, the total unrecorded stock-based compensation expense for nonvested RSAs was $2 million, which is expected to be amortized over a weighted-average period of 1.6 years.
RSAs that contain Market Conditions
The Company granted TSR-RSAs to certain senior management personnel. The number of awards granted represented the target number of shares of Class A commonstock that may be earned; however, the number of vested TSR-RSAs is assessed at the end of a three-year performance period in accordance with the level of totalshareholder return of the Company's stock price achieved relative to a peer group during the specified period. Following the date of grant, rights to dividends will accrue onthe maximum number of shares and may be forfeited if the market or service conditions are not achieved.
The Company measures the fair value of these restricted stock awards at the grant date using a Monte Carlo simulation model and amortizes the fair value over the longerof the requisite period or performance period. The Company estimates expected volatility based on the actual volatility of the Company's daily closing share price sincelisting on September 27, 2013 and the historical volatility of comparable publicly traded companies for a period that is equal to the performance period. The risk-freeinterest rate is based on the yield on U.S. government bonds for a period commensurate with the performance period. The assumptions used to estimate the fair value ofTSR-RSAs are as follows:
Years ended December 31,
2019 2018 2017
Expected stock price volatility(1) 27% 32% 34%
Expected dividend yield N/A N/A N/A
Risk-free interest rate 2.36% 2.38% 1.60%
Expected performance period in years(2) 2.8 2.8 2.8
(1) The expected volatility was estimated using the historical volatility derived from the Company's Class A common stock.
(2) The expected performance period was estimated based on the length of the remaining performance period from the grant date.
F-55
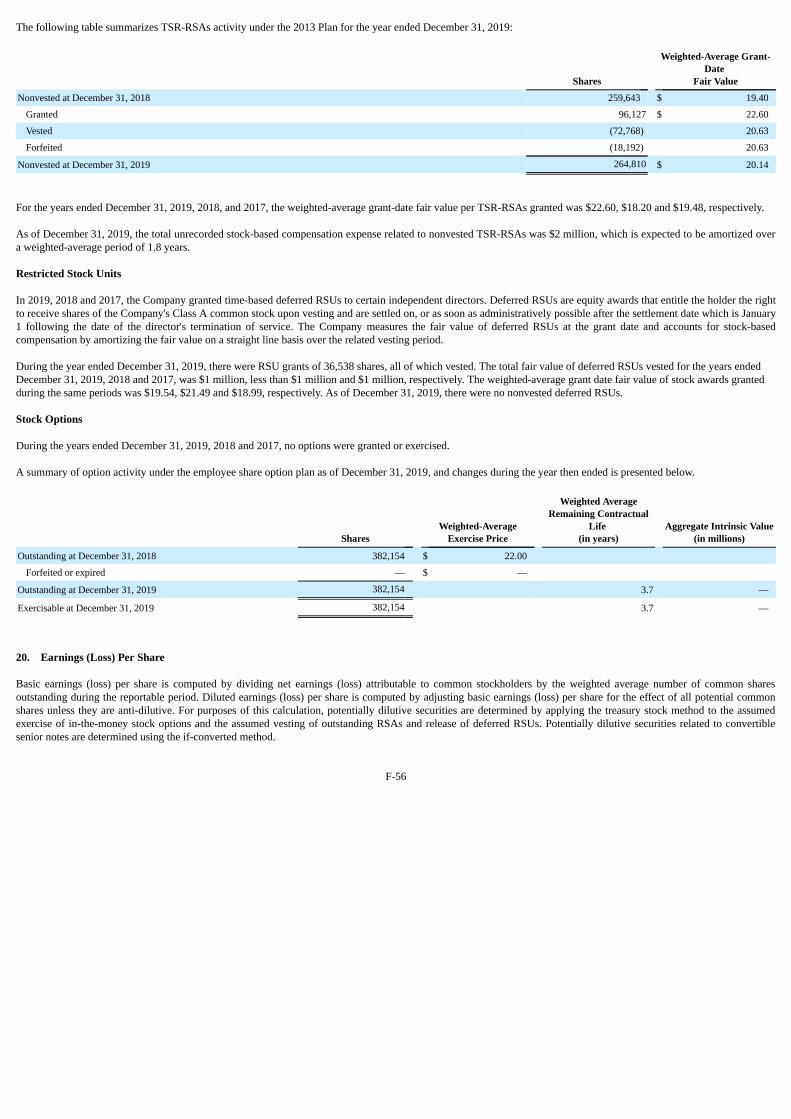
The following table summarizes TSR-RSAs activity under the 2013 Plan for the year ended December 31, 2019:
Shares
Weighted-Average Grant-Date
Fair Value
Nonvested at December 31, 2018 259,643 $ 19.40
Granted 96,127 $ 22.60
Vested (72,768) 20.63
Forfeited (18,192) 20.63
Nonvested at December 31, 2019 264,810 $ 20.14
For the years ended December 31, 2019, 2018, and 2017, the weighted-average grant-date fair value per TSR-RSAs granted was $22.60, $18.20 and $19.48, respectively.
As of December 31, 2019, the total unrecorded stock-based compensation expense related to nonvested TSR-RSAs was $2 million, which is expected to be amortized overa weighted-average period of 1.8 years.
Restricted Stock Units
In 2019, 2018 and 2017, the Company granted time-based deferred RSUs to certain independent directors. Deferred RSUs are equity awards that entitle the holder the rightto receive shares of the Company's Class A common stock upon vesting and are settled on, or as soon as administratively possible after the settlement date which is January1 following the date of the director's termination of service. The Company measures the fair value of deferred RSUs at the grant date and accounts for stock-basedcompensation by amortizing the fair value on a straight line basis over the related vesting period.
During the year ended December 31, 2019, there were RSU grants of 36,538 shares, all of which vested. The total fair value of deferred RSUs vested for the years endedDecember 31, 2019, 2018 and 2017, was $1 million, less than $1 million and $1 million, respectively. The weighted-average grant date fair value of stock awards grantedduring the same periods was $19.54, $21.49 and $18.99, respectively. As of December 31, 2019, there were no nonvested deferred RSUs.
Stock Options
During the years ended December 31, 2019, 2018 and 2017, no options were granted or exercised.
A summary of option activity under the employee share option plan as of December 31, 2019, and changes during the year then ended is presented below.
SharesWeighted-Average
Exercise Price
Weighted AverageRemaining Contractual
Life (in years)
Aggregate Intrinsic Value(in millions)
Outstanding at December 31, 2018 382,154 $ 22.00 Forfeited or expired — $ —
Outstanding at December 31, 2019 382,154 3.7 —
Exercisable at December 31, 2019 382,154 3.7 —
20. Earnings (Loss) Per Share
Basic earnings (loss) per share is computed by dividing net earnings (loss) attributable to common stockholders by the weighted average number of common sharesoutstanding during the reportable period. Diluted earnings (loss) per share is computed by adjusting basic earnings (loss) per share for the effect of all potential commonshares unless they are anti-dilutive. For purposes of this calculation, potentially dilutive securities are determined by applying the treasury stock method to the assumedexercise of in-the-money stock options and the assumed vesting of outstanding RSAs and release of deferred RSUs. Potentially dilutive securities related to convertiblesenior notes are determined using the if-converted method.
F-56
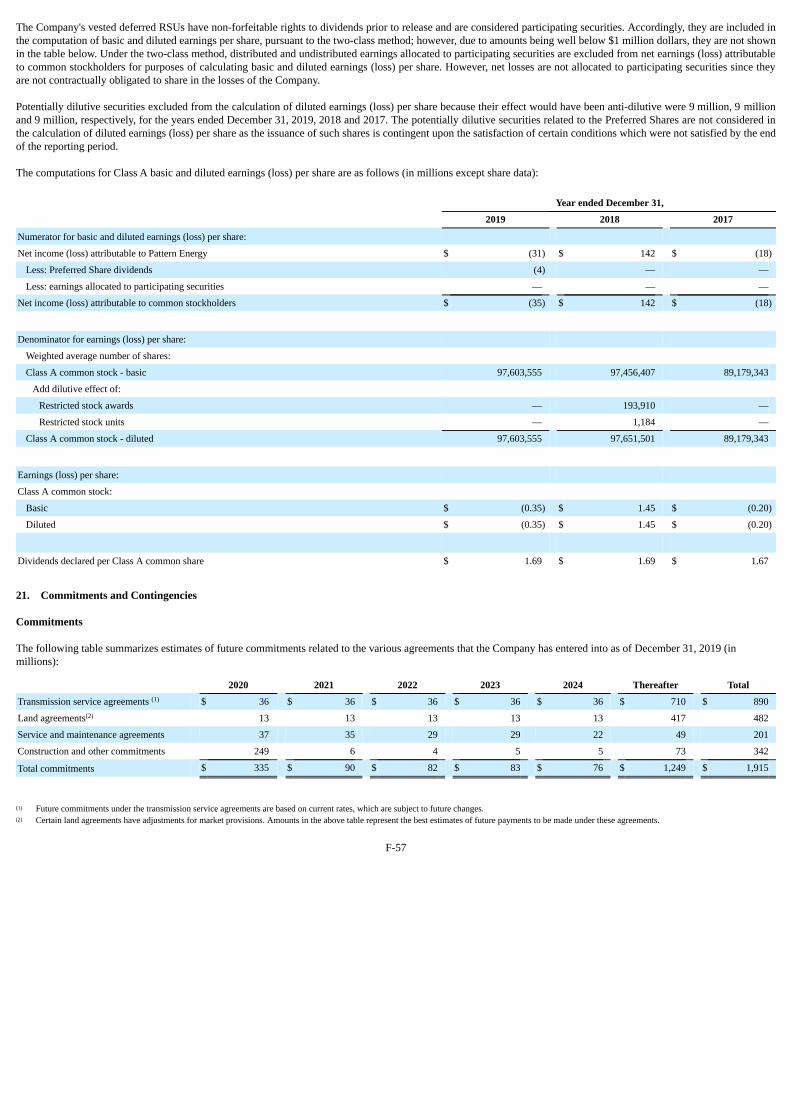
The Company's vested deferred RSUs have non-forfeitable rights to dividends prior to release and are considered participating securities. Accordingly, they are included inthe computation of basic and diluted earnings per share, pursuant to the two-class method; however, due to amounts being well below $1 million dollars, they are not shownin the table below. Under the two-class method, distributed and undistributed earnings allocated to participating securities are excluded from net earnings (loss) attributableto common stockholders for purposes of calculating basic and diluted earnings (loss) per share. However, net losses are not allocated to participating securities since theyare not contractually obligated to share in the losses of the Company.
Potentially dilutive securities excluded from the calculation of diluted earnings (loss) per share because their effect would have been anti-dilutive were 9 million, 9 millionand 9 million, respectively, for the years ended December 31, 2019, 2018 and 2017. The potentially dilutive securities related to the Preferred Shares are not considered inthe calculation of diluted earnings (loss) per share as the issuance of such shares is contingent upon the satisfaction of certain conditions which were not satisfied by the endof the reporting period.
The computations for Class A basic and diluted earnings (loss) per share are as follows (in millions except share data):
Year ended December 31,
2019 2018 2017
Numerator for basic and diluted earnings (loss) per share: Net income (loss) attributable to Pattern Energy $ (31) $ 142 $ (18)
Less: Preferred Share dividends (4) — —
Less: earnings allocated to participating securities — — —
Net income (loss) attributable to common stockholders $ (35) $ 142 $ (18)
Denominator for earnings (loss) per share: Weighted average number of shares: Class A common stock - basic 97,603,555 97,456,407 89,179,343
Add dilutive effect of: Restricted stock awards — 193,910 —
Restricted stock units — 1,184 —
Class A common stock - diluted 97,603,555 97,651,501 89,179,343
Earnings (loss) per share: Class A common stock:
Basic $ (0.35) $ 1.45 $ (0.20)
Diluted $ (0.35) $ 1.45 $ (0.20)
Dividends declared per Class A common share $ 1.69 $ 1.69 $ 1.67
21. Commitments and Contingencies
Commitments
The following table summarizes estimates of future commitments related to the various agreements that the Company has entered into as of December 31, 2019 (inmillions):
2020 2021 2022 2023 2024 Thereafter Total
Transmission service agreements (1) $ 36 $ 36 $ 36 $ 36 $ 36 $ 710 $ 890
Land agreements(2) 13 13 13 13 13 417 482
Service and maintenance agreements 37 35 29 29 22 49 201
Construction and other commitments 249 6 4 5 5 73 342
Total commitments $ 335 $ 90 $ 82 $ 83 $ 76 $ 1,249 $ 1,915
(1) Future commitments under the transmission service agreements are based on current rates, which are subject to future changes.(2) Certain land agreements have adjustments for market provisions. Amounts in the above table represent the best estimates of future payments to be made under these agreements.
F-57
Transmission Service Agreements
In connection with the Broadview Project acquisition, the Company became a party to various long-term transmission service agreements expiring between 2-29 years. TheCompany recorded transmission service costs related to such agreements of $25 million for the year ended December 31, 2019.
Land Agreements Not Accounted for under ASC 842
The Company has entered into various long-term land agreements for its wind and solar farms that are not accounted for under ASC 842, primarily in the U.S. and Canada,because the agreements do not convey the right to control the use of the land. In these agreements, the Company does not have exclusive use of the land and the landownersretain the rights to the economic benefits for most of the land. For the years ended December 31, 2019, 2018 and 2017, the Company recorded rent expense of $18 million,$18 million and $15 million, respectively, in project expense in its consolidated statements of operations.
Service and Maintenance Agreements
The Company has entered into service and maintenance agreements with third party contractors to provide turbine operations and maintenance services and modificationsand upgrades for varying periods over the next 21 years. The computation of outstanding commitments includes an estimated annual price adjustment for inflation of 2%,where applicable. For the years ended December 31, 2019, 2018 and 2017, the Company recorded service and maintenance expense under these agreements of $33 million,$38 million and $47 million, respectively, in project expense in its consolidated statements of operations.
Construction and Other Commitments
Included in construction and other commitments are payments in lieu of taxes, Tsugaru construction, Gulf Wind re-powering, and various other commitments related to theCompany's projects and operations of its business. Payments in lieu of taxes include payments the Company is required to make in lieu of taxes as a result of tax savingsrealized as part of the issuance of the industrial revenue bonds. See Note 7, Intangible Assets and Liabilities and Goodwill, for further discussion. Tsugaru is currently inconstruction and expected to commence commercial operations in early to mid-2020.
Gulf Wind Re-Powering Commitment
In September 2018, the Company committed to a plan to re-power the Gulf Wind project. In connection with the re-powering plan, the Company entered into a turbinepurchase agreement for a maximum purchase price of $151 million plus certain storage costs.
Separately, in September 2018, the Company exercised its option to purchase turbines from an affiliate of Pattern Development. In 2019, the Company paid approximately$14 million to such affiliate of Pattern Development.
Letters of Credit
Power Sale Agreements
The Company owns and operates wind and solar power projects, and has entered into various long-term PSAs that terminate from 2025 to 2044. The terms of theseagreements generally provide for the annual delivery of a minimum amount of electricity at fixed prices and in some cases include price escalation over the term of theagreement. Under the terms of these agreements, as of December 31, 2019, irrevocable letters of credit totaling $158 million were available to be issued to guarantee theCompany's performance for the duration of the agreements.
Project Finance and Lease Agreements
The Company has various project finance and lease agreements which obligate the Company to provide certain reserves to enhance its credit worthiness and facilitate theavailability of credit. As of December 31, 2019, irrevocable letters of credit totaling $152 million which includes letters of credit available under the Revolving CreditFacility were available to be issued to ensure performance under these various project finance and lease agreements.
F-58

Contingencies
Turbine Operating Warranties and Service Guarantees
The Company has various turbine availability warranties from its turbine manufacturers and service guarantees from its service and maintenance providers. Pursuant tothese guarantees, if a turbine operates at less than minimum availability during the guarantee measurement period, the service provider is obligated to pay, as liquidateddamages at the end of the warranty measurement period, an amount for each percent that the turbine operates below the minimum availability threshold. In addition,pursuant to certain of these guarantees, if a turbine operates at more than a specified availability during the guarantee measurement period, the Company has an obligationto pay a bonus to the service provider at the end of the warranty measurement period. As of December 31, 2019, the Company recorded liabilities of $2 million associatedwith bonuses payable to turbine manufacturers and service providers.
Contingencies in connection with the Broadview Project Acquisition
The Company recorded a $7 million contingent obligation, payable to a third party who holds a 1% interest in Western Interconnect, at fair value upon the acquisition of theBroadview Project. These contingent payments are subject to certain conditions, including the actual energy production of Broadview in a production year and thecontinued operation of Broadview. Additionally, the Company initially recorded a $29 million contingent obligation, payable to the same counterparty, at fair value using adiscount rate of approximately 5% upon the acquisition of the Broadview Project. The undiscounted contingent obligation is estimated to be approximately $50 million andis expected to be paid over the life of the PSA term. The contingent payment is calculated as a percentage of additional transmission revenue earned by WesternInterconnect upon Grady's commercial operation, which occurred in August 2019. For the year ended December 31, 2019, the Company has paid approximately $1 million.
Contingencies in connection with the Sale of Panhandle 2 interests
In connection with the sale of Panhandle 2, the Company agreed to indemnify PSP Investments up to $5 million to cover PSP Investments' pro rata share of the economicimpacts resulting from planned transmission outages in the Texas market until December 31, 2019. As of December 31, 2019, the Company recorded a contingent liabilityof $2 million associated with the indemnity.
Contingencies in connection with Hatchet Ridge
On January 29, 2019, Pacific Gas and Electric Company (PG&E) filed voluntary petitions for relief under Chapter 11 of the United States Bankruptcy Code in the UnitedStates Bankruptcy Court for the Northern District of California ("the Bankruptcy Court"). The Company has received all post-petition invoiced amounts through December2019. However, the pre-petition amount of $2 million that relates to production prior to the Chapter 11 filing date remained outstanding as of December 31, 2019 and willbe addressed as part of Chapter 11 process. The Company determined that it is probable that substantially all of the consideration to which the entity will be entitled for theelectricity delivered to PG&E will be collected; therefore, the Company continues to account for the PSA under ASC 606. The Company evaluated the pre-petition amountof $2 million for impairment in accordance with ASC 450, Contingencies. The Company concluded that it is reasonably possible that Hatchet Ridge's pre-petition amountmay be impaired; however, the Company did not recognize any amount for impairment for the year ended December 31, 2019. The Company will continue to monitor thebankruptcy proceedings and reassess the pre-petition amount for impairment.
Gulf Wind Re-Powering Guarantees
In December 2019, the Company guaranteed to a third-party, Gulf B Member LLC's capital contribution up to $85 million towards the repayment of the Gulf WindConstruction Loan and to fund cost overruns for Gulf Wind's re-powering of up to $7 million.
Legal Matters
As a result of the Merger Agreement, several claims have been filed to date against the Company, certain officers and directors of the Company and in some claims, CPPInvestments. Such claims generally allege that the defendants violated federal securities laws by failing to disclose material information in the version of the merger proxystatement filed with the SEC on December 13, 2019. Each claim seeks, among other things, to enjoin the Merger Agreement and recover damages, as well as an award ofthe plaintiffs' attorneys' fees and costs of litigation. The Company believes that such claims asserted are wholly without merit, but it is not possible at this time toreasonably estimate the outcome of or any potential liability from such claims.
F-59
A contractor has filed a general claim for $22 million against the Company in relation to cost overruns experienced during construction of a wind farm. It is expected thisdispute will be referred to arbitration. At this time the Company is unable to reasonably predict the outcome of these legal proceedings. While the Company believes theclaim is without merit and intends to vigorously defend against such claim an adverse outcome with respect to the legal proceedings could have a material financial impact.
From time to time, the Company has become involved in claims and legal matters arising in the ordinary course of business. Management is not currently aware of anymatters that will have a material adverse effect on the financial position, results of operations, or cash flows of the Company.
Indemnity
The Company provides a variety of indemnities in the ordinary course of business to contractual counterparties and to its lenders and other financial partners. The Companyis party to certain indemnities for the benefit of project finance lenders and tax equity partners of certain projects.
The Company also enters into indemnity agreements in the ordinary course of business with surety bond providers that issue surety bonds to contractual counterparties inconnection with the decommissioning projects and other performance obligations. Pursuant to the indemnity agreements, the Company is obligated, on a joint and severalbasis with the project company, to indemnify the surety in the event of a draw by the beneficiary. The indemnity obligation is limited to the amount of the bonds and certainrelated costs and expenses.
22. Related Party Transactions
Management fees
The Company provides management services and receives a fee for such services under agreements with its joint venture investees Belle River, North Kent, South Kent,Grand, and Armow. In connection with the Japan Acquisition, the Company receives management services related to the acquired projects and incurred a fee for suchservices under agreements with a subsidiary of Pattern Development.
Management Services Agreement and Shared Management
The Company has entered into a MSA with the Pattern Development Companies, which provides for the Company and the Pattern Development Companies to benefit,primarily on a cost-reimbursement basis, from the parties’ respective management and other professional, technical and administrative personnel, all of whom report to theCompany’s executive officers. Costs and expenses incurred at the Pattern Development Companies or their respective subsidiaries on the Company's behalf will beallocated to the Company. Conversely, costs and expenses incurred at the Company or its respective subsidiaries on the behalf of a Pattern Development Company will beallocated to the respective Pattern Development Company.
Pursuant to the MSA, certain of the Company’s executive officers, including its Chief Executive Officer (shared PEG executives), also serve as executive officers of thePattern Development Companies and devote their time to both the Company and the Pattern Development Companies as is prudent in carrying out their executiveresponsibilities and fiduciary duties. The shared PEG executives have responsibilities for both the Company and the respective Pattern Development Companies and, as aresult, these individuals do not devote all of their time to the Company’s business. Under the terms of the MSA, each of the respective Pattern Development Companies isrequired to reimburse the Company for an allocation of the compensation paid to such shared PEG executives reflecting the percentage of time spent providing services tosuch Pattern Development Company.
Interconnection Fees
Under a co-tenancy agreement between the Company and Pattern Development, Pattern Development was required to reimburse the Company $8 million for lost revenuesand PTC credits for curtailments experienced at the Broadview Facility as a result of installing the interconnection for the Grady Project.
Employee Savings Plan
The Company participates in a 401(k) plan sponsored and maintained by Pattern Energy Group LP. For the years ended December 31, 2019, 2018 and 2017, the Companycontributed $1 million, $1 million and $1 million, respectively, which was recorded as general and administrative expense on the consolidated statements of operations.
F-60
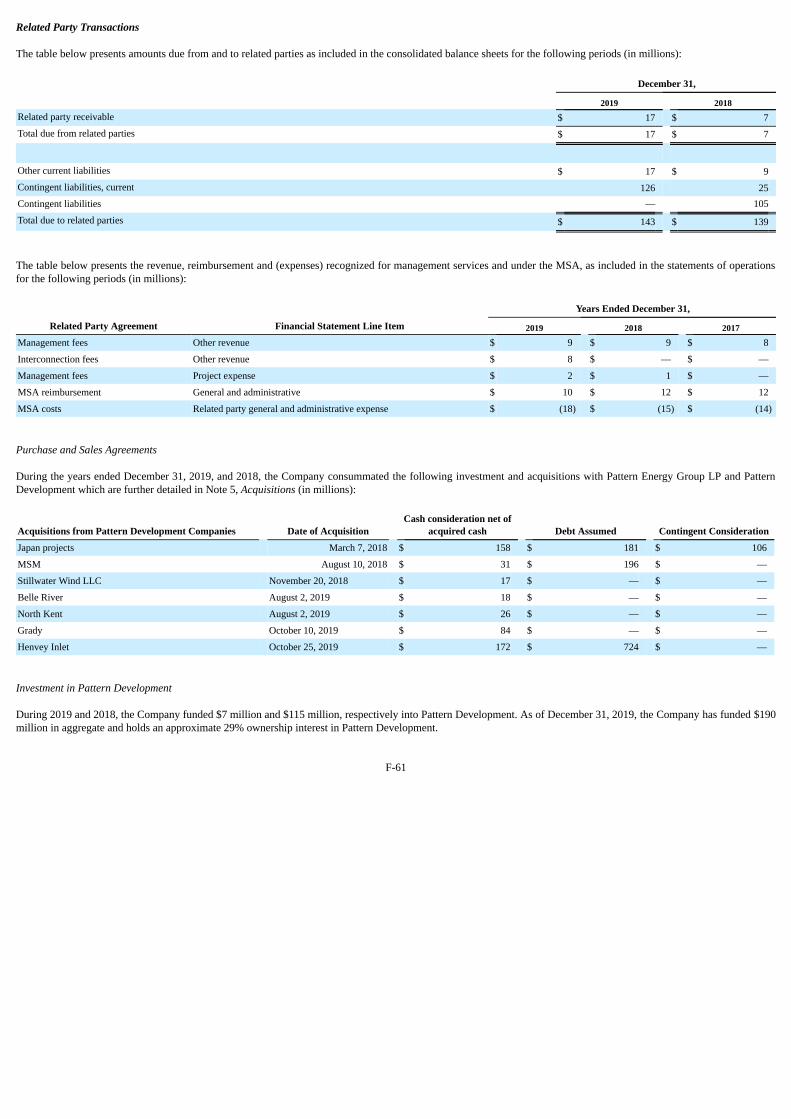
Related Party Transactions
The table below presents amounts due from and to related parties as included in the consolidated balance sheets for the following periods (in millions):
December 31,
2019 2018Related party receivable $ 17 $ 7Total due from related parties $ 17 $ 7
Other current liabilities $ 17 $ 9Contingent liabilities, current 126 25Contingent liabilities — 105
Total due to related parties $ 143 $ 139
The table below presents the revenue, reimbursement and (expenses) recognized for management services and under the MSA, as included in the statements of operationsfor the following periods (in millions):
Years Ended December 31,
Related Party Agreement Financial Statement Line Item 2019 2018 2017
Management fees Other revenue $ 9 $ 9 $ 8
Interconnection fees Other revenue $ 8 $ — $ —
Management fees Project expense $ 2 $ 1 $ —
MSA reimbursement General and administrative $ 10 $ 12 $ 12
MSA costs Related party general and administrative expense $ (18) $ (15) $ (14)
Purchase and Sales Agreements
During the years ended December 31, 2019, and 2018, the Company consummated the following investment and acquisitions with Pattern Energy Group LP and PatternDevelopment which are further detailed in Note 5, Acquisitions (in millions):
Acquisitions from Pattern Development Companies Date of Acquisition Cash consideration net of
acquired cash Debt Assumed Contingent Consideration
Japan projects March 7, 2018 $ 158 $ 181 $ 106
MSM August 10, 2018 $ 31 $ 196 $ —
Stillwater Wind LLC November 20, 2018 $ 17 $ — $ —
Belle River August 2, 2019 $ 18 $ — $ —
North Kent August 2, 2019 $ 26 $ — $ —
Grady October 10, 2019 $ 84 $ — $ —
Henvey Inlet October 25, 2019 $ 172 $ 724 $ —
Investment in Pattern Development
During 2019 and 2018, the Company funded $7 million and $115 million, respectively into Pattern Development. As of December 31, 2019, the Company has funded $190million in aggregate and holds an approximate 29% ownership interest in Pattern Development.
F-61
ERP Purchase from Pattern Energy Group LP
On March 26, 2019, the Company entered into an Intellectual Property Rights Purchase and Transfer Agreement with Pattern Energy Group LP, pursuant to which theCompany acquired certain intellectual property assets which comprise the enterprise resource planning system and associated integrated platforms developed by PatternEnergy Group LP, on a third-party software platform, (ERP) for a purchase price of $12 million. Amortization is calculated using the straight-line method over the serviceperiod of the ERP. The Company recorded amortization expense of $2 million related to the ERP for the year ended December 31, 2019. As of December 31, 2019, thecarrying value of the ERP was $10 million, net of accumulated amortization of $2 million. In addition, the Company intends to bill both Pattern Energy Group LP andPattern Development for their usage under the MSA.
Pattern Energy Group LP Earnout
In October 2019, we consummated an earnout acquisition agreement with Pattern Energy Group LP to acquire 100% of Pattern Energy Group LP's earnout rights in certaintransmission and wind projects under development, which represent 25% of the profits interest in such projects, for a purchase price of $10 million.
Development Fee
In September 2018, upon reaching a project development milestone, Tsugaru paid a development fee of approximately $15 million to an affiliate of Pattern Development.Due to the Company's equity ownership in Pattern Development, the Company has eliminated its portion of the profits realized by Pattern Development with respect to thistransaction.
Gulf Wind Re-Powering
In September 2018, the Company committed to a plan to re-power the Gulf Wind project and exercised its option to purchase turbines from an affiliate of PatternDevelopment. In 2019, the Company paid approximately $14 million to such affiliate of Pattern Development. As consideration for the Company providing WesternDevelopment flexibility with respect to the number and timing for delivery of the turbines, the affiliate of Pattern Development has agreed to pay the Company arepowering reservation charge. The Company recorded such amounts due as a reduction of the cost of the turbines.
PSP Investments Joint Venture
In June 2017, the Company entered into a Joint Venture Agreement with PSP Investments pursuant to which PSP Investments will have the right to co-invest up to anaggregate amount of approximately $500 million in projects acquired by the Company under Project Purchase Rights with the Pattern Development Companies. Inconnection with such arrangements, PSP Investments has made investments in Belle River, Grady, Meikle, MSM, Panhandle 2 and Stillwater. PSP Investments acquired a49% interest in MSM and 49% of Class B membership in Stillwater in 2018 and a 20.8% interest in Belle River and 49% of Class B membership in Grady in 2019. Prior toDecember 31, 2018, PSP Investments previously purchased approximately 9 million shares of the Company's common stock from Pattern Energy Group LP and anadditional approximately 600,000 shares from the Company.
Sponsor Services Agreement
Under the terms of a Sponsor Services Agreement with PSP Investments, the Company provides certain mutually agreed services to PSP Investments and its affiliates withrespect to the administration of the joint ownership of the project companies that PSP Investments invests in alongside the Company pursuant to the PSP Investments JointVenture Agreement in exchange for certain fees set forth in the Sponsor Services Agreement. Related party fee amounts recorded were immaterial.
F-62
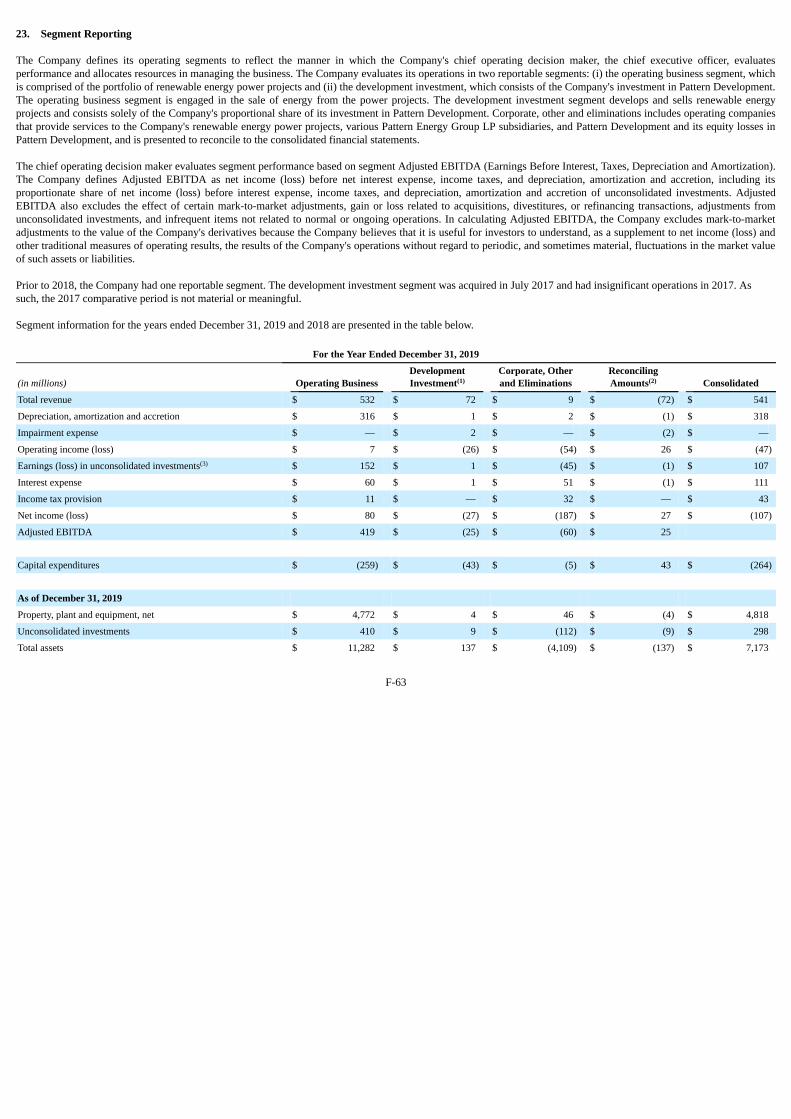
23. Segment Reporting
The Company defines its operating segments to reflect the manner in which the Company's chief operating decision maker, the chief executive officer, evaluatesperformance and allocates resources in managing the business. The Company evaluates its operations in two reportable segments: (i) the operating business segment, whichis comprised of the portfolio of renewable energy power projects and (ii) the development investment, which consists of the Company's investment in Pattern Development.The operating business segment is engaged in the sale of energy from the power projects. The development investment segment develops and sells renewable energyprojects and consists solely of the Company's proportional share of its investment in Pattern Development. Corporate, other and eliminations includes operating companiesthat provide services to the Company's renewable energy power projects, various Pattern Energy Group LP subsidiaries, and Pattern Development and its equity losses inPattern Development, and is presented to reconcile to the consolidated financial statements.
The chief operating decision maker evaluates segment performance based on segment Adjusted EBITDA (Earnings Before Interest, Taxes, Depreciation and Amortization).The Company defines Adjusted EBITDA as net income (loss) before net interest expense, income taxes, and depreciation, amortization and accretion, including itsproportionate share of net income (loss) before interest expense, income taxes, and depreciation, amortization and accretion of unconsolidated investments. AdjustedEBITDA also excludes the effect of certain mark-to-market adjustments, gain or loss related to acquisitions, divestitures, or refinancing transactions, adjustments fromunconsolidated investments, and infrequent items not related to normal or ongoing operations. In calculating Adjusted EBITDA, the Company excludes mark-to-marketadjustments to the value of the Company's derivatives because the Company believes that it is useful for investors to understand, as a supplement to net income (loss) andother traditional measures of operating results, the results of the Company's operations without regard to periodic, and sometimes material, fluctuations in the market valueof such assets or liabilities.
Prior to 2018, the Company had one reportable segment. The development investment segment was acquired in July 2017 and had insignificant operations in 2017. Assuch, the 2017 comparative period is not material or meaningful.
Segment information for the years ended December 31, 2019 and 2018 are presented in the table below.
For the Year Ended December 31, 2019
(in millions) Operating Business DevelopmentInvestment(1)
Corporate, Otherand Eliminations
ReconcilingAmounts(2) Consolidated
Total revenue $ 532 $ 72 $ 9 $ (72) $ 541
Depreciation, amortization and accretion $ 316 $ 1 $ 2 $ (1) $ 318
Impairment expense $ — $ 2 $ — $ (2) $ —
Operating income (loss) $ 7 $ (26) $ (54) $ 26 $ (47)
Earnings (loss) in unconsolidated investments(3) $ 152 $ 1 $ (45) $ (1) $ 107
Interest expense $ 60 $ 1 $ 51 $ (1) $ 111
Income tax provision $ 11 $ — $ 32 $ — $ 43
Net income (loss) $ 80 $ (27) $ (187) $ 27 $ (107)
Adjusted EBITDA $ 419 $ (25) $ (60) $ 25 Capital expenditures $ (259) $ (43) $ (5) $ 43 $ (264)
As of December 31, 2019 Property, plant and equipment, net $ 4,772 $ 4 $ 46 $ (4) $ 4,818
Unconsolidated investments $ 410 $ 9 $ (112) $ (9) $ 298
Total assets $ 11,282 $ 137 $ (4,109) $ (137) $ 7,173
F-63
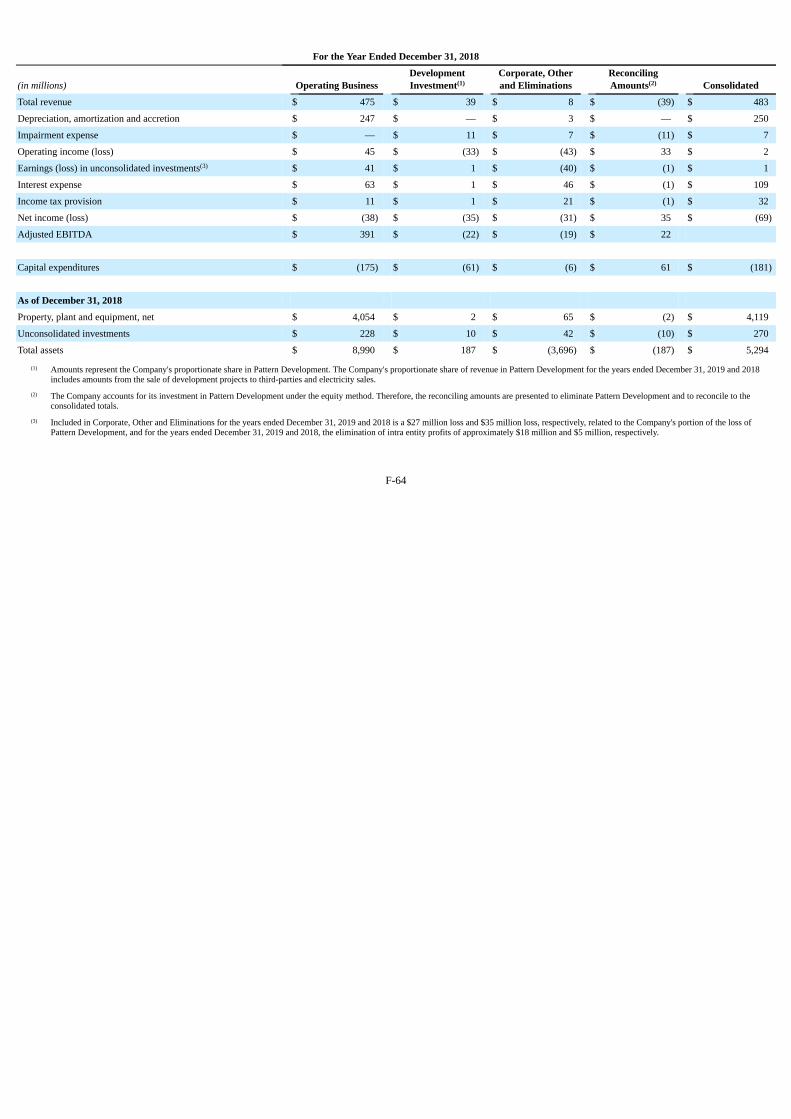
For the Year Ended December 31, 2018
(in millions) Operating BusinessDevelopmentInvestment(1)
Corporate, Otherand Eliminations
ReconcilingAmounts(2) Consolidated
Total revenue $ 475 $ 39 $ 8 $ (39) $ 483
Depreciation, amortization and accretion $ 247 $ — $ 3 $ — $ 250
Impairment expense $ — $ 11 $ 7 $ (11) $ 7
Operating income (loss) $ 45 $ (33) $ (43) $ 33 $ 2
Earnings (loss) in unconsolidated investments(3) $ 41 $ 1 $ (40) $ (1) $ 1
Interest expense $ 63 $ 1 $ 46 $ (1) $ 109
Income tax provision $ 11 $ 1 $ 21 $ (1) $ 32
Net income (loss) $ (38) $ (35) $ (31) $ 35 $ (69)
Adjusted EBITDA $ 391 $ (22) $ (19) $ 22
Capital expenditures $ (175) $ (61) $ (6) $ 61 $ (181)
As of December 31, 2018 Property, plant and equipment, net $ 4,054 $ 2 $ 65 $ (2) $ 4,119
Unconsolidated investments $ 228 $ 10 $ 42 $ (10) $ 270
Total assets $ 8,990 $ 187 $ (3,696) $ (187) $ 5,294
(1) Amounts represent the Company's proportionate share in Pattern Development. The Company's proportionate share of revenue in Pattern Development for the years ended December 31, 2019 and 2018includes amounts from the sale of development projects to third-parties and electricity sales.
(2) The Company accounts for its investment in Pattern Development under the equity method. Therefore, the reconciling amounts are presented to eliminate Pattern Development and to reconcile to theconsolidated totals.
(3) Included in Corporate, Other and Eliminations for the years ended December 31, 2019 and 2018 is a $27 million loss and $35 million loss, respectively, related to the Company's portion of the loss ofPattern Development, and for the years ended December 31, 2019 and 2018, the elimination of intra entity profits of approximately $18 million and $5 million, respectively.
F-64
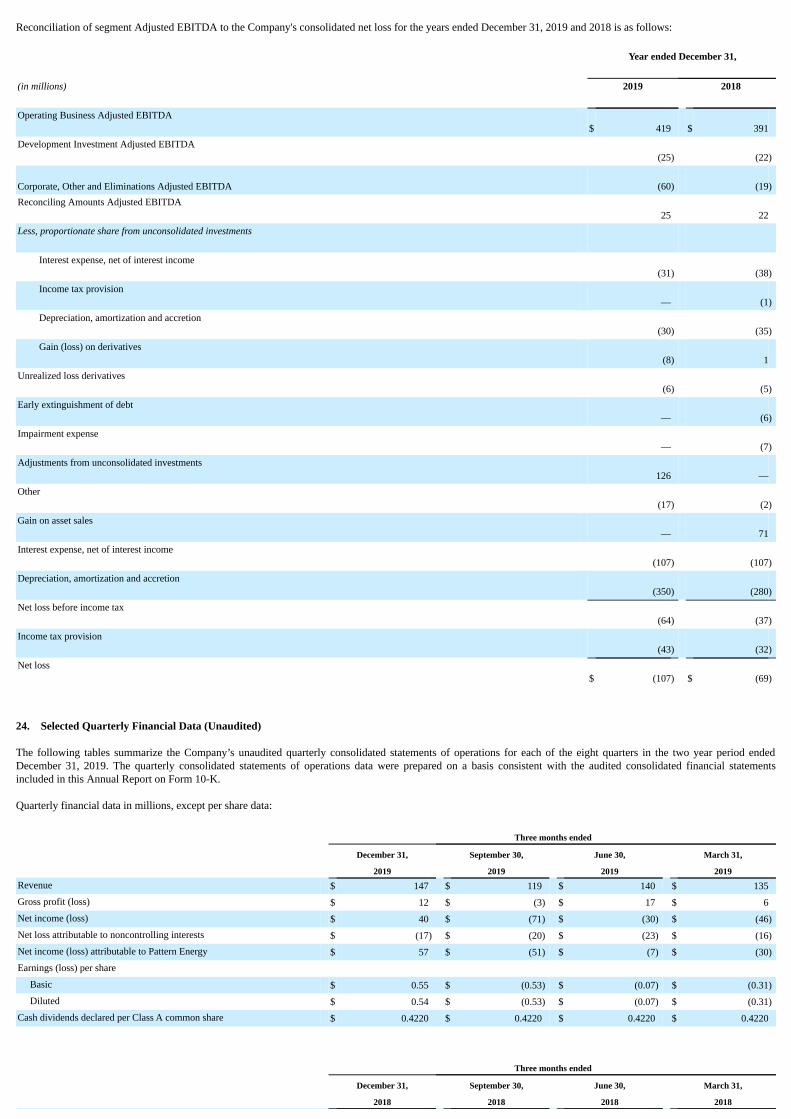
Reconciliation of segment Adjusted EBITDA to the Company's consolidated net loss for the years ended December 31, 2019 and 2018 is as follows:
Year ended December 31,
(in millions) 2019
2018
Operating Business Adjusted EBITDA$ 419 $ 391
Development Investment Adjusted EBITDA(25) (22)
Corporate, Other and Eliminations Adjusted EBITDA (60) (19)Reconciling Amounts Adjusted EBITDA
25 22Less, proportionate share from unconsolidated investments
Interest expense, net of interest income
(31) (38)Income tax provision
— (1)Depreciation, amortization and accretion
(30) (35)Gain (loss) on derivatives
(8) 1Unrealized loss derivatives
(6) (5)Early extinguishment of debt
— (6)Impairment expense
— (7)Adjustments from unconsolidated investments
126 —Other
(17) (2)Gain on asset sales
— 71Interest expense, net of interest income
(107) (107)Depreciation, amortization and accretion
(350) (280)Net loss before income tax
(64) (37)Income tax provision
(43) (32)Net loss
$ (107) $ (69)
24. Selected Quarterly Financial Data (Unaudited)
The following tables summarize the Company’s unaudited quarterly consolidated statements of operations for each of the eight quarters in the two year period endedDecember 31, 2019. The quarterly consolidated statements of operations data were prepared on a basis consistent with the audited consolidated financial statementsincluded in this Annual Report on Form 10-K.
Quarterly financial data in millions, except per share data:
Three months ended
December 31, September 30, June 30, March 31,
2019 2019 2019 2019Revenue $ 147 $ 119 $ 140 $ 135Gross profit (loss) $ 12 $ (3) $ 17 $ 6Net income (loss) $ 40 $ (71) $ (30) $ (46)Net loss attributable to noncontrolling interests $ (17) $ (20) $ (23) $ (16)Net income (loss) attributable to Pattern Energy $ 57 $ (51) $ (7) $ (30)Earnings (loss) per share Basic $ 0.55 $ (0.53) $ (0.07) $ (0.31) Diluted $ 0.54 $ (0.53) $ (0.07) $ (0.31)Cash dividends declared per Class A common share $ 0.4220 $ 0.4220 $ 0.4220 $ 0.4220
Three months ended
December 31, September 30, June 30, March 31,
2018 2018 2018 2018
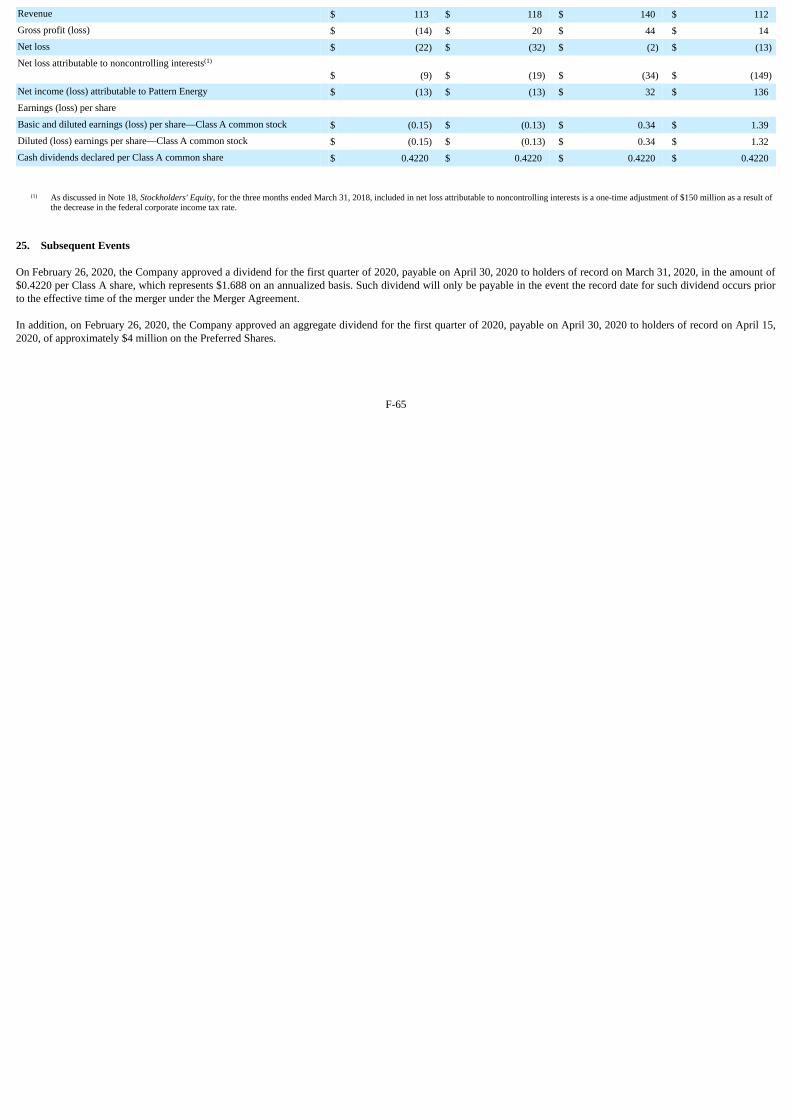
Revenue $ 113 $ 118 $ 140 $ 112Gross profit (loss) $ (14) $ 20 $ 44 $ 14Net loss $ (22) $ (32) $ (2) $ (13)Net loss attributable to noncontrolling interests(1)
$ (9) $ (19) $ (34) $ (149)Net income (loss) attributable to Pattern Energy $ (13) $ (13) $ 32 $ 136Earnings (loss) per share Basic and diluted earnings (loss) per share—Class A common stock $ (0.15) $ (0.13) $ 0.34 $ 1.39Diluted (loss) earnings per share—Class A common stock $ (0.15) $ (0.13) $ 0.34 $ 1.32Cash dividends declared per Class A common share $ 0.4220 $ 0.4220 $ 0.4220 $ 0.4220
(1) As discussed in Note 18, Stockholders' Equity, for the three months ended March 31, 2018, included in net loss attributable to noncontrolling interests is a one-time adjustment of $150 million as a result ofthe decrease in the federal corporate income tax rate.
25. Subsequent Events
On February 26, 2020, the Company approved a dividend for the first quarter of 2020, payable on April 30, 2020 to holders of record on March 31, 2020, in the amount of$0.4220 per Class A share, which represents $1.688 on an annualized basis. Such dividend will only be payable in the event the record date for such dividend occurs priorto the effective time of the merger under the Merger Agreement.
In addition, on February 26, 2020, the Company approved an aggregate dividend for the first quarter of 2020, payable on April 30, 2020 to holders of record on April 15,2020, of approximately $4 million on the Preferred Shares.
F-65

South Kent Wind LP
Financial Statementsin accordance with accounting principlesgenerally accepted in the United Statesof America (U.S. GAAP)December 31, 2019
(In thousands of Canadian Dollars)
S-1

South Kent Wind LP
Contents Page
Independent Auditor’s Report S-3
Financial Statements Balance Sheets S-4Statements of Operations and Comprehensive Income S-5Statements of Changes in Partners’ Equity S-6Statements of Cash Flows S-7Notes to Financial Statements S-8
S-2

Report of Independent Registered Public Accounting Firm
To the Board of Directors and Partners of South Kent Wind LP
Opinion on the Financial StatementsWe have audited the accompanying balance sheet of South Kent Wind LP (the Partnership) as of December 31, 2019, and the statements of operations and comprehensiveincome, statements of changes in partners’ equity and statements of cash flows for the years ended December 31, 2019 and 2017, including the related notes (collectivelyreferred to as the financial statements). In our opinion, the financial statements present fairly, in all material respects, the financial position of the Partnership as ofDecember 31, 2019, and the results of its operations and its cash flows for the years ended December 31, 2019 and 2017 in conformity with accounting principles generallyaccepted in the United States of America.
The accompanying balance sheet of the Partnership as of December 31, 2018, and the related statements of operations and comprehensive income, statement of changes inpartners’ equity and statement of cash flows for the year ended December 31, 2018 are presented for purposes of complying with Rule 3-09 of SEC Regulation S-X;however, Rule 3-09 does not require the 2018 financial statements to be audited and they are therefore not covered by this report.
Change in Accounting PrincipleAs discussed in note 2 to the financial statements, the Partnership changed the manner in which it accounts for leases in 2019 to comply with the requirements of ASC 842,Leases.
Basis for OpinionThese financial statements are the responsibility of the Partnership’s management. Our responsibility is to express an opinion on the Partnership’s financial statementsbased on our audits. We are a public accounting firm registered with the Public Company Accounting Oversight Board (United States) (PCAOB) and are required to beindependent with respect to the Partnership in accordance with the U.S. federal securities laws and the applicable rules and regulations of the Securities and ExchangeCommission and the PCAOB.
We conducted our audits of these financial statements in accordance with the standards of the PCAOB. Those standards require that we plan and perform the audit to obtainreasonable assurance about whether the financial statements are free of material misstatement, whether due to error or fraud.
Our audits included performing procedures to assess the risks of material misstatement of the financial statements, whether due to error or fraud, and performing proceduresthat respond to those risks. Such procedures included examining, on a test basis, evidence regarding the amounts and disclosures in the financial statements. Our audits alsoincluded evaluating the accounting principles used and significant estimates made by management, as well as evaluating the overall presentation of the financial statements.We believe that our audits provide a reasonable basis for our opinion.
/s/PricewaterhouseCoopers LLP
Chartered Professional Accountants, Licensed Public Accountants
Toronto, Ontario, CanadaFebruary 14, 2020
We have served as the Partnership’s auditor since 2011.
S-3
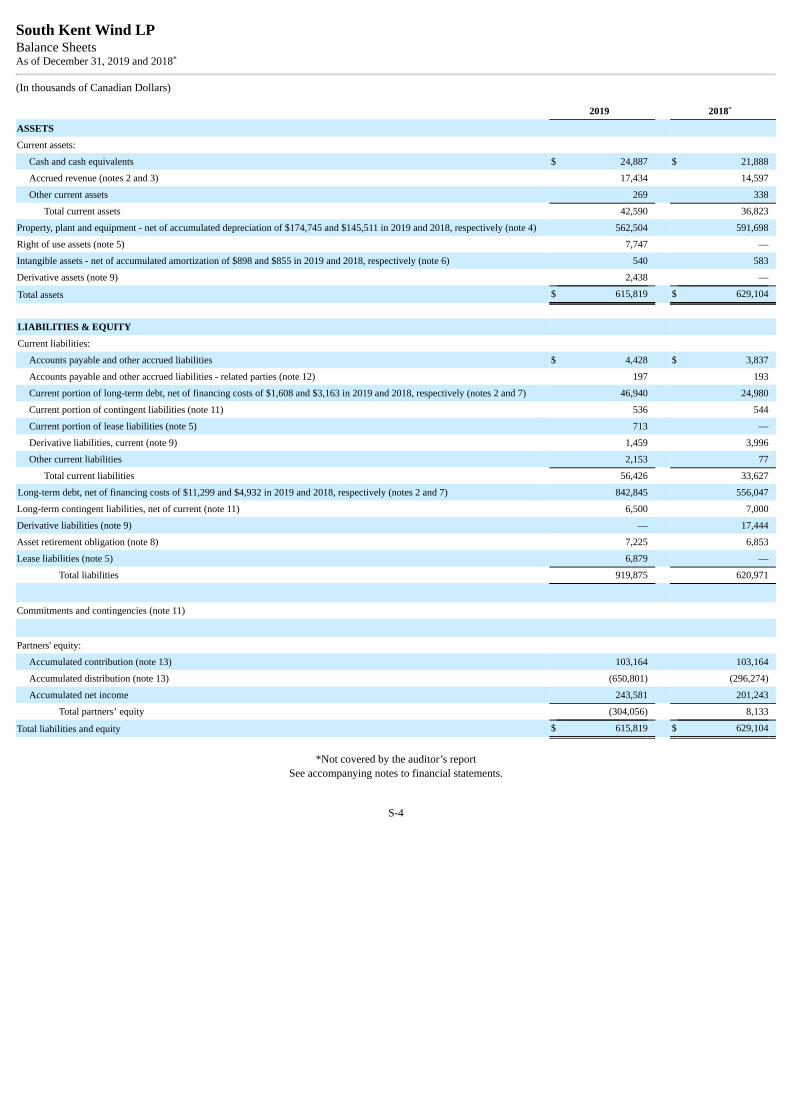
South Kent Wind LPBalance SheetsAs of December 31, 2019 and 2018*
(In thousands of Canadian Dollars)
2019 2018*
ASSETS Current assets:
Cash and cash equivalents $ 24,887 $ 21,888
Accrued revenue (notes 2 and 3) 17,434 14,597
Other current assets 269 338
Total current assets 42,590 36,823
Property, plant and equipment - net of accumulated depreciation of $174,745 and $145,511 in 2019 and 2018, respectively (note 4) 562,504 591,698
Right of use assets (note 5) 7,747 —
Intangible assets - net of accumulated amortization of $898 and $855 in 2019 and 2018, respectively (note 6) 540 583
Derivative assets (note 9) 2,438 —
Total assets $ 615,819 $ 629,104
LIABILITIES & EQUITY Current liabilities:
Accounts payable and other accrued liabilities $ 4,428 $ 3,837
Accounts payable and other accrued liabilities - related parties (note 12) 197 193
Current portion of long-term debt, net of financing costs of $1,608 and $3,163 in 2019 and 2018, respectively (notes 2 and 7) 46,940 24,980
Current portion of contingent liabilities (note 11) 536 544
Current portion of lease liabilities (note 5) 713 —
Derivative liabilities, current (note 9) 1,459 3,996
Other current liabilities 2,153 77
Total current liabilities 56,426 33,627
Long-term debt, net of financing costs of $11,299 and $4,932 in 2019 and 2018, respectively (notes 2 and 7) 842,845 556,047
Long-term contingent liabilities, net of current (note 11) 6,500 7,000
Derivative liabilities (note 9) — 17,444
Asset retirement obligation (note 8) 7,225 6,853
Lease liabilities (note 5) 6,879 —
Total liabilities 919,875 620,971
Commitments and contingencies (note 11)
Partners' equity: Accumulated contribution (note 13) 103,164 103,164
Accumulated distribution (note 13) (650,801) (296,274)
Accumulated net income 243,581 201,243
Total partners’ equity (304,056) 8,133
Total liabilities and equity $ 615,819 $ 629,104
*Not covered by the auditor’s reportSee accompanying notes to financial statements.
S-4
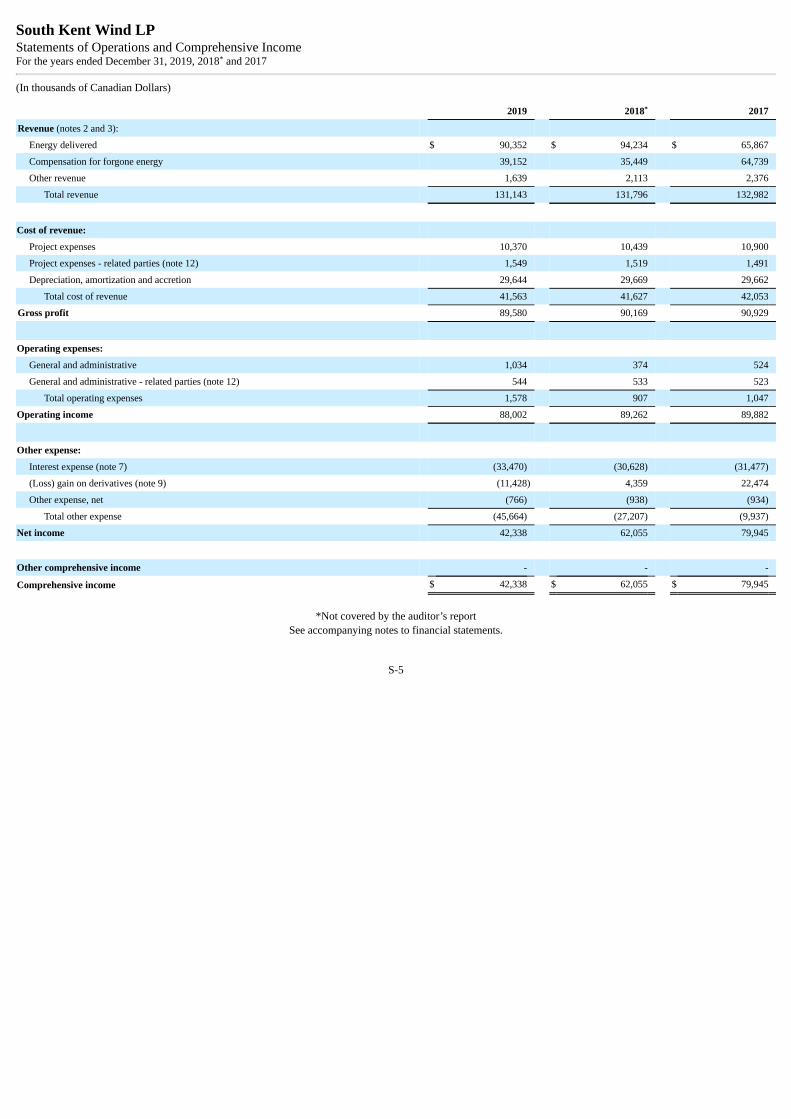
South Kent Wind LPStatements of Operations and Comprehensive IncomeFor the years ended December 31, 2019, 2018* and 2017
(In thousands of Canadian Dollars)
2019 2018* 2017
Revenue (notes 2 and 3): Energy delivered $ 90,352 $ 94,234 $ 65,867
Compensation for forgone energy 39,152 35,449 64,739
Other revenue 1,639 2,113 2,376
Total revenue 131,143 131,796 132,982
Cost of revenue: Project expenses 10,370 10,439 10,900
Project expenses - related parties (note 12) 1,549 1,519 1,491
Depreciation, amortization and accretion 29,644 29,669 29,662
Total cost of revenue 41,563 41,627 42,053
Gross profit 89,580 90,169 90,929
Operating expenses: General and administrative 1,034 374 524
General and administrative - related parties (note 12) 544 533 523
Total operating expenses 1,578 907 1,047
Operating income 88,002 89,262 89,882
Other expense: Interest expense (note 7) (33,470) (30,628) (31,477)
(Loss) gain on derivatives (note 9) (11,428) 4,359 22,474
Other expense, net (766) (938) (934)
Total other expense (45,664) (27,207) (9,937)
Net income 42,338 62,055 79,945
Other comprehensive income - - -
Comprehensive income $ 42,338 $ 62,055 $ 79,945
*Not covered by the auditor’s reportSee accompanying notes to financial statements.
S-5
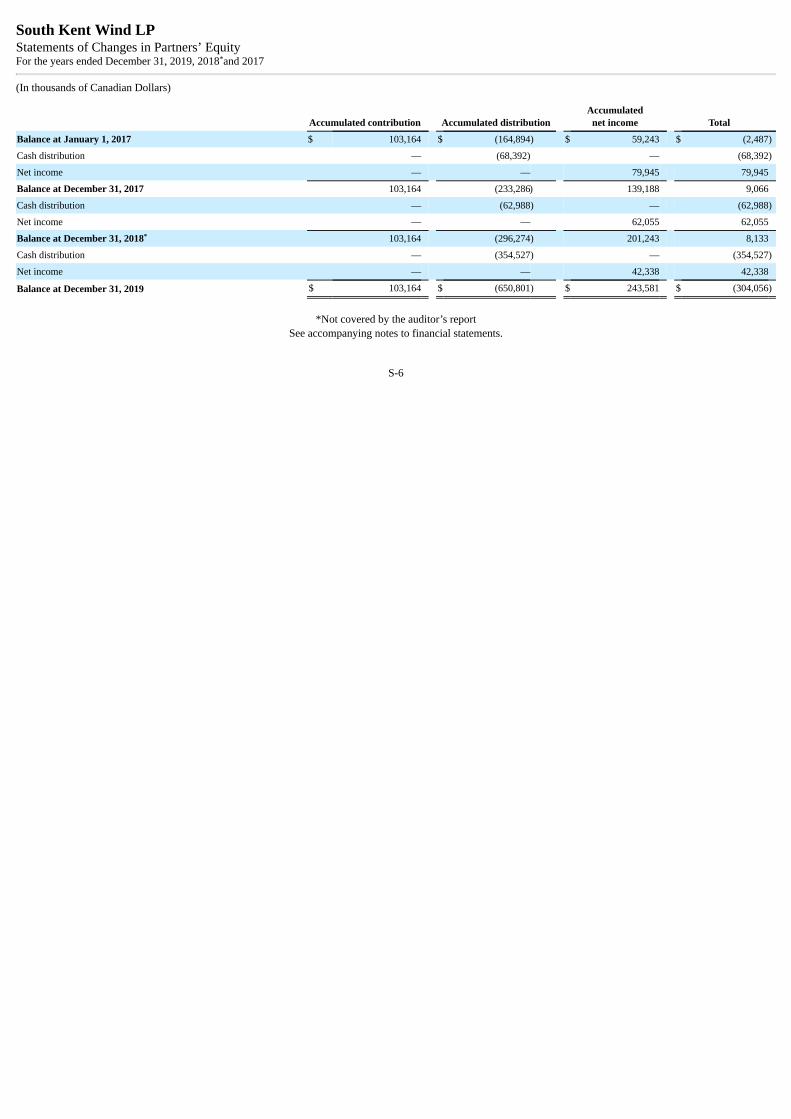
South Kent Wind LPStatements of Changes in Partners’ EquityFor the years ended December 31, 2019, 2018*and 2017
(In thousands of Canadian Dollars)
Accumulated contribution Accumulated distribution Accumulated
net income Total
Balance at January 1, 2017 $ 103,164 $ (164,894) $ 59,243 $ (2,487)
Cash distribution — (68,392) — (68,392)
Net income — — 79,945 79,945
Balance at December 31, 2017 103,164 (233,286) 139,188 9,066
Cash distribution — (62,988) — (62,988)
Net income — — 62,055 62,055
Balance at December 31, 2018* 103,164 (296,274) 201,243 8,133
Cash distribution — (354,527) — (354,527)
Net income — — 42,338 42,338
Balance at December 31, 2019 $ 103,164 $ (650,801) $ 243,581 $ (304,056)
*Not covered by the auditor’s reportSee accompanying notes to financial statements.
S-6

South Kent Wind LPStatements of Cash FlowsFor the years ended December 31, 2019, 2018* and 2017
(In thousands of Canadian Dollars)
2019 2018* 2017
Cash flows from operating activities: Net income $ 42,338 $ 62,055 $ 79,945
Adjustment to reconcile net income to net cash provided by operating activities: Loss (gain) on derivatives 11,428 (4,359) (22,474)
Depreciation, amortization and accretion 29,644 29,668 29,662
Amortization of deferred financing costs 6,829 3,297 3,426
Amortization of lease liabilities 253 — —
Changes in assets and liabilities, net: Accrued revenue (2,837) 6,314 794
Accounts payable and other accrued liabilities 587 629 (3)
Lease liabilities (294) — —
Other, net 3,028 (111) 118
Net cash provided by operating activities 90,976 97,493 91,468
Cash flows from investing activities: Capital expenditures (535) (622) (610)
Net cash used in investing activities (535) (622) (610)
Cash flows from financing activities: Proceeds from long-term debt 902,692 — —
Deferred financing costs paid (11,642) — —
Repayment of long-term debt (589,121) (26,819) (25,773)
Payment for extinguishing hedges (34,844) — —
Distribution to partners (354,527) (62,988) (68,392)
Net cash used in financing activities (87,442) (89,807) (94,165)
Net change in cash, cash equivalents and restricted cash 2,999 7,064 (3,307)
Cash, cash equivalents and restricted cash - Beginning 21,888 14,824 18,131
Cash, cash equivalents and restricted cash - Ending $ 24,887 $ 21,888 $ 14,824
Supplemental disclosure: Cash payments for interest and commitment fees $ 23,599 $ 27,486 $ 27,978
*Not covered by the auditor’s reportSee accompanying notes to financial statements.
S-7
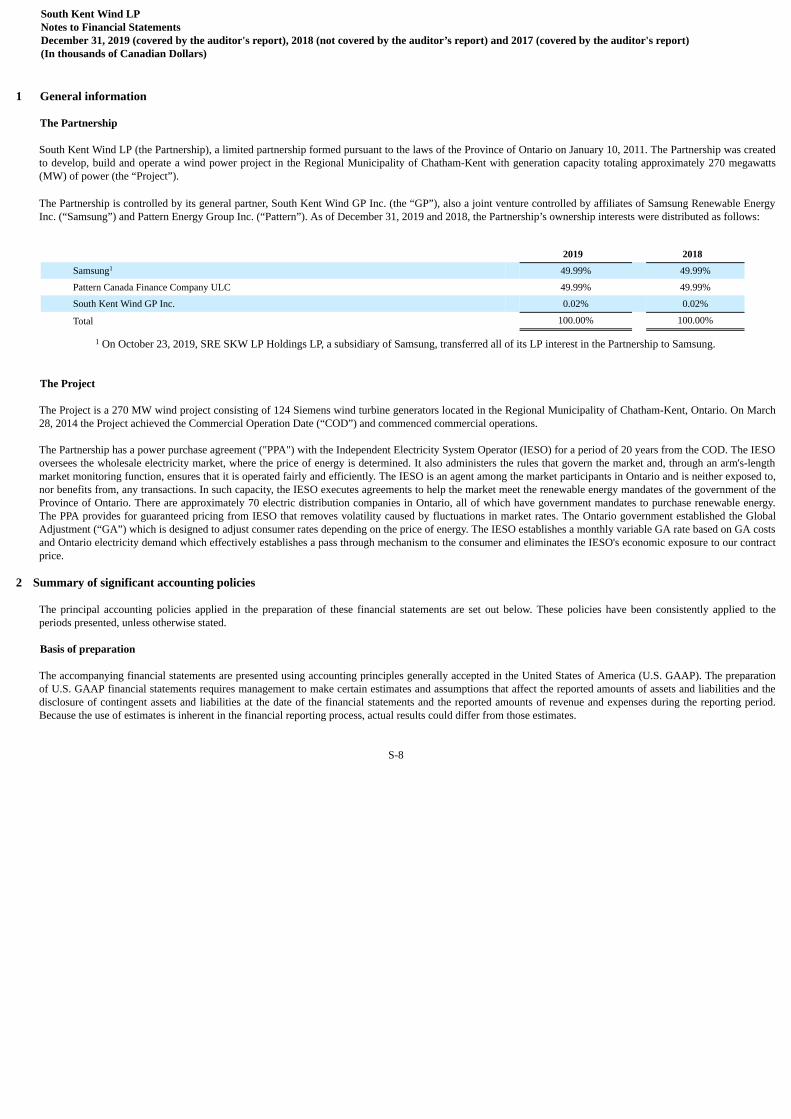
South Kent Wind LPNotes to Financial StatementsDecember 31, 2019 (covered by the auditor's report), 2018 (not covered by the auditor’s report) and 2017 (covered by the auditor's report)(In thousands of Canadian Dollars)
1 General information
The Partnership
South Kent Wind LP (the Partnership), a limited partnership formed pursuant to the laws of the Province of Ontario on January 10, 2011. The Partnership was createdto develop, build and operate a wind power project in the Regional Municipality of Chatham-Kent with generation capacity totaling approximately 270 megawatts(MW) of power (the “Project”).
The Partnership is controlled by its general partner, South Kent Wind GP Inc. (the “GP”), also a joint venture controlled by affiliates of Samsung Renewable EnergyInc. (“Samsung”) and Pattern Energy Group Inc. (“Pattern”). As of December 31, 2019 and 2018, the Partnership’s ownership interests were distributed as follows:
2019 2018
Samsung1 49.99% 49.99%
Pattern Canada Finance Company ULC 49.99% 49.99%
South Kent Wind GP Inc. 0.02% 0.02%
Total 100.00% 100.00%
1 On October 23, 2019, SRE SKW LP Holdings LP, a subsidiary of Samsung, transferred all of its LP interest in the Partnership to Samsung.
The Project
The Project is a 270 MW wind project consisting of 124 Siemens wind turbine generators located in the Regional Municipality of Chatham-Kent, Ontario. On March28, 2014 the Project achieved the Commercial Operation Date (“COD”) and commenced commercial operations.
The Partnership has a power purchase agreement ("PPA") with the Independent Electricity System Operator (IESO) for a period of 20 years from the COD. The IESOoversees the wholesale electricity market, where the price of energy is determined. It also administers the rules that govern the market and, through an arm's-lengthmarket monitoring function, ensures that it is operated fairly and efficiently. The IESO is an agent among the market participants in Ontario and is neither exposed to,nor benefits from, any transactions. In such capacity, the IESO executes agreements to help the market meet the renewable energy mandates of the government of theProvince of Ontario. There are approximately 70 electric distribution companies in Ontario, all of which have government mandates to purchase renewable energy.The PPA provides for guaranteed pricing from IESO that removes volatility caused by fluctuations in market rates. The Ontario government established the GlobalAdjustment (“GA”) which is designed to adjust consumer rates depending on the price of energy. The IESO establishes a monthly variable GA rate based on GA costsand Ontario electricity demand which effectively establishes a pass through mechanism to the consumer and eliminates the IESO's economic exposure to our contractprice.
2 Summary of significant accounting policies
The principal accounting policies applied in the preparation of these financial statements are set out below. These policies have been consistently applied to theperiods presented, unless otherwise stated.
Basis of preparation
The accompanying financial statements are presented using accounting principles generally accepted in the United States of America (U.S. GAAP). The preparationof U.S. GAAP financial statements requires management to make certain estimates and assumptions that affect the reported amounts of assets and liabilities and thedisclosure of contingent assets and liabilities at the date of the financial statements and the reported amounts of revenue and expenses during the reporting period.Because the use of estimates is inherent in the financial reporting process, actual results could differ from those estimates.
S-8
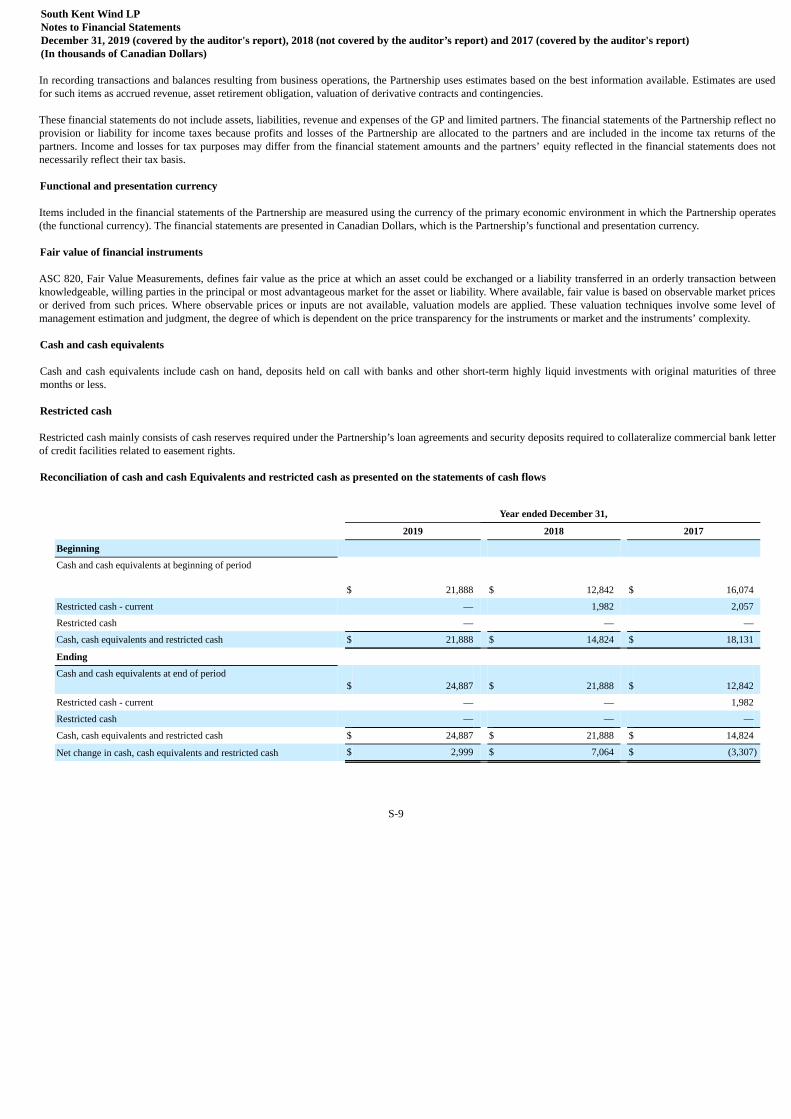
South Kent Wind LPNotes to Financial StatementsDecember 31, 2019 (covered by the auditor's report), 2018 (not covered by the auditor’s report) and 2017 (covered by the auditor's report)(In thousands of Canadian Dollars)
In recording transactions and balances resulting from business operations, the Partnership uses estimates based on the best information available. Estimates are usedfor such items as accrued revenue, asset retirement obligation, valuation of derivative contracts and contingencies.
These financial statements do not include assets, liabilities, revenue and expenses of the GP and limited partners. The financial statements of the Partnership reflect noprovision or liability for income taxes because profits and losses of the Partnership are allocated to the partners and are included in the income tax returns of thepartners. Income and losses for tax purposes may differ from the financial statement amounts and the partners’ equity reflected in the financial statements does notnecessarily reflect their tax basis.
Functional and presentation currency
Items included in the financial statements of the Partnership are measured using the currency of the primary economic environment in which the Partnership operates(the functional currency). The financial statements are presented in Canadian Dollars, which is the Partnership’s functional and presentation currency.
Fair value of financial instruments
ASC 820, Fair Value Measurements, defines fair value as the price at which an asset could be exchanged or a liability transferred in an orderly transaction betweenknowledgeable, willing parties in the principal or most advantageous market for the asset or liability. Where available, fair value is based on observable market pricesor derived from such prices. Where observable prices or inputs are not available, valuation models are applied. These valuation techniques involve some level ofmanagement estimation and judgment, the degree of which is dependent on the price transparency for the instruments or market and the instruments’ complexity.
Cash and cash equivalents
Cash and cash equivalents include cash on hand, deposits held on call with banks and other short-term highly liquid investments with original maturities of threemonths or less.
Restricted cash
Restricted cash mainly consists of cash reserves required under the Partnership’s loan agreements and security deposits required to collateralize commercial bank letterof credit facilities related to easement rights.
Reconciliation of cash and cash Equivalents and restricted cash as presented on the statements of cash flows
Year ended December 31,
2019 2018 2017
Beginning Cash and cash equivalents at beginning of period
$ 21,888 $ 12,842 $ 16,074
Restricted cash - current — 1,982 2,057
Restricted cash — — —
Cash, cash equivalents and restricted cash $ 21,888 $ 14,824 $ 18,131
Ending Cash and cash equivalents at end of period
$ 24,887 $ 21,888 $ 12,842
Restricted cash - current — — 1,982
Restricted cash — — —
Cash, cash equivalents and restricted cash $ 24,887 $ 21,888 $ 14,824
Net change in cash, cash equivalents and restricted cash $ 2,999 $ 7,064 $ (3,307)
S-9
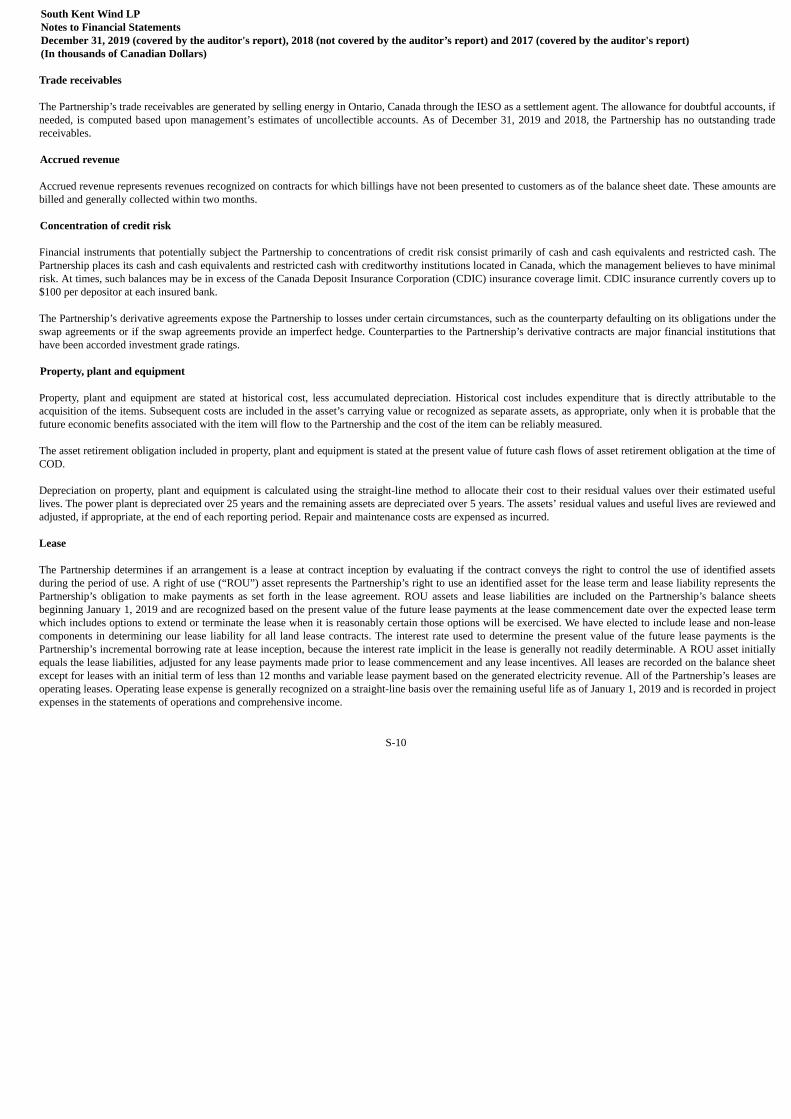
South Kent Wind LPNotes to Financial StatementsDecember 31, 2019 (covered by the auditor's report), 2018 (not covered by the auditor’s report) and 2017 (covered by the auditor's report)(In thousands of Canadian Dollars)
Trade receivables
The Partnership’s trade receivables are generated by selling energy in Ontario, Canada through the IESO as a settlement agent. The allowance for doubtful accounts, ifneeded, is computed based upon management’s estimates of uncollectible accounts. As of December 31, 2019 and 2018, the Partnership has no outstanding tradereceivables.
Accrued revenue
Accrued revenue represents revenues recognized on contracts for which billings have not been presented to customers as of the balance sheet date. These amounts arebilled and generally collected within two months.
Concentration of credit risk
Financial instruments that potentially subject the Partnership to concentrations of credit risk consist primarily of cash and cash equivalents and restricted cash. ThePartnership places its cash and cash equivalents and restricted cash with creditworthy institutions located in Canada, which the management believes to have minimalrisk. At times, such balances may be in excess of the Canada Deposit Insurance Corporation (CDIC) insurance coverage limit. CDIC insurance currently covers up to$100 per depositor at each insured bank.
The Partnership’s derivative agreements expose the Partnership to losses under certain circumstances, such as the counterparty defaulting on its obligations under theswap agreements or if the swap agreements provide an imperfect hedge. Counterparties to the Partnership’s derivative contracts are major financial institutions thathave been accorded investment grade ratings.
Property, plant and equipment
Property, plant and equipment are stated at historical cost, less accumulated depreciation. Historical cost includes expenditure that is directly attributable to theacquisition of the items. Subsequent costs are included in the asset’s carrying value or recognized as separate assets, as appropriate, only when it is probable that thefuture economic benefits associated with the item will flow to the Partnership and the cost of the item can be reliably measured.
The asset retirement obligation included in property, plant and equipment is stated at the present value of future cash flows of asset retirement obligation at the time ofCOD.
Depreciation on property, plant and equipment is calculated using the straight-line method to allocate their cost to their residual values over their estimated usefullives. The power plant is depreciated over 25 years and the remaining assets are depreciated over 5 years. The assets’ residual values and useful lives are reviewed andadjusted, if appropriate, at the end of each reporting period. Repair and maintenance costs are expensed as incurred.
Lease
The Partnership determines if an arrangement is a lease at contract inception by evaluating if the contract conveys the right to control the use of identified assetsduring the period of use. A right of use (“ROU”) asset represents the Partnership’s right to use an identified asset for the lease term and lease liability represents thePartnership’s obligation to make payments as set forth in the lease agreement. ROU assets and lease liabilities are included on the Partnership’s balance sheetsbeginning January 1, 2019 and are recognized based on the present value of the future lease payments at the lease commencement date over the expected lease termwhich includes options to extend or terminate the lease when it is reasonably certain those options will be exercised. We have elected to include lease and non-leasecomponents in determining our lease liability for all land lease contracts. The interest rate used to determine the present value of the future lease payments is thePartnership’s incremental borrowing rate at lease inception, because the interest rate implicit in the lease is generally not readily determinable. A ROU asset initiallyequals the lease liabilities, adjusted for any lease payments made prior to lease commencement and any lease incentives. All leases are recorded on the balance sheetexcept for leases with an initial term of less than 12 months and variable lease payment based on the generated electricity revenue. All of the Partnership’s leases areoperating leases. Operating lease expense is generally recognized on a straight-line basis over the remaining useful life as of January 1, 2019 and is recorded in projectexpenses in the statements of operations and comprehensive income.
S-10
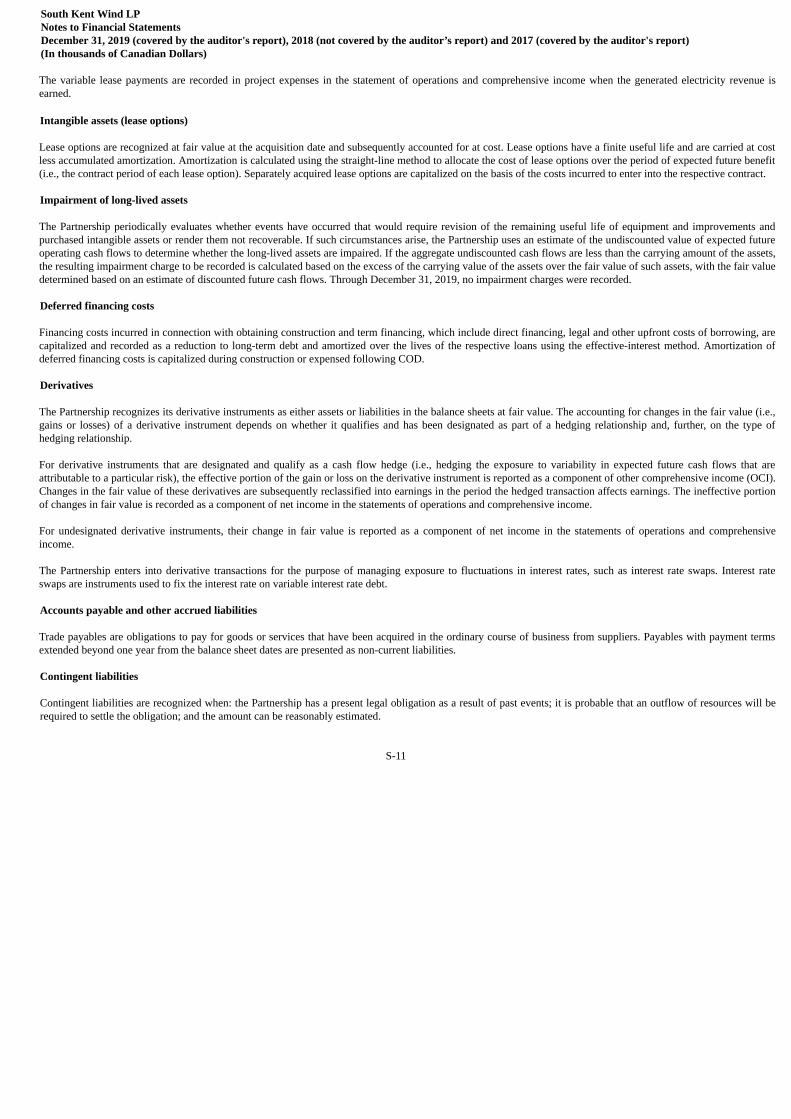
South Kent Wind LPNotes to Financial StatementsDecember 31, 2019 (covered by the auditor's report), 2018 (not covered by the auditor’s report) and 2017 (covered by the auditor's report)(In thousands of Canadian Dollars)
The variable lease payments are recorded in project expenses in the statement of operations and comprehensive income when the generated electricity revenue isearned.
Intangible assets (lease options)
Lease options are recognized at fair value at the acquisition date and subsequently accounted for at cost. Lease options have a finite useful life and are carried at costless accumulated amortization. Amortization is calculated using the straight-line method to allocate the cost of lease options over the period of expected future benefit(i.e., the contract period of each lease option). Separately acquired lease options are capitalized on the basis of the costs incurred to enter into the respective contract.
Impairment of long-lived assets
The Partnership periodically evaluates whether events have occurred that would require revision of the remaining useful life of equipment and improvements andpurchased intangible assets or render them not recoverable. If such circumstances arise, the Partnership uses an estimate of the undiscounted value of expected futureoperating cash flows to determine whether the long-lived assets are impaired. If the aggregate undiscounted cash flows are less than the carrying amount of the assets,the resulting impairment charge to be recorded is calculated based on the excess of the carrying value of the assets over the fair value of such assets, with the fair valuedetermined based on an estimate of discounted future cash flows. Through December 31, 2019, no impairment charges were recorded.
Deferred financing costs
Financing costs incurred in connection with obtaining construction and term financing, which include direct financing, legal and other upfront costs of borrowing, arecapitalized and recorded as a reduction to long-term debt and amortized over the lives of the respective loans using the effective-interest method. Amortization ofdeferred financing costs is capitalized during construction or expensed following COD.
Derivatives
The Partnership recognizes its derivative instruments as either assets or liabilities in the balance sheets at fair value. The accounting for changes in the fair value (i.e.,gains or losses) of a derivative instrument depends on whether it qualifies and has been designated as part of a hedging relationship and, further, on the type ofhedging relationship.
For derivative instruments that are designated and qualify as a cash flow hedge (i.e., hedging the exposure to variability in expected future cash flows that areattributable to a particular risk), the effective portion of the gain or loss on the derivative instrument is reported as a component of other comprehensive income (OCI).Changes in the fair value of these derivatives are subsequently reclassified into earnings in the period the hedged transaction affects earnings. The ineffective portionof changes in fair value is recorded as a component of net income in the statements of operations and comprehensive income.
For undesignated derivative instruments, their change in fair value is reported as a component of net income in the statements of operations and comprehensiveincome.
The Partnership enters into derivative transactions for the purpose of managing exposure to fluctuations in interest rates, such as interest rate swaps. Interest rateswaps are instruments used to fix the interest rate on variable interest rate debt.
Accounts payable and other accrued liabilities
Trade payables are obligations to pay for goods or services that have been acquired in the ordinary course of business from suppliers. Payables with payment termsextended beyond one year from the balance sheet dates are presented as non-current liabilities.
Contingent liabilities
Contingent liabilities are recognized when: the Partnership has a present legal obligation as a result of past events; it is probable that an outflow of resources will berequired to settle the obligation; and the amount can be reasonably estimated.
S-11
South Kent Wind LPNotes to Financial StatementsDecember 31, 2019 (covered by the auditor's report), 2018 (not covered by the auditor’s report) and 2017 (covered by the auditor's report)(In thousands of Canadian Dollars)
Asset retirement obligation
The Partnership records an asset retirement obligation for the estimated costs of decommissioning turbines, removing above-ground installations and restoring sites, atthe time when a contractual decommissioning obligation materializes. The Partnership records accretion expense, which represents the increase in the asset retirementobligation, over the remaining life of the associated wind project. Accretion expense is recorded as cost of revenue in the statements of operations and comprehensiveincome using accretion rates based on a credit adjusted risk free interest rate of 5.54%.
Revenue recognition
Beginning in 2019, the Partnership adopted ASC 606 Revenue Recognition (ASC 606). See Note 3, Revenue, regarding the Partnership’s revenue recognition policy.
Revenue is recognized based upon the amount of electricity delivered or curtailed at rates specified under the contracts, assuming all other revenue recognition criteriaare met. When curtailment revenue is earned, it is recorded as compensation for forgone revenue. The Partnership evaluates its PPA to determine whether it is insubstance a lease or derivative and, if applicable, recognizes revenue pursuant to ASC 842, Leases and ASC 815, Derivatives and Hedging, respectively. As ofDecember 31, 2019, the PPA was not considered a lease or a derivative instrument, as multiple market participants purchase the energy at market-based prices withIESO working as a settlement agent. As a result, revenue (including any revenue from the price guaranteed by IESO), is recognized according to the right to invoicepractical expedient as prescribed as ASC 606.
The Partnership recognizes revenue under other revenue for warranty settlements and liquidated damages from a turbine manufacturer upon resolution of outstandingcontingencies and for economic development adder from the IESO based on the amount of energy delivered. Any cash receipts for amounts subject to futureadjustment or repayment are deferred in other liabilities until the final settlement amount is considered fixed and determinable.
Cost of revenue
The Partnership’s cost of revenue is comprised of direct costs of operating and maintaining its project facilities, including labor, turbine service arrangements,metering service and shadow settlement, environmental fee, land lease royalties, property tax, insurance, depreciation, amortization and accretion.
Comprehensive income
Comprehensive income consists of net income and other comprehensive income. Other comprehensive income is included in accumulated other comprehensiveincome in the accompanying statements of changes in partners’ equity.
Recently adopted accounting standard
In May 2014, the FASB issued ASU 2014-09, Revenue from Contracts with Customers (Topic 606), which supersedes the revenue recognition requirements in Topic605, Revenue Recognition (Topic 605) and requires entities to recognize revenue when control of the promised goods or services is transferred to customers at anamount that reflects the consideration to which the entity expects to be entitled to in exchange for those goods or services. The Partnership adopted ASU 2014-09 as ofJanuary 1, 2019 using the modified retrospective transition method. The adoption did not have a material impact on the Partnership’s consolidated financialstatements, other than additional disclosures. See Note 3, Revenue for further details.
In February 2016, the FASB issued ASU 2016-12, Leases (ASC 842), as amended by subsequent standards updates, which requires lessees to recognize ROU assetsand lease liabilities, for all leases, with the exception of short-term leases, at the commencement date of each lease. Under the new guidance, lessor accounting islargely unchanged. ASC 842 simplifies the accounting for sale and leaseback transactions primarily because lessees must recognize lease assets and liabilities.
The Partnership has adopted ASC 842 retrospectively from January 1, 2019, but has not restated comparatives for the 2018 reporting period, as permitted under thespecific transitional provision in the standard. The reclassifications and the adjustments arising from the new leasing rules are therefore recognized in the openingbalance sheet on January 1, 2019. See Note 5, Leases for further details.
S-12

South Kent Wind LPNotes to Financial StatementsDecember 31, 2019 (covered by the auditor's report), 2018 (not covered by the auditor’s report) and 2017 (covered by the auditor's report)(In thousands of Canadian Dollars)
Recent accounting pronouncements
In August 2018, the FASB issued ASU 2018-13, Changes to the Disclosure Requirements for Fair Value Measurement (ASU 2018-13), which amends changes inunrealized gains and losses, the range and weighted average of significant unobservable inputs used to develop Level 3 fair value measurements, and the narrativedescription of measurement uncertainty which should be applied prospectively for only the most recent interim or annual period presented in the initial fiscal year ofadoption. ASU 2018-13 is effective for annual periods beginning after December 15, 2019, including interim periods within those periods. Early application ispermitted. The Partnership is currently assessing the impact of changes to the disclosure requirements for fair value measurement.
In June 2016, the FASB issued ASU 2016-13, Financial Instruments - Credit Losses (Topic 326): Measurement of Credit Losses on Financial Instruments (ASU 2016-13), which requires the measurement of all expected credit losses for financial assets including trade receivables held at the reporting date based on historicalexperience, current conditions, and reasonable and supportable forecasts. In November 2018, the FASB issued ASU 2018-19, Codification Improvements to Topic326, Financial Instruments - Credit Losses, for the purposes of clarifying certain aspects of ASU 2016-13. In April 2019, the FASB issued ASU 2019-04, CodificationImprovements to Topic 326, Financial Instruments - Credit Losses, Topic 815, Derivatives and Hedging, and Topic 825, Financial Instruments (ASU 2019-04), whichclarifies the treatment of certain credit losses. In May 2019, the FASB issued ASU 2019-05, Financial Instruments - Credit Losses (Topic 326): Targeted TransitionRelief (ASU 2019-05), which provides an option to irrevocably elect to measure certain individual financial assets at fair value instead of amortized cost. InNovember 2019, the FASB issued ASU 2019-11, Codification Improvements to Topic 326, Financial Instruments - Credit Losses (ASU 2019-11), which providesguidance around how to report expected recoveries. ASU 2016-13, as amended is effective for fiscal years, and interim periods within those fiscal years, beginningafter December 15, 2020. The adoption of ASU 2016-13 is not expected to have a material impact on the Partnership’s financial statements and related disclosures.
In October 2018, the FASB issued ASU 2018-16, Derivatives and Hedging (Topic ASC 815): Inclusion of the Secured Overnight Financing Rate (SOFR) OvernightIndex Swap (OIS) Rate as a Benchmark Interest Rate for Hedge Accounting Purposes (ASU 2018-16), which expands the list of U.S. benchmark interest ratespermitted in the application of hedge accounting. Because of concerns about the sustainability of LIBOR, the Federal Reserve Board and the Federal Reserve Bank ofNew York (Fed) initiated an effort to introduce an alternative reference rate in the United States. The SOFR is calculated by the Fed based on the interest rates bankscharge one another in the overnight market, typically called repurchase agreements, and because it is based on transactions in the open market, it is more reflective ofmarket conditions than LIBOR, which relies on judgment. The provisions of ASU 2017-12 (discussed below) and ASU 2018-16 are effective for fiscal yearsbeginning after December 15, 2019, with early adoption permitted. Initial adoption of ASU 2017-12 is required to be reported using a modified retrospectiveapproach, with the exception of the presentation and disclosure requirements which are required to be applied prospectively. The Partnership is currently in the processof determining the impact of adoption of the provisions of ASU 2017-12 and ASU 2018-16.
In August 2017, the FASB issued ASU 2017-12, Targeted Improvements to Accounting for Hedging Activities (ASU 2017-12), which amends the presentation anddisclosure requirements and changes how companies assess effectiveness. The amendments are intended to more closely align hedge accounting with companies’ riskmanagement strategies, simplify the application of hedge accounting, and increase transparency as to the scope and results of hedging programs. ASU 2017-12 iseffective for annual periods beginning after December 15, 2019. ASU 2017-12 requires a modified retrospective transition method in which the Partnership willrecognize the cumulative effect of the change on the opening balance of each affected component of equity in the balance sheet as of the date of adoption. While thePartnership continues to assess all potential impacts of the standard, the adoption is not expected to have a material impact on its future consolidated financialstatements.
3 RevenueOn January 1, 2019, the Partnership adopted the new accounting standard ASC 606, Revenue from Contracts with Customers, and all the related amendments (Topic606) and applied Topic 606 to its PPA contract previously accounted for under Topic 605, using the modified retrospective method. Results of the reporting periodbeginning January 1, 2019 are presented under Topic 606, while prior period amounts are not adjusted and continue to be reported in accordance with the Partnership’shistoric accounting under Topic 605.
The Partnership did not record any adjustment to the opening retained earnings as of January 1, 2019 as a result of Topic 606. Additionally, the adoption of Topic 606did not materially change the presentation of revenue.
S-13

South Kent Wind LPNotes to Financial StatementsDecember 31, 2019 (covered by the auditor's report), 2018 (not covered by the auditor’s report) and 2017 (covered by the auditor's report)(In thousands of Canadian Dollars)
Revenue Recognition
Revenue from contracts with customers are recognized when control of promised goods and services is transferred to customers, in an amount that reflects theconsideration the Partnership expects to be entitled to in exchange for those goods or services.
The following table presents the Partnership’s total revenue recognized and, for contracts with customers, disaggregated by revenue sources:
2019 2018 2017
Revenue from contracts with customers Electricity sales
Energy delivered $ 90,352 $ 94,234 $ 65,867
Compensation for forgone energy 39,152 35,449 64,739
Electricity sales from contracts with customers 129,504 129,683 130,606
Other revenue 1,639 2,113 2,376
Total revenue $ 131,143 $ 131,796 $ 132,982
Electricity Sales
The Partnership generates revenues primarily by delivering electricity to a customer under PPA and market participants. The revenues are determined by the price ofthe electricity under the PPA multiplied by the amount of electricity that the Partnership delivers.
The Partnership transfers control of the electricity over time and the customer simultaneously receives and consumes the benefits provided by the Partnership'sperformance as it performs. Accordingly, the Partnership has concluded that the sale of electricity over the term of the agreement represents a series of distinct goodsthat are substantially the same and that have the same pattern of transfer to the customer. Each distinct transfer of electricity in MWh that the Partnership promises totransfer to the customer meets the criteria to be a performance obligation satisfied over time. The electricity sales are recognized based on an output measure, as eachMWh is delivered to the customers. The Partnership recognizes revenue based on the amount invoiced on the basis of the prices multiplied by MWh delivered. ThePartnership does not determine the total transaction price at contract inception, allocate the transaction price to performance obligations, or disclose the value of thevariable portion of the remaining performance obligations for contracts for which it recognizes revenue as invoiced.
S-14

4 Property, plant and equipment
The following is a summary of property, plant and equipment, at cost less accumulated depreciation, at:
December 31,
2019 2018
Power plant $ 731,212 $ 731,212
Furniture, fixtures and equipment 501 501
Asset retirement obligation - asset 5,269 5,263
Capital spares 267 233
Subtotal 737,243 737,209
Less: Accumulated depreciation (174,745) (145,511)
$ 562,504 $ 591,698
Depreciation expense of $29,234, $29,266 and $29,279 was charged to the statements of operations and comprehensive income for the years ended December 31,2019, 2018 and 2017, respectively.
5 LeasesOn adoption of ASC 842, the Partnership recognized lease liabilities in relation to lease which had previously been classified as ‘operating leases’. These liabilitieswere measured at the present value of the remaining lease payments, discounted using the lessee’s incremental borrowing rate as of January 1, 2019. The weightedaverage lessee’s incremental borrowing rate applied to the lease liabilities on January 1, 2019 was 3.88%.
January 1, 2019
Operating lease commitments disclosed as at December 31, 2018 $ 65,118
Add: lease commitments period adjustment 9,657
Less: variable lease payments recognized as expenses when revenue is earned (63,930)
Less: short term leases recognized on a straight-line basis as expenses —
Undiscounted future lease liabilities 10,845
Imputed interest using the incremental borrowing rate of at the date of initial application (2,959)
Lease liabilities recognized as at January 1, 2019 7,886
Of which are: Current lease liabilities 724
Non-current lease liabilities 7,162
$ 7,886
The ROU assets were measured at the amount equal to the lease liabilities, adjusted by the amount of any prepaid or accrued lease payments relating to that leaserecognized in the balance sheet as at December 31, 2018. There were no onerous lease contracts that would have required an adjustment to the ROU assets at the dateof initial application.
The recognized ROU assets related to the following types of assets:
December 31,
2019 January 1, 2019
Land $ 7,747 $ 7,998
$ 7,747 $ 7,998
In applying ASC 842 for the first time, the Partnership has used the following practical expedients permitted by the standards:
• the use of single discount rate to a portfolio of leases with reasonably similar characteristics
S-15
South Kent Wind LPNotes to Financial StatementsDecember 31, 2019 (covered by the auditor's report), 2018 (not covered by the auditor’s report) and 2017 (covered by the auditor's report)(In thousands of Canadian Dollars)
• the exclusion of initial direct costs for the measurement of the right of use asset at the date of initial application
The change in accounting policy affected the following items in the statement of financial position on January 1, 2019:
• right of use assets: increased by $7,998
• prepaid expenses: decreased by $112
• lease liabilities: increased by $7,886
The Partnership has lease agreements with a group of participating landowners, on which the Project facilities were built. Lease agreements were negotiated on groupbasis and therefore contain similar terms and conditions including a lease term for period from 20 years to 40 years with an extension option, and right to terminatewithout penalty.
Until the 2018 financial year, leases were all classified as operating leases and the payments made were charged to profit or loss on the straight-line basis over theperiod of the lease.
From January 1, 2019, leases are recognized as ROU assets and corresponding lease liabilities at the date at which the lease asset is available for use by the Project.Lease expense is generally recognized on a straight-line basis over the lease term and is recorded in project expense in the statements of operation.
Lease liabilities include the net present value of the following lease payments:
• fixed payments including in-substance fixed payments), less any lease incentives receivable
• variable lease payment that are based on an Index or a rate
• amounts expected to be payable by the lease under residual value guarantees
The lease payments are discounted using the interest rate implicit in the lease. If that rate cannot be determined, the lessee’s incremental borrowing rate is used, beingthe rate that the lessee would have to pay to borrow the funds necessary to obtain an asset of similar value in a similar economic environment with similar terms andconditions.
ROU assets are measured at cost comprising the following:
• the amount of the initial measurement of lease liability
• any lease payments made at or before the commencement date less any lease incentives received
As of December 31, 2019, fixed contractual payments of lease liabilities were as follow:
2020 $ 726
2021 726
2022 732
2023 738
2024 491
Thereafter 6,705
Total lease payment 10,118
Less: imputed interest (2,527)
Total $ 7,591
Supplemental income statement information related to leases are as follow:
S-16
South Kent Wind LPNotes to Financial StatementsDecember 31, 2019 (covered by the auditor's report), 2018 (not covered by the auditor’s report) and 2017 (covered by the auditor's report)(In thousands of Canadian Dollars)
Income statement
location December 31, 2019
Operating lease expenses Project expenses $ 3,789
Operating leases expenses on variable components 3,248
Operating leases expenses on lease liability 541
$ 3,789
Supplemental cash flow and other information related to leases are as follow:
December 31, 2019
Operating cash flow from operating lease $ (294)
Weighted average remaining lease terms (years) 19
Weighted average discounted rate 3.88%
6 Intangible assets
December 31,
2019 2018
Beginning net book value 583 626
Amortization expense (43) (43)
Closing net book value 540 583
December 31,
2019 2018
Cost 1,438 1,438
Accumulated amortization (898) (855)
Net book value 540 583
Amortization expense of $43, $43 and $42 was charged to the statements of operations and comprehensive income for the years ended December 31, 2019, 2018 and2017, respectively.
7 Long-term debt
Upon achievement of the COD on March 28, 2014, and the construction facility converted to a term loan on August 28, 2014. On May 7, 2015, the Partnershipamended the credit agreement to reduce the related interest rate to Canadian Dealer Offered Rate (CDOR) plus 1.625% per annum. A fee facility was added with aprincipal amount of $5,106 to cover all fees for the amendment. The modifications have resulted in a current effective interest rate of 3.935% with a maturity date ofAugust 2021. In connection with the new credit agreement, the Partnership entered into interest rate swaps that would fix the interest rate for the outstanding notionalamount at each settlement date.
On December 6, 2019, the Partnership terminated the original credit agreement executed on March 8, 2013 and entered into a new credit agreement with a group oflenders to reduce the related interest rate to the Canadian Dealer Offered Rate (CDOR) plus 1.125%. The new credit agreement provides for a $902,692 term loanfacility, a $63,250 letter of credit facility and an interest rate hedge facility for a term aligning with the PPA.
As of December 6, 2019, the Partnership had a total of $5,195 in unamortized deferred financing costs relating to the original 2013 credit agreement. The unamortizedcosts of $3,844 related to 9 of the original lenders, who are no longer counterparties in the new credit agreement were recognised as interest expense in the statementof operations and comprehensive income. The Partnership determined that the new credit agreement was a debt modification as prescribed in ASC 470, Debt,therefore the remaining portion
S-17
South Kent Wind LPNotes to Financial StatementsDecember 31, 2019 (covered by the auditor's report), 2018 (not covered by the auditor’s report) and 2017 (covered by the auditor's report)(In thousands of Canadian Dollars)
of unamortized costs of $1,350, attributable to the 4 lenders who are counterparties to the new credit agreement continue to be amortized over the term of the newcredit agreement.
At December 6, 2019, the Partnership capitalized $12,922 of deferred financing costs associated with the new borrowings which are amortized over the term of thenew credit agreement.
Collateral under the new credit agreement consists of substantially all of the Partnership’s assets. The credit agreement contains a broad range of typical covenantsthat, subject to certain exceptions, restrict the Partnership’s ability to incur debt, grant liens, sell or lease assets, transfer equity interest, dissolve, pay distributions andchange its business. The Partnership is in compliance with all of the covenants contained in the new credit agreement. Each of the limited partners and the GP of thePartnership pledged their partnership units as collateral for the loan. Each of the shareholders of the GP pledged their shares in the GP as collateral for the loan.
Terms and conditions of outstanding borrowings were as follows:
As of December 31, 2019
Principal Deferred
financing costs Net of financing costs Interest rate Maturity date
Term loan
$ 902,692
$ (12,907)
$ 889,785
3.115%
March 2034
Less: current portion
(48,548)
1,608
(46,940)
Net of current
$ 854,144
$ (11,299)
$ 842,845
As of December 31, 2018
Principal Deferred
financing costs Net of financing costs Interest rate Maturity date
Term loan
$ 589,122
$ (8,095)
$ 581,027
3.935%
August 2021
Less: current portion
(28,143)
3,163
(24,980)
Net of current
$ 560,979
$ (4,932)
$ 556,047
Future maturities of long-term debt are as follows as of December 31, 2019:
2020 $ 48,548
2021 51,855
2022 53,572
2023 54,236
2024 57,138
Thereafter 637,343
$ 902,692
The following table presents a reconciliation of interest expense presented in the Partnerships’ statements of operations and comprehensive income for the years endedDecember 31:
2019 2018 2017
Interest incurred $ 26,641 $ 27,331 $ 28,051
Amortization of deferred financing costs 6,829 3,297 3,426
Interest expense $ 33,470 $ 30,628 $ 31,477
Letters of credit facilities
On August 28, 2014, letters of credit of $40,600 and $12,000 were issued upon term conversion for a debt service reserve and operations and maintenance reserve,respectively, with a seven-year term. On December 6, 2019, the old letters of credits were terminated along with the other credit facilities and new letters of credit of$52,500 and $10,750 were issued. Funds, when and if
S-18

South Kent Wind LPNotes to Financial StatementsDecember 31, 2019 (covered by the auditor's report), 2018 (not covered by the auditor’s report) and 2017 (covered by the auditor's report)(In thousands of Canadian Dollars)
drawn on the letter of credit facility, accrue interest at Prime Rate plus 0.125% for the first five years and at a higher applicable margin thereafter. At the option of thePartnership, the rate can be converted to a rate of CDOR plus 1.125% per annum. In addition, the Partnership shall pay letter of credit fees on the basis of the undrawnamount of the facility at 1.125% per annum. As of December 31, 2019 and 2018, the letters of credit facility did not have an outstanding balance, and no amountswere drawn in 2019 and 2018. Letter of credit fees of $845, $855 and $855 were charged to other expense in the statements of operations and comprehensive incomefor the years ended December 31, 2019, 2018 and 2017, respectively.
8 Asset retirement obligation
The Partnership’s asset retirement obligation represents the estimated cost of decommissioning the turbines, removing above-ground installations and restoring thesites at the end of its estimated useful life.
The following table presents a reconciliation of the beginning and ending aggregate carrying amounts of the asset retirement obligation:
December 31,
2019 2018
Asset retirement obligation - Beginning of year $ 6,853 $ 6,493
Accretion expense 372 360
Asset retirement obligation - End of year $ 7,225 $ 6,853
9 Derivatives
The Partnership uses interest rate derivatives to manage its exposure to fluctuations in interest rates. Interest rate risk exists primarily on variable-rate debt for whichthe cash flows vary based upon movement in market prices. The Partnership’s objectives for holding these derivative instruments include reducing, eliminating andefficiently managing the economic impact of interest rate exposures as effectively as possible. The Partnership does not hedge all of its interest rate risks, therebyexposing the unhedged portions to changes in market prices.
On December 6, 2019, as a part of refinancing further discussed in Note 7, the Partnership terminated the old interest rate swap and paid $34,844 to the old hedgeproviders, which were charged to loss in the statement of operations and comprehensive income. The Partnership entered into new interest rate swaps with a group ofhedge providers for a term aligning with the PPA.
The following tables present the fair values of the Partnership's derivative instruments on a gross basis as reflected on the Partnership’s balance sheets:
December 31, 2019 December 31, 2018
Derivative assets (liabilities) Derivative assets (liabilities)
Current Long-term Current Long-term
Fair value of undesignated derivatives: Interest rate swaps $ (1,459) $ 2,438 $ (3,996) $ (17,444)
Total fair value $ (1,459) $ 2,438 $ (3,996) $ (17,444)
The following table summarizes the notional amounts of the Partnership's outstanding derivative instruments:
December 31,
Unit of measure 2019 2018
Undesignated derivative instruments Interest rate swaps CAD $ 901,904 $ 525,614
S-19
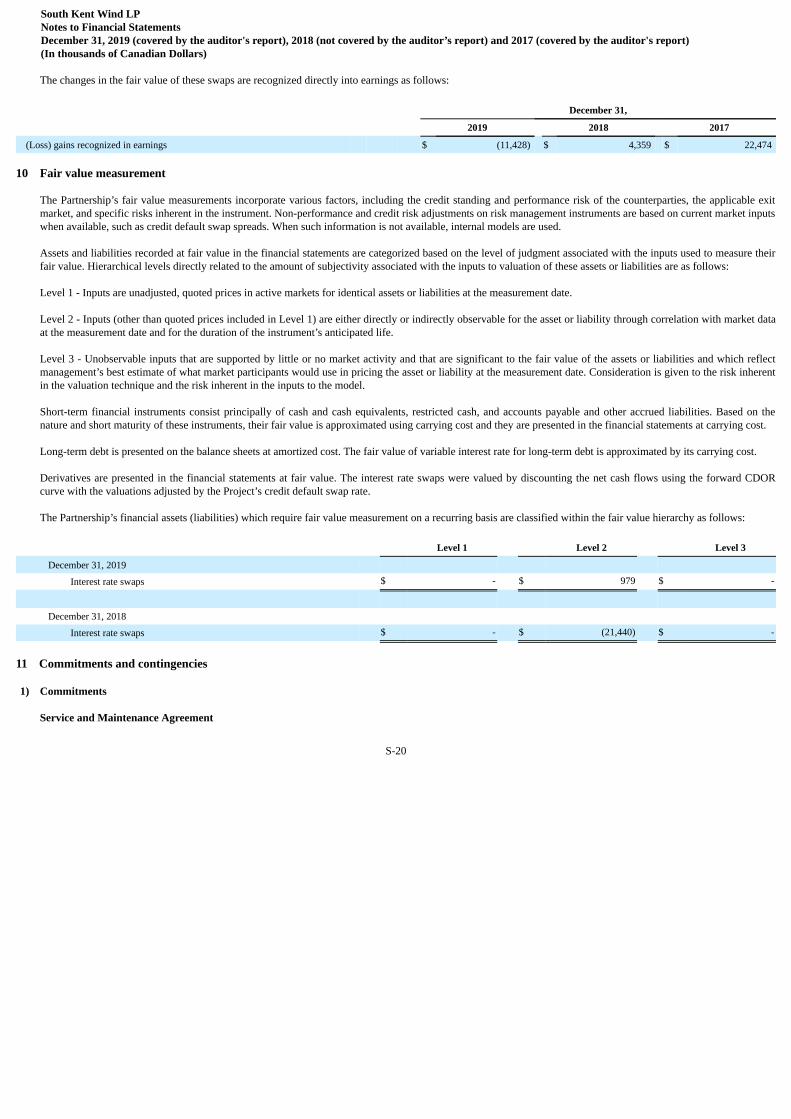
South Kent Wind LPNotes to Financial StatementsDecember 31, 2019 (covered by the auditor's report), 2018 (not covered by the auditor’s report) and 2017 (covered by the auditor's report)(In thousands of Canadian Dollars)
The changes in the fair value of these swaps are recognized directly into earnings as follows:
December 31,
2019 2018 2017
(Loss) gains recognized in earnings $ (11,428) $ 4,359 $ 22,474
10 Fair value measurement
The Partnership’s fair value measurements incorporate various factors, including the credit standing and performance risk of the counterparties, the applicable exitmarket, and specific risks inherent in the instrument. Non-performance and credit risk adjustments on risk management instruments are based on current market inputswhen available, such as credit default swap spreads. When such information is not available, internal models are used.
Assets and liabilities recorded at fair value in the financial statements are categorized based on the level of judgment associated with the inputs used to measure theirfair value. Hierarchical levels directly related to the amount of subjectivity associated with the inputs to valuation of these assets or liabilities are as follows:
Level 1 - Inputs are unadjusted, quoted prices in active markets for identical assets or liabilities at the measurement date.
Level 2 - Inputs (other than quoted prices included in Level 1) are either directly or indirectly observable for the asset or liability through correlation with market dataat the measurement date and for the duration of the instrument’s anticipated life.
Level 3 - Unobservable inputs that are supported by little or no market activity and that are significant to the fair value of the assets or liabilities and which reflectmanagement’s best estimate of what market participants would use in pricing the asset or liability at the measurement date. Consideration is given to the risk inherentin the valuation technique and the risk inherent in the inputs to the model.
Short-term financial instruments consist principally of cash and cash equivalents, restricted cash, and accounts payable and other accrued liabilities. Based on thenature and short maturity of these instruments, their fair value is approximated using carrying cost and they are presented in the financial statements at carrying cost.
Long-term debt is presented on the balance sheets at amortized cost. The fair value of variable interest rate for long-term debt is approximated by its carrying cost.
Derivatives are presented in the financial statements at fair value. The interest rate swaps were valued by discounting the net cash flows using the forward CDORcurve with the valuations adjusted by the Project’s credit default swap rate.
The Partnership’s financial assets (liabilities) which require fair value measurement on a recurring basis are classified within the fair value hierarchy as follows:
Level 1 Level 2 Level 3
December 31, 2019 Interest rate swaps $ - $ 979 $ -
December 31, 2018
Interest rate swaps $ - $ (21,440) $ -
11 Commitments and contingencies
1) Commitments
Service and Maintenance Agreement
S-20
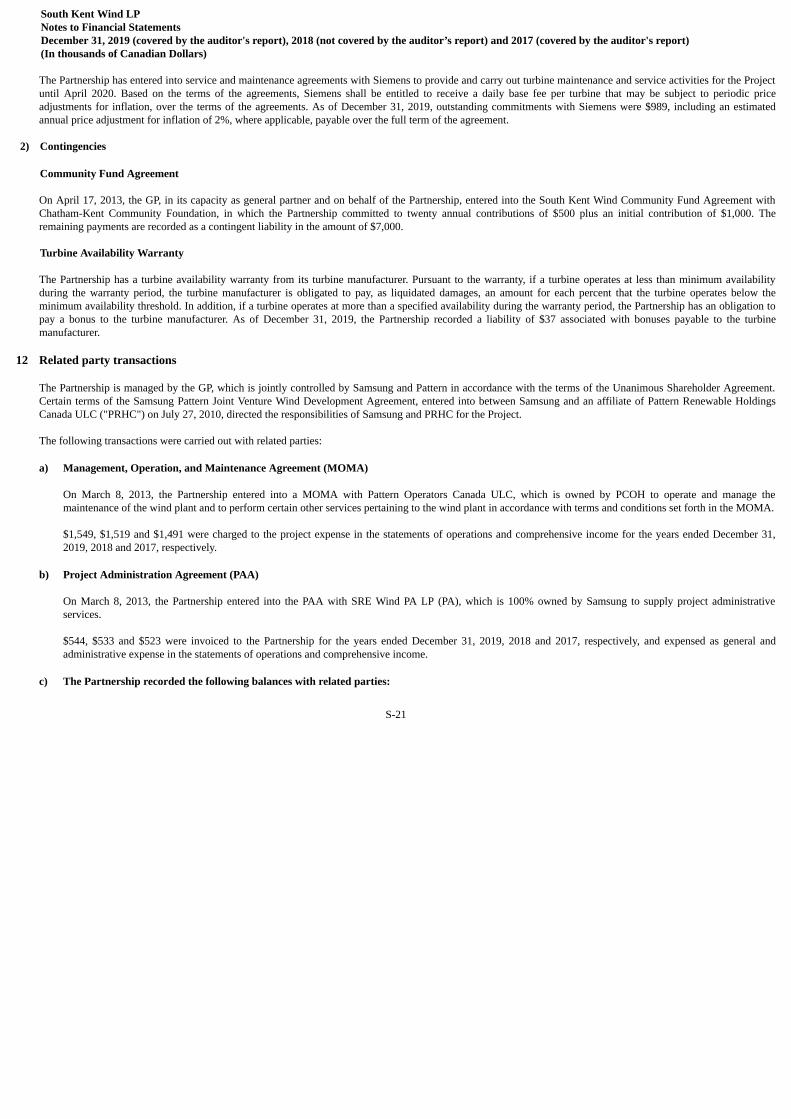
South Kent Wind LPNotes to Financial StatementsDecember 31, 2019 (covered by the auditor's report), 2018 (not covered by the auditor’s report) and 2017 (covered by the auditor's report)(In thousands of Canadian Dollars)
The Partnership has entered into service and maintenance agreements with Siemens to provide and carry out turbine maintenance and service activities for the Projectuntil April 2020. Based on the terms of the agreements, Siemens shall be entitled to receive a daily base fee per turbine that may be subject to periodic priceadjustments for inflation, over the terms of the agreements. As of December 31, 2019, outstanding commitments with Siemens were $989, including an estimatedannual price adjustment for inflation of 2%, where applicable, payable over the full term of the agreement.
2) Contingencies
Community Fund Agreement
On April 17, 2013, the GP, in its capacity as general partner and on behalf of the Partnership, entered into the South Kent Wind Community Fund Agreement withChatham-Kent Community Foundation, in which the Partnership committed to twenty annual contributions of $500 plus an initial contribution of $1,000. Theremaining payments are recorded as a contingent liability in the amount of $7,000.
Turbine Availability Warranty
The Partnership has a turbine availability warranty from its turbine manufacturer. Pursuant to the warranty, if a turbine operates at less than minimum availabilityduring the warranty period, the turbine manufacturer is obligated to pay, as liquidated damages, an amount for each percent that the turbine operates below theminimum availability threshold. In addition, if a turbine operates at more than a specified availability during the warranty period, the Partnership has an obligation topay a bonus to the turbine manufacturer. As of December 31, 2019, the Partnership recorded a liability of $37 associated with bonuses payable to the turbinemanufacturer.
12 Related party transactions
The Partnership is managed by the GP, which is jointly controlled by Samsung and Pattern in accordance with the terms of the Unanimous Shareholder Agreement.Certain terms of the Samsung Pattern Joint Venture Wind Development Agreement, entered into between Samsung and an affiliate of Pattern Renewable HoldingsCanada ULC ("PRHC") on July 27, 2010, directed the responsibilities of Samsung and PRHC for the Project.
The following transactions were carried out with related parties:
a) Management, Operation, and Maintenance Agreement (MOMA)
On March 8, 2013, the Partnership entered into a MOMA with Pattern Operators Canada ULC, which is owned by PCOH to operate and manage themaintenance of the wind plant and to perform certain other services pertaining to the wind plant in accordance with terms and conditions set forth in the MOMA.
$1,549, $1,519 and $1,491 were charged to the project expense in the statements of operations and comprehensive income for the years ended December 31,2019, 2018 and 2017, respectively.
b) Project Administration Agreement (PAA)
On March 8, 2013, the Partnership entered into the PAA with SRE Wind PA LP (PA), which is 100% owned by Samsung to supply project administrativeservices.
$544, $533 and $523 were invoiced to the Partnership for the years ended December 31, 2019, 2018 and 2017, respectively, and expensed as general andadministrative expense in the statements of operations and comprehensive income.
c) The Partnership recorded the following balances with related parties:
S-21
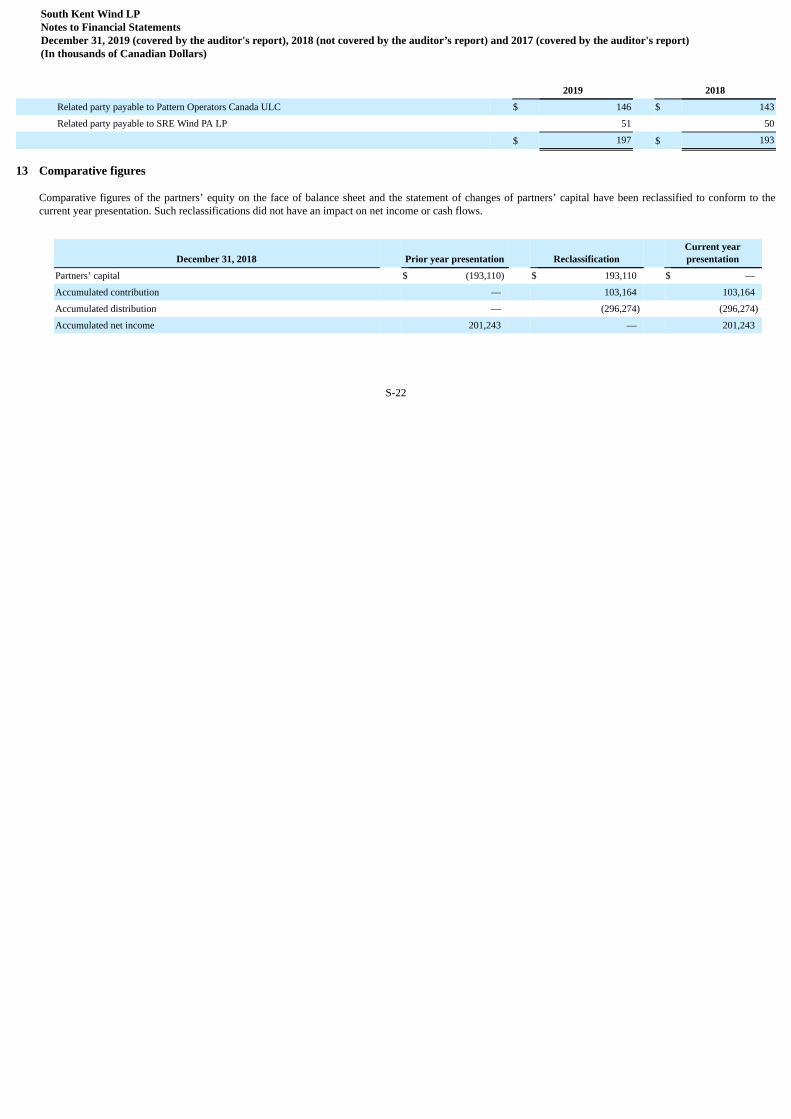
South Kent Wind LPNotes to Financial StatementsDecember 31, 2019 (covered by the auditor's report), 2018 (not covered by the auditor’s report) and 2017 (covered by the auditor's report)(In thousands of Canadian Dollars)
2019 2018
Related party payable to Pattern Operators Canada ULC $ 146 $ 143
Related party payable to SRE Wind PA LP 51 50
$ 197 $ 193
13 Comparative figures
Comparative figures of the partners’ equity on the face of balance sheet and the statement of changes of partners’ capital have been reclassified to conform to thecurrent year presentation. Such reclassifications did not have an impact on net income or cash flows.
December 31, 2018 Prior year presentation Reclassification Current yearpresentation
Partners’ capital $ (193,110) $ 193,110 $ —
Accumulated contribution — 103,164 103,164
Accumulated distribution — (296,274) (296,274)
Accumulated net income 201,243 — 201,243
S-22
Grand Renewable Wind LP
Financial Statementsin accordance with accounting principlesgenerally accepted in the United States ofAmerica (U.S. GAAP)
December 31, 2019(In thousands of Canadian Dollars)
S-23

Grand Renewable Wind LP
Contents Page
Independent Auditor’s Report S-25
Financial Statements Balance Sheets S-26Statements of Operations and Comprehensive Income S-27Statements of Changes in Partners’ Equity S-28Statements of Cash Flows S-29Notes to Financial Statements S-30
S-24

Report of Independent Registered Public Accounting Firm
To the Board of Directors and Partners of Grand Renewable Wind LP
Opinion on the Financial StatementsWe have audited the accompanying balance sheet of Grand Renewable Wind LP (the Partnership) as at December 31, 2019, and the related statements of operations andcomprehensive income, statements of changes in partners’ equity and statements of cash flows for the years ended December 31, 2019 and 2017, including the related notes(collectively referred to as the financial statements). In our opinion, the financial statements present fairly, in all material respects, the financial position of the Partnershipas at December 31, 2019, and the results of its operations and its cash flows for the years ended December 31, 2019 and 2017 in conformity with accounting principlesgenerally accepted in the United States of America.
The accompanying balance sheet of the Partnership as of December 31, 2018, and the related statements of operations and comprehensive income, statement of changes inpartners’ equity and statement of cash flows for the year ended December 31, 2018 are presented for purposes of complying with Rule 3-09 of SEC Regulation S-X;however, Rule 3-09 does not require the 2018 financial statements to be audited and they are therefore not covered by this report.
Change in accounting principleAs discussed in note 2 to the financial statements, the Partnership changed the manner in which it accounts for leases in 2019 to comply with the requirements of ASC 842,Leases.
Basis for OpinionThese financial statements are the responsibility of the Partnership’s management. Our responsibility is to express an opinion on the Partnership’s financial statementsbased on our audits. We are a public accounting firm registered with the Public Company Accounting Oversight Board (United States) (PCAOB) and are required to beindependent with respect to the Partnership in accordance with the U.S. federal securities laws and the applicable rules and regulations of the Securities and ExchangeCommission and the PCAOB.
We conducted our audits of these financial statements in accordance with the standards of the PCAOB. Those standards require that we plan and perform the audit to obtainreasonable assurance about whether the financial statements are free of material misstatement, whether due to error or fraud.
Our audits included performing procedures to assess the risks of material misstatement of the financial statements, whether due to error or fraud, and performing proceduresthat respond to those risks. Such procedures included examining, on a test basis, evidence regarding the amounts and disclosures in the financial statements. Our audits alsoincluded evaluating the accounting principles used and significant estimates made by management, as well as evaluating the overall presentation of the financial statements.We believe that our audits provide a reasonable basis for our opinion.
/s/ PricewaterhouseCoopers LLP
Chartered Professional Accountants, Licensed Public Accountants
Toronto, Ontario, CanadaFebruary 14, 2020
We have served as the Partnership's auditor since 2011.
S-25

Grand Renewable Wind LPBalance SheetsAs of December 31, 2019 and 2018*
(In thousands of Canadian Dollars)
2019 2018*
ASSETS Current assets:
Cash and cash equivalents $ 16,378 $ 5,079
Restricted cash (note 4) — 4,339
Accrued revenue (notes 2 and 3) 8,608 6,396
Other current assets 245 300
Total current assets 25,231 16,114Property, plant and equipment - net of accumulated depreciation of $88,152 and $70,792 in 2019 and 2018, respectively (note 5) 345,368 362,613
Right of use assets (note 6) 26,407 —
Intangible assets - net of accumulated amortization of $425 and $341 in 2019 and 2018, respectively (note 7) 1,247 1,331
Derivative assets (note 10) 1,212 —
Total assets $ 399,465 $ 380,058
LIABILITIES & EQUITY Current liabilities:
Accounts payable and other accrued liabilities $ 2,076 $ 2,425
Accounts payable and other accrued liabilities - related parties (note 13) 166 163
Current portion of long-term debt, net of financing costs of $802 and $1,290 in 2019 and 2018, respectively (notes 2 and 8) 23,635 17,128
Current portion of lease liabilities (note 6) 1,622 —
Derivative liabilities, current (note 10) 733 3,346
Other current liabilities (note 12) 1,055 86
Total current liabilities 29,287 23,148
Long-term debt, net of financing costs of $5,856 and $2,997 in 2019 and 2018, respectively (notes 2 and 8) 392,623 315,988
Derivative liabilities (note 10) — 35,507
Asset retirement obligation (note 9) 3,394 3,187
Lease liabilities (note 6) 25,050 —
Total liabilities 450,354 377,830
Commitments and contingencies (note 12)
Partners’ equity: Accumulated contribution (Note 14) 67,990 67,990
Accumulated distribution (Note 14) (138,915) (76,980)
Accumulated net income 26,940 19,930
Accumulated other comprehensive loss (6,904) (8,712)
Total partners’ equity (50,889) 2,228
Total liabilities and partners’ equity $ 399,465 $ 380,058
*Not covered by the auditor’s reportSee accompanying notes to financial statements.
S-26
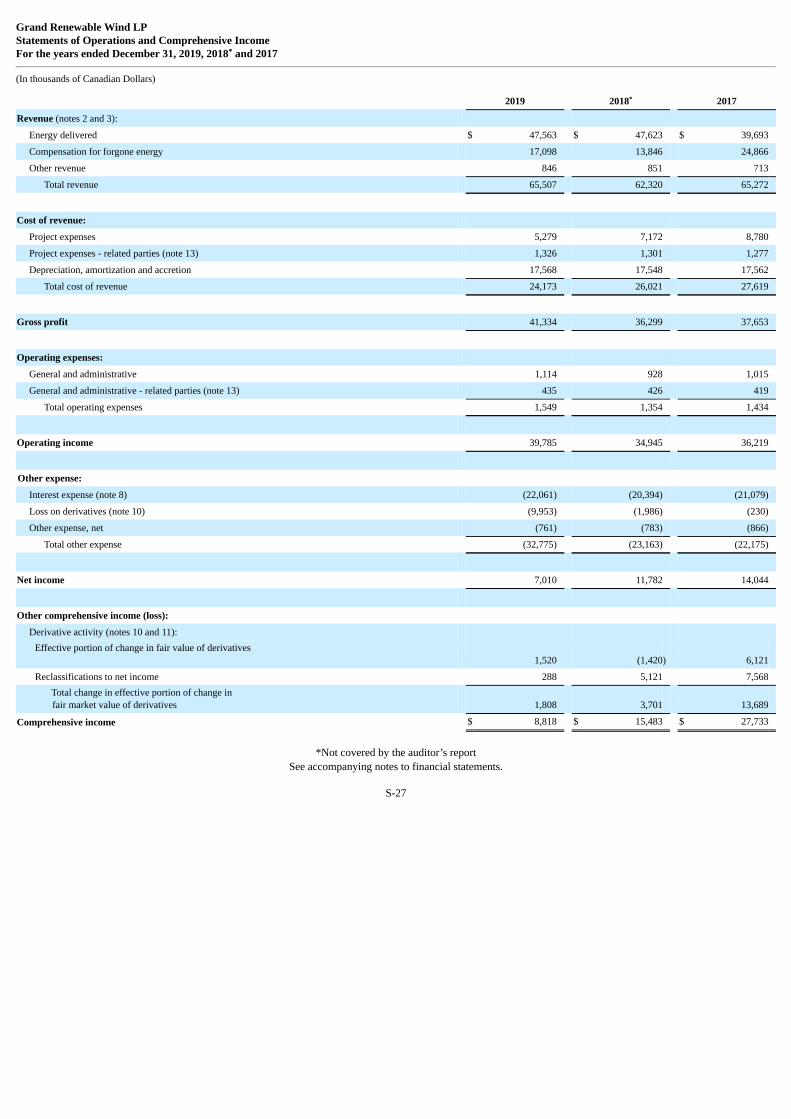
Grand Renewable Wind LPStatements of Operations and Comprehensive IncomeFor the years ended December 31, 2019, 2018* and 2017
(In thousands of Canadian Dollars)
2019 2018* 2017
Revenue (notes 2 and 3): Energy delivered $ 47,563 $ 47,623 $ 39,693
Compensation for forgone energy 17,098 13,846 24,866
Other revenue 846 851 713
Total revenue 65,507 62,320 65,272
Cost of revenue: Project expenses 5,279 7,172 8,780
Project expenses - related parties (note 13) 1,326 1,301 1,277
Depreciation, amortization and accretion 17,568 17,548 17,562
Total cost of revenue 24,173 26,021 27,619
Gross profit 41,334 36,299 37,653
Operating expenses: General and administrative 1,114 928 1,015
General and administrative - related parties (note 13) 435 426 419
Total operating expenses 1,549 1,354 1,434
Operating income 39,785 34,945 36,219
Other expense: Interest expense (note 8) (22,061) (20,394) (21,079)
Loss on derivatives (note 10) (9,953) (1,986) (230)
Other expense, net (761) (783) (866)
Total other expense (32,775) (23,163) (22,175)
Net income 7,010 11,782 14,044
Other comprehensive income (loss): Derivative activity (notes 10 and 11):
Effective portion of change in fair value of derivatives 1,520 (1,420) 6,121
Reclassifications to net income 288 5,121 7,568 Total change in effective portion of change in
fair market value of derivatives 1,808 3,701 13,689
Comprehensive income $ 8,818 $ 15,483 $ 27,733
*Not covered by the auditor’s reportSee accompanying notes to financial statements.
S-27
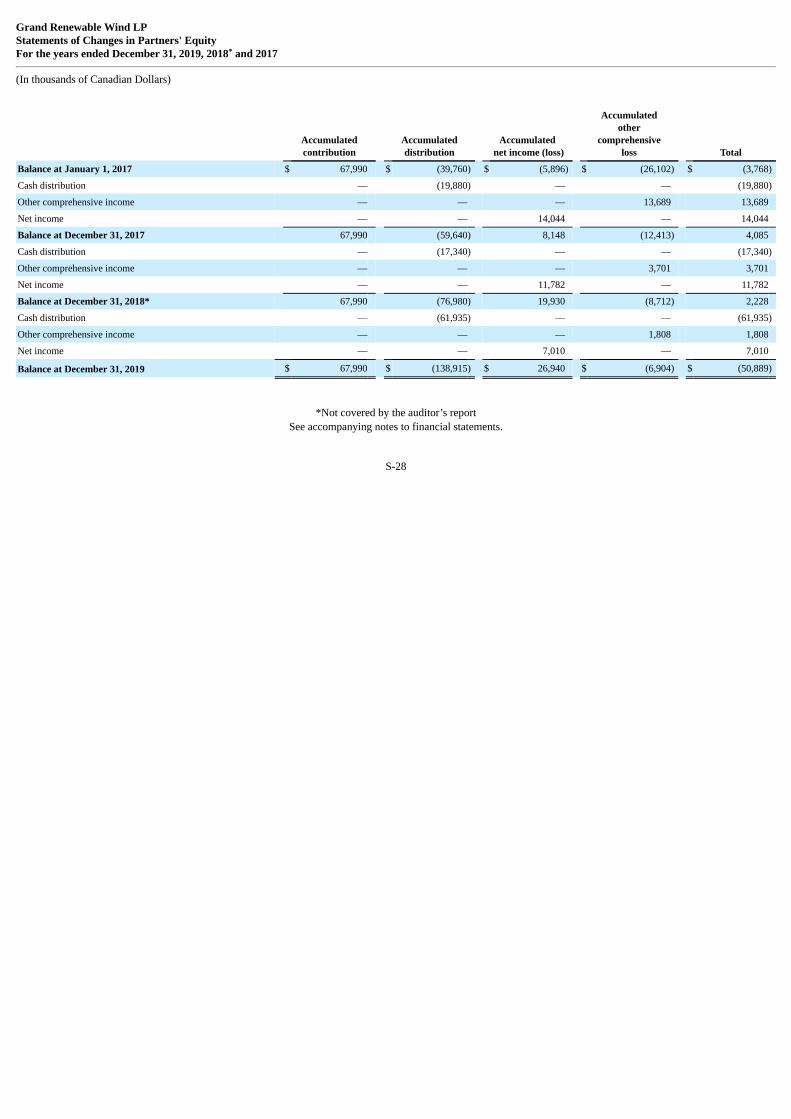
Grand Renewable Wind LPStatements of Changes in Partners' EquityFor the years ended December 31, 2019, 2018* and 2017
(In thousands of Canadian Dollars)
Accumulatedcontribution
Accumulateddistribution
Accumulated net income (loss)
Accumulatedother
comprehensiveloss Total
Balance at January 1, 2017 $ 67,990 $ (39,760) $ (5,896) $ (26,102) $ (3,768)
Cash distribution — (19,880) — — (19,880)
Other comprehensive income — — — 13,689 13,689
Net income — — 14,044 — 14,044
Balance at December 31, 2017 67,990 (59,640) 8,148 (12,413) 4,085
Cash distribution — (17,340) — — (17,340)
Other comprehensive income — — — 3,701 3,701
Net income — — 11,782 — 11,782
Balance at December 31, 2018* 67,990 (76,980) 19,930 (8,712) 2,228
Cash distribution — (61,935) — — (61,935)
Other comprehensive income — — — 1,808 1,808
Net income — — 7,010 — 7,010
Balance at December 31, 2019 $ 67,990 $ (138,915) $ 26,940 $ (6,904) $ (50,889)
*Not covered by the auditor’s reportSee accompanying notes to financial statements.
S-28
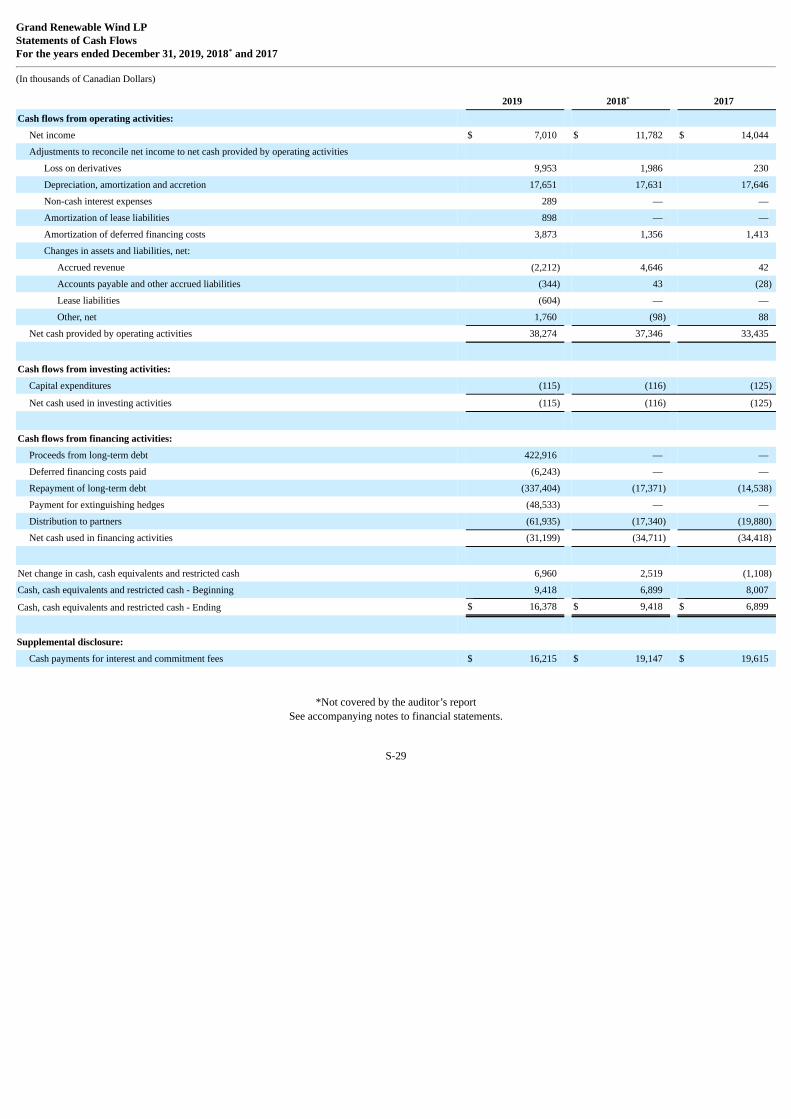
Grand Renewable Wind LPStatements of Cash FlowsFor the years ended December 31, 2019, 2018* and 2017
(In thousands of Canadian Dollars)
2019 2018* 2017
Cash flows from operating activities: Net income $ 7,010 $ 11,782 $ 14,044
Adjustments to reconcile net income to net cash provided by operating activities Loss on derivatives 9,953 1,986 230
Depreciation, amortization and accretion 17,651 17,631 17,646
Non-cash interest expenses 289 — —
Amortization of lease liabilities 898 — —
Amortization of deferred financing costs 3,873 1,356 1,413
Changes in assets and liabilities, net: Accrued revenue (2,212) 4,646 42
Accounts payable and other accrued liabilities (344) 43 (28)
Lease liabilities (604) — —
Other, net 1,760 (98) 88
Net cash provided by operating activities 38,274 37,346 33,435
Cash flows from investing activities: Capital expenditures (115) (116) (125)
Net cash used in investing activities (115) (116) (125)
Cash flows from financing activities: Proceeds from long-term debt 422,916 — —
Deferred financing costs paid (6,243) — —
Repayment of long-term debt (337,404) (17,371) (14,538)
Payment for extinguishing hedges (48,533) — —
Distribution to partners (61,935) (17,340) (19,880)
Net cash used in financing activities (31,199) (34,711) (34,418)
Net change in cash, cash equivalents and restricted cash 6,960 2,519 (1,108)
Cash, cash equivalents and restricted cash - Beginning 9,418 6,899 8,007
Cash, cash equivalents and restricted cash - Ending $ 16,378 $ 9,418 $ 6,899
Supplemental disclosure:
Cash payments for interest and commitment fees $ 16,215 $ 19,147 $ 19,615
*Not covered by the auditor’s reportSee accompanying notes to financial statements.
S-29

Grand Renewable Wind LPNotes to Financial StatementsDecember 31, 2019 (covered by the auditor's report), 2018 (not covered by the auditor’s report) and 2017 (covered by the auditor's report)(In thousands of Canadian Dollars)
1 General information
The Partnership
Grand Renewable Wind LP (the “Partnership”), a limited partnership formed pursuant to the laws of the Province of Ontario on January 10, 2011. The Partnership wascreated to develop, build and operate a wind power project in Haldimand County with generation capacity totaling approximately 149 megawatts (MW) of power (theProject).
The Partnership is managed by its general partner, Grand Renewable Wind GP Inc. (“the GP”), also a joint venture controlled by affiliates of Samsung RenewableEnergy Inc. (“Samsung”) and Pattern Energy Group Inc. (“Pattern”). The Partnership’s ownership interests were distributed as follows:
December 31,
2019 2018
Samsung¹ 44.99% 44.99%
Pattern Canada Finance Company ULC 44.99% 44.99%
Six Nations of the Grand River 10.00% 10.00%
Grand Renewable Wind GP Inc. 0.02% 0.02%
Total 100.00% 100.00%
¹ On October 23, 2019, SRE GRW LP Holdings LP, a subsidiary of Samsung, transferred all of its LP Interest in the Partnership to Samsung.
The Project
The Project is a 149 MW wind project consisting of 67 Siemens wind turbine generators located in Haldimand County, Ontario. On December 9, 2014 the Projectachieved the Commercial Operation Date (“COD”) and commenced commercial operations.
The Partnership has a power purchase agreement ("PPA") with the Independent Electricity System Operator (“IESO”) for a period of 20 years from the COD. TheIESO oversees the wholesale electricity market, where the price of energy is determined. It also administers the rules that govern the market and, through an arm's-length market monitoring function, ensures that it is operated fairly and efficiently. The IESO is an agent among the market participants in Ontario and is neitherexposed to, nor benefits from, any transactions. In such capacity, the IESO executes agreements to help the market meet the renewable energy mandates of thegovernment of the Province of Ontario. There are approximately 70 electric distribution companies in Ontario, all of which have government mandates to purchaserenewable energy. The PPA provides for guaranteed pricing from IESO that removes volatility caused by fluctuations in market rates. The Ontario governmentestablished the Global Adjustment (“GA”) which is designed to adjust consumer rates depending on the price of energy. The IESO establishes a monthly variable GArate based on GA costs and Ontario electricity demand which effectively establishes a pass through mechanism to the consumer and eliminates the IESO's economicexposure to our contract price.
A 100 MW solar facility developed by an affiliate of Samsung is sharing the usage and ownership of the transmission line and substation. The Project connected to theOntario transmission grid by way of a 20 km transmission line sited in the municipal road allowance.
2 Summary of significant accounting policies
The principal accounting policies applied in the preparation of these financial statements are set out below. These policies have been consistently applied to theperiods presented, unless otherwise stated.
Basis of preparation
The accompanying financial statements are presented using accounting principles generally accepted in the United States of America (“U.S. GAAP”). The preparationof U.S. GAAP financial statements requires management to make certain estimates and assumptions that affect the reported amounts of assets and liabilities and thedisclosure of contingent assets and liabilities at the date of the
S-30

Grand Renewable Wind LPNotes to Financial StatementsDecember 31, 2019 (covered by the auditor's report), 2018 (not covered by the auditor’s report) and 2017 (covered by the auditor's report)(In thousands of Canadian Dollars)
financial statements and the reported amounts of revenue and expenses during the reporting period. Because the use of estimates is inherent in the financial reportingprocess, actual results could differ from those estimates.
In recording transactions and balances resulting from business operations, the Partnership uses estimates based on the best information available. Estimates are usedfor such items as accrued revenue, asset retirement obligation, valuation of long-term derivative contracts and contingencies.
These financial statements do not include assets, liabilities, revenue and expenses of the GP and limited partners. The financial statements of the Partnership reflect noprovision or liability for income taxes because profits and losses of the Partnership are allocated to the partners and are included in the income tax returns of thepartners. Income and losses for tax purposes may differ from the financial statement amounts and the partners’ equity reflected in the financial statements does notnecessarily reflect their tax basis.
Functional and presentation currency
Items included in the financial statements of the Partnership are measured using the currency of the primary economic environment in which the Partnership operates(the functional currency). The financial statements are presented in Canadian dollars, which is the Partnership’s functional and presentation currency.
Fair value of financial instruments
ASC 820, Fair Value Measurements, defines fair value as the price at which an asset could be exchanged or a liability transferred in an orderly transaction betweenknowledgeable, willing parties in the principal or most advantageous market for the asset or liability. Where available, fair value is based on observable market pricesor derived from such prices. Where observable prices or inputs are not available, valuation models are applied. These valuation techniques involve some level ofmanagement estimation and judgment, the degree of which is dependent on the price transparency for the instruments or market and the instruments’ complexity.
Cash and cash equivalents
Cash and cash equivalents include cash on hand, deposits held on call with banks and other short-term highly liquid investments with original maturities of threemonths or less.
Restricted cash
Restricted cash mainly consists of cash reserves required under the Partnership’s loan agreements (note 3).
S-31
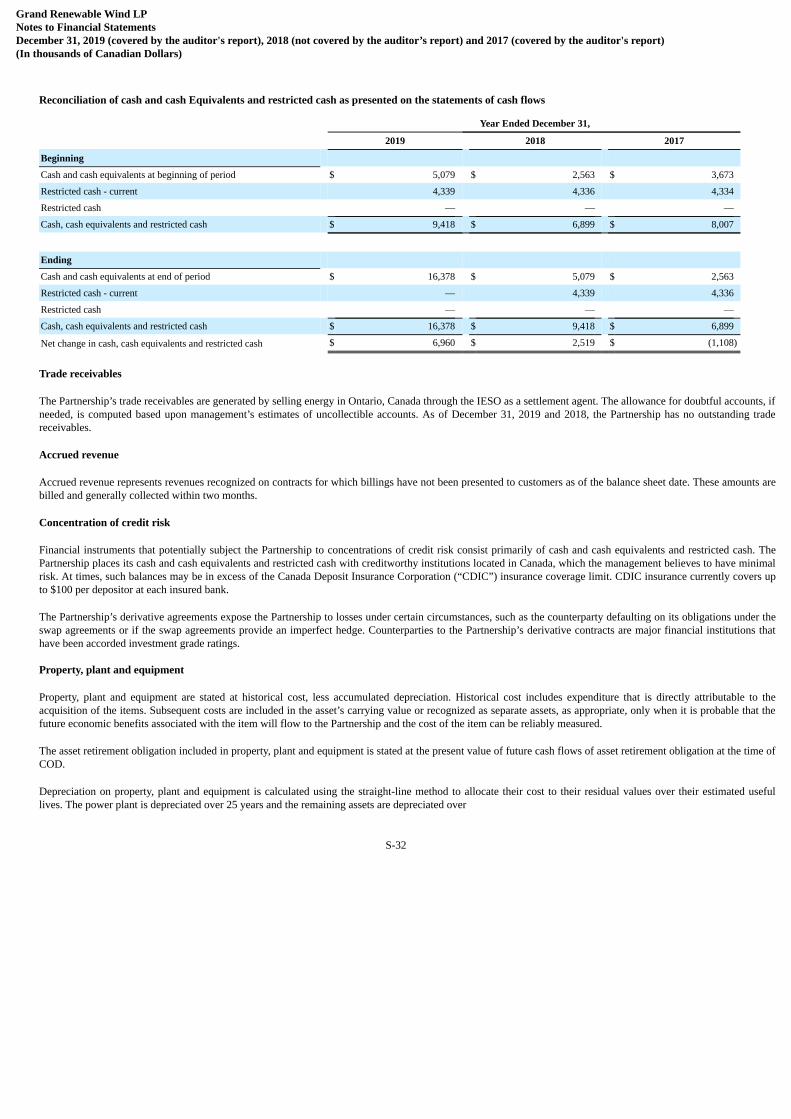
Grand Renewable Wind LPNotes to Financial StatementsDecember 31, 2019 (covered by the auditor's report), 2018 (not covered by the auditor’s report) and 2017 (covered by the auditor's report)(In thousands of Canadian Dollars)
Reconciliation of cash and cash Equivalents and restricted cash as presented on the statements of cash flows
Year Ended December 31,
2019 2018 2017
Beginning Cash and cash equivalents at beginning of period $ 5,079 $ 2,563 $ 3,673
Restricted cash - current 4,339 4,336 4,334
Restricted cash — — —
Cash, cash equivalents and restricted cash $ 9,418 $ 6,899 $ 8,007
Ending Cash and cash equivalents at end of period $ 16,378 $ 5,079 $ 2,563
Restricted cash - current — 4,339 4,336
Restricted cash — — —
Cash, cash equivalents and restricted cash $ 16,378 $ 9,418 $ 6,899
Net change in cash, cash equivalents and restricted cash $ 6,960 $ 2,519 $ (1,108)
Trade receivables
The Partnership’s trade receivables are generated by selling energy in Ontario, Canada through the IESO as a settlement agent. The allowance for doubtful accounts, ifneeded, is computed based upon management’s estimates of uncollectible accounts. As of December 31, 2019 and 2018, the Partnership has no outstanding tradereceivables.
Accrued revenue
Accrued revenue represents revenues recognized on contracts for which billings have not been presented to customers as of the balance sheet date. These amounts arebilled and generally collected within two months.
Concentration of credit risk
Financial instruments that potentially subject the Partnership to concentrations of credit risk consist primarily of cash and cash equivalents and restricted cash. ThePartnership places its cash and cash equivalents and restricted cash with creditworthy institutions located in Canada, which the management believes to have minimalrisk. At times, such balances may be in excess of the Canada Deposit Insurance Corporation (“CDIC”) insurance coverage limit. CDIC insurance currently covers upto $100 per depositor at each insured bank.
The Partnership’s derivative agreements expose the Partnership to losses under certain circumstances, such as the counterparty defaulting on its obligations under theswap agreements or if the swap agreements provide an imperfect hedge. Counterparties to the Partnership’s derivative contracts are major financial institutions thathave been accorded investment grade ratings.
Property, plant and equipment
Property, plant and equipment are stated at historical cost, less accumulated depreciation. Historical cost includes expenditure that is directly attributable to theacquisition of the items. Subsequent costs are included in the asset’s carrying value or recognized as separate assets, as appropriate, only when it is probable that thefuture economic benefits associated with the item will flow to the Partnership and the cost of the item can be reliably measured.
The asset retirement obligation included in property, plant and equipment is stated at the present value of future cash flows of asset retirement obligation at the time ofCOD.
Depreciation on property, plant and equipment is calculated using the straight-line method to allocate their cost to their residual values over their estimated usefullives. The power plant is depreciated over 25 years and the remaining assets are depreciated over
S-32
Grand Renewable Wind LPNotes to Financial StatementsDecember 31, 2019 (covered by the auditor's report), 2018 (not covered by the auditor’s report) and 2017 (covered by the auditor's report)(In thousands of Canadian Dollars)
5 years. The assets’ residual values and useful lives are reviewed and adjusted, if appropriate, at the end of each reporting period. Repair and maintenance costs areexpensed as incurred.
Lease
The Partnership determines if an arrangement is a lease at contract inception by evaluating if the contract conveys the right to control the use of identified assetsduring the period of use. A right of use (“ROU”) asset represents the Partnership’s right to use an identified asset for the lease term and lease liability represents thePartnership’s obligation to make payments as set forth in the lease agreement. ROU assets and lease liabilities are included on the Partnership’s balance sheetsbeginning January 1, 2019 and are recognized based on the present value of the future lease payments at the lease commencement date over the expected lease termwhich includes options to extend or terminate the lease when it is reasonably certain those options will be exercised. We have elected to include lease and non-leasecomponents in determining our lease liability for all land lease contracts. The interest rate used to determine the present value of the future lease payments is thePartnership’s incremental borrowing rate at lease inception, because the interest rate implicit in the lease is generally not readily determinable. A ROU asset initiallyequals the lease liabilities, adjusted for any lease payments made prior to lease commencement and any lease incentives. All leases are recorded on the balance sheetexcept for leases with an initial term of less than 12 months and variable lease payment based on the generated electricity revenue. All of the Partnership’s leases areoperating leases. Operating lease expense is generally recognized on a straight-line basis over the remaining useful life as of January 1, 2019 and is recorded in projectexpenses in the statements of operations and comprehensive income.
The variable lease payments are recorded in project expenses in the statements of operations and comprehensive income when the generated electricity revenue isearned.
Intangible assets
Amortization is calculated using the straight-line method and recorded against revenue over the remaining term of the PPA.
Impairment of long-lived assets
The Partnership periodically evaluates whether events have occurred that would require revision of the remaining useful life of equipment and improvements andpurchased intangible assets, or render them not recoverable. If such circumstances arise, the Partnership uses an estimate of the undiscounted value of expected futureoperating cash flows to determine whether the long-lived assets are impaired. If the aggregate undiscounted cash flows are less than the carrying amount of the assets,the resulting impairment charge to be recorded is calculated based on the excess of the carrying value of the assets over the fair value of such assets, with the fair valuedetermined based on an estimate of discounted future cash flows. Through December 31, 2018, no impairment charges were recorded.
Deferred financing costs
Financing costs incurred in connection with obtaining construction and term financing, which include direct financing, legal and other upfront costs of borrowing, arecapitalized and recorded as a reduction to long-term debt and amortized over the lives of the respective loans using the effective-interest method. Amortization ofdeferred financing costs is capitalized during construction or expensed following COD.
Derivatives
The Partnership recognizes its derivative instruments as either assets or liabilities in the balance sheets at fair value. The accounting for changes in the fair value (i.e.,gains or losses) of a derivative instrument depends on whether it qualifies and has been designated as part of a hedging relationship and the type of hedgingrelationship.
For derivative instruments that are designated and qualify as a cash flow hedge (i.e., hedging the exposure to variability in expected future cash flows that areattributable to a particular risk), the effective portion of the gain or loss on the derivative instrument is reported as a component of other comprehensive income(“OCI”) or loss (“OCL”). Changes in the fair value of these derivatives
S-33

Grand Renewable Wind LPNotes to Financial StatementsDecember 31, 2019 (covered by the auditor's report), 2018 (not covered by the auditor’s report) and 2017 (covered by the auditor's report)(In thousands of Canadian Dollars)
are subsequently reclassified into earnings in the period that the hedged transaction affects earnings. The ineffective portion of changes in fair value is recorded as acomponent of net income in the statements of operations and comprehensive income.
For undesignated derivative instruments, their change in fair value is reported as a component of net income in the statements of operations and comprehensiveincome.
The Partnership enters into derivative transactions for the purpose of managing exposure to fluctuations in interest rates, such as interest rate swaps. Interest rateswaps are instruments used to fix the interest rate on variable interest rate debt.
Accounts payable and other accrued liabilities
Trade payables are obligations to pay for goods or services that have been acquired in the ordinary course of business from suppliers. Payables with payment termsextended beyond one year from the balance sheet dates are presented as non-current liabilities.
Contingent liabilities
Contingent liabilities are recognized when: the Partnership has a present legal obligation as a result of past events; it is probable that an outflow of resources will berequired to settle the obligation; and the amount can be reasonably estimated.
Asset retirement obligation
The Partnership records an asset retirement obligation for the estimated costs of decommissioning turbines, removing above-ground installations and restoring sites, atthe time when a contractual decommissioning obligation materializes. The Partnership records accretion expense, which represents the increase in the asset retirementobligation, over the remaining life of the associated wind project. Accretion expense is recorded as cost of revenue in the statements of operations and comprehensiveincome using accretion rates based on a credit adjusted risk free interest rate of 6.51%.
Revenue recognition
Beginning in 2019, the Partnership adopted ASC 606 Revenue Recognition (ASC 606). See Note 3, Revenue, regarding the Partnership’s revenue recognition policy.
Revenue is recognized based upon the amount of electricity delivered or curtailed at rates specified under the contracts, assuming all other revenue recognition criteriaare met. When curtailment revenue is earned, it is recorded as compensation for forgone revenue. The Partnership evaluates its PPA to determine whether it is insubstance a lease or derivative and, if applicable, recognizes revenue pursuant to ASC 842 Leases and ASC 815 Derivatives and Hedging, respectively. As ofDecember 31, 2019, the PPA was not considered a lease or a derivative instrument, as multiple market participants purchase the energy at market-based prices withIESO working as a settlement agent. As a result, revenue (including any revenue from the price guaranteed by IESO), is recognized according to the right to invoicepractical expedient as prescribed by ASC 606.
The Partnership recognizes revenue for warranty settlements and liquidated damages from a turbine manufacturer in other revenue upon resolution of outstandingcontingencies. Any cash receipts for amounts subject to future adjustment or repayment are deferred in other liabilities until the final settlement amount is consideredfixed and determinable.
Cost of revenue
The Partnership’s cost of revenue is comprised of direct costs of operating and maintaining its project facilities, including labor, turbine service arrangements,metering service and shadow settlement, environmental fee, land lease royalties, property tax, insurance, depreciation, amortization and accretion.
Comprehensive income
Comprehensive income consists of net income and other comprehensive income. Other comprehensive income is included in accumulated other comprehensiveincome in the accompanying statements of changes in partners’ equity.
S-34
Grand Renewable Wind LPNotes to Financial StatementsDecember 31, 2019 (covered by the auditor's report), 2018 (not covered by the auditor’s report) and 2017 (covered by the auditor's report)(In thousands of Canadian Dollars)
Recently adopted accounting standard
In May 2014, the FASB issued ASU 2014-09, Revenue from Contracts with Customers (Topic 606), which supersedes the revenue recognition requirements in Topic605, Revenue Recognition (Topic 605) and requires entities to recognize revenue when control of the promised goods or services is transferred to customers at anamount that reflects the consideration to which the entity expects to be entitled to in exchange for those goods or services. The Partnership adopted ASU 2014-09 as ofJanuary 1, 2019 using the modified retrospective transition method. The adoption did not have a material impact on the Partnership’s consolidated financialstatements, other than additional disclosures. See Note 3, Revenue for further details.
In February 2016, the FASB issued ASU 2016-12, Leases (ASC 842), as amended by subsequent standards updates, which requires lessees to recognize ROU assetsand lease liabilities, for all leases, with the exception of short-term leases, at the commencement date of each lease. Under the new guidance, lessor accounting islargely unchanged. ASC 842 simplifies the accounting for sale and leaseback transactions primarily because lessees must recognize lease assets and liabilities.
The Partnership has adopted ASC 842 retrospectively from January 1, 2019, but has not restated comparatives for the 2018 reporting period, as permitted under thespecific transitional provision in the standard. The reclassifications and the adjustments arising from the new leasing rules are therefore recognized in the openingbalance sheet on January 1, 2019. See Note 6, Leases for further details.
Recent accounting pronouncements
In August 2018, the FASB issued ASU 2018-13, Changes to the Disclosure Requirements for Fair Value Measurement (ASU 2018-13), which amends changes inunrealized gains and losses, the range and weighted average of significant unobservable inputs used to develop Level 3 fair value measurements, and the narrativedescription of measurement uncertainty which should be applied prospectively for only the most recent interim or annual period presented in the initial fiscal year ofadoption. ASU 2018-13 is effective for annual periods beginning after December 15, 2019, including interim periods within those periods. Early application ispermitted. The Partnership is currently assessing the impact of changes to the disclosure requirements for fair value measurement.
In June 2016, the FASB issued ASU 2016-13, Financial Instruments - Credit Losses (Topic 326): Measurement of Credit Losses on Financial Instruments (ASU 2016-13), which requires the measurement of all expected credit losses for financial assets including trade receivables held at the reporting date based on historicalexperience, current conditions, and reasonable and supportable forecasts. In November 2018, the FASB issued ASU 2018-19, Codification Improvements to Topic326, Financial Instruments - Credit Losses, for the purposes of clarifying certain aspects of ASU 2016-13. In April 2019, the FASB issued ASU 2019-04, CodificationImprovements to Topic 326, Financial Instruments - Credit Losses, Topic 815, Derivatives and Hedging, and Topic 825, Financial Instruments (ASU 2019-04), whichclarifies the treatment of certain credit losses. In May 2019, the FASB issued ASU 2019-05, Financial Instruments - Credit Losses (Topic 326): Targeted TransitionRelief (ASU 2019-05), which provides an option to irrevocably elect to measure certain individual financial assets at fair value instead of amortized cost. InNovember 2019, the FASB issued ASU 2019-11, Codification Improvements to Topic 326, Financial Instruments - Credit Losses (ASU 2019-11), which providesguidance around how to report expected recoveries. ASU 2016-13, as amended, is effective for fiscal years, and interim periods within those fiscal years, beginningafter December 15, 2020. The adoption of ASU 2016-13 is not expected to have a material impact on the Partnership’s financial statements and related disclosures.
In October 2018, the FASB issued ASU 2018-16, Derivatives and Hedging (Topic ASC 815): Inclusion of the Secured Overnight Financing Rate (SOFR) OvernightIndex Swap (OIS) Rate as a Benchmark Interest Rate for Hedge Accounting Purposes (ASU 2018-16), which expands the list of U.S. benchmark interest ratespermitted in the application of hedge accounting. Because of concerns about the sustainability of LIBOR, the Federal Reserve Board and the Federal Reserve Bank ofNew York (Fed) initiated an effort to introduce an alternative reference rate in the United States. The SOFR is calculated by the Fed based on the interest rates bankscharge one another in the overnight market, typically called repurchase agreements, and because it is based on transactions in the open market, it is more reflective ofmarket conditions than LIBOR, which relies on judgment. The provisions of ASU 2017-12 (discussed below) and ASU 2018-16 are effective for fiscal yearsbeginning after December 15, 2019, with early adoption permitted. Initial adoption of ASU 2017-12 is required to be reported using a modified retrospectiveapproach, with the exception of the presentation and disclosure requirements which are required to be applied prospectively. The Partnership is currently in the processof determining the impact of adoption of the provisions of ASU 2017-12 and ASU 2018-16.
In August 2017, the FASB issued ASU 2017-12, Targeted Improvements to Accounting for Hedging Activities (ASU 2017-12), which amends the presentation anddisclosure requirements and changes how companies assess effectiveness. The amendments are
S-35
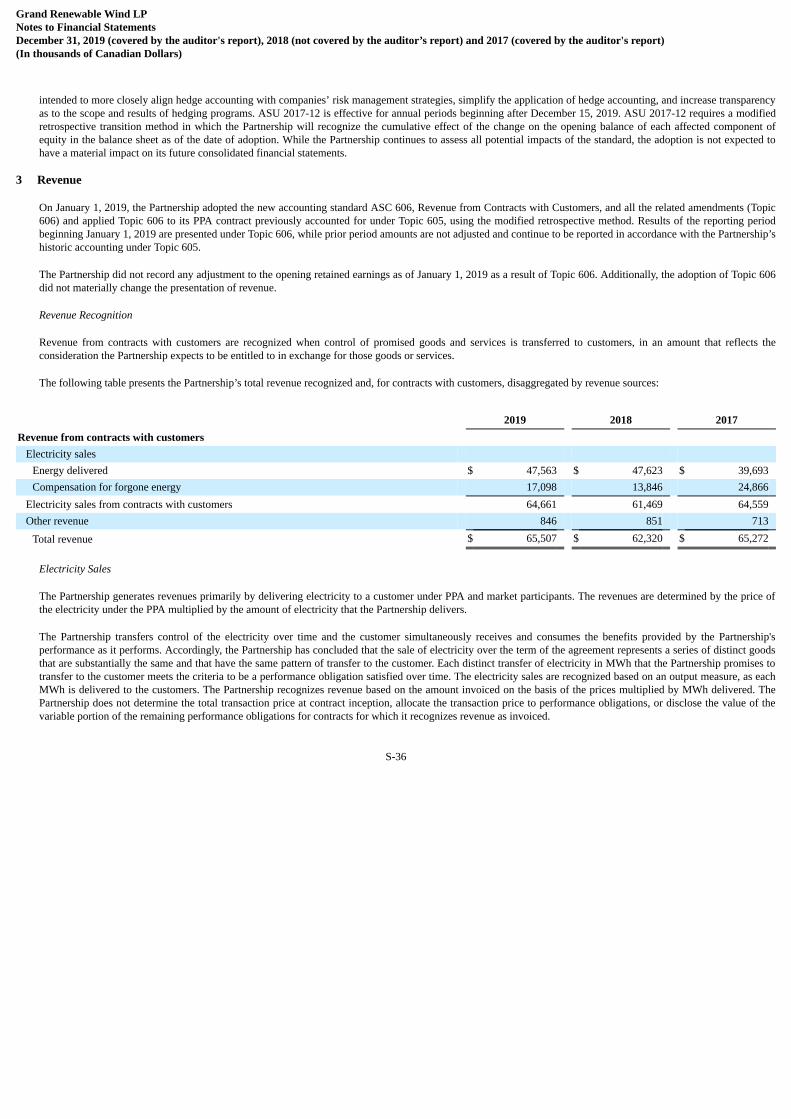
Grand Renewable Wind LPNotes to Financial StatementsDecember 31, 2019 (covered by the auditor's report), 2018 (not covered by the auditor’s report) and 2017 (covered by the auditor's report)(In thousands of Canadian Dollars)
intended to more closely align hedge accounting with companies’ risk management strategies, simplify the application of hedge accounting, and increase transparencyas to the scope and results of hedging programs. ASU 2017-12 is effective for annual periods beginning after December 15, 2019. ASU 2017-12 requires a modifiedretrospective transition method in which the Partnership will recognize the cumulative effect of the change on the opening balance of each affected component ofequity in the balance sheet as of the date of adoption. While the Partnership continues to assess all potential impacts of the standard, the adoption is not expected tohave a material impact on its future consolidated financial statements.
3 Revenue
On January 1, 2019, the Partnership adopted the new accounting standard ASC 606, Revenue from Contracts with Customers, and all the related amendments (Topic606) and applied Topic 606 to its PPA contract previously accounted for under Topic 605, using the modified retrospective method. Results of the reporting periodbeginning January 1, 2019 are presented under Topic 606, while prior period amounts are not adjusted and continue to be reported in accordance with the Partnership’shistoric accounting under Topic 605.
The Partnership did not record any adjustment to the opening retained earnings as of January 1, 2019 as a result of Topic 606. Additionally, the adoption of Topic 606did not materially change the presentation of revenue.
Revenue Recognition
Revenue from contracts with customers are recognized when control of promised goods and services is transferred to customers, in an amount that reflects theconsideration the Partnership expects to be entitled to in exchange for those goods or services.
The following table presents the Partnership’s total revenue recognized and, for contracts with customers, disaggregated by revenue sources:
2019 2018 2017Revenue from contracts with customers
Electricity sales Energy delivered $ 47,563 $ 47,623 $ 39,693Compensation for forgone energy 17,098 13,846 24,866
Electricity sales from contracts with customers 64,661 61,469 64,559Other revenue 846 851 713
Total revenue $ 65,507 $ 62,320 $ 65,272
Electricity Sales
The Partnership generates revenues primarily by delivering electricity to a customer under PPA and market participants. The revenues are determined by the price ofthe electricity under the PPA multiplied by the amount of electricity that the Partnership delivers.
The Partnership transfers control of the electricity over time and the customer simultaneously receives and consumes the benefits provided by the Partnership'sperformance as it performs. Accordingly, the Partnership has concluded that the sale of electricity over the term of the agreement represents a series of distinct goodsthat are substantially the same and that have the same pattern of transfer to the customer. Each distinct transfer of electricity in MWh that the Partnership promises totransfer to the customer meets the criteria to be a performance obligation satisfied over time. The electricity sales are recognized based on an output measure, as eachMWh is delivered to the customers. The Partnership recognizes revenue based on the amount invoiced on the basis of the prices multiplied by MWh delivered. ThePartnership does not determine the total transaction price at contract inception, allocate the transaction price to performance obligations, or disclose the value of thevariable portion of the remaining performance obligations for contracts for which it recognizes revenue as invoiced.
S-36
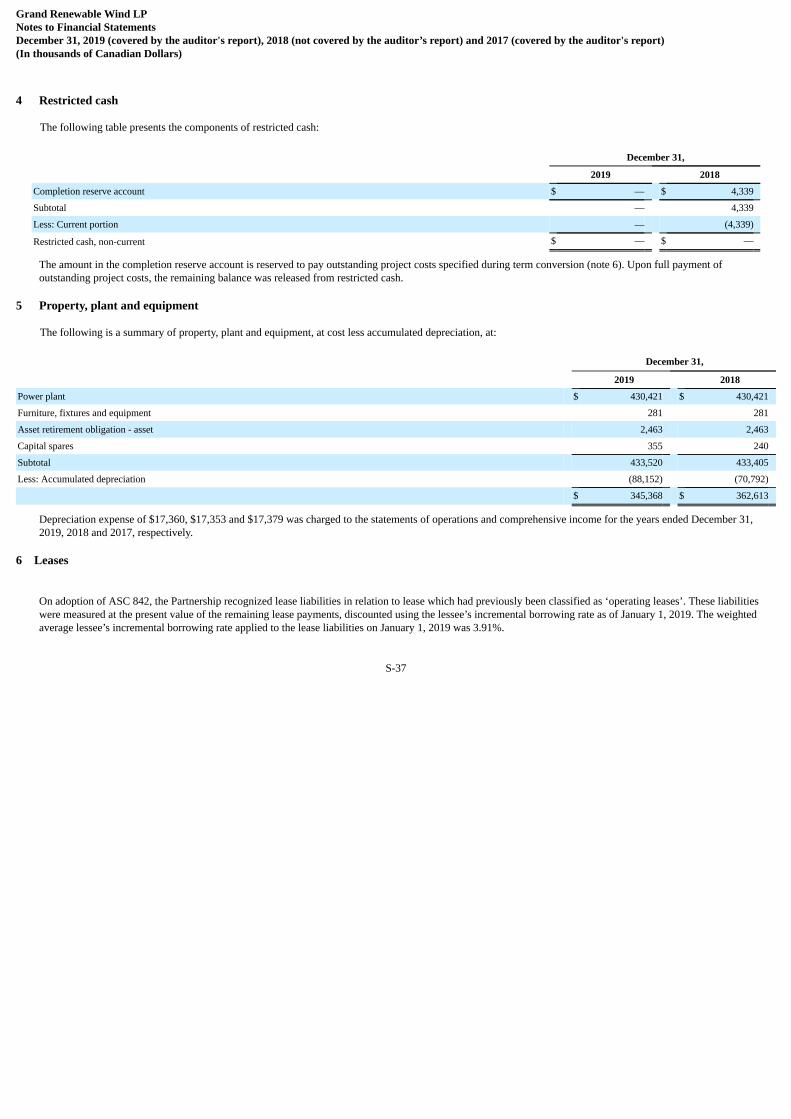
Grand Renewable Wind LPNotes to Financial StatementsDecember 31, 2019 (covered by the auditor's report), 2018 (not covered by the auditor’s report) and 2017 (covered by the auditor's report)(In thousands of Canadian Dollars)
4 Restricted cash
The following table presents the components of restricted cash:
December 31,
2019 2018
Completion reserve account $ — $ 4,339
Subtotal — 4,339
Less: Current portion — (4,339)
Restricted cash, non-current $ — $ —
The amount in the completion reserve account is reserved to pay outstanding project costs specified during term conversion (note 6). Upon full payment ofoutstanding project costs, the remaining balance was released from restricted cash.
5 Property, plant and equipment
The following is a summary of property, plant and equipment, at cost less accumulated depreciation, at:
December 31,
2019 2018
Power plant $ 430,421 $ 430,421
Furniture, fixtures and equipment 281 281
Asset retirement obligation - asset 2,463 2,463
Capital spares 355 240
Subtotal 433,520 433,405
Less: Accumulated depreciation (88,152) (70,792)
$ 345,368 $ 362,613
Depreciation expense of $17,360, $17,353 and $17,379 was charged to the statements of operations and comprehensive income for the years ended December 31,2019, 2018 and 2017, respectively.
6 Leases
On adoption of ASC 842, the Partnership recognized lease liabilities in relation to lease which had previously been classified as ‘operating leases’. These liabilitieswere measured at the present value of the remaining lease payments, discounted using the lessee’s incremental borrowing rate as of January 1, 2019. The weightedaverage lessee’s incremental borrowing rate applied to the lease liabilities on January 1, 2019 was 3.91%.
S-37
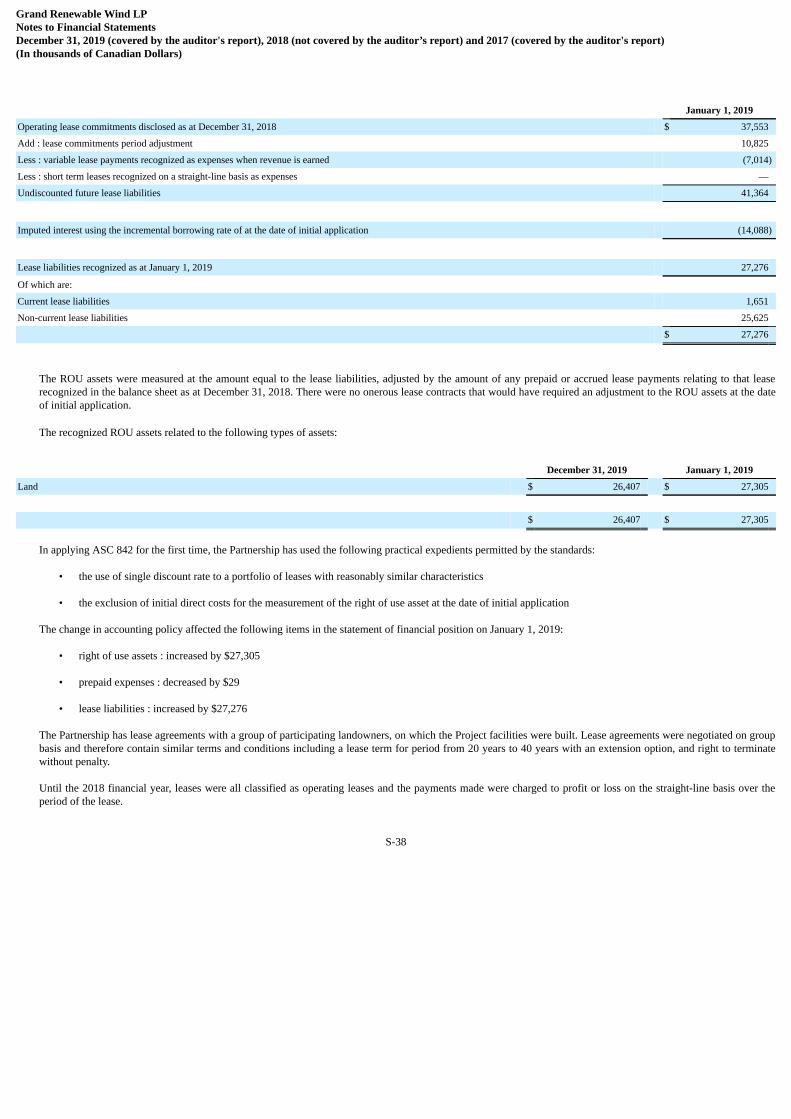
Grand Renewable Wind LPNotes to Financial StatementsDecember 31, 2019 (covered by the auditor's report), 2018 (not covered by the auditor’s report) and 2017 (covered by the auditor's report)(In thousands of Canadian Dollars)
January 1, 2019
Operating lease commitments disclosed as at December 31, 2018 $ 37,553
Add : lease commitments period adjustment 10,825
Less : variable lease payments recognized as expenses when revenue is earned (7,014)
Less : short term leases recognized on a straight-line basis as expenses —
Undiscounted future lease liabilities 41,364
Imputed interest using the incremental borrowing rate of at the date of initial application (14,088)
Lease liabilities recognized as at January 1, 2019 27,276
Of which are: Current lease liabilities 1,651
Non-current lease liabilities 25,625
$ 27,276
The ROU assets were measured at the amount equal to the lease liabilities, adjusted by the amount of any prepaid or accrued lease payments relating to that leaserecognized in the balance sheet as at December 31, 2018. There were no onerous lease contracts that would have required an adjustment to the ROU assets at the dateof initial application.
The recognized ROU assets related to the following types of assets:
December 31, 2019 January 1, 2019
Land $ 26,407 $ 27,305
$ 26,407 $ 27,305
In applying ASC 842 for the first time, the Partnership has used the following practical expedients permitted by the standards:
• the use of single discount rate to a portfolio of leases with reasonably similar characteristics
• the exclusion of initial direct costs for the measurement of the right of use asset at the date of initial application
The change in accounting policy affected the following items in the statement of financial position on January 1, 2019:
• right of use assets : increased by $27,305
• prepaid expenses : decreased by $29
• lease liabilities : increased by $27,276
The Partnership has lease agreements with a group of participating landowners, on which the Project facilities were built. Lease agreements were negotiated on groupbasis and therefore contain similar terms and conditions including a lease term for period from 20 years to 40 years with an extension option, and right to terminatewithout penalty.
Until the 2018 financial year, leases were all classified as operating leases and the payments made were charged to profit or loss on the straight-line basis over theperiod of the lease.
S-38
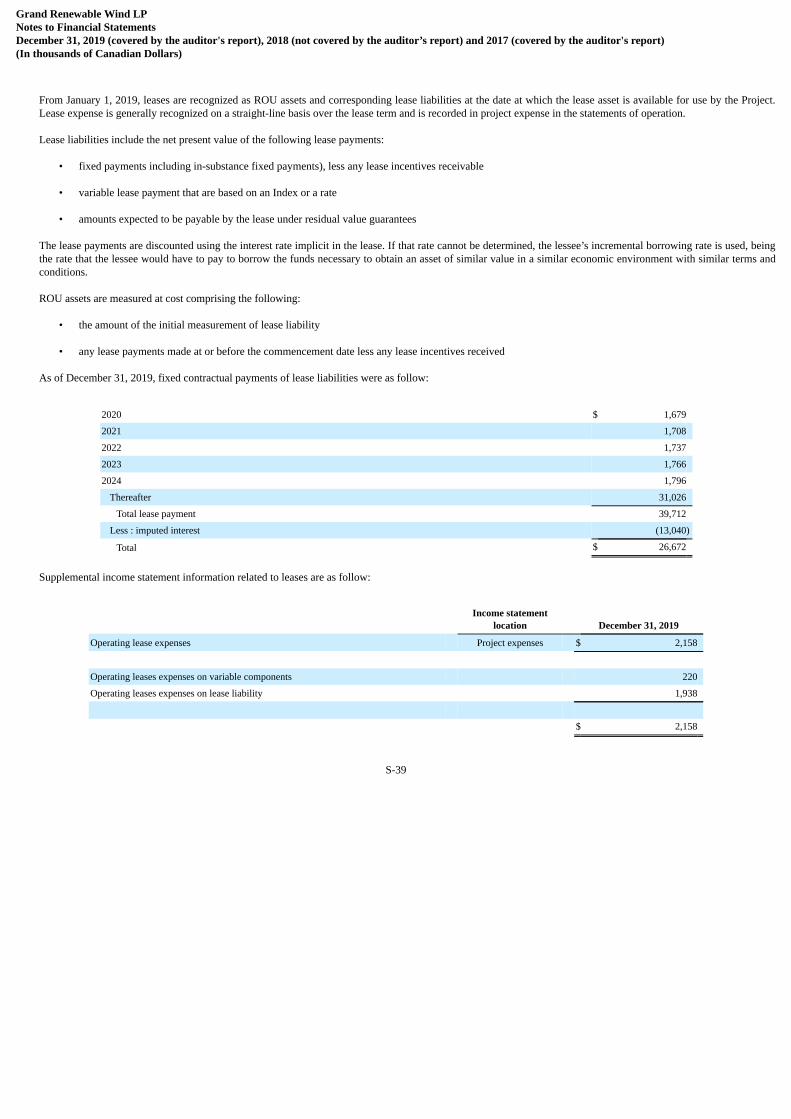
Grand Renewable Wind LPNotes to Financial StatementsDecember 31, 2019 (covered by the auditor's report), 2018 (not covered by the auditor’s report) and 2017 (covered by the auditor's report)(In thousands of Canadian Dollars)
From January 1, 2019, leases are recognized as ROU assets and corresponding lease liabilities at the date at which the lease asset is available for use by the Project.Lease expense is generally recognized on a straight-line basis over the lease term and is recorded in project expense in the statements of operation.
Lease liabilities include the net present value of the following lease payments:
• fixed payments including in-substance fixed payments), less any lease incentives receivable
• variable lease payment that are based on an Index or a rate
• amounts expected to be payable by the lease under residual value guarantees
The lease payments are discounted using the interest rate implicit in the lease. If that rate cannot be determined, the lessee’s incremental borrowing rate is used, beingthe rate that the lessee would have to pay to borrow the funds necessary to obtain an asset of similar value in a similar economic environment with similar terms andconditions.
ROU assets are measured at cost comprising the following:
• the amount of the initial measurement of lease liability
• any lease payments made at or before the commencement date less any lease incentives received
As of December 31, 2019, fixed contractual payments of lease liabilities were as follow:
2020 $ 1,679
2021 1,708
2022 1,737
2023 1,766
2024 1,796
Thereafter 31,026
Total lease payment 39,712
Less : imputed interest (13,040)
Total $ 26,672
Supplemental income statement information related to leases are as follow:
Income statement
location December 31, 2019
Operating lease expenses Project expenses $ 2,158
Operating leases expenses on variable components 220
Operating leases expenses on lease liability 1,938
$ 2,158
S-39

Grand Renewable Wind LPNotes to Financial StatementsDecember 31, 2019 (covered by the auditor's report), 2018 (not covered by the auditor’s report) and 2017 (covered by the auditor's report)(In thousands of Canadian Dollars)
Supplemental cash flow and other information related to leases are as follow:
December 31, 2019
Operating cash flow from operating lease $ (604)
Weighted average remaining lease terms (years) 19
Weighted average discounted rate 3.91%
7 Intangible assets
December 31,
2019 2018
Beginning net book value $ 1,331 $ 1,414
Amortization expense (84) (83)
Closing net book value $ 1,247 $ 1,331
December 31,
2019 2018
Cost $ 1,672 $ 1,672
Accumulated amortization (425) (341)
Net book value $ 1,247 $ 1,331
Amortization expense of $84, $83 and $84 was charged as a reduction to revenue in the statements of operations and comprehensive income for the years endedDecember 31, 2019, 2018 and 2017, respectively.
8 Long-term debt
Upon achievement of the COD in December 2014, the construction facility converted to term loan on July 29, 2015. The original loan maturity was on July 29, 2022.In connection with the new credit agreement, the Partnership entered into interest rate swaps that would fix the interest rate for the outstanding notional amount ateach settlement date.
On December 6, 2019, the Partnership terminated the original credit agreement executed on September 13, 2013 and entered into a new credit agreement with a groupof lenders to reduce the related interest rate to the Canadian Dealer Offered Rate (CDOR) plus 1.125%. The new credit agreement provides for a $422,916 term loanfacility, a $38,500 letter of credit facility and an interest rate hedge facility for a term aligning with the PPA.
As of December 6, 2019, the Partnership had a total of $3,105 in unamortized deferred financing costs relating to the original 2013 credit agreement. The unamortizedcosts of $2,647 related to 9 of their original lenders, who are no longer counterparties in the new credit agreement were recognised as interest expense in the statementof operations and comprehensive income. The Partnership determined that the new credit agreement was a debt modification as prescribed in ASC 470, Debt,therefore the remaining portion of unamortized costs of $458, attributable to 1 lender who is a counterparty to the new credit continues to be amortized over the termof the new credit agreement.
At December 6, 2019, the Partnership capitalized $6,700 of deferred financing costs associated with the new borrowings which are amortized over the term of the newcredit agreement.
Collateral under the new credit agreement consists of substantially all of the Partnership’s assets. The credit agreement contains a broad range of typical covenantsthat, subject to certain exceptions, restrict the Partnership’s ability to incur debt, grant liens, sell or lease assets, transfer equity interest, dissolve, pay distributions andchange its business. The Partnership is in compliance with all of the covenants contained in the new credit agreement. Each of the limited partners and the GP of thePartnership pledged their partnership units as collateral for the loan. Each of the shareholders of the GP pledged shares their shares in the GP as collateral for the loan.
S-40
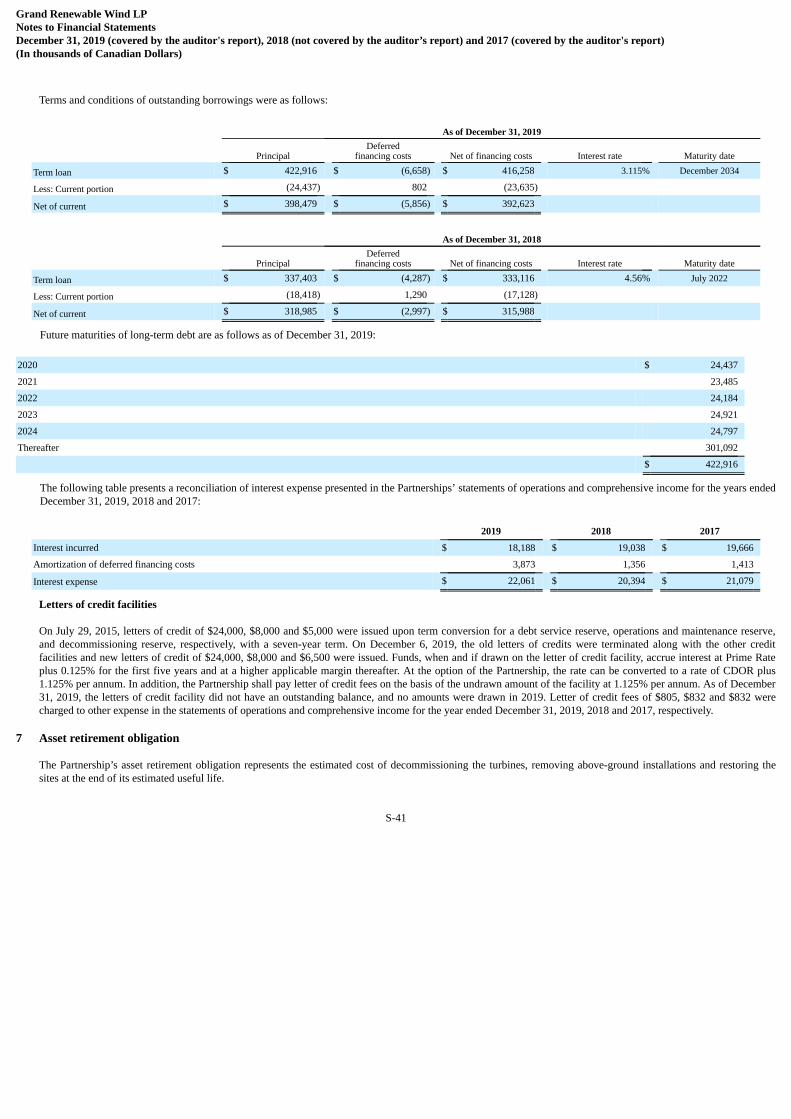
Grand Renewable Wind LPNotes to Financial StatementsDecember 31, 2019 (covered by the auditor's report), 2018 (not covered by the auditor’s report) and 2017 (covered by the auditor's report)(In thousands of Canadian Dollars)
Terms and conditions of outstanding borrowings were as follows:
As of December 31, 2019
Principal Deferred
financing costs Net of financing costs Interest rate Maturity date
Term loan $ 422,916 $ (6,658) $ 416,258 3.115% December 2034
Less: Current portion (24,437) 802 (23,635)
Net of current $ 398,479 $ (5,856) $ 392,623
As of December 31, 2018
Principal Deferred
financing costs Net of financing costs Interest rate Maturity date
Term loan $ 337,403 $ (4,287) $ 333,116 4.56% July 2022
Less: Current portion (18,418) 1,290 (17,128)
Net of current $ 318,985 $ (2,997) $ 315,988
Future maturities of long-term debt are as follows as of December 31, 2019:
2020 $ 24,437
2021 23,485
2022 24,184
2023 24,921
2024 24,797
Thereafter 301,092
$ 422,916
The following table presents a reconciliation of interest expense presented in the Partnerships’ statements of operations and comprehensive income for the years endedDecember 31, 2019, 2018 and 2017:
2019 2018 2017
Interest incurred $ 18,188 $ 19,038 $ 19,666
Amortization of deferred financing costs 3,873 1,356 1,413
Interest expense $ 22,061 $ 20,394 $ 21,079
Letters of credit facilities
On July 29, 2015, letters of credit of $24,000, $8,000 and $5,000 were issued upon term conversion for a debt service reserve, operations and maintenance reserve,and decommissioning reserve, respectively, with a seven-year term. On December 6, 2019, the old letters of credits were terminated along with the other creditfacilities and new letters of credit of $24,000, $8,000 and $6,500 were issued. Funds, when and if drawn on the letter of credit facility, accrue interest at Prime Rateplus 0.125% for the first five years and at a higher applicable margin thereafter. At the option of the Partnership, the rate can be converted to a rate of CDOR plus1.125% per annum. In addition, the Partnership shall pay letter of credit fees on the basis of the undrawn amount of the facility at 1.125% per annum. As of December31, 2019, the letters of credit facility did not have an outstanding balance, and no amounts were drawn in 2019. Letter of credit fees of $805, $832 and $832 werecharged to other expense in the statements of operations and comprehensive income for the year ended December 31, 2019, 2018 and 2017, respectively.
7 Asset retirement obligation
The Partnership’s asset retirement obligation represents the estimated cost of decommissioning the turbines, removing above-ground installations and restoring thesites at the end of its estimated useful life.
S-41
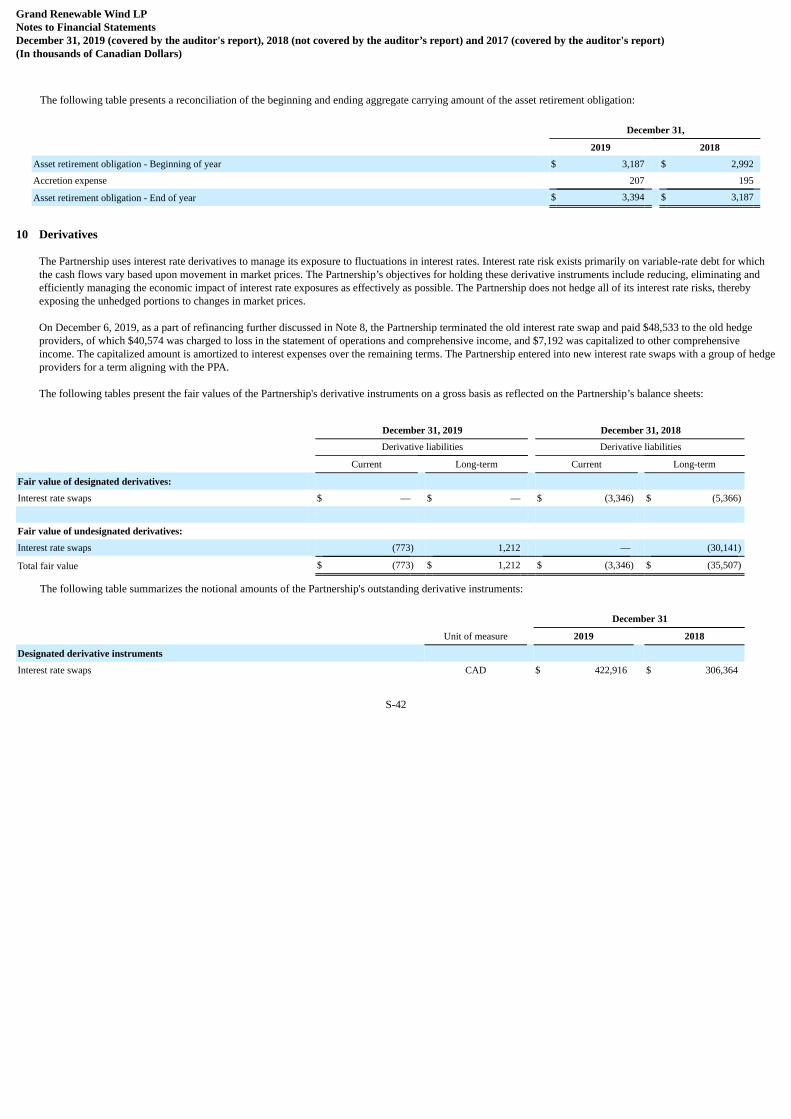
Grand Renewable Wind LPNotes to Financial StatementsDecember 31, 2019 (covered by the auditor's report), 2018 (not covered by the auditor’s report) and 2017 (covered by the auditor's report)(In thousands of Canadian Dollars)
The following table presents a reconciliation of the beginning and ending aggregate carrying amount of the asset retirement obligation:
December 31,
2019 2018
Asset retirement obligation - Beginning of year $ 3,187 $ 2,992
Accretion expense 207 195
Asset retirement obligation - End of year $ 3,394 $ 3,187
10 Derivatives
The Partnership uses interest rate derivatives to manage its exposure to fluctuations in interest rates. Interest rate risk exists primarily on variable-rate debt for whichthe cash flows vary based upon movement in market prices. The Partnership’s objectives for holding these derivative instruments include reducing, eliminating andefficiently managing the economic impact of interest rate exposures as effectively as possible. The Partnership does not hedge all of its interest rate risks, therebyexposing the unhedged portions to changes in market prices.
On December 6, 2019, as a part of refinancing further discussed in Note 8, the Partnership terminated the old interest rate swap and paid $48,533 to the old hedgeproviders, of which $40,574 was charged to loss in the statement of operations and comprehensive income, and $7,192 was capitalized to other comprehensiveincome. The capitalized amount is amortized to interest expenses over the remaining terms. The Partnership entered into new interest rate swaps with a group of hedgeproviders for a term aligning with the PPA.
The following tables present the fair values of the Partnership's derivative instruments on a gross basis as reflected on the Partnership’s balance sheets:
December 31, 2019 December 31, 2018
Derivative liabilities Derivative liabilities
Current Long-term Current Long-term
Fair value of designated derivatives: Interest rate swaps $ — $ — $ (3,346) $ (5,366)
Fair value of undesignated derivatives: Interest rate swaps (773) 1,212 — (30,141)
Total fair value $ (773) $ 1,212 $ (3,346) $ (35,507)
The following table summarizes the notional amounts of the Partnership's outstanding derivative instruments:
December 31
Unit of measure 2019 2018
Designated derivative instruments Interest rate swaps CAD $ 422,916 $ 306,364
S-42
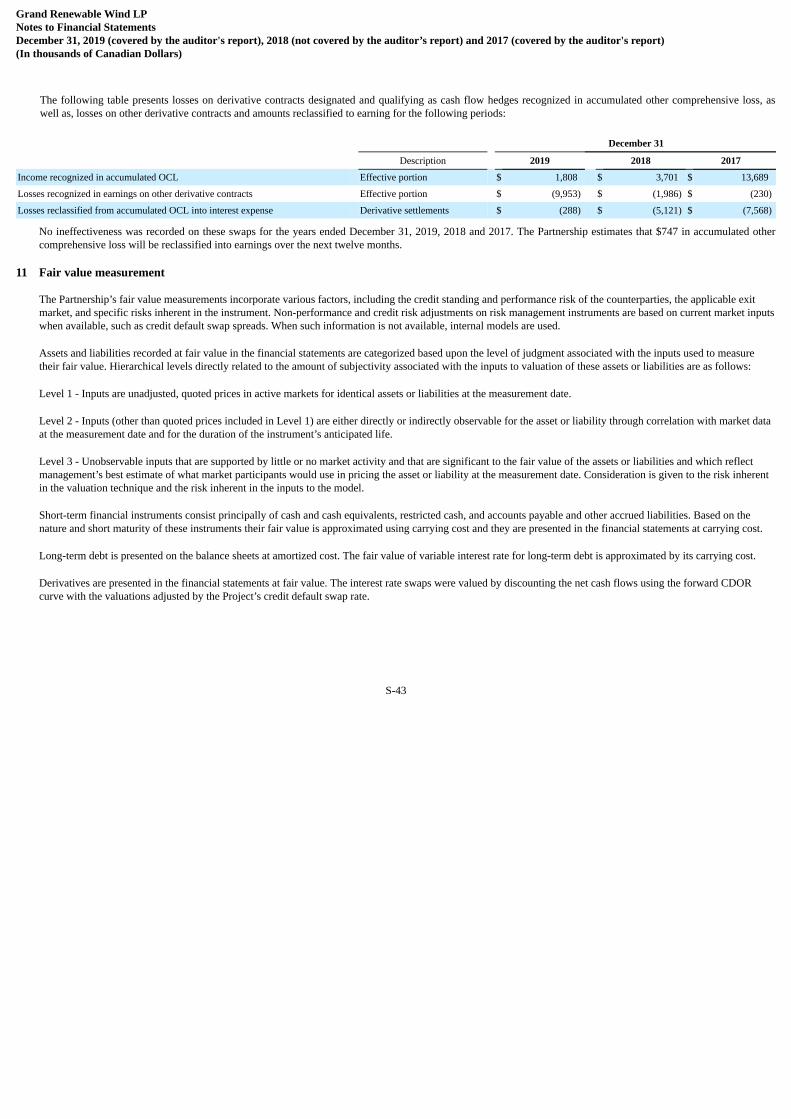
Grand Renewable Wind LPNotes to Financial StatementsDecember 31, 2019 (covered by the auditor's report), 2018 (not covered by the auditor’s report) and 2017 (covered by the auditor's report)(In thousands of Canadian Dollars)
The following table presents losses on derivative contracts designated and qualifying as cash flow hedges recognized in accumulated other comprehensive loss, aswell as, losses on other derivative contracts and amounts reclassified to earning for the following periods:
December 31
Description 2019 2018 2017
Income recognized in accumulated OCL Effective portion $ 1,808 $ 3,701 $ 13,689
Losses recognized in earnings on other derivative contracts Effective portion $ (9,953) $ (1,986) $ (230)
Losses reclassified from accumulated OCL into interest expense Derivative settlements $ (288) $ (5,121) $ (7,568)
No ineffectiveness was recorded on these swaps for the years ended December 31, 2019, 2018 and 2017. The Partnership estimates that $747 in accumulated othercomprehensive loss will be reclassified into earnings over the next twelve months.
11 Fair value measurement
The Partnership’s fair value measurements incorporate various factors, including the credit standing and performance risk of the counterparties, the applicable exitmarket, and specific risks inherent in the instrument. Non-performance and credit risk adjustments on risk management instruments are based on current market inputswhen available, such as credit default swap spreads. When such information is not available, internal models are used.
Assets and liabilities recorded at fair value in the financial statements are categorized based upon the level of judgment associated with the inputs used to measuretheir fair value. Hierarchical levels directly related to the amount of subjectivity associated with the inputs to valuation of these assets or liabilities are as follows:
Level 1 - Inputs are unadjusted, quoted prices in active markets for identical assets or liabilities at the measurement date.
Level 2 - Inputs (other than quoted prices included in Level 1) are either directly or indirectly observable for the asset or liability through correlation with market dataat the measurement date and for the duration of the instrument’s anticipated life.
Level 3 - Unobservable inputs that are supported by little or no market activity and that are significant to the fair value of the assets or liabilities and which reflectmanagement’s best estimate of what market participants would use in pricing the asset or liability at the measurement date. Consideration is given to the risk inherentin the valuation technique and the risk inherent in the inputs to the model.
Short-term financial instruments consist principally of cash and cash equivalents, restricted cash, and accounts payable and other accrued liabilities. Based on thenature and short maturity of these instruments their fair value is approximated using carrying cost and they are presented in the financial statements at carrying cost.
Long-term debt is presented on the balance sheets at amortized cost. The fair value of variable interest rate for long-term debt is approximated by its carrying cost.
Derivatives are presented in the financial statements at fair value. The interest rate swaps were valued by discounting the net cash flows using the forward CDORcurve with the valuations adjusted by the Project’s credit default swap rate.
S-43

Grand Renewable Wind LPNotes to Financial StatementsDecember 31, 2019 (covered by the auditor's report), 2018 (not covered by the auditor’s report) and 2017 (covered by the auditor's report)(In thousands of Canadian Dollars)
The Partnership’s financial assets (liabilities) which require fair value measurement on a recurring basis are classified within the fair value hierarchy as follows:
Level 1 Level 2 Level 3
December 31, 2019 Interest rate swaps $ — $ 479 $ —
December 31, 2018 Interest rate swaps $ — $ (38,853) $ —
12 Commitments and contingencies
1) Commitments
Service and Maintenance Agreement
The Partnership has entered into service and maintenance agreements with Siemens to provide and carry out turbine maintenance and service activities for the Projectuntil January 2021. Based on the terms of the agreements, Siemens shall be entitled to receive a daily base fee per turbine that may be subject to periodic priceadjustments for inflation, over the terms of the agreements. As of December 31, 2019, outstanding commitments with Siemens were $1,417, including an estimatedannual price adjustment for inflation of 2%, where applicable, payable over the full term of the agreement.
2) Contingencies
Community Vibrancy Fund
On September 26, 2011, the Partnership entered into a Community Vibrancy Fund (CVF) Agreement with the Corporation of Haldimand County, in which thePartnership will make annual payments into a fund managed by the municipality in amounts of $3.5 per MW of the Project installed capacity plus $5 per kilometer(km) of high voltage overhead transmission line that is installed in municipal right-of-way. The payments are calculated annually and are owed for the 20-year term ofthe PPA. In exchange for CVF payments, the municipality undertakes certain obligations to support the Project, including entering into a road use agreement in whichthe Project may utilize municipal rights of way for collection and transmission lines.
Turbine Availability Warranty
The Partnership has a turbine availability warranty from its turbine manufacturer. Pursuant to the warranty, if a turbine operates at less than minimum availabilityduring the warranty period, the turbine manufacturer is obligated to pay, as liquidated damages, an amount for each percent that the turbine operates below theminimum availability threshold. In addition, if a turbine operates at more than a specified availability during the warranty period, the Partnership has an obligation topay a bonus to the turbine manufacturer. As of December 31, 2019, the Partnership recorded a liability of $36 associated with bonuses payable to the turbinemanufacturer.
13 Related party transactions
The Partnership is managed by the GP, which is jointly controlled by Samsung and Pattern in accordance with the terms of the Unanimous Shareholder Agreement.Certain terms of the Samsung Pattern Joint Venture Wind Development Agreement, entered into between Samsung and an affiliate of Pattern Renewable HoldingsCanada ULC (“PRHC”) on July 27, 2010, directed the responsibilities of Samsung and PRHC for the Project.
S-44
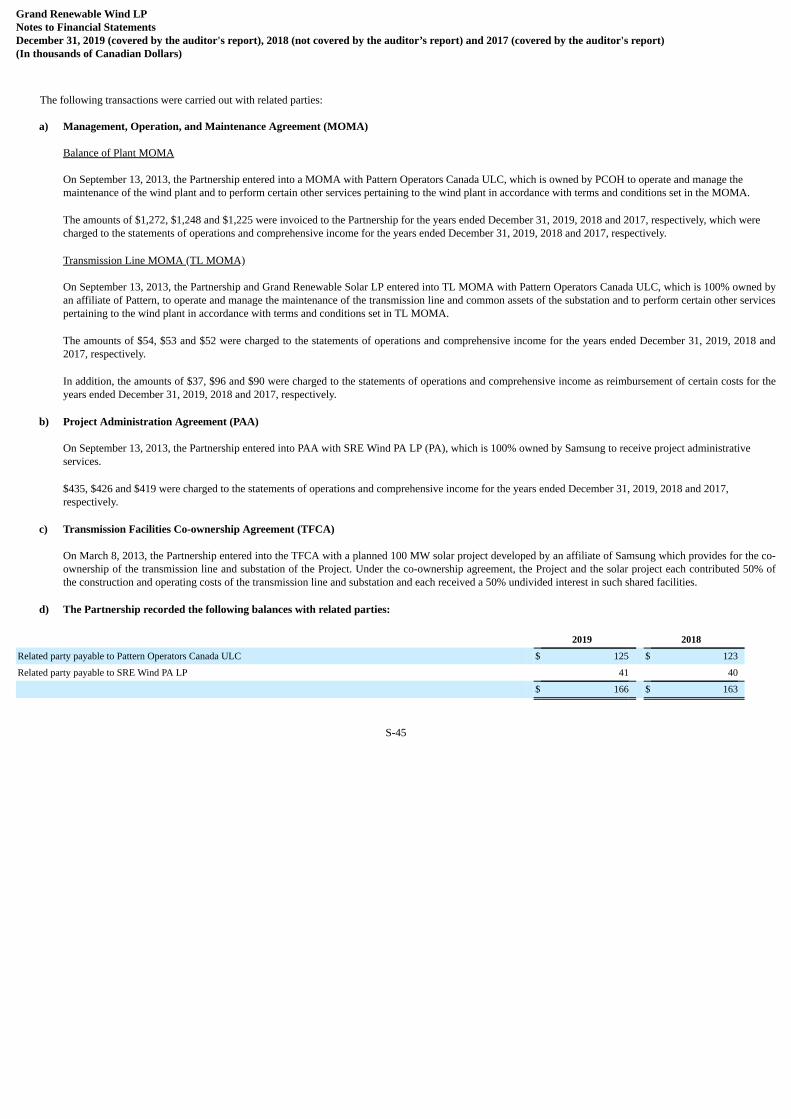
Grand Renewable Wind LPNotes to Financial StatementsDecember 31, 2019 (covered by the auditor's report), 2018 (not covered by the auditor’s report) and 2017 (covered by the auditor's report)(In thousands of Canadian Dollars)
The following transactions were carried out with related parties:
a) Management, Operation, and Maintenance Agreement (MOMA)
Balance of Plant MOMA
On September 13, 2013, the Partnership entered into a MOMA with Pattern Operators Canada ULC, which is owned by PCOH to operate and manage themaintenance of the wind plant and to perform certain other services pertaining to the wind plant in accordance with terms and conditions set in the MOMA.
The amounts of $1,272, $1,248 and $1,225 were invoiced to the Partnership for the years ended December 31, 2019, 2018 and 2017, respectively, which werecharged to the statements of operations and comprehensive income for the years ended December 31, 2019, 2018 and 2017, respectively.
Transmission Line MOMA (TL MOMA)
On September 13, 2013, the Partnership and Grand Renewable Solar LP entered into TL MOMA with Pattern Operators Canada ULC, which is 100% owned byan affiliate of Pattern, to operate and manage the maintenance of the transmission line and common assets of the substation and to perform certain other servicespertaining to the wind plant in accordance with terms and conditions set in TL MOMA.
The amounts of $54, $53 and $52 were charged to the statements of operations and comprehensive income for the years ended December 31, 2019, 2018 and2017, respectively.
In addition, the amounts of $37, $96 and $90 were charged to the statements of operations and comprehensive income as reimbursement of certain costs for theyears ended December 31, 2019, 2018 and 2017, respectively.
b) Project Administration Agreement (PAA)
On September 13, 2013, the Partnership entered into PAA with SRE Wind PA LP (PA), which is 100% owned by Samsung to receive project administrativeservices.
$435, $426 and $419 were charged to the statements of operations and comprehensive income for the years ended December 31, 2019, 2018 and 2017,respectively.
c) Transmission Facilities Co-ownership Agreement (TFCA)
On March 8, 2013, the Partnership entered into the TFCA with a planned 100 MW solar project developed by an affiliate of Samsung which provides for the co-ownership of the transmission line and substation of the Project. Under the co-ownership agreement, the Project and the solar project each contributed 50% ofthe construction and operating costs of the transmission line and substation and each received a 50% undivided interest in such shared facilities.
d) The Partnership recorded the following balances with related parties:
2019 2018
Related party payable to Pattern Operators Canada ULC $ 125 $ 123
Related party payable to SRE Wind PA LP 41 40
$ 166 $ 163
S-45

Grand Renewable Wind LPNotes to Financial StatementsDecember 31, 2019 (covered by the auditor's report), 2018 (not covered by the auditor’s report) and 2017 (covered by the auditor's report)(In thousands of Canadian Dollars)
14Comparative figures
Comparative figures of the partners’ equity on the face of balance sheet and the statement of changes of partners’ capital have been reclassified to conform to thecurrent year presentation. Such reclassifications did not have an impact on net income or cash flows.
December 31, 2018 Prior year presentation Reclassification Current yearpresentation
Partners’ capital $ (8,990) $ 8,990 $ —
Accumulated contribution — 67,990 67,990
Accumulated distribution — (76,980) (76,980)
Accumulated net income 19,930 — 19,930
Accumulated other comprehensive loss (8,712) — (8,712)
S-46
SP Armow Wind Ontario LP
Financial Statementsin accordance with accounting principlesgenerally accepted in the United States ofAmerica (U.S. GAAP)
December 31, 2019(In thousands of Canadian Dollars)
S-47

SP Armow Wind Ontario LP
Contents Page
Independent Auditor’s Report S-49
Financial Statements Balance Sheets S-50Statements of Operations and Comprehensive Income S-51Statements of Changes in Partners’ Equity S-52Statements of Cash Flows S-53Notes to Financial Statements S-54
S-48

Report of Independent Registered Public Accounting Firm
To the Board of Directors and Partners of SP Armow Wind Ontario LP
Opinion on the financial statements
We have audited the accompanying statements of operations and comprehensive income, statement of changes in partners’ equity, and related statement of cash flows of SPArmow Wind Ontario LP (the Partnership) for the year ended December 31, 2017, including the related notes (collectively referred to as the financial statements). In ouropinion, the financial statements present fairly, in all material respects, the results of operations and its cash flows for the year ended December 31, 2017 in conformity withaccounting principles generally accepted in the United States of America (US GAAP).
The accompanying balance sheets of the Partnership as of December 31, 2019 and 2018, and the related statements of operations and comprehensive income, statements ofchanges in partners’ equity, and statements of cash flows for the years then ended are presented for purposes of complying with Rule 3-09 of SEC Regulation S-X;however, Rule 3-09 does not require the 2019 and 2018 financial statements to be audited and they are therefore not covered by this report.
Change in accounting principle
As discussed in note 13 to the financial statements, the Partnership changed the manner in which it presents partners’ equity in the statement of partners’ equity in 2019.Our opinion is not modified with respect to this matter.
Basis for opinion
These financial statements are the responsibility of the Partnership’s management. Our responsibility is to express an opinion on the Partnership’s financial statementsbased on our audit. We are a public accounting firm registered with the Public Company Accounting Oversight Board (United States) (PCAOB) and are required to beindependent with respect to the Partnership in accordance with the U.S. federal securities laws and the applicable rules and regulations of the Securities and ExchangeCommission and the PCAOB.
We conducted our audit of these financial statements in accordance with the standards of the PCAOB. Those standards require that we plan and perform the audit to obtainreasonable assurance about whether the financial statements are free of material misstatement, whether due to error or fraud.
Our audit included performing procedures to assess the risks of material misstatement of the financial statements, whether due to error or fraud, and performing proceduresthat respond to those risks. Such procedures included examining, on a test basis, evidence regarding the amounts and disclosures in the financial statements. Our audit alsoincluded evaluating the accounting principles used and significant estimates made by management, as well as evaluating the overall presentation of the financial statements.
We believe that our audit provides a reasonable basis for our opinion.
/s/ PricewaterhouseCoopers LLP
Chartered Professional Accountants, Licensed Public Accountants
Toronto, Ontario, Canada
February 20, 2018, except for the change in the manner in which the Partnership accounts for restricted cash in the statements of cash flows discussed in note 2 to thefinancial statements, as to which the date is February 15, 2019 and the change in the manner in which the Partnership presents the partners’ equity in the statements ofchanges in partners’ equity discussed in note 13 to the financial statements, as to which the date is February 14, 2020.
We have served as the Partnership’s auditor since 2011.
S-49
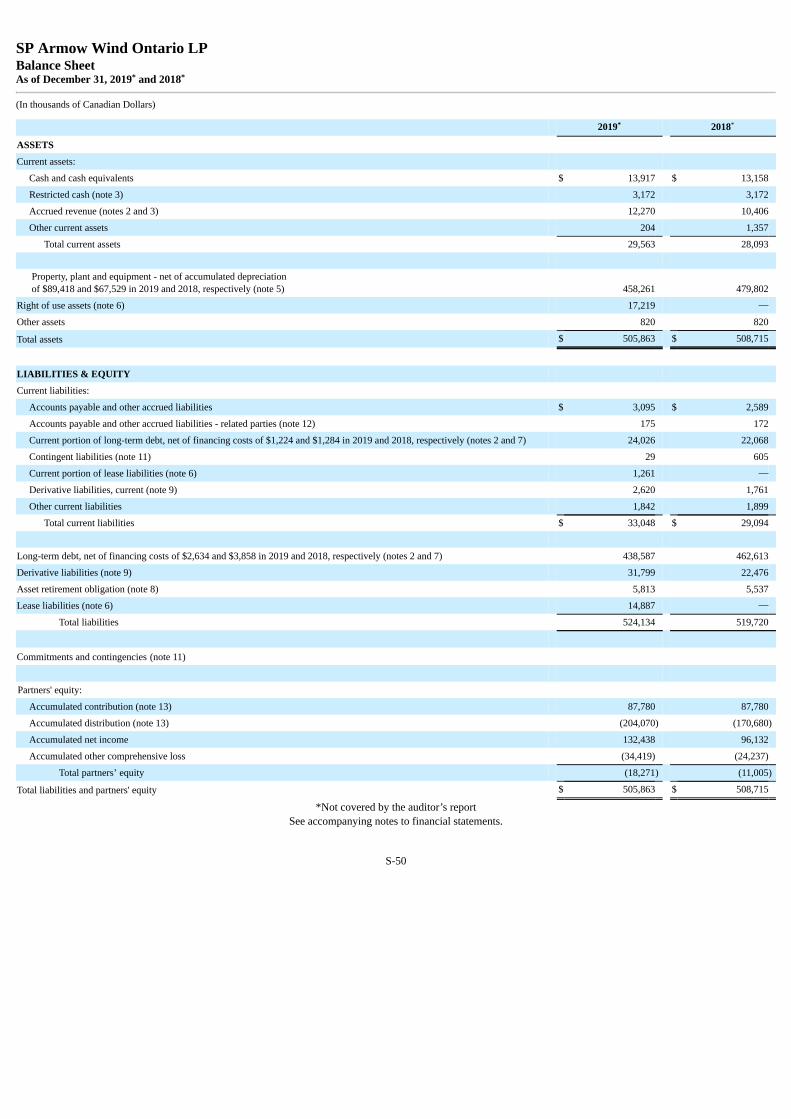
SP Armow Wind Ontario LPBalance SheetAs of December 31, 2019* and 2018*
(In thousands of Canadian Dollars)
2019* 2018*
ASSETS Current assets:
Cash and cash equivalents $ 13,917 $ 13,158
Restricted cash (note 3) 3,172 3,172
Accrued revenue (notes 2 and 3) 12,270 10,406
Other current assets 204 1,357
Total current assets 29,563 28,093
Property, plant and equipment - net of accumulated depreciationof $89,418 and $67,529 in 2019 and 2018, respectively (note 5) 458,261 479,802
Right of use assets (note 6) 17,219 —
Other assets 820 820
Total assets $ 505,863 $ 508,715
LIABILITIES & EQUITY Current liabilities:
Accounts payable and other accrued liabilities $ 3,095 $ 2,589
Accounts payable and other accrued liabilities - related parties (note 12) 175 172
Current portion of long-term debt, net of financing costs of $1,224 and $1,284 in 2019 and 2018, respectively (notes 2 and 7) 24,026 22,068
Contingent liabilities (note 11) 29 605
Current portion of lease liabilities (note 6) 1,261 —
Derivative liabilities, current (note 9) 2,620 1,761
Other current liabilities 1,842 1,899
Total current liabilities $ 33,048 $ 29,094
Long-term debt, net of financing costs of $2,634 and $3,858 in 2019 and 2018, respectively (notes 2 and 7) 438,587 462,613
Derivative liabilities (note 9) 31,799 22,476
Asset retirement obligation (note 8) 5,813 5,537
Lease liabilities (note 6) 14,887 —
Total liabilities 524,134 519,720
Commitments and contingencies (note 11) Partners' equity:
Accumulated contribution (note 13) 87,780 87,780
Accumulated distribution (note 13) (204,070) (170,680)
Accumulated net income 132,438 96,132
Accumulated other comprehensive loss (34,419) (24,237)
Total partners’ equity (18,271) (11,005)
Total liabilities and partners' equity $ 505,863 $ 508,715
*Not covered by the auditor’s reportSee accompanying notes to financial statements.
S-50

SP Armow Wind Ontario LPStatement of Operations and Comprehensive IncomeFor the years ended December 31, 2019*, 2018* and 2017
(In thousands of Canadian Dollars)
2019* 2018* 2017
Revenue (notes 2 and 3): Energy delivered $ 64,691 $ 64,925 $ 55,718
Compensation for forgone energy 25,213 21,968 34,284
Other revenue 1,174 1,183 1,014
Total revenue 91,078 88,076 91,016
Cost of revenue:
Project expenses 7,113 10,229 9,633
Project expenses - related parties (note 12) 1,430 1,403 1,377
Depreciation, amortization and accretion 22,618 22,165 22,153
Total cost of revenue 31,161 33,797 33,163
Gross profit 59,917 54,279 57,853
Operating expenses:
General and administrative 1,145 1,043 1,147
General and administrative - related parties (note 12) 429 420 413
Total operating expenses 1,574 1,463 1,560
Operating income 58,343 52,816 56,293
Other expense:
Interest expense (note 7) (21,590) (22,440) (22,838)
Other expense, net (447) (502) (631)
Total other expense (22,037) (22,942) (23,469)
Net income 36,306 29,874 32,824
Other comprehensive income (loss):
Derivative activity (notes 9 and 10): Effective portion of change in fair value of derivatives
(12,973) (2,359) 9,191
Reclassifications to net income 2,791 4,163 7,680 Total change in effective portion of change in
fair market value of derivatives (10,182) 1,804 16,871
Comprehensive income $ 26,124 $ 31,678 $ 49,695
*Not covered by the auditor’s reportSee accompanying notes to financial statements.
S-51
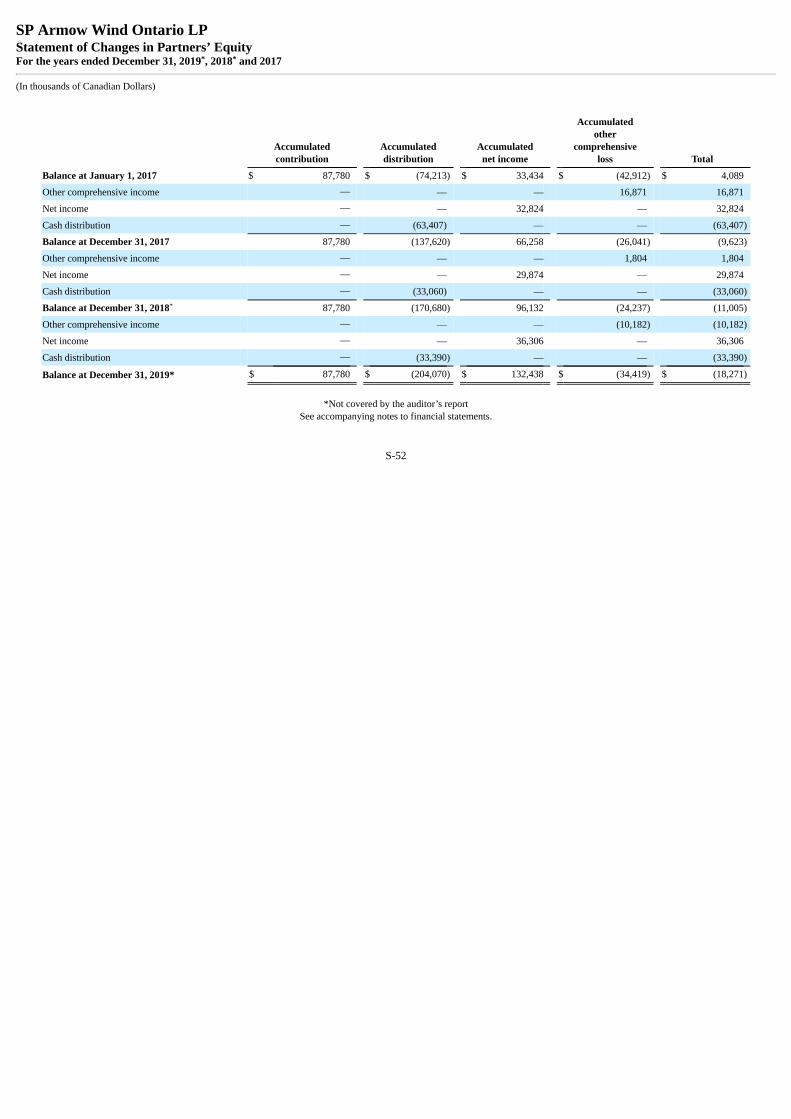
SP Armow Wind Ontario LPStatement of Changes in Partners’ EquityFor the years ended December 31, 2019*, 2018* and 2017
(In thousands of Canadian Dollars)
Accumulatedcontribution
Accumulateddistribution
Accumulatednet income
Accumulatedother
comprehensiveloss Total
Balance at January 1, 2017 $ 87,780 $ (74,213) $ 33,434 $ (42,912) $ 4,089
Other comprehensive income — — — 16,871 16,871
Net income — — 32,824 — 32,824
Cash distribution — (63,407) — — (63,407)
Balance at December 31, 2017 87,780 (137,620) 66,258 (26,041) (9,623)
Other comprehensive income — — — 1,804 1,804
Net income — — 29,874 — 29,874
Cash distribution — (33,060) — — (33,060)
Balance at December 31, 2018* 87,780 (170,680) 96,132 (24,237) (11,005)
Other comprehensive income — — — (10,182) (10,182)
Net income — — 36,306 — 36,306
Cash distribution — (33,390) — — (33,390)
Balance at December 31, 2019* $ 87,780 $ (204,070) $ 132,438 $ (34,419) $ (18,271)
*Not covered by the auditor’s reportSee accompanying notes to financial statements.
S-52
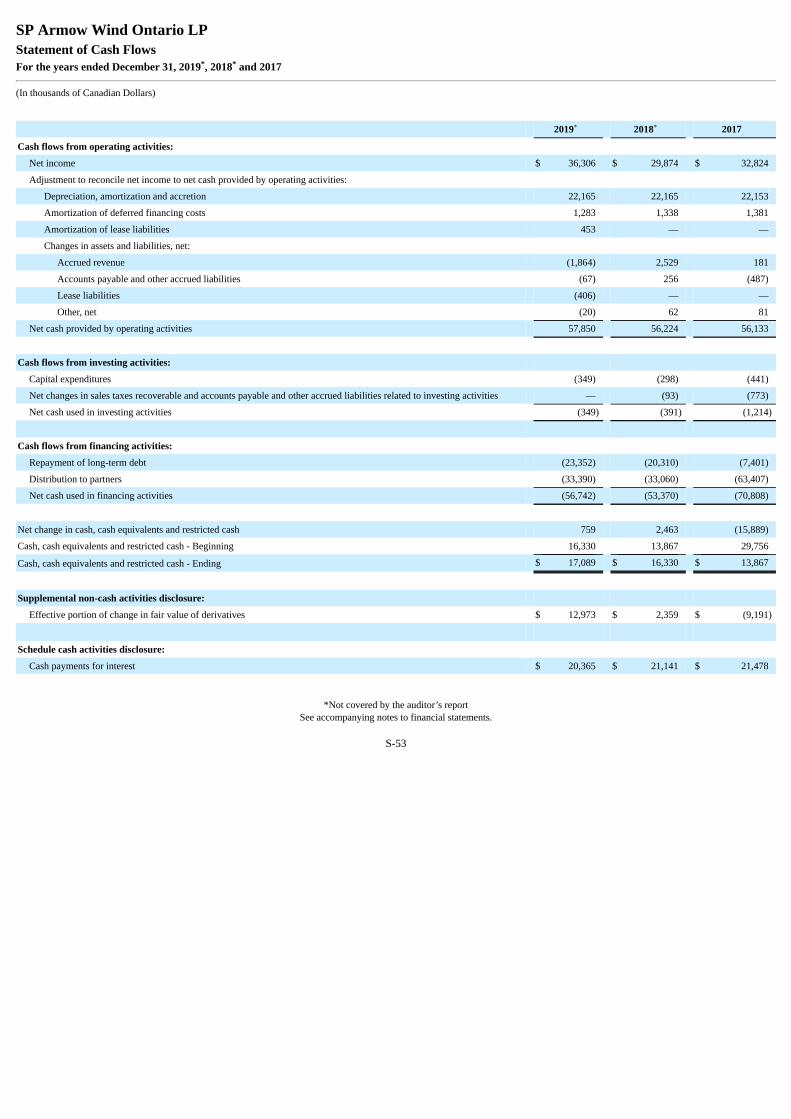
SP Armow Wind Ontario LPStatement of Cash FlowsFor the years ended December 31, 2019*, 2018* and 2017
(In thousands of Canadian Dollars)
2019* 2018* 2017
Cash flows from operating activities: Net income $ 36,306 $ 29,874 $ 32,824
Adjustment to reconcile net income to net cash provided by operating activities: Depreciation, amortization and accretion 22,165 22,165 22,153
Amortization of deferred financing costs 1,283 1,338 1,381
Amortization of lease liabilities 453 — —
Changes in assets and liabilities, net: Accrued revenue (1,864) 2,529 181
Accounts payable and other accrued liabilities (67) 256 (487)
Lease liabilities (406) — —
Other, net (20) 62 81
Net cash provided by operating activities 57,850 56,224 56,133
Cash flows from investing activities:
Capital expenditures (349) (298) (441)
Net changes in sales taxes recoverable and accounts payable and other accrued liabilities related to investing activities — (93) (773)
Net cash used in investing activities (349) (391) (1,214)
Cash flows from financing activities:
Repayment of long-term debt (23,352) (20,310) (7,401)
Distribution to partners (33,390) (33,060) (63,407)
Net cash used in financing activities (56,742) (53,370) (70,808)
Net change in cash, cash equivalents and restricted cash 759 2,463 (15,889)
Cash, cash equivalents and restricted cash - Beginning 16,330 13,867 29,756
Cash, cash equivalents and restricted cash - Ending $ 17,089 $ 16,330 $ 13,867
Supplemental non-cash activities disclosure:
Effective portion of change in fair value of derivatives $ 12,973 $ 2,359 $ (9,191)
Schedule cash activities disclosure: Cash payments for interest $ 20,365 $ 21,141 $ 21,478
*Not covered by the auditor’s reportSee accompanying notes to financial statements.
S-53
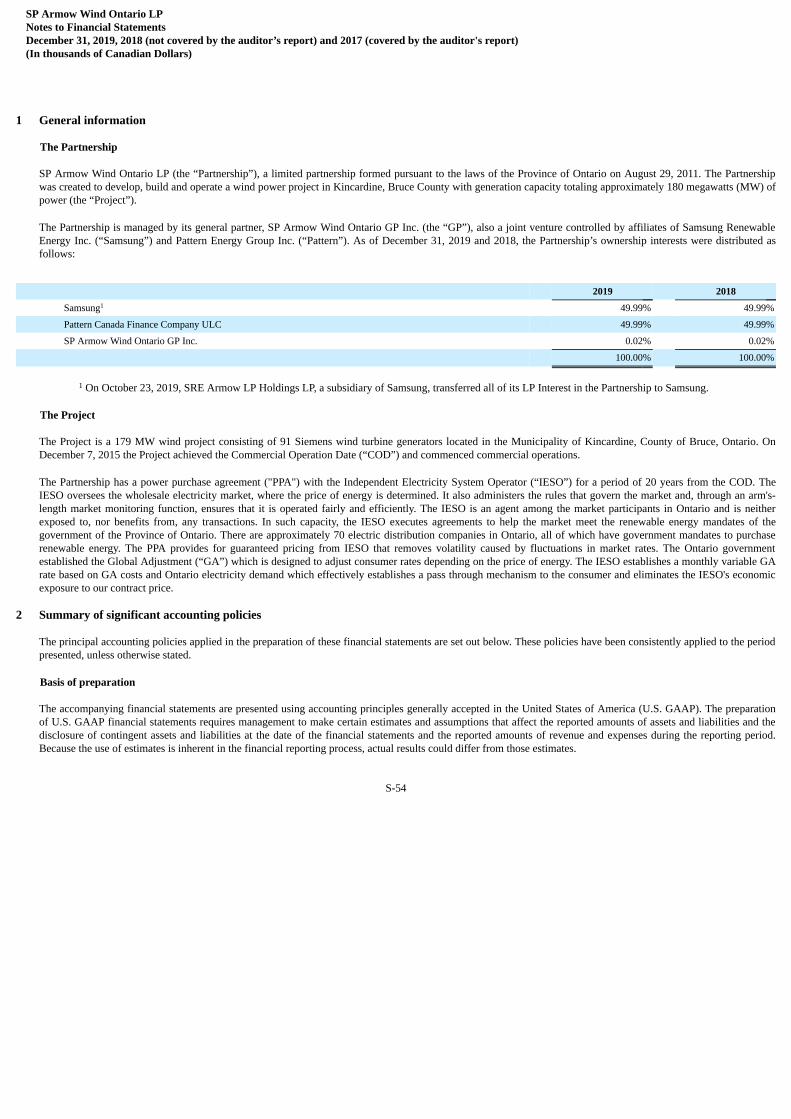
SP Armow Wind Ontario LPNotes to Financial StatementsDecember 31, 2019, 2018 (not covered by the auditor’s report) and 2017 (covered by the auditor's report)(In thousands of Canadian Dollars)
1 General information
The Partnership
SP Armow Wind Ontario LP (the “Partnership”), a limited partnership formed pursuant to the laws of the Province of Ontario on August 29, 2011. The Partnershipwas created to develop, build and operate a wind power project in Kincardine, Bruce County with generation capacity totaling approximately 180 megawatts (MW) ofpower (the “Project”).
The Partnership is managed by its general partner, SP Armow Wind Ontario GP Inc. (the “GP”), also a joint venture controlled by affiliates of Samsung RenewableEnergy Inc. (“Samsung”) and Pattern Energy Group Inc. (“Pattern”). As of December 31, 2019 and 2018, the Partnership’s ownership interests were distributed asfollows:
2019 2018
Samsung1 49.99% 49.99%
Pattern Canada Finance Company ULC 49.99% 49.99%
SP Armow Wind Ontario GP Inc. 0.02% 0.02%
100.00% 100.00%
1 On October 23, 2019, SRE Armow LP Holdings LP, a subsidiary of Samsung, transferred all of its LP Interest in the Partnership to Samsung.
The Project
The Project is a 179 MW wind project consisting of 91 Siemens wind turbine generators located in the Municipality of Kincardine, County of Bruce, Ontario. OnDecember 7, 2015 the Project achieved the Commercial Operation Date (“COD”) and commenced commercial operations.
The Partnership has a power purchase agreement ("PPA") with the Independent Electricity System Operator (“IESO”) for a period of 20 years from the COD. TheIESO oversees the wholesale electricity market, where the price of energy is determined. It also administers the rules that govern the market and, through an arm's-length market monitoring function, ensures that it is operated fairly and efficiently. The IESO is an agent among the market participants in Ontario and is neitherexposed to, nor benefits from, any transactions. In such capacity, the IESO executes agreements to help the market meet the renewable energy mandates of thegovernment of the Province of Ontario. There are approximately 70 electric distribution companies in Ontario, all of which have government mandates to purchaserenewable energy. The PPA provides for guaranteed pricing from IESO that removes volatility caused by fluctuations in market rates. The Ontario governmentestablished the Global Adjustment (“GA”) which is designed to adjust consumer rates depending on the price of energy. The IESO establishes a monthly variable GArate based on GA costs and Ontario electricity demand which effectively establishes a pass through mechanism to the consumer and eliminates the IESO's economicexposure to our contract price.
2 Summary of significant accounting policies
The principal accounting policies applied in the preparation of these financial statements are set out below. These policies have been consistently applied to the periodpresented, unless otherwise stated.
Basis of preparation
The accompanying financial statements are presented using accounting principles generally accepted in the United States of America (U.S. GAAP). The preparationof U.S. GAAP financial statements requires management to make certain estimates and assumptions that affect the reported amounts of assets and liabilities and thedisclosure of contingent assets and liabilities at the date of the financial statements and the reported amounts of revenue and expenses during the reporting period.Because the use of estimates is inherent in the financial reporting process, actual results could differ from those estimates.
S-54

SP Armow Wind Ontario LPNotes to Financial StatementsDecember 31, 2019, 2018 (not covered by the auditor’s report) and 2017 (covered by the auditor's report)(In thousands of Canadian Dollars)
In recording transactions and balances resulting from business operations, the Partnership uses estimates based on the best information available. Estimates are usedfor such items as accrued revenue, asset retirement obligation, valuation of derivative contracts and contingencies.
These financial statements do not include assets, liabilities, revenue and expenses of the GP and limited partners. The financial statements of the Partnership reflect noprovision or liability for income taxes because profits and losses of the Partnership are allocated to the partners and are included in the income tax returns of partners.Income and losses for tax purposes may differ from the financial statement amounts and the partners’ equity reflected in the financial statements does not necessarilyreflect their tax basis.
Functional and presentation currency
Items included in the financial statements of the Partnership are measured using the currency of the primary economic environment in which the Partnership operates(the functional currency). The financial statements are presented in Canadian dollars, which is the Partnership’s functional and presentation currency.
Fair value of financial instruments
ASC 820, Fair Value Measurements, defines fair value as the price at which an asset could be exchanged or a liability transferred in an orderly transaction betweenknowledgeable, willing parties in the principal or most advantageous market for the asset or liability. Where available, fair value is based on observable market pricesor derived from such prices. Where observable prices or inputs are not available, valuation models are applied.
These valuation techniques involve some level of management estimation and judgment, the degree of which is dependent on the price transparency for theinstruments or market and the instruments’ complexity.
Cash and cash equivalents
Cash and cash equivalents include cash on hand, deposits held on call with banks and other short-term highly liquid investments with original maturities of threemonths or less.
Restricted cash
Restricted cash consists of cash reserves required under the Partnership’s loan agreements and security deposits required to collateralize commercial bank letter ofcredit facilities related primarily to a power purchase agreement (PPA) and road use agreements (note 3).
S-55
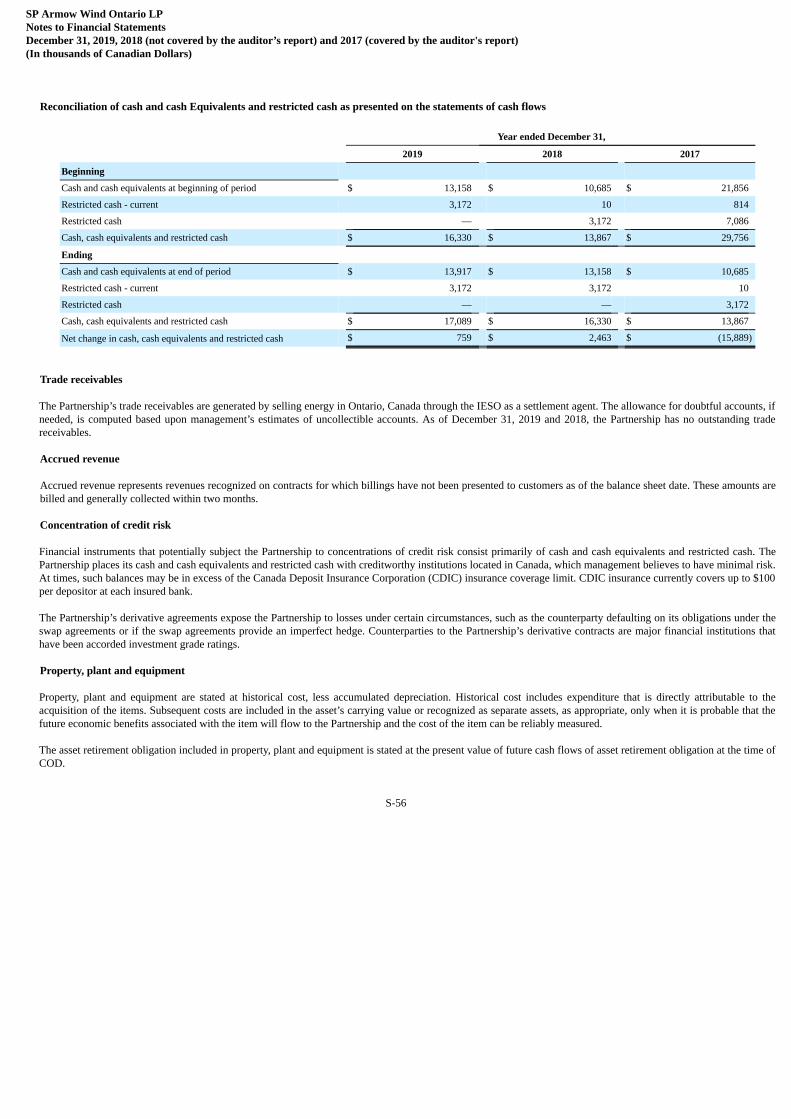
SP Armow Wind Ontario LPNotes to Financial StatementsDecember 31, 2019, 2018 (not covered by the auditor’s report) and 2017 (covered by the auditor's report)(In thousands of Canadian Dollars)
Reconciliation of cash and cash Equivalents and restricted cash as presented on the statements of cash flows
Year ended December 31,
2019 2018 2017
Beginning Cash and cash equivalents at beginning of period $ 13,158 $ 10,685 $ 21,856
Restricted cash - current 3,172 10 814
Restricted cash — 3,172 7,086
Cash, cash equivalents and restricted cash $ 16,330 $ 13,867 $ 29,756
Ending Cash and cash equivalents at end of period $ 13,917 $ 13,158 $ 10,685
Restricted cash - current 3,172 3,172 10
Restricted cash — — 3,172
Cash, cash equivalents and restricted cash $ 17,089 $ 16,330 $ 13,867
Net change in cash, cash equivalents and restricted cash $ 759 $ 2,463 $ (15,889)
Trade receivables
The Partnership’s trade receivables are generated by selling energy in Ontario, Canada through the IESO as a settlement agent. The allowance for doubtful accounts, ifneeded, is computed based upon management’s estimates of uncollectible accounts. As of December 31, 2019 and 2018, the Partnership has no outstanding tradereceivables.
Accrued revenue
Accrued revenue represents revenues recognized on contracts for which billings have not been presented to customers as of the balance sheet date. These amounts arebilled and generally collected within two months.
Concentration of credit risk
Financial instruments that potentially subject the Partnership to concentrations of credit risk consist primarily of cash and cash equivalents and restricted cash. ThePartnership places its cash and cash equivalents and restricted cash with creditworthy institutions located in Canada, which management believes to have minimal risk.At times, such balances may be in excess of the Canada Deposit Insurance Corporation (CDIC) insurance coverage limit. CDIC insurance currently covers up to $100per depositor at each insured bank.
The Partnership’s derivative agreements expose the Partnership to losses under certain circumstances, such as the counterparty defaulting on its obligations under theswap agreements or if the swap agreements provide an imperfect hedge. Counterparties to the Partnership’s derivative contracts are major financial institutions thathave been accorded investment grade ratings.
Property, plant and equipment
Property, plant and equipment are stated at historical cost, less accumulated depreciation. Historical cost includes expenditure that is directly attributable to theacquisition of the items. Subsequent costs are included in the asset’s carrying value or recognized as separate assets, as appropriate, only when it is probable that thefuture economic benefits associated with the item will flow to the Partnership and the cost of the item can be reliably measured.
The asset retirement obligation included in property, plant and equipment is stated at the present value of future cash flows of asset retirement obligation at the time ofCOD.
S-56
SP Armow Wind Ontario LPNotes to Financial StatementsDecember 31, 2019, 2018 (not covered by the auditor’s report) and 2017 (covered by the auditor's report)(In thousands of Canadian Dollars)
Depreciation on property, plant and equipment is calculated using the straight-line method to allocate their cost to their residual values over their estimated usefullives. The power plant is depreciated over 25 years and the remaining assets are depreciated over 5 years. The assets’ residual values and useful lives are reviewed andadjusted, if appropriate, at the end of each reporting period. Repair and maintenance costs are expensed as incurred.
Lease
The Partnership determines if an arrangement is a lease at contract inception by evaluating if the contract conveys the right to control the use of identified assetsduring the period of use. A right of use (“ROU”) asset represents the Partnership’s right to use an identified asset for the lease term and lease liability represents thePartnership’s obligation to make payments as set forth in the lease agreement. ROU assets and lease liabilities are included on the Partnership’s balance sheetsbeginning January 1, 2019 and are recognized based on the present value of the future lease payments at the lease commencement date over the expected lease termwhich includes options to extend or terminate the lease when it is reasonably certain those options will be exercised. We have elected to include lease and non-leasecomponents in determining our lease liability for all land lease contracts. The interest rate used to determine the present value of the future lease payments is thePartnership’s incremental borrowing rate at lease inception, because the interest rate implicit in the lease is generally not readily determinable. A ROU asset initiallyequals the lease liabilities, adjusted for any lease payments made prior to lease commencement and any lease incentives. All leases are recorded on the balance sheetexcept for leases with an initial term of less than 12 months and variable lease payment based on the generated electricity revenue. All of the Partnership’s leases areoperating leases. Operating lease expense is generally recognized on a straight-line basis over the remaining useful life as of January 1, 2019 and is recorded in projectexpenses in the statements of operations and comprehensive income.
The variable lease payments are recorded in project expenses in the statement of operations and comprehensive income when the generated electricity revenue isearned.
Impairment of long-lived assets
The Partnership periodically evaluates whether events have occurred that would require revision of the remaining useful life of equipment and improvements or renderthem not recoverable. If such circumstances arise, the Partnership uses an estimate of the undiscounted value of expected future operating cash flows to determinewhether the long-lived assets are impaired. If the aggregate undiscounted cash flows are less than the carrying amount of the assets, the resulting impairment charge tobe recorded is calculated based on the excess of the carrying value of the assets over the fair value of such assets, with the fair value determined based on an estimateof discounted future cash flows. Through December 31, 2019, no impairment charges were recorded.
Deferred financing costs
Financing costs incurred in connection with obtaining construction and term financing, which include direct financing, legal and other upfront costs of borrowing, arecapitalized and recorded as a reduction to long-term debt and amortized over the lives of the respective loans using the effective-interest method. Amortization ofdeferred financing costs is capitalized during construction or expensed following COD.
Derivatives
The Partnership recognizes its derivative instruments as either assets or liabilities in the balance sheets at fair value. The accounting for changes in the fair value (i.e.,gains or losses) of a derivative instrument depends on whether it qualifies and has been designated as part of a hedging relationship and, further, on the type ofhedging relationship.
For derivative instruments that are designated and qualify as a cash flow hedge (i.e., hedging the exposure to variability in expected future cash flows that areattributable to a particular risk), the effective portion of the gain or loss on the derivative instrument is reported as a component of other comprehensive income or loss(OCI or OCL). Changes in the fair value of these derivatives are subsequently reclassified into earnings in the period the hedged transaction affects earnings. Theineffective portion of changes in fair value is recorded as a component of net income in the statements of operations and comprehensive income.
For undesignated derivative instruments, their change in fair value is reported as a component of net income in the statements of operations and comprehensiveincome.
S-57
SP Armow Wind Ontario LPNotes to Financial StatementsDecember 31, 2019, 2018 (not covered by the auditor’s report) and 2017 (covered by the auditor's report)(In thousands of Canadian Dollars)
The Partnership enters into derivative transactions for the purpose of managing exposure to fluctuations in interest rates, such as interest rate swaps. Interest rateswaps are instruments used to fix the interest rate on variable interest rate debt.
Accounts payable and other accrued liabilities
Trade payables are obligations to pay for goods or services that have been acquired in the ordinary course of business from suppliers. Payables with payment termsextended beyond one year from the balance sheet dates are presented as non-current liabilities.
Contingent liabilities
Contingent liabilities are recognized when: the Partnership has a present legal obligation as a result of past events; it is probable that an outflow of resources will berequired to settle the obligation; and the amount can be reasonably estimated.
Asset retirement obligation
The Partnership records an asset retirement obligation for the estimated costs of decommissioning turbines, removing above-ground installations and restoring sites, atthe time when a contractual decommissioning obligation materializes. The Partnership records accretion expense, which represents the increase in the asset retirementobligation, over the remaining life of the associated wind project. Accretion expense is recorded as cost of revenue in the statements of operations and comprehensiveincome using accretion rates based on a credit adjusted risk free interest rate of 4.989%.
Revenue recognition
Beginning in 2019, the Partnership adopted ASC 606 Revenue Recognition (ASC 606). See Note 3, Revenue, regarding the Partnership’s revenue recognition policy.
Revenue is recognized based upon the amount of electricity delivered or curtailed at rates specified under the contracts, assuming all other revenue recognition criteriaare met. When curtailment revenue is earned it is recorded as compensation for forgone revenue. The Partnership evaluates its PPA to determine whether it is insubstance a lease or derivative and, if applicable, recognizes revenue pursuant to ASC 842 Leases and ASC 815 Derivatives and Hedging, respectively. As ofDecember 31, 2019, the PPA was not considered a lease or a derivative instrument, as multiple market participants purchase the energy at market-based prices withIESO working as a settlement agent. As a result, revenue (including any revenue from the price guaranteed by IESO), is recognized according to the right to invoicepractical expedient as prescribed by ASC 606.
The Partnership recognizes revenue for warranty settlements and liquidated damages from a turbine manufacturer in other revenue upon resolution of outstandingcontingencies. Any cash receipts for amounts subject to future adjustment or repayment are deferred in other liabilities until the final settlement amount is consideredfixed and determinable.
Cost of revenue
The Partnership’s cost of revenue is comprised of direct costs of operating and maintaining its project facilities, including labor, turbine service arrangements,metering service and shadow settlement, environmental fee, land lease royalties, property tax, insurance, depreciation, amortization and accretion.
Comprehensive income
Comprehensive income consists of net income and other comprehensive loss. Other comprehensive loss is included in accumulated other comprehensive loss in theaccompanying statements of changes in partners’ equity.
Recently adopted accounting standard
In November 2016, the FASB issued ASU 2016-18, Statement of Cash Flows (Topic 230): Restricted Cash (ASU 2016-18), which requires that a statement of cashflows explain the change during the period in the total of cash, cash equivalents, and amounts generally described as restricted cash or restricted cash equivalents. As aresult, amounts generally described as restricted cash and restricted cash equivalents should be included with cash and cash equivalents when reconciling thebeginning-of-period and end-
S-58
SP Armow Wind Ontario LPNotes to Financial StatementsDecember 31, 2019, 2018 (not covered by the auditor’s report) and 2017 (covered by the auditor's report)(In thousands of Canadian Dollars)
of-period total amounts shown on the statement of cash flows. The amendments do not provide a definition of restricted cash or restricted cash equivalents. TheCompany elected to early adopt the provisions of ASU 2016-18 as of December 31, 2018 and has restated its statements of cash flows for the years ended December31, 2017 and 2016 to reflect amounts described as restricted cash and restricted cash equivalents included with cash and cash equivalents in the reconciliation ofbeginning of period and end of period total amounts shown on the statements of cash flows. Consequently, transfers between cash and restricted cash will not bepresented as a separate line item in the operating, investing or financing sections of the cash flow statement. A reconciliation of cash and cash equivalents andrestricted cash as presented on the balance sheets to the statements of cash flows is included in the significant accounting policies above.
In May 2014, the FASB issued ASU 2014-09, Revenue from Contracts with Customers (Topic 606), which supersedes the revenue recognition requirements in Topic605, Revenue Recognition (Topic 605) and requires entities to recognize revenue when control of the promised goods or services is transferred to customers at anamount that reflects the consideration to which the entity expects to be entitled to in exchange for those goods or services. The Partnership adopted ASU 2014-09 as ofJanuary 1, 2019 using the modified retrospective transition method. The adoption did not have a material impact on the Partnership’s consolidated financialstatements, other than additional disclosures. See Note 3, Revenue for further details.
In February 2016, the FASB issued ASU 2016-12, Leases (ASC 842), as amended by subsequent standards updates, which requires lessees to recognize ROU assetsand lease liabilities, for all leases, with the exception of short-term leases, at the commencement date of each lease. Under the new guidance, lessor accounting islargely unchanged. ASC 842 simplifies the accounting for sale and leaseback transactions primarily because lessees must recognize lease assets and liabilities.
The Partnership has adopted ASC 842 retrospectively from January 1, 2019, but has not restated comparatives for the 2018 reporting period, as permitted under thespecific transitional provision in the standard. The reclassifications and the adjustments arising from the new leasing rules are therefore recognized in the openingbalance sheet on January 1, 2019.
Recent accounting pronouncements
In August 2018, the FASB issued ASU 2018-13, Changes to the Disclosure Requirements for Fair Value Measurement (ASU 2018-13), which amends changes inunrealized gains and losses, the range and weighted average of significant unobservable inputs used to develop Level 3 fair value measurements, and the narrativedescription of measurement uncertainty which should be applied prospectively for only the most recent interim or annual period presented in the initial fiscal year ofadoption. ASU 2018-13 is effective for annual periods beginning after December 15, 2019, including interim periods within those periods. Early application ispermitted. The Partnership is currently assessing the impact of changes to the disclosure requirements for fair value measurement.
In June 2016, the FASB issued ASU 2016-13, Financial Instruments - Credit Losses (Topic 326): Measurement of Credit Losses on Financial Instruments (ASU 2016-13), which requires the measurement of all expected credit losses for financial assets including trade receivables held at the reporting date based on historicalexperience, current conditions, and reasonable and supportable forecasts. In November 2018, the FASB issued ASU 2018-19, Codification Improvements to Topic326, Financial Instruments - Credit Losses, for the purposes of clarifying certain aspects of ASU 2016-13. In April 2019, the FASB issued ASU 2019-04, CodificationImprovements to Topic 326, Financial Instruments - Credit Losses, Topic 815, Derivatives and Hedging, and Topic 825, Financial Instruments (ASU 2019-04), whichclarifies the treatment of certain credit losses. In May 2019, the FASB issued ASU 2019-05, Financial Instruments - Credit Losses (Topic 326): Targeted TransitionRelief (ASU 2019-05), which provides an option to irrevocably elect to measure certain individual financial assets at fair value instead of amortized cost. InNovember 2019, the FASB issued ASU 2019-11, Codification Improvements to Topic 326, Financial Instruments - Credit Losses (ASU 2019-11), which providesguidance around how to report expected recoveries. ASU 2016-13, as amended, is effective for fiscal years, and interim periods within those fiscal years, beginningafter December 15, 2020. The adoption of ASU 2016-13 is not expected to have a material impact on the Partnership’s financial statements and related disclosures.
In October 2018, the FASB issued ASU 2018-16, Derivatives and Hedging (Topic ASC 815): Inclusion of the Secured Overnight Financing Rate (SOFR) OvernightIndex Swap (OIS) Rate as a Benchmark Interest Rate for Hedge Accounting Purposes (ASU 2018-16), which expands the list of U.S. benchmark interest ratespermitted in the application of hedge accounting. Because of concerns about the sustainability of LIBOR, the Federal Reserve Board and the Federal Reserve Bank ofNew York (Fed) initiated an effort to introduce an alternative reference rate in the United States. The SOFR is calculated by the Fed based on the interest rates bankscharge one another in the overnight market, typically called repurchase agreements, and because it is based on transactions in the open market, it is more reflective ofmarket conditions than LIBOR, which relies on judgment. The provisions of ASU 2017-12
S-59
SP Armow Wind Ontario LPNotes to Financial StatementsDecember 31, 2019, 2018 (not covered by the auditor’s report) and 2017 (covered by the auditor's report)(In thousands of Canadian Dollars)
(discussed below) and ASU 2018-16 are effective for fiscal years beginning after December 15, 2019, with early adoption permitted. Initial adoption of ASU 2017-12is required to be reported using a modified retrospective approach, with the exception of the presentation and disclosure requirements which are required to be appliedprospectively. The Partnership is currently in the process of determining the impact of adoption of the provisions of ASU 2017-12 and ASU 2018-16.
In August 2017, the FASB issued ASU 2017-12, Targeted Improvements to Accounting for Hedging Activities (ASU 2017-12), which amends the presentation anddisclosure requirements and changes how companies assess effectiveness. The amendments are intended to more closely align hedge accounting with companies’ riskmanagement strategies, simplify the application of hedge accounting, and increase transparency as to the scope and results of hedging programs. ASU 2017-12 iseffective for annual periods beginning after December 15, 2019. ASU 2017-12 requires a modified retrospective transition method in which the Partnership willrecognize the cumulative effect of the change on the opening balance of each affected component of equity in the balance sheet as of the date of adoption. While thePartnership continues to assess all potential impacts of the standard, the adoption is not expected to have a material impact on its future consolidated financialstatements.
3 Revenue
On January 1, 2019, the Partnership adopted the new accounting standard ASC 606, Revenue from Contracts with Customers, and all the related amendments (Topic606) and applied Topic 606 to its PPA contract previously accounted for under Topic 605, using the modified retrospective method. Results of the reporting periodbeginning January 1, 2019 are presented under Topic 606, while prior period amounts are not adjusted and continue to be reported in accordance with the Partnership’shistoric accounting under Topic 605.
The Partnership did not record any adjustment to the opening retained earnings as of January 1, 2019 as a result of Topic 606. Additionally, the adoption of Topic 606did not materially change the presentation of revenue.
Revenue Recognition
Revenue from contracts with customers are recognized when control of promised goods and services is transferred to customers, in an amount that reflects theconsideration the Partnership expects to be entitled to in exchange for those goods or services.
The following table presents the Partnership’s total revenue recognized and, for contracts with customers, disaggregated by revenue sources:
2019 2018 2017
Revenue from contracts with customers Electricity sales
Energy delivered $ 64,691 $ 64,925 $ 55,718
Compensation for forgone energy 25,213 21,968 34,284
Electricity sales from contracts with customers 89,904 86,893 90,002
Other revenue 1,174 1,183 1,014
Total revenue $ 91,078 $ 88,076 $ 91,016
Electricity Sales
The Partnership generates revenues primarily by delivering electricity to a customer under PPA and market participants. The revenues are determined by the price ofthe electricity under the PPA multiplied by the amount of electricity that the Partnership delivers.
The Partnership transfers control of the electricity over time and the customer simultaneously receives and consumes the benefits provided by the Partnership'sperformance as it performs. Accordingly, the Partnership has concluded that the sale of electricity over the term of the agreement represents a series of distinct goodsthat are substantially the same and that have the same pattern of transfer to the customer. Each distinct transfer of electricity in MWh that the Partnership promises totransfer to the customer
S-60
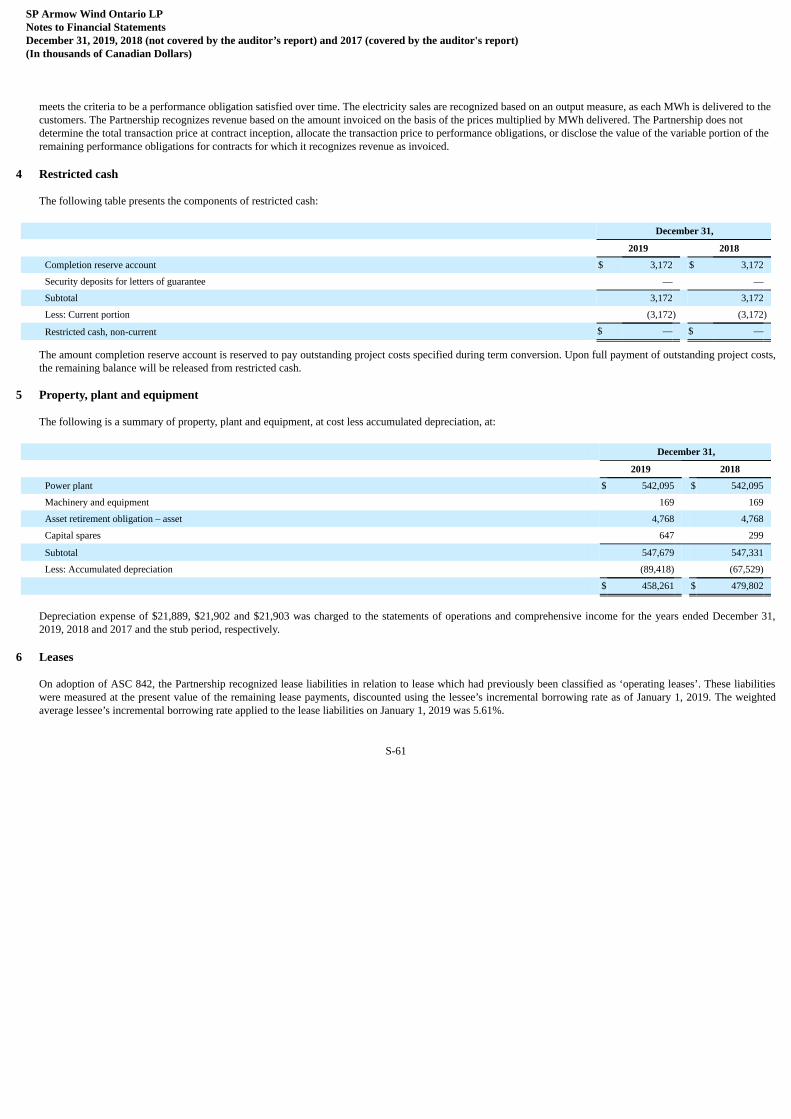
SP Armow Wind Ontario LPNotes to Financial StatementsDecember 31, 2019, 2018 (not covered by the auditor’s report) and 2017 (covered by the auditor's report)(In thousands of Canadian Dollars)
meets the criteria to be a performance obligation satisfied over time. The electricity sales are recognized based on an output measure, as each MWh is delivered to thecustomers. The Partnership recognizes revenue based on the amount invoiced on the basis of the prices multiplied by MWh delivered. The Partnership does notdetermine the total transaction price at contract inception, allocate the transaction price to performance obligations, or disclose the value of the variable portion of theremaining performance obligations for contracts for which it recognizes revenue as invoiced.
4 Restricted cash
The following table presents the components of restricted cash:
December 31,
2019 2018
Completion reserve account $ 3,172 $ 3,172
Security deposits for letters of guarantee — —
Subtotal 3,172 3,172
Less: Current portion (3,172) (3,172)
Restricted cash, non-current $ — $ —
The amount completion reserve account is reserved to pay outstanding project costs specified during term conversion. Upon full payment of outstanding project costs,the remaining balance will be released from restricted cash.
5 Property, plant and equipment
The following is a summary of property, plant and equipment, at cost less accumulated depreciation, at:
December 31,
2019 2018
Power plant $ 542,095 $ 542,095
Machinery and equipment 169 169
Asset retirement obligation – asset 4,768 4,768
Capital spares 647 299
Subtotal 547,679 547,331
Less: Accumulated depreciation (89,418) (67,529)
$ 458,261 $ 479,802
Depreciation expense of $21,889, $21,902 and $21,903 was charged to the statements of operations and comprehensive income for the years ended December 31,2019, 2018 and 2017 and the stub period, respectively.
6 Leases
On adoption of ASC 842, the Partnership recognized lease liabilities in relation to lease which had previously been classified as ‘operating leases’. These liabilitieswere measured at the present value of the remaining lease payments, discounted using the lessee’s incremental borrowing rate as of January 1, 2019. The weightedaverage lessee’s incremental borrowing rate applied to the lease liabilities on January 1, 2019 was 5.61%.
S-61

SP Armow Wind Ontario LPNotes to Financial StatementsDecember 31, 2019, 2018 (not covered by the auditor’s report) and 2017 (covered by the auditor's report)(In thousands of Canadian Dollars)
January 1, 2019
Operating lease commitments disclosed as at December 31, 2018 $ 44,597
Add: lease commitments period adjustment 4,677
Less: variable lease payment recognized as expenses when revenue is earned (20,148)
Less: short term leases recognized on a straight-line basis as expenses —
Undiscounted future lease liabilities 29,126
Imputed interest using the incremental borrowing rate of at the date of initial application (12,572)
Lease liabilities recognized as at January 1, 2019 16,554
Of which are: Current lease liabilities 1,323
Non-current lease liabilities 15,231
$ 16,554
The ROU assets were measured at the amount equal to the lease liabilities, adjusted by the amount of any prepaid or accrued lease payments relating to that leaserecognized in the balance sheet as at December 31, 2018. There were no onerous lease contracts that would have required an adjustment to the right of use assets at thedate of initial application.
The recognized ROU assets related to the following types of assets:
December 31, 2019 January 1, 2019
Land $ 17,219 $ 17,672
$ 17,219 $ 17,672
In applying ASC 842 for the first time, the Partnership has used the following practical expedients permitted by the standards:
• the use of single discount rate to a portfolio of leases with reasonably similar characteristics
• the exclusion of initial direct costs for the measurement of the right of use asset at the date of initial application
The change in accounting policy affected the following items in the statement of financial position on January 1, 2019:
• right of use assets: increased by $17,672
• prepaid expenses: decreased by $1,118
• lease liabilities: increased by $16,554
The Partnership has lease agreements with a group of participating landowners, on which the Project facilities were built. Lease agreements were negotiated on groupbasis and therefore contain similar terms and conditions including a lease term for period from 20 years to 40 years with an extension option, and right to terminatewithout penalty.
Until the 2018 financial year, leases were all classified as operating leases and the payments made were charged to profit or loss on the straight-line basis over theperiod of the lease.
From January 1, 2019, leases are recognized as ROU assets and corresponding lease liabilities at the date at which the lease asset is available for use by the Project.Lease expense is generally recognized on a straight-line basis over the lease term and is recorded in project expense in the statements of operation.
Lease liabilities include the net present value of the following lease payments:
S-62
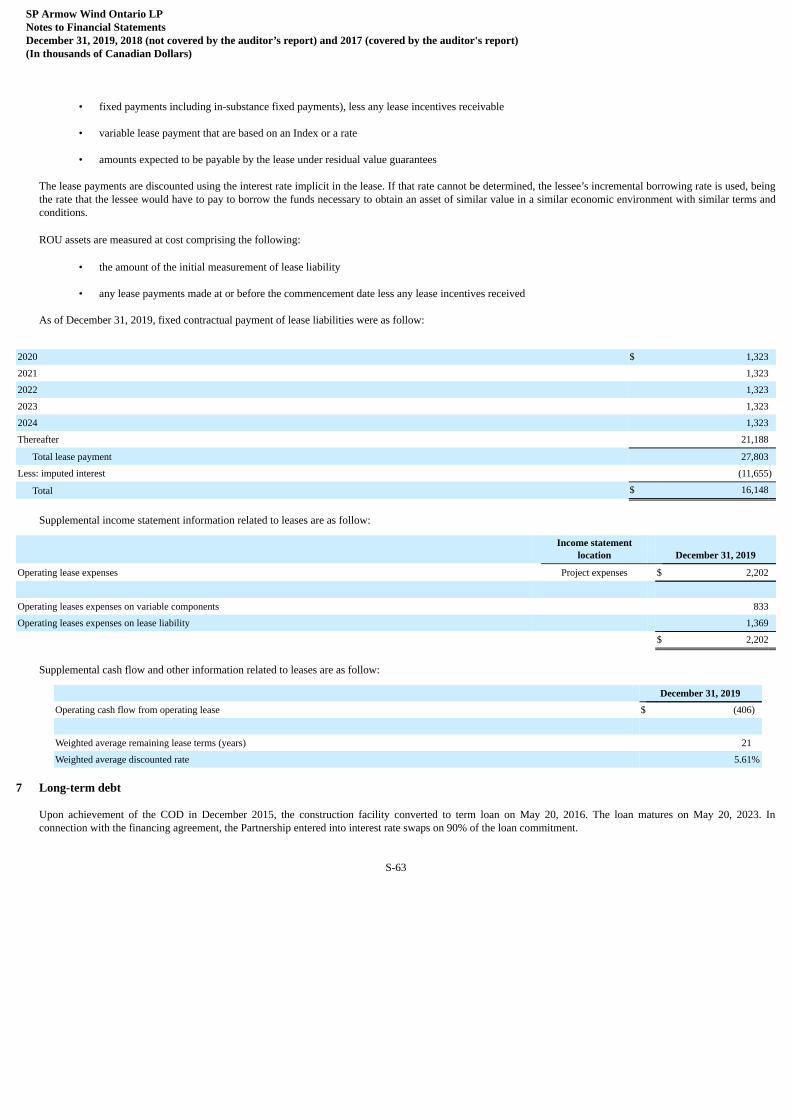
SP Armow Wind Ontario LPNotes to Financial StatementsDecember 31, 2019, 2018 (not covered by the auditor’s report) and 2017 (covered by the auditor's report)(In thousands of Canadian Dollars)
• fixed payments including in-substance fixed payments), less any lease incentives receivable
• variable lease payment that are based on an Index or a rate
• amounts expected to be payable by the lease under residual value guarantees
The lease payments are discounted using the interest rate implicit in the lease. If that rate cannot be determined, the lessee’s incremental borrowing rate is used, beingthe rate that the lessee would have to pay to borrow the funds necessary to obtain an asset of similar value in a similar economic environment with similar terms andconditions.
ROU assets are measured at cost comprising the following:
• the amount of the initial measurement of lease liability
• any lease payments made at or before the commencement date less any lease incentives received
As of December 31, 2019, fixed contractual payment of lease liabilities were as follow:
2020 $ 1,323
2021 1,323
2022 1,323
2023 1,323
2024 1,323
Thereafter 21,188
Total lease payment 27,803
Less: imputed interest (11,655)
Total $ 16,148
Supplemental income statement information related to leases are as follow:
Income statement
location December 31, 2019
Operating lease expenses Project expenses $ 2,202
Operating leases expenses on variable components 833
Operating leases expenses on lease liability 1,369
$ 2,202
Supplemental cash flow and other information related to leases are as follow:
December 31, 2019
Operating cash flow from operating lease $ (406)
Weighted average remaining lease terms (years) 21
Weighted average discounted rate 5.61%
7 Long-term debt
Upon achievement of the COD in December 2015, the construction facility converted to term loan on May 20, 2016. The loan matures on May 20, 2023. Inconnection with the financing agreement, the Partnership entered into interest rate swaps on 90% of the loan commitment.
S-63
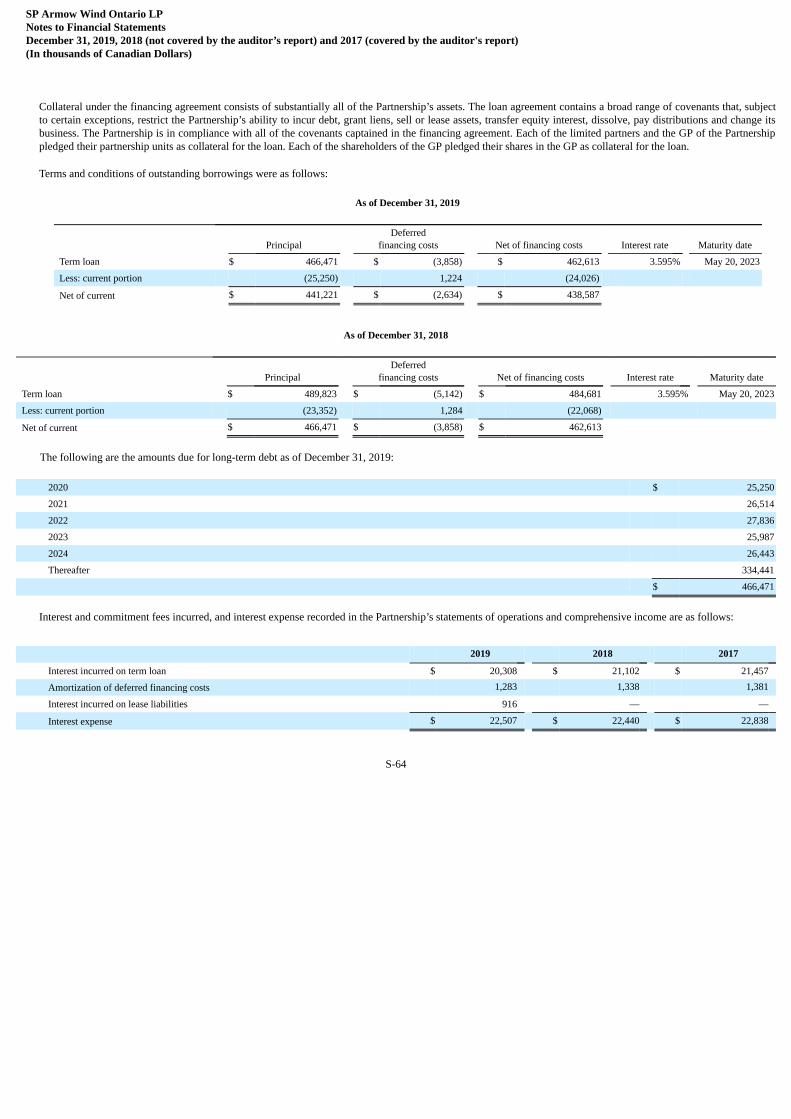
SP Armow Wind Ontario LPNotes to Financial StatementsDecember 31, 2019, 2018 (not covered by the auditor’s report) and 2017 (covered by the auditor's report)(In thousands of Canadian Dollars)
Collateral under the financing agreement consists of substantially all of the Partnership’s assets. The loan agreement contains a broad range of covenants that, subjectto certain exceptions, restrict the Partnership’s ability to incur debt, grant liens, sell or lease assets, transfer equity interest, dissolve, pay distributions and change itsbusiness. The Partnership is in compliance with all of the covenants captained in the financing agreement. Each of the limited partners and the GP of the Partnershippledged their partnership units as collateral for the loan. Each of the shareholders of the GP pledged their shares in the GP as collateral for the loan.
Terms and conditions of outstanding borrowings were as follows:
As of December 31, 2019
Principal Deferred
financing costs Net of financing costs Interest rate Maturity date
Term loan $ 466,471 $ (3,858) $ 462,613 3.595% May 20, 2023
Less: current portion (25,250) 1,224 (24,026) Net of current $ 441,221 $ (2,634) $ 438,587
As of December 31, 2018
Principal Deferred
financing costs Net of financing costs Interest rate Maturity date
Term loan $ 489,823 $ (5,142) $ 484,681 3.595% May 20, 2023
Less: current portion (23,352) 1,284 (22,068) Net of current $ 466,471 $ (3,858) $ 462,613
The following are the amounts due for long-term debt as of December 31, 2019:
2020 $ 25,250
2021 26,514
2022 27,836
2023 25,987
2024 26,443
Thereafter 334,441
$ 466,471
Interest and commitment fees incurred, and interest expense recorded in the Partnership’s statements of operations and comprehensive income are as follows:
2019 2018 2017
Interest incurred on term loan $ 20,308 $ 21,102 $ 21,457
Amortization of deferred financing costs 1,283 1,338 1,381
Interest incurred on lease liabilities 916 — —
Interest expense $ 22,507 $ 22,440 $ 22,838
S-64
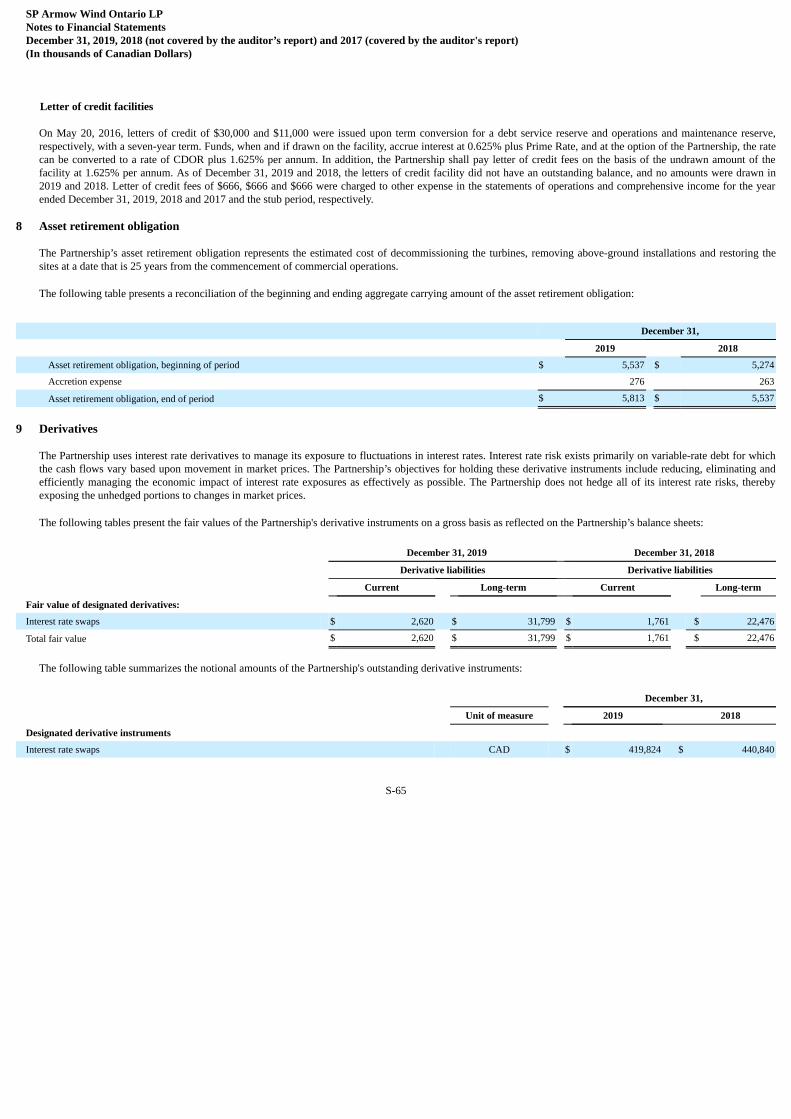
SP Armow Wind Ontario LPNotes to Financial StatementsDecember 31, 2019, 2018 (not covered by the auditor’s report) and 2017 (covered by the auditor's report)(In thousands of Canadian Dollars)
Letter of credit facilities
On May 20, 2016, letters of credit of $30,000 and $11,000 were issued upon term conversion for a debt service reserve and operations and maintenance reserve,respectively, with a seven-year term. Funds, when and if drawn on the facility, accrue interest at 0.625% plus Prime Rate, and at the option of the Partnership, the ratecan be converted to a rate of CDOR plus 1.625% per annum. In addition, the Partnership shall pay letter of credit fees on the basis of the undrawn amount of thefacility at 1.625% per annum. As of December 31, 2019 and 2018, the letters of credit facility did not have an outstanding balance, and no amounts were drawn in2019 and 2018. Letter of credit fees of $666, $666 and $666 were charged to other expense in the statements of operations and comprehensive income for the yearended December 31, 2019, 2018 and 2017 and the stub period, respectively.
8 Asset retirement obligation
The Partnership’s asset retirement obligation represents the estimated cost of decommissioning the turbines, removing above-ground installations and restoring thesites at a date that is 25 years from the commencement of commercial operations.
The following table presents a reconciliation of the beginning and ending aggregate carrying amount of the asset retirement obligation:
December 31,
2019 2018
Asset retirement obligation, beginning of period $ 5,537 $ 5,274
Accretion expense 276 263
Asset retirement obligation, end of period $ 5,813 $ 5,537
9 Derivatives
The Partnership uses interest rate derivatives to manage its exposure to fluctuations in interest rates. Interest rate risk exists primarily on variable-rate debt for whichthe cash flows vary based upon movement in market prices. The Partnership’s objectives for holding these derivative instruments include reducing, eliminating andefficiently managing the economic impact of interest rate exposures as effectively as possible. The Partnership does not hedge all of its interest rate risks, therebyexposing the unhedged portions to changes in market prices.
The following tables present the fair values of the Partnership's derivative instruments on a gross basis as reflected on the Partnership’s balance sheets:
December 31, 2019 December 31, 2018
Derivative liabilities Derivative liabilities
Current Long-term Current Long-term
Fair value of designated derivatives: Interest rate swaps $ 2,620 $ 31,799 $ 1,761 $ 22,476
Total fair value $ 2,620 $ 31,799 $ 1,761 $ 22,476
The following table summarizes the notional amounts of the Partnership's outstanding derivative instruments:
December 31,
Unit of measure 2019 2018
Designated derivative instruments Interest rate swaps CAD $ 419,824 $ 440,840
S-65

SP Armow Wind Ontario LPNotes to Financial StatementsDecember 31, 2019, 2018 (not covered by the auditor’s report) and 2017 (covered by the auditor's report)(In thousands of Canadian Dollars)
The following table presents losses on derivative contracts designated and qualifying as cash flow hedges recognized in accumulated other comprehensive loss for thefollowing periods:
December 31,
Description 2019 2018 2017
Losses (gains) recognized in accumulated OCL Effective portion $ (10,182) $ 1,804 $ 16,871
Losses reclassified from accumulated OCL into interest expense Derivativesettlements $ (2,791) $ (4,163) $ (7,680)
No ineffectiveness was recorded on these swaps for the years ended December 31, 2018 and 2017 and the stub period. The Partnership estimates that $1,952 inaccumulated other comprehensive loss will be reclassified into earnings over the next twelve months.
10 Fair value measurement
The Partnership’s fair value measurements incorporate various factors, including the credit standing and performance risk of the counterparties, the applicable exitmarket, and specific risks inherent in the instrument. Non-performance and credit risk adjustments on risk management instruments are based on current market inputswhen available, such as credit default swap spreads. When such information is not available, internal models are used.
Assets and liabilities recorded at fair value in the financial statements are categorized based on the level of judgment associated with the inputs used to measure theirfair value. Hierarchical levels directly related to the amount of subjectivity associated with the inputs to valuation of these assets or liabilities are as follows:
Level 1 - Inputs are unadjusted, quoted prices in active markets for identical assets or liabilities at the measurement date.
Level 2 - Inputs (other than quoted prices included in Level 1) are either directly or indirectly observable for the asset or liability through correlation with market dataat the measurement date and for the duration of the instrument’s anticipated life.
Level 3 - Unobservable inputs that are supported by little or no market activity and that are significant to the fair value of the assets or liabilities and which reflectmanagement’s best estimate of what market participants would use in pricing the asset or liability at the measurement date. Consideration is given to the risk inherentin the valuation technique and the risk inherent in the inputs to the model.
Short-term financial instruments consist principally of cash and cash equivalents, restricted cash, accounts payable and other accrued liabilities. Based on the natureand short maturity of these instruments their fair value is approximated using carrying cost and they are presented in the financial statements at carrying cost.
Long-term debt is presented on the balance sheets at amortized cost. The fair value of variable interest rate for long-term debt is approximated by its carrying cost.
Derivatives are presented in the financial statements at fair value. The interest rate swaps were valued by discounting the net cash flows using the forward CDORcurve with the valuations adjusted by the Project's credit default swap rate.
The following table presents the fair values according to each defined level.
S-66

SP Armow Wind Ontario LPNotes to Financial StatementsDecember 31, 2019, 2018 (not covered by the auditor’s report) and 2017 (covered by the auditor's report)(In thousands of Canadian Dollars)
Financial assets (liabilities) measured on a recurring basis:
Level 1 Level 2 Level 3
December 31, 2019 Interest rate swaps $ — $ (34,419) $ —
December 31, 2018 Interest rate swaps $ — $ (24,237) $ —
11 Commitments and contingencies
1) Commitments
Service and Maintenance Agreement
The Partnership has entered into service and maintenance agreements with Siemens to provide and carry out turbine maintenance and service activities for the Projectuntil January 2022. Based on the terms of the agreements, Siemens shall be entitled to receive a daily base fee per turbine that may be subject to periodic priceadjustments for inflation, over the terms of the agreements. As of December 31, 2019, outstanding commitments with Siemens were $3,479, including an estimatedannual price adjustment for inflation of 2%, where applicable, payable over the full term of the agreement.
2) Contingencies
Development Agreement
On May 21, 2014, the Partnership entered into a Development Agreement (DA) with the Corporation of the Municipality of Kincardine, in which the Partnershipcommitted to twenty annual contributions of $630 plus an initial contribution of $1,030. In exchange for DA payments, the municipality undertakes certain obligationsto support the Project, including entering into a road use agreement.
Turbine Availability Warranty
The Partnership has a turbine availability warranty from its turbine manufacturer. Pursuant to the warranty, if a turbine operates at less than minimum availabilityduring the warranty period, the turbine manufacturer is obligated to pay, as liquidated damages, an amount for each percent that the turbine operates below theminimum availability threshold. In addition, if a turbine operates at more than a specified availability during the warranty period, the Partnership has an obligation topay a bonus to the turbine manufacturer. As of December 31, 2019, the Partnership recorded a liability of $29 associated with bonuses payable to the turbinemanufacturer.
12 Related party transactions
The Partnership is managed by the GP, which is jointly controlled by Samsung and Pattern in accordance with the terms of the Unanimous Shareholder Agreement.Certain terms of the Samsung Pattern Joint Venture Wind Development Agreement, entered into between Samsung and an affiliate of PRHC on July 27, 2010, directedthe responsibilities of Samsung and Pattern Renewable Holdings ULC ("PRHC") for the Project.
The following transactions were carried out with related parties:
a) Management, Operation, and Maintenance Agreement (MOMA)
On October 24, 2014, the Partnership entered into a MOMA with Pattern Operators Canada ULC, which is owned by an affiliate of Pattern to operate andmanage the maintenance of the wind plant and to perform certain other services pertaining to the wind plant in accordance with terms and conditions set forth inthe MOMA.
S-67

SP Armow Wind Ontario LPNotes to Financial StatementsDecember 31, 2019, 2018 (not covered by the auditor’s report) and 2017 (covered by the auditor's report)(In thousands of Canadian Dollars)
$1,430, $1,403 and $1,377 were charged to the statements of operations and comprehensive income for the years ended December 31, 2019, 2018 and 2017 andthe stub period, respectively.
b) Project Administration Agreement (PAA)
On October 24, 2014, the Partnership entered into the PAA with SRE Wind PA LP (PA), which is 100% owned by Samsung to supply project administrativeservices.
$429, $420 and $413 were charged to the statements of operations and comprehensive income for the years ended December 31, 2019, 2018 and 2017 and thestub period, respectively.
c) The Partnership recorded the following balances with related parties:
2019 2018
Related party payable to Pattern Operators Canada ULC $ 135 $ 132
Related party payable to SRE Wind PA LP 40 40
$ 175 $ 172
13 Comparative figures
Comparative figures of the partners’ equity on the face of balance sheet and the statement of changes of partners’ capital have been reclassified to conform to thecurrent year presentation. Such reclassifications did not have an impact on net income or cash flows.
December 31, 2018 Prior year presentation Reclassification Current yearpresentation
Partners’ capital $ (82,900) $ 82,900 $ —
Accumulated contribution — 87,780 87,780
Accumulated distribution — (170,680) (170,680)
Accumulated net income 96,132 — 96,132
Accumulated other comprehensive loss (24,237) — (24,237)
S-68

FINANCIAL STATEMENTS
K2 Wind Ontario Limited Partnership
For the period January 1, 2018 to December 30, 2018 (unaudited) andfor the year ended December 31, 2017
S-69
K2 Wind Ontario Limited Partnership
Financial Statements
For the period January 1, 2018 to December 30, 2018 (unaudited) andfor the year ended December 31, 2017
Contents Page
Report of Independent Registered Public Accounting Firm S-71
Financial Statements
Statements of Operations and Comprehensive Income S-72
Statements of Changes in Partners' Capital (Deficit) S-73
Statements of Cash Flows S-74
Notes to Financial Statements S-75
S-70
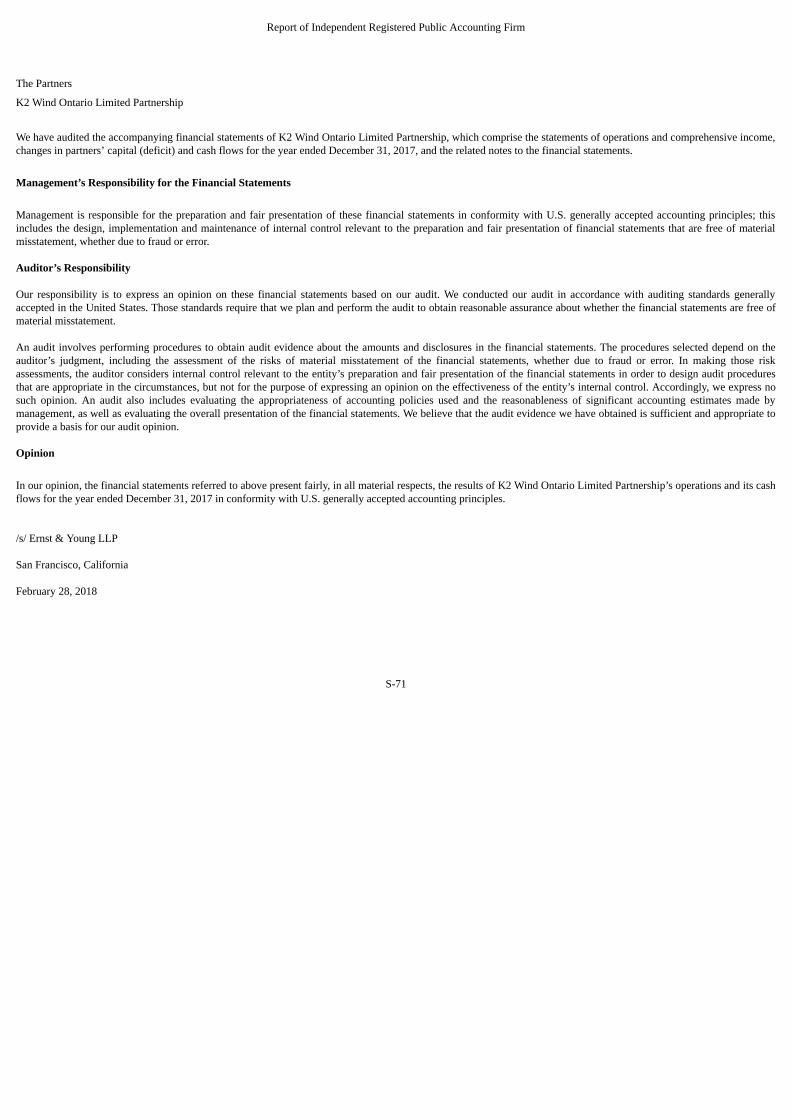
Report of Independent Registered Public Accounting Firm
The Partners
K2 Wind Ontario Limited Partnership
We have audited the accompanying financial statements of K2 Wind Ontario Limited Partnership, which comprise the statements of operations and comprehensive income,changes in partners’ capital (deficit) and cash flows for the year ended December 31, 2017, and the related notes to the financial statements.
Management’s Responsibility for the Financial Statements
Management is responsible for the preparation and fair presentation of these financial statements in conformity with U.S. generally accepted accounting principles; thisincludes the design, implementation and maintenance of internal control relevant to the preparation and fair presentation of financial statements that are free of materialmisstatement, whether due to fraud or error.
Auditor’s Responsibility
Our responsibility is to express an opinion on these financial statements based on our audit. We conducted our audit in accordance with auditing standards generallyaccepted in the United States. Those standards require that we plan and perform the audit to obtain reasonable assurance about whether the financial statements are free ofmaterial misstatement.
An audit involves performing procedures to obtain audit evidence about the amounts and disclosures in the financial statements. The procedures selected depend on theauditor’s judgment, including the assessment of the risks of material misstatement of the financial statements, whether due to fraud or error. In making those riskassessments, the auditor considers internal control relevant to the entity’s preparation and fair presentation of the financial statements in order to design audit proceduresthat are appropriate in the circumstances, but not for the purpose of expressing an opinion on the effectiveness of the entity’s internal control. Accordingly, we express nosuch opinion. An audit also includes evaluating the appropriateness of accounting policies used and the reasonableness of significant accounting estimates made bymanagement, as well as evaluating the overall presentation of the financial statements. We believe that the audit evidence we have obtained is sufficient and appropriate toprovide a basis for our audit opinion.
Opinion
In our opinion, the financial statements referred to above present fairly, in all material respects, the results of K2 Wind Ontario Limited Partnership’s operations and its cashflows for the year ended December 31, 2017 in conformity with U.S. generally accepted accounting principles.
/s/ Ernst & Young LLP
San Francisco, California
February 28, 2018
S-71

K2 Wind Ontario Limited PartnershipStatements of Operations and Comprehensive Income
(In thousands of Canadian Dollars)
For the period January1, 2018 to December 30,
Year endedDecember 31,
2018 2017
Revenue: (unaudited) Electricity sales $ 100,773 $ 87,012
Compensation for forgone energy 32,949 56,089
Total revenue 133,722 143,101
Cost of revenue: Operations and maintenance 11,564 11,443
General and administrative 5,889 6,255
Depreciation and accretion 35,720 35,306
Total cost of revenue 53,173 53,004
Operating income 80,549 90,097
Other income (expense): Interest expense (37,091) (38,043)
Other income (expense), net 167 87
Total other expense (36,924) (37,956)
Net income 43,625 52,141
Other comprehensive income (loss): Change in unrealized gain (loss) on cash flow hedges (3,878) 11,190
Reclassifications to net income 8,808 14,121
Total other comprehensive income (loss) 4,930 25,311
Total comprehensive income $ 48,555 $ 77,452
See accompanying notes to financial statements.
S-72
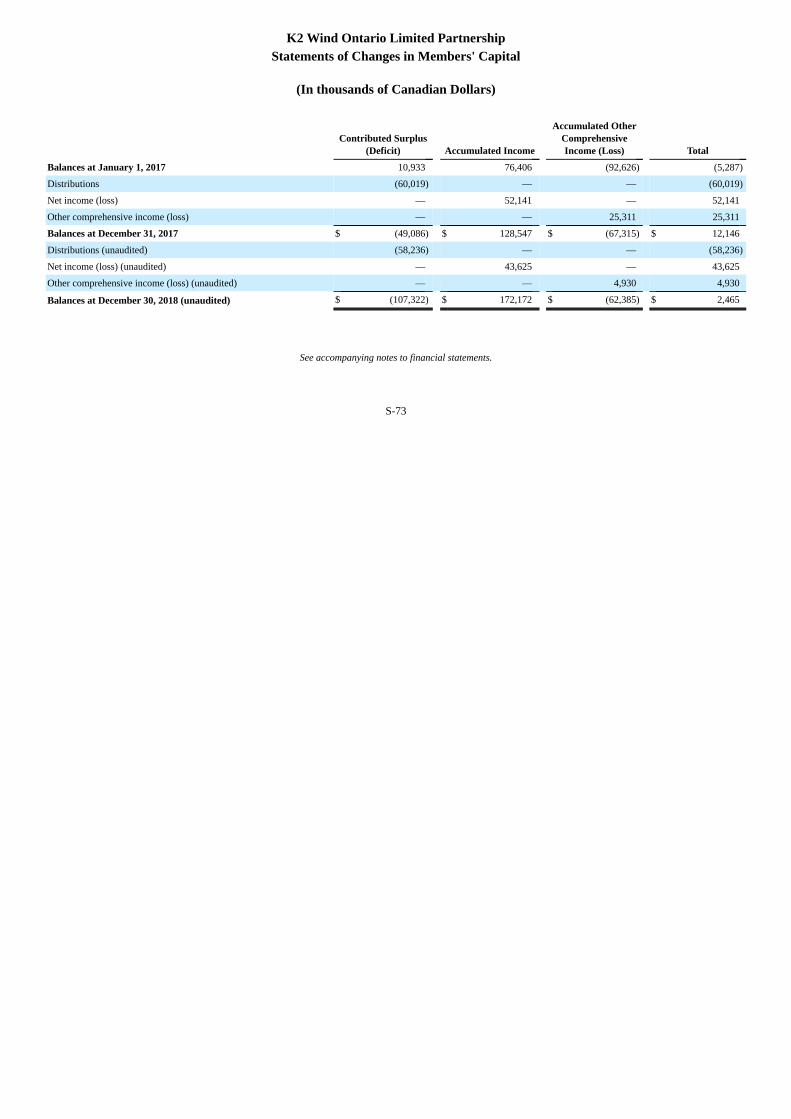
K2 Wind Ontario Limited PartnershipStatements of Changes in Members' Capital
(In thousands of Canadian Dollars)
Contributed Surplus
(Deficit) Accumulated Income
Accumulated OtherComprehensiveIncome (Loss) Total
Balances at January 1, 2017 10,933 76,406 (92,626) (5,287)
Distributions (60,019) — — (60,019)
Net income (loss) — 52,141 — 52,141
Other comprehensive income (loss) — — 25,311 25,311
Balances at December 31, 2017 $ (49,086) $ 128,547 $ (67,315) $ 12,146
Distributions (unaudited) (58,236) — — (58,236)
Net income (loss) (unaudited) — 43,625 — 43,625
Other comprehensive income (loss) (unaudited) — — 4,930 4,930
Balances at December 30, 2018 (unaudited) $ (107,322) $ 172,172 $ (62,385) $ 2,465
See accompanying notes to financial statements.
S-73
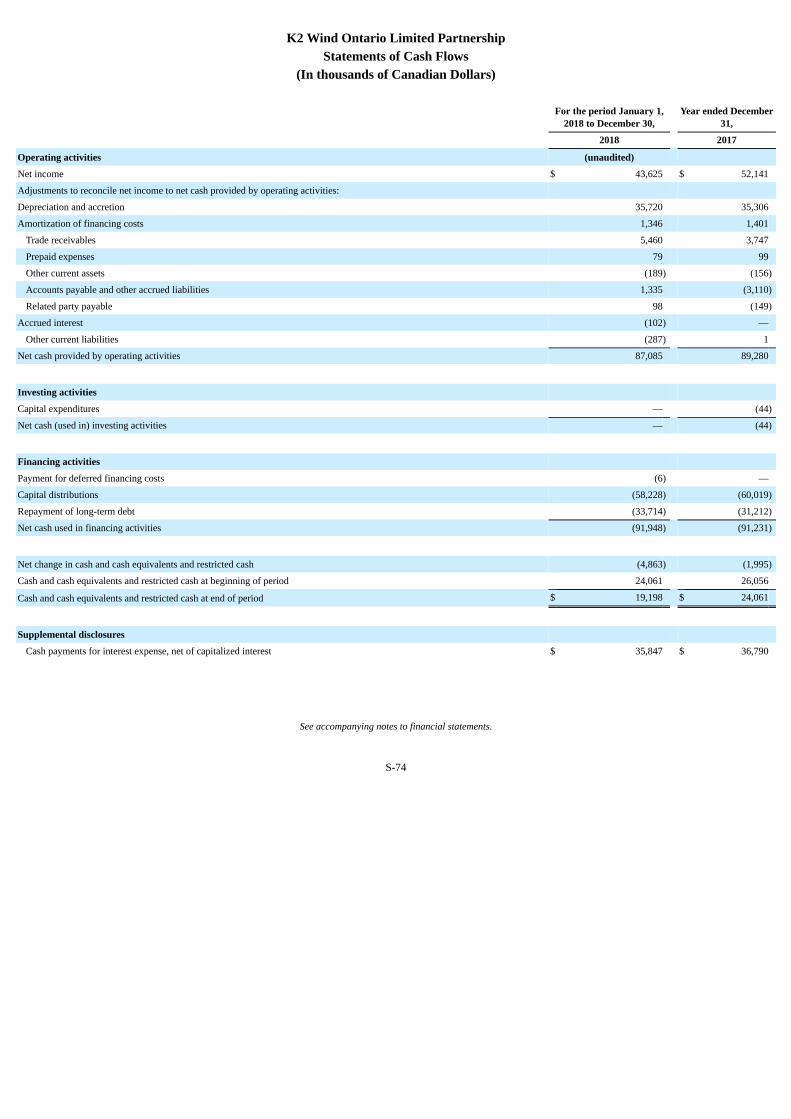
K2 Wind Ontario Limited PartnershipStatements of Cash Flows
(In thousands of Canadian Dollars)
For the period January 1,
2018 to December 30, Year ended December
31,
2018 2017
Operating activities (unaudited) Net income $ 43,625 $ 52,141
Adjustments to reconcile net income to net cash provided by operating activities: Depreciation and accretion 35,720 35,306
Amortization of financing costs 1,346 1,401
Trade receivables 5,460 3,747
Prepaid expenses 79 99
Other current assets (189) (156)
Accounts payable and other accrued liabilities 1,335 (3,110)
Related party payable 98 (149)
Accrued interest (102) —
Other current liabilities (287) 1
Net cash provided by operating activities 87,085 89,280
Investing activities Capital expenditures — (44)
Net cash (used in) investing activities — (44)
Financing activities Payment for deferred financing costs (6) —
Capital distributions (58,228) (60,019)
Repayment of long-term debt (33,714) (31,212)
Net cash used in financing activities (91,948) (91,231)
Net change in cash and cash equivalents and restricted cash (4,863) (1,995)
Cash and cash equivalents and restricted cash at beginning of period 24,061 26,056
Cash and cash equivalents and restricted cash at end of period $ 19,198 $ 24,061
Supplemental disclosures Cash payments for interest expense, net of capitalized interest $ 35,847 $ 36,790
See accompanying notes to financial statements.
S-74
K2 Wind Ontario Limited PartnershipNotes to Financial Statements
The period January 1, 2018 to December 30, 2018 is unaudited.
1. General information
Business
K2 Wind Ontario Limited Partnership (K2 Wind or the Company), a limited partnership under the laws of the Province of Ontario, was formed on July 27, 2011, as a jointventure project between Capital Power L.P., Samsung Renewable Energy Inc. (Samsung) and Pattern Renewable Holdings Canada ULC (PRHC), each holding a 33.33%ownership interest as limited partners of the Company, and K2 Wind Ontario Inc. (the GP), holding a 0.01% ownership interest as general partner of the Company.
The GP is a corporation jointly owned among affiliates of Samsung, Pattern Energy Group Inc. (Pattern), and Capital Power. The Samsung affiliate originally owned a 50%GP interest and the Pattern and Capital Power affiliates each originally owned a 25% GP interest.
On June 17, 2015, Pattern K2 LP Holdings LP transferred all of its interests in K2 Wind to PRHC and PRHC subsequently transferred all of its interests in K2 Wind toPattern Canada Finance Company ULC, a wholly owned subsidiary of Pattern.
On March 15, 2016, Samsung transferred a portion of its GP interest so that each of the Samsung, Pattern and Capital Power affiliates then held equal 33.33% interests inthe GP.
On July 7, 2016, CP K2 Holdings Inc.’s LP interest in K2 Wind, was transferred through an internal reorganization to Capital Power LP Holdings Inc., an entity whollyowned by Capital Power.
On August 5, 2016, Samsung sold its LP interest in K2 Wind to K2 Wind Co LP and its GP interest to K2 Wind Co GP Inc. K2 Wind Co LP and K2 Wind Co GP Inc. areowned by a consortium of Axium Infrastructure Canada II LP, ATRF INF (DB) LTD. and The Manufacturers Life Insurance Company.
On December 31, 2018, Pattern and Capital Power L.P. sold all of their interest in K2 Wind to K2 Wind Co LP and K2 Wind Co GP Inc. K2 Wind is continuing operationspost sale and these financials have been prepared with K2 Wind operating as an ongoing venture. A balance sheet as of December 31, 2018 is not presented due to thechange in ownership.
The partners’ liability and losses for K2 Wind are limited to each limited partner’s capital contribution plus any unpaid capital contributions agreed to by the partners. Thepartners shall not be required to make additional capital contributions, or have any personal liability, in respect of the liabilities or the obligations of K2 Wind.
These United States Generally Accepted Accounting Principles (U.S. GAAP) financials are presented for the purposes of inclusion in Pattern's annual report on Form 10-Kunder the requirements of SEC Rule S-X 3-09. The unaudited financial statements for 2018 present information only for the period in which Pattern held its interest in K2Wind.
The Project
K2 Wind owns a 270 megawatt (MW) wind project consisting of 140 wind turbine generators located in the township of Ashfield Colborne Wawanosh in Ontario, Canada(the Project). The Project reached its commercial operation date (COD) on May 29, 2015.
The Company has a power purchase agreement (PPA) with the Independent Electricity System Operator (IESO) for a period of 20 years from the COD. The IESO overseesthe wholesale electricity market, where the price of energy is determined. It also administers the rules that govern the market and, through an arm's-length marketmonitoring function, ensures that it is operated fairly and efficiently. The IESO is an agent among the market participants in Ontario and is neither exposed to, nor benefitsfrom, any transactions. In such capacity, the IESO executes agreements to help the market meet the renewable energy mandates of the government of the Province ofOntario. There are approximately 70 electric distribution companies in Ontario, all of which have government mandates to purchase renewable energy. The PPA providesfor guaranteed pricing from IESO that removes volatility caused by fluctuations in market rates. The Ontario government established the Global Adjustment (GA) which isdesigned to adjust consumer rates depending on the price of energy. The IESO establishes a monthly variable GA rate based on GA costs and Ontario electricity demandwhich effectively establishes a pass through mechanism to the consumer and eliminates the IESO's economic exposure to our contract price.
S-75

K2 Wind Ontario Limited PartnershipNotes to Financial Statements
2. Summary of Significant Accounting Policies
Basis of Presentation
The accompanying financial statements are presented using U.S. GAAP. The preparation of U.S. GAAP basis financial statements requires management to make certainestimates and assumptions that affect the reported amounts and disclosures in the financial statements and the reported amounts of assets and liabilities, and to disclosecontingent assets and liabilities at the date of the financial statements and the reported amounts of revenues and expenses during the reporting period. Because the use ofestimates is inherent in the financial reporting process, actual results could differ from those estimates.
These financial statements do not include assets, liabilities, revenue and expenses of the GP and limited partners.
Use of Estimates
The preparation of financial statements in conformity with U.S. GAAP requires management to make estimates and assumptions that affect the reported amounts of assetsand liabilities, disclosures of contingent assets and liabilities at the date of the financial statements, and the reported amounts of revenues and expenses during the reportingperiod. Actual results could differ from those estimates, and such differences may be material to the financial statements.
Functional and Presentation Currency
Items included in the financial statements of the Company are measured using the currency of the primary economic environment in which the Company operates, the(functional currency). The financial statements are presented in Canadian dollars, which is the Company’s functional and presentation currency.
Fair Value of Financial Instruments
ASC 820, Fair Value Measurement, defines fair value as the price at which an asset could be exchanged or a liability transferred in an orderly transaction betweenknowledgeable, willing parties in the principal or most advantageous market for the asset or liability. Where available, fair value is based on observable market prices orderived from such prices. Where observable prices or inputs are not available, valuation models are applied. These valuation techniques involve some level of managementestimation and judgment, the degree of which is dependent on the price transparency for the instruments or market and the instruments’ complexity.
Cash and Cash Equivalents
Cash and cash equivalents consist of cash in banks and highly liquid investments with original maturities of three months or less.
Restricted Cash
Restricted cash consists of cash balances required to collateralize commercial bank letter of credit facilities related primarily to the PPA and for reserves required under theCompany's credit agreements.
Trade Receivables
The Company’s trade receivables are generated by selling energy in Ontario, Canada through the IESO as a settlement agent. The Company believes that all amounts arecollectible and an allowance for doubtful accounts is not required.
Property, Plant and Equipment
The Project is recorded at historical cost on the balance sheets. The Project is being depreciated using the straight-line method over its 25-year life beginning at the COD.Capitalized assets acquired in support of the plant operations are recorded at cost and depreciated using the straight-line method over the estimated useful life of the asset.
The remaining assets are depreciated over two to five years. Improvements to property, plant and equipment deemed to extend the useful economic life of an asset arecapitalized. Repair and maintenance costs are expensed as incurred.
S-76

K2 Wind Ontario Limited PartnershipNotes to Financial Statements
Impairment of Long-Lived Assets
The Company periodically evaluates long-lived assets for potential impairment whenever events or changes in circumstances have occurred that indicate that impairmentmay exist, or the carrying amount of the long-lived asset may not be recoverable. An impairment loss is recognized only if the carrying amount of a long-lived asset is notrecoverable based on its estimated future undiscounted cash flows. An impairment loss is calculated based on the excess of the carrying value of the long-lived asset overthe fair value of such long-lived asset, with the fair value determined based on an estimate of discounted future cash flows. During the period January 1, 2018 toDecember 30, 2018 and the year ended December 31, 2017, no impairment losses were recorded in the statements of operations and comprehensive income.
Deferred Financing Costs
Financing costs incurred in connection with obtaining construction and term financing are deferred and amortized over the terms of the respective loans using the effective-interest method. Deferred financing costs are capitalized and recorded as an offset to the respective loans in the Company's balance sheets and are amortized to interestexpense in the statements of operations and comprehensive income (loss). Deferred financing costs incurred in connection with obtaining letters of credit are recorded as aseparate asset in the Company's balance sheets and are amortized using the straight-line method over the term of the letters of credit to interest expense in the statements ofoperations and comprehensive income.
Derivatives and Risk Management
The Company may enter into interest rate swaps, interest rate caps, forwards and other agreements to manage its interest rate risk. The Company recognizes its derivativeinstruments as assets or liabilities at fair value in the balance sheets. The Company does not have contracts subject to master netting agreements with counterparties, as suchassets and liabilities are presented gross on the balance sheets.
Accounting for changes in the fair value of a derivative instrument depends on whether it has been designated as part of a hedging relationship and on the type of hedgingrelationship. For derivative instruments that qualify and are designated as cash flow hedges, the effective portion of change in fair value of the derivative is reported as acomponent of other comprehensive income (OCI) until the contract settles and the hedged item is recognized in earnings. The ineffective portion of change in fair value isrecorded as a component of net income (loss) on the statements of operations and comprehensive income. The Company discontinues hedge accounting when it hasdetermined that a derivative contract no longer qualifies as an effective hedge or when it is no longer probable that the hedged forecasted transaction will occur.
Concentration of Credit Risk
Financial instruments that potentially subject the Company to concentrations of credit risk consist primarily of cash and cash equivalents, restricted cash, debt, derivativesand revenue. The Company places its cash and restricted cash with high-quality institutions. The Company’s derivative instruments are placed with counterparties that arecredit worthy institutions.
Contingent Liabilities
Contingent liabilities are recognized when the Company has a present legal obligation as a result of past events for which it is probable that an outflow of resources will berequired to settle the obligation, and the amount can be reasonably estimated. Contingent liabilities are not recognized for future operating losses.
Other Liabilities
Other liabilities are recognized when the Company has a present legal obligation as a result of past events for which it is probable that an outflow of resources will berequired to settle the obligation, and the amount can be reasonably estimated.
S-77
K2 Wind Ontario Limited PartnershipNotes to Financial Statements
Asset Retirement Obligation
The Company records an asset retirement obligation (ARO) for the estimated costs of decommissioning turbines, removing above-ground installations and restoring sites,at the time when a contractual decommissioning obligation is incurred. The ARO represents the present value of the expected costs and timing of the relateddecommissioning activities. The ARO asset and liability are recorded in property, plant and equipment and asset retirement obligation, respectively, on the accompanyingbalance sheets. The Company records accretion expense, which represents the increase in the asset retirement obligation, over the remaining or operational life of theProject. Accretion expense is recorded as operating costs in the statements of operations and comprehensive income using an accretion rate based on a credit adjusted risk-free interest rate. Changes resulting from revisions to the timing or amount of the original estimate of cash flows are recognized as an increase or a decrease in the assetretirement cost, or income when the asset retirement cost is depleted.
Income Taxes
The financial statements of the Company reflect no provision or liability for income taxes because profits and losses of the Company are allocated to the partners and areincluded in the income tax returns of the partners.
Income and losses for tax purposes may differ from the financial statement amounts and the partners’ capital (deficit) reflected in the financial statements does notnecessarily reflect their tax basis.
Revenue Recognition
The Company sells the electricity it generates through the IESO. Revenue is recognized based upon the amount of electricity delivered or curtailed at rates specified underthe contracts, assuming all other revenue recognition criteria are met. Revenue earned from curtailment is recorded as compensation for forgone energy in the statements ofoperations and comprehensive income (loss). The Company evaluates its PPA to determine whether it is in substance a lease or derivative and, if applicable, recognizesrevenue pursuant to ASC 840, Leases, and ASC 815, Derivatives and Hedging, respectively. The PPA was not considered a lease or a derivative instrument, as multiplemarket participants purchase the energy at market-based prices with IESO working as a settlement agent. As a result, revenue (including any revenue from the priceguaranteed by IESO), is recognized on an accrual basis in accordance with ASC 605, Revenue Recognition.
Cost of Revenue
The Company’s cost of revenue is comprised of direct costs of operating and maintaining its project facilities, including labor, turbine service arrangements, meteringservice and shadow settlements, environmental fees, land lease royalties, property taxes, insurance costs, depreciation of long-lived assets and accretion associated with theCompany's ARO.
Recently Issued Accounting Standards Not Yet Adopted
In October 2018, the Financial Accounting Standards Board (FASB) issued ASU 2018-16, Derivatives and Hedging (Topic ASC 815): Inclusion of the Secured OvernightFinancing Rate (SOFR) Overnight Index Swap (OIS) Rate as a Benchmark Interest Rate for Hedge Accounting Purposes (ASU 2018-16), which expands the list of U.S.benchmark interest rates permitted in the application of hedge accounting. Because of concerns about the sustainability of LIBOR, the Federal Reserve Board and theFederal Reserve Bank of New York (Fed) initiated an effort to introduce an alternative reference rate in the United States. The SOFR is calculated by the Fed based on theinterest rates banks charge one another in the overnight market, typically called repurchase agreements, and because it is based on transactions in the open market, it ismore reflective of market conditions than LIBOR, which relies on judgment. The provisions of ASU 2017-12 (discussed below) and ASU 2018-16 are effective for fiscalyears beginning after December 15, 2018, including interim periods, with early adoption permitted. Initial adoption of ASU 2017-12 is required to be reported using amodified retrospective approach, with the exception of the presentation and disclosure requirements which are required to be applied prospectively. The Company iscurrently in the process of determining the impact of adoption of the provisions of ASU 2017-12 and ASU 2018-16.
In August 2017, the FASB issued ASU 2017-12, Targeted Improvements to Accounting for Hedging Activities (ASU 2017-12), which amends the presentation anddisclosure requirements and changes how companies assess effectiveness. The amendments are intended to more closely align hedge accounting with companies’ riskmanagement strategies, simplify the application of hedge accounting, and increase transparency as to the scope and results of hedging programs. ASU 2017-12 is effectivefor annual periods beginning after December 15, 2019, and interim periods within fiscal years beginning after December 15, 2020. Early application is permitted. TheCompany is currently assessing the future impact of this update on its consolidated financial statements and related disclosures.
S-78
K2 Wind Ontario Limited PartnershipNotes to Financial Statements
In June 2016, the FASB issued ASU 2016-13, Financial Instruments - Credit Losses (Topic 326): Measurement of Credit Losses on Financial Instruments (ASU 2016-13),which requires the measurement of all expected credit losses for financial assets including trade receivables held at the reporting date based on historical experience, currentconditions and reasonable and supportable forecasts. ASU 2016-13 is effective for fiscal years beginning after December 15, 2020, and interim periods within fiscal yearsbeginning after December 15, 2021. The Company is currently assessing the future impact of this update on its consolidated financial statements and related disclosures.
In February 2016, the FASB issued ASU 2016-02, Leases (ASU 2016-02), which requires lessees to recognize right-of-use assets and lease liabilities, for all leases, withthe exception of short-term leases, at the commencement date of each lease. Under the new guidance, lessor accounting is largely unchanged. ASU 2016-02 simplifies theaccounting for sale and leaseback transactions primarily because lessees must recognize lease assets and liabilities. ASU 2016-02 is effective for annual periods beginningafter December 15, 2019, and interim periods within fiscal years beginning after December 15, 2020. Early adoption is permitted. The amendments of this update should beapplied using a modified retrospective approach, which requires lessees and lessors to recognize and measure leases at the beginning of the earliest period presented. TheCompany is in the initial stages of evaluating the impact of the new standard on its accounting policies, processes and system requirements. The Company is also assessingthe accounting impact of ASU 2016-02 as it applies to its PPAs, land leases, office leases and equipment leases. As the Company progresses further in its analysis, thescope of this assessment could be expanded to review other types of contracts.
In May 2014, the FASB issued ASU 2014-09, which creates ASC Topic 606, Revenue from Contracts with Customers and supersedes ASC Topic 605, RevenueRecognition. The new standard replaces industry-specific guidance and establishes a single five-step model to identify and recognize revenue. The core principle of the newstandard is that an entity should recognize revenue upon transfer of control of promised goods or services to customers in an amount that reflects the consideration to whichan entity expects to be entitled in exchange for those goods or services. Additionally, the new standard requires the entity to disclose further quantitative and qualitativeinformation regarding the nature and amount of revenues arising from contracts with customers, as well as other information about the significant judgments and estimatesused in recognizing revenues from contracts with customers. The Company expects to adopt these updates beginning January 1, 2019. The adoption of ASC 606 has beenassessed and determined that there will not be a material impact on the financial statements.
3. Property, Plant and Equipment
The Company recorded depreciation expense related to property, plant and equipment of $35.2 million and $35.0 million for the period January 1, 2018 to December 30,2018 and for the year ended December 31, 2017, respectively.
4. Long-Term Debt
In November 2015, the Company entered into a term loan in the amount of $818.0 million with an amortization period of 18 years, at a variable rate interest at CanadianDollar Offered Rate (CDOR) plus 1.75% per annum. The loan has a maturity date on November 20, 2022 due to prepayment requirements in the partnership's creditagreement. In connection with the term loan, the Company entered into interest rate swaps on 90% of the loan commitment. The interest rate swaps are organized in twotranches with fixed effective interest rates of 3.11% and 4.45% for years 1-7 and years 8-18, respectively.
Collateral under the financing agreement consists of substantially all of the Company’s assets. Its loan agreement contains a broad range of covenants that, subject to certainexceptions, restrict the Company’s ability to incur debt, grant liens, sell or lease assets, transfer equity interest, dissolve, pay distributions and change its business. All thelimited partners, general partners and shareholders of general partners pledged shares of partnership units or common stock owned as collateral for the loan. As ofDecember 30, 2018, the Company was in compliance with all loan covenants.
Interest and commitment fees incurred and interest expense for long-term debt consisted of the following (in thousands):
For the period January 1,
2018 to December 30, Year ended
December 31,
2018 2017
Interest and commitment fees incurred $ 34,686 $ 35,583
Letter of credit fees incurred 1,059 1,059
Amortization of financing costs 1,346 1,401
Interest expense $ 37,091 $ 38,043
S-79

K2 Wind Ontario Limited PartnershipNotes to Financial Statements
The Company has two letter of credit facilities available in the amount of $60.5 million as set out in the Company’s credit agreement. During the period January 1 toDecember 31, 2018, no amounts had been drawn on these letters of credit.
5. Derivatives and Risk Management
The Company uses interest rate derivatives to manage its exposure to fluctuation in interest rates. Interest rate risk exists primarily on variable-rate debt for which the cashflows vary based upon movement in interest rates. The Company’s objectives for holding these derivative instruments include reducing, eliminating and efficientlymanaging the economic impact of interest rate exposure as effectively as possible. The Company does not hedge of all of its interest rate risk, thereby exposing theunhedged portion to changes in market prices.
The Company’s interest rate swaps have remaining maturities ranging from approximately 3.7 years to 14.6 years.
The following table presents gains and losses on derivative contracts designated and qualifying as cash flow hedges recognized in accumulated other comprehensiveincome, as well as, amounts reclassified to earning for the following periods (in thousands):
For the periodJanuary 1, 2018 to
December 30, Year ended
December 31,
Description 2018 2017
Gains (losses) recognized in accumulated OCI Effective portion $ (3,878) $ 11,190
Gains (losses) reclassified from accumulated OCI into: Interest expense Derivative settlements $ 8,808 $ 14,121
The Company estimates that $4.9 million in accumulated other comprehensive income will be reclassified into earnings over the next twelve months.
No ineffectiveness was recorded on these swaps for the period January 1, 2018 to December 30, 2018 and for the year ended December 31, 2017. The changes in the fairvalue of these swaps were recognized in other comprehensive income.
No margin cash collateral was received or recorded from the counterparty during the period January 1, 2018 to December 30, 2018 and for the year ended December 31,2017.
6. Fair Value Measurements
The Company’s fair value measurements incorporate various factors, including the credit standing and performance risk of the counterparties, the applicable exit market,and specific risks inherent in the instrument. Non-performance and credit risk adjustments on risk management instruments are based on current market inputs whenavailable, such as credit default hedge spreads. When such information is not available, internal models may be used.
Assets and liabilities recorded at fair value in the combined financial statements are categorized based upon the level of judgment associated with the inputs used tomeasure their fair value. Hierarchical levels directly related to the amount of subjectivity associated with the inputs to valuation of these assets or liabilities are as follows:
Level 1 - Inputs are unadjusted, quoted prices in active markets for identical assets or liabilities at the measurement date.
Level 2 - Inputs (other than quoted prices included in Level 1) are either directly or indirectly observable for the asset or liability through correlation with marketdata at the measurement date and for the duration of the instrument’s anticipated life.
Level 3 - Unobservable inputs that are supported by little or no market activity and that are significant to the fair value of the assets or liabilities and which reflectmanagement’s best estimate of what market participants would use in pricing the asset or liability at the measurement date. Consideration is given to the riskinherent in the valuations technique and the risk inherent in the inputs to the model.
S-80
K2 Wind Ontario Limited PartnershipNotes to Financial Statements
The carrying value of financial instruments classified as current assets and current liabilities approximates their fair value, based on the nature and short maturity of theseinstruments, and they are presented in the Company’s financial statements at carrying cost. The fair values of cash and cash equivalents and restricted cash are classified asLevel 1 in the fair value hierarchy. Certain other assets and liabilities were measured at fair value upon initial recognition and unless conditions give rise to an impairment,are not remeasured.
Long term debt is presented on the balance sheets at amortized cost. The fair value of variable interest rate long-term debt is approximated by its carrying cost, and isclassified as Level 2 in the fair value hierarchy.
Level 2 Inputs
Derivative instruments subject to re-measurement are presented in the financial statements at fair value. The Company's interest rate swaps were valued by discounting thenet cash flows using the forward Canadian dollar offered rate curve with the valuations adjusted by the Company’s credit default hedge rate.
7. Commitments, Contingencies and Warranties
Commitments
The Company has entered into various purchase, construction, as well as other commitments, land leases, and turbine operations and maintenance agreements. Detailedbelow are estimates of future commitments under these arrangements as of December 30, 2018 (in thousands):
2019 2020 2021 2022 2023 Thereafter Total
Purchase and other commitments $ 715 $ 718 $ 721 $ 724 $ 727 $ 8,014 $ 11,619
Land leases 2,955 2,956 2,957 2,958 3,007 60,998 75,831
Service and maintenance 2,633 2,633 1,536 — — — 6,802
Total Commitments $ 6,303 $ 6,307 $ 5,214 $ 3,682 $ 3,734 $ 69,012 $ 94,252
Purchase and other commitments
The Company has entered into various commitments with service providers related to the projects and operations of its business. Outstanding commitments include thoserelated to construction, and commitments related to donations to local community and government organizations.
In March 2013, the Company entered into an agreement with the local township in which the Company will make annual payments into a fund managed by the township inamounts of $2,600 per nameplate MW of the Project installed capacity. The payments are calculated annually and are owed for the 20-year term of the PPA. In exchangefor payments, the township undertakes certain obligations to support the Project, including entering into a road use agreement in which the Project may utilize municipalright-of-ways for collection and transmission lines.
The Company has also made various public statements that payments will be made to local landowners, for which the Company will not receive any future benefits. TheCompany considers these statements to be cancellable and not legally binding; therefore the Company has not recognized a liability for these amounts, nor are the paymentsincluded in the table above. Payments under the statements are approximately $0.5 million per year, for the next 18 years.
Land leases
The Company has acquired leases for land where the wind farm will be located through the exercise of land options acquired from Capital Power and also executed newland lease agreements in 2014. The leases provide for the land interests necessary for the construction and operation of the project. The Company recorded $2.9 million and$2.9 million of lease expense in the statements of operations and comprehensive income for the period January 1, 2018 to December 30, 2018 and the year ended December31, 2017, respectively.
S-81

K2 Wind Ontario Limited PartnershipNotes to Financial Statements
Service and maintenance
The Company has entered into service and maintenance agreements with third party contractors to provide turbine operations and maintenance services and modificationsand upgrades for a three year period beginning after the COD. The computation of outstanding commitments includes an estimated annual price adjustment for inflation of2%, where applicable. For the period January 1, 2018 to December 30, 2018 and the year ended December 31, 2017, the Company recorded service and maintenanceexpense under these agreements of $6.4 million and $7.3 million, respectively, in project expense in the statements of operations.
Warranties and Guarantees
Turbine Operating Warranties and Service Guarantees
The Company entered in to a warranty agreement with Siemens for a two-year period from the commissioning of each turbine. Pursuant to the warranty, if the turbinesoperate at less than a specified percentage of availability during each consecutive thirty month period, Siemens is obligated to pay liquidated damages to the Company. Inaddition, the Company will pay Siemens a bonus if the availability of the turbines exceeds a certain specified availability percentage during the thirty-month period. TheCompany has not recorded any liability associated with bonuses to Siemens.
Siemens
On March 8, 2013, an Operational Incentive Agreement was entered into among Samsung, an affiliate of PRHC and Siemens. The agreement defines operationalobjectives, the terms and conditions upon which the Company may make operational incentive payments to Siemens for achieving one or more of such operationalobjectives under the turbine supply agreements for joint development projects. Siemens earned an initial payment of $1.1 million, which was paid in 2013 for havingsatisfied the Peak Capacity Objective defined under the agreement. The Company has not recorded any liability related to the agreement.
Legal Proceedings
Renewable Energy Approval
During the third quarter of 2015, rights to appeal prior decisions granting the Renewable Energy Approval (REA) under Ontario's Environmental Protection Act for theProject were exhausted without further appeal. As a result, a stay of a previously filed civil suit against the Project pending final determination of the REA was lifted,allowing such suit to move forward if the claimants so chose to continue such suit. The Project has been awarded their legal fees in connection with the portion of the claimthat was stricken, and has reached a settlement agreement under which the Project will waive entitlement to the legal fees and in return Plaintiff has agreed to full dismissalof all pending claims.
8. Related Party Transactions
The following transactions were carried out with the related parties:
Management, Operation, and Maintenance Agreement (MOMA)
On March 20, 2014, the Company entered into the MOMA with Pattern Operators Canada ULC (POC), which is owned by an affiliate of Pattern to operate and manage themaintenance of the wind plant and to perform certain other services pertaining to the wind plant in accordance with terms and conditions set in the MOMA.
The fixed annual fee for the service is $0.9 million pro-rated for the period from March 20, 2013 until the COD and thereafter the annual fee was increased to $1.4 millionuntil expiry of the contract in 2035. Additionally, the Company recorded expense of $1.5 million and $1.5 million to operations and maintenance expense in the statementsof operations and comprehensive income for the period January 1, 2018 to December 30, 2018 and the year ended December 31, 2017, respectively.
S-82

K2 Wind Ontario Limited PartnershipNotes to Financial Statements
Project Administration Agreement (PAA)
On March 20, 2014, the Company entered into the PAA with POC, which is 100% owned by an affiliate to receive project administrative services. A fixed annual fee of$0.4 million is payable during the period between the COD until expiry of the PPA in 2035. The Company recorded expense of $0.4 million and $0.4 million to general andadministrative expense in the statements of operations and comprehensive income for the period January 1, 2018 to December 30, 2018 and the year ended December 31,2017, respectively. The Company has not recorded any related party payable.
9. Subsequent Events
The Company evaluated subsequent events through February 28, 2019, which is the date these financial statements were available to be issued and noted that there were nosubsequent events to disclose.
S-83
CONSOLIDATED FINANCIAL STATEMENTS
Pattern Energy Group Holdings 2 LP
As of December 31, 2019 and 2018and for the years ended December 31, 2019 and 2018and the period from July 27, 2017 through December 31, 2017with Reports of Independent Auditors
S-84
Pattern Energy Group Holdings 2 LP
Consolidated Financial Statements
As of December 31, 2019 and 2018 (not covered by the auditor's report)and for the years ended December 31, 2019 and 2018 (not covered by the auditor's report)
and the period from July 27, 2017 through December 31, 2017
Contents Page
Independent Auditor’s Report S-86
Consolidated Financial Statements Consolidated Balance Sheets S-89Consolidated Statements of Operations S-90Consolidated Statements of Comprehensive Income (Loss) S-91Consolidated Statements of Changes in Partners' Capital S-92Consolidated Statements of Cash Flows S-94Notes to Consolidated Financial Statements S-96
S-85
Report of Independent Auditors
To the Management and Board of Directors of Pattern Energy Group Holdings 2 LP
We have audited the accompanying consolidated financial statements of Pattern Energy Group Holdings 2 LP and its subsidiaries (the “Partnership”), which comprise theconsolidated balance sheet as of December 31, 2019, and the related consolidated statements of operations, of comprehensive income (loss), of changes in partners' capitaland of cash flows for the year then ended.
Management's Responsibility for the Consolidated Financial Statements
Management is responsible for the preparation and fair presentation of the consolidated financial statements in accordance with accounting principles generally accepted inthe United States of America; this includes the design, implementation, and maintenance of internal control relevant to the preparation and fair presentation of consolidatedfinancial statements that are free from material misstatement, whether due to fraud or error.
Auditors’ Responsibility
Our responsibility is to express an opinion on the consolidated financial statements based on our audit. We conducted our audit in accordance with auditing standardsgenerally accepted in the United States of America. Those standards require that we plan and perform the audit to obtain reasonable assurance about whether theconsolidated financial statements are free from material misstatement.
An audit involves performing procedures to obtain audit evidence about the amounts and disclosures in the consolidated financial statements. The procedures selecteddepend on our judgment, including the assessment of the risks of material misstatement of the consolidated financial statements, whether due to fraud or error. In makingthose risk assessments, we consider internal control relevant to the Partnership's preparation and fair presentation of the consolidated financial statements in order to designaudit procedures that are appropriate in the circumstances, but not for the purpose of expressing an opinion on the effectiveness of the Partnership's internal control.Accordingly, we express no such opinion. An audit also includes evaluating the appropriateness of accounting policies used and the reasonableness of significantaccounting estimates made by management, as well as evaluating the overall presentation of the consolidated financial statements. We believe that the audit evidence wehave obtained is sufficient and appropriate to provide a basis for our audit opinion.
Opinion
In our opinion, the consolidated financial statements referred to above present fairly, in all material respects, the financial position of Pattern Energy Group Holdings 2 LPand its subsidiaries as of December 31, 2019 and the results of their operations and their cash flows for the year then ended in accordance with accounting principlesgenerally accepted in the United States of America.
Emphasis of Matters
The accompanying consolidated financial statements have been prepared assuming that the Partnership will continue as a going concern. As discussed in Note 1 to theconsolidated financial statements, the Partnership has suffered recurring losses from operations, negative working capital and cash outflows from operating activities, andhas stated that substantial doubt exists about the Partnership’s ability to continue as a going concern. Management's evaluation of the events and conditions andmanagement’s plans regarding these matters are also described in Note 1. The consolidated financial statements do not include any adjustments that might result from theoutcome of this uncertainty. Our opinion is not modified with respect to this matter.
As discussed in Note 2 to the consolidated financial statements, the Partnership changed the manner in which it accounts for revenue in 2019. Our opinion is not modifiedwith respect to this matter.
Other Matter
S-86

The accompanying consolidated balance sheet of the Partnership as of December 31, 2018, and the related consolidated statements of operations, of comprehensive income(loss), of changes in partners' capital and of cash flows for the year then ended are presented for purposes of complying with Rule 3-09 of SEC Regulation S-X; however,Rule 3-09 does not require the 2018 financial statements to be audited and they are therefore not covered by this report.
/s/ PricewaterhouseCoopers LLPSan Francisco, CaliforniaMarch 2, 2020
S-87
Report of Independent Auditors
To the Partners,Pattern Energy Group Holdings 2 LP.
We have audited the accompanying consolidated financial statements of Pattern Energy Group Holdings 2 LP, which comprise the consolidated statements of operations,comprehensive income (loss), changes in partners’ capital and cash flows for the period from July 27, 2017 through December 31, 2017, and the related notes to theconsolidated financial statements.
Management’s Responsibility for the Financial Statements
Management is responsible for the preparation and fair presentation of these financial statements in conformity with U.S. generally accepted accounting principles; thisincludes the design, implementation and maintenance of internal control relevant to the preparation and fair presentation of financial statements that are free of materialmisstatement, whether due to fraud or error.
Auditor’s Responsibility
Our responsibility is to express an opinion on these financial statements based on our audit. We conducted our audit in accordance with auditing standards generallyaccepted in the United States. Those standards require that we plan and perform the audit to obtain reasonable assurance about whether the financial statements are free ofmaterial misstatement. An audit involves performing procedures to obtain audit evidence about the amounts and disclosures in the financial statements. The proceduresselected depend on the auditor’s judgment, including the assessment of the risks of material misstatement of the financial statements, whether due to fraud or error. Inmaking those risk assessments, the auditor considers internal control relevant to the entity’s preparation and fair presentation of the financial statements in order to designaudit procedures that are appropriate in the circumstances, but not for the purpose of expressing an opinion on the effectiveness of the entity’s internal control. Accordingly,we express no such opinion.
An audit also includes evaluating the appropriateness of accounting policies used and the reasonableness of significant accounting estimates made by management, as wellas evaluating the overall presentation of the financial statements. We believe that the audit evidence we have obtained is sufficient and appropriate to provide a basis for ouraudit opinion.
Opinion
In our opinion, the financial statements referred to above present fairly, in all material respects, the consolidated results of Pattern Energy Group Holdings 2 LP’s operationsand its cash flows for the period from July 27, 2017 through December 31, 2017 in conformity with U.S. generally accepted accounting principles.
/s/ Ernst & Young LLP
San Francisco, California
March 28, 2019
S-88

Pattern Energy Group Holdings 2 LPConsolidated Balance Sheets(In thousands of U.S. Dollars)
December 31, 2019 2018*
Assets Cash and cash equivalents (Note 9) $ 29,095 $ 61,712Notes receivable, related party 57,961 52,307Restricted cash 23,804 51,983Related party receivable 11,997 11,063Notes receivable (Note 9) 2,701 2,476Major equipment advances (Note 9) 24,322 147,618Deferred development costs (Note 9) 12,844 5,727Construction in progress 139,407 180,278Property, plant and equipment, net (Note 9) 15,136 6,819Unconsolidated investments 29,650 29,302Finite-lived intangible assets, net 27,857 16,769Deposits (Note 9) 62,375 52,571Contract asset 13,696 —Other assets (Note 9) 18,293 22,057
Total assets $ 469,138 $ 640,682
Liabilities and partners' capital Accounts payable and accrued liabilities (Note 9) $ 36,976 $ 60,368Debt, net (Note 9) 39,397 211,907Revolving credit facility 60,000 —Related party payable (Note 9) 44,068 30,008Other liabilities (Note 9) 18,072 10,394Total liabilities 198,513 312,677Commitments and contingencies (Note 14)
Partners' capital: General partners — —Limited partners 275,567 332,361Accumulated other comprehensive loss (4,621) (4,924)Total capital before noncontrolling interest 270,946 327,437Noncontrolling interest (321) 568
Total partners' capital 270,625 328,005
Total liabilities and partners' capital $ 469,138 $ 640,682
See accompanying notes to consolidated financial statements.
* Not covered by the auditor's report
S-89
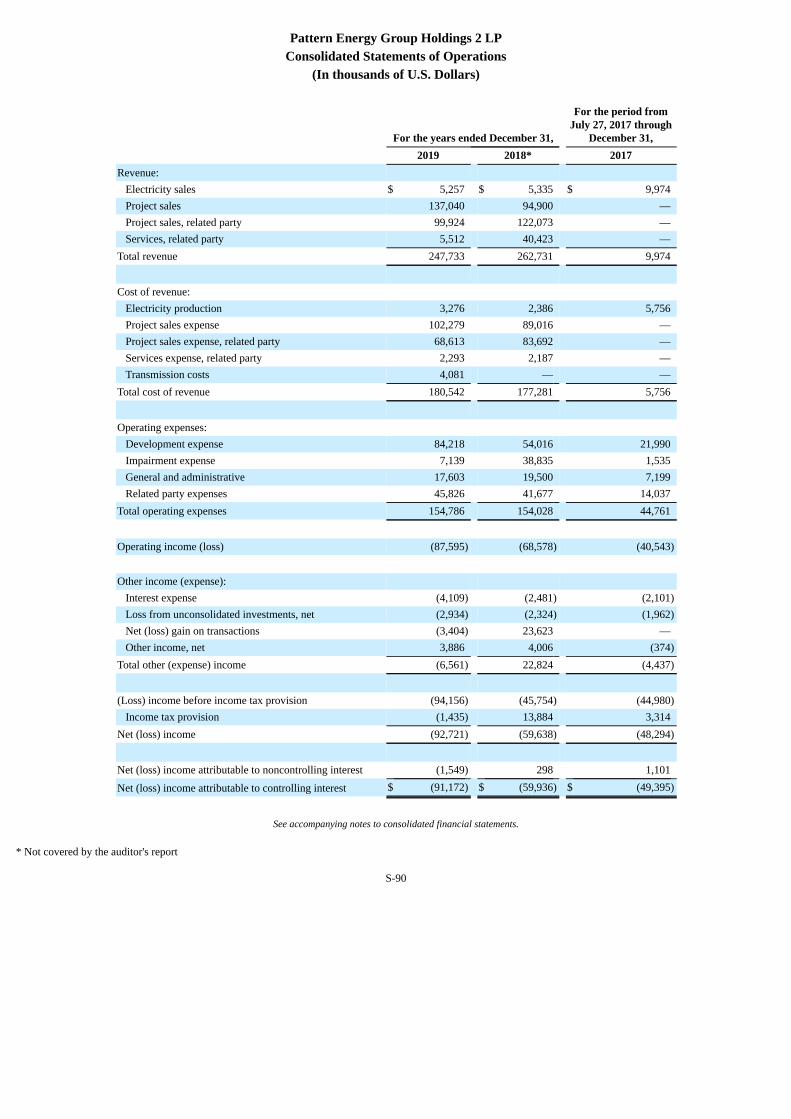
Pattern Energy Group Holdings 2 LPConsolidated Statements of Operations
(In thousands of U.S. Dollars)
For the years ended December 31,
For the period fromJuly 27, 2017 through
December 31, 2019 2018* 2017Revenue:
Electricity sales $ 5,257 $ 5,335 $ 9,974Project sales 137,040 94,900 —Project sales, related party 99,924 122,073 —Services, related party 5,512 40,423 —
Total revenue 247,733 262,731 9,974
Cost of revenue: Electricity production 3,276 2,386 5,756Project sales expense 102,279 89,016 —Project sales expense, related party 68,613 83,692 —Services expense, related party 2,293 2,187 —Transmission costs 4,081 — —
Total cost of revenue 180,542 177,281 5,756
Operating expenses: Development expense 84,218 54,016 21,990Impairment expense 7,139 38,835 1,535General and administrative 17,603 19,500 7,199Related party expenses 45,826 41,677 14,037
Total operating expenses 154,786 154,028 44,761
Operating income (loss) (87,595) (68,578) (40,543)
Other income (expense): Interest expense (4,109) (2,481) (2,101)Loss from unconsolidated investments, net (2,934) (2,324) (1,962)Net (loss) gain on transactions (3,404) 23,623 —Other income, net 3,886 4,006 (374)
Total other (expense) income (6,561) 22,824 (4,437)
(Loss) income before income tax provision (94,156) (45,754) (44,980)Income tax provision (1,435) 13,884 3,314
Net (loss) income (92,721) (59,638) (48,294)
Net (loss) income attributable to noncontrolling interest (1,549) 298 1,101
Net (loss) income attributable to controlling interest $ (91,172) $ (59,936) $ (49,395)
See accompanying notes to consolidated financial statements.
* Not covered by the auditor's report
S-90
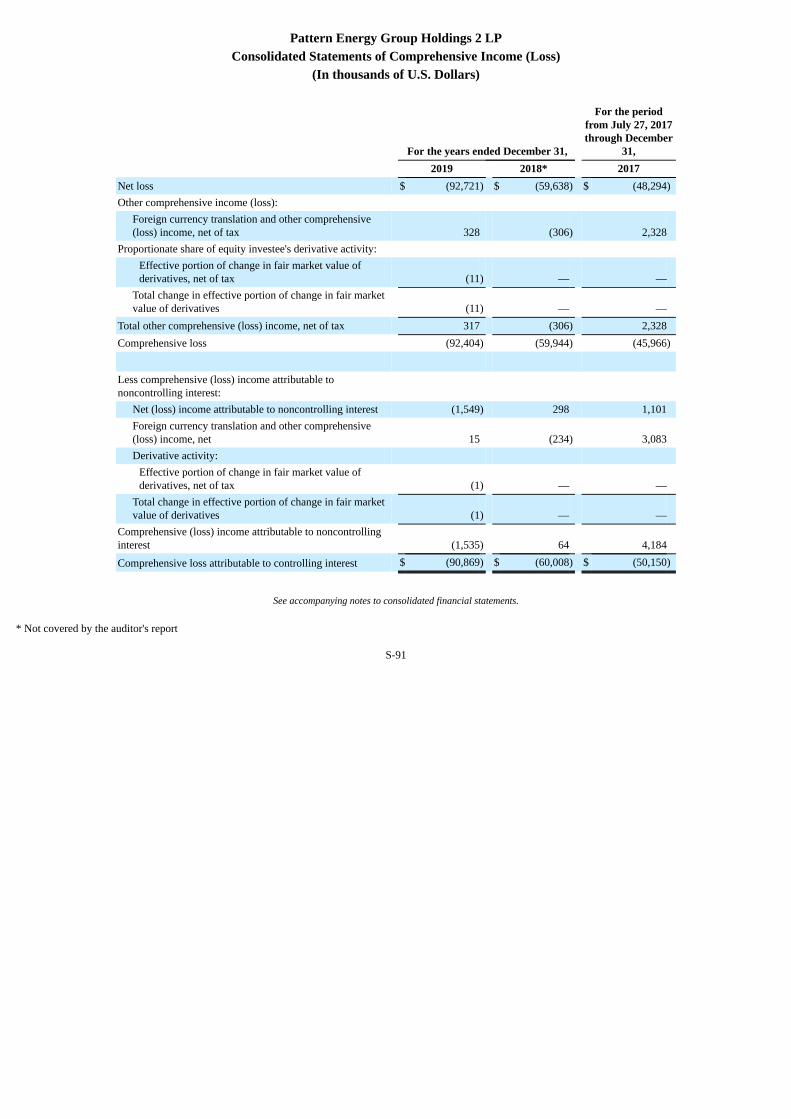
Pattern Energy Group Holdings 2 LPConsolidated Statements of Comprehensive Income (Loss)
(In thousands of U.S. Dollars)
For the years ended December 31,
For the periodfrom July 27, 2017through December
31, 2019 2018* 2017Net loss $ (92,721) $ (59,638) $ (48,294)Other comprehensive income (loss):
Foreign currency translation and other comprehensive(loss) income, net of tax 328 (306) 2,328
Proportionate share of equity investee's derivative activity: Effective portion of change in fair market value ofderivatives, net of tax (11) — —
Total change in effective portion of change in fair marketvalue of derivatives (11) — —
Total other comprehensive (loss) income, net of tax 317 (306) 2,328Comprehensive loss (92,404) (59,944) (45,966)
Less comprehensive (loss) income attributable tononcontrolling interest:
Net (loss) income attributable to noncontrolling interest (1,549) 298 1,101Foreign currency translation and other comprehensive(loss) income, net 15 (234) 3,083Derivative activity:
Effective portion of change in fair market value ofderivatives, net of tax (1) — —
Total change in effective portion of change in fair marketvalue of derivatives (1) — —
Comprehensive (loss) income attributable to noncontrollinginterest (1,535) 64 4,184
Comprehensive loss attributable to controlling interest $ (90,869) $ (60,008) $ (50,150)
See accompanying notes to consolidated financial statements.
* Not covered by the auditor's report
S-91
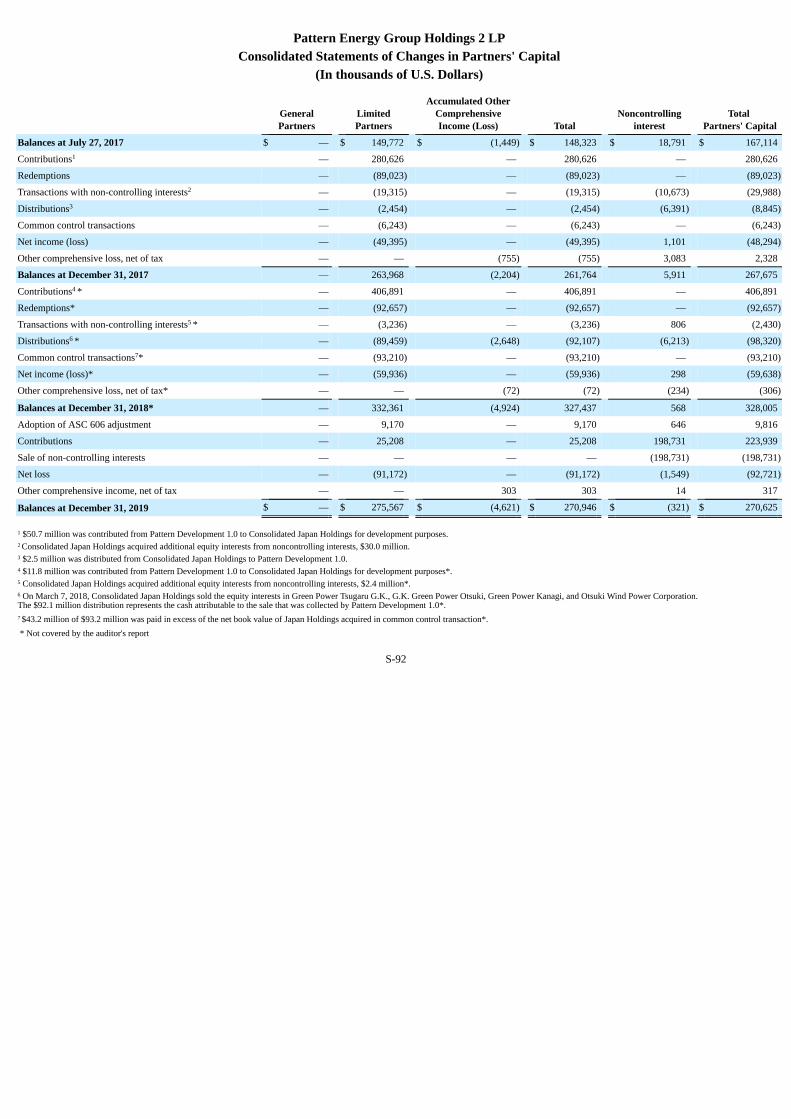
Pattern Energy Group Holdings 2 LPConsolidated Statements of Changes in Partners' Capital
(In thousands of U.S. Dollars)
GeneralPartners
LimitedPartners
Accumulated OtherComprehensiveIncome (Loss) Total
Noncontrollinginterest
Total Partners' Capital
Balances at July 27, 2017 $ — $ 149,772 $ (1,449) $ 148,323 $ 18,791 $ 167,114
Contributions1 — 280,626 — 280,626 — 280,626
Redemptions — (89,023) — (89,023) — (89,023)
Transactions with non-controlling interests2 — (19,315) — (19,315) (10,673) (29,988)
Distributions3 — (2,454) — (2,454) (6,391) (8,845)
Common control transactions — (6,243) — (6,243) — (6,243)
Net income (loss) — (49,395) — (49,395) 1,101 (48,294)
Other comprehensive loss, net of tax — — (755) (755) 3,083 2,328
Balances at December 31, 2017 — 263,968 (2,204) 261,764 5,911 267,675
Contributions4 * — 406,891 — 406,891 — 406,891
Redemptions* — (92,657) — (92,657) — (92,657)
Transactions with non-controlling interests5 * — (3,236) — (3,236) 806 (2,430)
Distributions6 * — (89,459) (2,648) (92,107) (6,213) (98,320)
Common control transactions7* — (93,210) — (93,210) — (93,210)
Net income (loss)* — (59,936) — (59,936) 298 (59,638)
Other comprehensive loss, net of tax* — — (72) (72) (234) (306)
Balances at December 31, 2018* — 332,361 (4,924) 327,437 568 328,005
Adoption of ASC 606 adjustment — 9,170 — 9,170 646 9,816
Contributions — 25,208 — 25,208 198,731 223,939
Sale of non-controlling interests — — — — (198,731) (198,731)
Net loss — (91,172) — (91,172) (1,549) (92,721)
Other comprehensive income, net of tax — — 303 303 14 317
Balances at December 31, 2019 $ — $ 275,567 $ (4,621) $ 270,946 $ (321) $ 270,625
1 $50.7 million was contributed from Pattern Development 1.0 to Consolidated Japan Holdings for development purposes.2 Consolidated Japan Holdings acquired additional equity interests from noncontrolling interests, $30.0 million.3 $2.5 million was distributed from Consolidated Japan Holdings to Pattern Development 1.0.4 $11.8 million was contributed from Pattern Development 1.0 to Consolidated Japan Holdings for development purposes*.5 Consolidated Japan Holdings acquired additional equity interests from noncontrolling interests, $2.4 million*.6 On March 7, 2018, Consolidated Japan Holdings sold the equity interests in Green Power Tsugaru G.K., G.K. Green Power Otsuki, Green Power Kanagi, and Otsuki Wind Power Corporation. The $92.1 million distribution represents the cash attributable to the sale that was collected by Pattern Development 1.0*.7 $43.2 million of $93.2 million was paid in excess of the net book value of Japan Holdings acquired in common control transaction*. * Not covered by the auditor's report
S-92

See accompanying notes to consolidated financial statements.
S-93
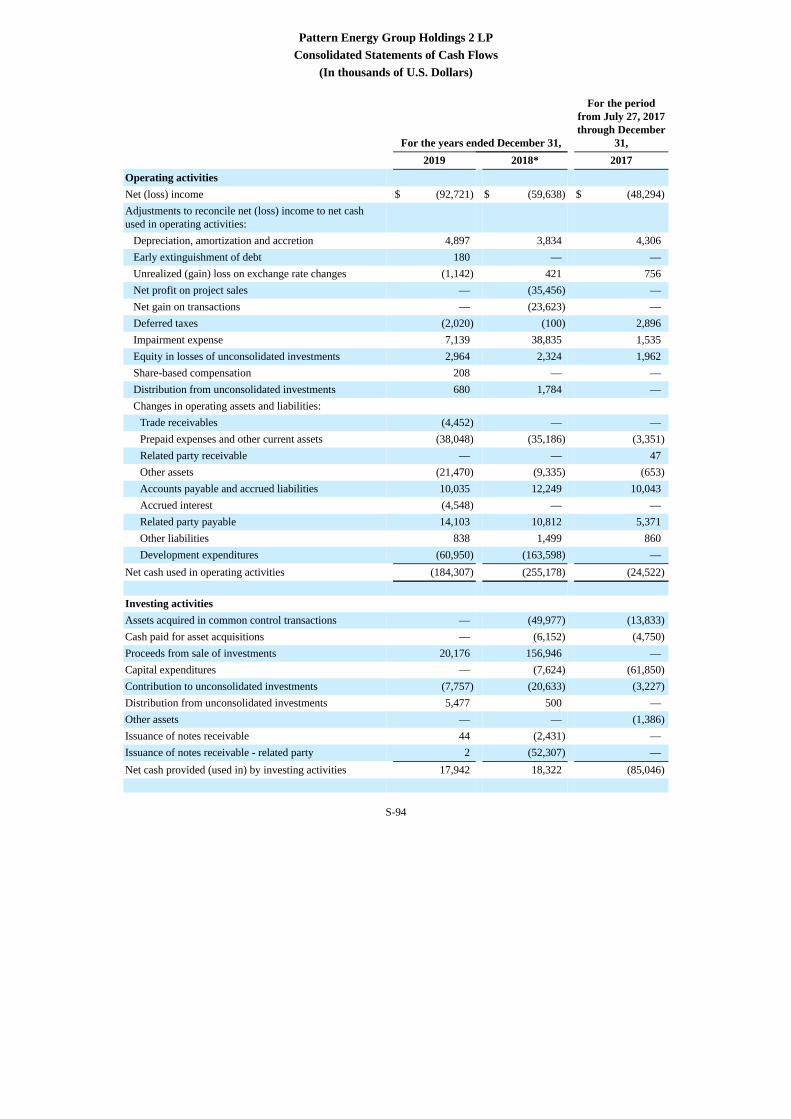
Pattern Energy Group Holdings 2 LPConsolidated Statements of Cash Flows
(In thousands of U.S. Dollars)
For the years ended December 31,
For the periodfrom July 27, 2017through December
31, 2019 2018* 2017Operating activities Net (loss) income $ (92,721) $ (59,638) $ (48,294)Adjustments to reconcile net (loss) income to net cashused in operating activities:
Depreciation, amortization and accretion 4,897 3,834 4,306Early extinguishment of debt 180 — —Unrealized (gain) loss on exchange rate changes (1,142) 421 756Net profit on project sales — (35,456) —Net gain on transactions — (23,623) —Deferred taxes (2,020) (100) 2,896Impairment expense 7,139 38,835 1,535Equity in losses of unconsolidated investments 2,964 2,324 1,962Share-based compensation 208 — —Distribution from unconsolidated investments 680 1,784 —Changes in operating assets and liabilities:
Trade receivables (4,452) — —Prepaid expenses and other current assets (38,048) (35,186) (3,351)Related party receivable — — 47Other assets (21,470) (9,335) (653)Accounts payable and accrued liabilities 10,035 12,249 10,043Accrued interest (4,548) — —Related party payable 14,103 10,812 5,371Other liabilities 838 1,499 860Development expenditures (60,950) (163,598) —
Net cash used in operating activities (184,307) (255,178) (24,522) Investing activities Assets acquired in common control transactions — (49,977) (13,833)Cash paid for asset acquisitions — (6,152) (4,750)Proceeds from sale of investments 20,176 156,946 —Capital expenditures — (7,624) (61,850)Contribution to unconsolidated investments (7,757) (20,633) (3,227)Distribution from unconsolidated investments 5,477 500 —Other assets — — (1,386)Issuance of notes receivable 44 (2,431) —Issuance of notes receivable - related party 2 (52,307) —Net cash provided (used in) by investing activities 17,942 18,322 (85,046)
S-94
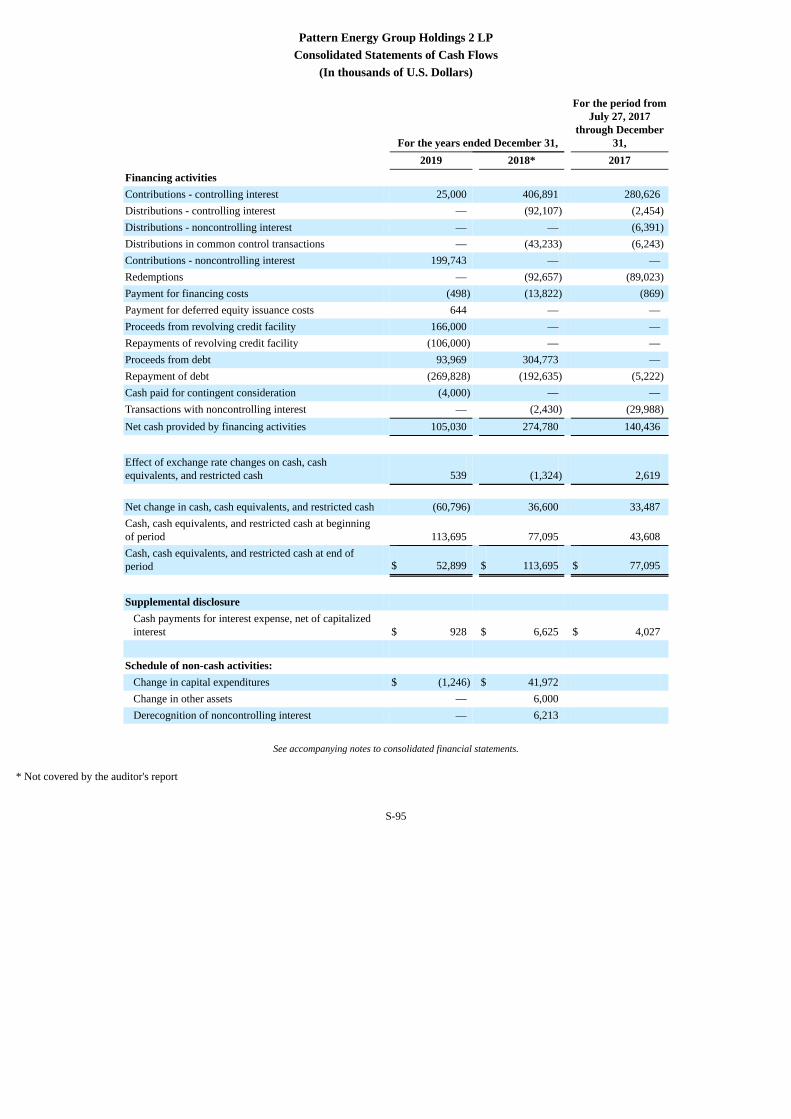
Pattern Energy Group Holdings 2 LPConsolidated Statements of Cash Flows
(In thousands of U.S. Dollars)
For the years ended December 31,
For the period fromJuly 27, 2017
through December31,
2019 2018* 2017Financing activities Contributions - controlling interest 25,000 406,891 280,626Distributions - controlling interest — (92,107) (2,454)Distributions - noncontrolling interest — — (6,391)Distributions in common control transactions — (43,233) (6,243)Contributions - noncontrolling interest 199,743 — —Redemptions — (92,657) (89,023)Payment for financing costs (498) (13,822) (869)Payment for deferred equity issuance costs 644 — —Proceeds from revolving credit facility 166,000 — —Repayments of revolving credit facility (106,000) — —Proceeds from debt 93,969 304,773 —Repayment of debt (269,828) (192,635) (5,222)Cash paid for contingent consideration (4,000) — —Transactions with noncontrolling interest — (2,430) (29,988)Net cash provided by financing activities 105,030 274,780 140,436
Effect of exchange rate changes on cash, cashequivalents, and restricted cash 539 (1,324) 2,619 Net change in cash, cash equivalents, and restricted cash (60,796) 36,600 33,487Cash, cash equivalents, and restricted cash at beginningof period 113,695 77,095 43,608Cash, cash equivalents, and restricted cash at end ofperiod $ 52,899 $ 113,695 $ 77,095
Supplemental disclosure
Cash payments for interest expense, net of capitalizedinterest $ 928 $ 6,625 $ 4,027
Schedule of non-cash activities:
Change in capital expenditures $ (1,246) $ 41,972 Change in other assets — 6,000 Derecognition of noncontrolling interest — 6,213
See accompanying notes to consolidated financial statements.
* Not covered by the auditor's report
S-95
Pattern Energy Group Holdings 2 LPNotes to Financial StatementsFor the years ended December 31, 2019, 2018 (not covered by the auditor's report) and the period from July 27, 2017 through December 31, 2017(In thousands of US Dollars)
1. Organization
On November 10, 2016, Pattern Energy Group Holdings 2 LP ("PEG LP 2") and its subsidiaries (collectively, referred to as "Pattern Development 2.0", "we", "our", or the"Partnership") were formed as a Delaware limited partnership with the purpose, through its consolidated and equity method investees ("Project Entities"), to acquire anddevelop early to mid-stage renewable energy generation and electrical transmission assets for the purpose of further developing them for eventual sale.
On June 16, 2017, PEG LP 2’s General Partner executed the Second Amended and Restated Agreement of Limited Partnership of Pattern Energy Group Holdings 2 LP(“Capital and Redemption Agreement”) with R/C Wind II LP ("Riverstone"), Pattern Energy Group Holdings LP ("PEGH"), Management (together with PEGH, the"Existing LPs") and new investors, Riverstone Pattern Energy II Holdings LP (“Riverstone II”) and Pattern Energy Group, Inc. (“PEGI”).
PEG LP 2 has secured commitments for capital calls from its investors for up to $1.0 billion. As of December 31, 2019, PEG LP 2 has called a total of $650 million whichwere used to redeem the Existing LP units including all of PEGH’s investment, purchase Project Entities and to provide working capital for development activities.
Business
The Partnership is a developer of early to mid-stage renewable energy generation and electrical transmission projects in North America and Japan. The Partnership acquiresprojects and further develops them for sale once development is complete. The Partnership currently has some projects that are in the construction phase. The Partnershipgenerally intends to sell its projects under construction prior to or when they reach commercial operation as the Partnership's business is not to hold projects during theiroperational phase.
On December 8, 2016, PEG LP 2 entered into a contribution agreement with PEGH. PEGH, through its wholly owned subsidiary, Pattern Energy Group LP, renamed asPattern Energy Group One LP, (“Pattern Development 1.0”), contributed all of its equity interests in certain development subsidiaries to Pattern Development 2.0 inexchange for partnership interests in the Partnership (the “Contribution”). In June 2017, Pattern Development 1.0 and Pattern Development 2.0 entered into three separateagreements to transfer additional equity interests from Pattern Development 1.0 to the Partnership. PEGH sold equity interests in development subsidiaries in the UnitedStates, Canada, and Mexico (the “Second Contribution”) to the Partnership for $23.5 million.
On February 26, 2018, the Partnership entered into a Purchase and Sale Agreement (“Japan Purchase”) with Pattern Development 1.0 to acquire certain developmentalrenewable energy assets for $93.2 million. The Japan Purchase closed on March 7, 2018.
As a result of the transactions with PEGH, the Partnership’s purchase of Project Entities from third parties, and the Partnership’s formation of greenfield Project Entities,the Partnership has varying interests in approximately 100 Project Entities in various degrees of development as of December 31, 2019.
Liquidity
The Partnership evaluated its ability to continue as a going concern in preparing its consolidated financial statements. For the years ended December 31, 2019, 2018, andthe period from July 27, 2017 and December 31, 2017, the Partnership had operating losses of $87.6 million, $68.6 million, and $40.5 million, respectively, working capitaldeficiencies, and negative operating cash flows from operating activities as of December 31, 2019. Working capital as of December 31, 2019 is negative primarily due toloan maturity, the Revolver, the related party payable (refer to Footnote 10. Revolving Credit Facility, Footnote 11.Debt and Footnote 15. Related Party Transactions) andmaterial commitments related to the development and construction of its renewable energy generation projects. The Partnership does not have sufficient liquid assets tomeet its current debt obligations and related party payable that are due within the following year. As such, the Partnership's management concluded that there is asubstantial doubt about its ability to continue as a going concern. The Partnership’s management plans as described below are intended to mitigate the conditions that raisesubstantial doubt about its ability to continue as a going concern:
• The Partnership has executed agreements with a third party to sell two project entities at construction completion, which is expected to occur in the first half of2020.
S-96
Pattern Energy Group Holdings 2 LPNotes to Financial StatementsFor the years ended December 31, 2019, 2018 (not covered by the auditor's report) and the period from July 27, 2017 through December 31, 2017(In thousands of US Dollars)
• The Partnership has executed agreements with a third party to sell a project entity upon the receipt of the last federal approval, which is expected to occur in thesecond half of 2020.
• On April 11, 2019, the Partnership entered into a $175.0 million revolving credit agreement (Revolver). As of December 31, 2019, the Partnership has drawn$60.0 million. Although the terms of the Revolver are payable on demand, the Partnership's management considers the remaining $115 million a source ofliquidity for the next 12 months after the issuance of these financial statements. To draw on the Partnership's revolving credit facility requires pre-approval ofPEGI.
• In addition, the Partnership may make capital calls to its investors for funding. As of December 31, 2019 the remaining capital commitment is $350 million,subject to a right of refusal.
• On November 3, 2019, PEGI and Canada Pension Plan Investment Board ("CPP Investment") entered into a definitive agreement pursuant to which CPPInvestment will acquire 100% of PEGI's outstanding common share. As part of this transaction, CPP Investments and Riverstone concurrently will be entered intoan agreement pursuant to which, at or following the completion of the transaction, CPP Investments and Riverstone will combine PEGI and PEGH2 LP to createan integrated renewable energy company that both builds and operates power assets. Completion of this transaction is subject to a vote of PEGI’s shareholders andcertain regulatory approvals.
Certain of the Partnership management plans, including the ability to access liquidity through the Partnership's revolving credit facility, and receive cash from capital callsare not within its control. As such, the Partnership concluded that its management plans do not alleviate the principal conditions described above and there is substantialdoubt about the Partnership ability to continue as a going concern.
2. Summary of Significant Accounting Policies
Basis of Presentation and Principles of Consolidation
The accompanying consolidated financial statements have been prepared in accordance with the accounting principles generally accepted in the United States ("U.S.GAAP"). They include the results of wholly-owned and partially-owned subsidiaries in which the Partnership has a controlling interest with all significant intercompanyaccounts and transactions eliminated.
The consolidated financial statements include the accounts of PEG LP 2 and all other entities in which the Partnership has a controlling financial interest, including thosevariable interest entities ("VIEs") where the Partnership is the primary beneficiary. Results of operations of acquired entities are included from the date of acquisition.Results of operations of VIEs are included from the date at which the Partnership became the primary beneficiary.
Reclassifications
Certain prior period balances have been reclassified to conform to the current period presentation in PEG LP 2's consolidated financial statements and the accompanyingnotes.
Asset Acquisitions
When the Partnership acquires assets and liabilities that do not constitute a business or a VIE, the fair value of the purchase consideration, including the transaction costsfor the asset acquisition, is assumed to be equal to the fair value of the net assets acquired. The purchase consideration, including transaction costs, is allocated to theindividual assets and liabilities assumed based on their relative fair values. Contingent consideration associated with the acquisition is generally recognized when thecontingency is resolved and the consideration is paid or becomes payable. No goodwill is recognized in an asset acquisition.
Variable Interest Entities
When the Partnership acquire a controlling interest in an entity that meets the definition of a VIE, but does not meet the definition of a business, the acquisition is accountedfor using the acquisition method, except no goodwill or bargain purchase is recognized. The fair value of the purchase consideration is allocated to the tangible andintangible assets acquired and the liabilities assumed based on their estimated fair values. Contingent consideration, if any exists, is also recognized and measured at fairvalue as of the acquisition date. To the extent that there is difference between the purchase consideration and the VIE's identifiable assets and liabilities recorded andmeasured
S-97
Pattern Energy Group Holdings 2 LPNotes to Financial StatementsFor the years ended December 31, 2019, 2018 (not covered by the auditor's report) and the period from July 27, 2017 through December 31, 2017(In thousands of US Dollars)
at fair value, the difference is recognized as a gain or loss. Transaction costs associated with the acquisition of a VIE are expensed as incurred.
In the normal course of its business, the Partnership has 100% of the ownership interests in Project Entities that have been determined to be VIEs because the ProjectEntities lack sufficient equity at risk to develop, construct, and operate the respective projects. The Partnership is the primary beneficiary since is has the power to direct theactivities that most significantly impact the VIE’s economic performance and exposure to the economics of the Project Entities through its obligation to fund thedevelopment of the project. When a Project Entity begins construction and obtains construction financing, the Project Entity is generally determined to no longer be a VIEbecause the entity has demonstrated that it has sufficient equity at risk to finance the construction without additional subordinated financial support. The Partnership alsoenter into joint venture agreements with third parties to develop and construct projects. The Partnership is generally have a variable interest in these entities and anobligation to co-develop the project. Prior to construction financing these entities are usually VIEs, but the Partnership is generally not the primary beneficiary.
Equity Method Investments
The Partnership recognizes its interests in Project Entities in which it has significant influence over, but does not control, as equity method investments. The Partnershipdoes not control these Project Entities as it has development partners with significant equity interests in these Project Entities, and such partners hold substantive rights toparticipate in the significant activities of the Project Entities. The Partnership records its initial investment in these unconsolidated Project Entities at cost. The Partnershipthen increases or decreases the carrying cost of the investment for its share of income or loss from each Project Entity based upon its ownership percentage and recognizescorresponding income or loss in the its consolidated statements of operations. Any cash distributions from an unconsolidated Project Entity are accounted for as an increasein cash and a decrease in the carrying cost of the Partnership's investment.
In the event that cumulative allocated earnings or losses, distributions and other comprehensive income (loss) exceed the carrying balance of the investment, the Partnershipwill suspend the application of the equity method of accounting until such time as each Project Entity’s cumulative equity method earnings and other comprehensiveincome exceed cumulative distributions received, cumulative equity method losses and cumulative other comprehensive income (loss) during the suspension period.
The unconsolidated investments of $29.7 million and $29.3 million as of December 31, 2019 and 2018, respectively, is comprised of investments in eight Project Entitiesand seven Project Entities, respectively, with ownership percentages in these Project Entities varying from 14.9% to 50.0%.
Noncontrolling Interests
Noncontrolling interests represent the portion of the Partnership’s net income (loss), net assets and comprehensive income (loss) that is not allocable to the Partnership andis calculated based on ownership percentage, where applicable.
Use of Estimates
The preparation of consolidated financial statements in conformity with U.S. GAAP requires management to make estimates and assumptions that affect the reportedamounts of assets and liabilities, disclosures of contingent assets and liabilities at the date of the consolidated financial statements and the reported amounts of expensesduring the reporting period. Actual results could differ from those estimates and such differences may be material to the consolidated financial statements. Significant itemssubject to such estimates and assumptions include the useful lives of fixed assets and recoverability of long-lived assets.
Fair Value Measurements
The Partnership’s fair value measurements incorporate various factors, including the credit standing and performance risk of the counterparties, the applicable exit marketand specific risks inherent in the instrument. Nonperformance and credit risk adjustments on risk management instruments are based on either (i) actual market data or (ii)assumptions that other market participants would use in pricing and asset or liability, including estimates or risk. When such information is not available, internal modelsmay be used. (Refer to Footnote 12. Fair Value Measurements).
S-98

Pattern Energy Group Holdings 2 LPNotes to Financial StatementsFor the years ended December 31, 2019, 2018 (not covered by the auditor's report) and the period from July 27, 2017 through December 31, 2017(In thousands of US Dollars)
Assets and liabilities recorded at fair value in the consolidated financial statements are categorized based upon the level of judgment associated with the inputs used tomeasure their fair value. Hierarchical levels directly related to the amount of subjectivity associated with the inputs to valuation of these assets or liabilities are as follows:
Level 1 - Inputs are unadjusted, quoted prices in active markets for identical assets or liabilities at the measurement date.
Level 2 - Inputs (other than quoted prices included in Level 1) are either directly or indirectly observable for the asset or liability through correlation with market data at themeasurement date and for the duration of the instrument’s anticipated life.
Level 3 - Unobservable inputs that are supported by little or no market activity and that are significant to the fair value of the assets or liabilities and which reflectmanagement’s best estimate of what market participants would use in pricing the asset or liability at the measurement date. Consideration is given to the risk inherent in thevaluations technique and the risk inherent in the inputs to the model.
Cash, Cash Equivalents and Restricted Cash
Cash and cash equivalents consist of all cash balances and highly-liquid investments with original maturities of three months or less.
Restricted cash consists of cash balances which are restricted as to withdrawal or usage and includes cash held in reserves required under the Partnership’s letter of credit("LC") agreements.
Reconciliation of Cash, Cash Equivalents, and Restricted Cash as presented on the Consolidated Statements of Cash Flows
The following table provides a reconciliation of cash, cash equivalents, and restricted cash reported within the consolidated balance sheets that sum to the total of the samesuch amounts shown in the consolidated statements of cash flows as of December 31 (in thousands):
2019 2018 2017
Cash and cash equivalents at end of period $ 29,095 $ 61,712 $ 53,504Restricted cash - current — — 2,451Restricted cash 23,804 51,983 21,140Cash, cash equivalents and restricted cash shown in the consolidated statements ofcash flows $ 52,899 $ 113,695 $ 77,095
Major Equipment Advances
Major equipment advances represent amounts advanced to suppliers for the manufacture of wind turbines and solar panels in accordance with component equipment supplyagreements and for which the Partnership has not taken title. These advances are reclassified to construction in progress when the Partnership takes legal title of theequipment.
Deferred Development Costs and Construction in Progress
The Partnership expenses all project development costs until a project is determined to be technically feasible and likely to achieve commercial success. When the project isdeemed feasible, project development costs are recorded as deferred developments costs. Deferred development costs represent the accumulated cost of initial permitting,environmental reviews, land rights and obligations, and preliminary design and engineering work.
Upon commencement of construction, all construction costs along with applicable previously deferred development costs are recorded as a component of construction inprogress. Construction in progress represents the accumulation of project development costs and construction costs, including costs incurred for the purchase of majorequipment, such as turbines and modules for which the Partnership has taken legal title, civil engineering, electrical, and other related costs. Construction in progress isreclassified to property, plant and equipment when the project achieves commercial operation.
S-99
Pattern Energy Group Holdings 2 LPNotes to Financial StatementsFor the years ended December 31, 2019, 2018 (not covered by the auditor's report) and the period from July 27, 2017 through December 31, 2017(In thousands of US Dollars)
Capitalization of Other Costs
The Partnership capitalizes certain employee compensation and other indirect costs ("indirect costs") associated with development and construction projects. Indirect costsare capitalized based on time estimates spent on each project when the project is determined to be probable or technically feasible and likely to achieve commercial success.
The Partnership capitalizes interest and related financing fees related to the debt used to finance projects in construction. Capitalization is discontinued when the projectachieves commercial operation.
Property, Plant and Equipment
Property, plant and equipment represents the costs of completed and operational projects as well as land, computer software, and other equipment. Property, plant andequipment are stated at cost, less accumulated depreciation. Depreciation is calculated using the straight-line method over the respective assets’ useful lives. Land is notdepreciated. Improvements to property, plant and equipment deemed to extend the useful economic life of an asset are capitalized. Repair and maintenance costs areexpensed as incurred.
Intangible Assets
Long-lived intangible assets primarily include land easements, land options, interconnection rights and transmission rights that are stated at cost, less accumulatedamortization. Amortization is calculated using the straight-line method over the respective assets' contract lives. For the years ended December 31, 2019, 2018 and for theperiod from July 27, 2017 through December 31, 2017, the Partnership recorded immaterial amortization expense related to intangible assets in the consolidated statementsof operations. Future amortization expense is not expected to be material. Long-lived intangible assets are included in the other assets in the consolidated balance sheets.
Impairment of Long-Lived Assets
The Partnership periodically evaluates long-lived assets for potential impairment whenever events or changes in circumstances have occurred that indicate that impairmentmay exist, or the carrying amount of the long-lived asset may not be recoverable. An impairment loss is recognized only if the carrying amount of a long-lived asset is notrecoverable based on its estimated future undiscounted cash flows. An impairment loss is calculated based on the excess of the carrying value of the long-lived asset overthe fair value of such long-lived asset, with the fair value determined based on an estimate of discounted future cash flows.
Revenue Recognition
The Partnership has three sources of revenue: sale of completed energy-generating and transmission projects, services from management and administration, and electricitysales from completed projects before its eventual sale.
The Partnership develops and sells renewable energy generation and electrical transmission assets. These assets are developed in Project Entities that hold the land or leasesfor land on which the assets are being developed. Prior to January 1, 2019, the Partnership applied the guidance on sales of real estate in ASC 360-20 to account its sales ofits interest in Project Entities. ASC 606 supersedes ASC 360-20 and amends the scope of the derecognition guidance in ASC 810. Consequently, upon the adoption of ASC606 on January 1, 2019, the Partnership applied ASC 606 to sales of its equity interests in consolidated project entities and ASC 860 to sales of equity method investmentprojects under ASC 860. Under ASC 606, the Partnership recognizes revenue once it has transferred control to the customer. However, to recognize revenue for a sale of aninterest in a consolidated entity, the Partnership must first evaluate whether it has lost control over the entity under ASC 810 Consolidation. That is, the Partnership mustfirst determine that it does not consolidate under ASC 810 before it can evaluate whether control has transferred to a customer under ASC 606. Sales of consolidatedprojects are in scope of ASC 606 and thus presented as revenue with a corresponding cost of sales. Sales of equity method investments are in scope of ASC 860 andpresented net as gains (losses).
The Partnership earns revenue from the Management, Operations and Maintenance Agreements ("MOMAs") and Project Administration Agreements ("PAAs") that it haswith wind farms, which are owned by related parties. These agreements provide persuasive evidence that a contract exists between the Partnership and wind farm owner.Under each MOMA and PAA, the Partnership provides various services to the wind farms typically in exchange for a fixed annual fee, payable in equal monthlyinstallments. The Partnership recognizes revenue for its services as they are rendered each month, based on the amount invoiced each month. The accounting for thePartnership’s service contracts will not differ materially under ASC 606.
S-100
Pattern Energy Group Holdings 2 LPNotes to Financial StatementsFor the years ended December 31, 2019, 2018 (not covered by the auditor's report) and the period from July 27, 2017 through December 31, 2017(In thousands of US Dollars)
The Partnership sells electricity under the terms of Power Sale Agreements ("PSAs"), Power Purchase Agreements ("PPAs") or at market prices. Revenue is recognizedbased upon the amount of electricity delivered at rates specified under the contracts or at market prices, for spot market transactions, assuming all other revenue recognitioncriteria are met. Depending on the terms of the PSAs or PPAs, the Partnership may account for the contracts as operating leases. The Partnership's electricity revenue, forthe year ended 2019, was earned by its Project Entity, Grady Wind Energy Center, LLC, which was sold in the fourth quarter of 2019 to PEGI and the third parties. ThePartnership's electricity revenue, for the year ended 2018, was earned by its Project Entity, Stillwater Wind, LLC, which was sold in the fourth quarter of 2018 to PEGI andunrelated third parties (refer to Footnote 3. Revenue).
Cost of Revenue
The Partnership's cost of revenue for its sale of its interests in Project Entities is the Project Entities' assets. The Project Entities' assets consist of deferred developmentcosts and construction in progress and either the land or lease of land.
The Partnership’s other cost of revenue is comprised of direct costs of operating and maintaining its wind project facilities, including labor, turbine service arrangements,land lease royalties, depreciation, accretion, property taxes and insurance.
Income Taxes
The Partnership is organized as a pass-through entity for U.S. federal and state income tax purposes. Federal and state income taxes are assessed at the owner level and eachowner is liable for its own tax payments. The Partnership is subject to other state-based taxes. Certain entities are corporations or have elected to be taxed as corporations.In these circumstances, income tax is accounted for under the asset and liability method. The Partnership is subject to Canada, Netherlands, Japan, Poland, and Mexicoincome taxes based upon the tax laws and rates in effect in the countries in which operations are conducted.
The asset and liability method require the recognition of deferred tax assets and liabilities for the expected future tax consequences of events that have been included in theconsolidated financial statements. Under this method, deferred tax assets and liabilities are determined on the basis of the differences between the financial statement andtax bases of assets and liabilities using enacted tax rates in effect for the year in which the differences are expected to reverse. The effect of a change in tax rates on deferredtax assets and liabilities is recognized in income in the period that includes the enactment date. The Partnership recognizes deferred tax assets to the extent that it believesthese assets are more likely than not to be realized. In making such a determination, the Partnership considers all available positive and negative evidence, including futurereversals of existing taxable temporary differences, projected future taxable income, tax-planning and results of recent operations. If the Partnership determines that itwould be able to realize its deferred tax assets in the future in excess of their net recorded amount, it would make an adjustment to the deferred tax asset valuationallowance, which would reduce the provision for income taxes.
The Partnership records uncertain tax positions in accordance with ASC 740, Income Taxes, on the basis of a two-step process whereby (1) it determines whether it is morelikely than not that the tax positions will be sustained on the basis of the technical merits of the position and (2) for those tax positions that meet the more likely than notrecognition threshold, it recognizes the largest amount of tax benefit that is more than 50 percent likely to be realized upon ultimate settlement with the related taxauthority. The Partnership has a policy to classify interest and penalties associated with uncertain tax positions together with the related liability and the expenses incurredrelated to such accruals, if any, are included in the provision for income taxes.
Concentration of Credit Risk
Financial instruments that potentially subject the Partnership to concentrations of credit risk consist primarily of cash and cash equivalents, major equipment advances, andtransmission security deposits. The Partnership’s cash and cash equivalents are with high quality institutions. The Partnership has exposure to credit risk to the extent cashand cash equivalent balances, including restricted cash, exceed amounts covered by federal deposit insurance. Exposure to credit risk for major equipment advances andtransmission security deposits are limited by the amount of the deposit. Major equipment advances are with large creditworthy companies and transmission securitydeposits are held with public utilities. The Partnership believes that its credit risk is immaterial.
As of December 31, 2019 and 2018, the Partnership recorded a deposit of $58.9 million and $49.2 million, respectively, for transmission security deposits to public utilitiescompanies and $24.3 million and $147.6 million, respectively, in major equipment advances to major turbine suppliers.
S-101

Pattern Energy Group Holdings 2 LPNotes to Financial StatementsFor the years ended December 31, 2019, 2018 (not covered by the auditor's report) and the period from July 27, 2017 through December 31, 2017(In thousands of US Dollars)
Foreign Currency Translation
The assets and liabilities of foreign subsidiaries, where the local currency is the functional currency, are translated from their respective functional currencies into U.S.dollars (“USD”) at the rates in effect at the consolidated balance sheets date and revenue and expense amounts are translated at average rates during the period, with theresulting foreign currency translation adjustments recorded in other comprehensive income (loss), net of tax, in the consolidated statements of changes in partners’ capitaland comprehensive income (loss). Where the USD is the functional currency, re-measurement adjustments are recorded in other (expense) income, net in the accompanyingconsolidated statements of operations.
Recently Adopted Accounting Standards
On January 1, 2019, the Partnership was required to adopt ASC 606, Revenue from Contracts with Customers (“ASC 606”) and ASC 340-40, Other Assets and DeferredCosts - Contracts with Customers (“ASC 340-40” and collectively with ASC 606, “the new standards”). The new standards apply to the Partnership’s contracts with itscustomers. This includes the Partnership’s service contracts (e.g. management, operation and maintenance agreements, project administration agreements, etc.) andcontracts to sell its interests in its consolidated project entities. The Partnership’s sales of its interests in projects that are accounted for as equity method investmentshowever, are accounted for under ASC 860, Transfers and Servicing (“ASC 860”) upon the adoption of the standards. The Partnership adopted the new standards using amodified retrospective approach. Under this adoption approach, the date of initial application is January 1, 2019. That is, January 1, 2019 is the start of the reporting periodin which the Partnership first applies the new standards. Under the modified retrospective approach, any contracts (1) that are not complete (as defined in ASC 606) as ofthe date of initial application and (2) for which the accounting would be impacted by the adoption of the new standards, must be restated under US GAAP as amended bythe new standards. In restating these contracts, the Partnership is required to apply US GAAP, as amended by the new standards, to the contracts from their inception. Toreflect the amount of revenue and/or costs that the Partnership would have recognized in prior periods had the new standards always been effective, the Partnership made acumulated adjustment to its January 1, 2019 retained earnings.
In February 2016, the FASB issued ASU 2016-02, Leases, along with subsequent amendments issued thereafter (collectively, “ASC 842”) which will supersede ASC 840,Leases (“ASC 840”). Under ASC 842, lessees are required to recognize right-of-use (“ROU”) assets and lease liabilities on the balance sheet, for all leases, with theexception of short-term leases, at the commencement date of each lease. ASC 842 is effective for private business entities beginning in January 1, 2020. Early adoption ispermitted, and the Partnership decided to adopt ASC 842 as of January 1, 2019 using a modified retrospective method and did not restate comparative periods. The impactof the adoption was not material and resulted in the initial recognition of $1.9 million of ROU assets and $1.1 million of lease liabilities for operating leases primarilyrelated to corporate offices and land leases in Japan. There was no cumulative-effect adjustment for the adoption and the adoption did not have a significant effect on thePartnership's consolidated statements of operations. The Partnership elected the practical expedient related to land easements, allowing the Partnership to carry forward itsaccounting treatment for land easements on certain existing agreements as its intangible assets. The Partnership elected to not separate lease and non-lease components andinstead treats them as a single lease component. The Partnership also elected to not record short-term leases with an initial term of 12 months or less on its consolidatedbalance sheets. Since the Partnership did not elect the package of practical expedients to carry forward historical lease classification, the Partnership reassessed its PPAs andland arrangements and determined that all PPAs and the majority of land arrangements were not accounted for as leases under ASC 842. The Partnership further reassessedthe PPAs under ASC 815, Derivatives and Hedging (ASC 815) and ASC 606, Revenue from Contracts with Customers (ASC 606) and determined all PPAs previouslyaccounted for under the previous U.S. GAAP leasing standard, ASC 840, Leases (ASC 840) should be accounted for under ASC 606. The reassessment of the PPAs did nothave a material impact to the Partnership's consolidated financial statements.
Recently Issued Accounting Standards not yet Adopted
In October 2018, the FASB issued ASU 2018-17, Consolidation (Topic 810): Targeted Improvements to Related Party Guidance for Variable Interest Entities ("ASU 2018-17"). ASU 2018-17 requires reporting entities to consider indirect interests held through related parties under common control on a proportional basis rather than as theequivalent of a direct interest in its entirety for determining whether a decision-making fee is a variable interest. The standard is effective for all entities for financialstatements issued for fiscal years beginning after December 15, 2019, and interim periods within those fiscal years. Early adoption is permitted. Entities are required toapply the amendments in ASU 2018-17 retrospectively with a cumulative-effect adjustment to retained earnings at the beginning of the earliest period presented. ThePartnership is currently evaluating this guidance to determine the impact it may have on its consolidated financial statements.
S-102

Pattern Energy Group Holdings 2 LPNotes to Financial StatementsFor the years ended December 31, 2019, 2018 (not covered by the auditor's report) and the period from July 27, 2017 through December 31, 2017(In thousands of US Dollars)
In August 2018, the FASB issued ASU 2018-13, Changes to the Disclosure Requirements for Fair Value Measurement ("ASU 2018-13"), which amends changes inunrealized gains and losses, the range and weighted average of significant unobservable inputs used to develop Level 3 fair value measurements, and the narrativedescription of measurement uncertainty which should be applied prospectively for only the most recent interim or annual period presented in the initial fiscal year ofadoption. ASU 2018-13 is effective for annual periods beginning after December 15, 2019, including interim periods within those periods. Early application is permitted.The Partnership is currently assessing the impact of changes to the disclosure requirements for fair value measurement.
In June 2016, the FASB issued ASU 2016-13, Financial Instruments —Credit Losses (Topic 326): Measurement of Credit Losses on Financial Instruments ("ASU 2016-13"), which requires the measurement of all expected credit losses for financial assets including trade receivables held at the reporting date based on historical experience,current conditions, and reasonable and supportable forecasts. In November 2018, the FASB issued ASU 2018-19, Codification Improvements to Topic 326, FinancialInstruments - Credit Losses, for the purposes of clarifying certain aspects of ASU 2016-13. In April 2019, the FASB issued ASU 2019-04, Codification Improvements toTopic 326, Financial Instruments - Credit Losses, Topic 815, Derivatives and Hedging, and Topic 825, Financial Instruments (ASU 2019-04), which clarifies the treatmentof certain credit losses. In May 2019, the FASB issued ASU 2019-05, Financial Instruments - Credit Losses (Topic 326): Targeted Transition Relief (ASU 2019-05), whichprovides an option to irrevocably elect to measure certain individual financial assets at fair value instead of amortized cost. In November 2019, the FASB issued ASU2019-11, Codification Improvements to Topic 326, Financial Instruments - Credit Losses (ASU 2019-11), which provides guidance around how to report expectedrecoveries. ASU 2016-13, ASU 2018-19, ASU 2019-04, ASU 2019-05 and ASU 2019-11 are effective for fiscal years, and interim periods within those fiscal years,beginning after December 15, 2019. The adoption is not expected to have a material impact on the Partnership's consolidated financial statements and related disclosures.
In December 2019, the FASB issued ASU No 2019-12, Income Taxes (Topic 740): Simplifying the Accounting for Income Taxes ("ASU 2019-12"). ASU 2019-12 removescertain exceptions to the general principles in Topic 740. ASU 2019-12 is effective for fiscal years beginning after December 15, 2020, with early adoption permitted. ThePartnership is currently evaluating this guidance to determine the impact it may have on its consolidated financial statements.
3. Revenue
The Partnership has three sources of revenue: electricity sales from completed projects before its eventual sale, sale of completed energy-generating and transmissionprojects, and services from management and administration.
Sale of Japan Entities in 2018
On March 7, 2018, the Partnership completed a sale to PEGI of its equity interest in four projects in Japan (Tsugaru, Otsuki, Kanagi, and G.K. Green Power Otsuki) for atotal sales price of $99.1 million. According to terms of the sales, the agreement included a deferred purchase price of $9.9 million (1.1 billion JPY) which is receivableupon the term conversion of the construction loan at the Tsugaru project, and to the extent such term conversion does not occur, a second consideration payment will bemade upon the commencement of commercial operations which is expected to occur in 2020. As a result of the adoption of ASC 606, the Partnership recognized the $9.9million (1.1 billion JPY) as an adjustment to the January 1, 2019 retained earnings and against a contract asset in the consolidated balance sheets. As of December 31, 2019,the deferred purchase price of $10.5 million is included in a contract asset in the consolidated balance sheets.
Sale of Stillwater
On November 20, 2018, the Partnership sold 100% of its interest in the Project Entity of Stillwater Wind LLC and its holding companies (together, "Stillwater") to PEGIand an unrelated third parties for an aggregate purchase price of $117.8 million .
Sale of Project Entity in Mexico
In November of 2018, the Partnership sold its interests in a Project Entity in Mexico. The revenue was not recognized for the sale as the Partnership accounted for the saleunder the deposit method because it has a significant receivable from the Project Entity in Mexico. Under the deposit method, the Partnership recognized the considerationreceived as a deposit liability and did not de-recognize its investment in the Project Entity in Mexico. However, the Partnership wrote down the Project Entity in Mexico bythe amount of the loss recognized and reclassified the Project Entity in Mexico to held for sale. The carrying amount of the Project Entity in Mexico is $2.2 million, whichis recorded in assets held for sale in other assets (refer to Footnote 7. Assets Held for Sale).
S-103

Pattern Energy Group Holdings 2 LPNotes to Financial StatementsFor the years ended December 31, 2019, 2018 (not covered by the auditor's report) and the period from July 27, 2017 through December 31, 2017(In thousands of US Dollars)
Sale of Willow Creek
On June 26, 2019, the Partnership sold 100% of its interest in Willow Creek, an early stage development project, to a third party for an aggregate purchase price of $41.5million, of which $7.9 million is contingent upon the project achieving certain future milestones. As of December 31, 2019, the Partnership recognized the $7.9 millionvariable revenue on the consolidated statements of operation and recorded the $3.2 million in a contract asset in the consolidated balance sheets.
Sale of Grady
On October 10, 2019, the Partnership sold 100% of its interest in the Project Entity of Grady Wind Energy Center, LLC and its holding companies (together, "Grady") toPEGI and a third party for an aggregate purchase price of $195.1 million.
4. Acquisitions
The Partnership enters into agreements to purchase renewable energy assets in early to mid-stage development (the "Projects"). The Partnership further develops theProjects in its Project Entities typically with the intent to sell its interest in the Project Entities once the Partnership has completed development and, in some circumstances,construction of the Projects. From time to time, the Partnership may hold the Projects during their operational periods. The purchase agreements usually require an initialpayment and contingent payments based on the Projects reaching certain milestones. For the years ended December 31, 2019 and 2018 and for the period from July 27,2017 through December 31, 2017, the Partnership paid $25.1 million, $6.2 million, $4.8 million respectively, in initial and milestone payments for the acquisitions of theProjects other than for the Japan Purchase.
El Corazon
In the fourth quarter of 2019, the Partnership acquired 100% interests in El Corazon from an unrelated third party. The Partnership paid $20.1 million for wind turbines, and$5.0 million in membership interests. Acquired turbines were capitalized as construction in progress in the consolidated balance sheets. The transaction was determined tobe an asset acquisition and an early stage development project.
Acquisition of Pattern Development Japan Power Holdings LLC
On March 7, 2018, the Partnership acquired 100% of the membership interests in Pattern Development Japan Power Holdings LLC ("Japan Holdings") from PatternDevelopment 1.0 for a total cash consideration of $93.2 million. The Japan Purchase is considered a transaction between entities under common control, and a change inreporting entity.
Japan Holdings holds 93.42% of the equity interests in Green Power Investment Corporation ("GPI") and 100% of the equity interests in Pattern Development Japan G.K.("PDJ"). GPI and PDJ are in the business of developing and operating renewable energy projects in Japan. Through the acquisition the Partnership acquired: a developmentpipeline in Japan; a development contract to develop Tsugaru; a minority interest in Futtsu; and management agreements for Ohorayama, Kanagi, and Otsuki, operatingrenewable energy projects owned by PEGI.
5. Notes Receivable, Related Party
In November 2018, the Partnership entered into funding agreements ("Notes") with two of its equity method investments in Mexico. The Notes accrue interest at an annualrate of 8.6%. As of December 31, 2019, the accrued interest amounts were $5.1 million and recognized as distributions from unconsolidated investments on theconsolidated balance sheets. The Notes are expected to be repaid upon completion of construction, which is expected to occur in the first half of 2020. The Notes areconvertible into equity at the option of the Partnership and other investor at a fixed conversion rate.
S-104

Pattern Energy Group Holdings 2 LPNotes to Financial StatementsFor the years ended December 31, 2019, 2018 (not covered by the auditor's report) and the period from July 27, 2017 through December 31, 2017(In thousands of US Dollars)
6. Property, Plant and Equipment
The following table presents the categories within property, plant and equipment, and accumulated depreciation as of December 31 (in thousands):
2019 2018 Depreciable Life
(Years)
Operating wind and solar farms $ 877 $ 752 20 - 30Development equipment 8,856 6,454 2 - 10Computer software 83 82 3Computer equipment 427 361 2 - 5Furniture 584 273 2 - 5Leasehold improvements 717
647
Shorter of theirestimated useful
lives or theremaining term of
the lease.Land 7,677 1,807 N/AOther 69 67 2 - 5 19,290 10,443 Less: accumulated depreciation (4,154) (3,624)
Property, plant and equipment, net $ 15,136 $ 6,819
The Partnership recorded depreciation expense in the consolidated statements of operations related to property, plant and equipment of $3.0 million, $1.1 million, and $3.5million for the years ended December 31, 2019 and 2018 and for the period from July 27, 2017 through December 31, 2017, respectively.
7. Assets Held for Sale
In August 2018, the Partnership, through one of its subsidiaries, executed a Memorandum of Understanding ("MOU") with Pattern Gulf Wind Holdings, LLC ("Gulf"), a100% owned indirect subsidiary of PEGI. The MOU provided Gulf with the option to purchase turbines from the Partnership's subsidiary. In September 2018, Gulfexercised its option to purchase turbines. Pursuant to the MOU, the Partnership had the right to determine the number of turbines it will sell to Gulf. Since the MOUrequired that the Partnership sell a minimum up to a maximum number of turbines to Gulf, the Partnership determined that as of December 31, 2018, the minimum numberof turbines meet the criteria for held for sale.
Upon determining that the turbines were held for sale in 2018, the Partnership was required to record the turbines at the lower of their carrying amount or their fair valueless cost to sell and thus recorded a loss of $5.9 million for the year ended 2018. The loss was recorded in impairment expense in the consolidated statements of operations.The turbines were classified as held for sale and recorded in other assets on the consolidated balance sheets. The liabilities that were expected to transfer to Gulf as part ofthe sale of the turbines were classified as part of held for sale. As of December 31, 2018, the carrying amount of the turbines classified as held for sale was $9.4 million andthe carrying amount of the liabilities classified as held for sale was $1.8 million. In December of 2019, the Partnership completed the sale of turbines to PEGI for theminimum number of turbines.
On November 15, 2018, the Partnership sold its interests in a Project Entity in Mexico. The sale is accounted for under deposit accounting (refer to Footnote 4.Acquisitions). As such, the Partnership did not de-recognize its investment in the Project Entity in Mexico. The Partnership reclassified the carrying amount of the ProjectEntity in Mexico, after recording the loss on sale, of $2.2 million to assets held for sale. On January 1, 2019, the Partnership recognized this sale, as a result of the adoptionof ASC 606, under ASC 860.
8. Impairment of Long-lived Assets Held and Used
S-105

Pattern Energy Group Holdings 2 LPNotes to Financial StatementsFor the years ended December 31, 2019, 2018 (not covered by the auditor's report) and the period from July 27, 2017 through December 31, 2017(In thousands of US Dollars)
On March 19, 2019, the Partnership received an Order on Preliminary Injunction limiting any further on-the-ground construction, road modifications, or physical on-sitemodifications for one of its Project Entities. This Project Entity had assets of $7.1 million. Management evaluated whether there is an impairment in the first quarter of2019 and recorded $7.1 million in impairment expense based on the cost approach.
In 2018, the Partnership recorded an impairment of $29.3 million related to wind turbine equipment held for development projects. A review of the Partnership'sdevelopment projects requiring the wind turbine equipment triggered an assessment of the recoverability of the wind turbine equipment. The Partnership determined thatthe carrying value of the wind turbine equipment is not fully recoverable through deployment at its development projects and that the fair value of the wind turbineequipment is less than the carrying value by $29.3 million based on the market approach.
9. Variable Interest Entities
Consolidated Variable Interest Entities
The Partnership has Project Entities in North America and Japan in the development stage and construction stage. The Partnership consolidates Project Entities when it hasa controlling financial interest in them. The Partnership consolidates Project Entities that are not VIEs when it holds the majority of the voting rights and there are nosubstantive participating or kick-out rights held by other parties. The Partnership consolidates Project Entities that are VIEs when it has the characteristics of a primarybeneficiary and there are no participating or kick-out rights held by others that would prevent the Partnership from controlling the Project Entity.
Project Entities are generally VIEs during the development stage as they do not have sufficient equity at risk to finance their operations without additional subordinatesupport from the Partnership. Once the Project Entities have obtained third party financing for construction of the project, the Partnership reconsiders whether the ProjectEntity is a VIE and whether it is the primary beneficiary.
As a result of the Contribution and the Second Contribution, the Partnership became the direct and indirect parent of four Project Entity structures that are subject to aprofit-sharing arrangement under an X/Y share structure. The X shares have 100% of the voting interests and will receive 10% of the distributions after the Partnership hasbeen returned all of its invested capital. The Y shares are non-voting and have no obligations to fund capital into the projects. The Project Entities are in the developmentstage, are VIEs and the Partnership has been determined to be the primary beneficiary.
The following presents the carrying amounts of the consolidated VIEs’ assets and liabilities included in the consolidated balance sheets as of December 31 (in thousands).Assets presented below are restricted for settlement of the consolidated VIEs’ obligations and all liabilities presented below can only be settled using the VIE’s resources.
S-106

Pattern Energy Group Holdings 2 LPNotes to Financial StatementsFor the years ended December 31, 2019, 2018 (not covered by the auditor's report) and the period from July 27, 2017 through December 31, 2017(In thousands of US Dollars)
2019 2018
Assets Cash and cash equivalents $ 2,119 $ 7,852Notes receivable 2,510 2,243Major equipment advances 6,849 124,816Deferred development costs — 5,089Construction in progress 20,070 60,468Property, plant and equipment, net 7,993 2,749Deposits 14,784 25,947Other assets 12,133 27,134
Total assets $ 66,458 $ 256,298
Liabilities Accounts payable and accrued liabilities $ 16,750 $ 34,131Debt, net 39,427 211,907Related party payable 8,856 169Other liabilities 1,890 9,212
Total liabilities $ 66,923 $ 255,419
Unconsolidated Variable Interest Entities
The Partnership has formed Project Entities with third parties to develop certain projects. The Partnership and third party are both equity investors in these Project Entities.These Project Entities are VIEs. Since the Partnership does not have a controlling financial interest in these Project Entities, it does not consolidate them. The Partnershipaccounts for its interests in these Project Entities under the equity method of accounting (Refer to Footnote 2. Summary of Significant Accounting Policies).
As of December 31, 2019 and 2018, the Partnership’s maximum exposure to loss is estimated at $29.7 million and $29.3 million, respectively, which represents the carryingvalue of its investments in unconsolidated VIEs. The maximum exposure to loss represents the maximum loss that the Partnership could be required to recognize assumingall the investees’ assets are worthless, without consideration of the probability of a loss or any actions the Partnership may take to mitigate any such loss.
10. Revolving Credit Facility
On April 11, 2019, the Partnership entered into a $175.0 million Revolver. As of December 31, 2019, the Partnership has drawn $60.0 million. The terms of the Revolverare payable on demand. Additional draws require the consent of PEGI. Loans, when and if drawn, accrue interest at 2.9% plus the London Interbank Offered Rate (LIBOR)per annum. The revolving credit facility contains additional quarterly administrative fees of 0.025% on the $175.0 million max amount. In addition, the Revolver providesLCs for the Partnership of up to $75.0 million of which the $61.3 million has been issued. The LCs are subject to quarterly fees of 2.9% per annum.
As of and for the year ended December 31, 2019, no event or condition which constitutes an event of default.
11. Debt
The Partnership’s debt is presented below as of December 31 (in thousands):
S-107
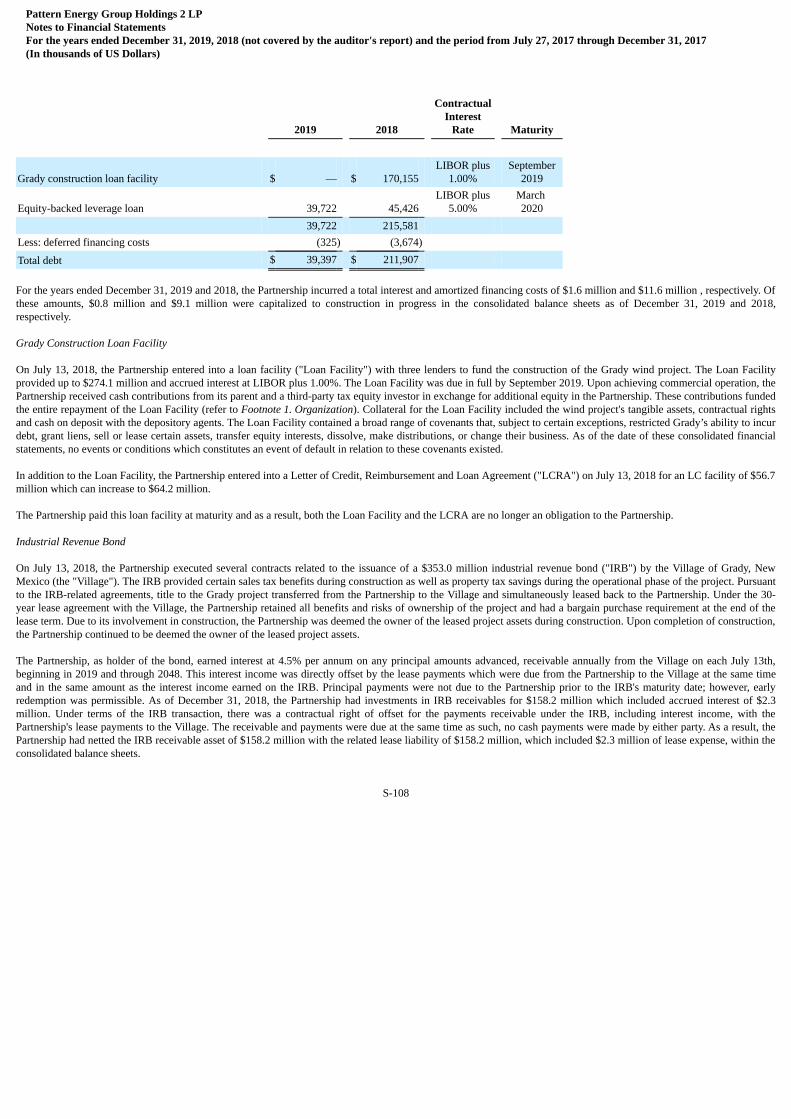
Pattern Energy Group Holdings 2 LPNotes to Financial StatementsFor the years ended December 31, 2019, 2018 (not covered by the auditor's report) and the period from July 27, 2017 through December 31, 2017(In thousands of US Dollars)
2019 2018
ContractualInterest
Rate Maturity
Grady construction loan facility $ — $ 170,155 LIBOR plus
1.00% September
2019
Equity-backed leverage loan 39,722 45,426 LIBOR plus
5.00% March 2020
39,722 215,581 Less: deferred financing costs (325) (3,674)
Total debt $ 39,397 $ 211,907
For the years ended December 31, 2019 and 2018, the Partnership incurred a total interest and amortized financing costs of $1.6 million and $11.6 million , respectively. Ofthese amounts, $0.8 million and $9.1 million were capitalized to construction in progress in the consolidated balance sheets as of December 31, 2019 and 2018,respectively.
Grady Construction Loan Facility
On July 13, 2018, the Partnership entered into a loan facility ("Loan Facility") with three lenders to fund the construction of the Grady wind project. The Loan Facilityprovided up to $274.1 million and accrued interest at LIBOR plus 1.00%. The Loan Facility was due in full by September 2019. Upon achieving commercial operation, thePartnership received cash contributions from its parent and a third-party tax equity investor in exchange for additional equity in the Partnership. These contributions fundedthe entire repayment of the Loan Facility (refer to Footnote 1. Organization). Collateral for the Loan Facility included the wind project's tangible assets, contractual rightsand cash on deposit with the depository agents. The Loan Facility contained a broad range of covenants that, subject to certain exceptions, restricted Grady’s ability to incurdebt, grant liens, sell or lease certain assets, transfer equity interests, dissolve, make distributions, or change their business. As of the date of these consolidated financialstatements, no events or conditions which constitutes an event of default in relation to these covenants existed.
In addition to the Loan Facility, the Partnership entered into a Letter of Credit, Reimbursement and Loan Agreement ("LCRA") on July 13, 2018 for an LC facility of $56.7million which can increase to $64.2 million.
The Partnership paid this loan facility at maturity and as a result, both the Loan Facility and the LCRA are no longer an obligation to the Partnership.
Industrial Revenue Bond
On July 13, 2018, the Partnership executed several contracts related to the issuance of a $353.0 million industrial revenue bond ("IRB") by the Village of Grady, NewMexico (the "Village"). The IRB provided certain sales tax benefits during construction as well as property tax savings during the operational phase of the project. Pursuantto the IRB-related agreements, title to the Grady project transferred from the Partnership to the Village and simultaneously leased back to the Partnership. Under the 30-year lease agreement with the Village, the Partnership retained all benefits and risks of ownership of the project and had a bargain purchase requirement at the end of thelease term. Due to its involvement in construction, the Partnership was deemed the owner of the leased project assets during construction. Upon completion of construction,the Partnership continued to be deemed the owner of the leased project assets.
The Partnership, as holder of the bond, earned interest at 4.5% per annum on any principal amounts advanced, receivable annually from the Village on each July 13th,beginning in 2019 and through 2048. This interest income was directly offset by the lease payments which were due from the Partnership to the Village at the same timeand in the same amount as the interest income earned on the IRB. Principal payments were not due to the Partnership prior to the IRB's maturity date; however, earlyredemption was permissible. As of December 31, 2018, the Partnership had investments in IRB receivables for $158.2 million which included accrued interest of $2.3million. Under terms of the IRB transaction, there was a contractual right of offset for the payments receivable under the IRB, including interest income, with thePartnership's lease payments to the Village. The receivable and payments were due at the same time as such, no cash payments were made by either party. As a result, thePartnership had netted the IRB receivable asset of $158.2 million with the related lease liability of $158.2 million, which included $2.3 million of lease expense, within theconsolidated balance sheets.
S-108

Pattern Energy Group Holdings 2 LPNotes to Financial StatementsFor the years ended December 31, 2019, 2018 (not covered by the auditor's report) and the period from July 27, 2017 through December 31, 2017(In thousands of US Dollars)
In addition to the lease expense, the Partnership was committed to pay "Payment In-Lieu of Taxes" ("PILOT"), totaling to $7.4 million for a portion of the avoided propertytaxes, which were payable annually to various municipalities in New Mexico until year 2045.
As a result of the sale of Grady in the fourth quarter of 2019, the IRB was no longer an obligation to the Partnership (refer to Footnote 3. Revenue).
Equity-backed Leverage Loan
On December 26, 2018, the Partnership entered into an equity-backed leverage loan ("EBL") of $48.8 million secured by its equity interests in two projects in Mexico. TheEBL matures the earlier of the date the Partnership sells its equity interests in the projects or March of 2020. The EBL accrues interest at LIBOR plus 5.0%.
12. Fair Value Measurements
The carrying value of financial instruments approximates their fair value based on the nature of their short maturity, and these instruments are presented in the Partnership'sconsolidated financial statements at carrying cost as Level 1. The fair values of cash and cash equivalents and restricted cash are classified as Level 1 in the fair valuehierarchy.
The carrying value of debt is presented on the consolidated balance sheets, net of financing costs, discounts and premiums, which approximates the fair value of thevariable interest rate debt. These debt fair values are Level 3 measurements because they are estimated based on the Partnership's incremental borrowing rates. (Refer toFootnote 2. Summary of Significant Accounting Policies).
The Partnership had financial liabilities which require fair value measurement on a recurring basis are classified within the fair value hierarchy as of December 31, 2018 asfollows (in thousands):
2018
Level 1 Level 2 Level 3 TotalLiabilities Contingent liabilities $ — $ — $ 3,344 $ 3,344
$ — — $ — — $ 3,344 — $ 3,344
As of December 31, 2019, the Partnership has no financial liabilities which require fair value measurement on a recurring basis.
Level 3 Measurements
The fair value of contingent liabilities is related to Grady in 2018, as represented in other liabilities on the consolidated balance sheets. The fair value is measured bydiscounting the net cash flows using a discount rate representing an estimate of cost of debt to determine the present value. The significant primary unobservable input usedfor these assessments is the discount rate. Significant increases or decreases in this unobservable input would result in a significantly lower or higher fair valuemeasurement.
As a result of the sale of Grady in the fourth quarter of 2019, these contingencies were no longer an obligation to the Partnership (refer to Footnote 3. Revenue).
Nonrecurring Fair Value Measurements
Certain nonfinancial assets and liabilities are measured at fair value on a nonrecurring basis and are subject to fair value adjustments in certain circumstances, such as whenthere is evidence of impairment.
The Partnership periodically evaluates the carrying value of long-lived assets to be held and used when events or circumstances warrant such a review. Fair value isdetermined primarily using anticipated cash flows assumed by a market participant discounted at a rate commensurate with the risk involved. For the years endedDecember 31, 2019 and 2018 and the period from July 27, 2017 through
S-109
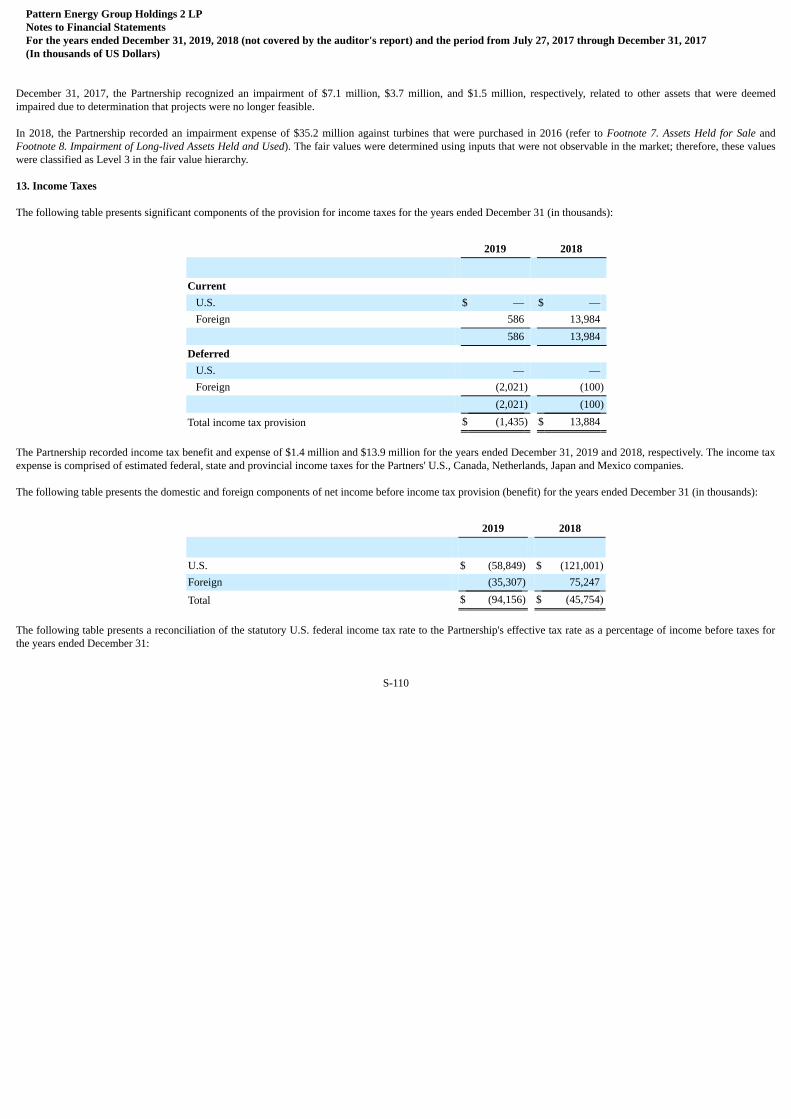
Pattern Energy Group Holdings 2 LPNotes to Financial StatementsFor the years ended December 31, 2019, 2018 (not covered by the auditor's report) and the period from July 27, 2017 through December 31, 2017(In thousands of US Dollars)
December 31, 2017, the Partnership recognized an impairment of $7.1 million, $3.7 million, and $1.5 million, respectively, related to other assets that were deemedimpaired due to determination that projects were no longer feasible.
In 2018, the Partnership recorded an impairment expense of $35.2 million against turbines that were purchased in 2016 (refer to Footnote 7. Assets Held for Sale andFootnote 8. Impairment of Long-lived Assets Held and Used). The fair values were determined using inputs that were not observable in the market; therefore, these valueswere classified as Level 3 in the fair value hierarchy.
13. Income Taxes
The following table presents significant components of the provision for income taxes for the years ended December 31 (in thousands):
2019 2018
Current U.S. $ — $ —Foreign 586 13,984
586 13,984Deferred
U.S. — —Foreign (2,021) (100)
(2,021) (100)
Total income tax provision $ (1,435) $ 13,884
The Partnership recorded income tax benefit and expense of $1.4 million and $13.9 million for the years ended December 31, 2019 and 2018, respectively. The income taxexpense is comprised of estimated federal, state and provincial income taxes for the Partners' U.S., Canada, Netherlands, Japan and Mexico companies.
The following table presents the domestic and foreign components of net income before income tax provision (benefit) for the years ended December 31 (in thousands):
2019 2018
U.S. $ (58,849) $ (121,001)Foreign (35,307) 75,247
Total $ (94,156) $ (45,754)
The following table presents a reconciliation of the statutory U.S. federal income tax rate to the Partnership's effective tax rate as a percentage of income before taxes forthe years ended December 31:
S-110
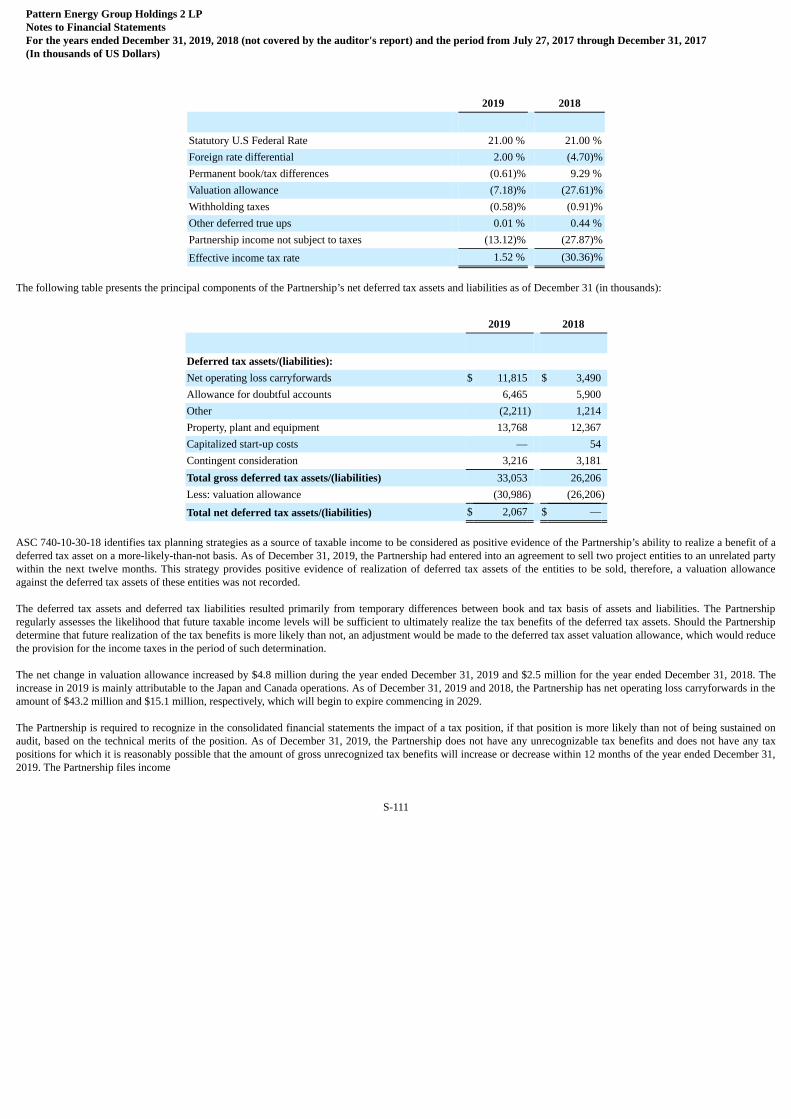
Pattern Energy Group Holdings 2 LPNotes to Financial StatementsFor the years ended December 31, 2019, 2018 (not covered by the auditor's report) and the period from July 27, 2017 through December 31, 2017(In thousands of US Dollars)
2019 2018
Statutory U.S Federal Rate 21.00 % 21.00 %Foreign rate differential 2.00 % (4.70)%Permanent book/tax differences (0.61)% 9.29 %Valuation allowance (7.18)% (27.61)%Withholding taxes (0.58)% (0.91)%Other deferred true ups 0.01 % 0.44 %Partnership income not subject to taxes (13.12)% (27.87)%
Effective income tax rate 1.52 % (30.36)%
The following table presents the principal components of the Partnership’s net deferred tax assets and liabilities as of December 31 (in thousands):
2019 2018
Deferred tax assets/(liabilities): Net operating loss carryforwards $ 11,815 $ 3,490Allowance for doubtful accounts 6,465 5,900Other (2,211) 1,214Property, plant and equipment 13,768 12,367Capitalized start-up costs — 54Contingent consideration 3,216 3,181Total gross deferred tax assets/(liabilities) 33,053 26,206Less: valuation allowance (30,986) (26,206)
Total net deferred tax assets/(liabilities) $ 2,067 $ —
ASC 740-10-30-18 identifies tax planning strategies as a source of taxable income to be considered as positive evidence of the Partnership’s ability to realize a benefit of adeferred tax asset on a more-likely-than-not basis. As of December 31, 2019, the Partnership had entered into an agreement to sell two project entities to an unrelated partywithin the next twelve months. This strategy provides positive evidence of realization of deferred tax assets of the entities to be sold, therefore, a valuation allowanceagainst the deferred tax assets of these entities was not recorded.
The deferred tax assets and deferred tax liabilities resulted primarily from temporary differences between book and tax basis of assets and liabilities. The Partnershipregularly assesses the likelihood that future taxable income levels will be sufficient to ultimately realize the tax benefits of the deferred tax assets. Should the Partnershipdetermine that future realization of the tax benefits is more likely than not, an adjustment would be made to the deferred tax asset valuation allowance, which would reducethe provision for the income taxes in the period of such determination.
The net change in valuation allowance increased by $4.8 million during the year ended December 31, 2019 and $2.5 million for the year ended December 31, 2018. Theincrease in 2019 is mainly attributable to the Japan and Canada operations. As of December 31, 2019 and 2018, the Partnership has net operating loss carryforwards in theamount of $43.2 million and $15.1 million, respectively, which will begin to expire commencing in 2029.
The Partnership is required to recognize in the consolidated financial statements the impact of a tax position, if that position is more likely than not of being sustained onaudit, based on the technical merits of the position. As of December 31, 2019, the Partnership does not have any unrecognizable tax benefits and does not have any taxpositions for which it is reasonably possible that the amount of gross unrecognized tax benefits will increase or decrease within 12 months of the year ended December 31,2019. The Partnership files income
S-111

Pattern Energy Group Holdings 2 LPNotes to Financial StatementsFor the years ended December 31, 2019, 2018 (not covered by the auditor's report) and the period from July 27, 2017 through December 31, 2017(In thousands of US Dollars)
tax returns in the U.S. federal and state jurisdictions, and various foreign jurisdictions. The Partnership's U.S. and foreign income tax returns for 2015 and forward aresubject to examination.
The Partnership has a policy to classify accrued interest and penalties associated with uncertain tax positions together with the related liability, and the expenses incurredrelated to such accruals are included in the provision for income taxes. The Partnership did not incur any interest expense or penalties associated with unrecognized taxbenefits during the year ended December 31, 2019.
14. Commitments and Contingencies
From time to time, the Partnership becomes involved in claims and legal matters arising in the ordinary course of business. Management is not currently aware of anymatters that will have a material adverse effect on the consolidated results of operations or cash flows of the Partnership.
Commitments
The following table summarizes estimates of future commitments related to the various agreements that the Partnership has entered into (in thousands):
2020 2021 2022 2023 2024 Thereafter TotalLand use agreements $ 4,607 $ 4,545 $ 4,081 $ 3,170 $ 1,504 $ 20,136 $ 38,043Other 1,123 1,063 453 98 38 15 2,790
Total Commitments $ 5,730 $ 5,608 $ 4,534 $ 3,268 $ 1,542 $ 20,151 $ 40,833
Construction
The Partnership has open commitments related to construction commitments of $41.8 million and $123.8 million as of December 31, 2019 and 2018, respectively. Of theseamounts, $38.3 million and $97.2 million as of December 31, 2019 and 2018, respectively, are related to wind turbines and solar modules.
Purchase Order Commitments
The Partnership entered into various commitments with service providers related to the Partnership’s Project Entities and operations of its business. Outstandingcommitments with these vendors were $35.1 million and $18.0 million as of December 31, 2019 and 2018, respectively.
Land Use Agreements
Rent expense recorded in the consolidated statements of operations as general and administrative expense was $6.3 million, $5.6 million, and $3.0 million for the yearsended December 31, 2019 and 2018 and for the period from July 27, 2017 through December 31, 2017, respectively.
The Partnership entered into various long-term land agreements for various projects. The land agreements have various terms based on the project's stage of developmentand most of the land agreements are cancellable if the project does not proceed with construction or reach commercial operation. Some land agreements contain provisionsthat require us to purchase the property or part of the property if the projects reach commercial operation. Many of the land agreements have damage clauses that requirethe Partnership to pay for damages caused during its development activities. The land agreements include both fixed minimum and contingent rent based on the Partnershipreaching development milestones and upon reaching commercial operation. If the project reaches commercial operation, the land agreement's contingent rent will generallybe based on total megawatts of electricity produced and delivered to the grid. Contingent rental payments are generally recognized as rent expenses as incurred.
S-112

Pattern Energy Group Holdings 2 LPNotes to Financial StatementsFor the years ended December 31, 2019, 2018 (not covered by the auditor's report) and the period from July 27, 2017 through December 31, 2017(In thousands of US Dollars)
Contingencies
Unrecorded Contingent Consideration
Unrecorded contingent consideration exists in the Partnership's acquisition of Project Entities which are asset acquisitions. The nature of the contingencies may vary bycontract but generally these contingent payments become due and payable upon (i) signing of a PPA, (ii) closing construction financing or (iii) the commercial operationsdate. In addition to achieving these milestones, the contingent consideration liabilities may also be subject to purchase price adjustments, such as the final amount of thePPA price, the name plate capacity or annual energy production level of the project. The amount of unrecorded contingent consideration is estimated to be $188.0 millionand $206.0 million at December 31, 2019 and 2018, respectively.
The Partnership entered into agreements with law firms to engage them as counsel in connection with the development of one or more transmission expansion projects.Pursuant to the agreements, certain billings are only due if ground-breaking and construction financing occurs. As of December 31, 2019, the Partnership has not accruedany future payments under these agreements.
Letters of Credits
During development activities, the Partnership routinely enters into long term agreements, many of which require security deposits to guarantee its performance orcontingent consideration under the agreements. These LCs are recorded on the consolidated balance sheets as of December 31, 2019 and 2018 as $23.8 million and $52.0million in restricted cash, respectively, and $0 million and $7.7 million in related party receivable, respectively. The LCs are generally released when the project beginscommercial operations.
15. Related Party Transactions
Multilateral Service Agreement
The Partnership entered into a Multilateral Management Services Agreement ("MSA") with PEGH and PEGI (collectively, the "Pattern Companies") which provides for thePartnership and the Pattern Companies to benefit, primarily on a cost-reimbursement basis, plus a 5.0% fee on certain direct costs, from the parties' respective managementand other professional, technical and administrative personnel. Pursuant to the MSA, certain of PEGI’s executive officers, including its Chief Executive Officer andexecutive officers of PEGH (collectively, "Shared Pattern Executives"), also serve as executive officers of the Partnership and devote their time to the Partnership and theother Pattern Companies as is prudent in carrying out their executive responsibilities and fiduciary duties. The Shared Pattern Executives have responsibilities for thePartnership, PEGI and PEGH and, as a result, these individuals do not devote all of their time to the Partnership’s business. Under the terms of the MSA, the Partnership isrequired to reimburse the Pattern Companies for an allocation of the compensation paid to such Shared Pattern Executives reflecting the percentage of time spent providingservices to the Partnership. The MSA costs are included in related party general and administrative expenses, as applicable on the consolidated statements of operations.
Other Arrangements with Pattern Companies
The Partnership entered into a purchase rights agreement that provides PEGI the right of first offer with respect to any power project that the Partnership decides to sell aswell as a right of first offer with respect to the Partnership itself.
Pattern Development 2.0 was formed in 2016 as a result of Project Entities contributed by Pattern Development 1.0. Total contributions in assets and cash were $131.6million through year-end 2017. Five of the Project Entities that were contributed to the Partnership have an X/Y equity structure, which is designed to provide residualreturns of PEGH.
In 2018, Pattern Development 2.0 entered into the Japan Purchase to acquire Japanese Project Entities from Pattern Development 1.0, executed development and operatingagreements with PEGI.
As of December 31, 2019, PEGI has contributed approximately $190.0 million to the Partnership giving PEGI approximately 29.0% equity ownership.
S-113
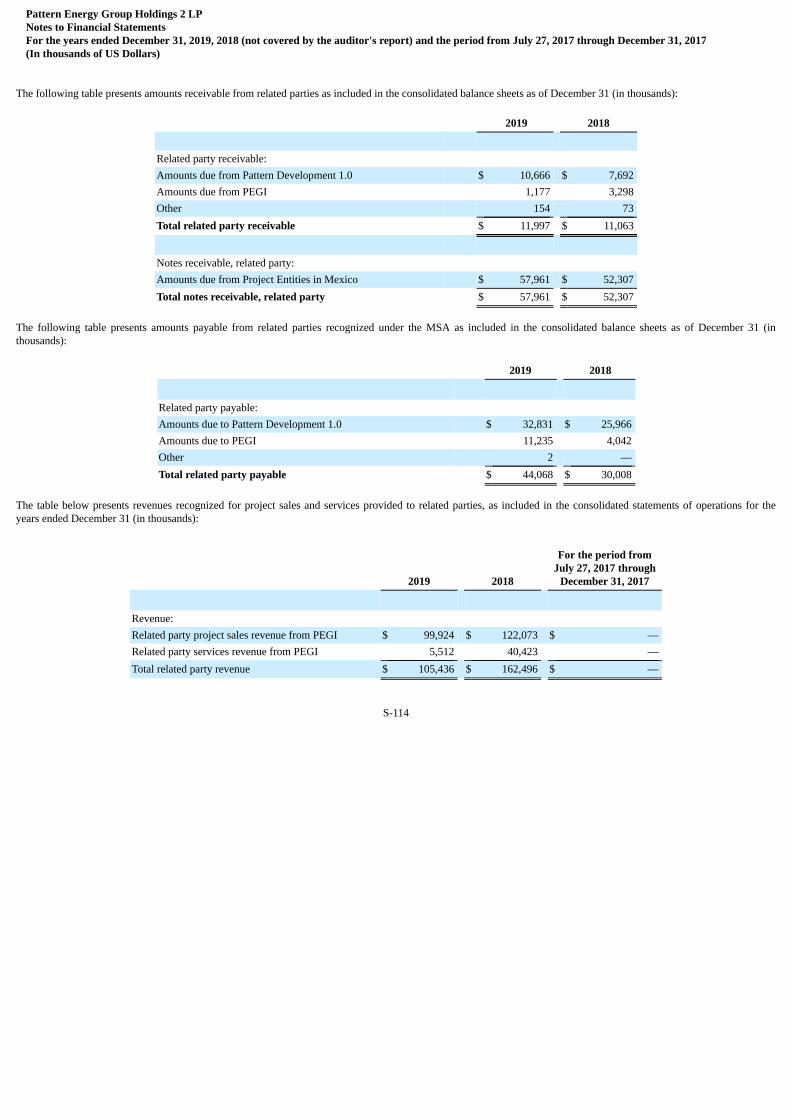
Pattern Energy Group Holdings 2 LPNotes to Financial StatementsFor the years ended December 31, 2019, 2018 (not covered by the auditor's report) and the period from July 27, 2017 through December 31, 2017(In thousands of US Dollars)
The following table presents amounts receivable from related parties as included in the consolidated balance sheets as of December 31 (in thousands):
2019 2018
Related party receivable: Amounts due from Pattern Development 1.0 $ 10,666 $ 7,692Amounts due from PEGI 1,177 3,298Other 154 73Total related party receivable $ 11,997 $ 11,063
Notes receivable, related party: Amounts due from Project Entities in Mexico $ 57,961 $ 52,307Total notes receivable, related party $ 57,961 $ 52,307
The following table presents amounts payable from related parties recognized under the MSA as included in the consolidated balance sheets as of December 31 (inthousands):
2019 2018
Related party payable: Amounts due to Pattern Development 1.0 $ 32,831 $ 25,966Amounts due to PEGI 11,235 4,042Other 2 —Total related party payable $ 44,068 $ 30,008
The table below presents revenues recognized for project sales and services provided to related parties, as included in the consolidated statements of operations for theyears ended December 31 (in thousands):
2019 2018
For the period fromJuly 27, 2017 through
December 31, 2017
Revenue: Related party project sales revenue from PEGI $ 99,924 $ 122,073 $ —Related party services revenue from PEGI 5,512 40,423 —Total related party revenue $ 105,436 $ 162,496 $ —
S-114

Pattern Energy Group Holdings 2 LPNotes to Financial StatementsFor the years ended December 31, 2019, 2018 (not covered by the auditor's report) and the period from July 27, 2017 through December 31, 2017(In thousands of US Dollars)
The table below presents cost of revenue related to project sales and services provided to related parties and expenses recognized for management services under the MSA,as included in the consolidated statements of operations for the years ended December 31 (in thousands):
2019 2018
For the period fromJuly 27, 2017 through
December 31, 2017
Cost of revenue: Related party expense from Pattern Development 1.0 $ — $ — $ —Related party project sales expense from PEGI 68,613 83,692 —Related party services expense from PEGI 2,293 2,187 —Total cost of revenue from related party $ 70,906 $ 85,879 $ —
Operating expenses: Related party expense from Pattern Development 1.0 $ 38,393 $ 36,563 $ 11,892Related party expense from PEGI 7,993 7,370 2,145Capitalized overhead - related party (560) (2,256) —Total operating expenses from related party $ 45,826 $ 41,677 $ 14,037
16. Partnership Capital
Capital Units and Profits Interest Units
The Capital and Redemption Agreement effective July 27, 2017, authorized PEG LP 2 to issue Class A units to the Class A limited partners (the “Class A Partners”) andClass B units to the Class B limited partners (the “Class B Partners”).
Prior to November 1, 2019, PEG LP 2 was authorized to issue additional Class A units at $1.00 per share and admit additional Class A Partners with certain approvals andconditions as indicated in the Capital and Redemption Agreement. PEG LP 2 has secured commitments for capital calls from its investors for up to $1.0 billion. As ofDecember 31, 2019, PEG LP 2 has called a total of $650 million of Class A Units which were used to redeem the Existing LP units including all of PEGH’s investment,purchase Project Entities and to provide working capital for development activities.
PEG LP 2 was authorized to issue up to 1,000,000 Class B units, of which a total of 802,500 Class B units have been issued to Class B Partners as of December 31, 2018.
On November 1, 2019 ("Redesignation Date"), the partners of PEG LP 2 amended and restated the Agreement of Limited Partnership to provide for a redesignation of theClass A units and Class B units as a single class of units. Units formerly designated as Class A units were redesignated as units (Capital) and units formerly designated asClass B units were redesignated as units (Profits Interest). Class A Partners and Class B Partners are now referred to as Capital Partners and Profits Interest Partners,respectively.
PEG LP 2 is authorized to issue additional Units (Capital) at $1.00 per unit and admit additional Capital Partners with certain approvals and conditions as indicated in theamended and restated Capital and Redemption Agreement on the Redesignation Date. PEG LP 2 iss authorized to issue up to 1,000,000 Units (Profit Interest), of which atotal of 835,000 Profit Interest Units were outstanding as of the Redesignation Date.
Distributions and Allocations
Prior to the Redesignation Date, Class A Partners were entitled to receive a Class A Preference Amount, which is equal to an annual pre-tax return of 8.0% compoundedquarterly on all unreturned capital contributions. Similarly, subsequent to the Redesignation Date, Capital Partners are entitled to receive an annual pre-tax return of 8.0%compounded quarterly on all unreturned capital contributions.
S-115

Pattern Energy Group Holdings 2 LPNotes to Financial StatementsFor the years ended December 31, 2019, 2018 (not covered by the auditor's report) and the period from July 27, 2017 through December 31, 2017(In thousands of US Dollars)
Units (Capital) are senior to theUnits (Profit Interest) with respect to distributions. Upon sale or liquidation of the Partnership, distributions would occur in the followingorder:
• First, 100% to the Capital Partners in proportion to their unreturned capital contributions until unreturned capital contributions have been reduced to zero;
• Second, 100% to the Capital Partners in proportion to their unpaid preference amounts until unpaid preference amounts have been reduced to zero;
• Third, 50% to the Capital Partners in proportion to their respective Capital Unit Sharing Percentages and 50% to the Profits Interest Partners in proportion to theirrespective Profits Interest Unit Sharing Percentages, until the Profits Interest Payout occurs; and
• Thereafter, 85% to the Capital Units Partners and 15% to the Profits Interest Partners.
Board of Directors and Voting Rights
The Board of Directors shall consist of not less than five Directors: (a) three of whom shall be appointed by Riverstone II (“Riverstone Delegates”), and (b) two of whomshall be appointed by the Units (Capital) Majority. Each Director shall have one vote; however, Riverstone Delegates may cast more than one vote in certain circumstancesdesigned to always give the Riverstone Delegates three votes.
Noncontrolling interest
The noncontrolling interest in the Partnerships’ Capital represents the noncontrolling interest held in GPI. GPI is a consolidated subsidiary of Japan Holdings, which is100% owned and consolidated by the Partnership. Japan Holdings owns 93.42% of the equity interests in GPI. The noncontrolling interest in the Partnerships’ Capitalrepresents the equity interests in GPI not attributable to Japan Holdings or the Partnership. The noncontrolling interest includes the portion of GPI’s net income (loss), netassets and comprehensive income (loss) that is not allocable to Japan Holdings or the Partnership. Net income (loss) and comprehensive income (loss) is allocated to JapanHoldings and the noncontrolling interests based on their equity ownership percent.
17. Subsequent Events
The Partnership has evaluated subsequent events for recognition through March 2, 2020, which is the date these consolidated financial statements were available to beissued. The Partnership did not have subsequent disclosure events.
S-116
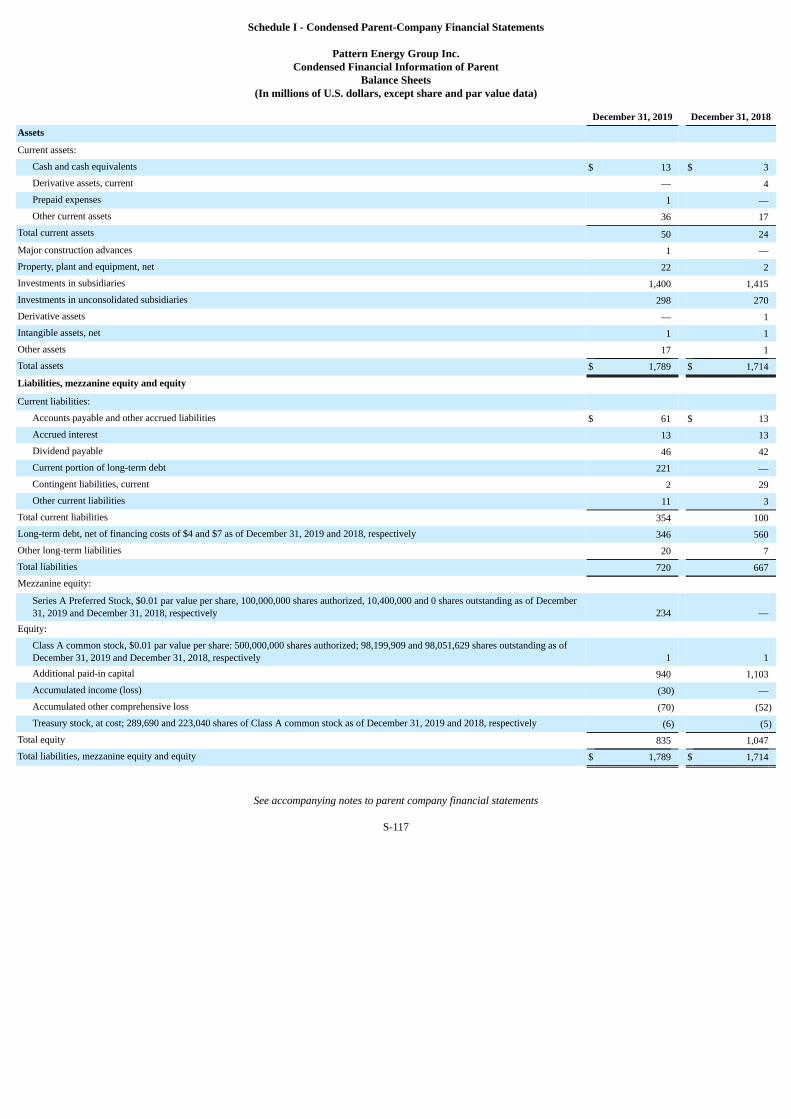
Schedule I - Condensed Parent-Company Financial Statements
Pattern Energy Group Inc.Condensed Financial Information of Parent
Balance Sheets(In millions of U.S. dollars, except share and par value data)
December 31, 2019 December 31, 2018Assets Current assets:
Cash and cash equivalents $ 13 $ 3Derivative assets, current — 4Prepaid expenses 1 —Other current assets 36 17
Total current assets 50 24Major construction advances 1 —Property, plant and equipment, net 22 2Investments in subsidiaries 1,400 1,415Investments in unconsolidated subsidiaries 298 270Derivative assets — 1Intangible assets, net 1 1Other assets 17 1Total assets $ 1,789 $ 1,714
Liabilities, mezzanine equity and equity Current liabilities:
Accounts payable and other accrued liabilities $ 61 $ 13Accrued interest 13 13Dividend payable 46 42Current portion of long-term debt 221 —Contingent liabilities, current 2 29Other current liabilities 11 3
Total current liabilities 354 100Long-term debt, net of financing costs of $4 and $7 as of December 31, 2019 and 2018, respectively 346 560Other long-term liabilities 20 7Total liabilities 720 667Mezzanine equity:
Series A Preferred Stock, $0.01 par value per share, 100,000,000 shares authorized, 10,400,000 and 0 shares outstanding as of December31, 2019 and December 31, 2018, respectively 234 —
Equity: Class A common stock, $0.01 par value per share: 500,000,000 shares authorized; 98,199,909 and 98,051,629 shares outstanding as ofDecember 31, 2019 and December 31, 2018, respectively 1 1Additional paid-in capital 940 1,103Accumulated income (loss) (30) —Accumulated other comprehensive loss (70) (52)Treasury stock, at cost; 289,690 and 223,040 shares of Class A common stock as of December 31, 2019 and 2018, respectively (6) (5)
Total equity 835 1,047Total liabilities, mezzanine equity and equity $ 1,789 $ 1,714
See accompanying notes to parent company financial statements
S-117
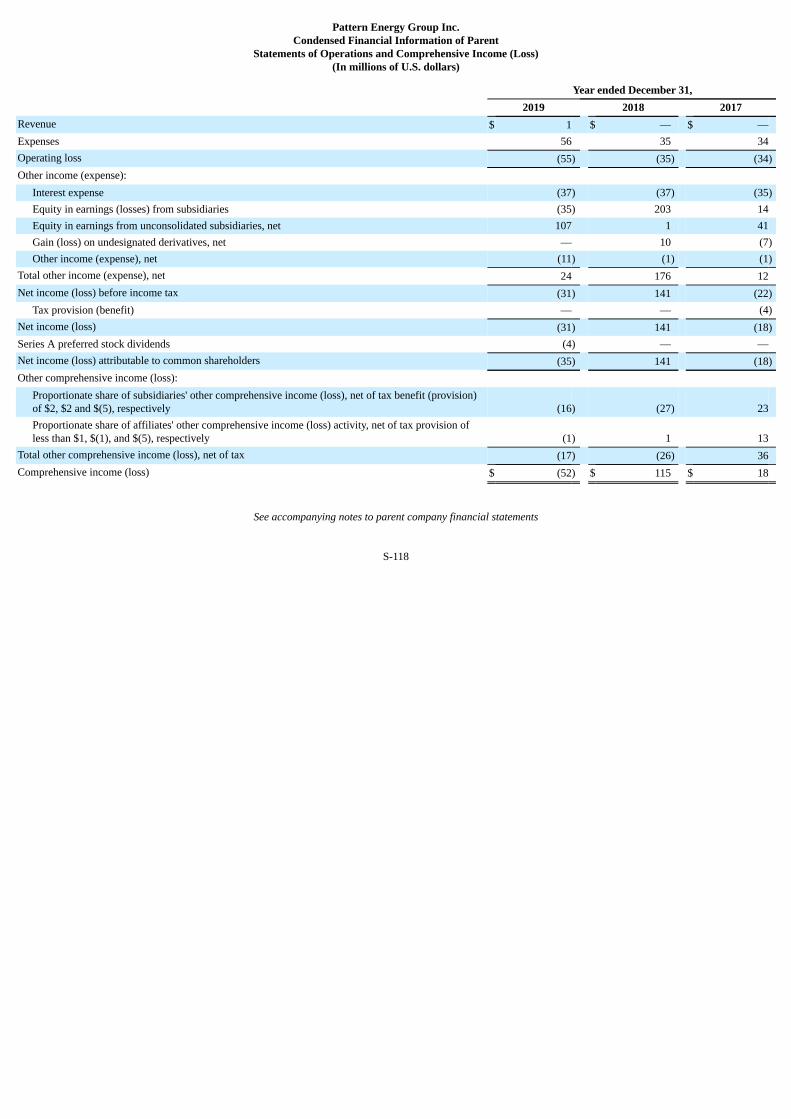
Pattern Energy Group Inc.Condensed Financial Information of Parent
Statements of Operations and Comprehensive Income (Loss)(In millions of U.S. dollars)
Year ended December 31, 2019 2018 2017Revenue $ 1 $ — $ —Expenses 56 35 34Operating loss (55) (35) (34)Other income (expense):
Interest expense (37) (37) (35)Equity in earnings (losses) from subsidiaries (35) 203 14Equity in earnings from unconsolidated subsidiaries, net 107 1 41Gain (loss) on undesignated derivatives, net — 10 (7)Other income (expense), net (11) (1) (1)
Total other income (expense), net 24 176 12Net income (loss) before income tax (31) 141 (22)
Tax provision (benefit) — — (4)Net income (loss) (31) 141 (18)Series A preferred stock dividends (4) — —Net income (loss) attributable to common shareholders (35) 141 (18)Other comprehensive income (loss):
Proportionate share of subsidiaries' other comprehensive income (loss), net of tax benefit (provision)of $2, $2 and $(5), respectively (16) (27) 23Proportionate share of affiliates' other comprehensive income (loss) activity, net of tax provision ofless than $1, $(1), and $(5), respectively (1) 1 13
Total other comprehensive income (loss), net of tax (17) (26) 36Comprehensive income (loss) $ (52) $ 115 $ 18
See accompanying notes to parent company financial statements
S-118
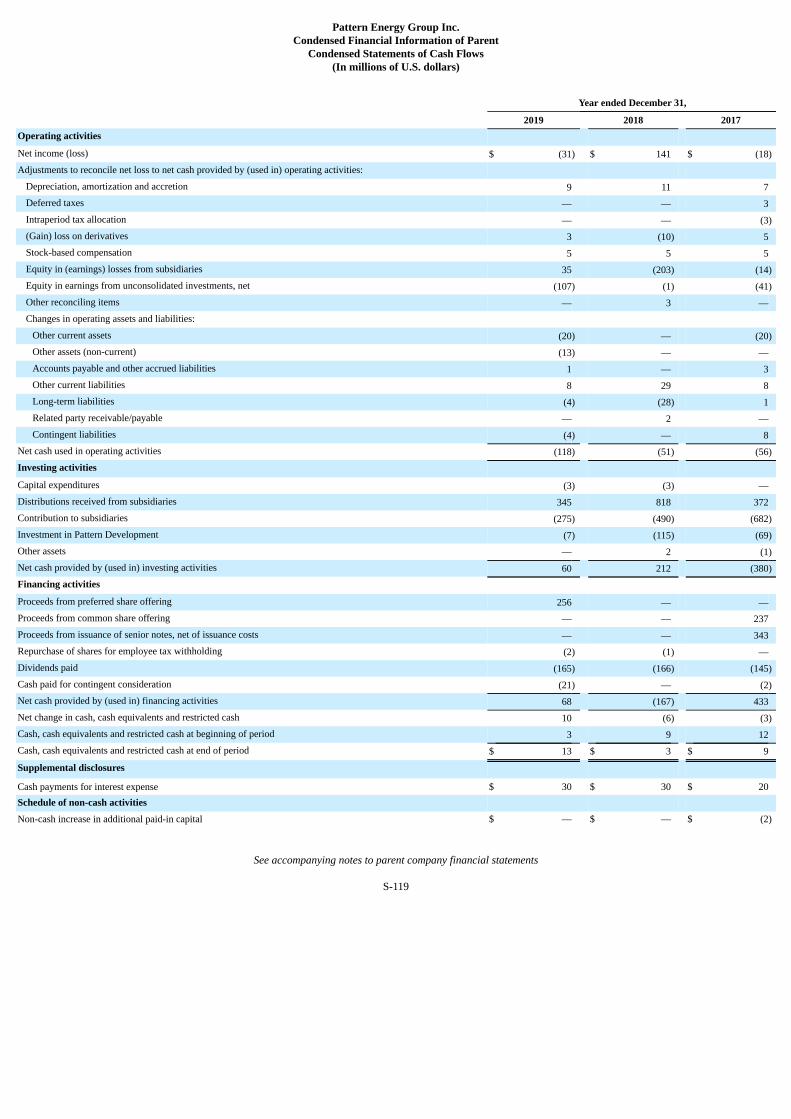
Pattern Energy Group Inc.Condensed Financial Information of Parent
Condensed Statements of Cash Flows(In millions of U.S. dollars)
Year ended December 31,
2019 2018 2017Operating activities Net income (loss) $ (31) $ 141 $ (18)Adjustments to reconcile net loss to net cash provided by (used in) operating activities:
Depreciation, amortization and accretion 9 11 7Deferred taxes — — 3Intraperiod tax allocation — — (3)(Gain) loss on derivatives 3 (10) 5Stock-based compensation 5 5 5Equity in (earnings) losses from subsidiaries 35 (203) (14)Equity in earnings from unconsolidated investments, net (107) (1) (41)Other reconciling items — 3 —Changes in operating assets and liabilities:
Other current assets (20) — (20)Other assets (non-current) (13) — —Accounts payable and other accrued liabilities 1 — 3Other current liabilities 8 29 8Long-term liabilities (4) (28) 1Related party receivable/payable — 2 —Contingent liabilities (4) — 8
Net cash used in operating activities (118) (51) (56)Investing activities Capital expenditures (3) (3) —Distributions received from subsidiaries 345 818 372Contribution to subsidiaries (275) (490) (682)Investment in Pattern Development (7) (115) (69)Other assets — 2 (1)Net cash provided by (used in) investing activities 60 212 (380)Financing activities Proceeds from preferred share offering 256 — —Proceeds from common share offering — — 237Proceeds from issuance of senior notes, net of issuance costs — — 343Repurchase of shares for employee tax withholding (2) (1) —Dividends paid (165) (166) (145)Cash paid for contingent consideration (21) — (2)Net cash provided by (used in) financing activities 68 (167) 433Net change in cash, cash equivalents and restricted cash 10 (6) (3)Cash, cash equivalents and restricted cash at beginning of period 3 9 12Cash, cash equivalents and restricted cash at end of period $ 13 $ 3 $ 9
Supplemental disclosures Cash payments for interest expense $ 30 $ 30 $ 20Schedule of non-cash activities Non-cash increase in additional paid-in capital $ — $ — $ (2)
See accompanying notes to parent company financial statements
S-119
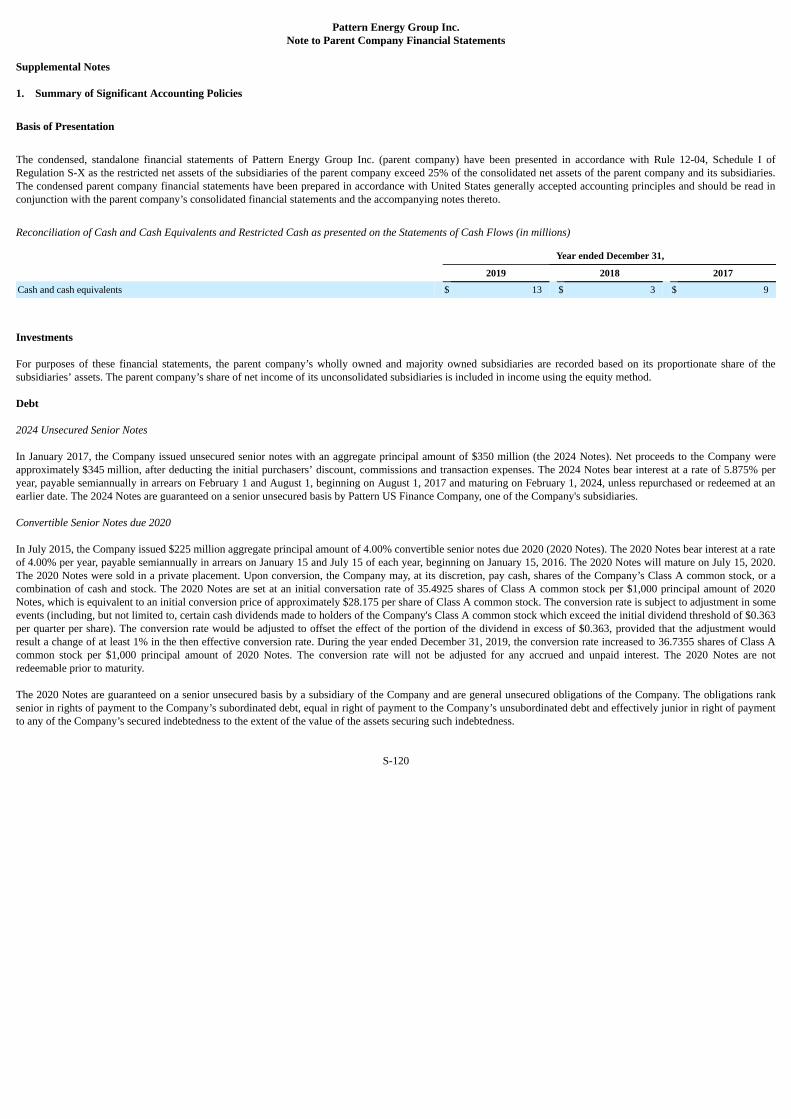
Pattern Energy Group Inc.Note to Parent Company Financial Statements
Supplemental Notes
1. Summary of Significant Accounting Policies
Basis of Presentation
The condensed, standalone financial statements of Pattern Energy Group Inc. (parent company) have been presented in accordance with Rule 12-04, Schedule I ofRegulation S-X as the restricted net assets of the subsidiaries of the parent company exceed 25% of the consolidated net assets of the parent company and its subsidiaries.The condensed parent company financial statements have been prepared in accordance with United States generally accepted accounting principles and should be read inconjunction with the parent company’s consolidated financial statements and the accompanying notes thereto.
Reconciliation of Cash and Cash Equivalents and Restricted Cash as presented on the Statements of Cash Flows (in millions)
Year ended December 31,
2019 2018 2017
Cash and cash equivalents $ 13 $ 3 $ 9
Investments
For purposes of these financial statements, the parent company’s wholly owned and majority owned subsidiaries are recorded based on its proportionate share of thesubsidiaries’ assets. The parent company’s share of net income of its unconsolidated subsidiaries is included in income using the equity method.
Debt
2024 Unsecured Senior Notes
In January 2017, the Company issued unsecured senior notes with an aggregate principal amount of $350 million (the 2024 Notes). Net proceeds to the Company wereapproximately $345 million, after deducting the initial purchasers’ discount, commissions and transaction expenses. The 2024 Notes bear interest at a rate of 5.875% peryear, payable semiannually in arrears on February 1 and August 1, beginning on August 1, 2017 and maturing on February 1, 2024, unless repurchased or redeemed at anearlier date. The 2024 Notes are guaranteed on a senior unsecured basis by Pattern US Finance Company, one of the Company's subsidiaries.
Convertible Senior Notes due 2020
In July 2015, the Company issued $225 million aggregate principal amount of 4.00% convertible senior notes due 2020 (2020 Notes). The 2020 Notes bear interest at a rateof 4.00% per year, payable semiannually in arrears on January 15 and July 15 of each year, beginning on January 15, 2016. The 2020 Notes will mature on July 15, 2020.The 2020 Notes were sold in a private placement. Upon conversion, the Company may, at its discretion, pay cash, shares of the Company’s Class A common stock, or acombination of cash and stock. The 2020 Notes are set at an initial conversation rate of 35.4925 shares of Class A common stock per $1,000 principal amount of 2020Notes, which is equivalent to an initial conversion price of approximately $28.175 per share of Class A common stock. The conversion rate is subject to adjustment in someevents (including, but not limited to, certain cash dividends made to holders of the Company's Class A common stock which exceed the initial dividend threshold of $0.363per quarter per share). The conversion rate would be adjusted to offset the effect of the portion of the dividend in excess of $0.363, provided that the adjustment wouldresult a change of at least 1% in the then effective conversion rate. During the year ended December 31, 2019, the conversion rate increased to 36.7355 shares of Class Acommon stock per $1,000 principal amount of 2020 Notes. The conversion rate will not be adjusted for any accrued and unpaid interest. The 2020 Notes are notredeemable prior to maturity.
The 2020 Notes are guaranteed on a senior unsecured basis by a subsidiary of the Company and are general unsecured obligations of the Company. The obligations ranksenior in rights of payment to the Company’s subordinated debt, equal in right of payment to the Company’s unsubordinated debt and effectively junior in right of paymentto any of the Company’s secured indebtedness to the extent of the value of the assets securing such indebtedness.
S-120
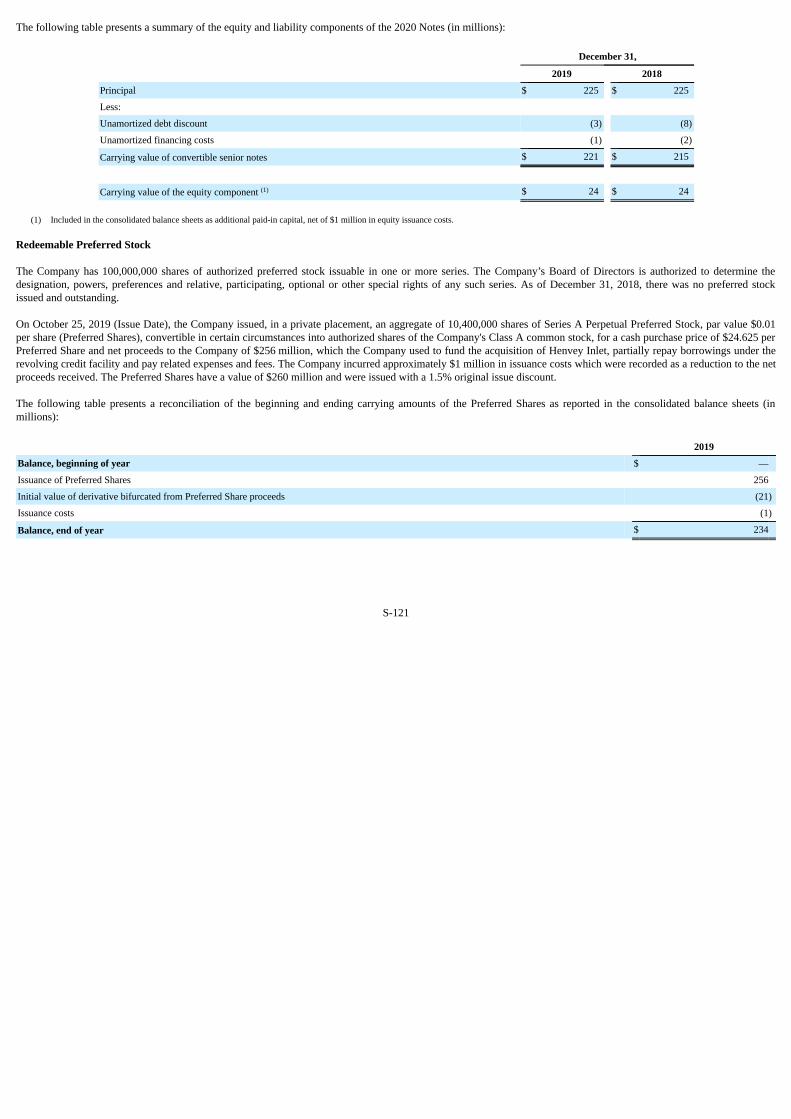
The following table presents a summary of the equity and liability components of the 2020 Notes (in millions):
December 31,
2019 2018
Principal $ 225 $ 225
Less: Unamortized debt discount (3) (8)
Unamortized financing costs (1) (2)
Carrying value of convertible senior notes $ 221 $ 215
Carrying value of the equity component (1) $ 24 $ 24
(1) Included in the consolidated balance sheets as additional paid-in capital, net of $1 million in equity issuance costs.
Redeemable Preferred Stock
The Company has 100,000,000 shares of authorized preferred stock issuable in one or more series. The Company’s Board of Directors is authorized to determine thedesignation, powers, preferences and relative, participating, optional or other special rights of any such series. As of December 31, 2018, there was no preferred stockissued and outstanding.
On October 25, 2019 (Issue Date), the Company issued, in a private placement, an aggregate of 10,400,000 shares of Series A Perpetual Preferred Stock, par value $0.01per share (Preferred Shares), convertible in certain circumstances into authorized shares of the Company's Class A common stock, for a cash purchase price of $24.625 perPreferred Share and net proceeds to the Company of $256 million, which the Company used to fund the acquisition of Henvey Inlet, partially repay borrowings under therevolving credit facility and pay related expenses and fees. The Company incurred approximately $1 million in issuance costs which were recorded as a reduction to the netproceeds received. The Preferred Shares have a value of $260 million and were issued with a 1.5% original issue discount.
The following table presents a reconciliation of the beginning and ending carrying amounts of the Preferred Shares as reported in the consolidated balance sheets (inmillions):
2019
Balance, beginning of year $ —
Issuance of Preferred Shares 256
Initial value of derivative bifurcated from Preferred Share proceeds (21)
Issuance costs (1)
Balance, end of year $ 234
S-121

Item 16. Form 10-K Summary
None.
S-122
Exhibit 4.6
DESCRIPTION OF THE REGISTRANT’S SECURITIESREGISTERED PURSUANT TO SECTION 12 OF THE SECURITIES EXCHANGE
ACT OF 1934
Pattern Energy Group Inc. (the “Company”, “we,” “us,” or “our”) has one class of securities registered under Section 12 of the Securities Exchange Act of 1934,as amended: Class A common stock, par value $0.01 per share.
The following description of our capital stock is a summary of the material terms of our amended and restated certificate of incorporation (“Certificate ofIncorporation”), our amended and restated bylaws (“Bylaws”) and applicable provisions of law. We have summarized certain portions of the Certificate of Incorporationand Bylaws below, each of which is filed as an exhibit to the Company’s Annual Report on Form 10-K. The summary is not complete. You should read the Certificate ofIncorporation and Bylaws for the provisions that are important to you.
Authorized Capital Shares
Our authorized capital stock consists of 500,000,000 shares of Class A common stock (“Class A shares”), par value $0.01 per share, 20,000,000 shares of Class Bcommon stock, par value $0.01 per share and 100,000,000 shares of preferred stock, par value $0.01 per share. All outstanding Class B common stock converted into ClassA shares on a one-for-one basis on December 31, 2014. Our Certificate of Incorporation provides that such Class B common stock were retired and we are no longerauthorized to issue shares of Class B common stock.
Class A Shares
Holders of Class A shares are entitled to one vote for each share held of record on all matters submitted to a vote of the shareholders, including the election ofdirectors. There is no cumulative voting in the election of directors, which means that holders of a majority of the outstanding Class A shares are able to elect all of thedirectors, and holders of less than a majority of such shares will be unable to elect any director. Under our Certificate of Incorporation, subject to preferences that may beapplicable to any outstanding shares of preferred stock, holders of Class A shares are entitled to receive ratably such dividends, if any, as may be declared from time to timeby our board of directors out of funds legally available for dividend payments. The holders of Class A shares have no preferences or rights of conversion, exchange, pre-emption or other subscription rights. There are no redemption or sinking fund provisions applicable to the Class A shares. In the event of any liquidation, dissolution orwinding-up of our affairs, holders of Class A shares will be entitled to share ratably in our assets that are remaining after payment or provision for payment of all of ourdebts and obligations and after liquidation payments to holders of outstanding shares of preferred stock, if any.
The Class A shares are listed on the Nasdaq Global Select Market under the trading symbol “PEGI”.
Preferred Shares
The Company currently has outstanding Series A Perpetual Preferred Stock (“Series A Preferred Stock”). The ability of the Company to declare or pay dividendsor distributions on Class A shares is subject to certain restrictions in the event that the Company fails to declare and pay full dividends on its Series A Preferred Stock. TheCompany’s Class A shares also ranks junior to the Series A Preferred Stock as to the distribution of assets upon liquidation, dissolution or winding up of the Company.These restrictions are set forth in, and this description is qualified in its entirety by reference to, the Certificate of Designation establishing the preferences and terms of theSeries A Preferred Stock, a copy of which has been filed with the Company’s Annual Report on Form 10-K.
1
Provisions of Our Certificate of Incorporation, Bylaws and Delaware Law that May Have an Anti-Takeover Effect
Certificate of Incorporation and Bylaws
Our Certificate of Incorporation and Bylaws contain certain provisions that could discourage, delay or prevent a change in control of our company or changes in ourmanagement that the shareholders of our company may deem advantageous. Among other things, these provisions include those that would:
• authorize the issuance of blank check preferred stock that our board of directors could issue to increase the number of outstanding shares and to discouragea takeover attempt;
• prohibit our shareholders from calling a special meeting of shareholders if Pattern Energy Group LP, or “Pattern Development”, and its affiliates (other thanour company) collectively cease to own more than 50% of our shares;
• prohibit shareholder action by written consent, which requires all shareholder actions to be taken at a meeting of our shareholders if Pattern Developmentand its affiliates (other than our company) collectively cease to own more than 50% of our shares;
• provide that the board of directors is expressly authorized to adopt, or to alter or repeal our bylaws; and
• establish advance notice requirements for nominations for election to our board of directors or for proposing matters that can be acted upon by shareholdersat shareholder meetings.
As of May 14, 2014, Pattern Development and its affiliates (other than our company) collectively ceased to own more than 50% of our shares. The foregoing provisions of our Certificate of Incorporation and Bylaws could discourage potential acquisition proposals and could delay or prevent a change in
control. These provisions are intended to enhance the likelihood of continuity and stability in the composition of the board of directors and in the policies formulated by theboard of directors and to discourage certain types of transactions that may involve an actual or threatened change of control. These provisions are designed to reduce ourvulnerability to an unsolicited acquisition proposal. The provisions also are intended to discourage certain tactics that may be used in proxy fights. However, suchprovisions could have the effect of discouraging others from making tender offers for our shares and, as a consequence, they also may inhibit fluctuations in the marketprice of our shares of Class A shares that could result from actual or rumored takeover attempts. Such provisions also may have the effect of preventing changes in ourmanagement.
Delaware Takeover Statute
Subject to certain exceptions, Section 203 of the Delaware General Corporation Law, or “DGCL,” prohibits a Delaware corporation from engaging in any “businesscombination” (as defined below) with any “interested shareholder” (as defined below) for a period of three years following the date that such shareholder became aninterested shareholder, unless: (1) prior to such date, the board of directors of the corporation approved either the business combination or the transaction that resulted in theshareholder becoming an interested shareholder; (2) on consummation of the transaction that resulted in the shareholder becoming an interested shareholder, the interestedshareholder owned at least 85% of the voting stock of the corporation outstanding at the time the transaction commenced, excluding for purposes of determining thenumber of shares outstanding those shares owned (x) by persons who are directors and also officers and (y) by employee stock plans in which employee participants do nothave the right to determine confidentially whether shares held subject to the plan will be tendered in a tender or exchange offer; or (3) on or subsequent to such date, thebusiness combination is approved by the board of directors and authorized at an annual or special meeting of shareholders, and not by written consent, by the affirmativevote of at least 66 2/3% of the outstanding voting stock that is not owned by the interested shareholder.
In our Certificate of Incorporation, we have elected not to be governed by Section 203 of the DGCL, as permitted under and pursuant to subsection (b)(3) of Section 203.Section 203 of the DGCL defines “business combination” to include: (1) any merger or consolidation involving the corporation and the interested shareholder; (2) any sale,transfer, pledge or other disposition of 10% or more of the assets of the corporation involving the interested shareholder; (3) subject to certain exceptions, any transactionthat results in the issuance or transfer by the corporation of any stock of the corporation to the interested shareholder; (4) any transaction involving the corporation that hasthe effect of increasing the proportionate share of the stock of any class or series of the corporation beneficially owned by the interested shareholder; or (5) the receipt bythe interested shareholder of the benefit of any loans, advances, guarantees, pledges or other financial benefits provided by or through the corporation. In general, Section203 defines an “interested shareholder” as any entity or person beneficially owning 15% or more of the outstanding voting stock of the corporation and any entity or personaffiliated with or controlling or controlled by such entity or person.
2

Exhibit 21.1
Pattern Energy Group Inc.Subsidiaries of the Registrant
Pattern
Name Domicile Ownership
Belle River LP Holdings LP Ontario 51%Broadview B Member LLC Delaware 100%Broadview Corporate Holdings LLC Delaware 100%Broadview Energy Holdings LLC Delaware 84%Broadview Energy JN Investments LLC Delaware 84%Broadview Energy JN, LLC New Mexico 84%Broadview Energy KW Investments LLC Delaware 84%Broadview Energy KW, LLC New Mexico 84%Broadview Energy Project Finco LLC Delaware 84%Broadview Finance Company LLC Delaware 100%Broadview Finco Pledgor Delaware 100%Fowler Ridge IV B Member LLC Delaware 100%Fowler Ridge IV Holdings LLC Delaware 58%Fowler Ridge IV Wind Farm LLC Delaware 58%GK Green Power Futtsu
Japan 91%GK Green Power Kanagi Japan 100%GK Green Power Otsuki Japan 100%
GK Otsuki Wind Power (formerly known as Otsuki Wind Power Corporation) Japan 100%Grady B Member LLC Delaware 51%Grady Energy Holdings LLC Delaware 46%Grady Wind Energy Center Investments LLC Delaware 46%Grady Wind Energy Center, LLC New Mexico 46%Grand Renewable Wind GP Inc. Canada 50%Grand Renewable Wind LP Ontario 45%Green Power Generation GK Japan 100%Green Power Tsugaru GK Japan 100%Green Power Tsugaru Holdings GK Japan 100%Gulf B Member LLC Delaware 100%Gulf Corporate Holdings LLC Delaware 100%Hatchet Ridge Holdings LLC Delaware 100%Hatchet Ridge Wind, LLC Delaware 100%Henvey Inlet Wind GP Inc. Ontario 50%Henvey Inlet Wind LP Ontario 50%HIW Property Holdings GP Inc. Ontario 50%HIW Property Holdings LP Ontario 50%Lincoln County Wind Project Holdco, LLC Delaware 100%Logan’s Gap B Member LLC Delaware 100%Logan’s Gap Holdings LLC Delaware 72%Logan’s Gap Wind LLC Delaware 72%Lost Creek Wind Finco, LLC Delaware 100%Lost Creek Wind Holdco, LLC Delaware 100%Lost Creek Wind, LLC Delaware 100%Meikle Wind Energy Corp British Columbia 70%Meikle Wind Energy Limited Partnership British Columbia 51%
Mont Sainte-Marguerite Wind Farm Inc. Quebec 35%
Mont Sainte-Marguerite Wind Farm L.P. Quebec 51%MSM LP Holdings LP Quebec 51%Nevada Wind Holdings LLC Delaware 100%North Kent Wind 1 GP Inc. Ontario 50%North Kent Wind 1 LP Ontario 35%North Kent Wind 1 LP Holdings LP Ontario 100%Ocotillo Express LLC Delaware 100%Ocotillo Wind Holdings LLC Delaware 100%PAN2 B2 LLC Delaware 2%Panhandle B Holdco LLC Delaware 100%

Panhandle B Member 2 LLC Delaware 100%Panhandle B Member LLC Delaware 100%Panhandle Wind Holdings 2 LLC Delaware 41%Panhandle Wind Holdings LLC Delaware 100%Pattern Belle River GP Holdings Inc. Ontario 70%Pattern Canada Finance Company ULC Nova Scotia 100%Pattern Canada Operations Holdings ULC Nova Scotia 100%Pattern Chile Holdings LLC Delaware 100%Pattern Development MSM Management ULC Nova Scotia 70%Pattern Energy Group Holding 2 LP Delaware 21%Pattern Energy Group Services LP Delaware 100%Pattern Energy Management Services LLC Delaware 100%Pattern Finance Chile LLC Delaware 100%Pattern Finance Chile SpA Chile 100%Pattern Gulf Wind Equity LLC Delaware 100%Pattern Gulf Wind Holdings LLC Delaware 100%Pattern Gulf Wind LLC Delaware 100%Pattern MSM GP Holdings Inc. Ontario 70%Pattern North Kent Wind 1 GP Holdings Inc. Ontario 100%Pattern Operators Canada ULC Nova Scotia 100%Pattern Operators GP LLC Delaware 100%Pattern Operators LP Delaware 100%Pattern Operators Puerto Rico LLC Delaware 100%Pattern Panhandle Wind 2 LLC Delaware 41%Pattern Panhandle Wind LLC Delaware 60%Pattern Santa Isabel LLC Delaware 100%Pattern St. Joseph Holdings Inc. Canada 100%Pattern US Finance Company LLC Delaware 100%Pattern US Operations Holdings LLC Delaware 100%Pattern Western Interconnect Holdings LLC Delaware 100%PEG Services GP LLC Delaware 100%Post Rock Wind Power Project, LLC Delaware 60%Santa Isabel Holdings LLC Delaware 100%South Kent Wind GP Inc. Canada 50%South Kent Wind LP Ontario 50%SP Armow Wind Ontario GP Inc. Canada 50%SP Armow Wind Ontario LP Ontario 50%SP Belle River Wind GP Inc. Canada 35%SP Belle River Wind LP Ontario 22%Spring Valley Wind LLC Nevada 100%St. Joseph Windfarm Inc. Canada 100%Stillwater New B Member LLC Delaware 51%Stillwater New Energy Holdings LLC Delaware 43%Stillwater Wind, LLC Delaware 43%Texas Gulf Wind 2 LLC Delaware 100%Western Interconnect Investments LLC Delaware 99%Western Interconnect LLC Delaware 99%WI Corporate Holdings Delaware 100%WI Holdings Pledgor LLC Delaware 100%

Exhibit 23.1
CONSENT OF INDEPENDENT REGISTERED PUBLIC ACCOUNTING FIRM
We hereby consent to the incorporation by reference in the Registration Statements on Form S-3 (No. 333-219970) and Form S-8 (No. 333-191641) of Pattern EnergyGroup Inc. of our report dated March 2, 2020 relating to the financial statements, financial statement schedule and the effectiveness of internal control over financialreporting, which appears in this Form 10-K.
/s/ PricewaterhouseCoopers LLP
San Francisco, CaliforniaMarch 2, 2020

Exhibit 23.2
Consent of Independent Registered Public Accounting Firm
We consent to the incorporation by reference in the following Registration Statements:
(1) Registration Statement on Form S-3 (No. 333-219970) and the related prospectus of Pattern Energy Group Inc. (the “Company”), and(2) Registration Statement on Form S-8 (No. 333-191641), pertaining to Pattern Energy Group Inc.’s 2013 Equity Incentive Award Plan.
of (i) our report dated March 1, 2018, with respect to the consolidated financial statements and schedule of Pattern Energy Group Inc., (ii) our report dated February 28,2018, with respect to the financial statements of K2 Wind Ontario Limited Partnership, and (iii) our report dated March 28, 2019 with respect to the financial statements ofPattern Energy Group Holdings 2 LP, all included in this Annual Report (Form 10-K) of Pattern Energy Group Inc. for the year ended December 31, 2019.
/s/ Ernst & Young LLP San Francisco, California February 28, 2020
Exhibit 23.3
CONSENT OF INDEPENDENT REGISTERED PUBLIC ACCOUNTING FIRM
We consent to the incorporation by reference in the Registration Statements on Form S-3 (File No.333-219970) and Form S-8 (File No. 333-191641) of Pattern EnergyGroup Inc.:
• of our report relating to the financial statements of South Kent Wind LP dated February 14, 2020;
• of our report relating to the financial statements of Grand Renewable Wind LP dated February 14, 2020; and
• of our report relating to the financial statements of SP Armow Wind Ontario LP dated February 20, 2018, except for the change in the manner in which SP ArmowWind Ontario LP accounts for restricted cash in the statements of cash flows discussed in Note 2 to the financial statements, as to which the date is February 15,2019 and the change in the manner in which SP Armow Wind Ontario LP presents the partners' equity in the statements of changes in partners' equity discussed inNote 13 to the financial statements, as to which the date is February 14, 2020,
which appear in this Form 10-K of Pattern Energy Group Inc.
/s/ PricewaterhouseCoopers LLP
Chartered Professional Accountants, Licensed Public AccountantsToronto, Ontario, CanadaMarch 2, 2020
PricewaterhouseCoopers LLPPwC Tower, 18 York Street, Suite 2600, Toronto, Ontario, Canada M5J 0B2T: +1 416 863 1133, F: +1 416 365 8215, www.pwc.com/ca
“PwC” refers to PricewaterhouseCoopers LLP, an Ontario limited liability partnership.

Exhibit 23.4
CONSENT OF INDEPENDENT AUDITORS
We hereby consent to the incorporation by reference in the Registration Statements on Form S-3 (No. 333-219970) and Form S-8 (No. 333-191641) of Pattern EnergyGroup Inc. of our report dated March 2, 2020 relating to the financial statements of Pattern Energy Group Holdings 2 LP, which appears in this Form 10-K.
/s/ PricewaterhouseCoopers LLP
San Francisco, CaliforniaMarch 2, 2020

Exhibit 31.1
Certification of Chief Executive OfficerPursuant to Exchange Act Rules 13a-14(a) and 15d-14(a),
As Adopted Pursuant to Section 302 of the Sarbanes-Oxley Act of 2002
I, Michael M. Garland, certify that:
1. I have reviewed this Annual Report on Form 10-K of Pattern Energy Group Inc.;
2. Based on my knowledge, this report does not contain any untrue statement of a material fact or omit to state a material fact necessary to make the statements made,in light of the circumstances under which such statements were made, not misleading with respect to the period covered by this report;
3. Based on my knowledge, the financial statements, and other financial information included in this report, fairly present in all material respects the financialcondition, results of operations and cash flows of the registrant as of, and for, the periods presented in this report;
4. The registrant’s other certifying officer and I are responsible for establishing and maintaining disclosure controls and procedures (as defined in Exchange Act Rules13a-15(e) and 15d-15(e)) and internal control over financial reporting (as defined in the Exchange Act Rules 13a-15(f) and 15d-15(f)) for the registrant and have:
a) designed such disclosure controls and procedures, or caused such disclosure controls and procedures to be designed under our supervision, to ensure thatmaterial information relating to the registrant, including its combined subsidiaries, is made known to us by others within those entities, particularly during the period inwhich this report is being prepared;
b) designed such internal control over financial reporting, or caused such internal control over financial reporting to be designed under our supervision, toprovide reasonable assurance regarding the reliability of financial reporting and the preparation of financial statements for external purposes in accordance with generallyaccepted accounting principles;
c) evaluated the effectiveness of the registrant’s disclosure controls and procedures and presented in this report our conclusions about the effectiveness of thedisclosure controls and procedures, as of the end of the period covered by this report based on such evaluation;
d) disclosed in this report any change in the registrant’s internal control over financial reporting that occurred during the registrant’s most recent fiscal quarter(the registrant’s fourth fiscal quarter in the case of an annual report) that has materially affected, or is reasonably likely to materially affect, the registrant’s internal controlover financial reporting; and
5. The registrant’s other certifying officer and I have disclosed, based on our most recent evaluation of internal control over financial reporting, to the registrant’sauditors and the audit committee of registrant’s board of directors (or persons performing the equivalent function):
a) all significant deficiencies and material weaknesses in the design or operation of internal control over financial reporting which are reasonably likely toadversely affect the registrant’s ability to record, process, summarize and report financial information; and
b) any fraud, whether or not material, that involves management or other employees who have a significant role in the registrant’s internal control overfinancial reporting.
Date: March 2, 2020 By /s/ Michael M. Garland Michael M. Garland Chief Executive Officer and Director (Principal Executive Officer)
Exhibit 31.2
Certification of Chief Financial OfficerPursuant to Exchange Act Rules 13a-14(a) and 15d-14(a),
As Adopted Pursuant to Section 302 of the Sarbanes-Oxley Act of 2002
I, Esben W. Pedersen, certify that:
1. I have reviewed this Annual Report on Form 10-K of Pattern Energy Group Inc.;
2. Based on my knowledge, this report does not contain any untrue statement of a material fact or omit to state a material fact necessary to make the statements made,in light of the circumstances under which such statements were made, not misleading with respect to the period covered by this report;
3. Based on my knowledge, the financial statements, and other financial information included in this report, fairly present in all material respects the financialcondition, results of operations and cash flows of the registrant as of, and for, the periods presented in this report;
4. The registrant’s other certifying officer and I are responsible for establishing and maintaining disclosure controls and procedures (as defined in Exchange Act Rules13a-15(e) and 15d-15(e)) and internal control over financial reporting (as defined in the Exchange Act Rules 13a-15(f) and 15d-15(f)) for the registrant and have:
a) designed such disclosure controls and procedures, or caused such disclosure controls and procedures to be designed under our supervision, to ensure thatmaterial information relating to the registrant, including its combined subsidiaries, is made known to us by others within those entities, particularly during the period inwhich this report is being prepared;
b) designed such internal control over financial reporting, or caused such internal control over financial reporting to be designed under our supervision, toprovide reasonable assurance regarding the reliability of financial reporting and the preparation of financial statements for external purposes in accordance with generallyaccepted accounting principles;
c) evaluated the effectiveness of the registrant’s disclosure controls and procedures and presented in this report our conclusions about the effectiveness of thedisclosure controls and procedures, as of the end of the period covered by this report based on such evaluation;
d) disclosed in this report any change in the registrant’s internal control over financial reporting that occurred during the registrant’s most recent fiscal quarter(the registrant’s fourth fiscal quarter in the case of an annual report) that has materially affected, or is reasonably likely to materially affect, the registrant’s internal controlover financial reporting; and
5. The registrant’s other certifying officer and I have disclosed, based on our most recent evaluation of internal control over financial reporting, to the registrant’sauditors and the audit committee of registrant’s board of directors (or persons performing the equivalent function):
a) all significant deficiencies and material weaknesses in the design or operation of internal control over financial reporting which are reasonably likely toadversely affect the registrant’s ability to record, process, summarize and report financial information; and
b) any fraud, whether or not material, that involves management or other employees who have a significant role in the registrant’s internal control overfinancial reporting.
Date: March 2, 2020 By /s/ Esben W. Pedersen Esben W. Pedersen Chief Financial Officer (Principal Financial Officer)
Exhibit 32
Certification of Chief Executive OfficerPursuant to 18 U.S.C. Section 1350, As Adopted
Pursuant to Section 906 of the Sarbanes-Oxley Act of 2002
Pursuant to 18 U.S.C. § 1350, as created by Section 906 of the Sarbanes-Oxley Act of 2002, the undersigned officer of Pattern Energy Group Inc. (the “Company”) herebycertifies, to such officer’s knowledge, that:
(i) the accompanying Annual Report on Form 10-K of the Company for the annual period ended December 31, 2019 (the “Report”) fully complies with therequirements of Section 13(a) or Section 15(d), as applicable, of the Securities Exchange Act of 1934, as amended; and
(ii) the information contained in the Report fairly presents, in all material respects, the financial condition and results of operations of the Company.
Date: March 2, 2020 By /s/ Michael M. Garland Michael M. Garland Chief Executive Officer
Certification of Chief Financial OfficerPursuant to 18 U.S.C. Section 1350, As Adopted
Pursuant to Section 906 of the Sarbanes-Oxley Act of 2002
Pursuant to 18 U.S.C. § 1350, as created by Section 906 of the Sarbanes-Oxley Act of 2002, the undersigned officer of Pattern Energy Group Inc. (the “Company”) herebycertifies, to such officer’s knowledge, that:
(i) the accompanying Annual Report on Form 10-K of the Company for the annual period ended December 31, 2019 (the “Report”) fully complies with therequirements of Section 13(a) or Section 15(d), as applicable, of the Securities Exchange Act of 1934, as amended; and
(ii) the information contained in the Report fairly presents, in all material respects, the financial condition and results of operations of the Company.
Date: March 2, 2020 By /s/ Esben W. Pedersen Esben W. Pedersen Chief Financial Officer