Embed Size (px)
Citation preview

Crop market outlook and program choices under the
new farm billPat Westhoff ([email protected])
FAPRI-MU directorUniversity of Missouri
www.fapri.missouri.edu
Farm Bill Decision Aid TrainingMemphis, TennesseeSeptember 25, 2014
Agenda
FAPRI-MU crop market outlook Price projections Farm commodity supply and use that
generate those prices Uncertainty around the projections
Why prices matter in making program choices

U.S. market price projectionsFAPRI-MU, September 2014
2013/14 2014/15 2015/16 2016/17 2017/18 2018/19
Corn ($/bu.) 4.45 3.50 3.80 3.97 4.12 4.22
Soybeans ($/bu.) 13.00 9.92 9.04 9.72 10.32 10.57
Wheat ($/bu.) 6.87 5.91 5.42 5.61 5.81 5.93
Durum 7.46 6.78 6.19 6.42 6.66 6.80
Other spring 6.73 5.95 5.68 5.88 6.09 6.22
Winter 6.89 5.88 5.31 5.50 5.69 5.81
Upland cotton (cents/lb.) 77.50 64.63 59.97 58.76 59.53 60.85
Sorghum ($/bu.) 4.25 3.33 3.64 3.75 3.88 3.96
Rice ($/cwt) 16.10 14.31 13.40 13.16 13.21 13.37
Long grain 15.40 13.01 12.33 12.10 12.13 12.27
Medium/short (exc. Japonica) 16.10 14.34 13.67 13.44 13.51 13.70
Japonica 18.40 18.93 17.09 16.80 16.89 17.12
Barley ($/bu.) 6.06 4.85 4.47 4.54 4.71 4.81
Oats ($/bu.) 3.75 3.11 3.07 3.19 3.30 3.35
Peanuts (cents/lb.) 24.90 19.59 22.96 22.03 22.43 22.49
Sunflower seed ($/cwt) 21.50 20.38 18.65 19.22 20.11 20.38
Canola ($/cwt) 20.60 17.76 17.74 17.91 19.15 19.32

U.S. market price projectionsFAPRI-MU, September 2014
2013/14 2014/15 2015/16 2016/17 2017/18 2018/19
Flaxseed ($/bu.) 13.80 12.26 11.63 12.08 12.48 12.65
Lentils ($/cwt) 19.90 17.92 16.79 17.57 18.27 18.58
Safflower ($/cwt) 23.70 20.65 19.38 20.25 21.03 21.38
Mustard seed ($/cwt) 36.00 31.25 29.60 30.65 31.61 32.05
Dry peas ($/cwt) 14.60 12.60 11.81 12.25 12.67 12.88
Rapeseed ($/cwt) 25.60 21.74 20.24 21.31 22.29 22.71
Large chickpeas ($/cwt) 31.10 26.46 24.59 25.66 26.66 27.15
Small chickpeas ($/cwt) 22.80 19.27 17.87 18.67 19.42 19.79
Crambe ($/cwt) 35.80 32.54 30.67 31.74 32.74 33.23
Sesame seed ($/cwt) 44.00 44.79 42.13 43.68 45.11 45.82
So where did those come from? FAPRI-MU has been making market projections for 30
years Complex models of U.S. and world markets + analyst
expertise DC review of models and projections each December Annual baseline released in early March
Updates August update each year For this project, monthly updates—September is first official Reflect new information on crop production, demand, etc.
We know actual prices will differ We solve for 500 different futures given different assumptions

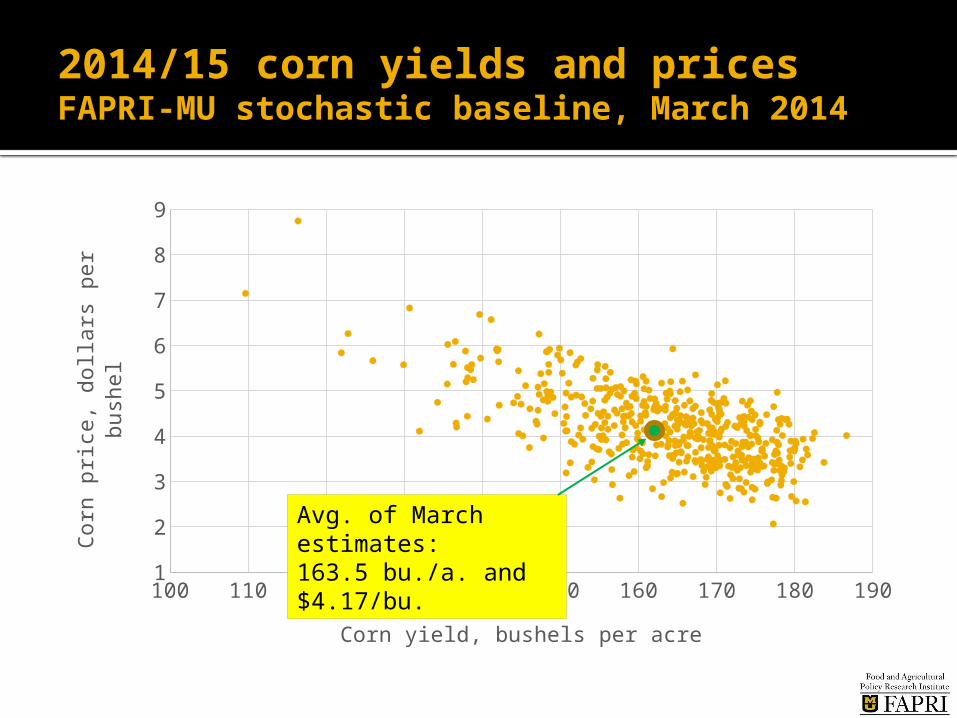
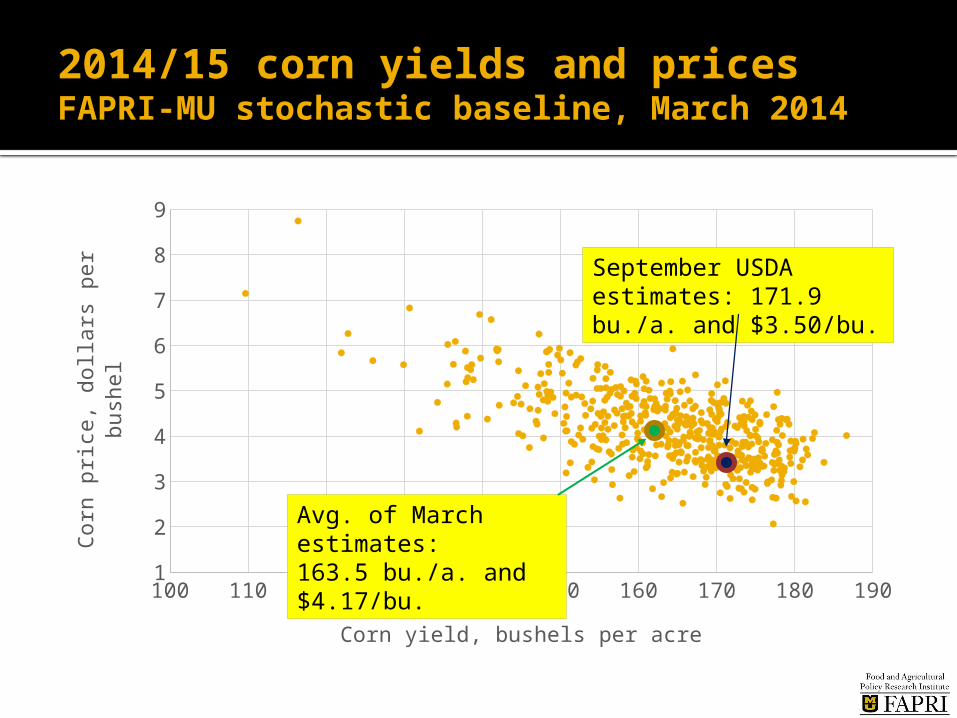
2014/15 corn yields and pricesFAPRI-MU stochastic baseline, March 2014
100 110 120 130 140 150 160 170 180 1901
2
3
4
5
6
7
8
9
Corn yield, bushels per acre
Corn
pri
ce,
dolla
rs p
er
bush
el
2014/15 corn yields and pricesFAPRI-MU stochastic baseline, March 2014
100 110 120 130 140 150 160 170 180 1901
2
3
4
5
6
7
8
9
Corn yield, bushels per acre
Corn
pri
ce,
dolla
rs p
er
bush
el
Avg. of March estimates:163.5 bu./a. and $4.17/bu.
2014/15 corn yields and pricesFAPRI-MU stochastic baseline, March 2014
100 110 120 130 140 150 160 170 180 1901
2
3
4
5
6
7
8
9
Corn yield, bushels per acre
Corn
pri
ce,
dolla
rs p
er
bush
el
September USDA estimates: 171.9 bu./a. and $3.50/bu.
Avg. of March estimates:163.5 bu./a. and $4.17/bu.
Some factors driving the baseline projections
Economic growth, exchange rates, etc.
Policy (generally keep current policies)
Technology (generally trend growth in crop yields, etc.)
Economic choices by producers and consumers
Weather and other factors that make markets volatile
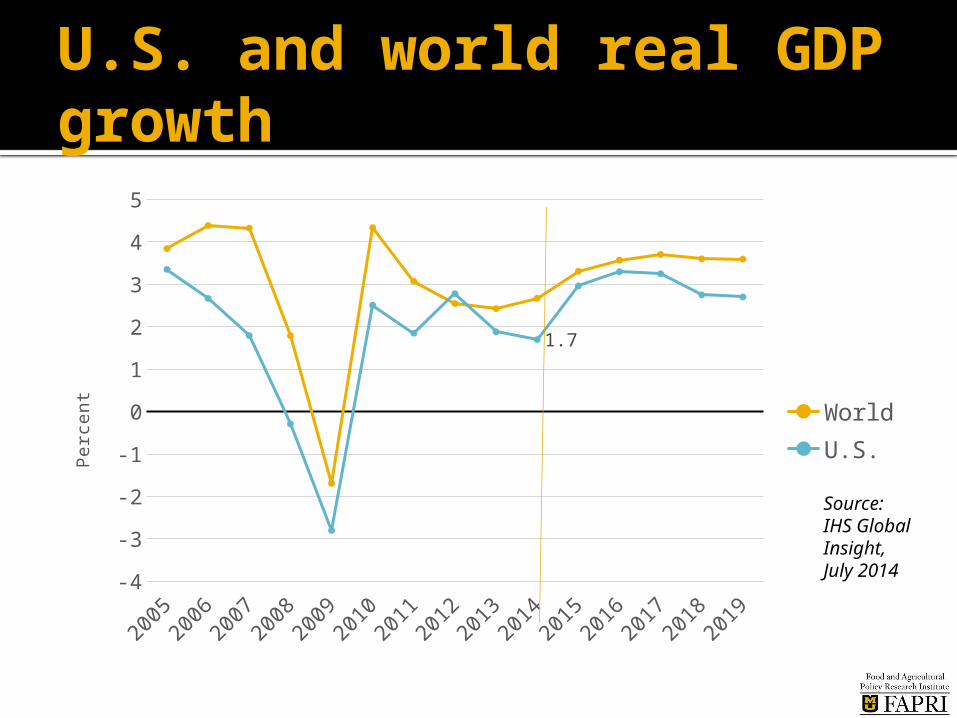
U.S. and world real GDP growth
2005
2006
2007
2008
2009
2010
2011
2012
2013
2014
2015
2016
2017
2018
2019
-4
-3
-2
-1
0
1
2
3
4
5
1.7
WorldU.S.P
erc
ent
Source: IHS Global Insight, July 2014
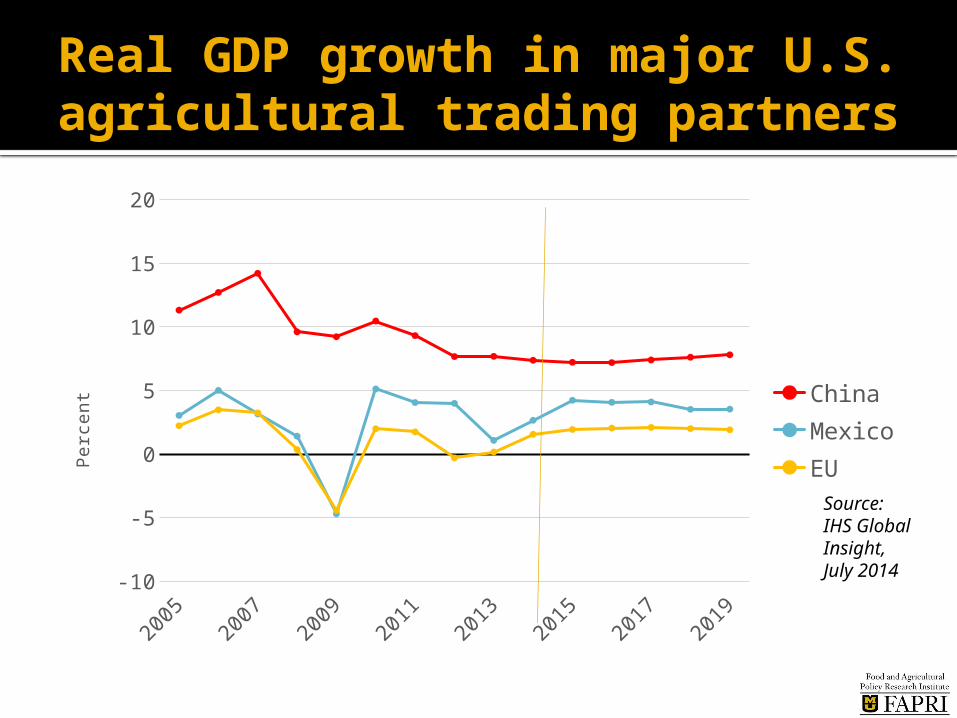
Real GDP growth in major U.S. agricultural trading partners
2005
2006
2007
2008
2009
2010
2011
2012
2013
2014
2015
2016
2017
2018
2019
-10
-5
0
5
10
15
20
ChinaMexicoEUP
erc
ent
Source: IHS Global Insight, July 2014
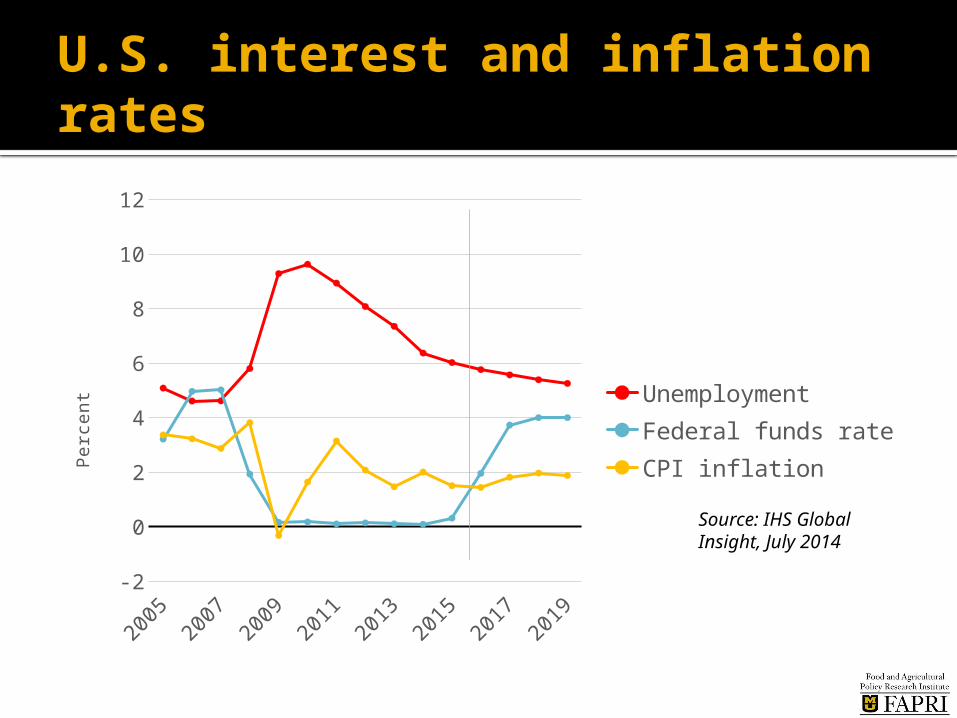
U.S. interest and inflation rates
2005
2007
2009
2011
2013
2015
2017
2019
-2
0
2
4
6
8
10
12
UnemploymentFederal funds rateCPI inflationP
erc
ent
Source: IHS Global Insight, July 2014
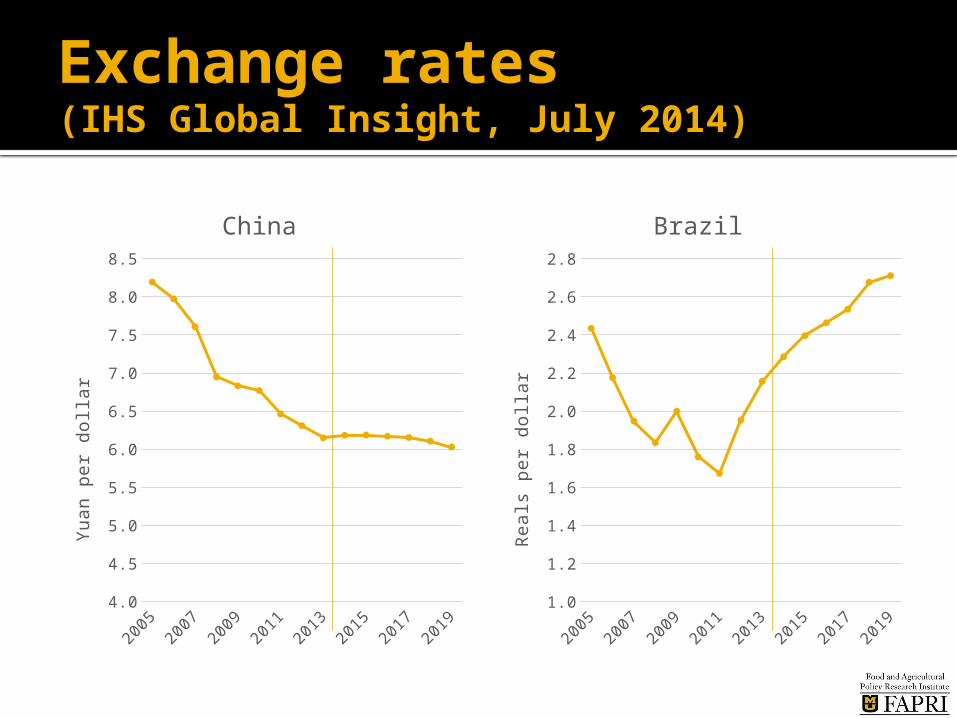
Exchange rates(IHS Global Insight, July 2014)
2005
2007
2009
2011
2013
2015
2017
2019
4.0
4.5
5.0
5.5
6.0
6.5
7.0
7.5
8.0
8.5
China
Yuan p
er
dolla
r
2005
2007
2009
2011
2013
2015
2017
2019
1.0
1.2
1.4
1.6
1.8
2.0
2.2
2.4
2.6
2.8
Brazil
Reals
per
dolla
r
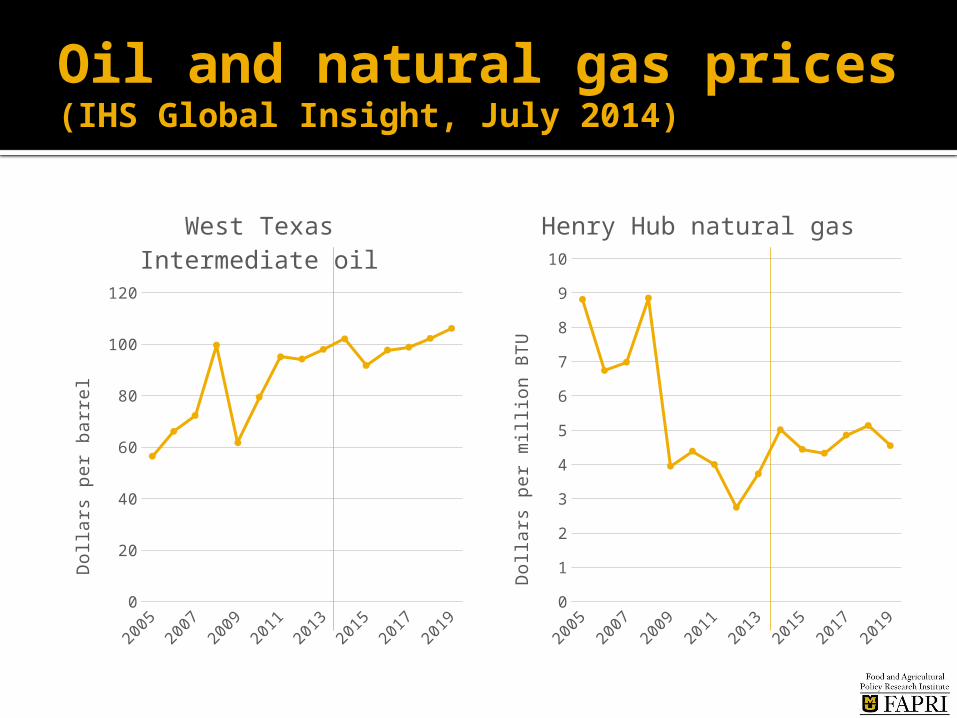
Oil and natural gas prices(IHS Global Insight, July 2014)
2005
2007
2009
2011
2013
2015
2017
2019
0
20
40
60
80
100
120
West Texas Intermediate oil
Dolla
rs p
er
barr
el
2005
2007
2009
2011
2013
2015
2017
2019
0
1
2
3
4
5
6
7
8
9
10
Henry Hub natural gas
Dolla
rs p
er
mill
ion B
TU
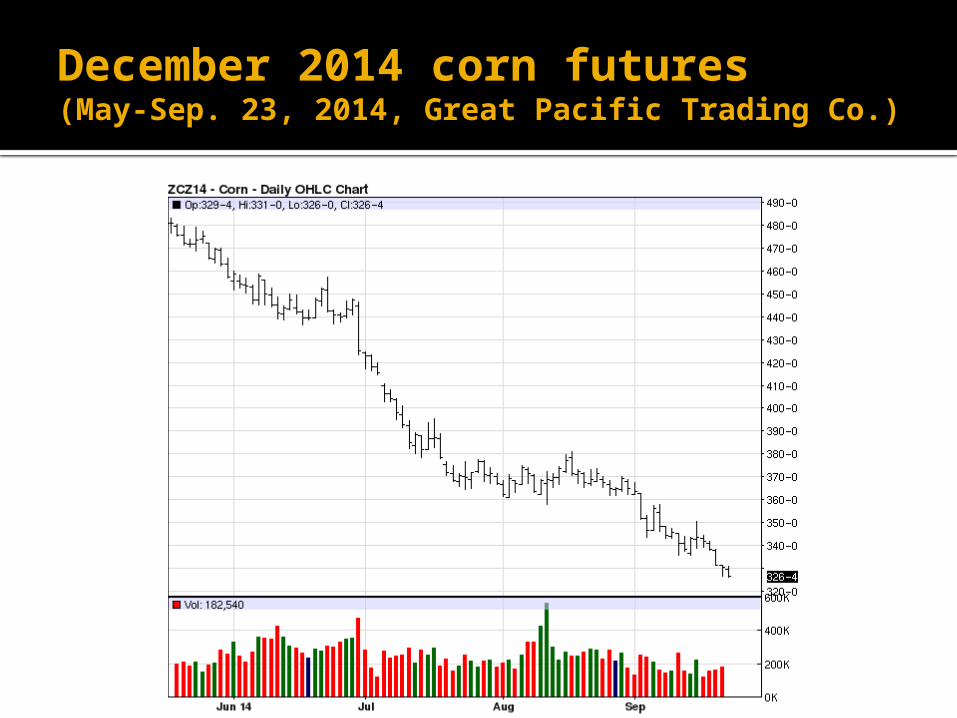
December 2014 corn futures(May-Sep. 23, 2014, Great Pacific Trading Co.)

U.S. corn supply and use(USDA WASDE, Sep. 2014)
2012/13 2013/14 2014/15
Planted area (mil. a.) 97.2 95.4 91.6
Harvested area (mil. a.) 87.4 87.7 83.8
Yield (bu./a.) 123.4 158.8 171.7
Production (mil. bu.) 10,780 13,925 14,395
Feed & residual (mil. bu.) 4,339 5,175 5,325
Ethanol & coproducts (mil. bu.)
4,641 5,125 5,125
Other domestic use (mil. bu.)
1,398 1,375 1,405
Exports (mil. bu.) 730 1,925 1,750
Ending stocks (mil. bu.) 821 1,181 2,002
Farm price per bushel $6.89 $4.45 $3.20-$3.80

U.S. corn supply and useFAPRI-MU, September 2014
2013/14 2014/15 2015/16 2016/17 2017/18 2018/19
million acres million acres
Area harvested 87.7 83.8 81.4 83.6 83.6 83.9
bushels per acre bushels per acre
Yield 158.8 171.7 162.7 164.5 166.2 167.7
million bushels million bushels
Production 13,925 14,395 13,239 13,755 13,891 14,061
Imports 35 30 30 30 30 30
Beginning stocks 821 1,181 1,962 1,566 1,509 1,484
Total supply 14,781 15,607 15,230 15,352 15,429 15,575
Feed use 5,175 5,285 5,173 5,289 5,302 5,283
Other domestic use 6,500 6,551 6,603 6,600 6,584 6,662
Exports 1,925 1,810 1,888 1,954 2,060 2,173
Total use 13,600 13,645 13,664 13,843 13,946 14,118
Ending stocks 1,181 1,962 1,566 1,509 1,484 1,457
dollars per bushel dollars per bushel
Price, U.S. farm 4.45 3.50 3.80 3.97 4.12 4.22

World corn supply and use
05/06
06/07
07/08
08/09
09/10
10/11
11/12
12/13
13/14
14/15
15/16
16/17
17/18
18/19
19/20
0
200
400
600
800
1000
1200
ProductionUseEnd. Stocks
Mill
ion m
etr
ic t
ons
Source: Unpublished FAPRI-MU projections, Sep. 2014

November 2014 soybean futures(May-Sep. 23, 2014, Great Pacific Trading Co.)
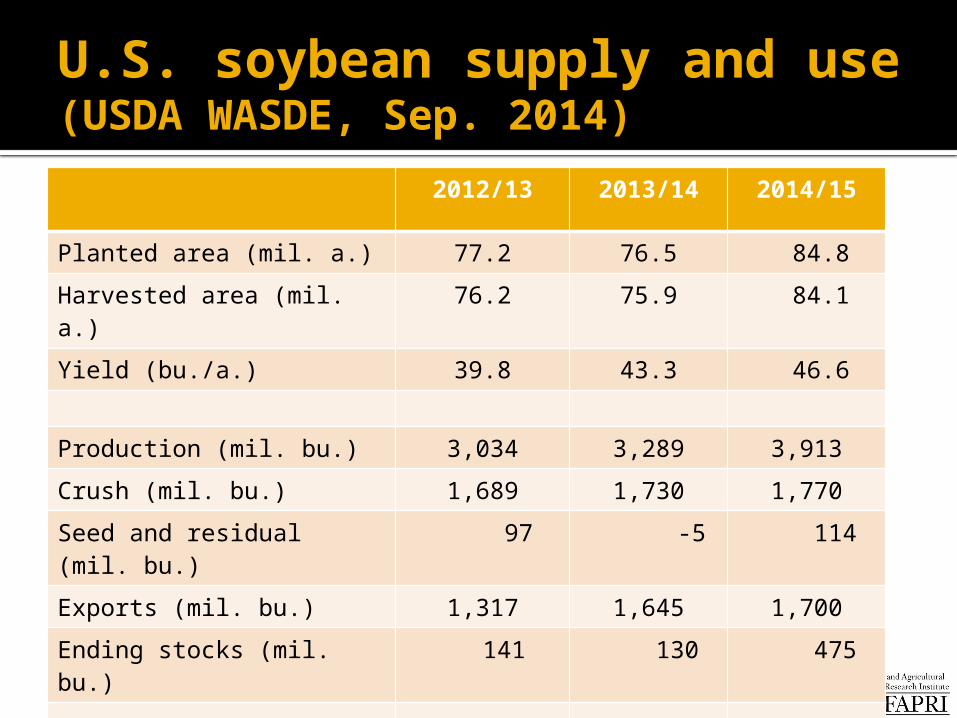
U.S. soybean supply and use(USDA WASDE, Sep. 2014)
2012/13 2013/14 2014/15
Planted area (mil. a.) 77.2 76.5 84.8
Harvested area (mil. a.) 76.2 75.9 84.1
Yield (bu./a.) 39.8 43.3 46.6
Production (mil. bu.) 3,034 3,289 3,913
Crush (mil. bu.) 1,689 1,730 1,770
Seed and residual (mil. bu.)
97 -5 114
Exports (mil. bu.) 1,317 1,645 1,700
Ending stocks (mil. bu.) 141 130 475
Farm price per bushel $14.40 $13.00 $9.00-$11.00

U.S. soybean supply and useFAPRI-MU, September 2014
2013/14 2014/15 2015/16 2016/17 2017/18 2018/19
million acres million acres
Area harvested 75.9 84.1 83.0 80.1 81.1 81.3
bushels per acre bushels per acre
Yield 43.3 46.6 44.0 44.6 45.0 45.3
million bushels million bushels
Production 3,289 3,913 3,657 3,573 3,649 3,688
Imports 80 15 15 15 15 15
Beginning stocks 141 130 433 434 381 374
Total supply 3,509 4,058 4,105 4,022 4,045 4,077
Crush 1,730 1,809 1,848 1,840 1,851 1,864
Other domestic use 4 105 102 103 103 103
Exports 1,645 1,712 1,720 1,698 1,717 1,741
Total use 3,379 3,626 3,670 3,641 3,671 3,708
Ending stocks 130 433 434 381 374 369
dollars per bushel dollars per bushel
Price, U.S. farm 13.00 9.92 9.04 9.72 10.32 10.57
ratio ratio
Soybean/corn price ratio 2.92 2.83 2.38 2.45 2.50 2.50
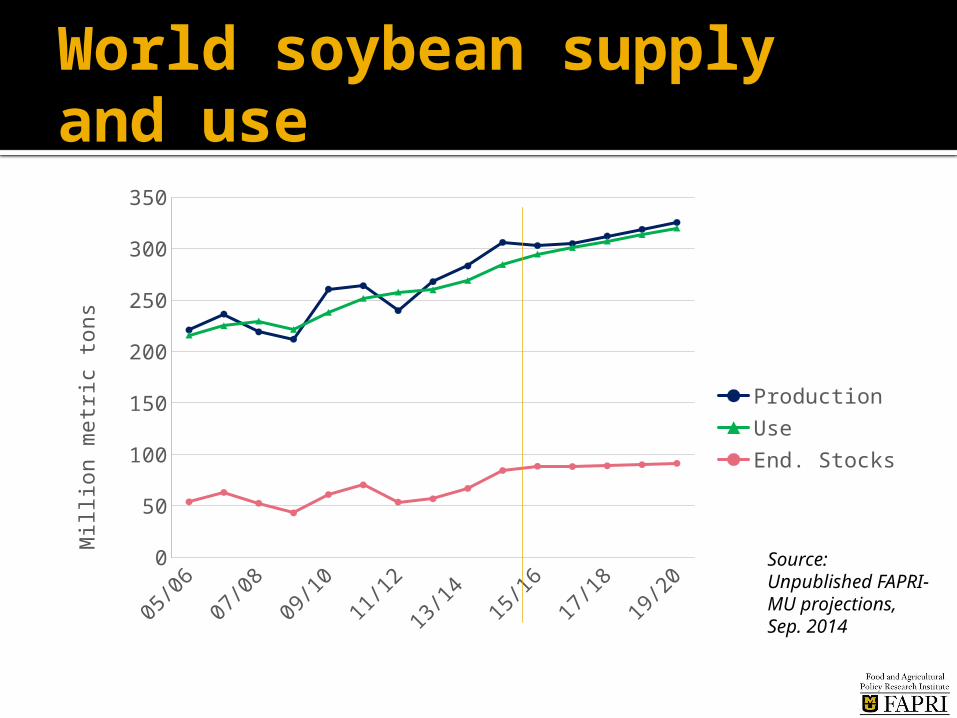
World soybean supply and use
05/06
06/07
07/08
08/09
09/10
10/11
11/12
12/13
13/14
14/15
15/16
16/17
17/18
18/19
19/20
0
50
100
150
200
250
300
350
ProductionUseEnd. Stocks
Mill
ion m
etr
ic t
ons
Source: Unpublished FAPRI-MU projections, Sep. 2014

U.S. wheat supply and useFAPRI-MU, September 2014
2013/14 2014/15 2015/16 2016/17 2017/18 2018/19
million acres million acres
Area harvested 45.2 46.2 46.7 45.8 45.8 45.7
bushels per acre bushels per acre
Yield 47.1 43.9 46.2 46.4 46.8 47.1
million bushels million bushels
Production 2,130 2,030 2,155 2,126 2,145 2,156
Imports 169 170 165 165 165 165
Beginning stocks 718 590 668 720 714 705
Total supply 3,016 2,789 2,987 3,011 3,024 3,026
Feed use 222 161 187 191 188 190
Other domestic use 1,028 1,039 1,045 1,052 1,058 1,065
Exports 1,176 922 1,034 1,055 1,072 1,072
Total use 2,426 2,122 2,267 2,297 2,318 2,328
Ending stocks 590 668 720 714 705 698
dollars per bushel dollars per bushel
Price, U.S. farm 6.87 5.91 5.42 5.61 5.81 5.93

U.S. cotton supply and useFAPRI-MU, September 2014
2013/14 2014/15 2015/16 2016/17 2017/18 2018/19
million acres million acres
Area harvested 7.54 9.88 8.74 8.80 8.76 8.74
pounds per acre pounds per acre
Yield 822 803 820 829 837 844
million bales million bales
Production 12.91 16.54 14.92 15.21 15.27 15.37
Imports 0.01 0.01 0.01 0.01 0.01 0.01
Beginning stocks 3.90 2.45 5.18 5.26 5.36 5.39
Total supply 16.82 18.99 20.11 20.48 20.64 20.76
Domestic use and residual 3.84 3.84 3.94 4.06 4.11 4.12
Exports 10.53 9.97 10.90 11.06 11.14 11.24
Total use 14.37 13.81 14.84 15.11 15.25 15.36
Ending stocks 2.45 5.18 5.26 5.36 5.39 5.40
cents per pound cents per pound
Price, U.S. farm 77.5 64.6 60.0 58.8 59.5 60.9
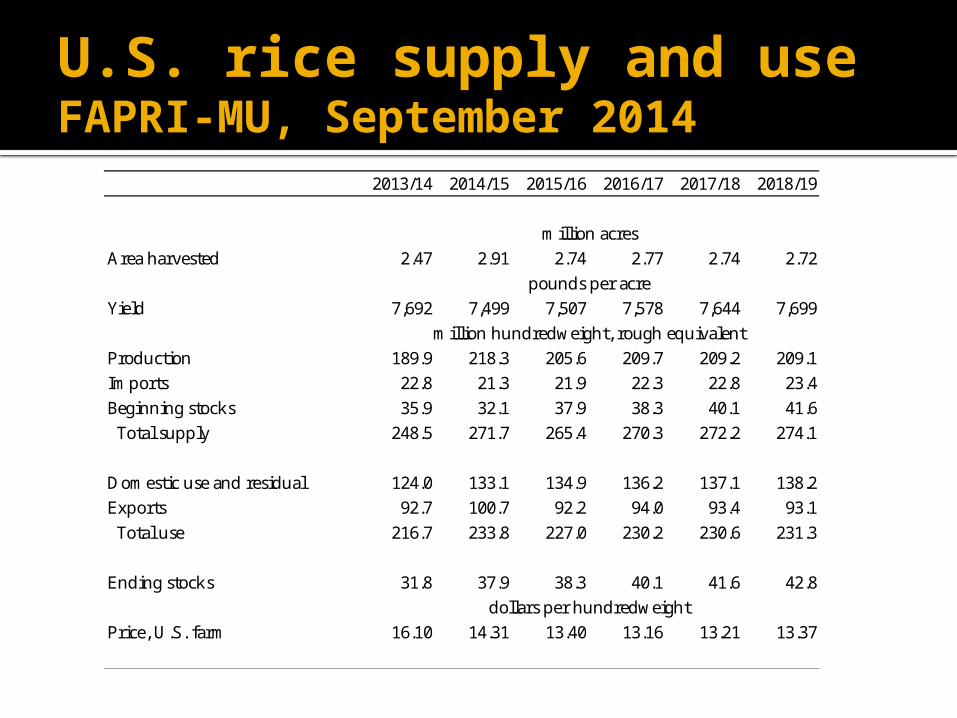
U.S. rice supply and useFAPRI-MU, September 2014
2013/14 2014/15 2015/16 2016/17 2017/18 2018/19
million acres million acres
Area harvested 2.47 2.91 2.74 2.77 2.74 2.72
pounds per acre pounds per acre
Yield 7,692 7,499 7,507 7,578 7,644 7,699
million hundredweight, rough equivalent million hundredweight, rough equivalent
Production 189.9 218.3 205.6 209.7 209.2 209.1
Imports 22.8 21.3 21.9 22.3 22.8 23.4
Beginning stocks 35.9 32.1 37.9 38.3 40.1 41.6
Total supply 248.5 271.7 265.4 270.3 272.2 274.1
Domestic use and residual 124.0 133.1 134.9 136.2 137.1 138.2
Exports 92.7 100.7 92.2 94.0 93.4 93.1
Total use 216.7 233.8 227.0 230.2 230.6 231.3
Ending stocks 31.8 37.9 38.3 40.1 41.6 42.8
dollars per hundredweight dollars per hundredweight
Price, U.S. farm 16.10 14.31 13.40 13.16 13.21 13.37
Why prices matter
Both ARC and PLC depend on U.S. season-average prices
Lower prices increase payments under both programs, all else equal
But actual payments under the two programs can differ—sometimes by a lot
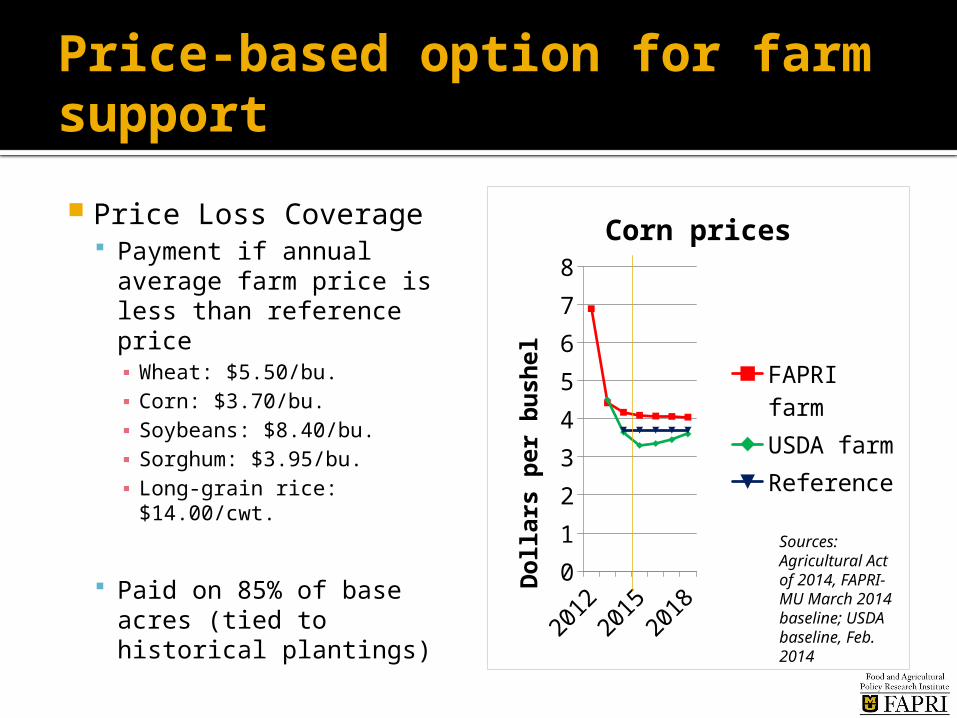
Price-based option for farm support
Price Loss Coverage Payment if annual
average farm price is less than reference price▪ Wheat: $5.50/bu. ▪ Corn: $3.70/bu.▪ Soybeans: $8.40/bu.▪ Sorghum: $3.95/bu.▪ Long-grain rice:
$14.00/cwt.
Paid on 85% of base acres (tied to historical plantings) 20
1220
1520
180
1
2
3
4
5
6
7
8
Corn prices
FAPRI farmUSDA farmReference
Dollars
per
bu
sh
el
Sources: Agricultural Act of 2014, FAPRI-MU March 2014 baseline; USDA baseline, Feb. 2014
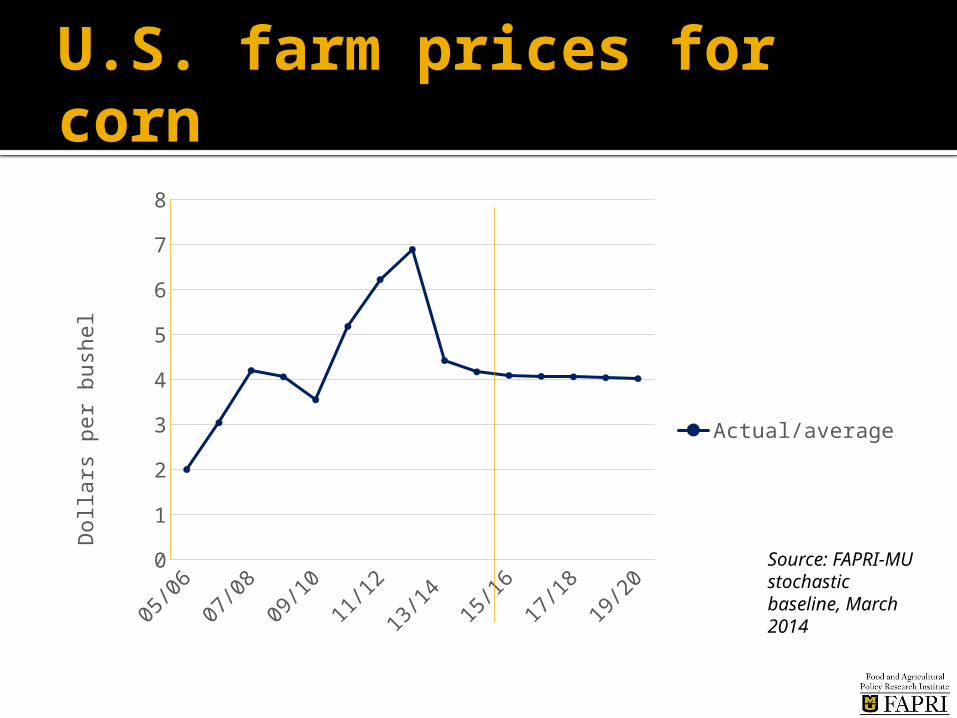
U.S. farm prices for corn
05/06
06/07
07/08
08/09
09/10
10/11
11/12
12/13
13/14
14/15
15/16
16/17
17/18
18/19
19/20
0
1
2
3
4
5
6
7
8
Actual/average
Dolla
rs p
er
bush
el
Source: FAPRI-MU stochastic baseline, March 2014

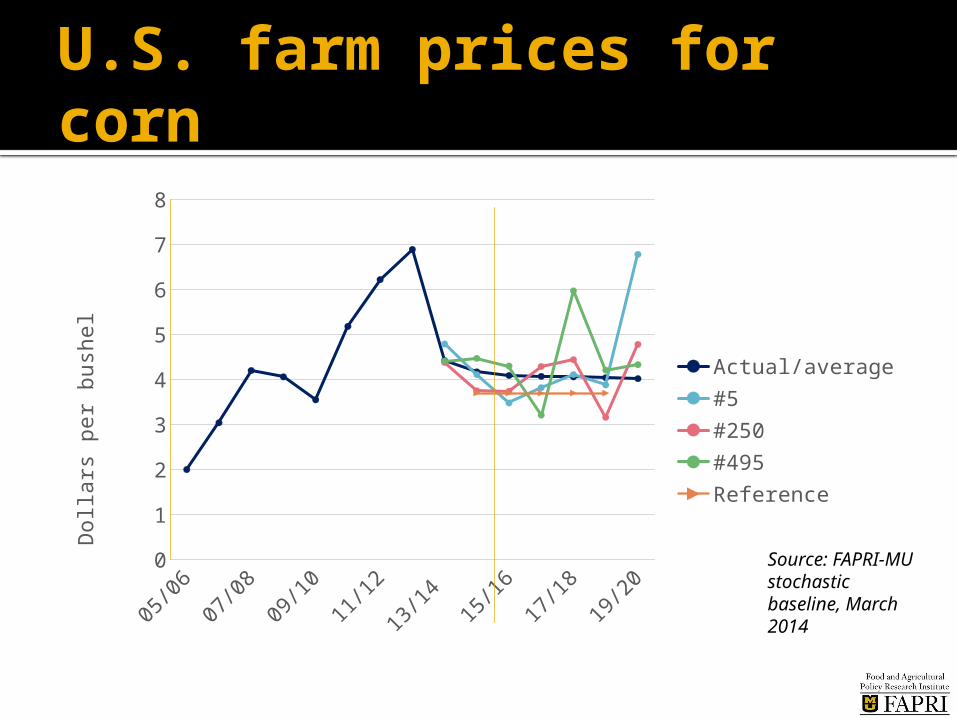
U.S. farm prices for corn
05/06
06/07
07/08
08/09
09/10
10/11
11/12
12/13
13/14
14/15
15/16
16/17
17/18
18/19
19/20
0
1
2
3
4
5
6
7
8
Actual/average#5
Dolla
rs p
er
bush
el
2019 yield in #5 is 140 bushels per acre (avg: 174)
Source: FAPRI-MU stochastic baseline, March 2014
U.S. farm prices for corn
05/06
06/07
07/08
08/09
09/10
10/11
11/12
12/13
13/14
14/15
15/16
16/17
17/18
18/19
19/20
0
1
2
3
4
5
6
7
8
Actual/average#5#250#495Reference
Dolla
rs p
er
bush
el
Source: FAPRI-MU stochastic baseline, March 2014
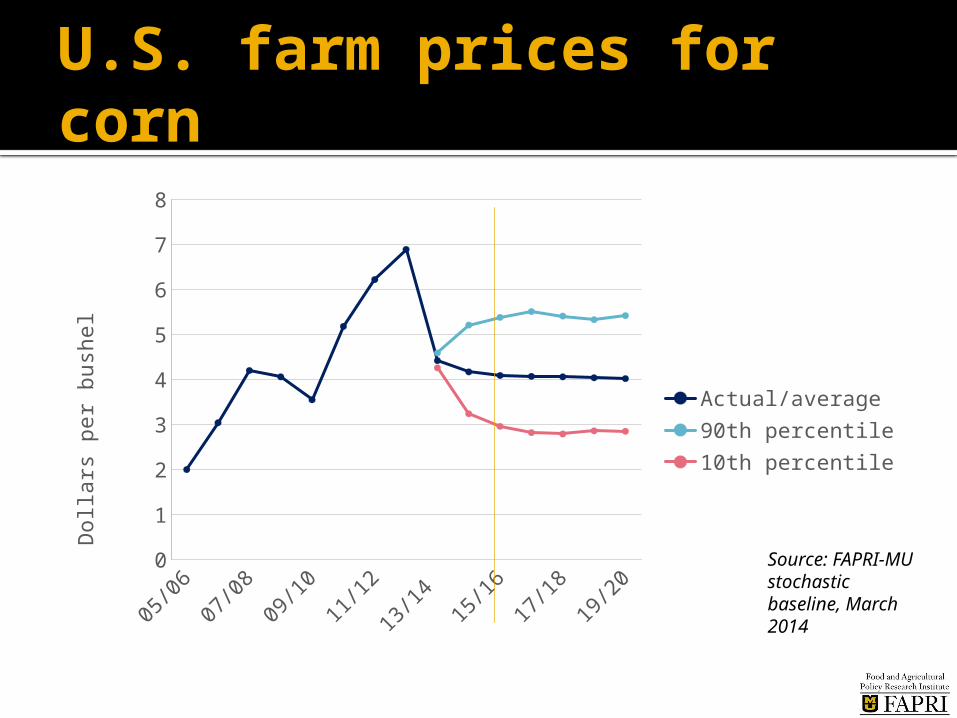
U.S. farm prices for corn
05/06
06/07
07/08
08/09
09/10
10/11
11/12
12/13
13/14
14/15
15/16
16/17
17/18
18/19
19/20
0
1
2
3
4
5
6
7
8
Actual/average90th percentile10th percentile
Dolla
rs p
er
bush
el
Source: FAPRI-MU stochastic baseline, March 2014
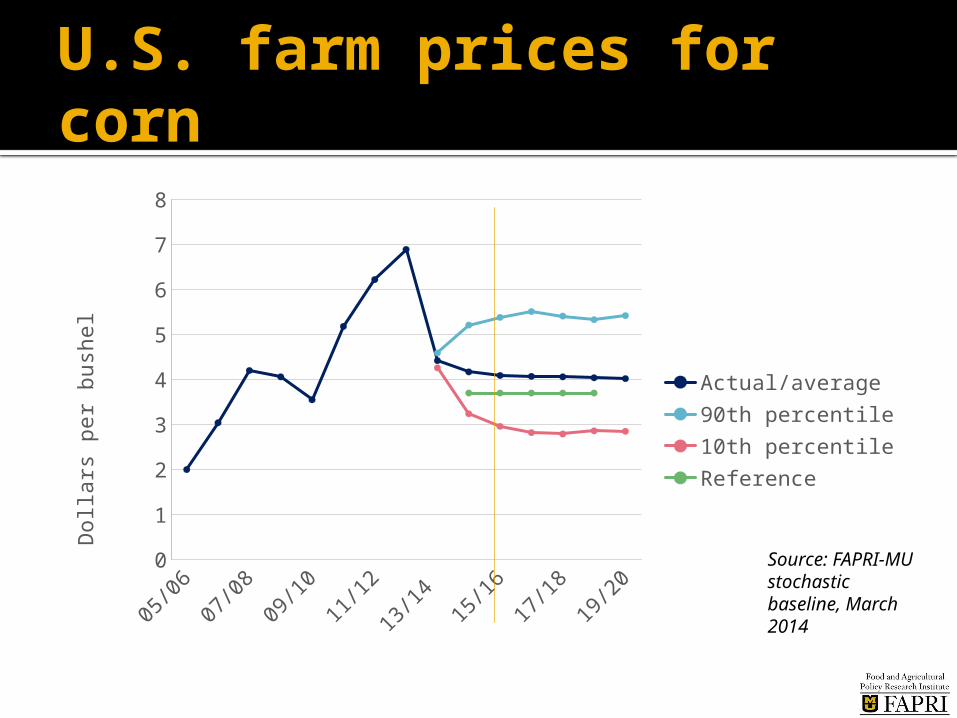
U.S. farm prices for corn
05/06
06/07
07/08
08/09
09/10
10/11
11/12
12/13
13/14
14/15
15/16
16/17
17/18
18/19
19/20
0
1
2
3
4
5
6
7
8
Actual/average90th percentile10th percentileReference
Dolla
rs p
er
bush
el
Source: FAPRI-MU stochastic baseline, March 2014
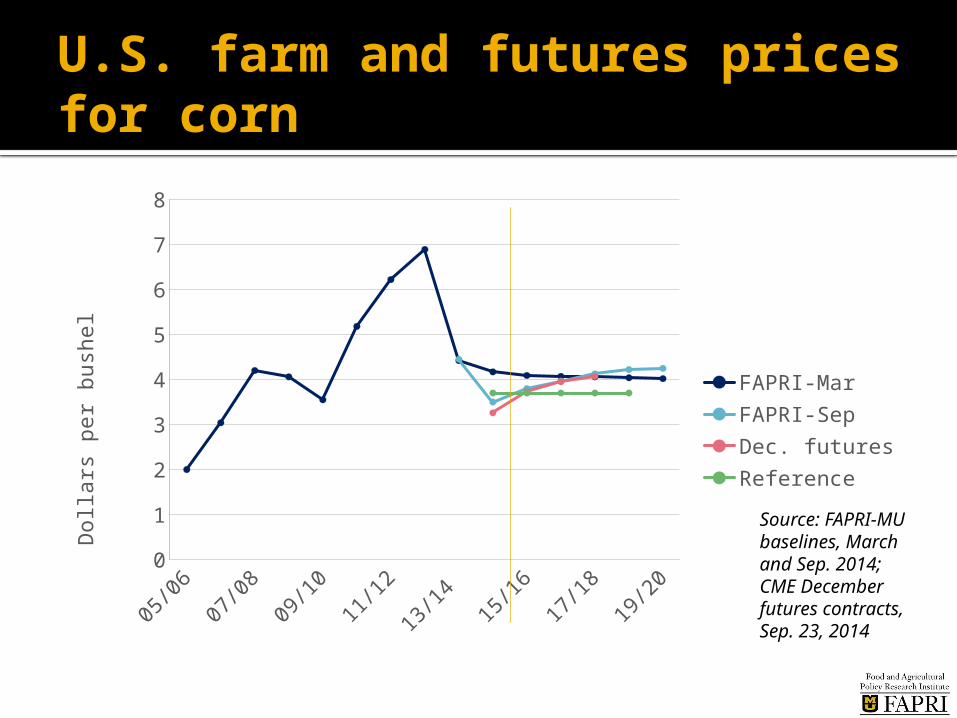
U.S. farm and futures prices for corn
05/06
06/07
07/08
08/09
09/10
10/11
11/12
12/13
13/14
14/15
15/16
16/17
17/18
18/19
19/20
0
1
2
3
4
5
6
7
8
FAPRI-MarFAPRI-SepDec. futuresReference
Dolla
rs p
er
bush
el
Source: FAPRI-MU baselines, March and Sep. 2014; CME December futures contracts, Sep. 23, 2014
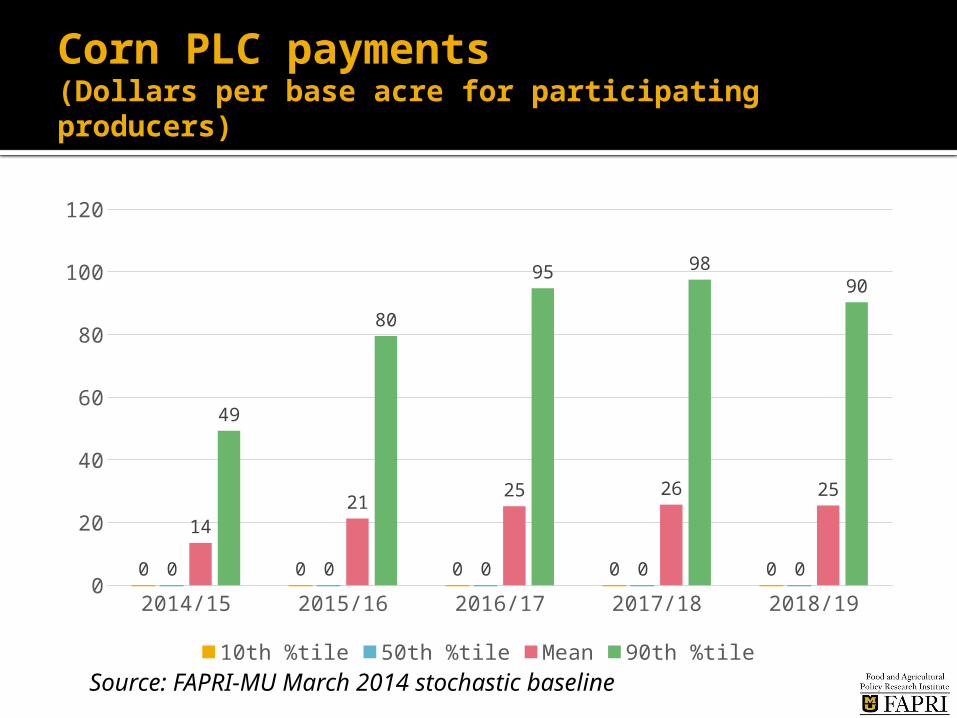
Corn PLC payments(Dollars per base acre for participating producers)
2014/15 2015/16 2016/17 2017/18 2018/190
20
40
60
80
100
120
0 0 0 0 00 0 0 0 0
1421
25 26 25
49
80
95 9890
10th %tile 50th %tile Mean 90th %tileSource: FAPRI-MU March 2014 stochastic baseline
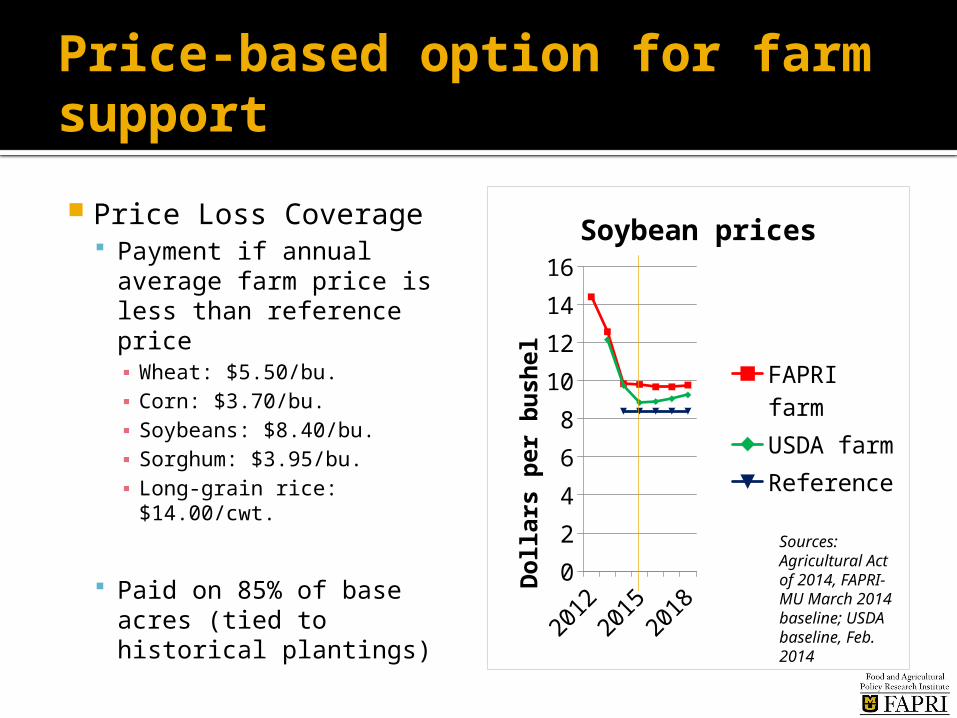
Price-based option for farm support
Price Loss Coverage Payment if annual
average farm price is less than reference price▪ Wheat: $5.50/bu. ▪ Corn: $3.70/bu.▪ Soybeans: $8.40/bu.▪ Sorghum: $3.95/bu.▪ Long-grain rice:
$14.00/cwt.
Paid on 85% of base acres (tied to historical plantings) 20
1220
1520
180
2
4
6
8
10
12
14
16
Soybean prices
FAPRI farmUSDA farmReference
Dollars
per
bu
sh
el
Sources: Agricultural Act of 2014, FAPRI-MU March 2014 baseline; USDA baseline, Feb. 2014
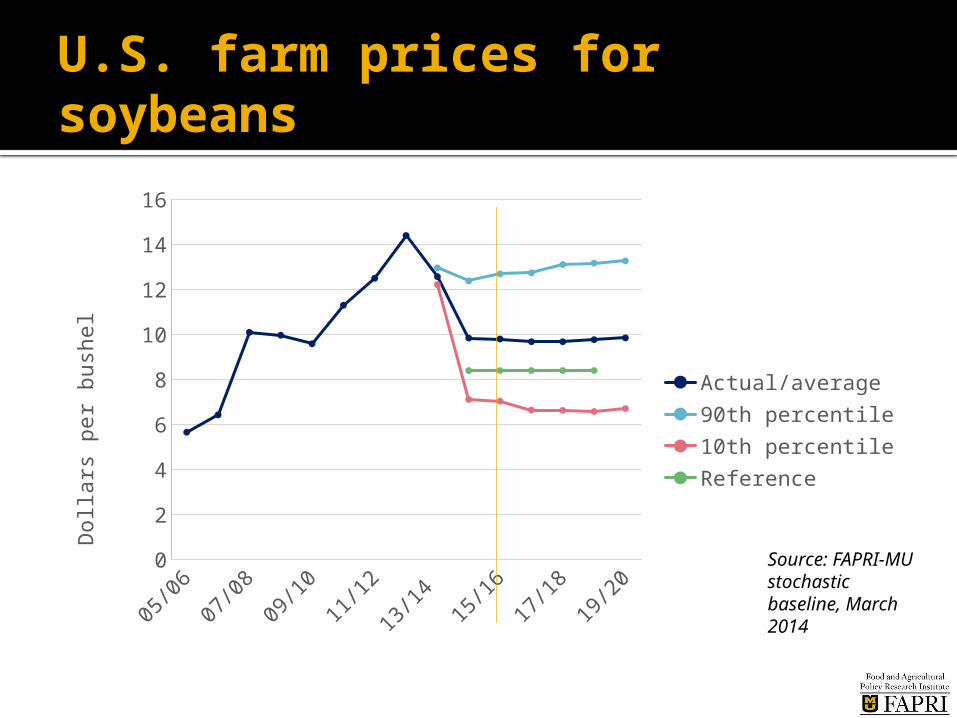
U.S. farm prices for soybeans
05/06
06/07
07/08
08/09
09/10
10/11
11/12
12/13
13/14
14/15
15/16
16/17
17/18
18/19
19/20
0
2
4
6
8
10
12
14
16
Actual/average90th percentile10th percentileReference
Dolla
rs p
er
bush
el
Source: FAPRI-MU stochastic baseline, March 2014

U.S. farm and futures prices for soybeans
05/06
06/07
07/08
08/09
09/10
10/11
11/12
12/13
13/14
14/15
15/16
16/17
17/18
18/19
19/20
0
2
4
6
8
10
12
14
16
FAPRI-Mar.FAPRI-Sep.Nov. futuresReference
Dolla
rs p
er
bush
el
Source: FAPRI-MU baselines, March and Sep. 2014; CME Nov. futures contracts, Sep. 23, 2014
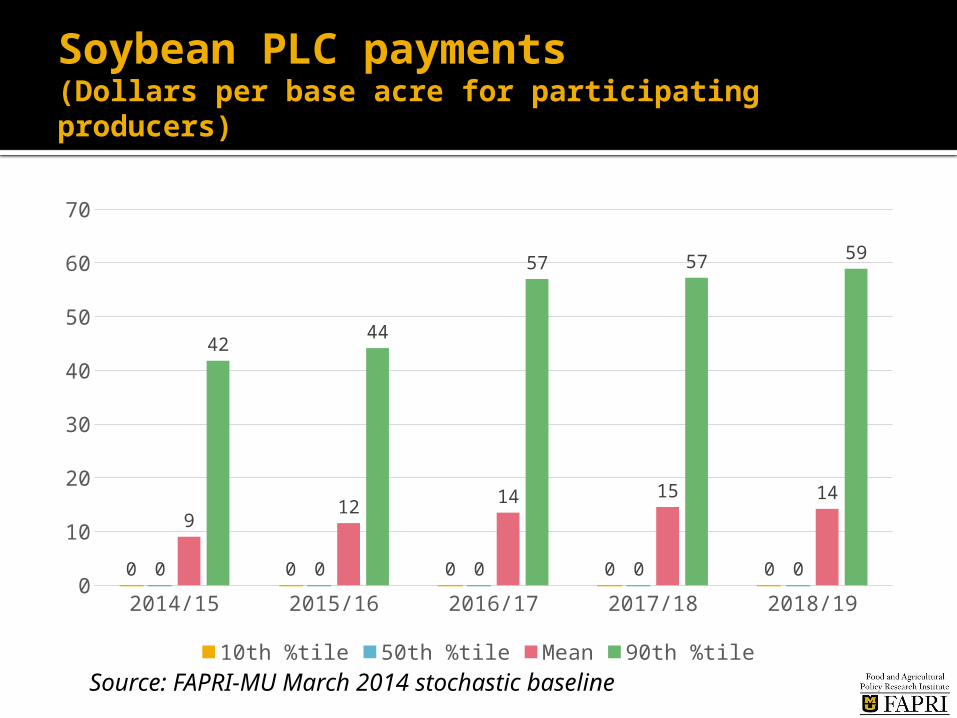
Soybean PLC payments(Dollars per base acre for participating producers)
2014/15 2015/16 2016/17 2017/18 2018/190
10
20
30
40
50
60
70
0 0 0 0 00 0 0 0 0
912
14 15 14
4244
57 57 59
10th %tile 50th %tile Mean 90th %tileSource: FAPRI-MU March 2014 stochastic baseline
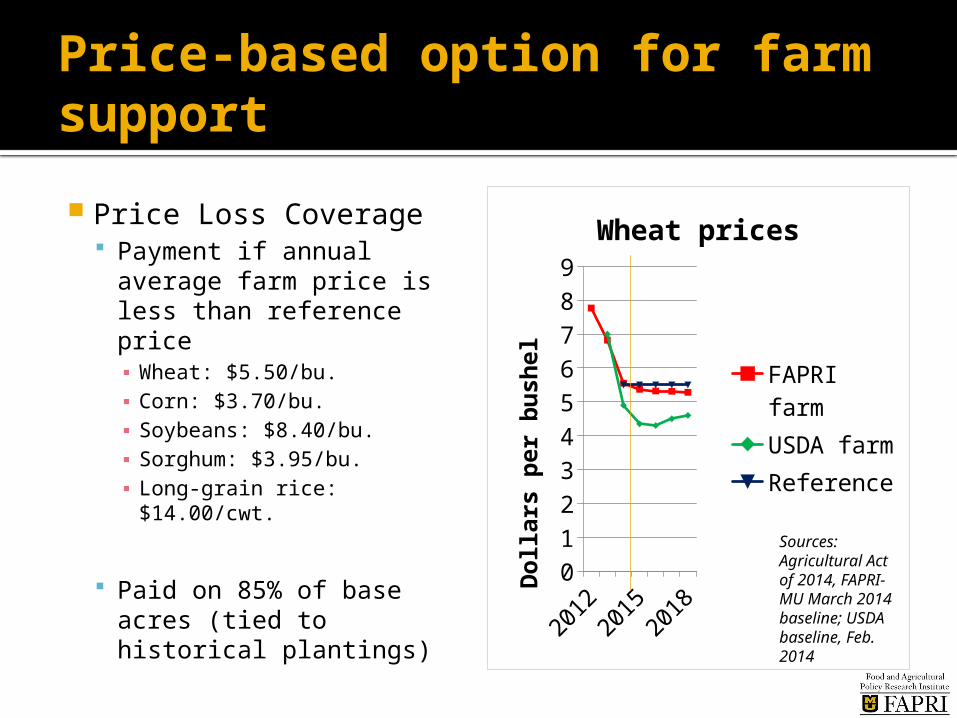
Price-based option for farm support
Price Loss Coverage Payment if annual
average farm price is less than reference price▪ Wheat: $5.50/bu. ▪ Corn: $3.70/bu.▪ Soybeans: $8.40/bu.▪ Sorghum: $3.95/bu.▪ Long-grain rice:
$14.00/cwt.
Paid on 85% of base acres (tied to historical plantings) 20
1220
1520
180
1
2
3
4
5
6
7
8
9
Wheat prices
FAPRI farmUSDA farmReference
Dollars
per
bu
sh
el
Sources: Agricultural Act of 2014, FAPRI-MU March 2014 baseline; USDA baseline, Feb. 2014
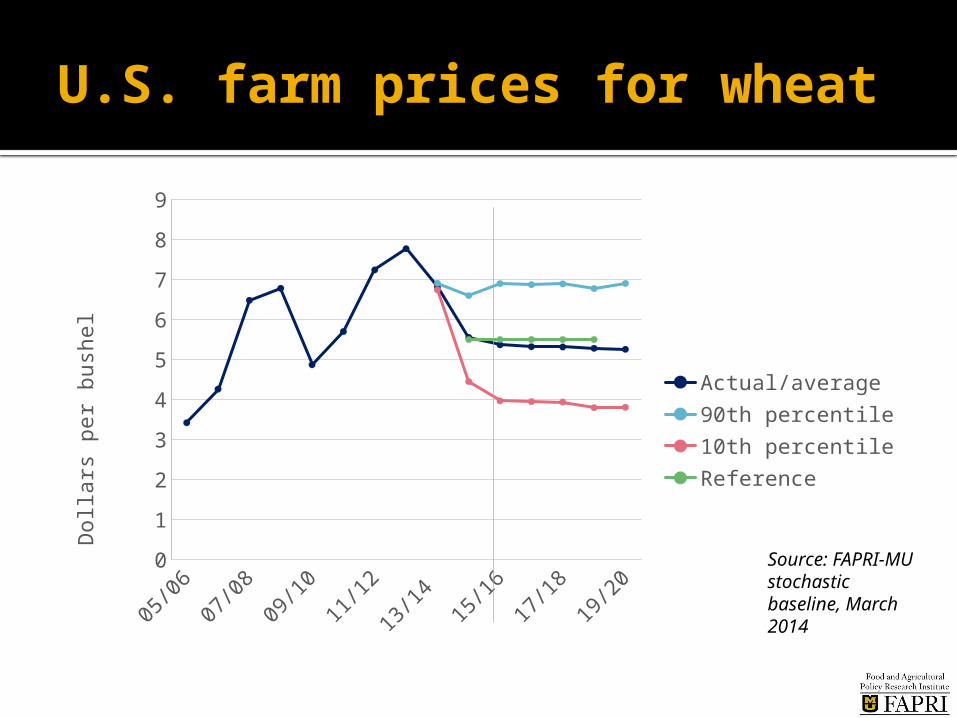
U.S. farm prices for wheat
05/06
06/07
07/08
08/09
09/10
10/11
11/12
12/13
13/14
14/15
15/16
16/17
17/18
18/19
19/20
0
1
2
3
4
5
6
7
8
9
Actual/average90th percentile10th percentileReference
Dolla
rs p
er
bush
el
Source: FAPRI-MU stochastic baseline, March 2014
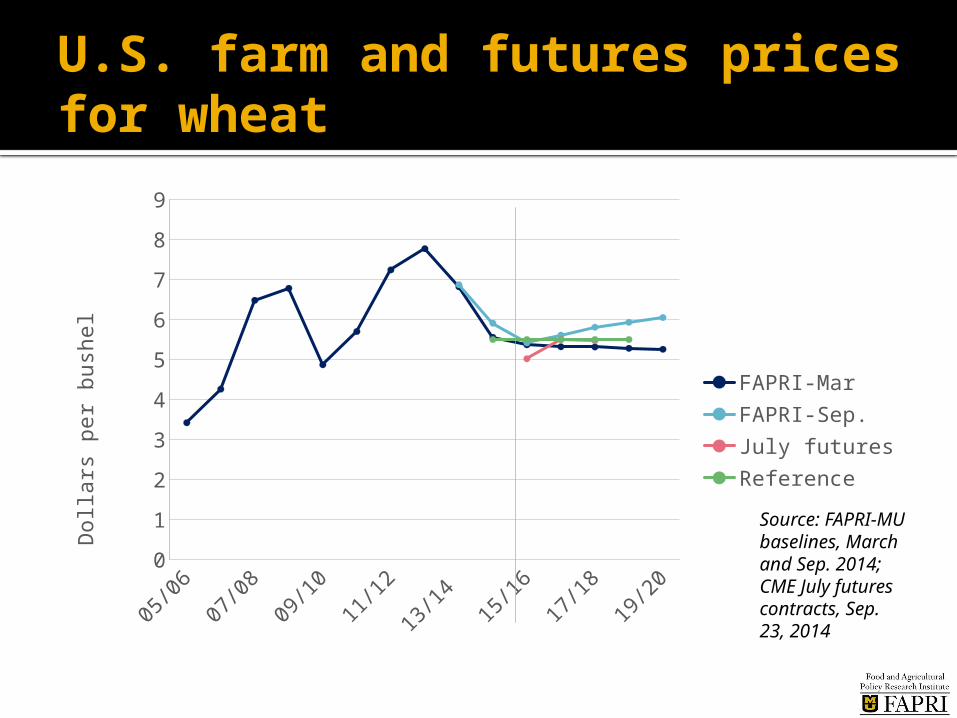
U.S. farm and futures prices for wheat
05/06
06/07
07/08
08/09
09/10
10/11
11/12
12/13
13/14
14/15
15/16
16/17
17/18
18/19
19/20
0
1
2
3
4
5
6
7
8
9
FAPRI-MarFAPRI-Sep.July futuresReference
Dolla
rs p
er
bush
el
Source: FAPRI-MU baselines, March and Sep. 2014; CME July futures contracts, Sep. 23, 2014

Wheat PLC payments(Dollars per base acre for participating producers)
2014/15 2015/16 2016/17 2017/18 2018/190
10
20
30
40
50
60
0 0 0 0 00
7 8 8 810
17 17 18 19
34
49 50 50
55
10th %tile 50th %tile Mean 90th %tile
Source: FAPRI-MU March 2014 stochastic baseline

Price-based option for farm support
Price Loss Coverage Payment if annual
average farm price is less than reference price▪ Wheat: $5.50/bu. ▪ Corn: $3.70/bu.▪ Soybeans: $8.40/bu.▪ Sorghum: $3.95/bu.▪ Long-grain rice:
$14.00/cwt.
Paid on 85% of base acres (tied to historical plantings) 20
1220
1520
1802468
1012141618
Long-grain rice prices
FAPRI farmUSDA farmReference
Dollars
per
cw
tSources: Agricultural Act of 2014, FAPRI-MU March 2014 baseline; USDA baseline, Feb. 2014
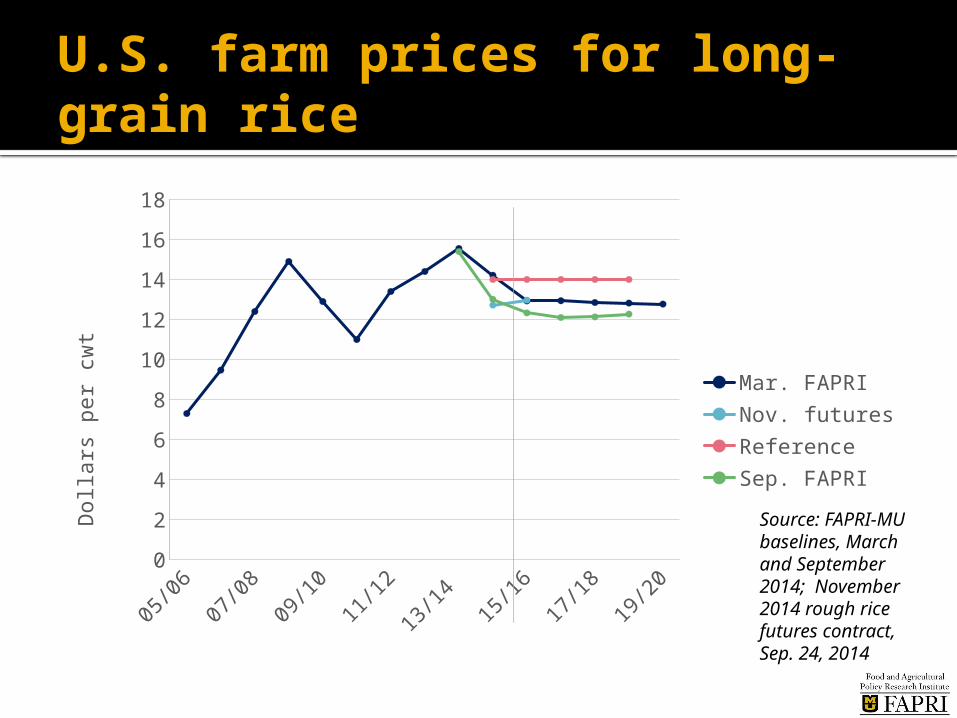
U.S. farm prices for long-grain rice
05/06
06/07
07/08
08/09
09/10
10/11
11/12
12/13
13/14
14/15
15/16
16/17
17/18
18/19
19/20
0
2
4
6
8
10
12
14
16
18
Mar. FAPRINov. futuresReferenceSep. FAPRI
Dolla
rs p
er
cwt
Source: FAPRI-MU baselines, March and September 2014; November 2014 rough rice futures contract, Sep. 24, 2014
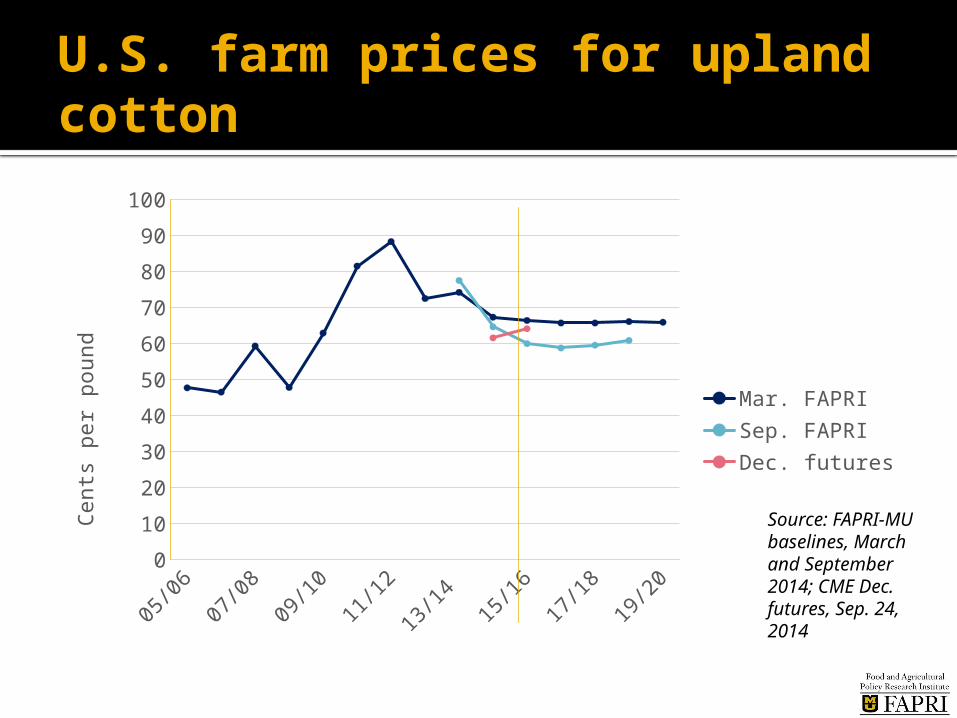
U.S. farm prices for upland cotton
05/06
06/07
07/08
08/09
09/10
10/11
11/12
12/13
13/14
14/15
15/16
16/17
17/18
18/19
19/20
0
10
20
30
40
50
60
70
80
90
100
Mar. FAPRISep. FAPRIDec. futures
Cents
per
pound
Source: FAPRI-MU baselines, March and September 2014; CME Dec. futures, Sep. 24, 2014
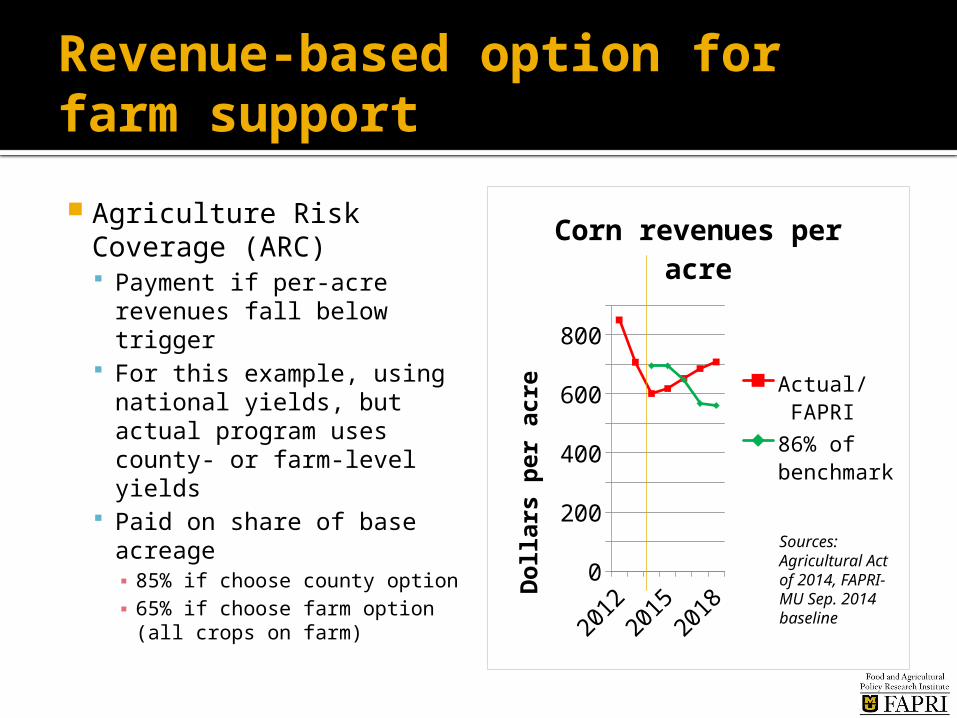
Revenue-based option for farm support
Agriculture Risk Coverage (ARC) Payment if per-acre
revenues fall below trigger
For this example, using national yields, but actual program uses county- or farm-level yields
Paid on share of base acreage▪ 85% if choose county option▪ 65% if choose farm option
(all crops on farm)20
1220
1520
180
100200300400500600700800900
Corn revenues per acre
Actual/ FAPRI86% of benchmark
Dollars
per
acre
Sources: Agricultural Act of 2014, FAPRI-MU Sep. 2014 baseline
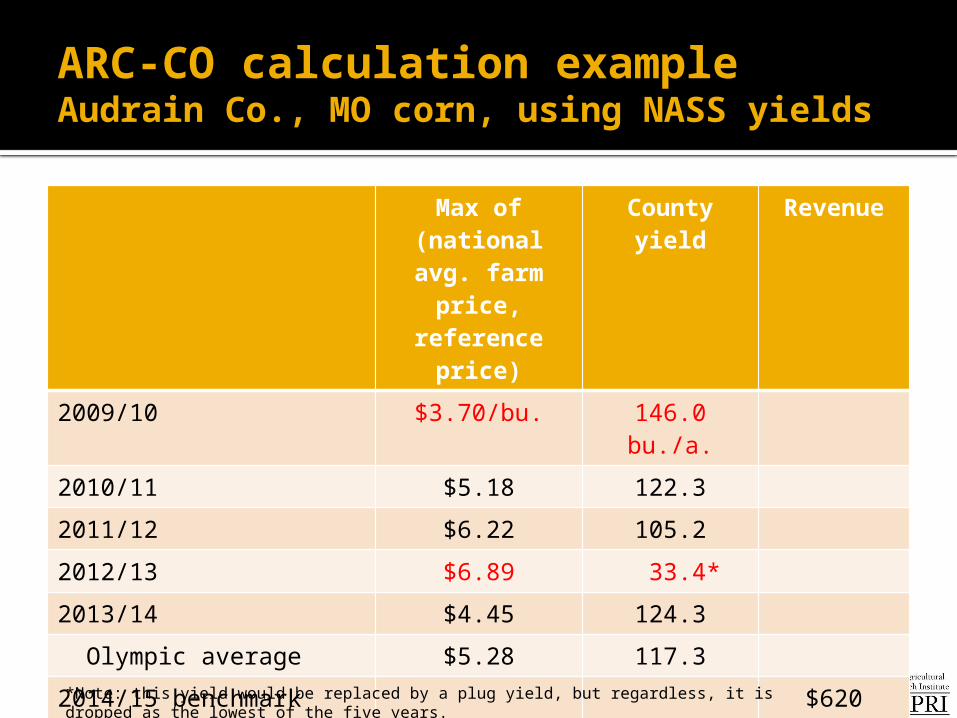
ARC-CO calculation exampleAudrain Co., MO corn, using NASS yields
Max of (national avg.
farm price, reference
price)
County yield
Revenue
2009/10 $3.70/bu. 146.0 bu./a.
2010/11 $5.18 122.3
2011/12 $6.22 105.2
2012/13 $6.89 33.4*
2013/14 $4.45 124.3
Olympic average $5.28 117.3
2014/15 benchmark revenue
$620
86% of benchmark $533
1st option triggering payments
$3.90 <137 <$533
2nd option triggering payments
<$3.55 150 <$533
*Note: this yield would be replaced by a plug yield, but regardless, it is dropped as the lowest of the five years.

Corn ARC payments(Dollars per base acre for participating producers)
2014/15 2015/16 2016/17 2017/18 2018/190
10
20
30
40
50
60
3 31 0 0
21
25
20
96
2527
24
1613
4953 52
45
40
10th %tile 50th %tile Mean 90th %tileSource: FAPRI-MU March 2014 stochastic baseline

Avg. corn ARC and PLC payments(Dollars per base acre for participating producers)
2014/15 2015/16 2016/17 2017/18 2018/190
5
10
15
20
25
30
25
27
24
16
1314
21
25 26 25
ARC PLCSource: FAPRI-MU March 2014 stochastic baseline

Avg. corn ARC and PLC payments(Dollars per base acre for participating producers)
2014/15 2015/16 2016/17 2017/18 2018/190
5
10
15
20
25
30
25
27
24
16
1314
21
25 26 25
ARC PLCSource: FAPRI-MU March 2014 stochastic baseline
Given Sep. baseline prices, 2014 expected payments would be considerably higher under both programs.

Revenue-based option for farm support
Agriculture Risk Coverage (ARC) Payment if per-acre
revenues fall below trigger
For this example, using national yields, but actual program uses county- or farm-level yields
Paid on share of base acreage▪ 85% if choose county option▪ 65% if choose farm option
(all crops on farm)20
1220
1520
180
100
200
300
400
500
600
700
Soy revenues per acre
Actual/ FAPRI86% of benchmark
Dollars
per
acre
Sources: Agricultural Act of 2014, FAPRI-MU Sep. 2014 baseline
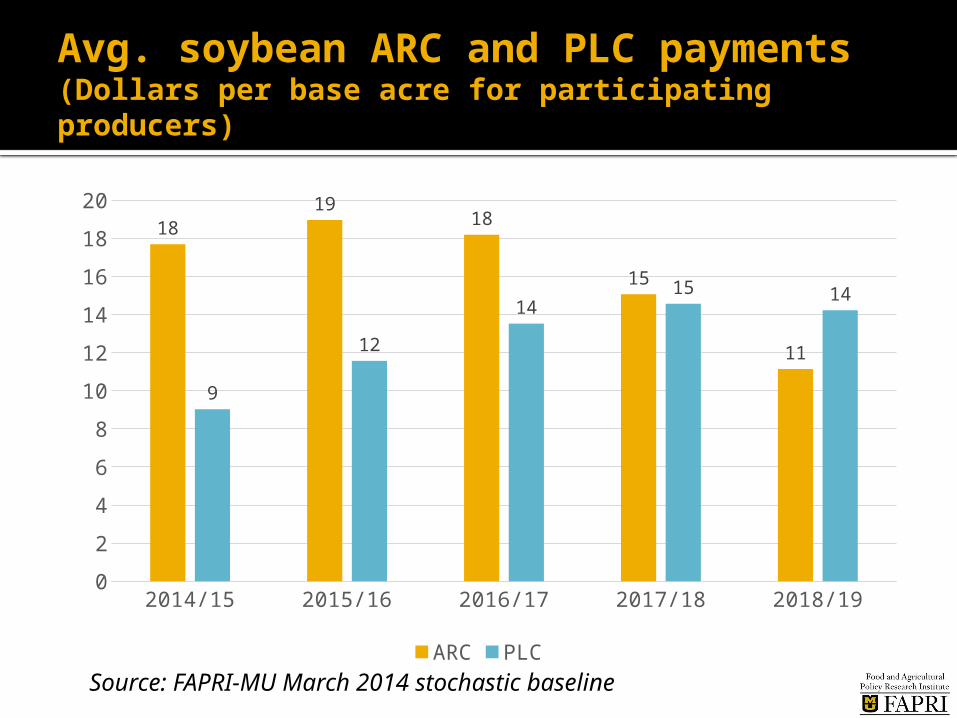
Avg. soybean ARC and PLC payments(Dollars per base acre for participating producers)
2014/15 2015/16 2016/17 2017/18 2018/190
2
4
6
8
10
12
14
16
18
2018
1918
15
11
9
12
1415 14
ARC PLCSource: FAPRI-MU March 2014 stochastic baseline
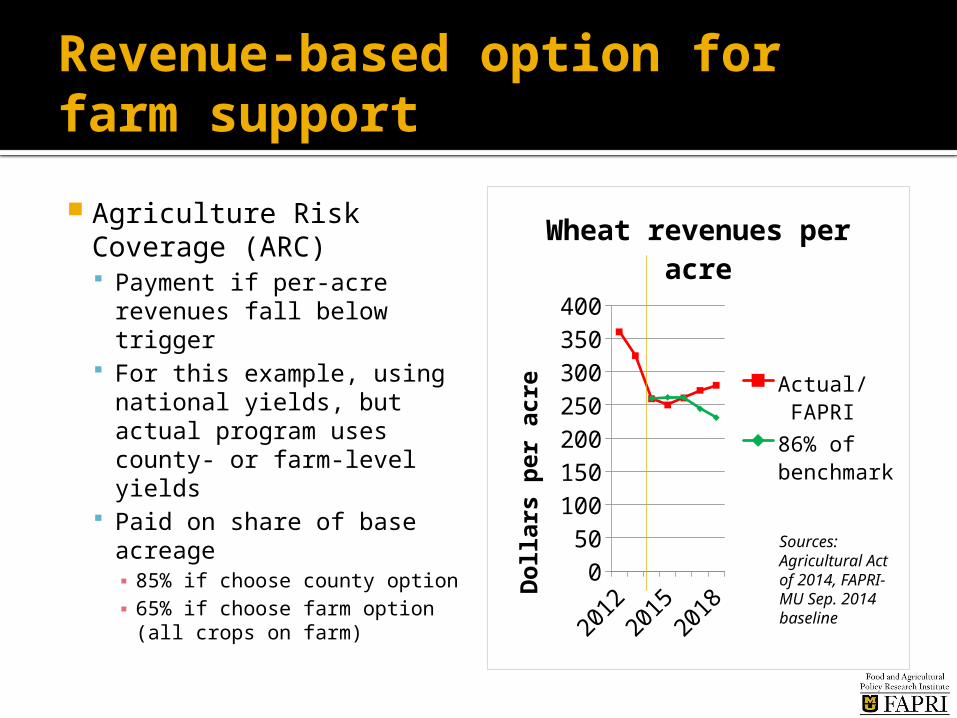
Revenue-based option for farm support
Agriculture Risk Coverage (ARC) Payment if per-acre
revenues fall below trigger
For this example, using national yields, but actual program uses county- or farm-level yields
Paid on share of base acreage▪ 85% if choose county option▪ 65% if choose farm option
(all crops on farm)20
1220
1520
180
50
100
150
200
250
300
350
400
Wheat revenues per acre
Actual/ FAPRI86% of benchmark
Dollars
per
acre
Sources: Agricultural Act of 2014, FAPRI-MU Sep. 2014 baseline

Avg. wheat ARC and PLC payments(Dollars per base acre for participating producers)
2014/15 2015/16 2016/17 2017/18 2018/190
2
4
6
8
10
12
14
16
18
20
1011 11
9
7
10
17 1718
19
ARC PLCSource: FAPRI-MU March 2014 stochastic baseline

Avg. wheat ARC and PLC payments(Dollars per base acre for participating producers)
2014/15 2015/16 2016/17 2017/18 2018/190
2
4
6
8
10
12
14
16
18
20
1011 11
9
7
10
17 1718
19
ARC PLCSource: FAPRI-MU March 2014 stochastic baseline
Given Sep. baseline prices, 2014 expected payments would be lower under PLC.
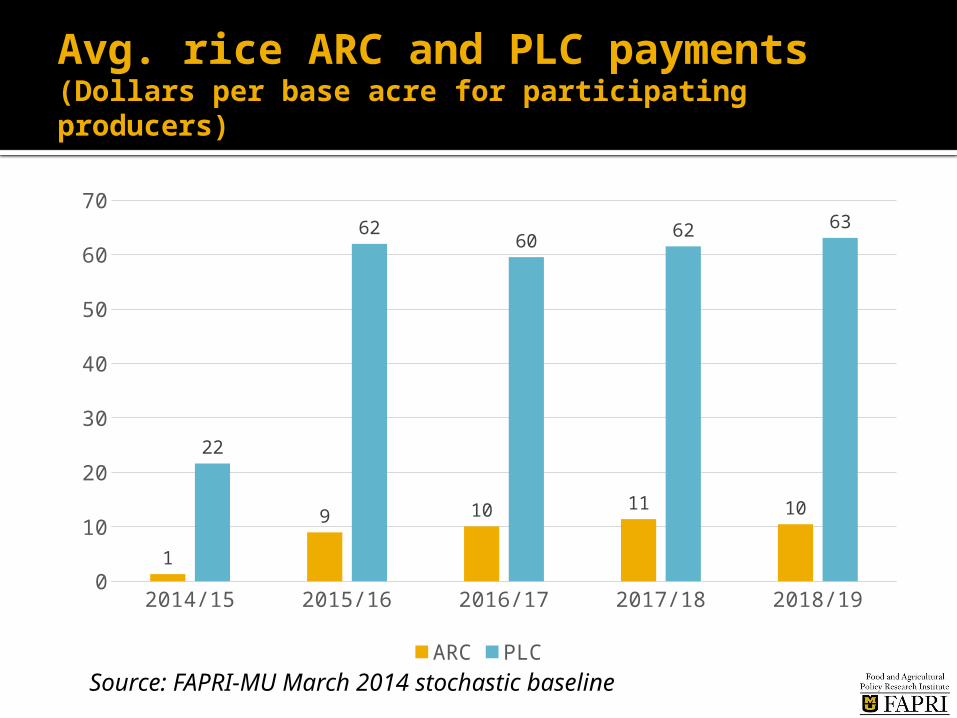
Avg. rice ARC and PLC payments(Dollars per base acre for participating producers)
2014/15 2015/16 2016/17 2017/18 2018/190
10
20
30
40
50
60
70
1
9 10 11 10
22
6260
62 63
ARC PLCSource: FAPRI-MU March 2014 stochastic baseline

Back to Audrain Co., MO corn2014/15 crop year payments
2014/15 national season-average corn price
PLC payment per base acre(program yield= 100 bu./a.)
ARC payment per base acre if county yield is 110 bu./a.
ARC payment per base acre if county yield is 130 bu./a.
ARC payment per base acre if county yield is 150 bu./a.
3.00 $59.50 $52.66 $52.66 $52.66
3.20 $42.50 $52.66 $52.66 $44.90
3.40 $25.50 $52.66 $52.66 $19.40
3.60 $8.50 $52.66 $52.66 $0.00
3.80 $0.00 $52.66 $33.00 $0.00
4.00 $0.00 $52.66 $10.90 $0.00
4.20 $0.00 $52.66 $0.00 $0.00
4.40 $0.00 $41.50 $0.00 $0.00
4.60 $0.00 $22.80 $0.00 $0.00
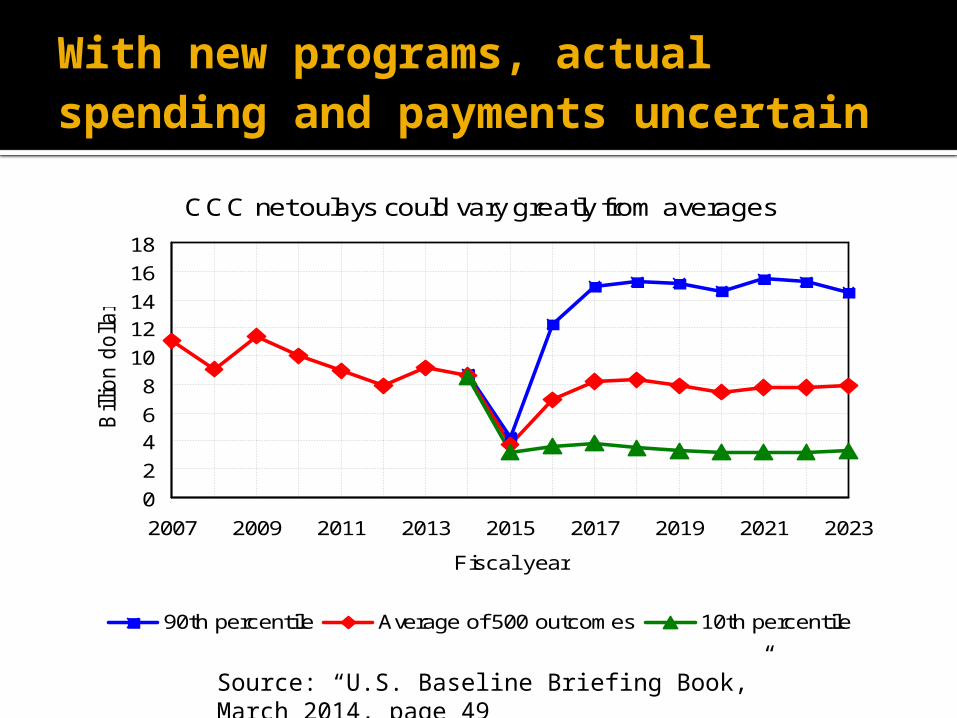
With new programs, actual spending and payments uncertain
Source: “U.S. Baseline Briefing Book,” March 2014, page 49
CCC net oulays could vary greatly from averages
0
2
46
8
10
1214
16
18
2007 2009 2011 2013 2015 2017 2019 2021 2023
Fiscal year
Bill
ion d
olla
rs
90th percentile Average of 500 outcomes 10th percentile

Thanks!
FAPRI-MU website: www.fapri.missouri.edu
To contact Pat Westhoff: 573-882-4647 [email protected]
du
FAPRI-MU team: Julian Binfield Sera Chiuchiarelli Deepayan Debnath Scott Gerlt Lauren Jackson Willi Meyers Wyatt Thompson Jarrett Whistance Peter Zimmel