Embed Size (px)
Citation preview

Patrick Long and Steve Roberts May 2014
Overview of Midstream and Downstream: Highlighting Current Events and Their Impact on the Back Office
Did You Know…
…the 42 gallon barrel originated with John D. Rockefeller?
Some oil was spilled during one of his early shipments. The result was 50 gallons a barrel now being 42…
Agenda
Introduction to Opportune Process & Technology Downstream Overview Crude Origin Logistics Refining Final Thoughts
Introduction to Opportune
Opportune at a glance
Opportune is a leading energy consulting firm, serving clients throughout North America and Europe from offices in Houston, Denver, and London.
We are unique in that we have the deep energy expertise of a large firm, but the nimbleness of a smaller firm.
We bring heavily experienced teams to deliver value to our clients in addressing complex strategic, transaction, process and technology issues.
Practice Areas• Process and Technology• Corporate finance• Complex financial reporting• Strategy and organization• Restructuring & Bankruptcy• Strategic Tax
Energy Segments• Energy trading and risk management• Upstream oil & gas• Refining & marketing• Power generation• Transport/distribution and storage
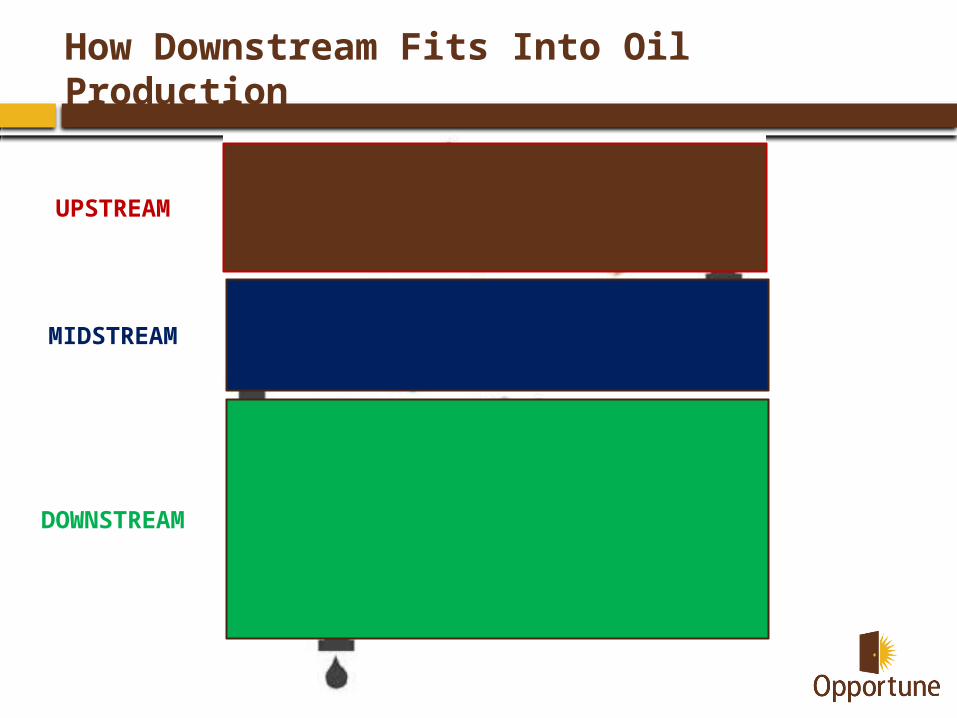
How Downstream Fits Into Oil Production
UPSTREAM
MIDSTREAM
DOWNSTREAM
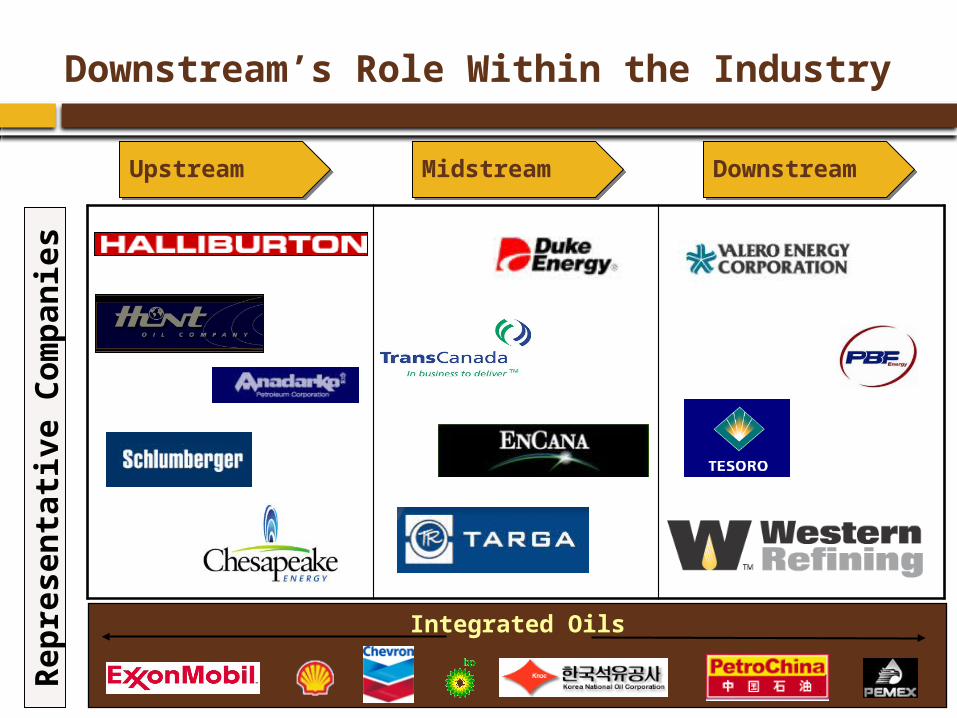
Downstream’s Role Within the Industry
MidstreamMidstream DownstreamDownstreamUpstreamUpstream
Integrated Oils
Rep
rese
nta
tive
Co
mp
anie
s
Energy is in the News
7
Senate Asks EIA to Study Crude Oil Export
Crude by Rail Costs Rival PipelineAdministration Delays
Keystone XL Decision
Environmental Groups Want Extensive Oil Review
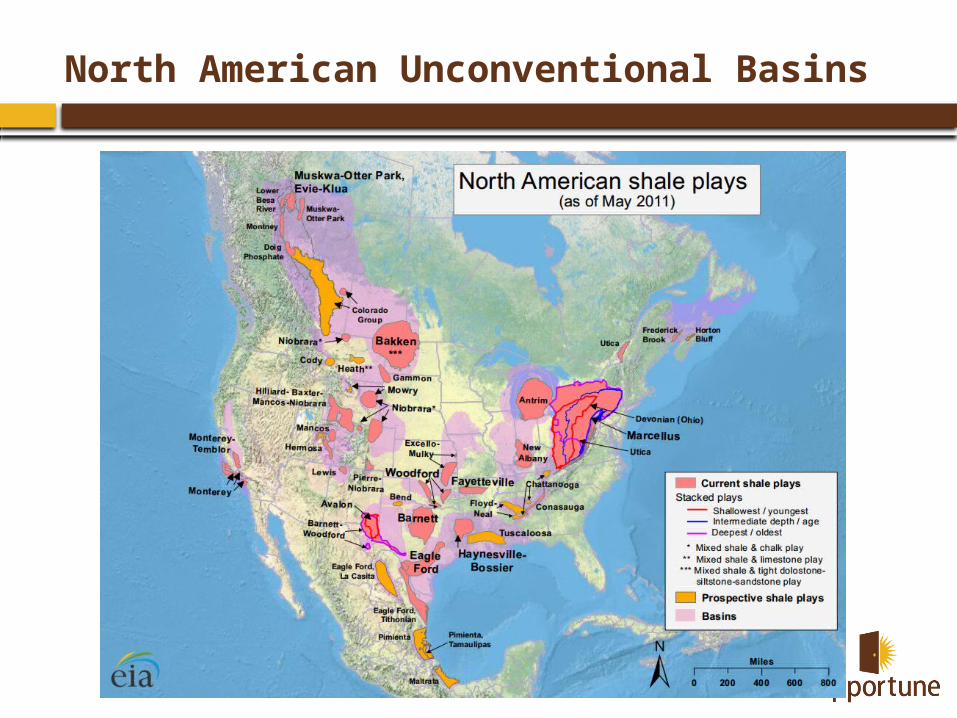
North American Unconventional Basins
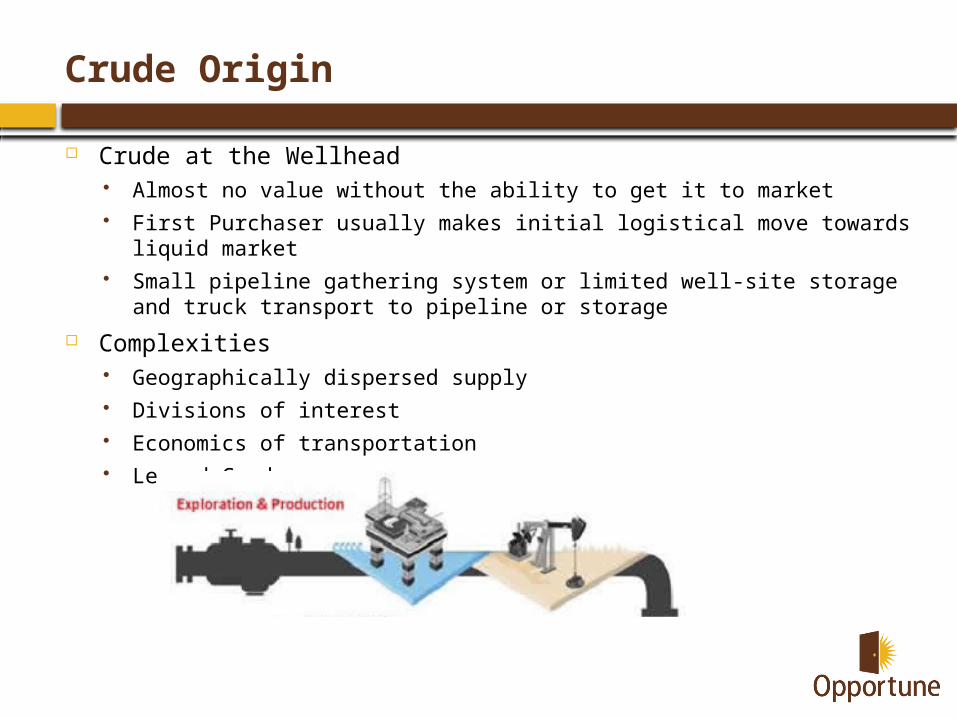
Crude Origin
Crude at the Wellhead Almost no value without the ability to get it to market First Purchaser usually makes initial logistical move towards liquid market Small pipeline gathering system or limited well-site storage and truck
transport to pipeline or storage
Complexities Geographically dispersed supply Divisions of interest Economics of transportation Leased Crude
Crude Origin
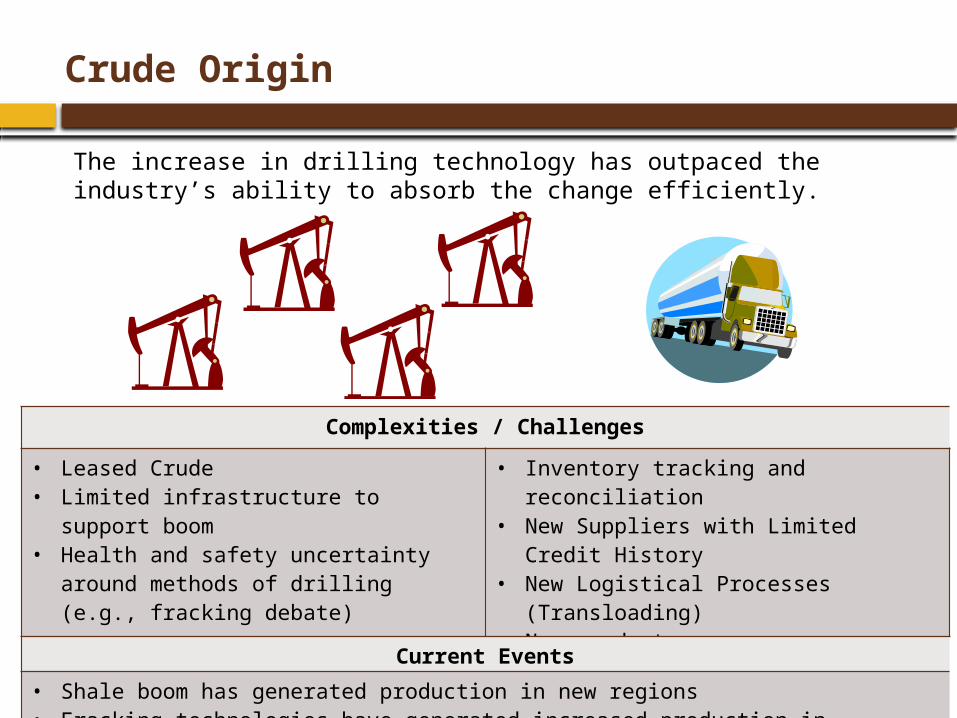
The increase in drilling technology has outpaced the industry’s ability to absorb the change efficiently.
Complexities / Challenges
• Leased Crude• Limited infrastructure to support boom• Health and safety uncertainty around
methods of drilling (e.g., fracking debate)
• Inventory tracking and reconciliation• New Suppliers with Limited Credit History• New Logistical Processes (Transloading)• New crude types
Current Events
• Shale boom has generated production in new regions• Fracking technologies have generated increased production in existing regions
Crude Origin – Accounting Impacts
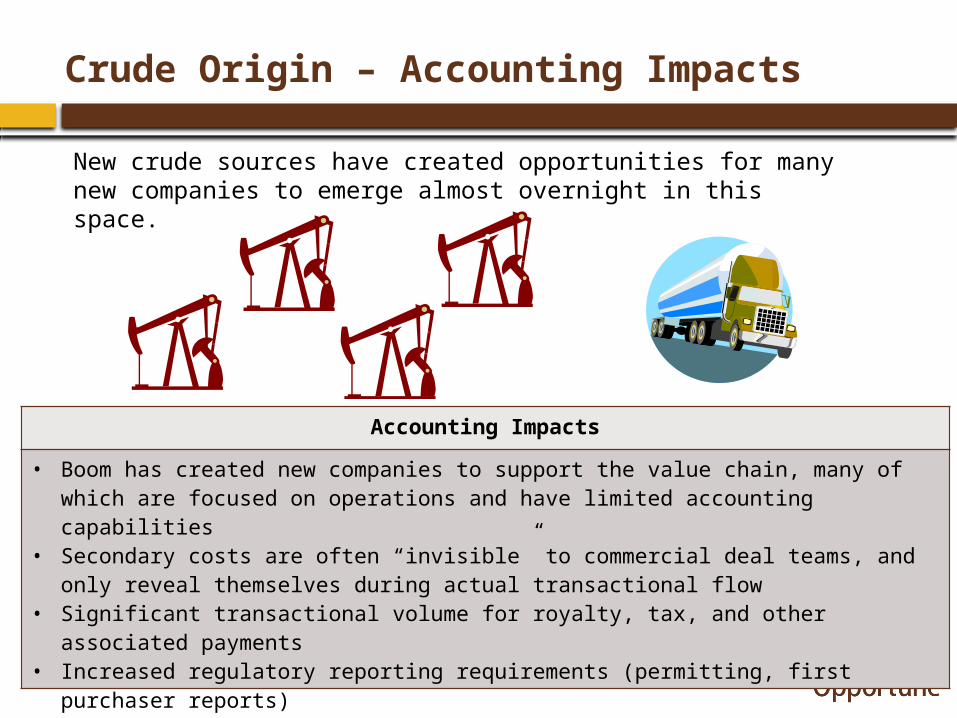
New crude sources have created opportunities for many new companies to emerge almost overnight in this space.
Accounting Impacts
• Boom has created new companies to support the value chain, many of which are focused on operations and have limited accounting capabilities
• Secondary costs are often “invisible” to commercial deal teams, and only reveal themselves during actual transactional flow
• Significant transactional volume for royalty, tax, and other associated payments• Increased regulatory reporting requirements (permitting, first purchaser reports)
Crude Logistics
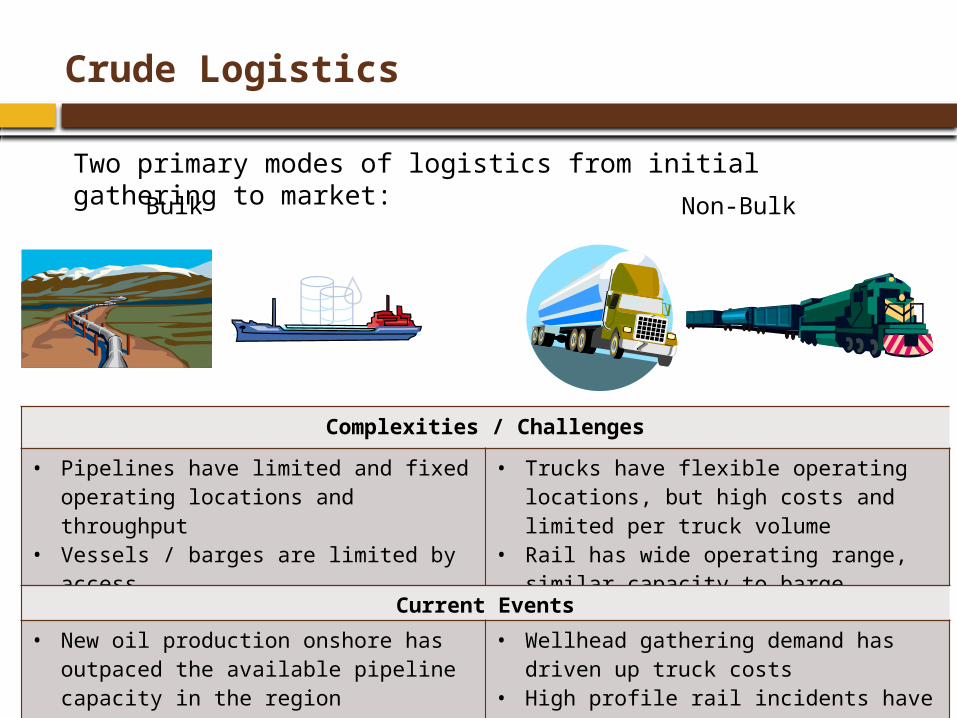
Two primary modes of logistics from initial gathering to market:Bulk Non-Bulk
Complexities / Challenges
• Pipelines have limited and fixed operating locations and throughput
• Vessels / barges are limited by access
• Trucks have flexible operating locations, but high costs and limited per truck volume
• Rail has wide operating range, similar capacity to barge
Current Events
• New oil production onshore has outpaced the available pipeline capacity in the region
• Cyclical swings in marine utilization has current costs very high
• Wellhead gathering demand has driven up truck costs
• High profile rail incidents have increased scrutiny on operations
Crude Logistics – Accounting Impacts
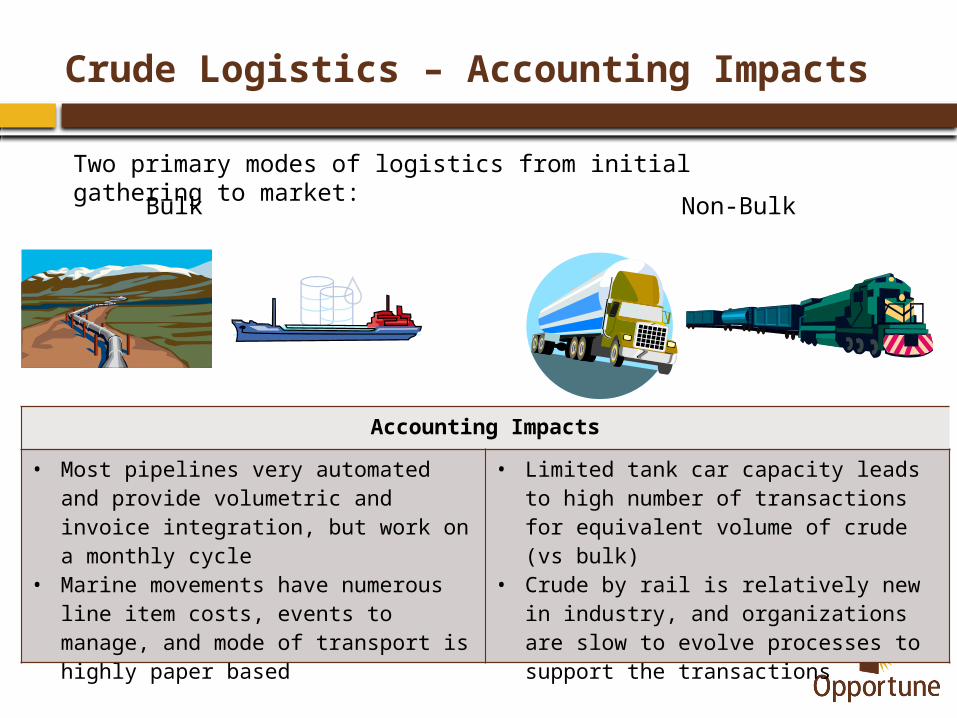
Two primary modes of logistics from initial gathering to market:
Bulk Non-Bulk
Accounting Impacts
• Most pipelines very automated and provide volumetric and invoice integration, but work on a monthly cycle
• Marine movements have numerous line item costs, events to manage, and mode of transport is highly paper based
• Limited tank car capacity leads to high number of transactions for equivalent volume of crude (vs bulk)
• Crude by rail is relatively new in industry, and organizations are slow to evolve processes to support the transactions
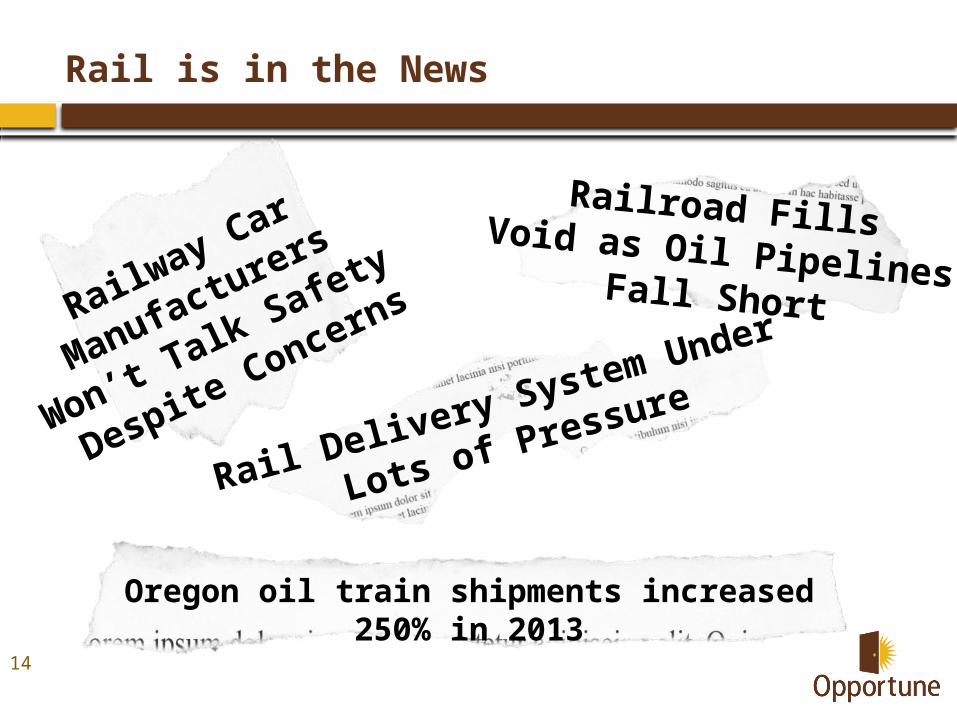
Rail is in the News
14
Oregon oil train shipments increased 250% in 2013
Railroad Fills Void as Oil Pipelines Fall Short
Rail Delivery System Under
Lots of Pressure
Railway Car
Manufacturers
Won’t Talk Safety
Despite Concerns
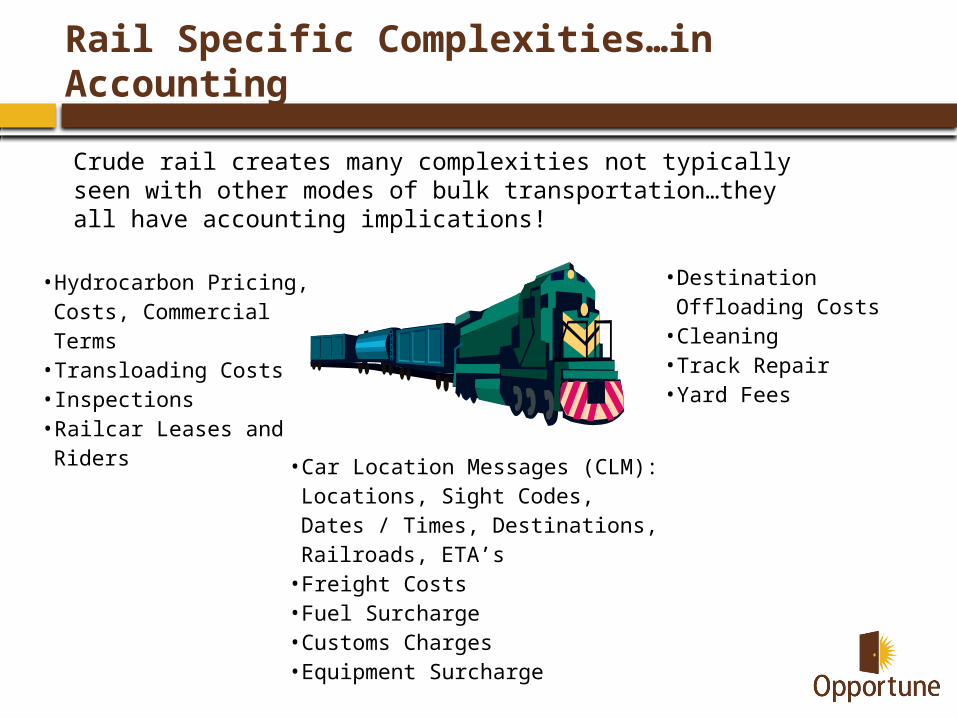
Rail Specific Complexities…in Accounting
• Hydrocarbon Pricing, Costs, Commercial Terms
• Transloading Costs• Inspections• Railcar Leases and Riders • Car Location Messages (CLM):
Locations, Sight Codes, Dates / Times, Destinations, Railroads, ETA’s
• Freight Costs• Fuel Surcharge• Customs Charges• Equipment Surcharge
• Destination Offloading Costs
• Cleaning• Track Repair• Yard Fees
Crude rail creates many complexities not typically seen with other modes of bulk transportation…they all have accounting implications!
40
35
30
25
20
15
10
5
0
0 0.5 1 1.5 2 2.5 3 3.5
HighHigh
LowLow
HighHigh
Light
Heavy
APIGravity(API)
Sweet SourSulfur (%)
Libyan
USA WTI
North Sea Brent
Nigerian Forecados
Indonesian Duri
Arab Light
DubaiArab Medium
Arab Heavy
Alaskan North Slope
Venezuelan BCF-17
Mexican Maya Venezuelan Pilon
Ural
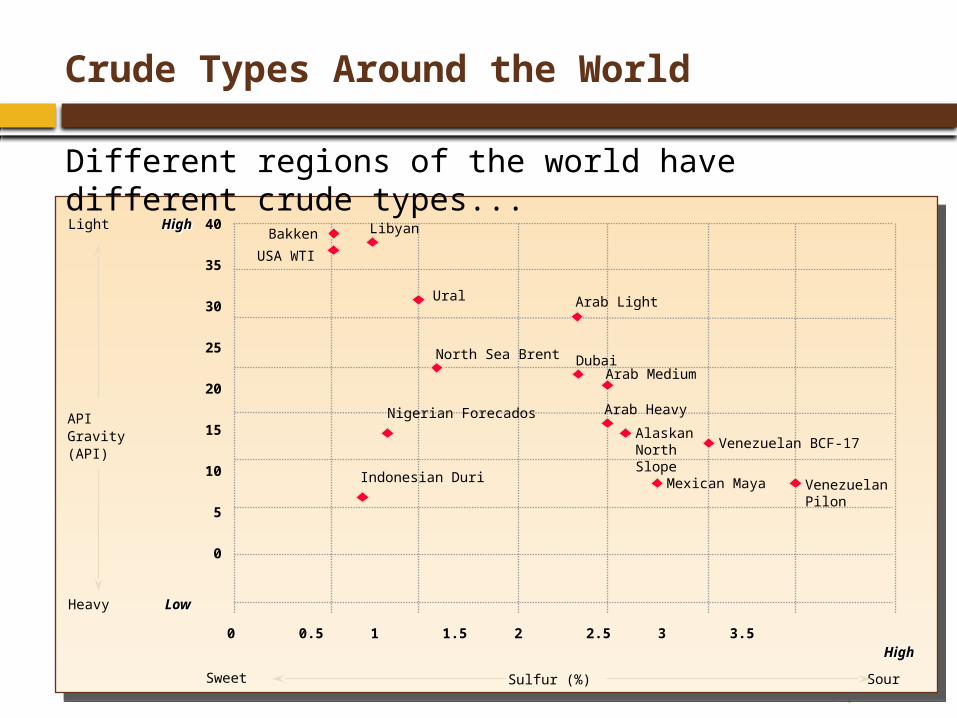
Crude Types Around the World
Different regions of the world have different crude types...
Bakken
Crude Properties
Light or heavy designation depends on the average molecular weight of the crude oil. Heavy oils are high in either tar (asphaltic) compounds,
polyaromatics, or both. Light oils are high in low molecular weight compounds, like
small alkanes. Light crude is easier to process which brings a higher price.
Sweet or sour depends on the sulfur content. Sweet crudes have a low sulfur content. Sour crudes have a high sulfur content. Sweet crude is easier to process which brings a higher price.
Converting Crude to Refined Product
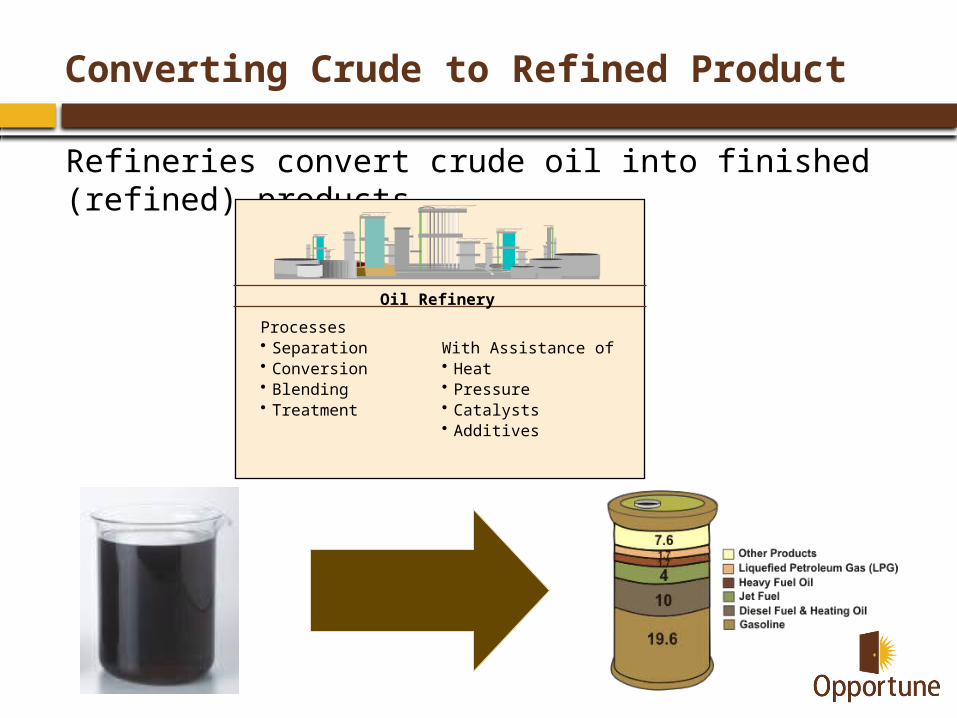
Refineries convert crude oil into finished (refined) products
Processes• Separation• Conversion• Blending• Treatment
With Assistance of• Heat• Pressure• Catalysts• Additives
Oil Refinery
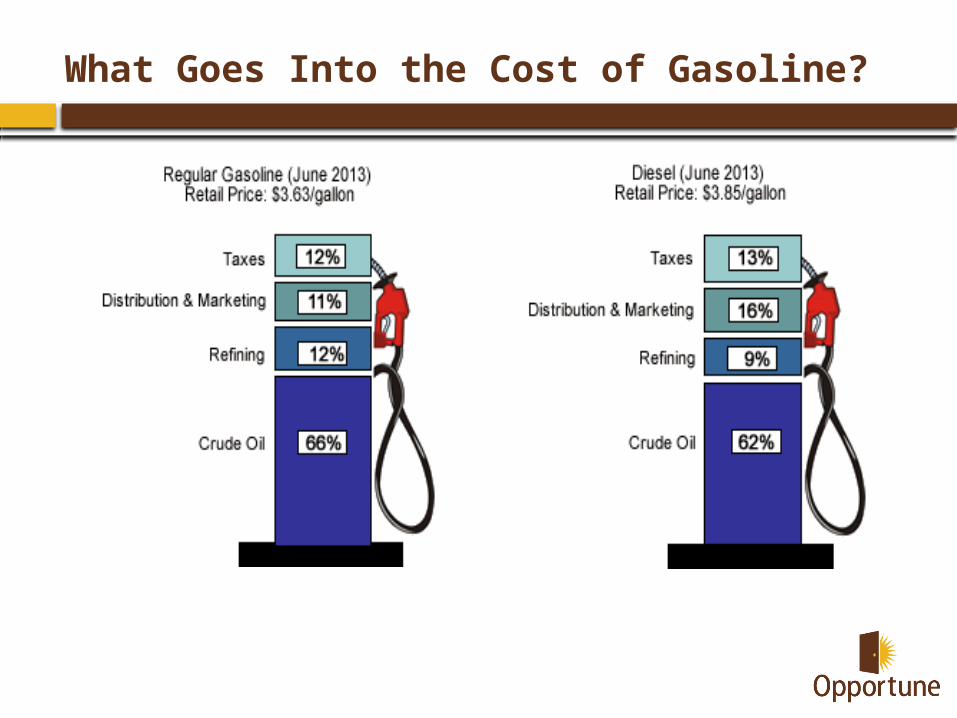
What Goes Into the Cost of Gasoline?
Refinery Types and Crude Optionality
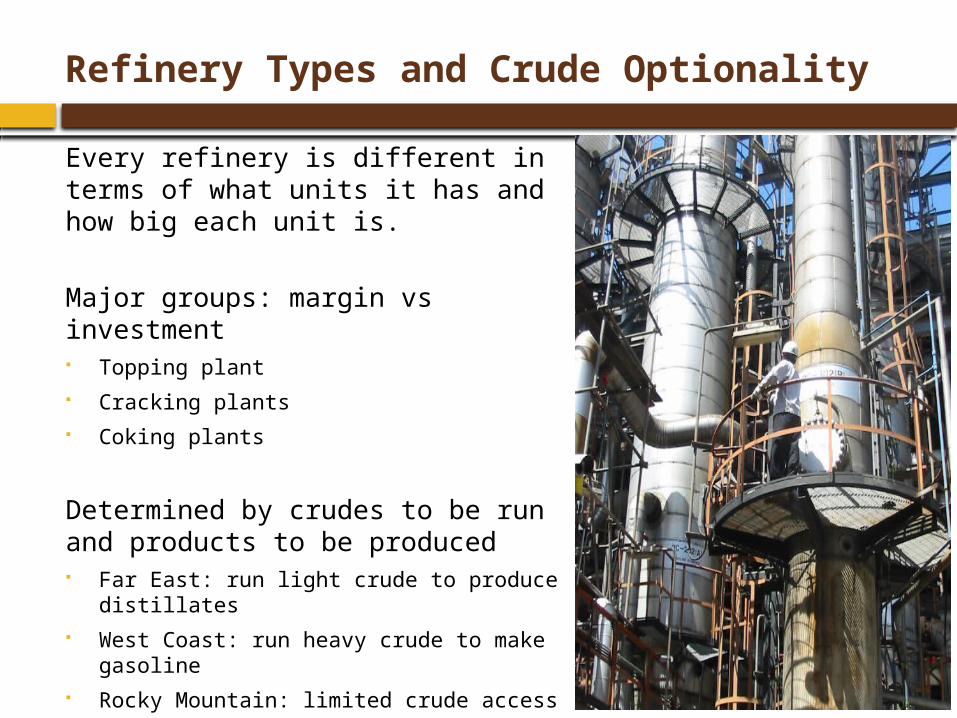
Every refinery is different in terms of what units it has and how big each unit is.
Major groups: margin vs investment Topping plant Cracking plants Coking plants
Determined by crudes to be run and products to be produced Far East: run light crude to produce
distillates West Coast: run heavy crude to make
gasoline Rocky Mountain: limited crude access East Coast: must produce home heating oil
Crude Conversion Happens in Different Ways
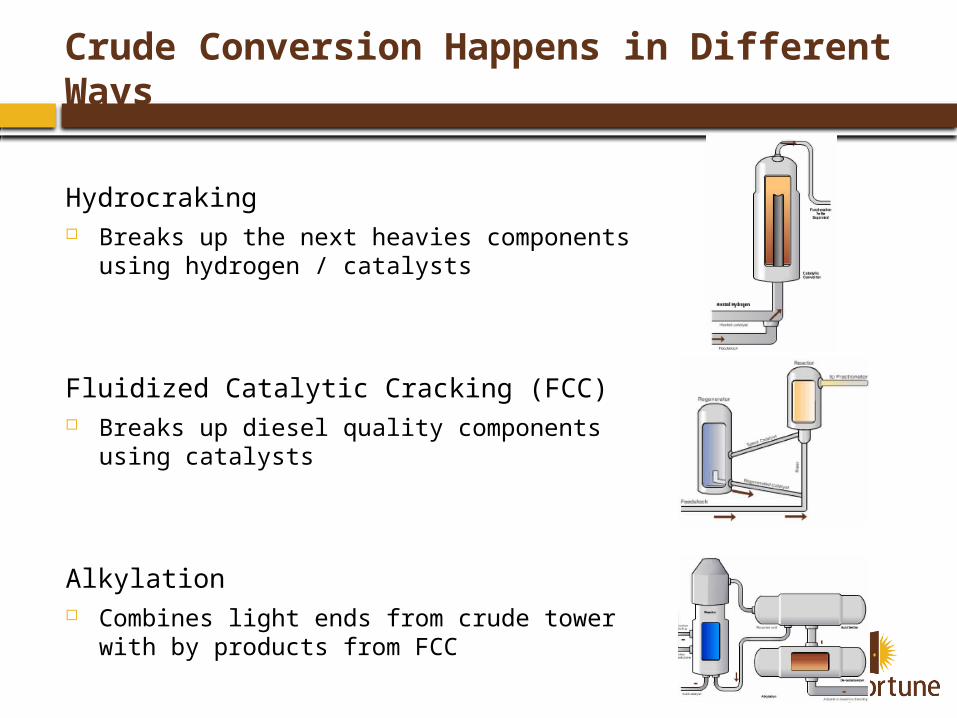
Hydrocraking Breaks up the next heavies components
using hydrogen / catalysts
Fluidized Catalytic Cracking (FCC) Breaks up diesel quality components using
catalysts
Alkylation Combines light ends from crude tower with
by products from FCC
Refining Current Events
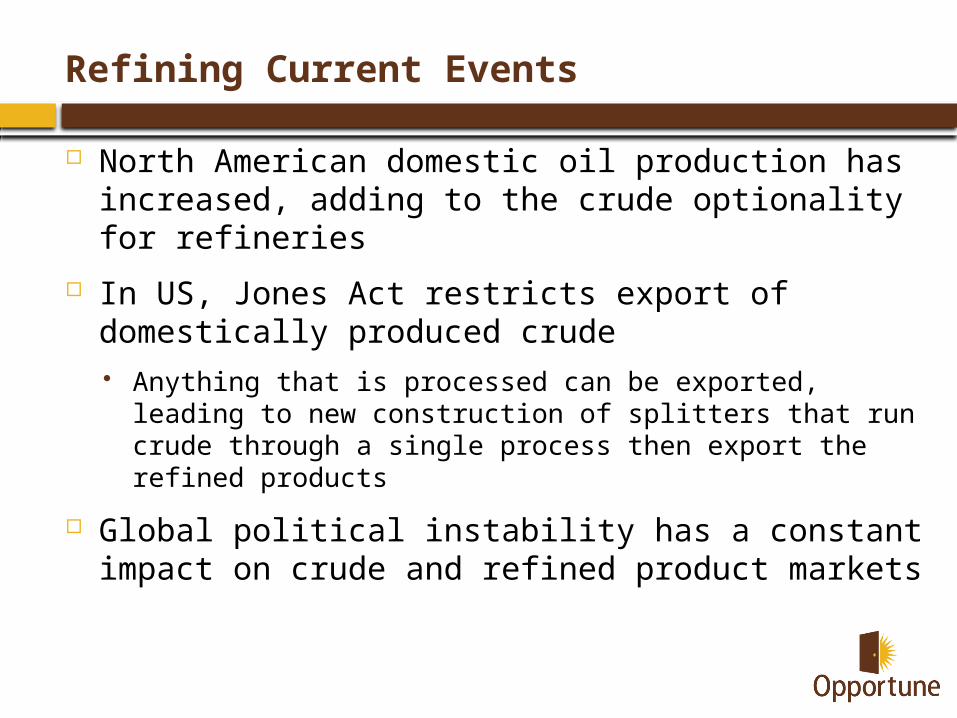
North American domestic oil production has increased, adding to the crude optionality for refineries
In US, Jones Act restricts export of domestically produced crude Anything that is processed can be exported, leading to new
construction of splitters that run crude through a single process then export the refined products
Global political instability has a constant impact on crude and refined product markets
Accounting Impacts
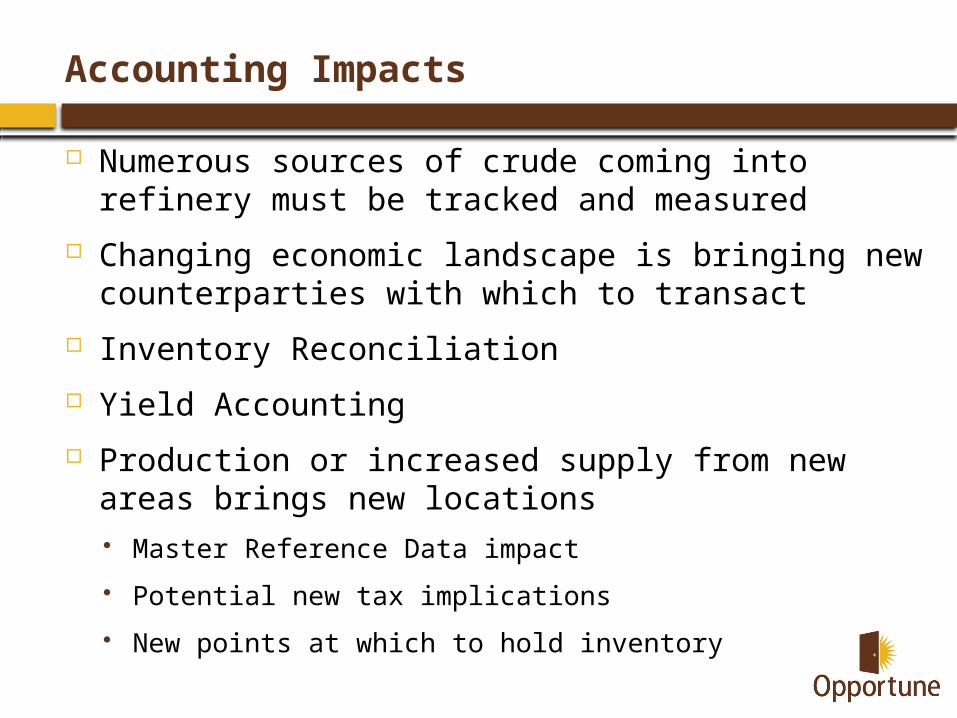
Numerous sources of crude coming into refinery must be tracked and measured
Changing economic landscape is bringing new counterparties with which to transact
Inventory Reconciliation
Yield Accounting
Production or increased supply from new areas brings new locations Master Reference Data impact
Potential new tax implications
New points at which to hold inventory
Final Thoughts
Transaction Processing and Scaling Organization and Processes to Support
Focus on larger trends and analysis
Health Checks to catch issues early
(Over) Communicate with the Business

Appendix
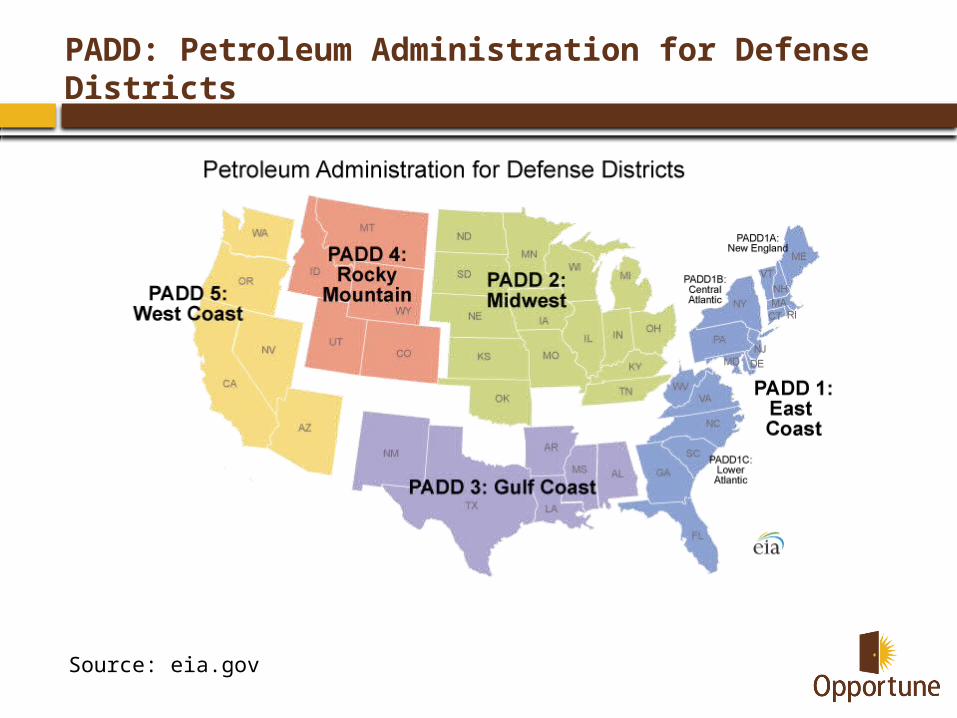
PADD: Petroleum Administration for Defense Districts
Source: eia.gov
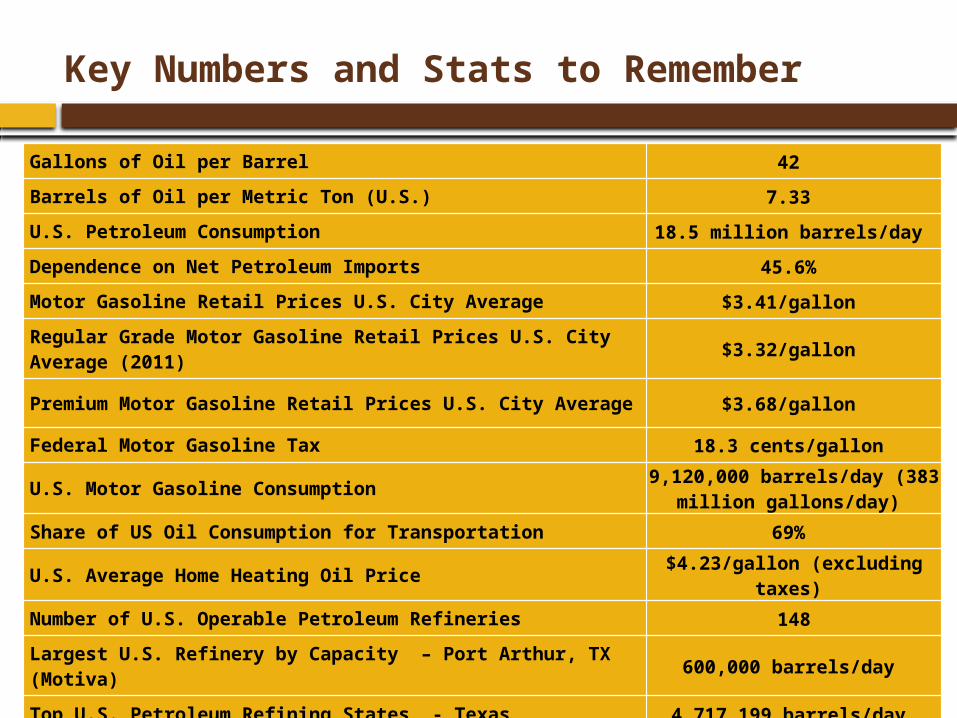
Key Numbers and Stats to Remember
Gallons of Oil per Barrel 42
Barrels of Oil per Metric Ton (U.S.) 7.33
U.S. Petroleum Consumption 18.5 million barrels/day
Dependence on Net Petroleum Imports 45.6%
Motor Gasoline Retail Prices U.S. City Average $3.41/gallon
Regular Grade Motor Gasoline Retail Prices U.S. City Average (2011) $3.32/gallon
Premium Motor Gasoline Retail Prices U.S. City Average $3.68/gallon
Federal Motor Gasoline Tax 18.3 cents/gallon
U.S. Motor Gasoline Consumption 9,120,000 barrels/day (383 million gallons/day)
Share of US Oil Consumption for Transportation 69%
U.S. Average Home Heating Oil Price $4.23/gallon (excluding taxes)
Number of U.S. Operable Petroleum Refineries 148
Largest U.S. Refinery by Capacity – Port Arthur, TX (Motiva) 600,000 barrels/day
Top U.S. Petroleum Refining States - Texas 4,717,199 barrels/day
Did You Know…
…U.S. oil demand in 2013 was 18.5 million barrels per day?
…every day the US consumes enough oil to cover a football field with a column of oil 2500 feet tall? That's 121 million cubic feet.
… the current U.S. refining capacity is 16.1 Million BPD

What to Know About Gas Prices
As this year’s driving season begins, gas prices this week reached a nationwide average of $3.17 per gallon, four cents per gallon higher than the previous record set last year.
The media stories are increasing, and as friends and family start to ask about gas prices, it’s important to understand the facts about what goes into the price at the pump:
Crude price drives the price of gasoline
Gasoline is a global product
Taxes take a toll
Consumers are in control
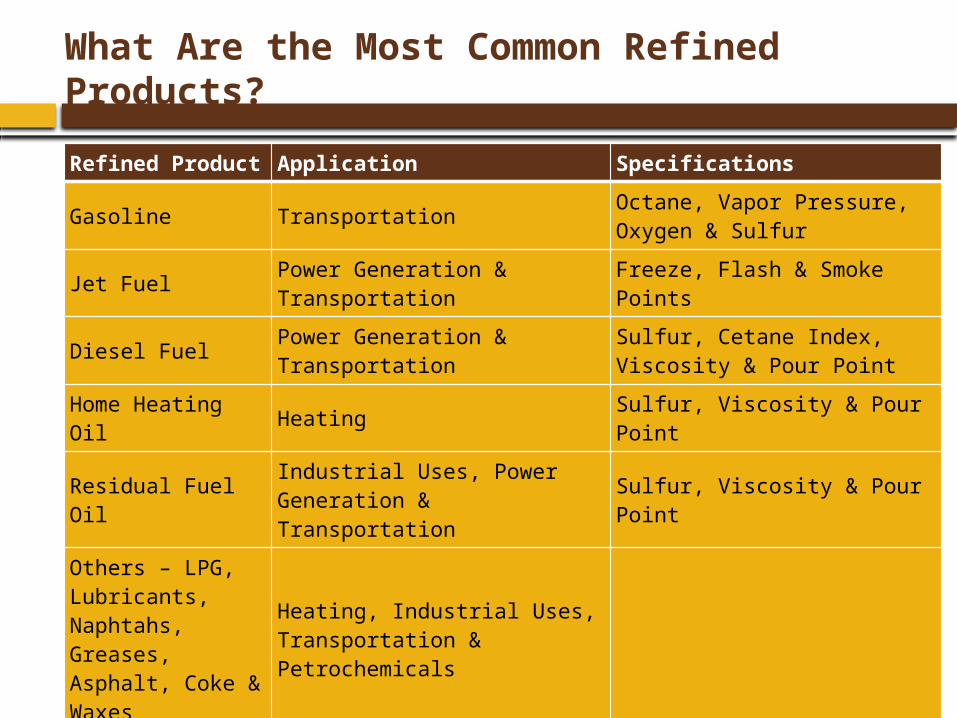
What Are the Most Common Refined Products?
Refined Product Application Specifications
Gasoline Transportation Octane, Vapor Pressure, Oxygen & Sulfur
Jet Fuel Power Generation & Transportation Freeze, Flash & Smoke Points
Diesel Fuel Power Generation & Transportation
Sulfur, Cetane Index, Viscosity & Pour Point
Home Heating Oil Heating Sulfur, Viscosity & Pour Point
Residual Fuel Oil Industrial Uses, Power Generation & Transportation Sulfur, Viscosity & Pour Point
Others – LPG, Lubricants, Naphtahs, Greases, Asphalt, Coke & Waxes
Heating, Industrial Uses, Transportation & Petrochemicals
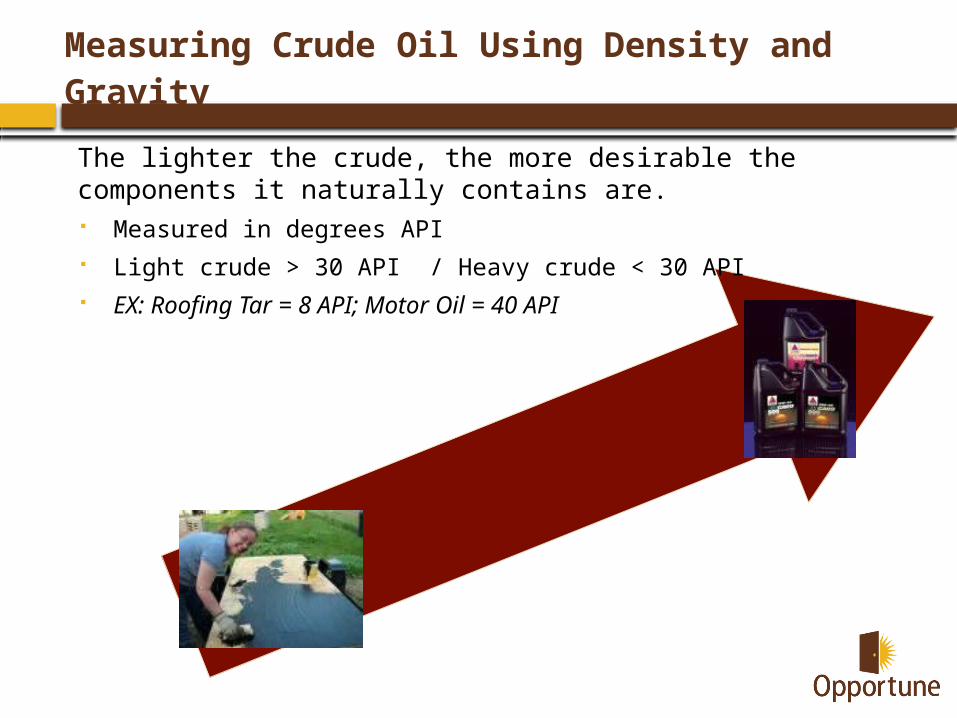
Measuring Crude Oil Using Density and Gravity
The lighter the crude, the more desirable the components it naturally contains are. Measured in degrees API Light crude > 30 API / Heavy crude < 30 API EX: Roofing Tar = 8 API; Motor Oil = 40 API
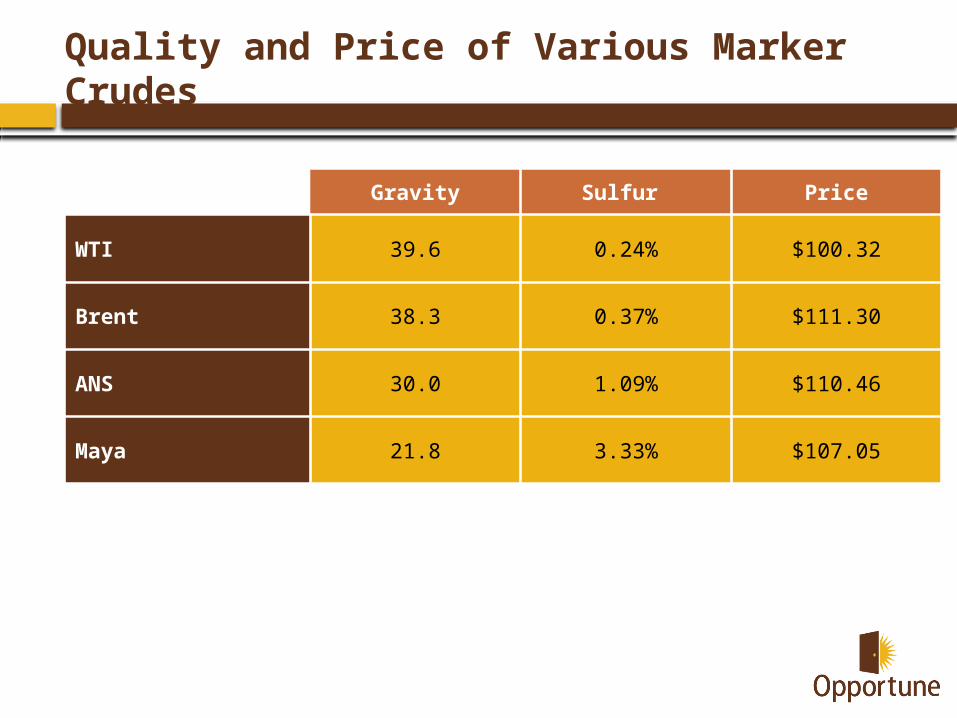
Quality and Price of Various Marker Crudes
Gravity Sulfur Price
WTI 39.6 0.24% $100.32
Brent 38.3 0.37% $111.30
ANS 30.0 1.09% $110.46
Maya 21.8 3.33% $107.05
Classifying Refineries by Major Processes
When looking at an oil refinery from a technical perspective items are the most relevant.
Complexity - an oil refinery’s ability to process feedstocks, such as heavier and higher sulfur content crude oils, into value-added products. Generally, the higher the complexity and more flexible the feedstock slate, the better positioned the refinery is to take advantage of the more cost effective crude oils. The result is incremental gross margin opportunities for the refinery.
Capacity – is a measurement of how much crude oil can be processed on a daily basis. The measurement is determined based on the standard crude slate that is run through the refinery. By adjusting the crude slates, there is the ability to slightly adjust the maximum amount that a refinery can run on a daily basis.
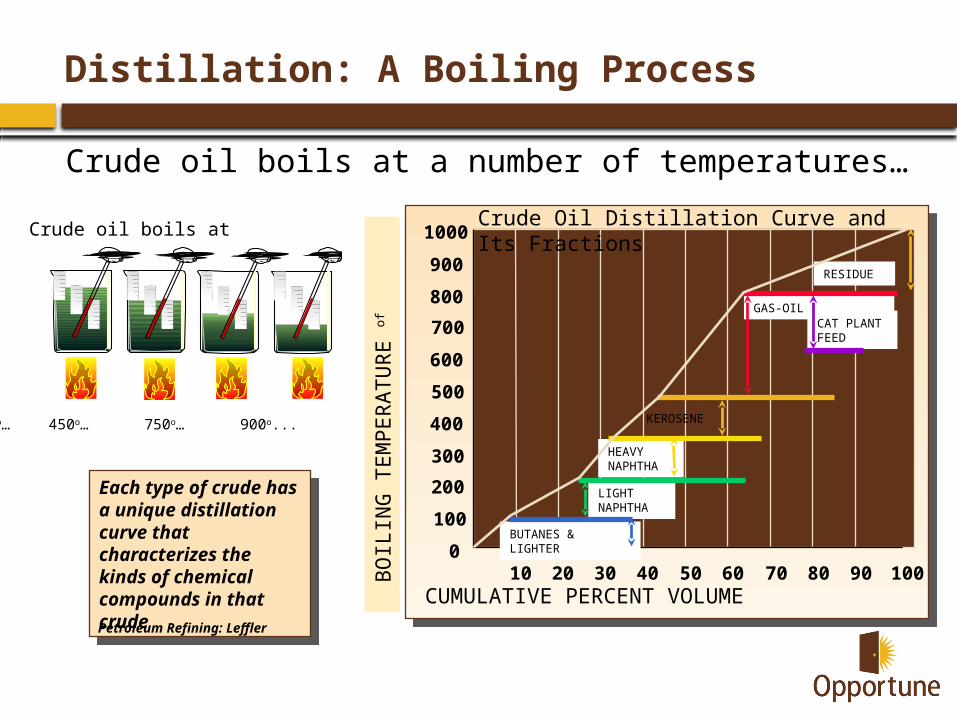
Each type of crude has a unique distillation curve that characterizes the kinds of chemical compounds in that crude
Each type of crude has a unique distillation curve that characterizes the kinds of chemical compounds in that crude
Petroleum Refining: Leffler
Crude oil boils at
150o… 450o… 750o… 900o...
150 450 750 900
BO
ILIN
G T
EM
PER
ATU
RE o
f
0
100
200
300
400
500
600
700
800
900
1000
10 20 30 40 50 60 70 80 90 100
LIGHT NAPHTHA
BUTANES & LIGHTER
HEAVY NAPHTHA
GAS-OILCAT PLANT FEED
RESIDUE
CUMULATIVE PERCENT VOLUME
Crude Oil Distillation Curve and Its Fractions
KEROSENE
Distillation: A Boiling Process
Crude oil boils at a number of temperatures…
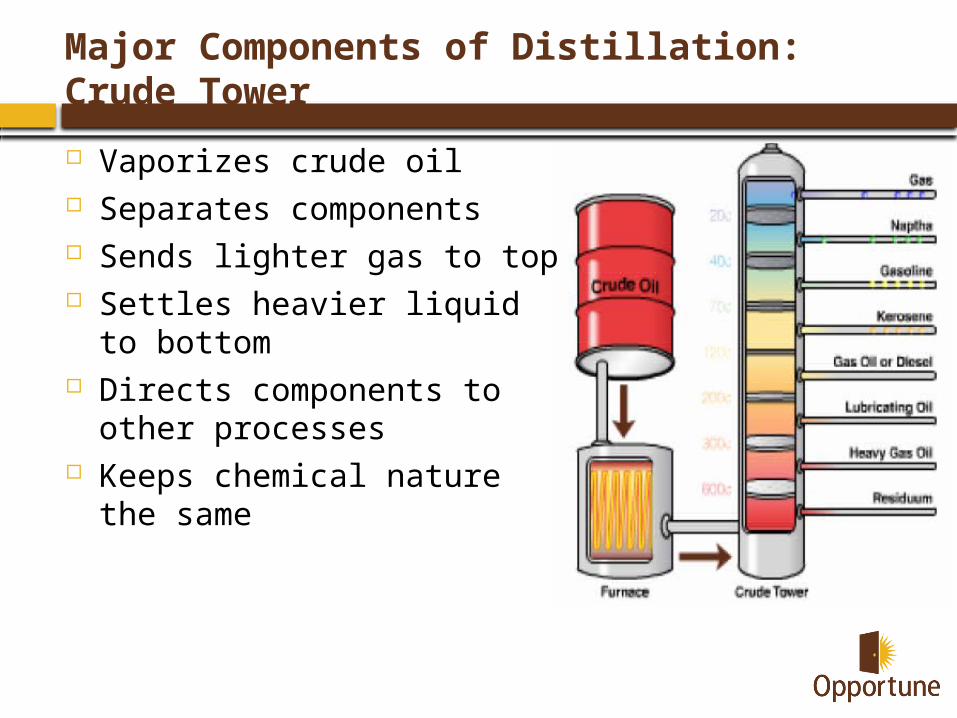
Major Components of Distillation: Crude Tower
Vaporizes crude oil Separates components Sends lighter gas to top Settles heavier liquid to bottom Directs components to other
processes Keeps chemical nature the same
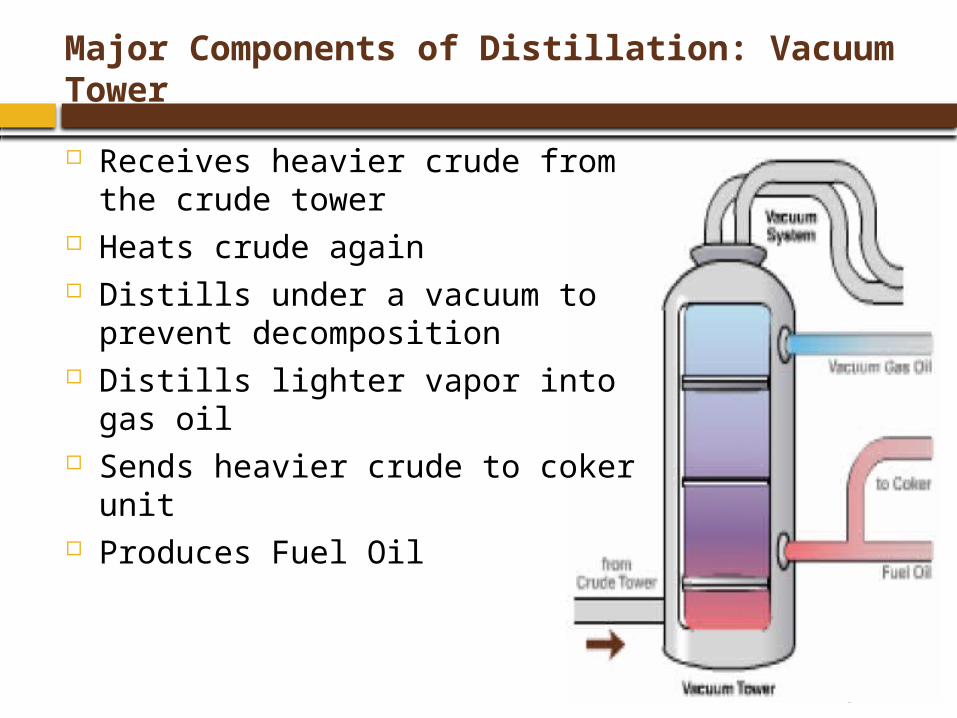
Major Components of Distillation: Vacuum Tower
Receives heavier crude from the crude tower
Heats crude again Distills under a vacuum to prevent
decomposition Distills lighter vapor into gas oil Sends heavier crude to coker unit Produces Fuel Oil
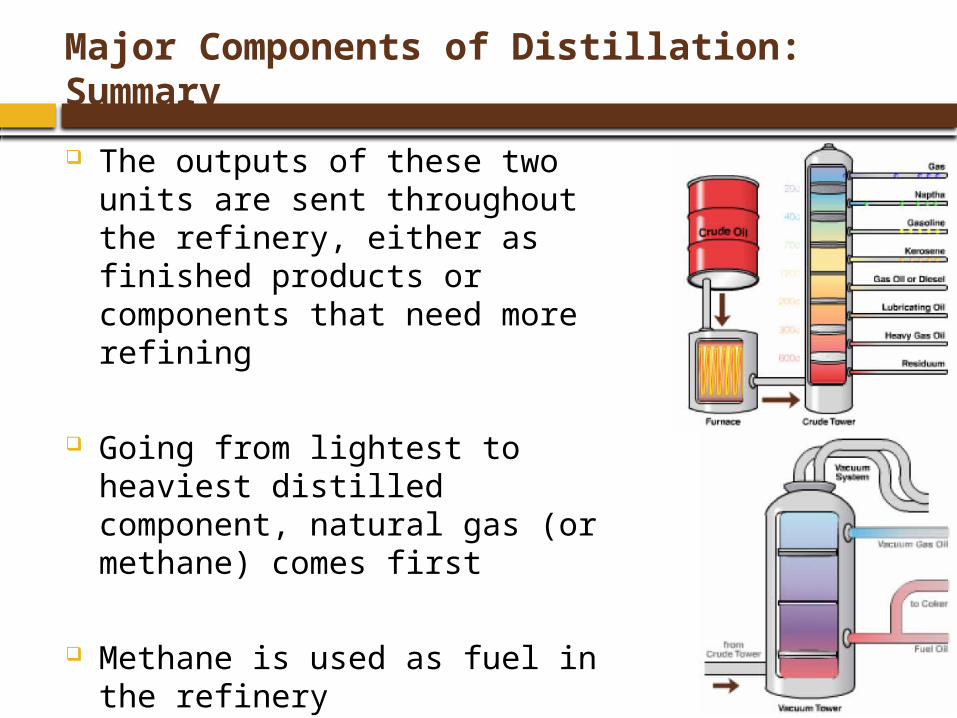
Major Components of Distillation: Summary
The outputs of these two units are sent throughout the refinery, either as finished products or components that need more refining
Going from lightest to heaviest distilled component, natural gas (or methane) comes first
Methane is used as fuel in the refinery
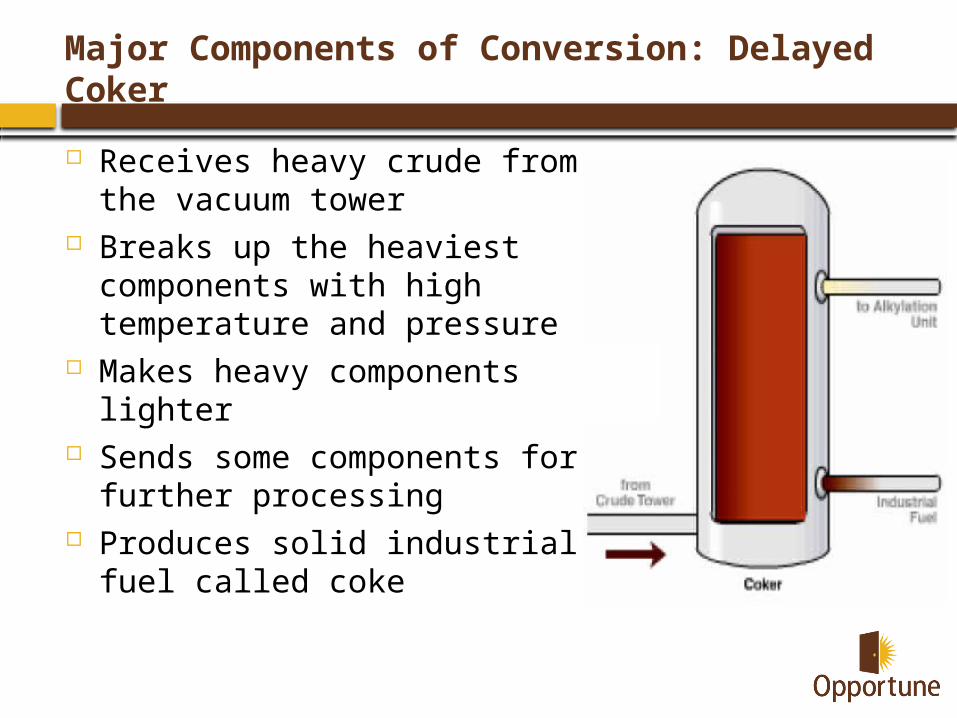
Major Components of Conversion: Delayed Coker
Receives heavy crude from the vacuum tower
Breaks up the heaviest components with high temperature and pressure
Makes heavy components lighter Sends some components for
further processing Produces solid industrial fuel called
coke
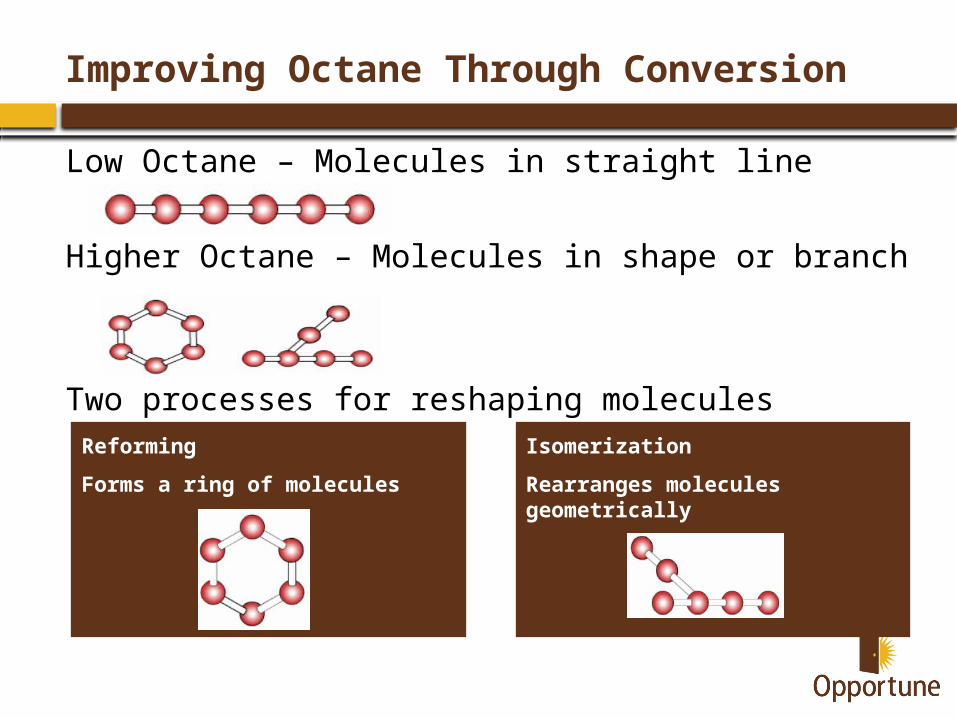
Improving Octane Through Conversion
Low Octane – Molecules in straight line
Higher Octane – Molecules in shape or branch
Two processes for reshaping moleculesReforming
Forms a ring of molecules
Isomerization
Rearranges molecules geometrically
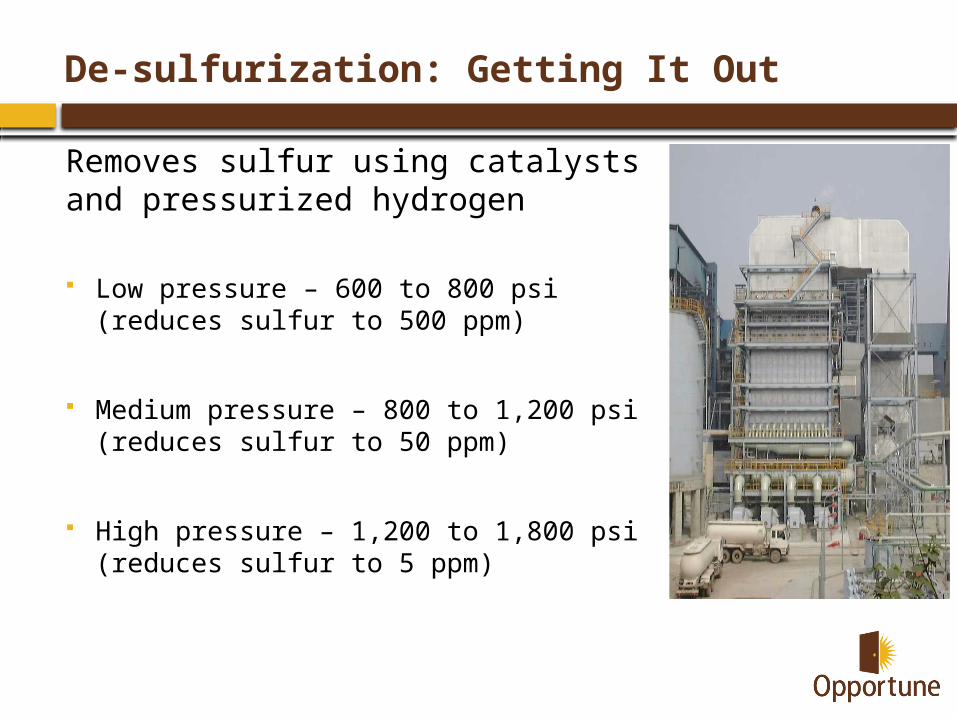
De-sulfurization: Getting It Out
Removes sulfur using catalysts and pressurized hydrogen
Low pressure – 600 to 800 psi (reduces sulfur to 500 ppm)
Medium pressure – 800 to 1,200 psi (reduces sulfur to 50 ppm)
High pressure – 1,200 to 1,800 psi (reduces sulfur to 5 ppm)
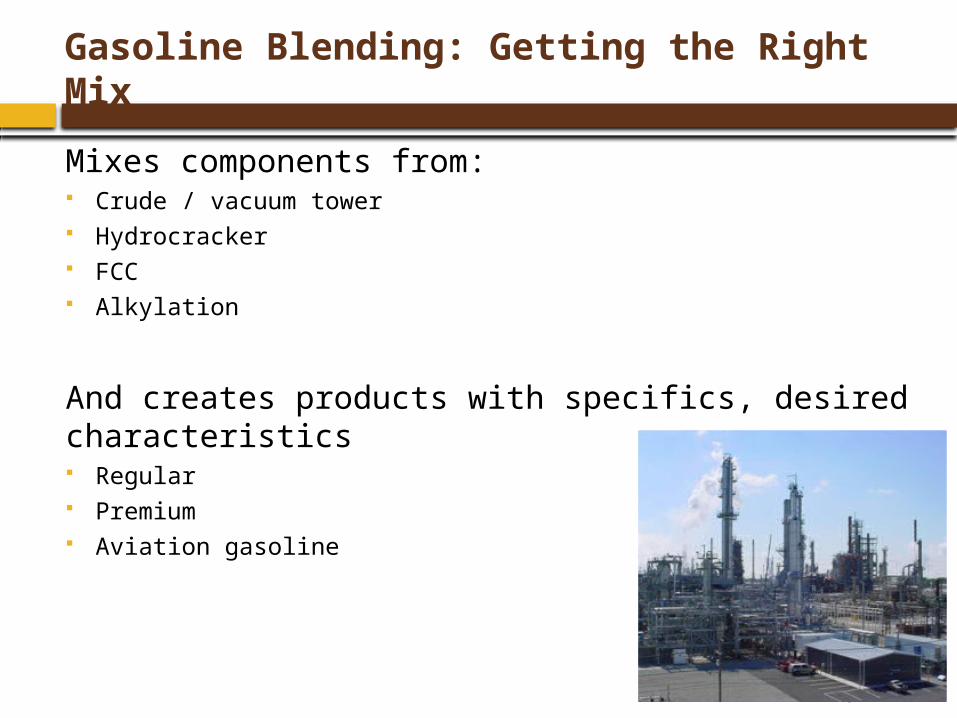
Gasoline Blending: Getting the Right Mix
Mixes components from: Crude / vacuum tower Hydrocracker FCC Alkylation
And creates products with specifics, desired characteristics Regular Premium Aviation gasoline
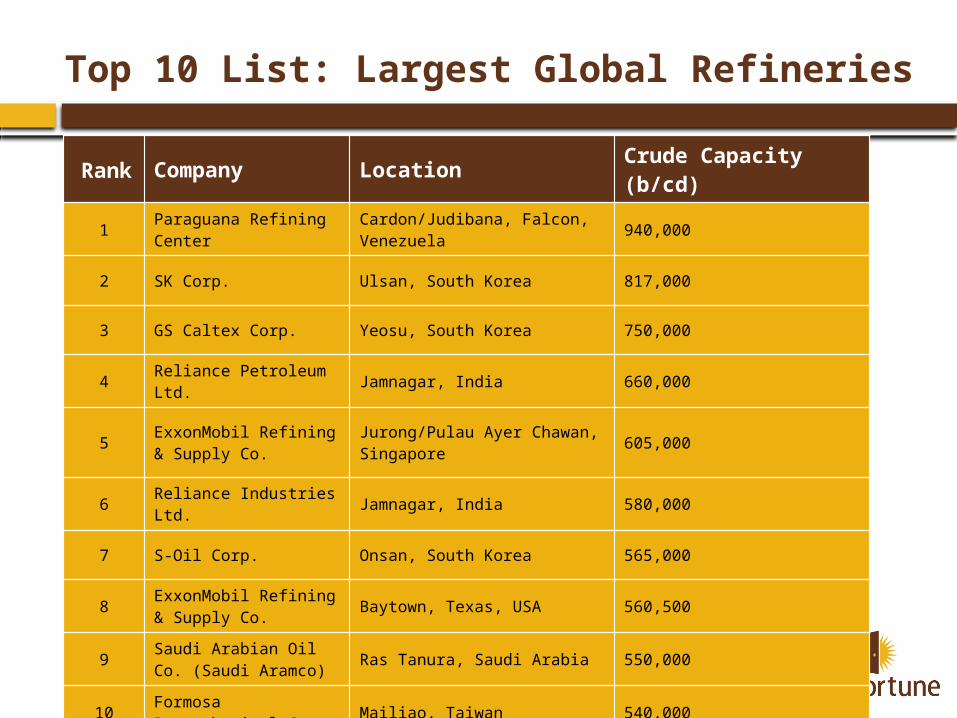
Top 10 List: Largest Global Refineries
Rank Company Location Crude Capacity (b/cd)
1Paraguana Refining Center
Cardon/Judibana, Falcon, Venezuela
940,000
2 SK Corp. Ulsan, South Korea 817,000
3 GS Caltex Corp. Yeosu, South Korea 750,000
4 Reliance Petroleum Ltd. Jamnagar, India 660,000
5ExxonMobil Refining & Supply Co.
Jurong/Pulau Ayer Chawan, Singapore
605,000
6 Reliance Industries Ltd. Jamnagar, India 580,000
7 S-Oil Corp. Onsan, South Korea 565,000
8ExxonMobil Refining & Supply Co.
Baytown, Texas, USA 560,500
9Saudi Arabian Oil Co. (Saudi Aramco)
Ras Tanura, Saudi Arabia 550,000
10Formosa Petrochemical Co.
Mailiao, Taiwan 540,000
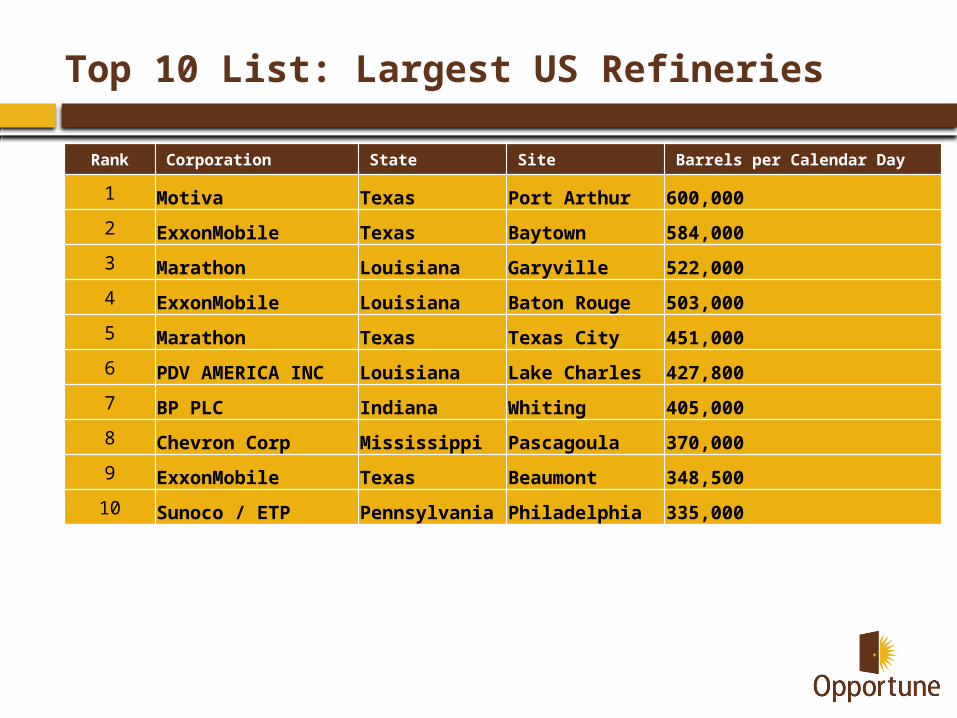
Top 10 List: Largest US Refineries
Rank Corporation State Site Barrels per Calendar Day
1 Motiva Texas Port Arthur 600,0002 ExxonMobile Texas Baytown 584,0003 Marathon Louisiana Garyville 522,0004 ExxonMobile Louisiana Baton Rouge 503,0005 Marathon Texas Texas City 451,0006 PDV AMERICA INC Louisiana Lake Charles 427,8007 BP PLC Indiana Whiting 405,0008 Chevron Corp Mississippi Pascagoula 370,0009 ExxonMobile Texas Beaumont 348,500
10 Sunoco / ETP Pennsylvania Philadelphia 335,000
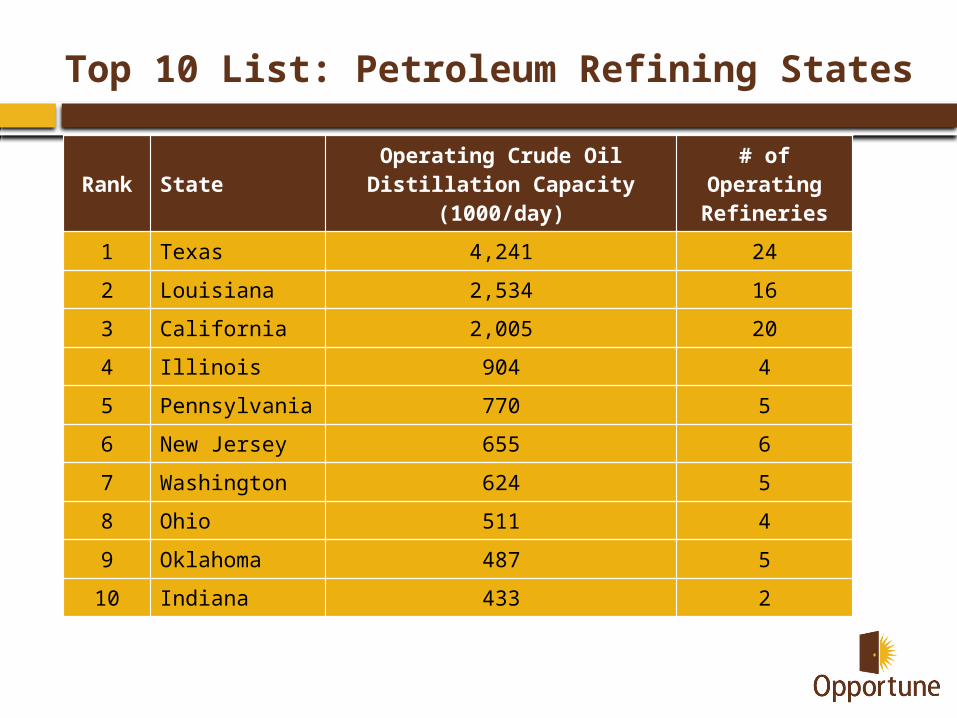
Top 10 List: Petroleum Refining States
Rank State Operating Crude Oil Distillation Capacity (1000/day)
# of Operating Refineries
1 Texas 4,241 24
2 Louisiana 2,534 16
3 California 2,005 20
4 Illinois 904 4
5 Pennsylvania 770 5
6 New Jersey 655 6
7 Washington 624 5
8 Ohio 511 4
9 Oklahoma 487 5
10 Indiana 433 2

Did You Know…
…U.S. oil demand in 2013 was 18.5 million barrels per day?
…every day the US consumes enough oil to cover a football field with a column of oil 2500 feet tall? That's 121 million cubic feet.
… the current U.S. refining capacity is 16.1 Million BPD
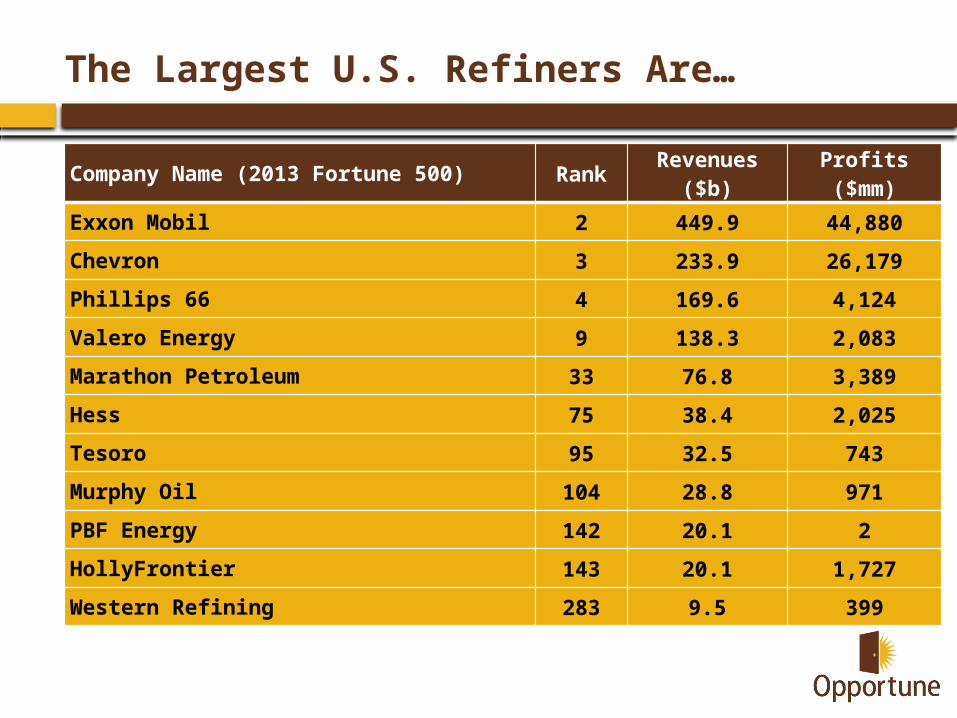
The Largest U.S. Refiners Are…
Company Name (2013 Fortune 500) Rank Revenues ($b) Profits ($mm)
Exxon Mobil 2 449.9 44,880
Chevron 3 233.9 26,179
Phillips 66 4 169.6 4,124
Valero Energy 9 138.3 2,083
Marathon Petroleum 33 76.8 3,389
Hess 75 38.4 2,025
Tesoro 95 32.5 743
Murphy Oil 104 28.8 971
PBF Energy 142 20.1 2
HollyFrontier 143 20.1 1,727
Western Refining 283 9.5 399
What to Know About Gas Prices
As this year’s driving season begins, gas prices this week reached a nationwide average of $3.17 per gallon, four cents per gallon higher than the previous record set last year.
The media stories are increasing, and as friends and family start to ask about gas prices, it’s important to understand the facts about what goes into the price at the pump:
Crude price drives the price of gasoline
Gasoline is a global product
Taxes take a toll
Consumers are in control
Refining Take Aways – Remember these…
Refined products are designed with specific properties based on engine requirements.
Refineries convert crude oil into finished products.
Distillation separates hydrocarbons into fractions using different boiling temperatures.
Quality improvement operations increase gasoline octane and remove sulfur impurities.
Conversion operations break larger hydrocarbons (fuel oil) into smaller ones (gasoline).
Refineries are built using combinations of different processing units.