Embed Size (px)
Citation preview

Potential of defatted marama flour-cassava starch composites to produce functional gluten-free bread-type dough
Patricia M. Nyembwe, Henriëtte L. de Kock, John R.N. Taylor1
Department of Consumer and Food Sciences and Institute for Food, Nutrition and Well-being, University of Pretoria, Private Bag X20, Hatfield
0028, South Africa
1Corresponding author. Tel.: +27124203238
E-mail address: [email protected]
1

Abstract
Marama bean is a drought-tolerant oilseed legume. Isolated marama bean protein has high foaming capacity, strong dough extensibility and
good elasticity characteristics. The dough properties of composites of defatted marama flour (DMF) and cassava starch (CS) were compared
with wheat flour dough with the aim of determining the potential of DMF as a functional nutritious gluten-free ingredient in bread. DMF-CS
doughs with similar strength to wheat flour dough could be produced. However, they had much shorter Mixolab development time and stability.
Alveography revealed that the DMF-CS doughs could inflate into a bubble, with the 33:67 DMF-CS ratio having the most similar bubble size,
extensibility and deformation energy to wheat flour dough; with a higher proportion of DMF (57:43) these parameters were lower.
Rheofermentometry showed that the DMF-CS composites could also hold gas produced by yeast fermentation. Confocal laser scanning
microscopy revealed that as the proportion of DMF to CS was increased, the DMF protein tended to aggregate rather distribute throughout the
dough, probably because the highly hydrophilic marama protein and pectin had great affinity for each other. Nevertheless, defatted marama
flour appears to have considerable potential as a functional gluten replacement for making protein- and fibre-rich gluten-free bread.
Keywords: cassava; dough rheology; gluten-free flour; marama bean
2
1. Introduction
The highly drought-tolerant leguminous plant marama bean, which is indigenous to south-western Africa, has great potential as a commercial
crop (Holse, Husted & Hansen, 2010). Domestication of marama has been initiated through a breeding programme in Namibia (Nepolo,
Takundwa, Chimwamurombe, Cullis & Kunert, 2009). The marama bean is an excellent source of protein (29-38 g/100 g) and oil (32-42 g/100
g), plus dietary fibre (19-27 g/100 g) but contains little starch; the carbohydrate fraction comprising mainly cellulose and pectin (Mosele, 2012).
Also, its defatted flour possesses useful functional properties such as high protein solubility, emulsification, water and oil absorption capacities
(Maruatona, Duodu & Minnaar, 2010), like defatted soy flour. Furthermore, isolated marama protein has been found have potential as a
functional gluten replacement in gluten-free dough-based products such as bread, as it has high foaming capacity and strong dough extensibility
(Amonsou, Taylor, Emmambux, Duodu & Minnaar, 2012b) and good elasticity characteristics (Gulzar, Taylor & Minnaar, 2017).
Today, there is increasing interest in gluten-free products which have both similar functional and nutritional attributes as their gluten-containing
counterparts (Matos and Rossell, 2015). The defatted marama bean flour (DMF), which is very rich in protein and dietary fibre, would appear to
be a useful functional and nutritional ingredient for gluten-free breadmaking. However, to date the dough properties of DMF, as opposed to
isolated marama protein (Amonsou et al., 2012; Gulzar et al., 2017) have not been investigated. Here we describe a study of the bread-type
dough properties of composites of DMF and cassava starch with bread wheat flour. Cassava starch was chosen to composite with the DMF
3

because of its better performance in gluten-free composite bread formulations than other starches (Onyango et al., 2011). This is probably
related to its relatively high proportion of amylopectin (Defloor et al. (1998), when compared to normal cereal starches.
2. Materials and methods
2.1 Materials
Marama beans were collected from the Masokaphala area, Botswana (Nyembwe, Minnaar, Duodu, de Kock, 2015). Wheat flour (Snowflake,
Premier, South Africa), cassava starch (CS) (Nature’s Choice, Atlantis, South Africa), instant yeast and salt were obtained from retail stores.
2.2 Methods
2.2.1 Defatted Marama-Cassava Composite Flour preparation
Marama beans were dehulled using a cracker (WMC Metal Sheet Works, Tzaneen, South Africa). DMF was prepared by coarsely grinding the
cotyledons using a Waring blender to a particle size <1000 µm. The meal was defatted to a fat content of 2 g/100 g using hexane (meal:hexane
1:5 w/v) for 2 h three times. The defatted meal was milled using a Retsch ZM 200 Ultra Centrifugal Mill (Hahn, Germany) to pass through a
500 µm opening mesh. The DMF was then blended with CS in different proportions to prepare DMF:CS composite flours of 22:78, 33:67 and
57:43 (w/w).
4

2.2.2 Moisture, protein and fat
Flour moisture and protein contents were determined according to methods 44-15A and 46-19A, respectively of the American Association of
Cereal Chemists (AACC International, 2000). Crude protein was determined by combustion analysis using a Dumatherm® (Model DT, Gerhardt
Analytical Systems, Königswinter, Germany). The conversion factor for DMF-CS composite and wheat flours was (N x 5.71), and for cassava
starch (N × 6.25). Crude fat was determined by the Soxhlet extraction method using petroleum ether (313-333 K).
2.2.3 Starch and amylose
Flour starch content was determined using the Megazyme Total Starch assay procedure (Amyloglucosidase/α-amylase method) (Megazyme
Ireland International, Bray, Ireland) and starch amylose content determined using Megazyme Amylose/Amylopectin assay kit.
2.2.4 Mixolab flour profiles
Mixolab 2 (Chopin, Tripette et Renaud, Paris, France) analysis parameters were according to ICC Standard 173 (International Association for
Cereal Science and Technology, 2011). Two protocols were applied: Mixolab Simulator and Mixolab Standard Chopin+. Mixolab Simulator
gives the data as a “farinograph-type curve” with parameters such as water absorption, maximum consistency, stability and development time at
constant temperature (303 K). The conditions used were 75 g dough weight and a constant mixing speed (80 rpm).
5

The Mixolab Standard Chopin+ protocol was used for more complete characterization where the dough is subjected to the dual constraints of
kneading and a heating/cooling cycle (Koksel, Kahraman, Sanal, Ozay, & Dubat, 2009). A 90 g dough weight was used with initial equilibrium
at 303 K for 8 min, heating to 363 K over 15 min (at a rate of 4 K/min), holding at 363 K for 7 min, cooling to 323 K over 5 min (at a rate of 4
K/min) and holding at 50⁰C for 5 min. Dough mixing speed was constant (80 rpm) and the test duration was 45 min.
2.2.5 Preparation of doughs for alveography, rheofermentometry and confocal scanning laser microscopy
The flours and water (303 K) were mixed in quantities as determined by the Mixolab on adapted hydration (Simulator test). A kitchen electric
dough mixer (Kenwood Chef Excel, Maraisburg, South Africa) was used to knead the wheat dough for 5 min at speed 2 and the DMF-CS
composite doughs for 1 min at speed 1 and then manually for 3 min. Longer mechanical mixing caused the DMF-CS doughs to have a chewed
chewing gum-liked consistency. As CS alone formed a slurry and not a dough, it was not analysed further.
2.2.6 Alveography
An Alveograph (Chopin NG Consistograph, Tripette and Renaud, Paris) was used according to ICC Standard 121 (ICC, 1992). Doughs were
sheeted with 12 passes on the Alveograph sheeting plate, cut into discs and allowed to rest in the Alveograph chamber (15 min for wheat dough
and 3 min for the DMF-CS doughs). Dough resistance to extension (P), extensibility (L), Configuration ratio (P/L) and the deformation energy
(W, Jx10-4) were recorded.
6

2.2.7 Rheofermentometry
The proofing properties of the doughs during fermentation were determined using a Rheofermentometer F3 (Chopin, Tripette and Renaud)
following the Chopin+ method. Flour (250 g) was mixed with 5 g salt, 3 g yeast and water (according to the Mixolab water absorption data).
Dough (315 g) was placed in the fermentation chamber. The tests were carried out at 28°C for 3 h with application of a 2 kg weight constraint.
Maximum dough height (Hm), time at which dough reached maximum height (T1), maximum height of gaseous production (H’m), time of
maximum gas formation (T’1) and time at which gas started to escape from the dough (Tx) were recorded.
2.2.7 Confocal Laser Scanning Microscopy (CLSM)
Freshly prepared doughs were stretched 5 times through a dough sheeter (Ibili Menaje, Bergara, Spain) to obtain a thickness of approximately 3
mm. Dough pieces (10 x 15 mm) were placed on microscope slides and stained using acid fuchsin dye (Falade, Emmambux, Buys, & Taylor,
2014), then dried at 333 K for 1 min. Immediately after, the doughs were studied using a Zeiss 510 META system CLSM (Jena, Germany) with
a Plan-Neofluar 10×0.3 objective at an excitation wavelength of 488 nm.
2.3 Statistical analysis
7

One-way analysis of variance (ANOVA) using Tukey’s Honest Significant Difference test at p < 0.05 was applied using IBM SSPS (New York)
version 22.00.
3. Results and discussion
3.1 Flour composition and Mixolab characteristics
The protein, fat and dietary fibre contents of the composite flours progressively increased as the proportion of DMF to CS increased and the
starch content decreased (Table 1). In terms of starch and protein contents, the 22:78 DMF-CS flour was the most similar to wheat flour. Since
isolated marama protein forms a viscoelastic dough (Amonsou et al., 2012b; Gulzar et al., 2017), the dough properties of the DMF-CS
composites were compared to wheat flour using the Mixolab.
The amount of water absorbed by flours is crucial for making gluten-free bread, as water plasticises the dough (Marco and Rosell, 2008b). The
Mixolab Simulator water absorption of all three DMF-CS composite flours required to obtain the same dough maximum consistency (C max) as
the wheat flour (approximately equivalent to 500 Brabender Units) was somewhat higher than the wheat flour (Table 2). The major compounds
that enhance flour water absorption are proteins and carbohydrates owing to their hydrophilic constituents such as polar or charged side chains
(Chinma, Ariahu, & Abu, 2013). CS possesses hydrophilic hydroxyl groups to which water molecules can bind through hydrogen bonding
8

Table 1: Protein, fat, starch and dietary fiber contents (g/100 g db) of wheat flour, defatted marama (DMF)-cassava starch (CS) composite flours
and cassava starch
Flours Protein Fat Starch Starch amylose
content (%)
Dietary fibre
Wheat 12.9c± 0.21,2 2.4d± 0.3 83.5d± 1.1 25.8 3.73
CS 0.6a± 0.0 0.0a ± 0.0 93.2de± 1.6 18.6 0
DMF 46.3e± 0.9 (50.7)6 2.1d± 0.9 9.3a± 1.2 34.8 42.24 (38.5)6
DMF-CS
(22: 78)
10.6b± 0.1 0.4b± 0.2 86.1d± 1.2 22.25 2.94
DMF-CS
(33: 67)
14.9c± 0.1 0.8b± 0.2 75.3c± 1.3 23.95 9.04
DMF-CS
(57: 43)
26.4d± 0.2 1.3c± 0.2 51.9b± 1.4 29.85 27.84
1Means of 3 replicates ± standard deviations, 2Mean values in a column with different superscript letters differ significantly (p <0.05), 3Product nutritional information data, 4Calculated by
difference from protein, fat and starch contents, 5Calculated from amylose contents of cassava starch and defatted marama flour starch, 6Values in parentheses are the means of seven samples of
marama bean from Botswana (Holse, Husted & Hansen, 2010)
9
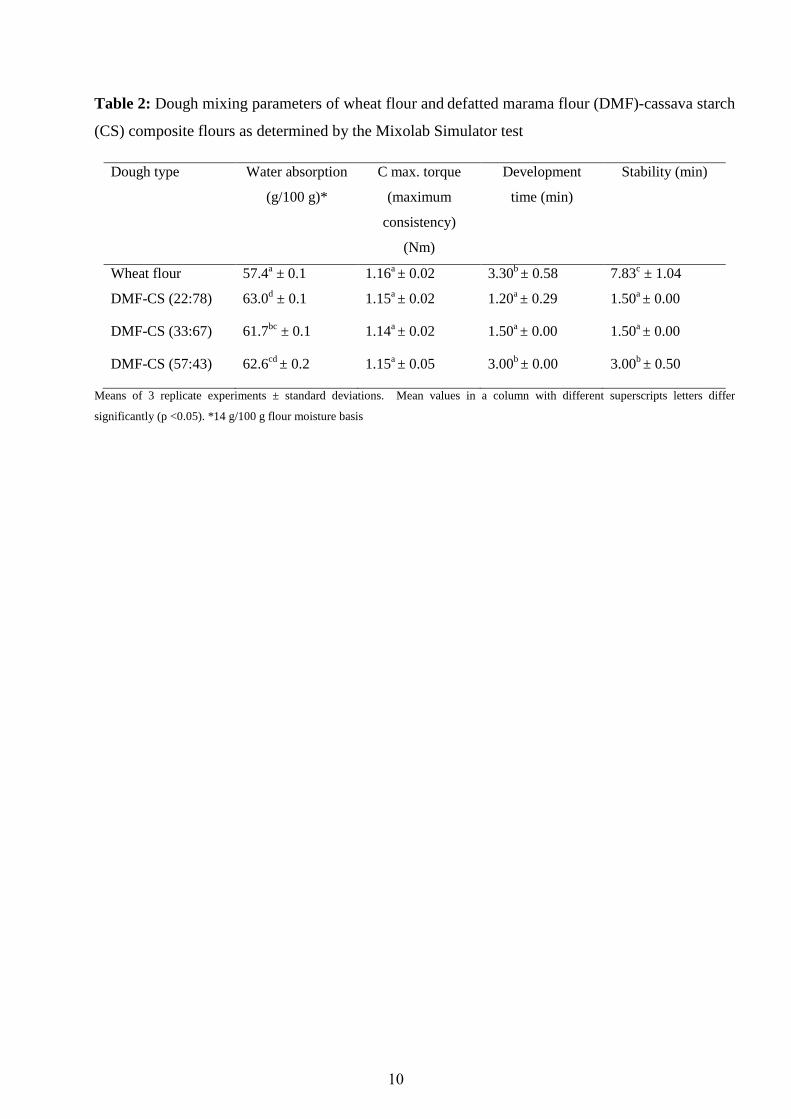
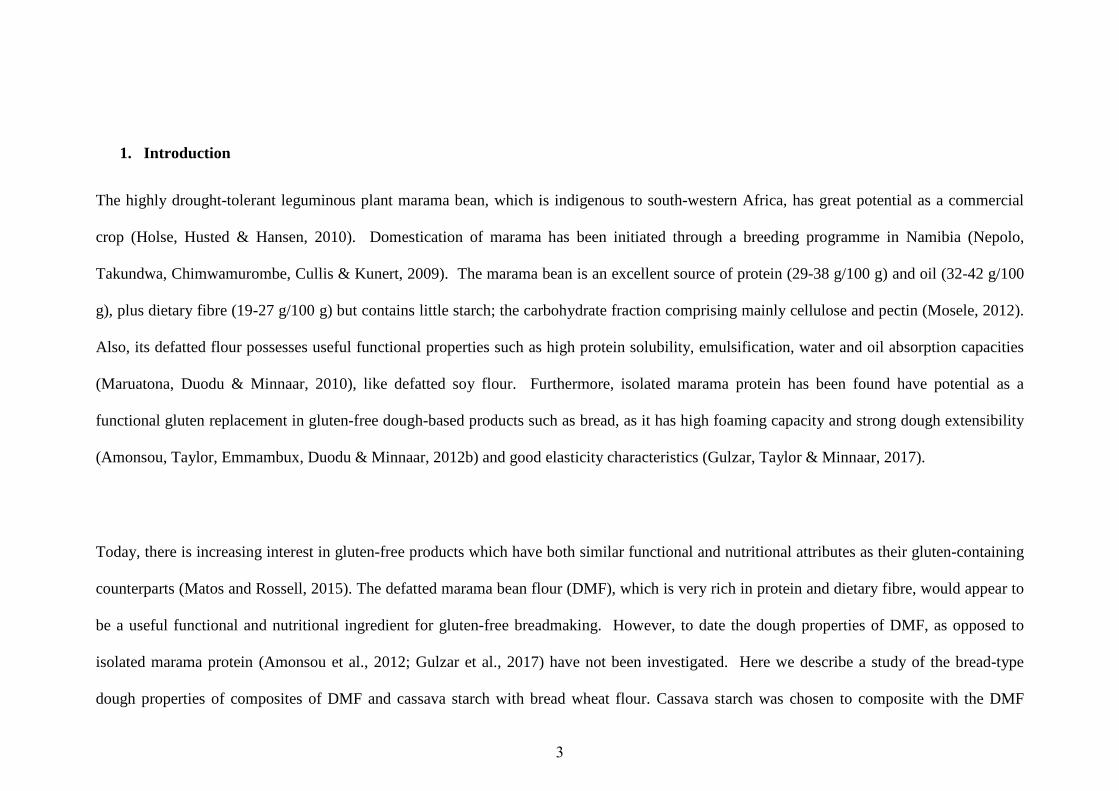
Table 2: Dough mixing parameters of wheat flour and defatted marama flour (DMF)-cassava starch
(CS) composite flours as determined by the Mixolab Simulator test
Means of 3 replicate experiments ± standard deviations. Mean values in a column with different superscripts letters differ
significantly (p <0.05). *14 g/100 g flour moisture basis
Dough type Water absorption
(g/100 g)*
C max. torque
(maximum
consistency)
(Nm)
Development
time (min)
Stability (min)
Wheat flour 57.4a ± 0.1 1.16a ± 0.02 3.30b ± 0.58 7.83c ± 1.04
DMF-CS (22:78) 63.0d ± 0.1 1.15a ± 0.02 1.20a ± 0.29 1.50a ± 0.00
DMF-CS (33:67) 61.7bc ± 0.1 1.14a ± 0.02 1.50a ± 0.00 1.50a ± 0.00
DMF-CS (57:43) 62.6cd ± 0.2 1.15a ± 0.05 3.00b ± 0.00 3.00b ± 0.50
10

(Mali, Sakanaka, Yamashita, Grossmann, 2005). Furthermore, CS has been used as a hydrocolloid to increase water absorption in gluten-free
flour (Awolu & Oseyemi, 2016). Since this present study used pure CS, it probably had more hydroxyl groups available to interact with water
than wheat flour, leading to higher water absorption. DMF also has a high water absorption capacity, 1.5 g water/g flour (Maruatona et al.,
2010). Marama protein is hydrophilic due to its high content of glutamic and aspartic acids, 8.58 and 5.12 g/100 g, respectively (Maruatona et
al., 2010). In proteins, such polar amino acids are reported to be primary sites for water interaction (Chinma et al., 2013).
The dietary fibre contents of the DMF-CS composite flours were far higher at the 33:67 and 57:43 ratios than the wheat flour (Table 1). Such
high fibre levels should also increase water absorption, due to hydrogen bonding with water by their hydroxyl groups (Ajila, Leelavathi & Rao,
2008). Furthermore, DMF has a high pectin content, approx. 4.2 g/100 g (Mosele et al., 2011). Pectin is a strong hydrocolloid (Gambus, Sikora
& Ziobro, 2007) due to its many hydroxyl groups. Lazaridou et al. (2007) found that rice flour with added hydrocolloids
(carboxymethylcellulose, pectin and xanthan gum) had elevated water absorption, 63.4-67.0 g/100 g. However, as there was no trend in water
absorption with relative proportion of DMF and CS in the composite flours despite their great differences in protein, starch and fibre contents, it
is probable that as the proportion of DMF increased, the increased water absorption due to the higher protein and dietary fibre contents was
cancelled out by the lower starch content.
11

Dough development time is also a critically important dough quality parameter as it is the time necessary for complete flour hydration or the
time to reach the maximum level of polymer interaction during the mixing stage (Marco & Rosell, 2008b). Dough development time for DMF-
CS (57:43) was the same as the wheat flour but the development times of DMF-CS 33:67 and 22:78 were much shorter (Table 2). The longer
dough development time of the high DMF:CS ratio composite was presumably due to marama protein’s viscoelastic dough-forming properties
(Amonsou et al., 2012b; Gulzar et al., 2017) and the pectin in the DMF, both which would exhibit strong polymer-polymer and polymer-water
interactions. The highest DMF-CS ratio composites also gave the longest dough stability (3 min) of the composite, probably for the same
reasons.
As stated, the Mixolab Standard Chopin+ protocol allows flour pasting and dough mixing properties to be determined in one test, to some extent
imitating the changes in dough taking place during the early stages of bread baking as well as during mixing and development. The initial
consistency (C1) was kept constant for all flours by using their optimal water absorptions (Table 2) to produce the required maximum resistance
for bread dough making, 1.10± 0.05 Nm (Koksel et al., 2009). Figure 1 shows that CS had negligible mixing stability (C1-C2). However, with
increasing proportion of DMF in the composites, dough strength became progressively more similar to wheat flour dough. This is similar to the
finding by Marco and Rosell (2008a) of an increase in the consistency in rice flour dough with the addition of soy protein isolate. However, the
stability of the DMF-CS doughs was still much lower than wheat flour doughs (Table 3). This was presumably mainly because the DMF protein
did not form as strong mechanical stress-resistant polymer-polymer interactions as wheat gluten, since the marama proteins are mainly globulins
and albumins, (Amonsou, Taylor, Beukes, & Minnaar, 2012a).
12

Meaning of phases for wheat flour: C1 used to calculate flour water absorption a given consistency during the constant temperature phase; C2 indication of protein weakening as a function of mechanical work and temperature; C3 indication of starch paste viscosity; C4 indication of the stability of the paste; C5 indication of starch retrogradation.
Figure 1: Mixolab profiles of wheat flour and DFM-CS composite flour doughs as determined by the Mixolab standard test.
13

Table 3: Dough mixing parameters of wheat flour and defatted marama flour (DMF)-cassava starch
(CS) composite flours as determined by the Mixolab standard test
Means of 3 replicate experiments ± standard deviations. Mean values in a column with different superscripts letters differ significantly (p <0.05). Meaning of phases for wheat flour: C1 used to calculate flour water absorption to achieve a given consistency during the constant temperature phase; C2 indication of protein weakening as a function of mechanical work and temperature; C3 indication of starch paste viscosity; C4 indication of the stability of the paste; C5 indication of starch retrogradation.
Dough type Stability (min)
C1 (Nm) C2 (Nm) C3 (Nm) C4 (Nm) C5 (Nm)
Wheat flour 9.65e ± 0.16 1.16a ± 0.02 0.52b ± 0.03 2.0d ± 0.03 1.74d ± 0.04 2.40d ±0.01
Cassava starch 0.83a ± 0.30 1.11a ± 0.20 0.24a ± 0.10 2.4e ± 0.03 1.93e ± 0.05 3.60e ±0.03
DMF-CS (22:78) 1.50b ± 0.11 1.16a ± 0.03 0.2a ± 0.40 1.34c ± 0.30 0.70c ± 0.05 1.20c ± 0.02
DMF-CS (33:67) 2.22c ± 0.20 1.10a ± 0.04 0.31a ± 0.02 0.94b ± 0.04 0.51b ± 0.02 0.90b ±0.10
DMF-CS (57:43) 3.93d ± 0.16 1.10a ± 0.03 0.34a ± 0.10 0.80a ± 0.11 0.33a ± 0.01 0.73a ±0.02
14

The second part of the Mixolab Standard Chopin+ concerns what happens to dough viscosity as the temperature is increased above starch
gelatinization temperature, held at elevated temperature and then cooled. (Fig. 1) and therefore the parameters measured are related primarily to
starch behaviour (Koksel et al., 2009). In fact, the CS paste alone had similar, but slightly higher pasting peak viscosity (C3), hot-formed gel
viscosity (C4) and setback viscosity (C5) to the wheat flour dough. In contrast, all the DMF-CS composite doughs had far lower values for these
parameters than the wheat dough, and the values decreased as the proportion of CS in the composites was reduced (Table 3). The fact that the
paste viscosities of the DMF-CS 22:78 composite were much lower than the wheat flour dough was possibly also due weaker marama protein
polymer-polymer interactions compared to wheat gluten. These findings are similar to those of Sciarini, Ribotta, Leó, & Pérez (2010) working
on gluten-free batters made from rice flour or corn starch with soybean flour who reported a progressive decrease in pasting property parameters
including gelatinization with soybean flour addition.
3.2 Alveography
The different proportion of DMF to CS had a significant effect on the composite dough alveographic properties as shown in Table 4. As
reported earlier, cassava starch alone did not exhibit any dough-like properties. The starch-water mixture formed a slurry that took up water over
a period of approximately 15 minutes. For that reason, it was not possible to analyse the cassava starch slurry using the alveograph. On the
other hand, the DMF-CF composite doughs exhibited wheat dough-like properties and held gas (Fig. 2, Table 4). Dough tenacity (P) or the
15

Figure 2: Images of the inflated alveography bubbles of wheat (A) and defatted marama-cassava starch (DFM-CS) composite doughs (B-D). B. DFM-CS (22:78); C. DFM-CS (33:77); D. DFM-CS (57:43).
16

Table 4: Alveograph dough rheological properties of the wheat flour and defatted marama
flour (DMF)-cassava starch (CS) composite flour doughs
Means of 3 replicate experiments ± standard deviations. Mean values in a column with different superscripts letters differ
significantly (p <0.05).
Dough type Tenacity Extensibility Curve configuration ratio
Deformation energy
(P, mm H2O) (L, mm) (P/L) (W, J x 10-4) Wheat flour 41.7a ± 2.3 133.7c ± 7.5 0.31a ± 0.10 158d ± 7
DMF-CS (22:78) 61.3a ± 9.5 43.0a ± 9.2 1.44c ± 0.87 61a± 14
DMF-CS (33:67) 103.8b ± 8.4 98.5b ± 9.4 1.05bc± 0.56 109c ± 20
DMF-CS (57:43) 38.0a ± 1.0 52.7a ± 5.7 0.72ab± 0.59 90b ± 15
17

capacity to resist deformation is an indication of the ability of the dough to retain gas (Rosell, Rojas, & Benito de Barber, 2001). The P value of
the DMF-CS composite doughs was improved as the proportion of DMF increased from 22:88 to 33:67, making the dough firmer. However,
increasing the proportion of DMF to 57:43, decreased P significantly (p < 0.05), by two and half times. The dough prepared from DMF-CS
(33:67) had the highest tenacity value of all produced doughs. Extensibility (L) represents the potential of the dough to stretch and hold gas and
also gives an indication of the handling characteristics of the dough (Rosell et al., 2001). The doughs made from the DMF-CS composite flours
were much less extensible compared to the wheat flour dough (Table 4). The 33:67 DMF-CS composite dough had significantly higher
extensibility (p < 0.05) than the 22:78 ratio, but decreased as the ratio increased to 57:43.
As stated, marama protein forms a highly extensible material when hydrated (Amonsou et al., (2012b) It was found that the extensibility of
marama protein dough increased from two to threefold that of gluten when the moisture content of the dough was increased from 38 g;100 g to
45 g/100 g. Of the three DMF levels, the DMF:CS 33:67 composite seem to absorb the most desirable amount of water for maximum dough
extensibility (Table 4, Fig. 2). The decreased extensibility at the highest proportion of DMF to CS ratio was probably due to the competition for
water between the components as such marama protein, fibre and CS in the mixture. In addition, as the proportion of DMF increased in the
composite dough 57:43, it also possible that there were more hydrated marama protein that might have promoted the viscous flow leading to
weakening of tensile properties such as extensibility and resistance to extension.
18

The curve configuration ratio (P/L) provides information on the elastic resistance and extensibility balance of flour (Rosell et al., 2001), and
relates to the overall bread-making potential of the flour through a combination of dough strength and extensibility. Composite doughs made
from DMF-CS (22:78) and ratio 33:67 had a significantly (p < 0.05) higher P/L than wheat flour dough. These values (Table 4) were similar to
wheat flour dough (P: 1.23) with added xanthan gum (0.1 g/100 g) (Rosell et al., 2001). The higher P/L can possibly be related to the strong
interaction between dietary fibre and marama protein
Guarda, Rosell, Benedito de Barber & Galotto (2004) reported that hydrocolloids such as xanthan gum increase P/L ratio in wheat doughs due to
interaction with the wheat protein. In this study, it may also be that the combined effect of marama protein and pectin that led to improvement in
dough structure as explained earlier and resulted in the higher P/L ratio. Wang, Rosell & Benedito de Barber (2002) also reported that addition
of legume fibre e.g. pea fibre to wheat dough led to an increase of P/L ratio (0.9 vs 0.5). However as DFM proportion rise up to 57:43, the P/L
slightly decreased, possibly also because of water competition between the flour components in the composite dough.
The deformation energy of DMF-CS 33:67 dough was almost twice that of DMF-CS 22: 78 dough (Table 4). In fact, the 33:67 DMF:CS ratio
dough had the most similar deformation energy as well as extensibility (L) to the wheat flour dough and gave the largest gas bubble of the DMF-
CS composites (Fig. 2), very similar in size to the wheat flour dough. However, further increasing the proportion of DMF to a DMF-CS ratio of
57:43 caused a decrease in dough deformation energy (Table 4). Taking into consideration the lower deformation energy and tenacity (P) of the
DMF-CS 57:43 dough, it is likely that the high level of DMF inclusion softened the dough, possibly because marama protein and dietary fibre
absorbed much of the water since there was comparatively less cassava starch in the composite. This is probably also the reason why there was
19

lower extensibility in the DMF-CS 57:43 composite dough when blowing bubbles compared to the 33:67 DMF-CS composite dough (Table 4,
Fig. 2). In fact, holes appeared before the softer composite (57:43) dough reached its maximum extensibility.
3.3 Dough characteristics during proofing
One of the major requirements for a gluten-free bread dough to produce leavened bread with desirable porous crumb structure is that the dough
should exhibit similar expansion and gas retention characteristics to wheat flour dough. The Rheofermentometer data showed that all the DMF-
CS composite doughs had much lower maximum dough height (Hm), height of maximum gas production (H’m) during proofing and had longer
time at which gas started to escape from the doughs (p < 0.05) than the wheat flour dough (Table 5). There are probably two reasons for these
differences in proofing characteristics between the DMF-CS composites and wheat flour doughs. Firstly, the higher height of wheat flour dough
would be in part due to remarkable viscoelastic properties of wheat gluten (Belton, 1999). Secondly, dough height, height of maximum gas
production and time start of gas escape from the dough are related to the quantity of carbon dioxide gas produced by the yeast (Chiotellis &
Campbell, 2003). Gas production in turn is also affected by the quantity of fermentable sugars present in the dough (Codină et al., 2013). The
DMF-CS doughs would be expected to have lower gas production due to the fact that marama flour contain only tiny quantities of fermentable
sugars such as sucrose (123.5 nmol/g) (Mosele et al., 2011) and most of the endogenous amylases would have been washed out during the CS
isolation process. Flours which show low amylase activity produce low levels of fermentable sugars and hence yeast fermentation during
proofing is limited (Codină et al., 2013). The lower maximum dough height of the DMF-CS (57:43) dough and its longer time to maximum gas
20

Table 5. Rheofermentometry dough proofing properties of wheat flour and defatted marama flour (DMF) cassava starch (CS) composite
flour doughs.
Dough type Hm (mm) H'm (mm) T1 (min) T′1 (min) Tx (min) Gas retention
coefficient (%)
Wheat flour 55.9c± 3.7 61.8
b ± 12.4 87.3
a± 14.2 96.3
a± 18.5 55.3
a± 8.6 63.1
a± 1.2
DMF-CS (22:78) 35.6b ± 3.6 33.7
a± 3.4 114.7
b ± 30.9 99.3
a± 33.5 85.3
b ± 16.2 90.7
b ± 3.1
DMF-CS (33:67) 35.1b ± 5.5 40.2
a± 7.2 107.7
b ± 21.8 95.3
a± 27.3 78.7
b ± 18.3 83.6
b ± 3.5
DMF-CS (57:43) 22.6a± 5.3 32.1
a± 3.3 120.0
b ± 21.6 143.7
b ± 32.4 87.7
b ± 21.5 87.0
b ± 4.6
Means of 3 replicate experiments ± standard deviations. Mean values in a column with different superscripts letters differ significantly (p < 0.05).
Hm Maximum dough height; H'm Maximum height of gaseous production;T1 Time at which dough reaches the maximum height; T′1 Time of
maximum gas formation; Tx Time at which gas starts to escape from the dough.
21

formation (p < 0.05) compared to the other DMF-CS composite doughs are probably also a consequence of this dough being softer, as described
above with respect to explaining its relatively poorer alveography performance (Table 4, Fig. 2)
Dough gas retention coefficient is related to the ability to stretch the dough in thin membranes, and in turn, it is associated with the quality of the
protein network (Wang et al., 2002). The significantly (p < 0.05) higher gas retention coefficients of the DMF-CS composite doughs compared
to the wheat flour dough (Table 4) shows that DMF-CS doughs could entrap the carbon dioxide produced by yeast during proofing, despite their
lower dough height. This confirms the alveograph data (Table 4, Fig. 2), indicating the potential of DMF-CS composite doughs to produce a
leavened dough similar to wheat flour dough.
3.4 Confocal Laser Scanning Microscopy (CLSM)
In help understand the rheological behaviour of the DFM-CS composite doughs they were examined using CLSM and compared with the wheat
flour dough (Fig. 3). Acid fuschin staining was used to identify the protein. In the wheat flour dough, the protein matrix (red spots) was
distributed homogenously throughout the dough (Fig. 3a). However, with the DMF-CS composite doughs as the proportion of DMF increased,
the protein matrix in the system became less homogenously distributed and occurred more as aggregates, particularly DMF-CS 57:43 dough
(Fig. 3D). A possible reason why the hydrated DMF did not distribute uniformly was because the hydrated DMF particles had a higher affinity
for each other than for the cassava starch, possibly due to the marama protein’s and pectin’s strong affinities for water (Amonsou et al., 2012b;
22
Figure 3: Confocal laser scanning microscopy (CLSM) images of wheat (A) and defatted marama-cassava starch (DFM-CS) doughs (B-D) stained with acid fuchsin. B. DFM-CS (22:78); C. DFM-CS (33:77; D. DFM-CS (57:43). Arrows indicate protein matrix.
23

Gambus et al., 2007). The particularly non-homogenous distribution of the marama protein with the highest DMF to CS ratio composite dough
(57:43) can possibly explain why it showed a reduction in alveograph dough tenacity and extensibility (Table 4) and dough bubble size (Fig. 2)
and rheofermentometer dough height and longer time to maximum gas formation (Table 5).
4. Conclusions
At a ratio of 33:67, the defatted marama flour:cassava starch composite flour can produce a dough of similar strength but less stability to wheat
flour dough, but which can produce an alveograph dough bubble and has good gas-holding capacity during proofing. This is evidently primarily
due to marama protein since marama protein has been found to have highly extensible and viscoelastic wheat gluten-like properties. The
presence of the dietary fibre in the defatted marama flour and the inclusion cassava starch appear favourably modify the marama protein
rheological properties. However, at a higher ratio of defatted cassava flour:cassava starch (57:43) the composite dough shows a reduction in
alveograph dough tenacity, extensibility and dough bubble size, and also of rheofermentometer dough height and takes a longer time to
maximum gas formation. This is probably due to non-homogenous distribution of the marama protein in the dough. Notwithstanding this,
defatted marama flour appears to have considerable potential as a functional gluten replacement in the production of “additive-free,” protein- and
dietary fibre-rich gluten-free bread or as a partial wheat flour replacement in composite flour breads. Research is now required to optimise
24

bakery handling properties of the defatted marama flour-cassava starch composite doughs and to determine baking performance, sensory quality
and bread shelf-life.
Acknowledgements
Mr Alan Hall of the University of Pretoria Microscopy and Microanalysis Lab, Mr Abadi Mezgebe and Dr Muhammad Gulzar for their technical
assistance.
References
AACC International (2000). Approved methods of the American Association of Cereal Chemists. (10th ed.). Approved Methods 44-15A, 46-
19A. St Paul, MN: American Association of Cereal Chemists.
Ajila, C.M., Leelavathi, K., & Rao, U.J.S.P. (2008). Improvement of dietary fiber content and antioxidant properties in soft dough biscuits with
incorporation of mango peel powder. Journal of Cereal Science, 48, 319-26.
Amonsou, E., Taylor, J.R.N., Beukes, M., & Minnaar, A. (2012a). Composition of marama bean protein. Food Chemistry, 130, 638-643.
25
Amonsou, E., Taylor, J.R.N., Emmambux, M.N., Duodu, K.G., & Minnaar. A. (2012b). Highly viscous dough-forming properties of marama
protein. Food Chemistry, 134, 1519–1526.
Awolu, O.O., & Oseyemi F.G. (2016). Physicochemical and rheological properties of optimised cocoyam-based composite flour comprising
cassava starch. Food Technology, 20, 65-85
Belton, P.S., (1999). Mini review: on the elasticity of wheat gluten. Journal of Cereal Science, 29, 103-107.
Chinma, C.E., Ariahu, C.C., & Abu, J.O. (2013). Chemical composition, functional and pasting properties of cassava starch and soy protein
concentrate blends. Journal of Food Science and Technology, 50, 1179–1185.
Chiotellis, E., & Campbell, G.M. (2003). Proving of bread dough II: measurement of gas production and retention. Food and Bioproducts
Processing, 81, 207-216.
Codină, G.G., MironeaSa, S., VoiCa, D.V., & Mironeasa, C. (2013). Multivariate analysis of wheat flour dough sugars, gas production, and
dough development at different fermentation times. Czech Journal of Food Science, 31, 222–229.
Defloor, I., Dehing, I,. & Delcour, J.A. (1998). Physico‐chemical properties of cassava starch. Starch‐Stärke, 50, 58-64.
Falade, A.T., Emmambux, M.N., Buys, E.M., & Taylor, J.RN. (2014). Improvement of maize bread quality through modification of dough
rheological properties by lactic acid bacteria fermentation. Journal of Cereal Science, 60, 471-476.
26

Gambus, H., Sikora, M., & Ziobro, R. (2007). The effect of composition of hydrocolloids on properties of gluten-free bread. Acta Scientiarum
Poonorum Technologia Alimentaria, 6, 61-74.
Guarda, A., Rosell, C.M., Benedito, C., & Galotto, M.J. (2004). Different hydrocolloids as bread improvers and antistaling agents. Food
Hydrocolloids, 18, 241-247.
Gulzar, M.,Taylor, J.R.N., & Minnaar, A. (2017). Influence of extraction pH on the foaming, emulsification, oil-binding and visco-elastic
properties of marama protein. Journal of Science of Food and Agriculture, 97, 4815-4821.
Holse, M., Husted, S., & Hansen, Å. (2010). Chemical composition of marama bean (Tylosema esculentum) - A wild African bean with
unexploited potential. Journal of Food Composition and Analysis, 23, 648-657.
ICC (2011). Standard Method 173. Whole meal and flour from T. aestivum – Determination of rheological behavior as a function of mixing and
temperature increase Vienna: International Association for Cereal Science and Technology.
ICC (1992). Standard Method 121. Method for using the Chopin Alveograph (Rheological Properties). Vienna: International Association for
Cereal Science and Technology.
Koksel, H., Kahraman, K., Sanal, T., Ozay, D.S., & Dubat, A. (2009). Potential utilization of Mixolab for quality evaluation. Cereal Chemistry,
86, 522–526.
27

Lazaridou, A., Duta, D., Papageorgiou, M., Belc, N., & Biliaderis, C.G. (2007). Effects of hydrocolloids on dough rheology and bread quality
parameters in gluten-free formulations. Journal of Food Engineering, 79, 1033–1047.
Mali, S., Sakanaka, L.S., Yamashita, F., & Grossmann, M.V. (2005). Water absorption and mechanical properties of cassava starch films and
their relation to plasticizing effect. Carbohydrate Polymers, 60, 283-289.
Marco, C., & Rosell, C.M. (2008a). Breadmaking performance of protein enriched, gluten- free breads. European Food Research Technology,
227, 1205-1213
Marco, C., & Rosell, C.M. (2008b). Functional and rheological properties of protein enriched gluten free composite flours. Journal of Food
Engineering, 88, 94-103.
Maruatona, G.M., Duodu, K.G., & Minnaar, A. (2010). Physicochemical, nutritional and functional properties of marama bean flour. Food
Chemistry, 121, 400–405.
Matos, M.E., & Rosell, C.M. (2015). Understanding gluten-free dough for reaching breads with physical quality and nutritional balance. Journal
of the Science of Food and Agriculture 95, 653-661.
Mosele, M.M. (2012). Chemical and structural characterisation of marama bean (Tylosema esculentum) carbohydrates. PhD thesis, Copenhagen:
University of Copenhagen.
28

Mosele, M.M., Hansen, A.S., Engelsen, S.B., Diaz, J., Sorensen, I., Ulvskov, P.,& Harholt, J. (2011). Characterisation of arabinose-rich
carbohydrate composition of immature and mature marama beans (Tylosema esculentum). Phytochemistry, 72, 1466-1472.
Nepolo, E., Takundwa, M., Chimwamurombe, P.M., Cullis, C.A., & Kunert, K. (2009). A review of geographical distribution of marama bean
[Tylosema esculentum (Burchell) Schreiber] and genetic diversity in the Namibian germplasm. African Journal of Biotechnology, 8, 2088-2093.
Nyembwe, P., Minnaar, A., Duodu, K.G., & de Kock, H.L. (2015). Sensory and physicochemical analyses of roasted marama beans [Tylosema
esculentum (Burchell) A. Schreiber] with specific focus on compounds that may contribute to bitterness. Food Chemistry, 178, 45-51.
Onyango, C., Mutungi, C., Unbehend, G., & Lindhauer, M.G., 2011. Modification of gluten-free sorghum batter and bread using maize, potato,
cassava or rice starch. LWT-Food Science and Technology, 44, 681-686.
Rosell, C.M., Rojas, J.A., & Benedito de Barber, C. (2001). Influence of hydrocolloids on dough rheology and bread quality. Food
Hydrocolloids, 15, 75-81.
Sciarini, L.S., Ribotta, P.D., Leó, A.E., & Pérez, G.T. (2010). Influence of gluten-free flours and their mixtures on batter properties and bread
quality. Food Bioprocess Technology, 10, 0098-2.
Wang, J., Rosell, C.M., & De Barber, B.C. (2002). Effect of the addition of different fibres on wheat dough performance and bread quality. Food
Chemistry, 79, 221-22.
29