Embed Size (px)
Citation preview
PATIENT DOSIMETRYIN
DIAGNOSTIC RADIOLOGY MODALITIES
Prof. Dr. Doğan BOR
Ankara UniversityInstitute of Nuclear Science

Ankara UniversityInstitute of Nuclear Science
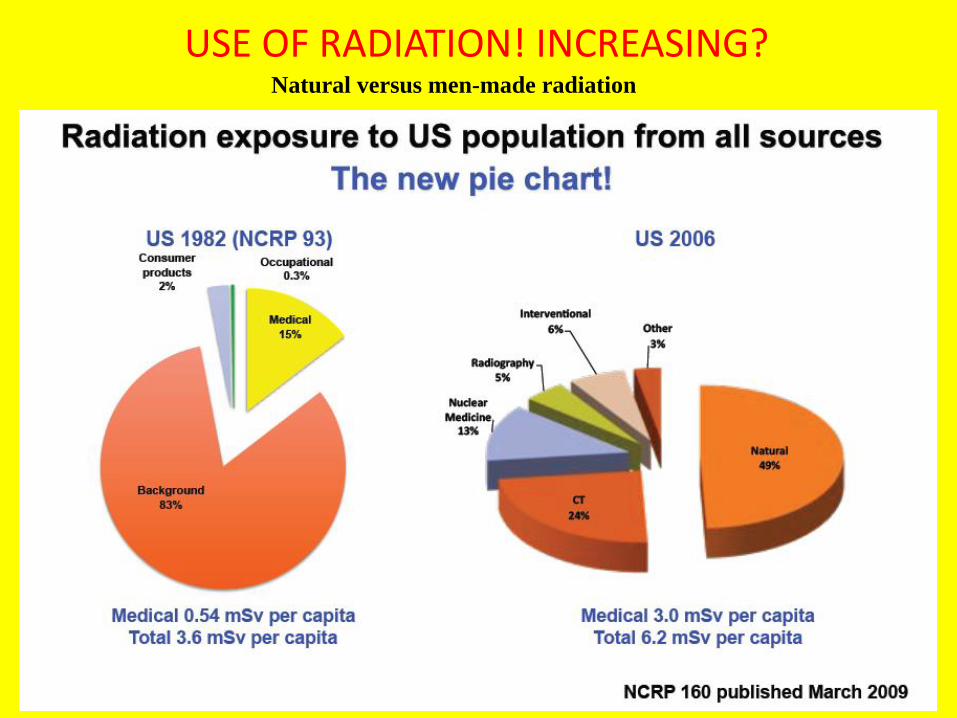
USE OF RADIATION! INCREASING?Natural versus men-made radiation
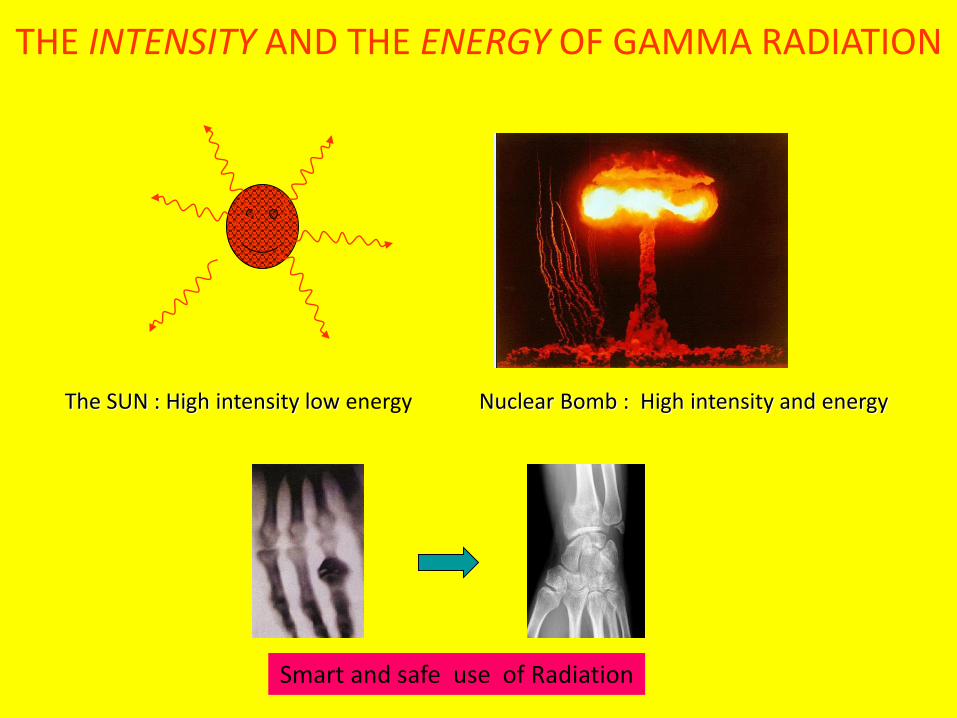
Nuclear Bomb : High intensity and energyThe SUN : High intensity low energy
Smart and safe use of Radiation
THE INTENSITY AND THE ENERGY OF GAMMA RADIATION
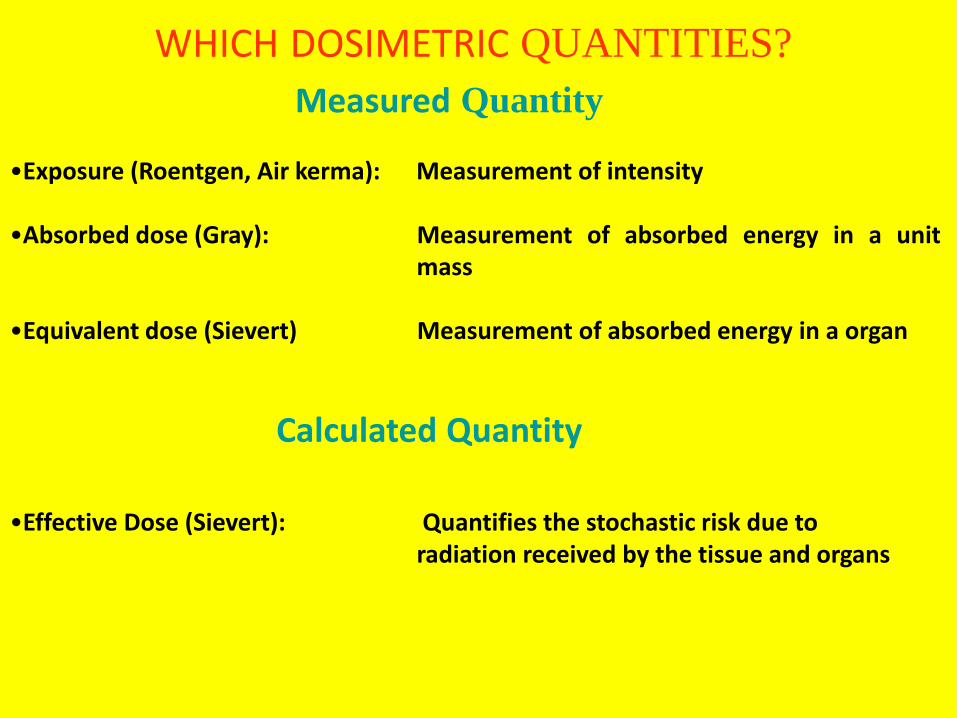
WHICH DOSIMETRIC QUANTITIES?
•Exposure (Roentgen, Air kerma): Measurement of intensity
•Absorbed dose (Gray): Measurement of absorbed energy in a unitmass
•Equivalent dose (Sievert) Measurement of absorbed energy in a organ
•Effective Dose (Sievert): Quantifies the stochastic risk due toradiation received by the tissue and organs
Measured Quantity
Calculated Quantity
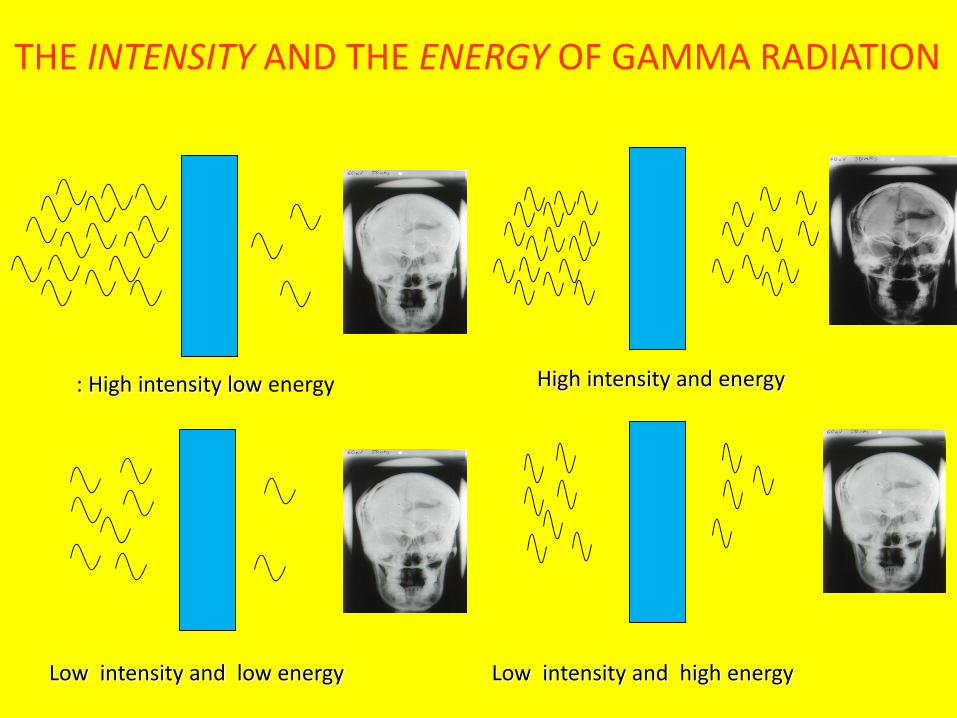
Low intensity and low energy
THE INTENSITY AND THE ENERGY OF GAMMA RADIATION
: High intensity low energy High intensity and energy
Low intensity and high energy
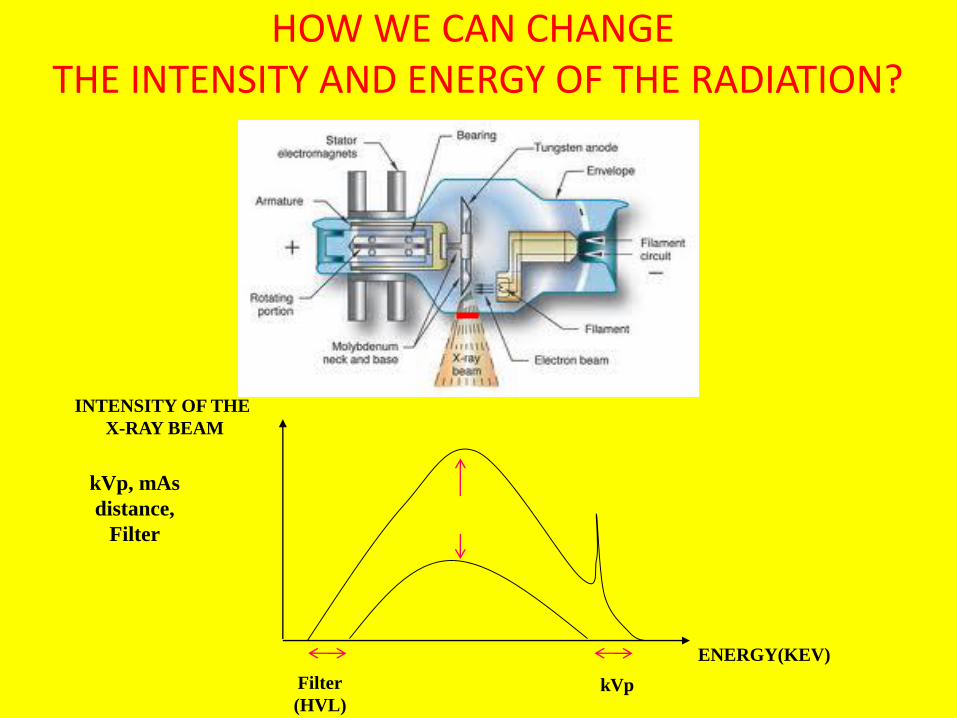
HOW WE CAN CHANGE THE INTENSITY AND ENERGY OF THE RADIATION?
ENERGY(KEV)
kVpFilter
(HVL)
kVp, mAs
distance,
Filter
INTENSITY OF THE
X-RAY BEAM
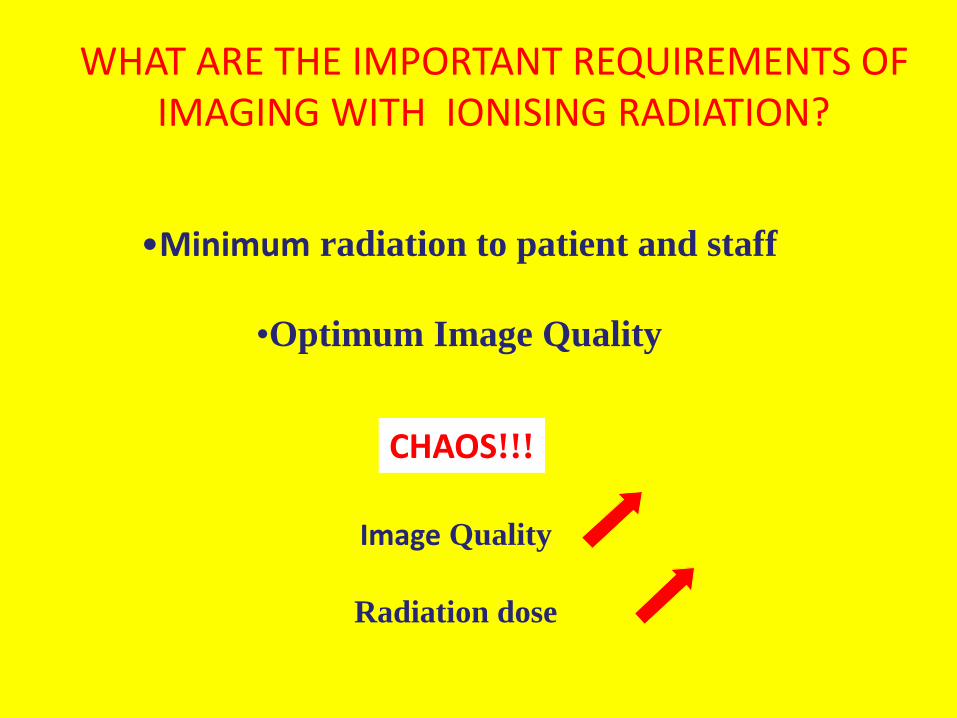
WHAT ARE THE IMPORTANT REQUIREMENTS OF IMAGING WITH IONISING RADIATION?
•Minimum radiation to patient and staff
•Optimum Image Quality
CHAOS!!!
Image Quality
Radiation dose
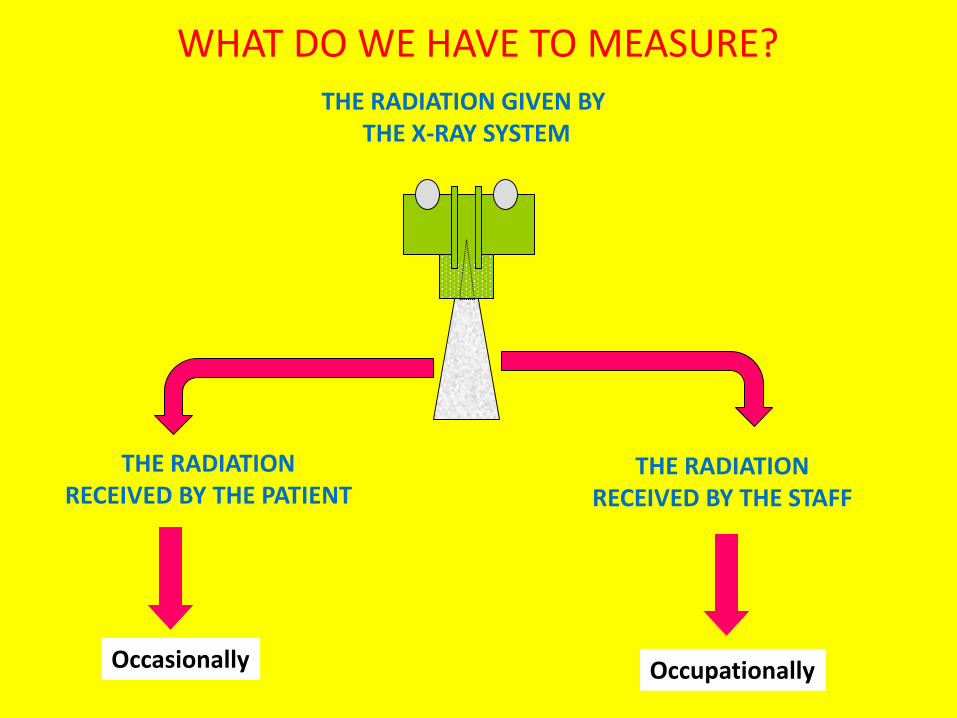
THE RADIATIONRECEIVED BY THE PATIENT
Occasionally Occupationally
THE RADIATION GIVEN BY THE X-RAY SYSTEM
WHAT DO WE HAVE TO MEASURE?
THE RADIATIONRECEIVED BY THE STAFF
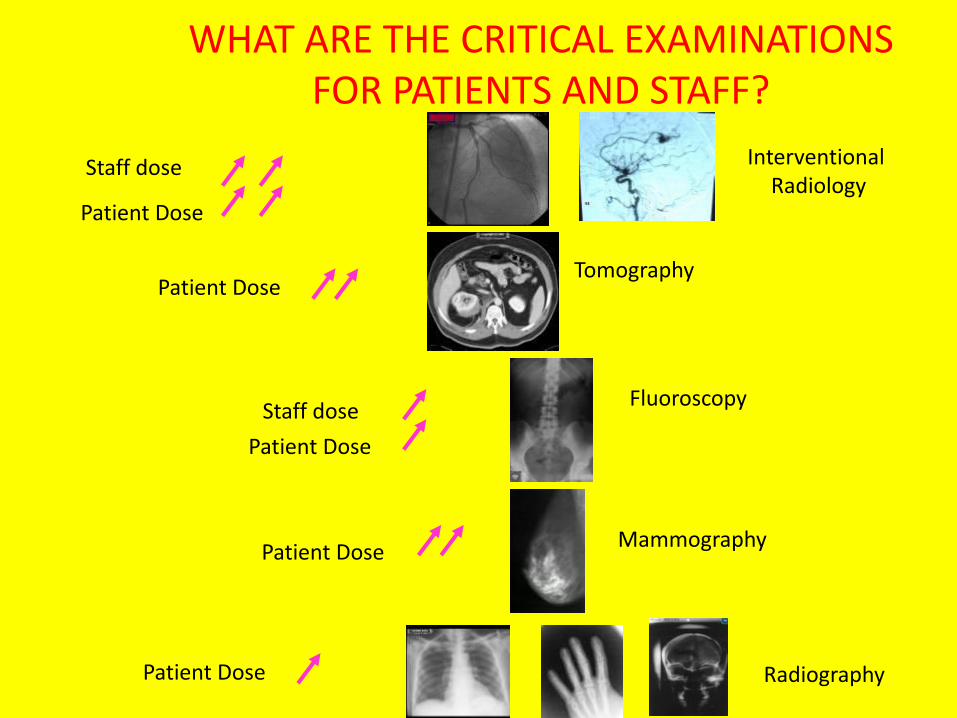
WHAT ARE THE CRITICAL EXAMINATIONSFOR PATIENTS AND STAFF?
Interventional Radiology
Tomography
Mammography
Radiography
Fluoroscopy
Patient Dose
Staff dose
Patient Dose
Patient Dose
Patient Dose
Staff dose
Patient Dose
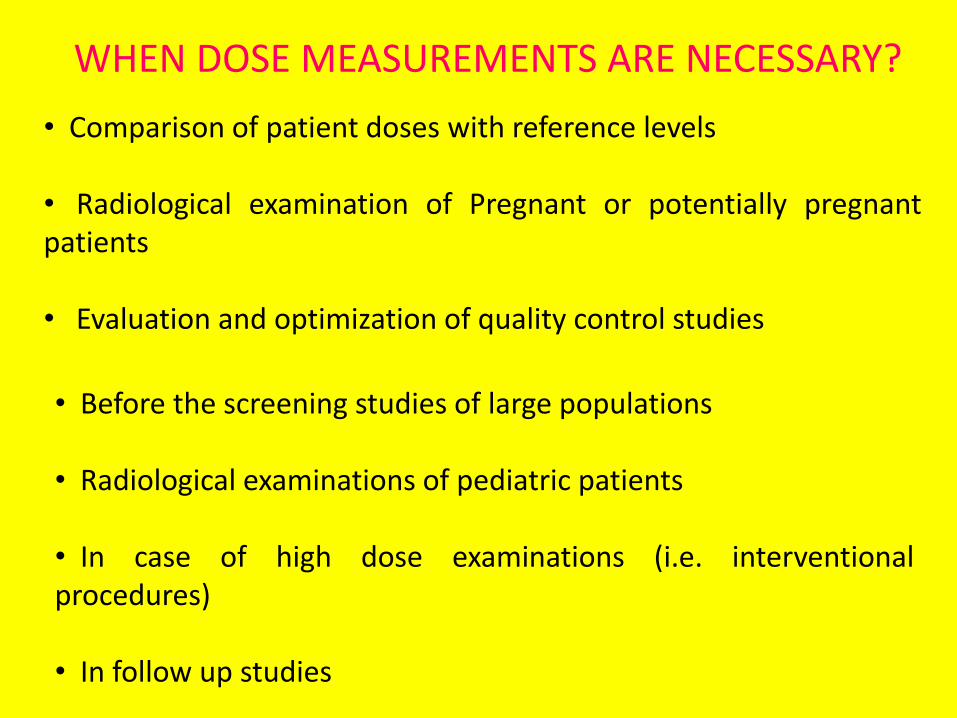
• Before the screening studies of large populations
• Radiological examinations of pediatric patients
• In case of high dose examinations (i.e. interventionalprocedures)
• In follow up studies
WHEN DOSE MEASUREMENTS ARE NECESSARY?
• Comparison of patient doses with reference levels
• Radiological examination of Pregnant or potentially pregnantpatients
• Evaluation and optimization of quality control studies
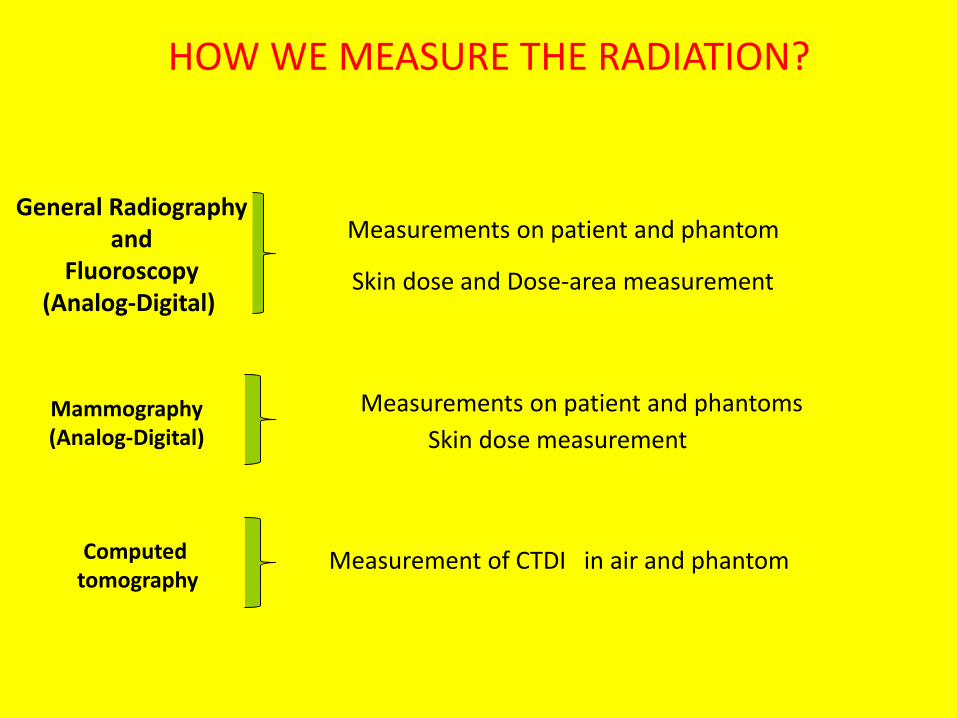
Measurements on patient and phantomGeneral Radiography
andFluoroscopy
(Analog-Digital) Skin dose and Dose-area measurement
Mammography(Analog-Digital)
Measurements on patient and phantoms
Computed tomography
Measurement of CTDI in air and phantom
HOW WE MEASURE THE RADIATION?
Skin dose measurement
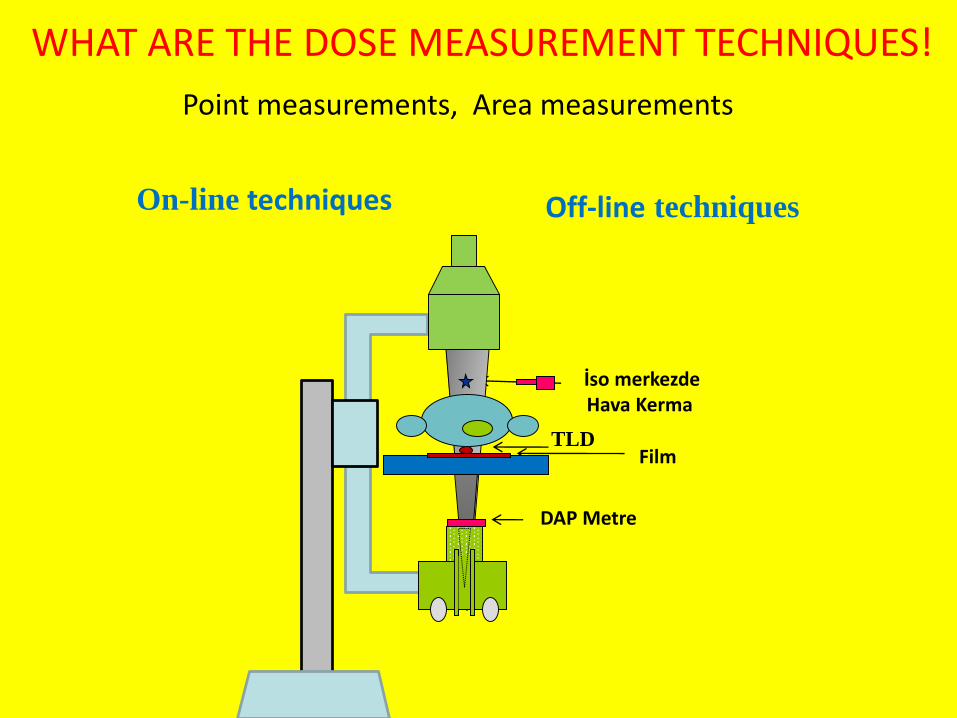
WHAT ARE THE DOSE MEASUREMENT TECHNIQUES!
İso merkezdeHava Kerma
TLDFilm
DAP Metre
On-line techniques Off-line techniques
Point measurements, Area measurements
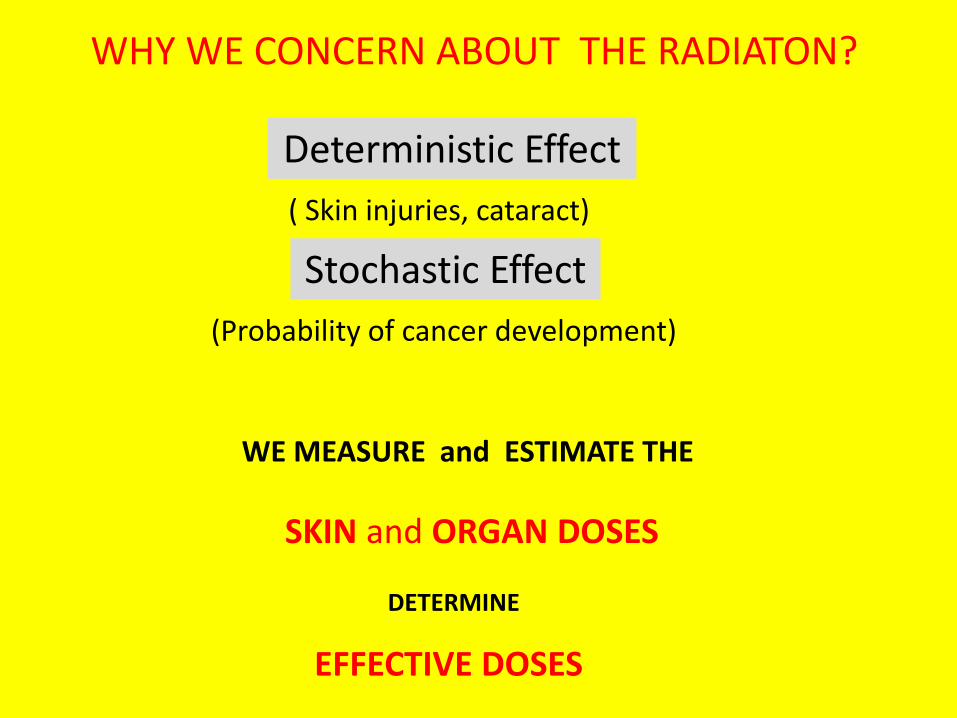
WHY WE CONCERN ABOUT THE RADIATON?
Deterministic Effect
Stochastic Effect
EFFECTIVE DOSES
( Skin injuries, cataract)
(Probability of cancer development)
WE MEASURE and ESTIMATE THE
SKIN and ORGAN DOSES
DETERMINE
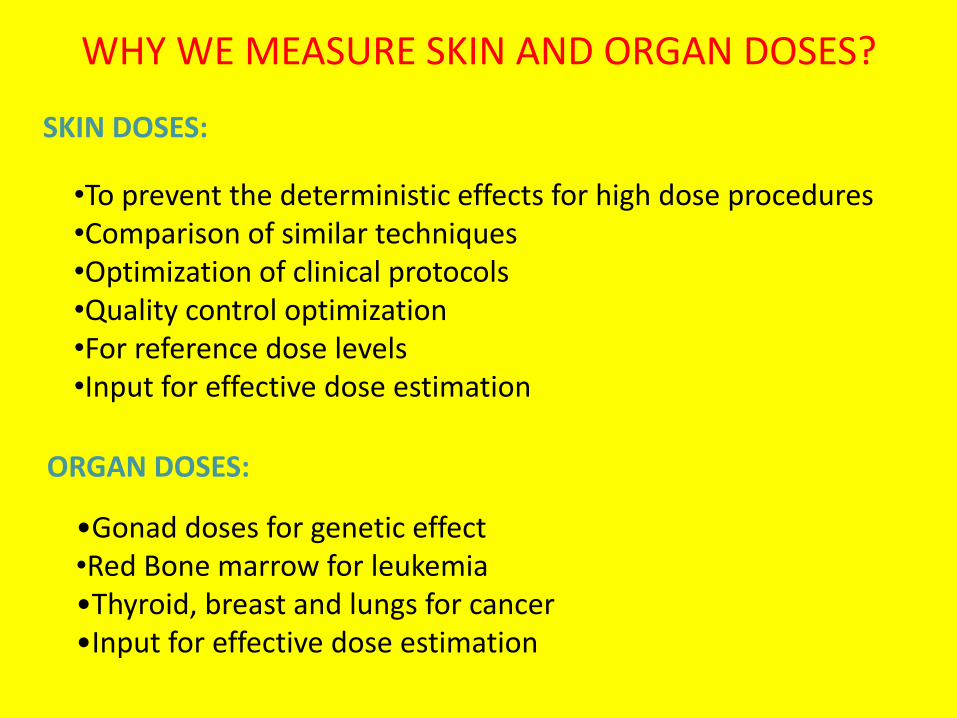
•Gonad doses for genetic effect•Red Bone marrow for leukemia•Thyroid, breast and lungs for cancer•Input for effective dose estimation
WHY WE MEASURE SKIN AND ORGAN DOSES?
•To prevent the deterministic effects for high dose procedures•Comparison of similar techniques•Optimization of clinical protocols•Quality control optimization•For reference dose levels•Input for effective dose estimation
SKIN DOSES:
ORGAN DOSES:
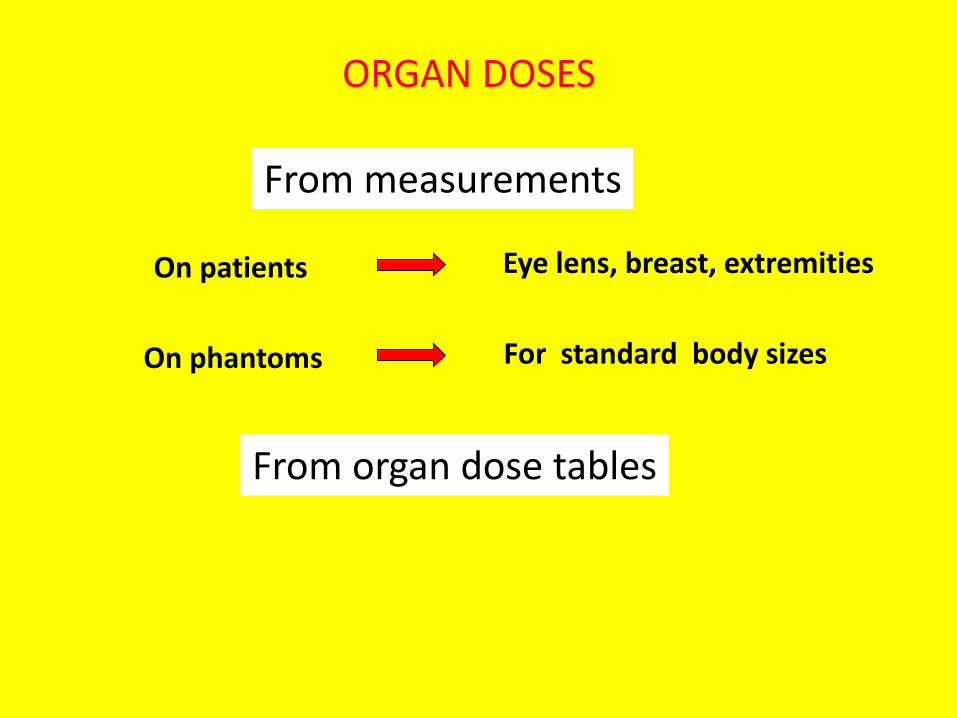
ORGAN DOSES
For standard body sizes
On patients Eye lens, breast, extremities
On phantoms
From measurements
From organ dose tables
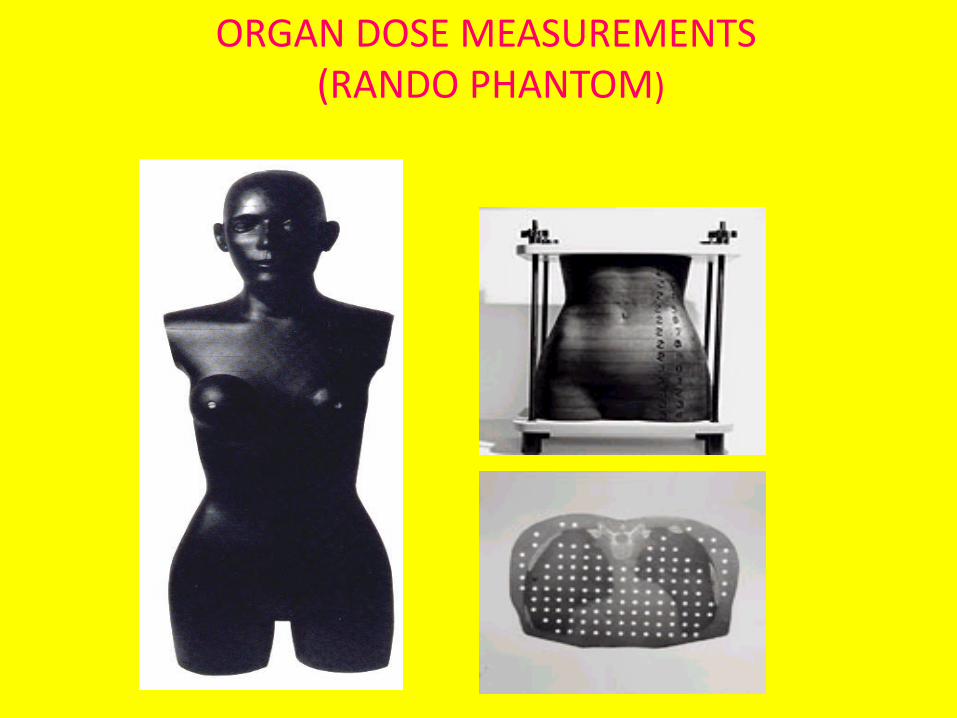
ORGAN DOSE MEASUREMENTS(RANDO PHANTOM)
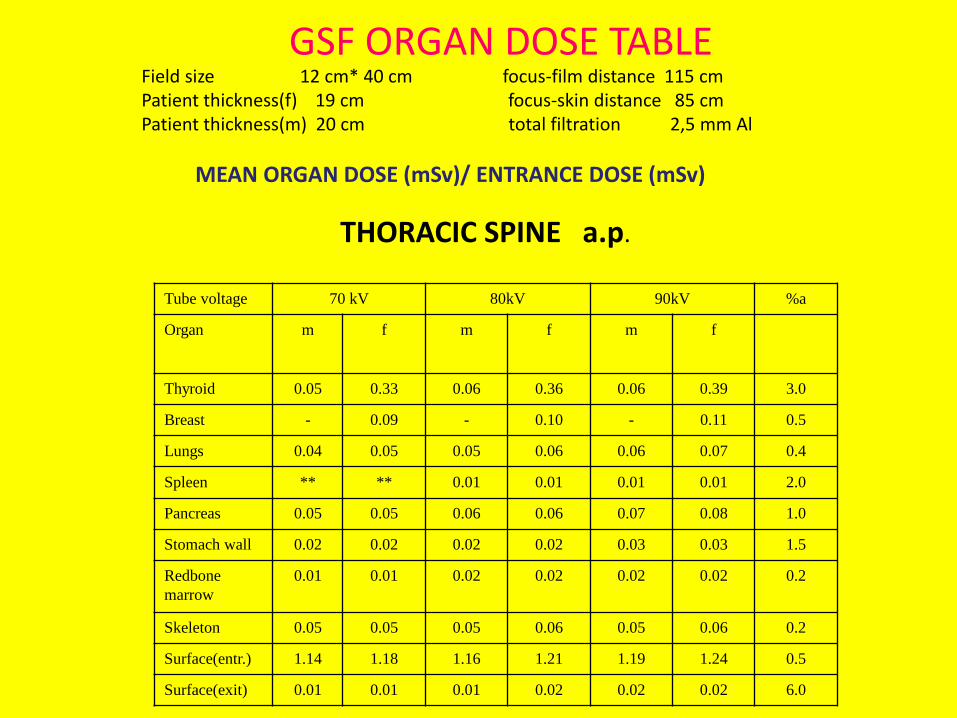
Field size 12 cm* 40 cm focus-film distance 115 cmPatient thickness(f) 19 cm focus-skin distance 85 cmPatient thickness(m) 20 cm total filtration 2,5 mm Al
MEAN ORGAN DOSE (mSv)/ ENTRANCE DOSE (mSv)
THORACIC SPINE a.p.
Tube voltage 70 kV 80kV 90kV %a
Organ m f m f m f
Thyroid 0.05 0.33 0.06 0.36 0.06 0.39 3.0
Breast - 0.09 - 0.10 - 0.11 0.5
Lungs 0.04 0.05 0.05 0.06 0.06 0.07 0.4
Spleen ** ** 0.01 0.01 0.01 0.01 2.0
Pancreas 0.05 0.05 0.06 0.06 0.07 0.08 1.0
Stomach wall 0.02 0.02 0.02 0.02 0.03 0.03 1.5
Redbone
marrow
0.01 0.01 0.02 0.02 0.02 0.02 0.2
Skeleton 0.05 0.05 0.05 0.06 0.05 0.06 0.2
Surface(entr.) 1.14 1.18 1.16 1.21 1.19 1.24 0.5
Surface(exit) 0.01 0.01 0.01 0.02 0.02 0.02 6.0
GSF ORGAN DOSE TABLE
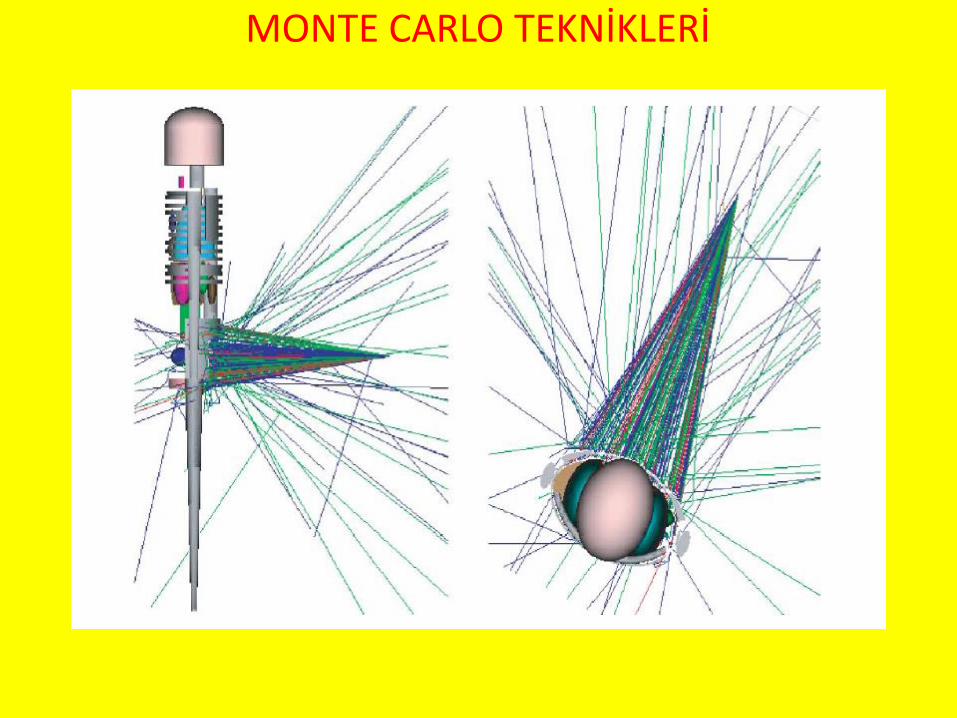
MONTE CARLO TEKNİKLERİ
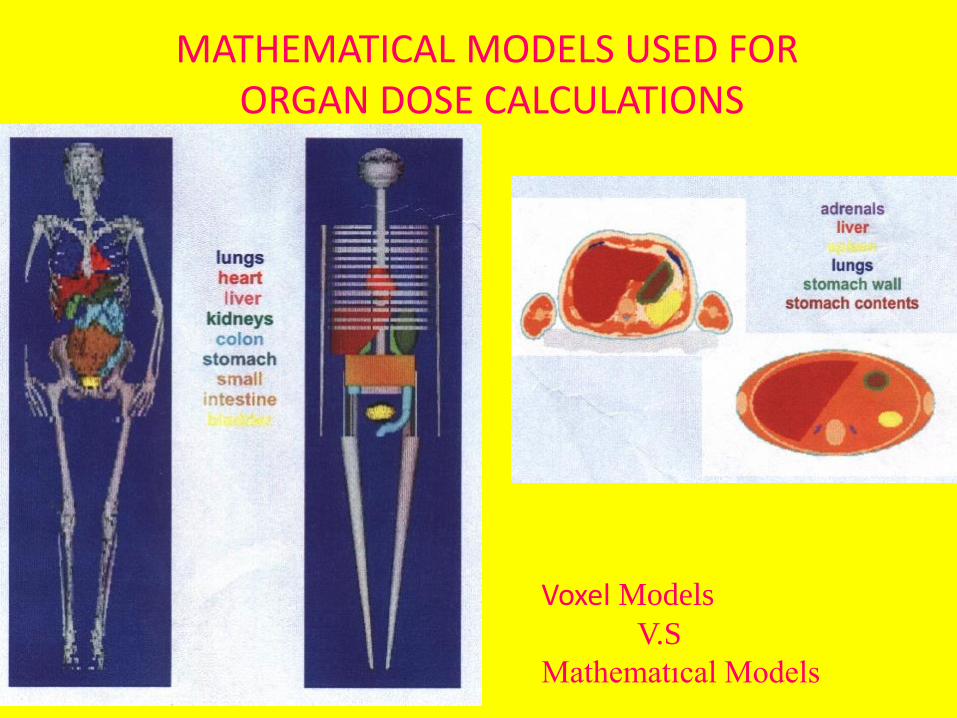
Voxel Models
V.S
Mathematıcal Models
MATHEMATICAL MODELS USED FORORGAN DOSE CALCULATIONS
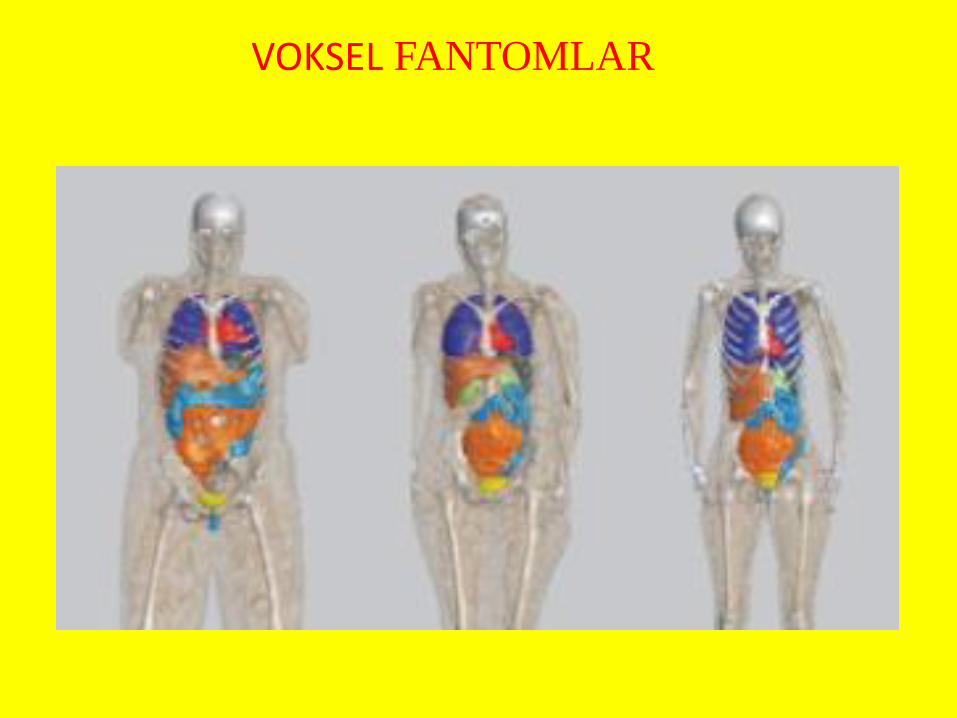
VOKSEL FANTOMLAR
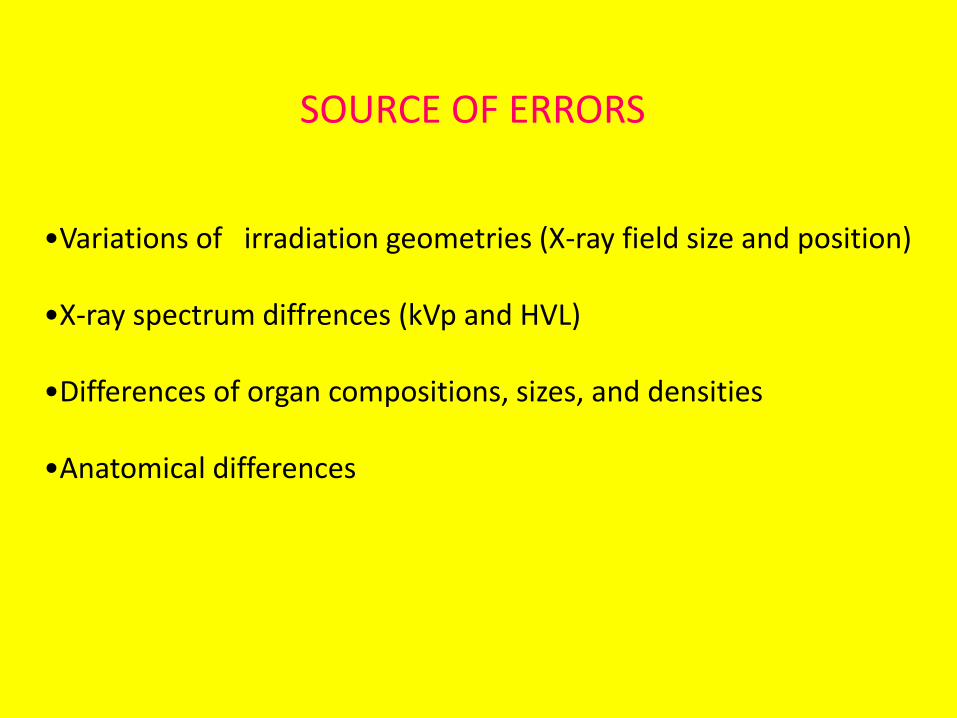
•Variations of irradiation geometries (X-ray field size and position)
•X-ray spectrum diffrences (kVp and HVL)
•Differences of organ compositions, sizes, and densities
•Anatomical differences
SOURCE OF ERRORS
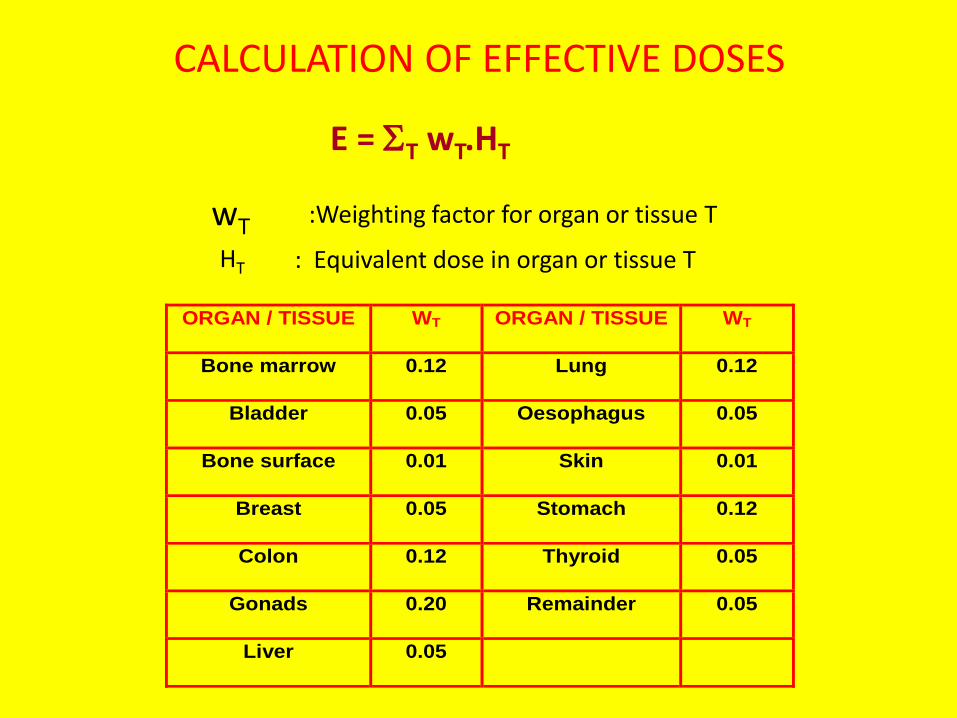
CALCULATION OF EFFECTIVE DOSES
E = T wT.HT
wT :Weighting factor for organ or tissue T
HT : Equivalent dose in organ or tissue T
ORGAN / TISSUE WT ORGAN / TISSUE WT
Bone marrow 0.12 Lung 0.12
Bladder 0.05 Oesophagus 0.05
Bone surface 0.01 Skin 0.01
Breast 0.05 Stomach 0.12
Colon 0.12 Thyroid 0.05
Gonads 0.20 Remainder 0.05
Liver 0.05
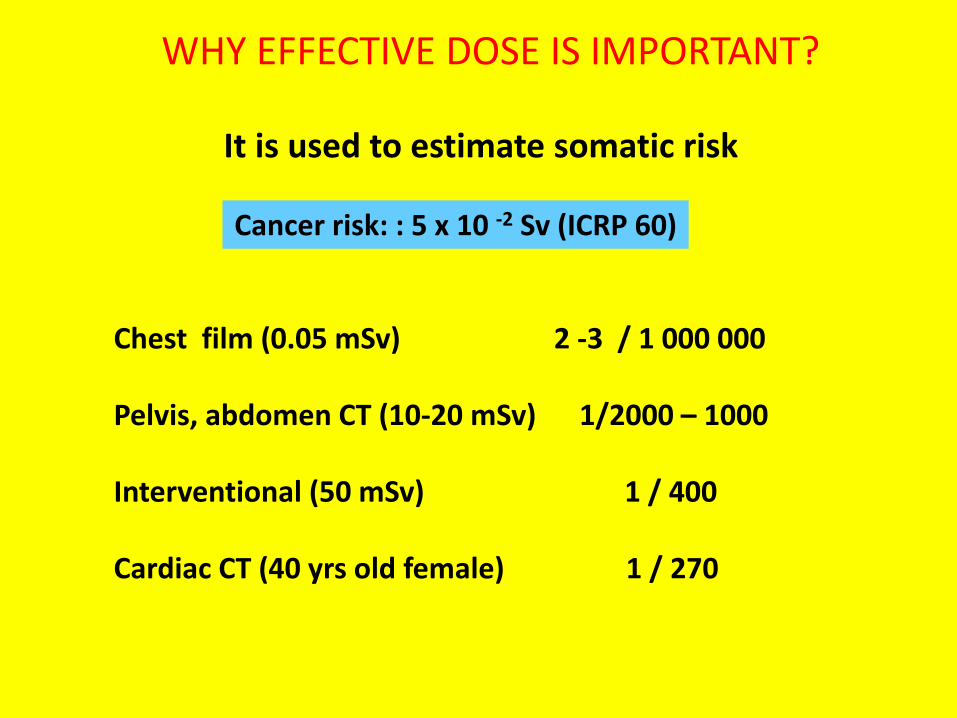
WHY EFFECTIVE DOSE IS IMPORTANT?
It is used to estimate somatic risk
Cancer risk: : 5 x 10 -2 Sv (ICRP 60)
Chest film (0.05 mSv) 2 -3 / 1 000 000
Pelvis, abdomen CT (10-20 mSv) 1/2000 – 1000
Interventional (50 mSv) 1 / 400
Cardiac CT (40 yrs old female) 1 / 270
DOSIMETRY IN RADIOGRAPHY
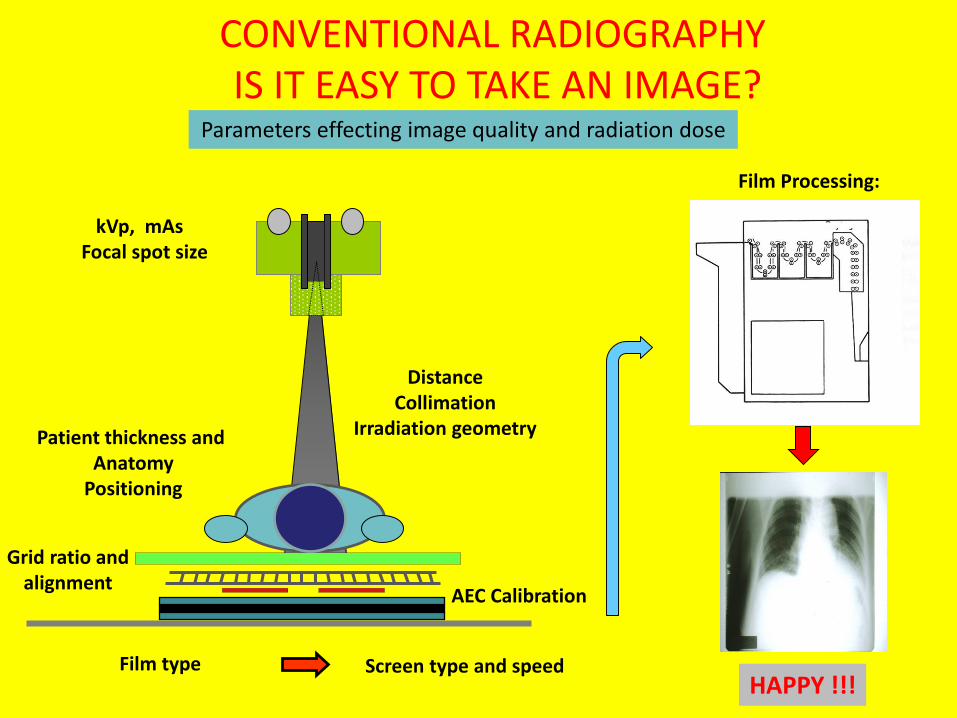
CONVENTIONAL RADIOGRAPHY IS IT EASY TO TAKE AN IMAGE?
Parameters effecting image quality and radiation dose
kVp, mAsFocal spot size
Patient thickness and Anatomy
Positioning
DistanceCollimation
Irradiation geometry
Film type
Grid ratio andalignment
Screen type and speed
Film Processing:
AEC Calibration
HAPPY !!!
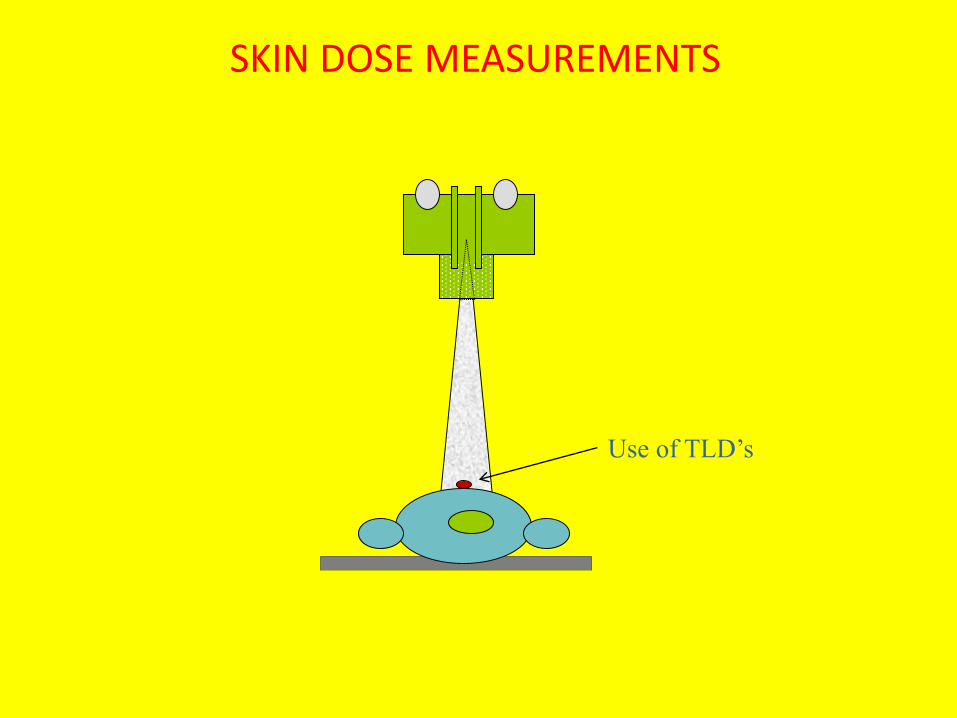
SKIN DOSE MEASUREMENTS
Use of TLD’s
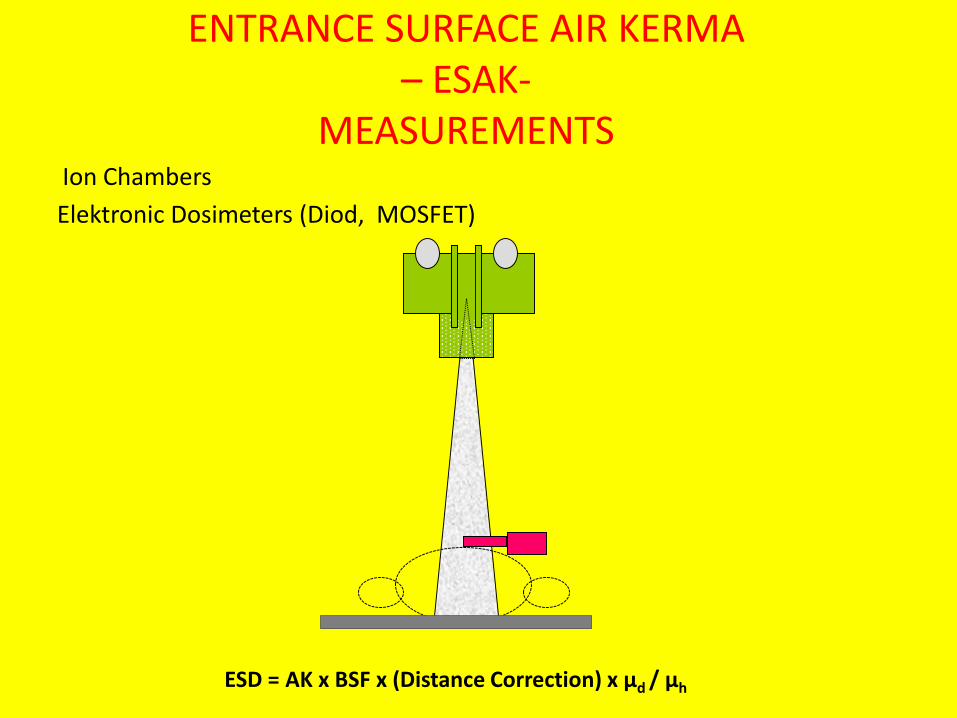
ENTRANCE SURFACE AIR KERMA – ESAK-
MEASUREMENTS Ion Chambers
Elektronic Dosimeters (Diod, MOSFET)
ESD = AK x BSF x (Distance Correction) x μd / μh
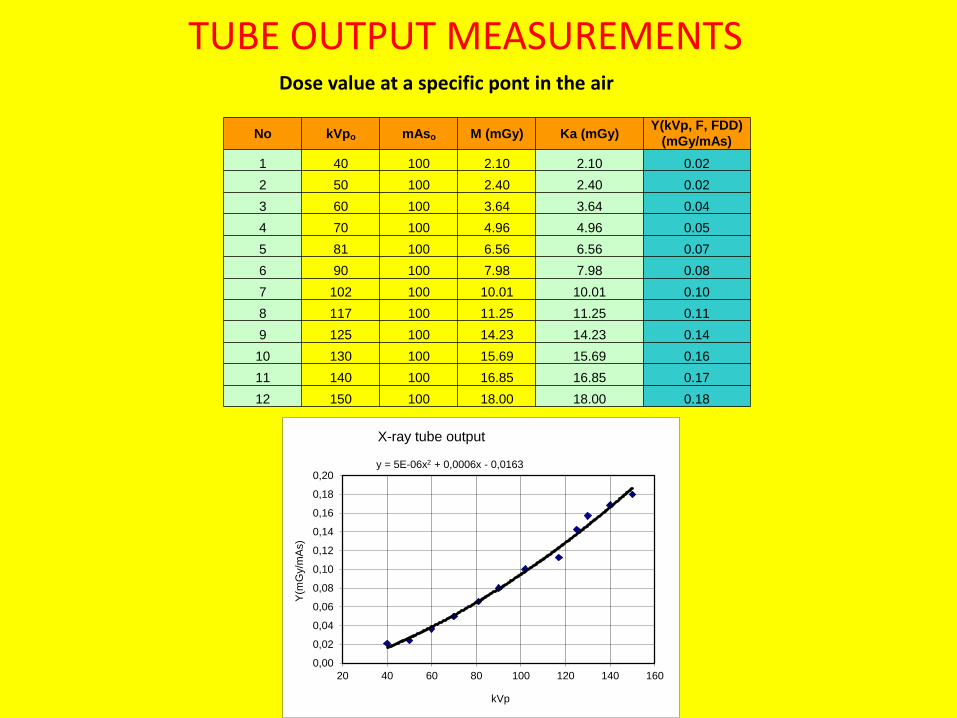
No kVpo mAso M (mGy) Ka (mGy)Y(kVp, F, FDD)
(mGy/mAs)
1 40 100 2.10 2.10 0.02
2 50 100 2.40 2.40 0.02
3 60 100 3.64 3.64 0.04
4 70 100 4.96 4.96 0.05
5 81 100 6.56 6.56 0.07
6 90 100 7.98 7.98 0.08
7 102 100 10.01 10.01 0.10
8 117 100 11.25 11.25 0.11
9 125 100 14.23 14.23 0.14
10 130 100 15.69 15.69 0.16
11 140 100 16.85 16.85 0.17
12 150 100 18.00 18.00 0.18
y = 5E-06x2 + 0,0006x - 0,0163
0,00
0,02
0,04
0,06
0,08
0,10
0,12
0,14
0,16
0,18
0,20
20 40 60 80 100 120 140 160
Y(m
Gy/m
As)
kVp
X-ray tube output
TUBE OUTPUT MEASUREMENTS Dose value at a specific pont in the air
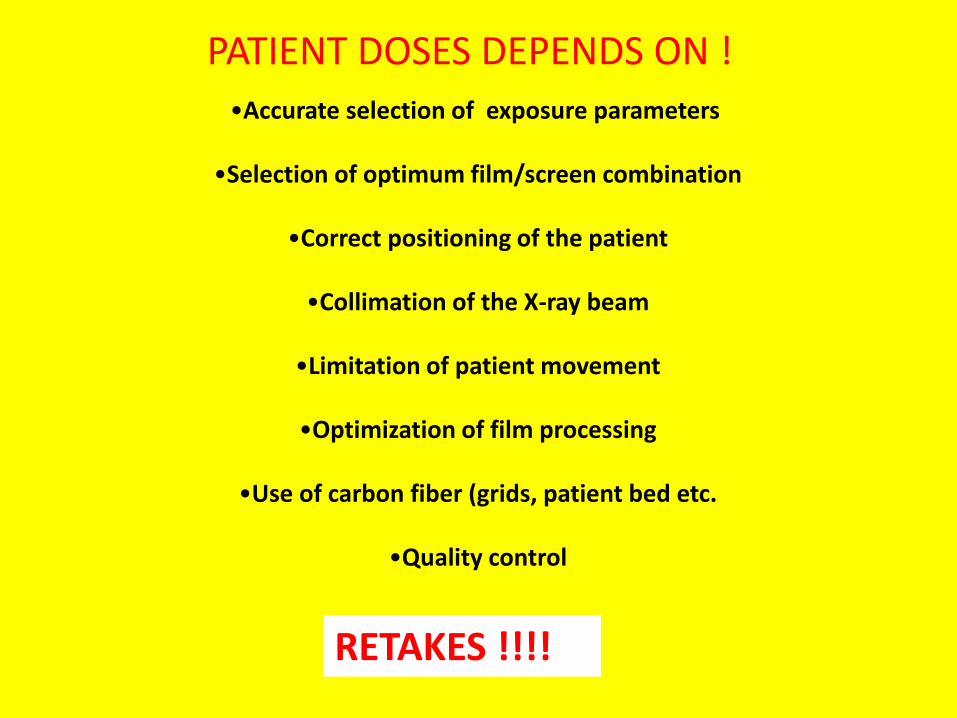
PATIENT DOSES DEPENDS ON !
•Accurate selection of exposure parameters
•Selection of optimum film/screen combination
•Correct positioning of the patient
•Collimation of the X-ray beam
•Limitation of patient movement
•Optimization of film processing
•Use of carbon fiber (grids, patient bed etc.
•Quality control
RETAKES !!!!
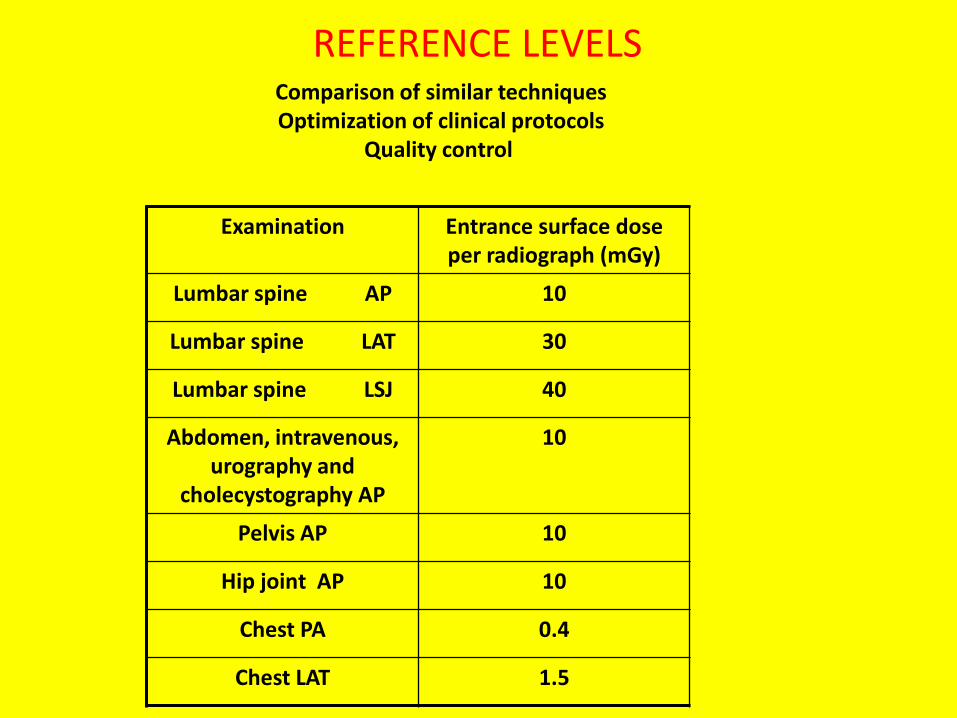
Examination Entrance surface dose per radiograph (mGy)
Lumbar spine AP 10
Lumbar spine LAT 30
Lumbar spine LSJ 40
Abdomen, intravenous, urography and
cholecystography AP
10
Pelvis AP 10
Hip joint AP 10
Chest PA 0.4
Chest LAT 1.5
REFERENCE LEVELSComparison of similar techniquesOptimization of clinical protocols
Quality control
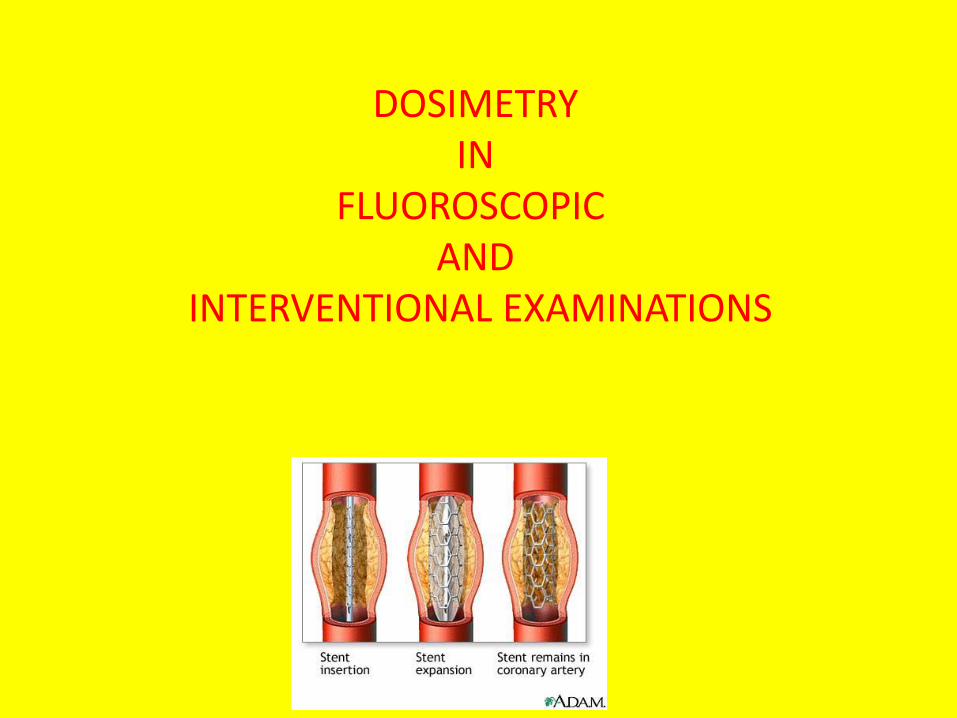
DOSIMETRYIN
FLUOROSCOPIC AND
INTERVENTIONAL EXAMINATIONS
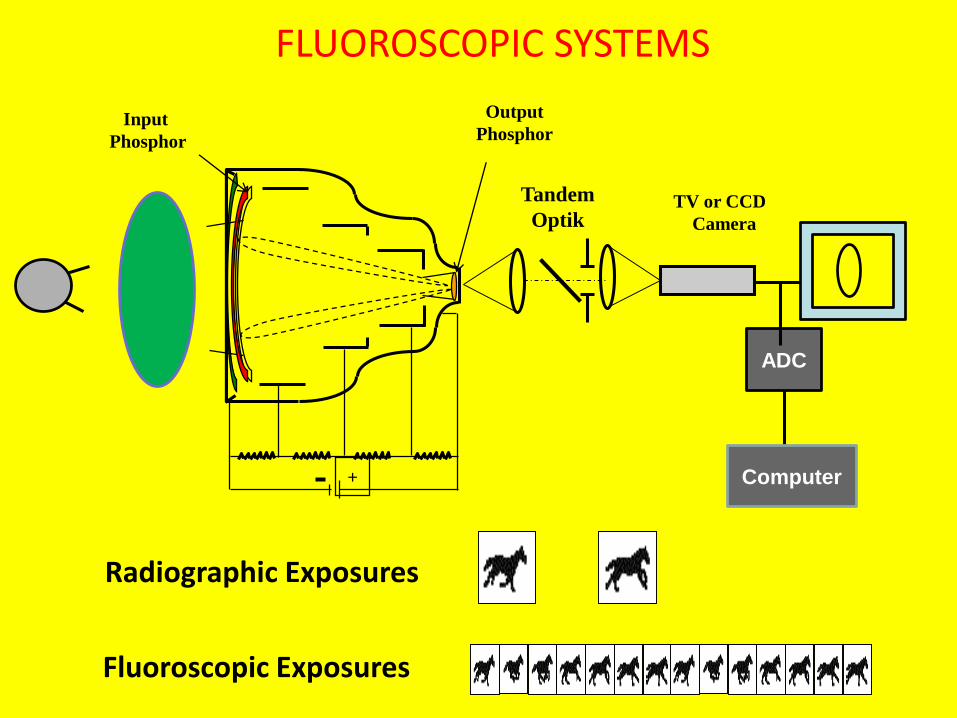
+
Input
Phosphor
Output
Phosphor
TV or CCD
Camera
Tandem
Optik
FLUOROSCOPIC SYSTEMS
ADC
Computer
Radiographic Exposures
Fluoroscopic Exposures
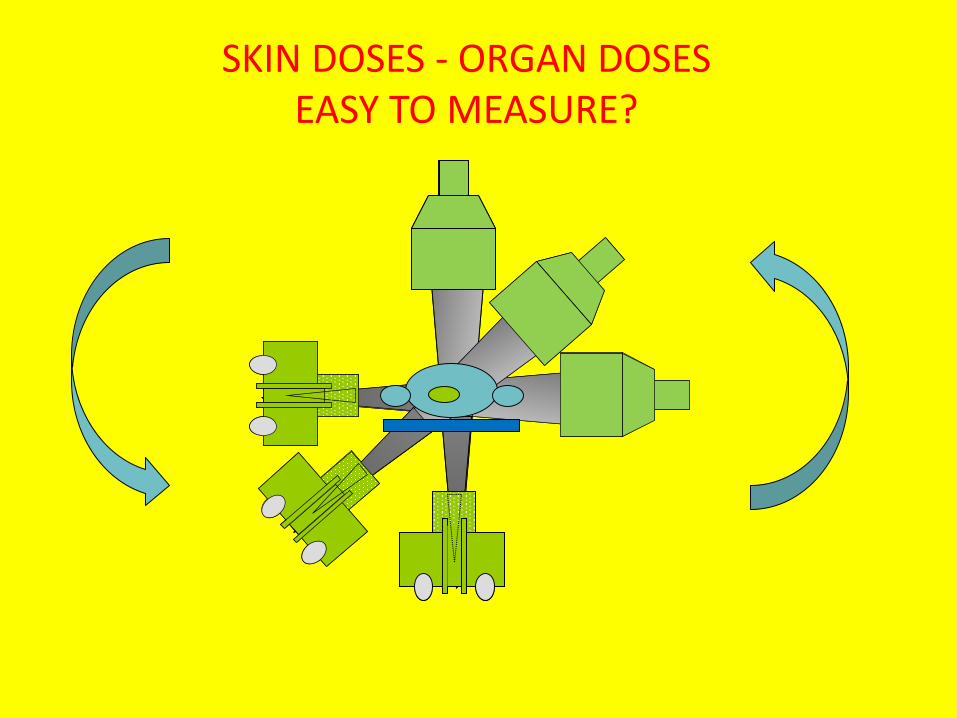
SKIN DOSES - ORGAN DOSESEASY TO MEASURE?
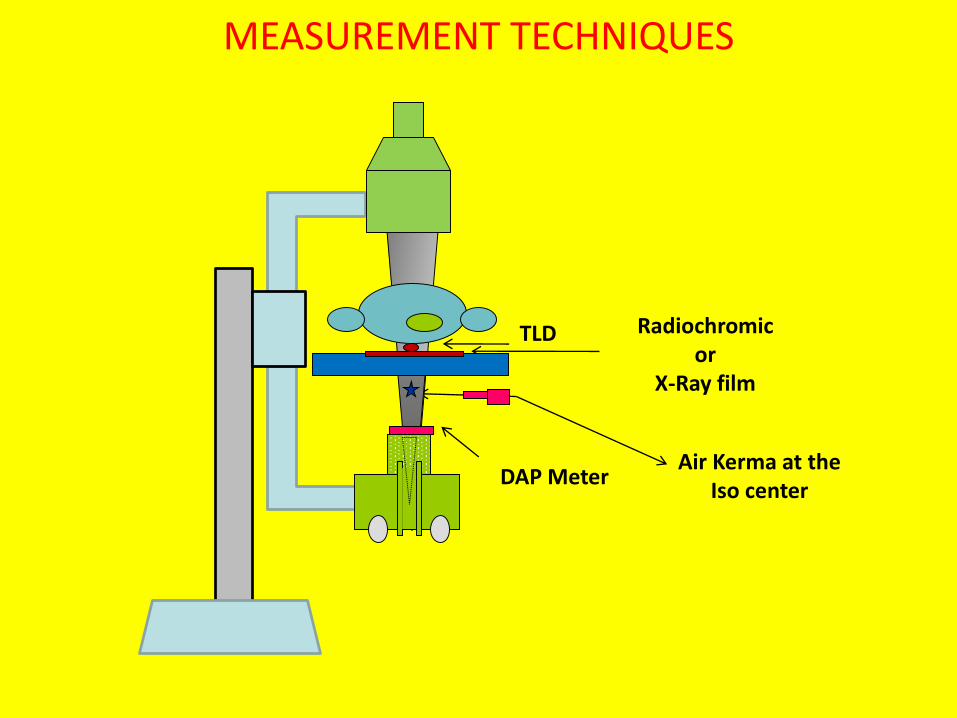
Air Kerma at the Iso center
TLD Radiochromicor
X-Ray film
DAP Meter
MEASUREMENT TECHNIQUES
36
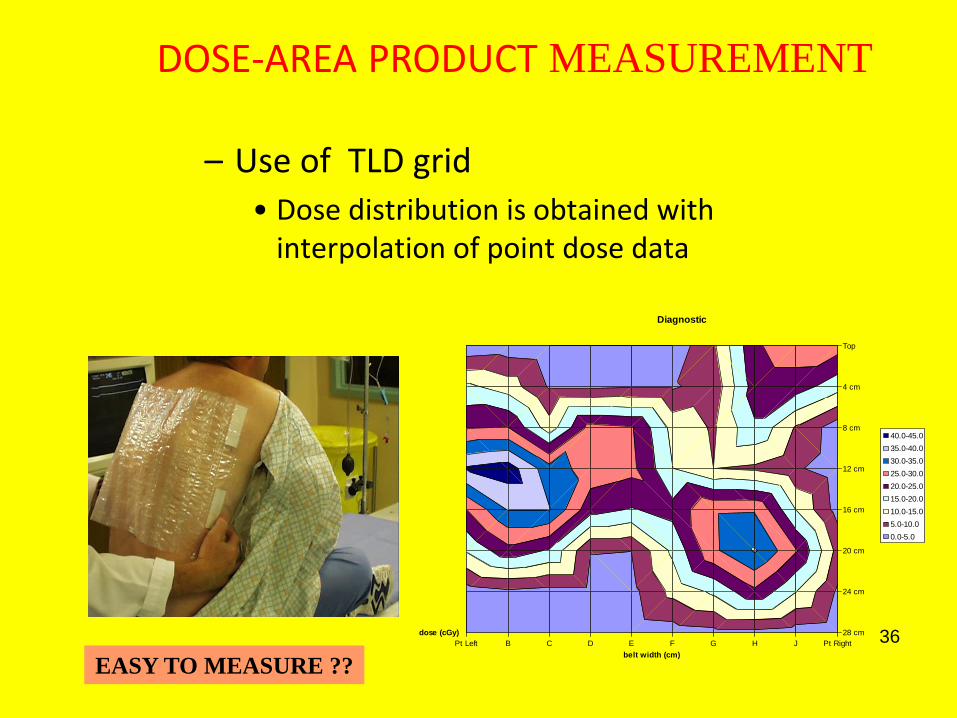
– Use of TLD grid
• Dose distribution is obtained with interpolation of point dose data
Pt Left B C D E F G H J Pt Right
Top
4 cm
8 cm
12 cm
16 cm
20 cm
24 cm
28 cmdose (cGy)
belt width (cm)
Diagnostic
40.0-45.0
35.0-40.0
30.0-35.0
25.0-30.0
20.0-25.0
15.0-20.0
10.0-15.0
5.0-10.0
0.0-5.0
DOSE-AREA PRODUCT MEASUREMENT
EASY TO MEASURE ??
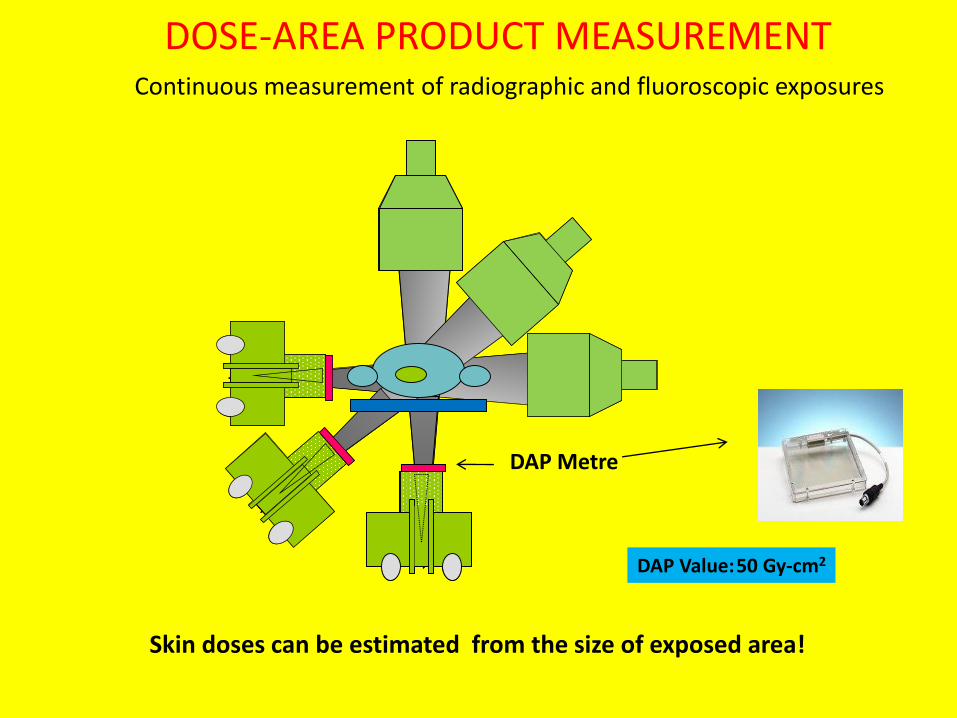
DOSE-AREA PRODUCT MEASUREMENTContinuous measurement of radiographic and fluoroscopic exposures
DAP Metre
Skin doses can be estimated from the size of exposed area!
DAP Value:50 Gy-cm2
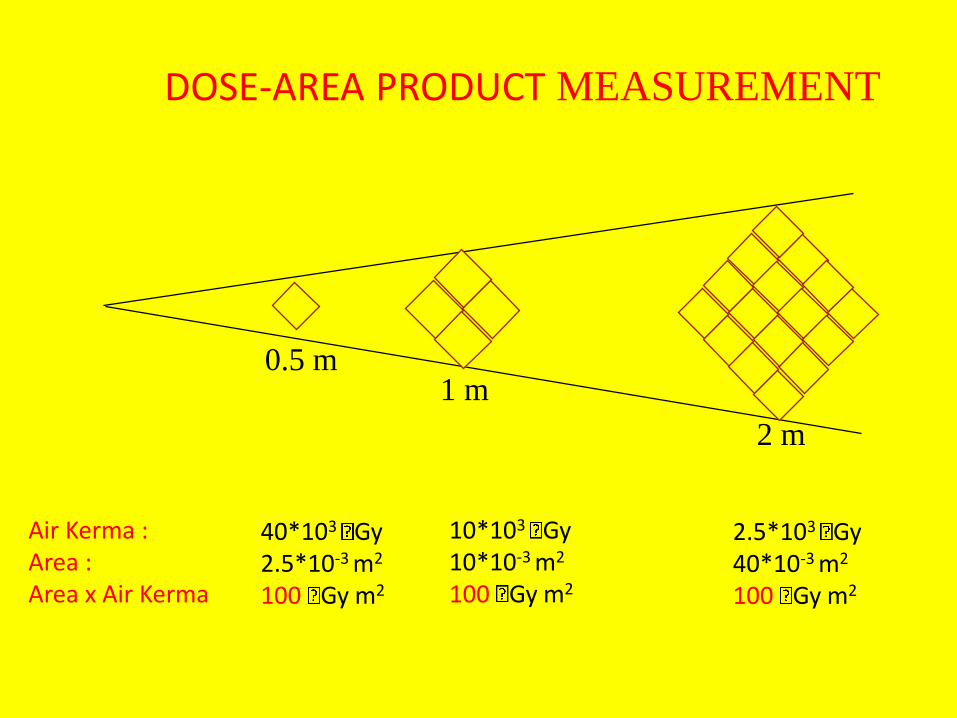
0.5 m1 m
2 m
Air Kerma :Area :Area x Air Kerma
40*103 Gy2.5*10-3 m2
100 Gy m2
10*103 Gy10*10-3 m2
100 Gy m2
2.5*103 Gy40*10-3 m2
100 Gy m2
DOSE-AREA PRODUCT MEASUREMENT
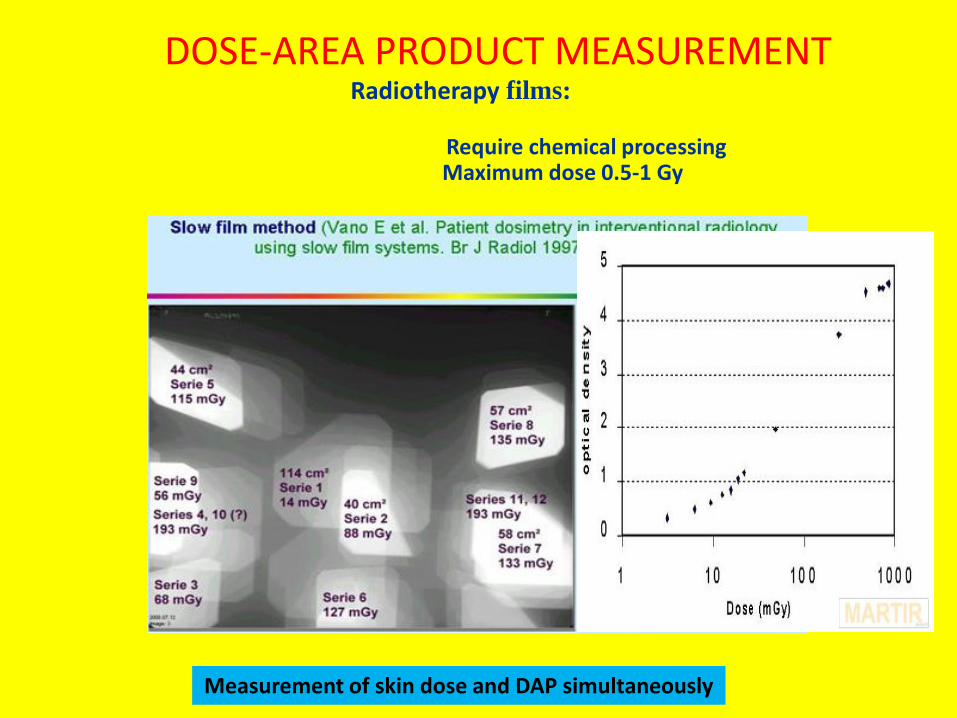
Radiotherapy films:
Require chemical processingMaximum dose 0.5-1 Gy
DOSE-AREA PRODUCT MEASUREMENT
Measurement of skin dose and DAP simultaneously
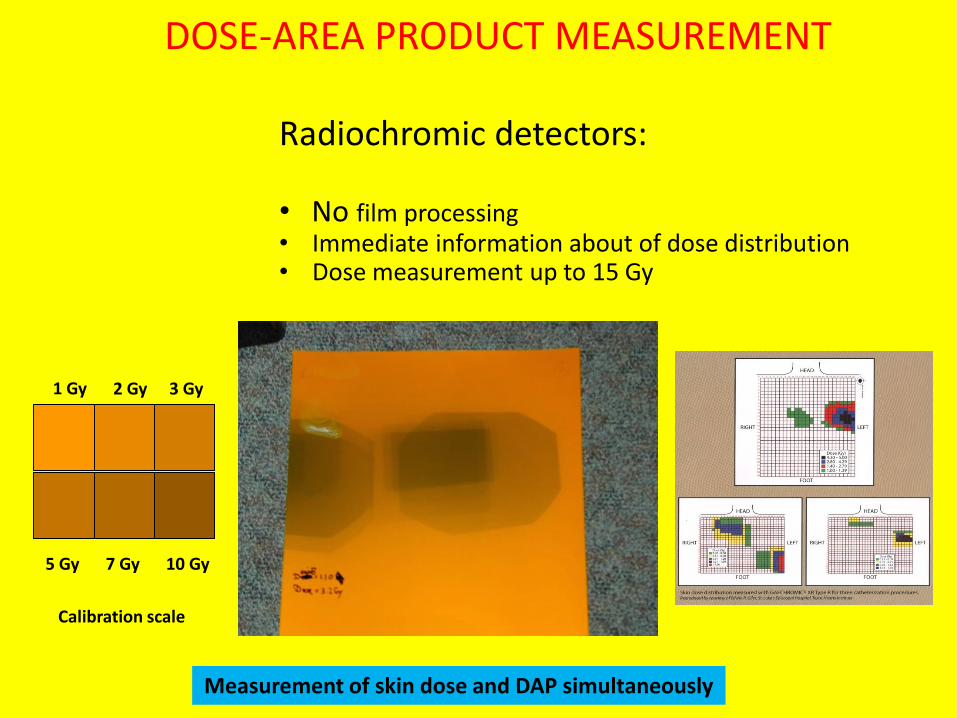
Calibration scale
1 Gy 2 Gy 3 Gy
5 Gy 7 Gy 10 Gy
Radiochromic detectors:
• No film processing• Immediate information about of dose distribution• Dose measurement up to 15 Gy
DOSE-AREA PRODUCT MEASUREMENT
Measurement of skin dose and DAP simultaneously
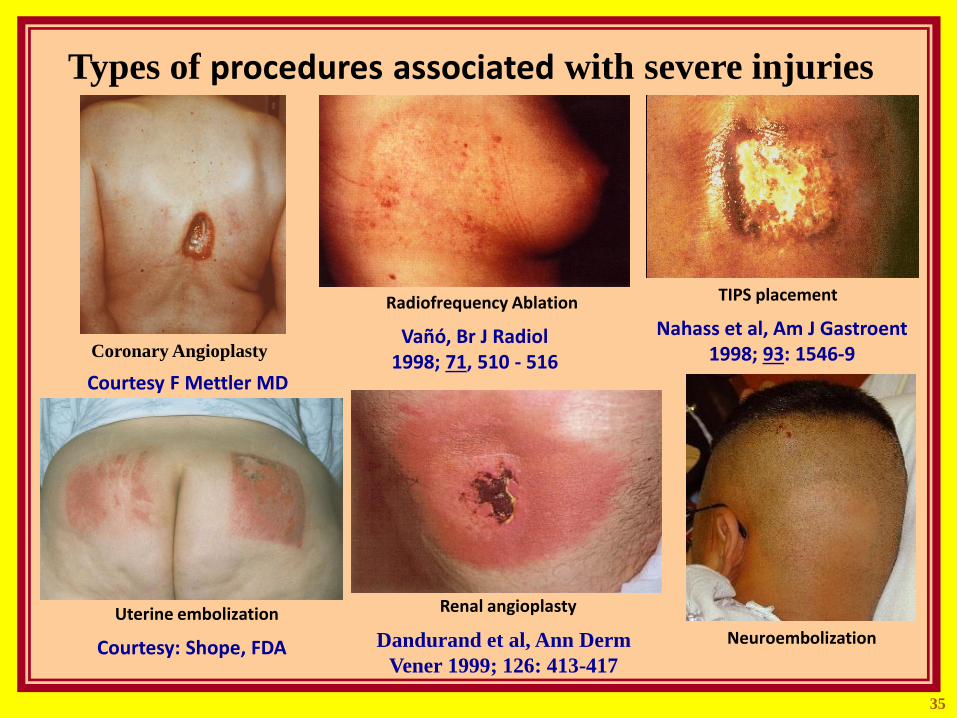
Coronary Angioplasty
TIPS placementRadiofrequency Ablation
Neuroembolization
Uterine embolization Renal angioplasty
Types of procedures associated with severe injuries
Courtesy: Shope, FDA
Vañó, Br J Radiol 1998; 71, 510 - 516
Nahass et al, Am J Gastroent1998; 93: 1546-9
Dandurand et al, Ann Derm
Vener 1999; 126: 413-417
Courtesy F Mettler MD
35
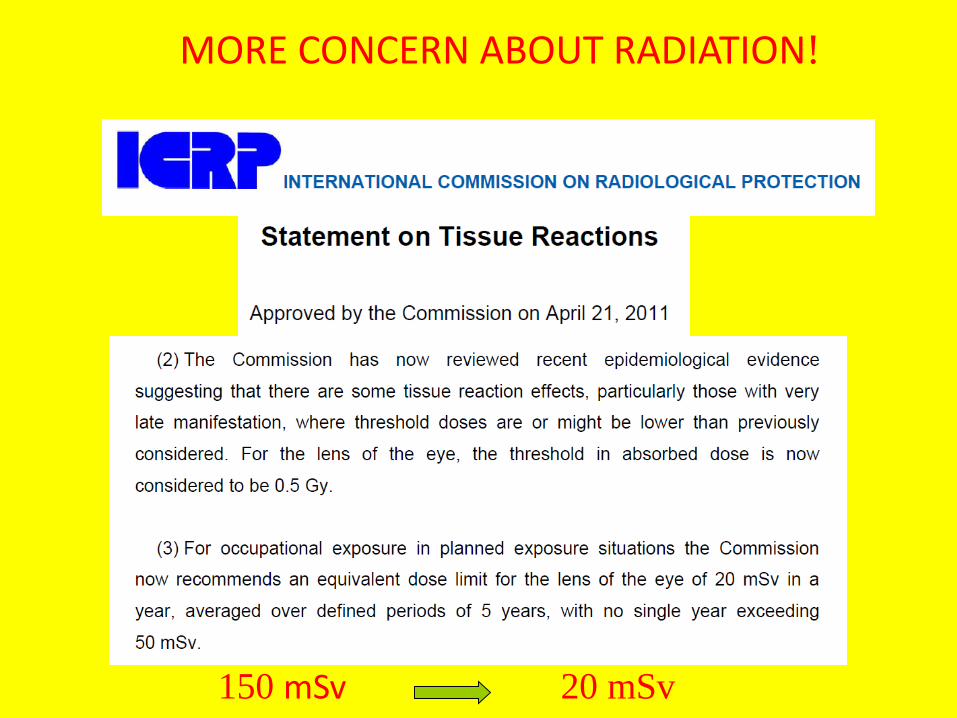
150 mSv 20 mSv
MORE CONCERN ABOUT RADIATION!
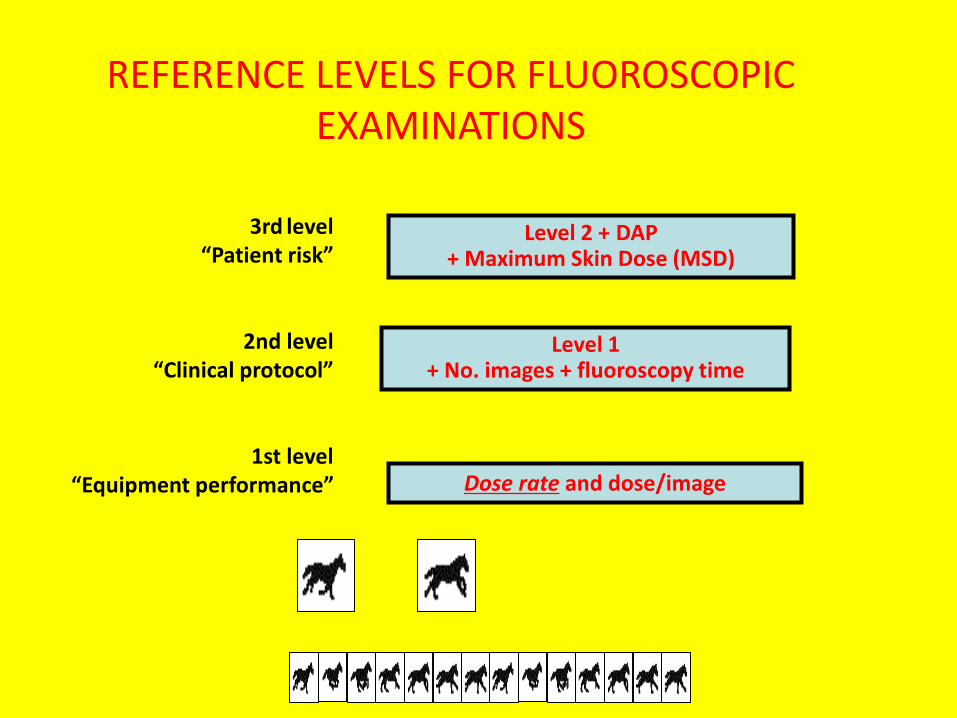
REFERENCE LEVELS FOR FLUOROSCOPIC EXAMINATIONS
3rd level “Patient risk”
2nd level “Clinical protocol”
1st level“Equipment performance” Dose rate and dose/image
Level 1 + No. images + fluoroscopy time
Level 2 + DAP+ Maximum Skin Dose (MSD)
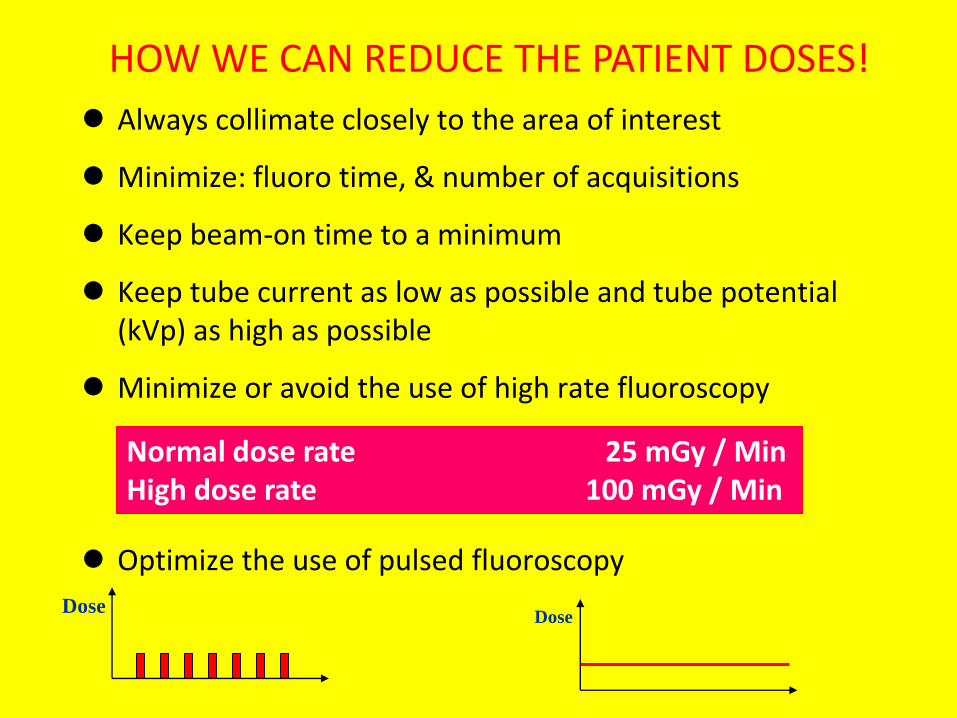
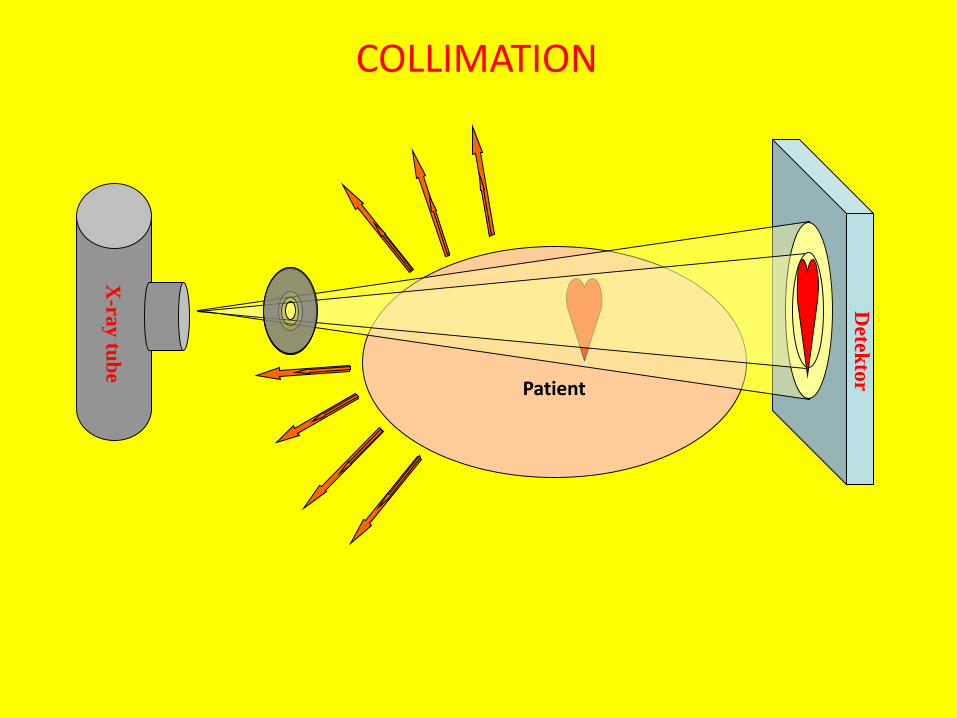
Always collimate closely to the area of interest
Minimize: fluoro time, & number of acquisitions
Keep beam-on time to a minimum
Keep tube current as low as possible and tube potential (kVp) as high as possible
Minimize or avoid the use of high rate fluoroscopy
Optimize the use of pulsed fluoroscopy
Normal dose rate 25 mGy / MinHigh dose rate 100 mGy / Min
DoseDose
HOW WE CAN REDUCE THE PATIENT DOSES!
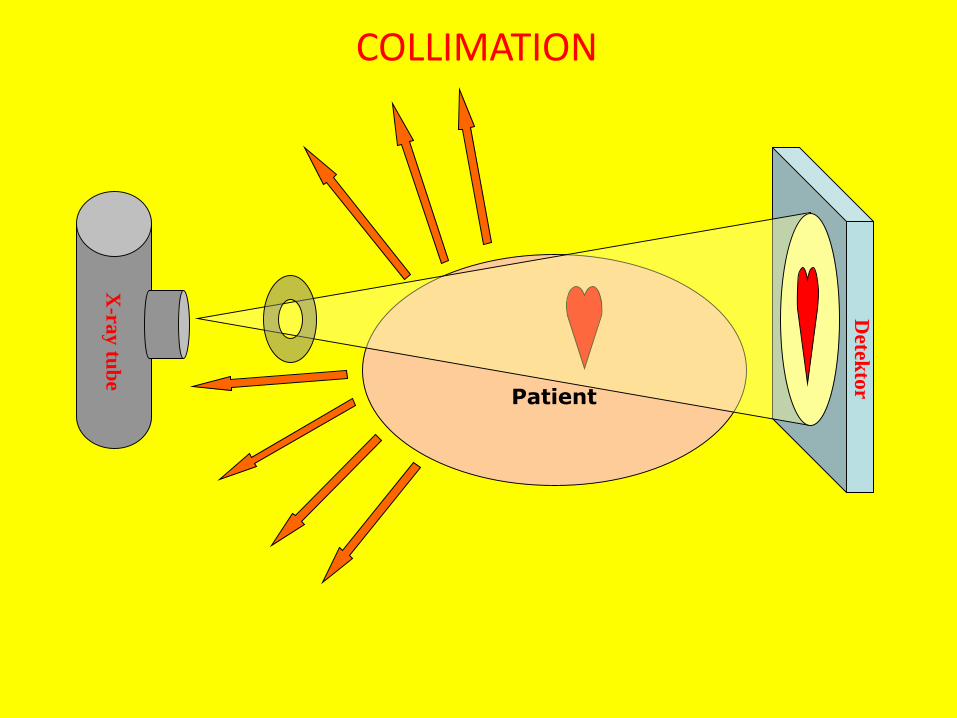
Detek
tor
X-ra
y tu
be
Patient
COLLIMATION
Detek
tor
X-ra
y tu
be
Patient
COLLIMATION
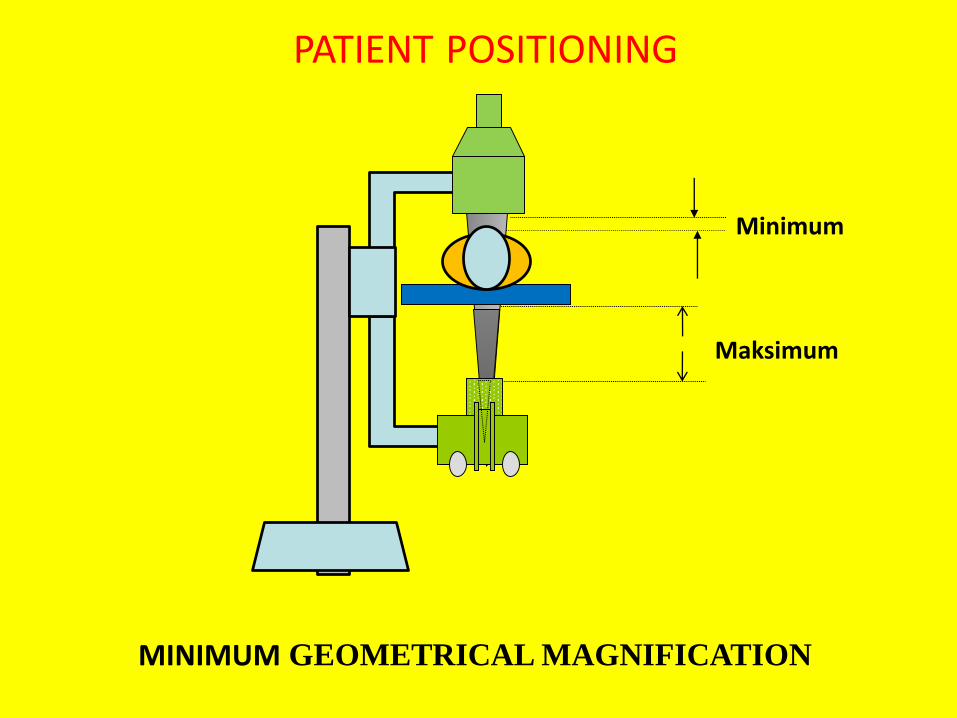
PATIENT POSITIONING
Minimum
Maksimum
MINIMUM GEOMETRICAL MAGNIFICATION
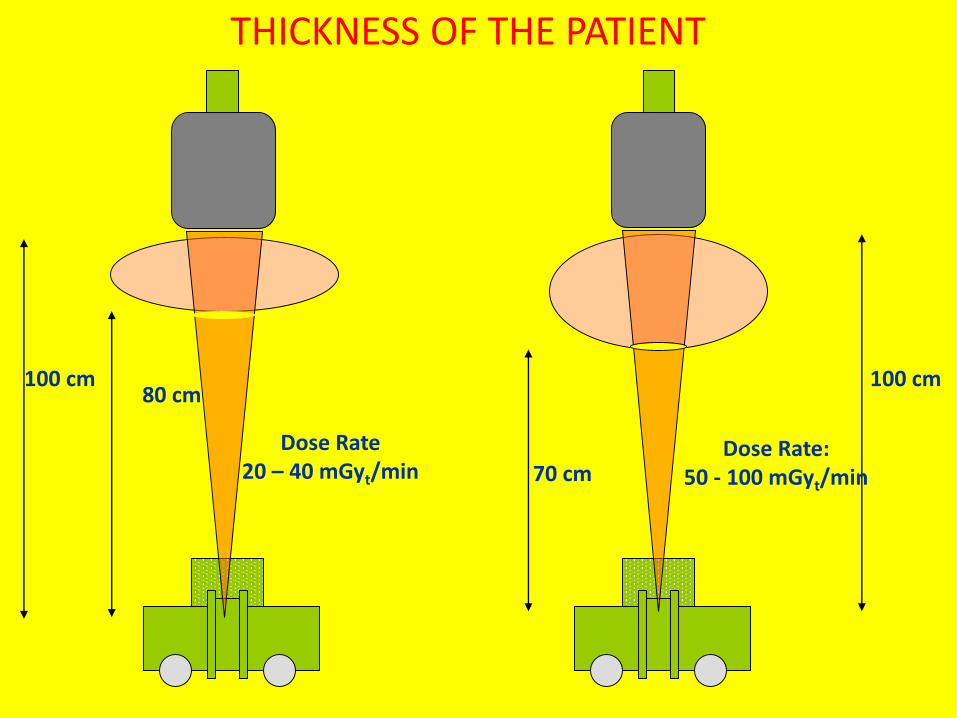
80 cm
Dose Rate20 – 40 mGyt/min 70 cm
100 cm
Dose Rate: 50 - 100 mGyt/min
THICKNESS OF THE PATIENT
100 cm
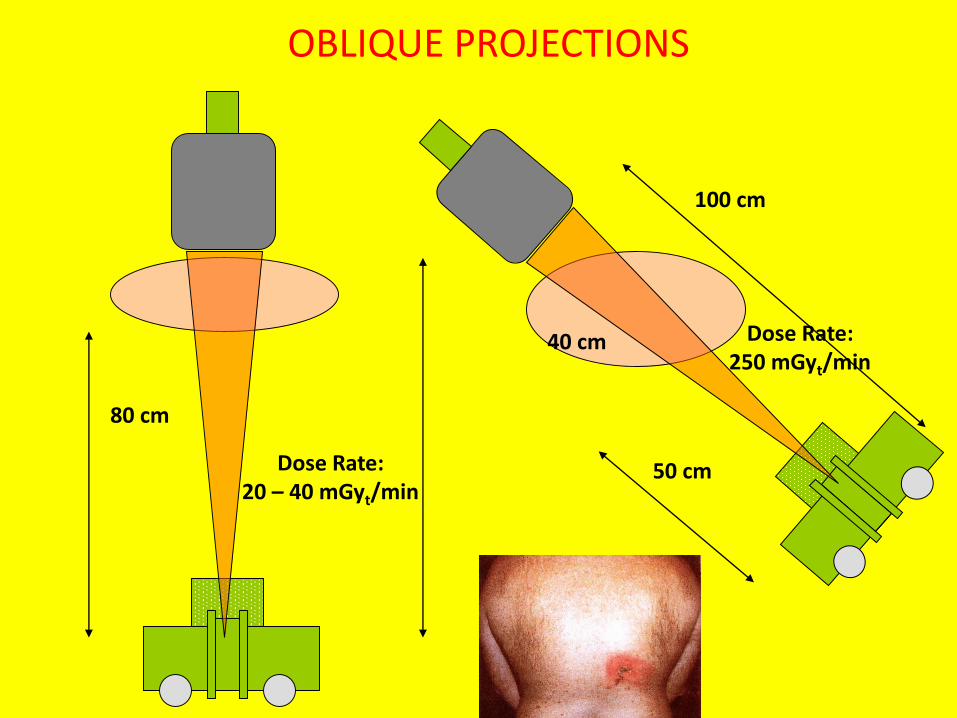
80 cm
Dose Rate: 20 – 40 mGyt/min
50 cm
100 cm
Dose Rate: 250 mGyt/min
KALIN OBLİK – İNCE PA GEOMETRİ
40 cm
OBLIQUE PROJECTIONS
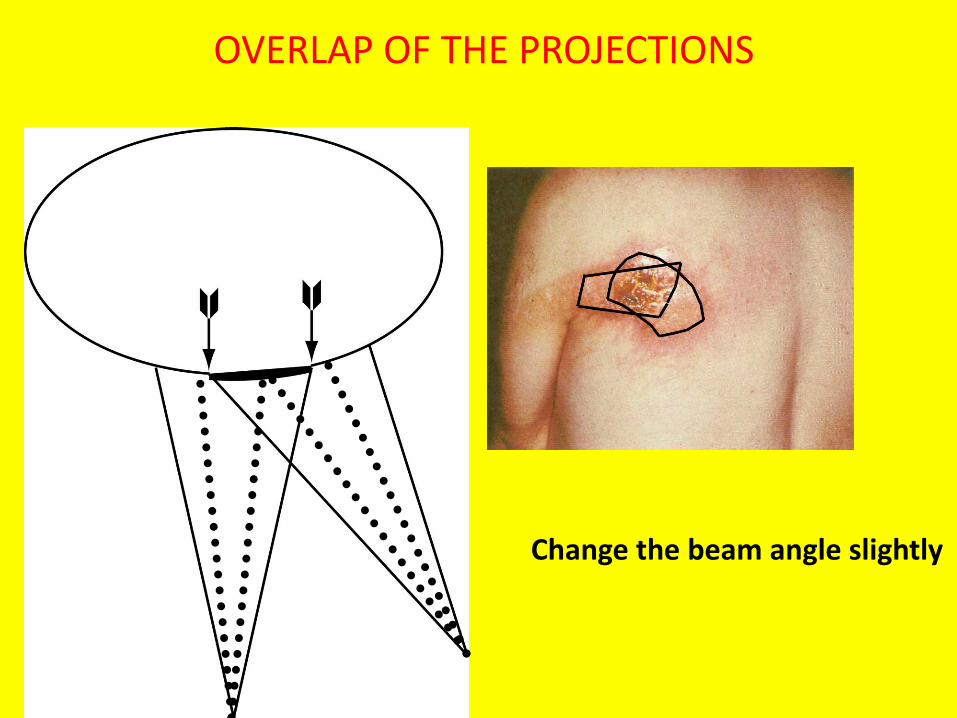
OVERLAP OF THE PROJECTIONS
Change the beam angle slightly
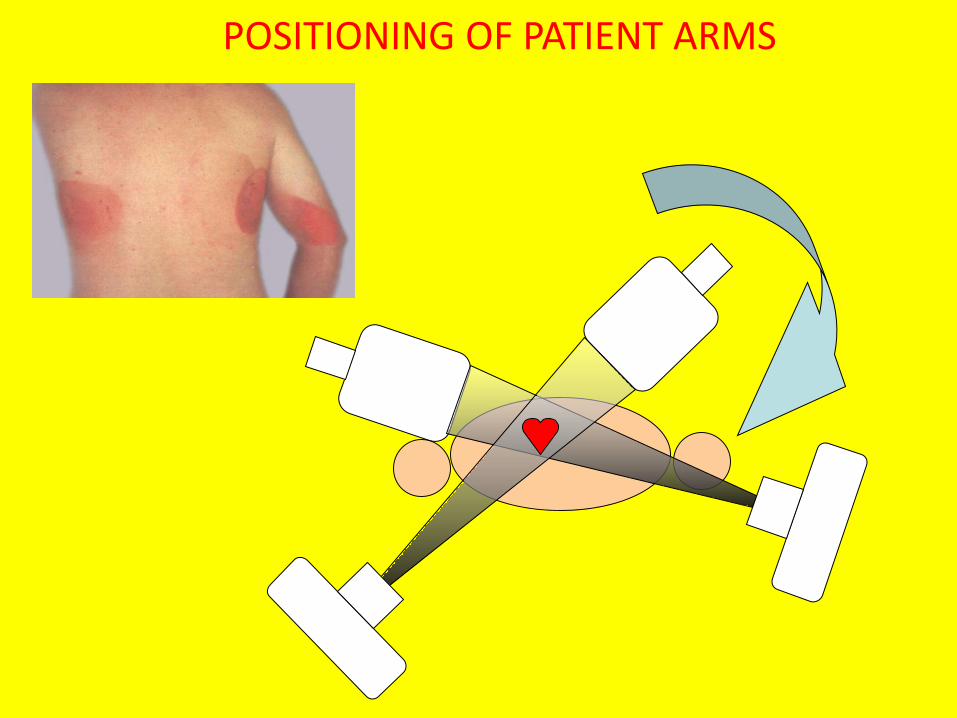
POSITIONING OF PATIENT ARMS
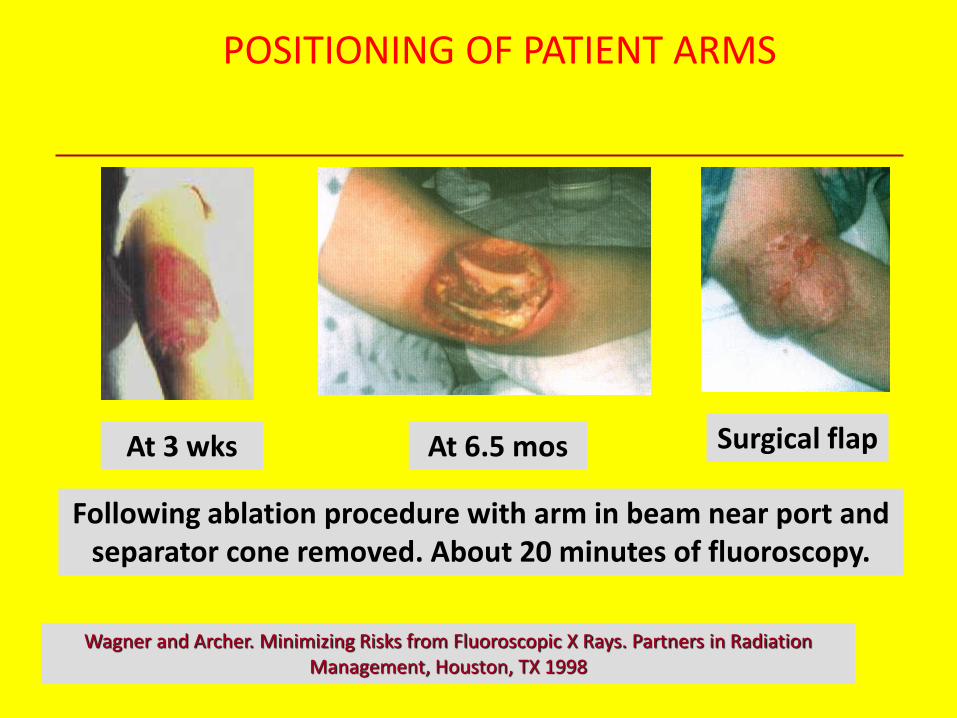
Wagner and Archer. Minimizing Risks from Fluoroscopic X Rays. Partners in Radiation Management, Houston, TX 1998
At 3 wks At 6.5 mos Surgical flap
Following ablation procedure with arm in beam near port and separator cone removed. About 20 minutes of fluoroscopy.
POSITIONING OF PATIENT ARMS

USE OF GRIDS !!
Patient dose increase up to 2-6 times !!
Remove for pediatric patients
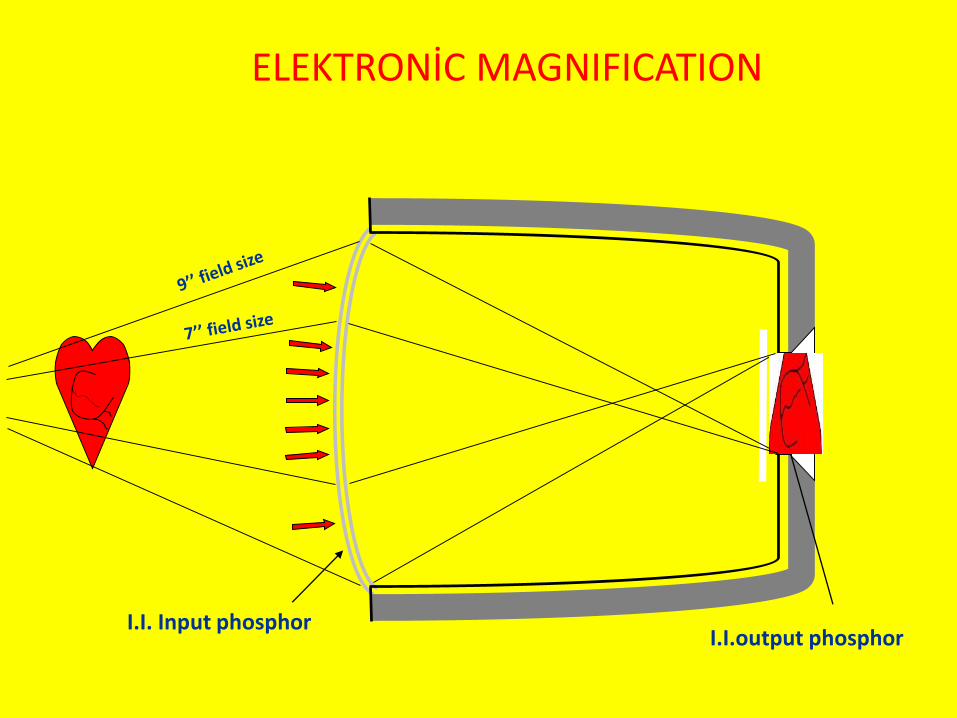
ELEKTRONİC MAGNIFICATION
I.I. Input phosphorI.I.output phosphor
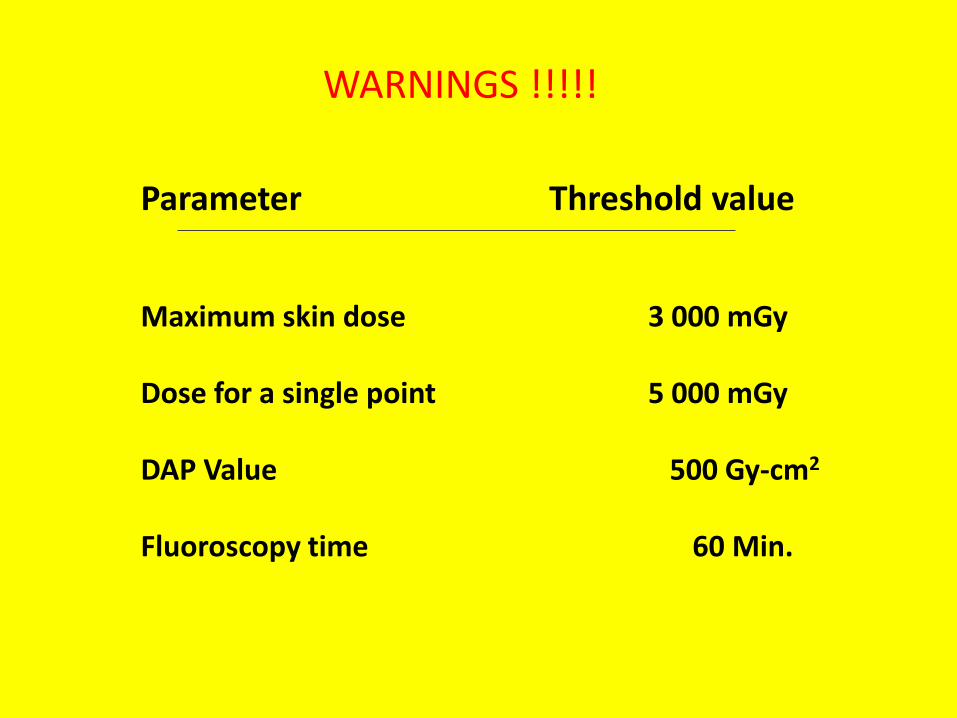
Parameter Threshold value
Maximum skin dose 3 000 mGy
Dose for a single point 5 000 mGy
DAP Value 500 Gy-cm2
Fluoroscopy time 60 Min.
WARNINGS !!!!!
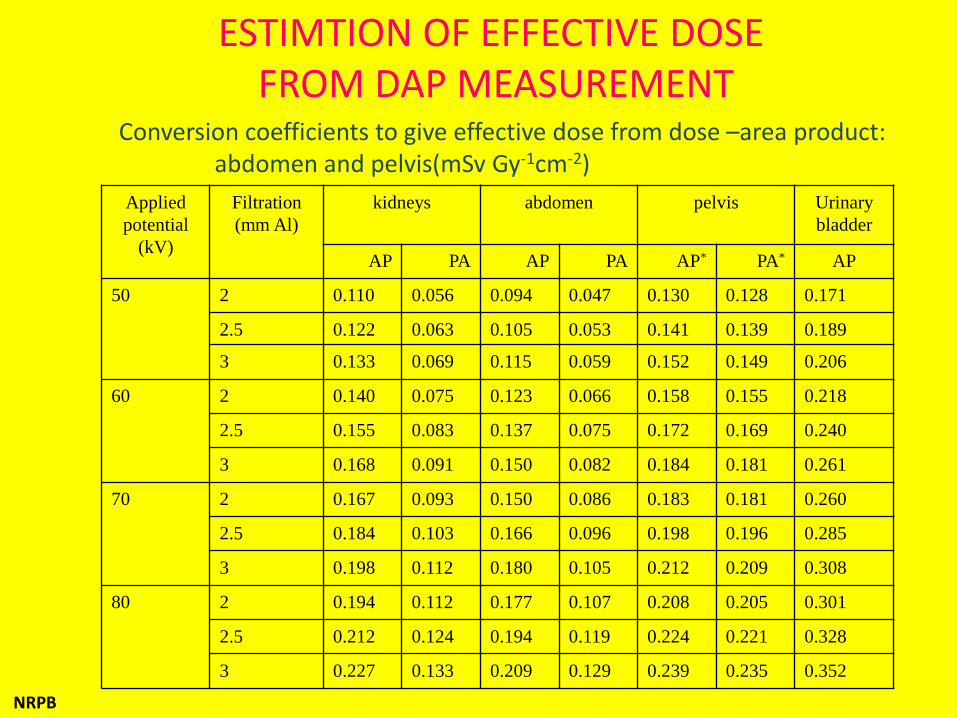
ESTIMTION OF EFFECTIVE DOSEFROM DAP MEASUREMENT
Conversion coefficients to give effective dose from dose –area product: abdomen and pelvis(mSv Gy-1cm-2)
Applied
potential
(kV)
Filtration
(mm Al)
kidneys abdomen pelvis Urinary
bladder
AP PA AP PA AP* PA* AP
50 2 0.110 0.056 0.094 0.047 0.130 0.128 0.171
2.5 0.122 0.063 0.105 0.053 0.141 0.139 0.189
3 0.133 0.069 0.115 0.059 0.152 0.149 0.206
60 2 0.140 0.075 0.123 0.066 0.158 0.155 0.218
2.5 0.155 0.083 0.137 0.075 0.172 0.169 0.240
3 0.168 0.091 0.150 0.082 0.184 0.181 0.261
70 2 0.167 0.093 0.150 0.086 0.183 0.181 0.260
2.5 0.184 0.103 0.166 0.096 0.198 0.196 0.285
3 0.198 0.112 0.180 0.105 0.212 0.209 0.308
80 2 0.194 0.112 0.177 0.107 0.208 0.205 0.301
2.5 0.212 0.124 0.194 0.119 0.224 0.221 0.328
3 0.227 0.133 0.209 0.129 0.239 0.235 0.352
NRPB
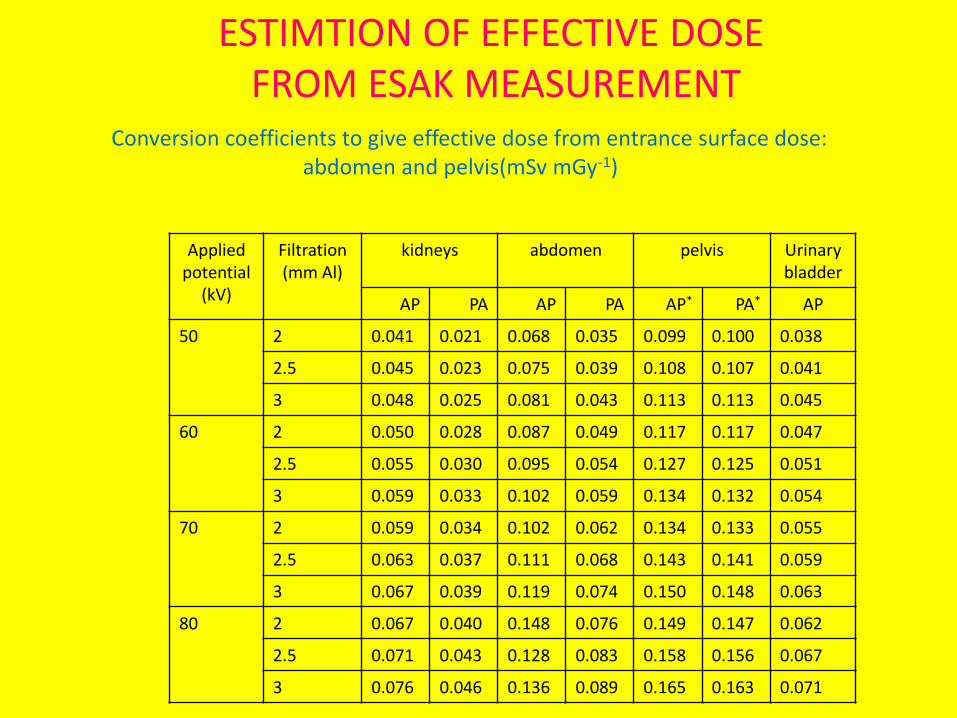
Conversion coefficients to give effective dose from entrance surface dose: abdomen and pelvis(mSv mGy-1)
Appliedpotential
(kV)
Filtration (mm Al)
kidneys abdomen pelvis Urinary bladder
AP PA AP PA AP* PA* AP
50 2 0.041 0.021 0.068 0.035 0.099 0.100 0.038
2.5 0.045 0.023 0.075 0.039 0.108 0.107 0.041
3 0.048 0.025 0.081 0.043 0.113 0.113 0.045
60 2 0.050 0.028 0.087 0.049 0.117 0.117 0.047
2.5 0.055 0.030 0.095 0.054 0.127 0.125 0.051
3 0.059 0.033 0.102 0.059 0.134 0.132 0.054
70 2 0.059 0.034 0.102 0.062 0.134 0.133 0.055
2.5 0.063 0.037 0.111 0.068 0.143 0.141 0.059
3 0.067 0.039 0.119 0.074 0.150 0.148 0.063
80 2 0.067 0.040 0.148 0.076 0.149 0.147 0.062
2.5 0.071 0.043 0.128 0.083 0.158 0.156 0.067
3 0.076 0.046 0.136 0.089 0.165 0.163 0.071
ESTIMTION OF EFFECTIVE DOSEFROM ESAK MEASUREMENT
DOSIMETRY IN MAMMOGRAPHY
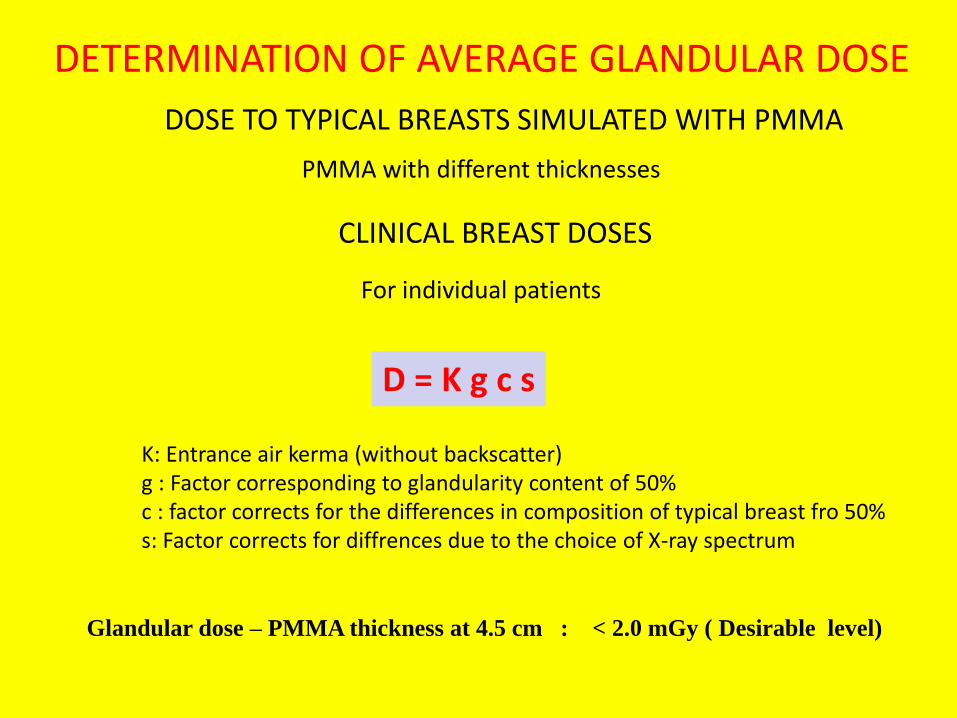
DOSE TO TYPICAL BREASTS SIMULATED WITH PMMA
CLINICAL BREAST DOSES
DETERMINATION OF AVERAGE GLANDULAR DOSE
PMMA with different thicknesses
For individual patients
D = K g c s
K: Entrance air kerma (without backscatter)g : Factor corresponding to glandularity content of 50%c : factor corrects for the differences in composition of typical breast fro 50%s: Factor corrects for diffrences due to the choice of X-ray spectrum
Glandular dose – PMMA thickness at 4.5 cm : < 2.0 mGy ( Desirable level)

DOSIMETRY IN CT
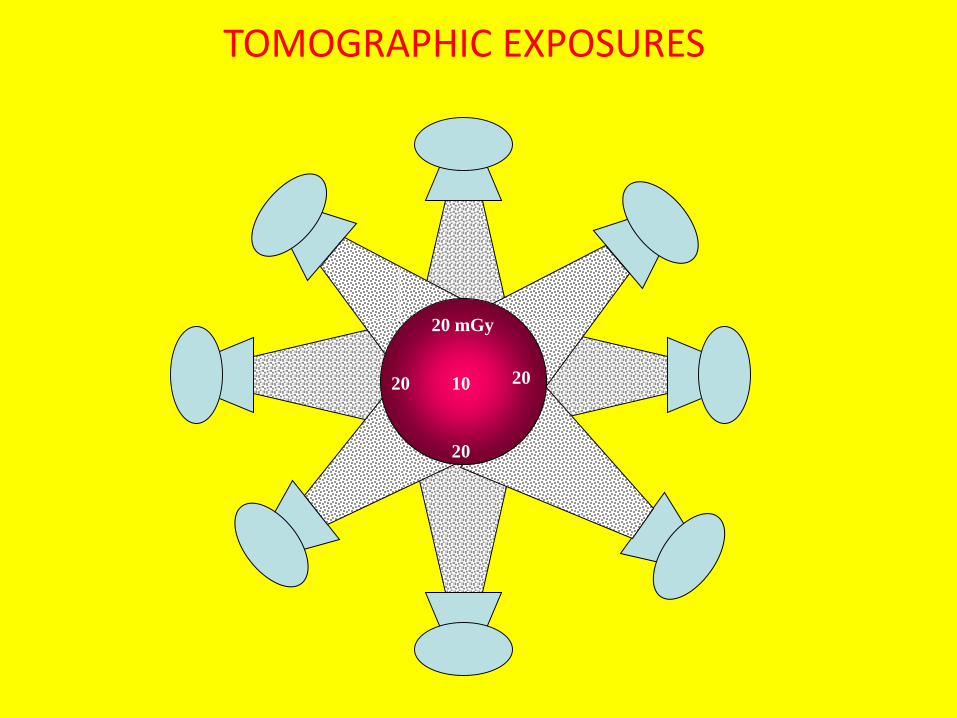
20 mGy
20
2020 10
TOMOGRAPHIC EXPOSURES
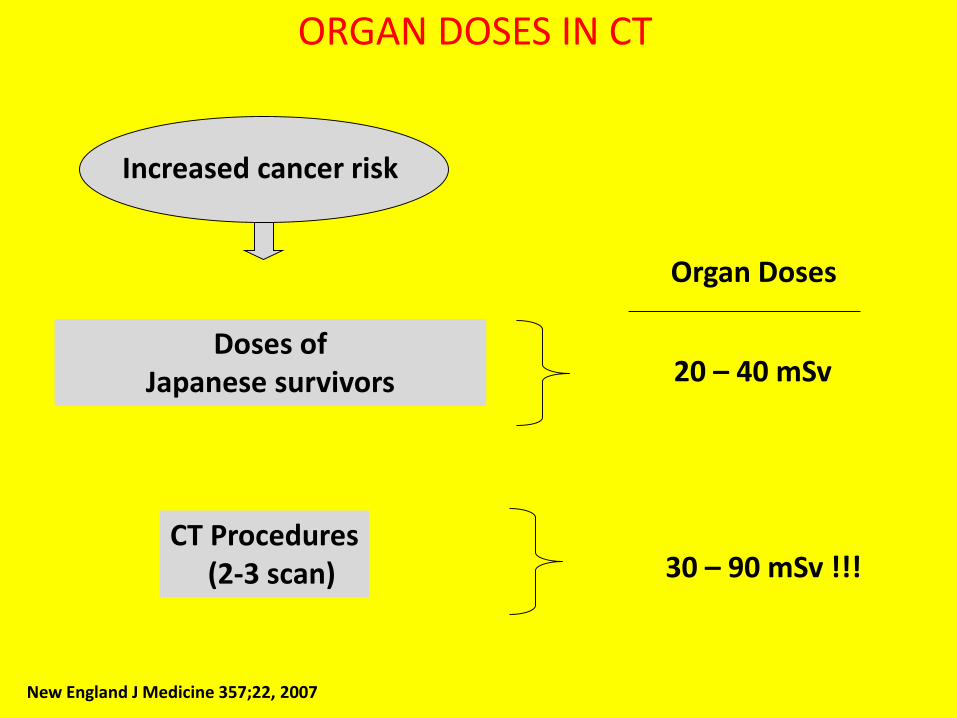
Doses of Japanese survivors
Increased cancer risk
ORGAN DOSES IN CT
Organ Doses
20 – 40 mSv
CT Procedures(2-3 scan) 30 – 90 mSv !!!
New England J Medicine 357;22, 2007
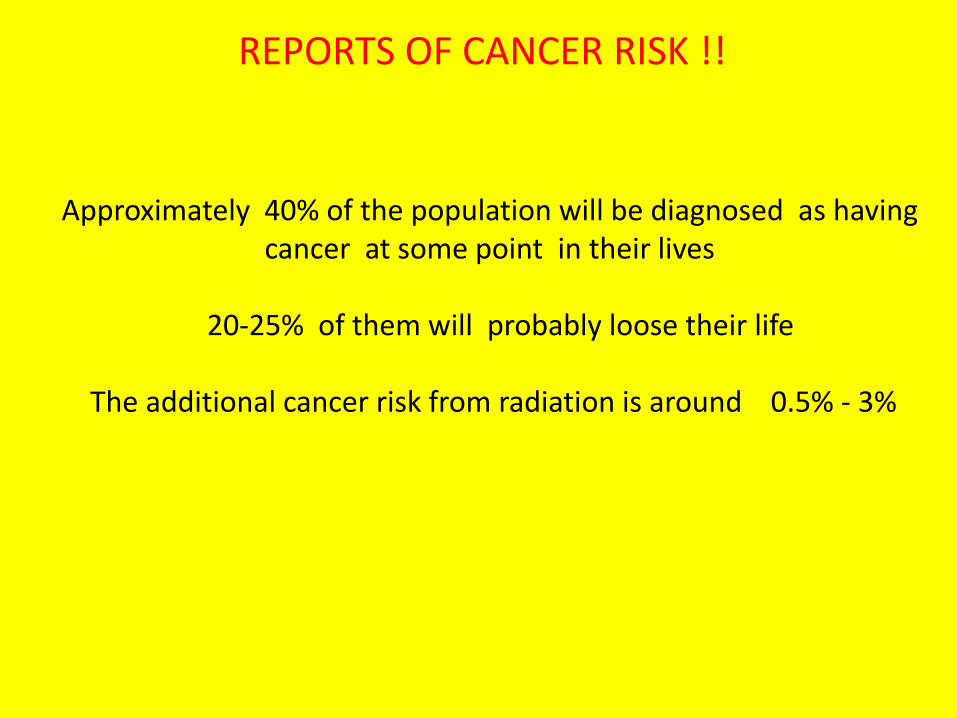
Approximately 40% of the population will be diagnosed as having cancer at some point in their lives
20-25% of them will probably loose their life
The additional cancer risk from radiation is around 0.5% - 3%
REPORTS OF CANCER RISK !!
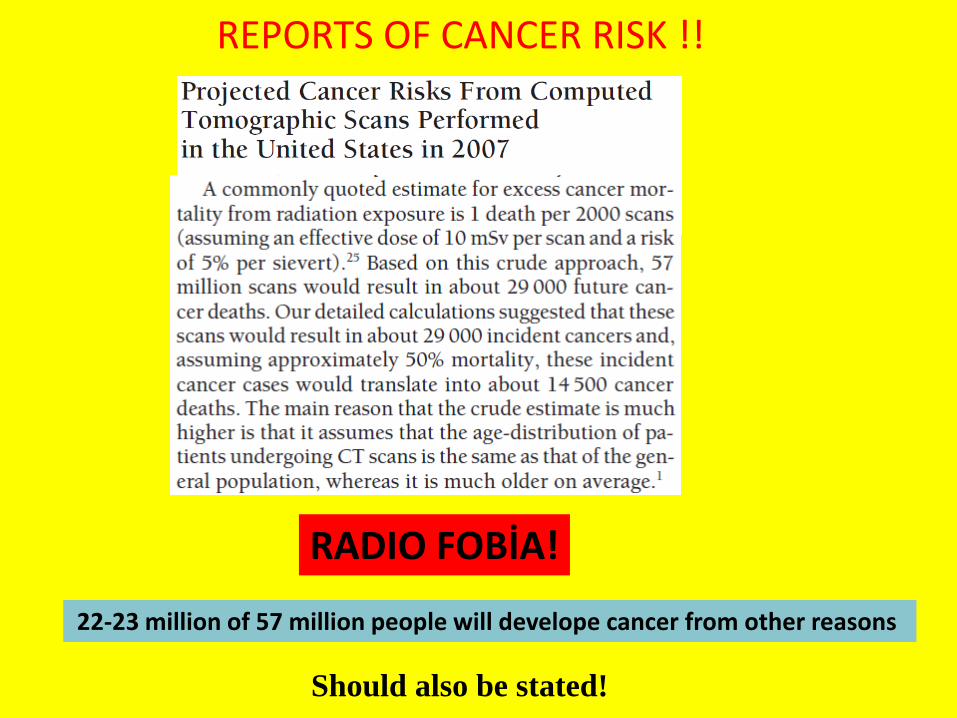
RADIO FOBİA!
22-23 million of 57 million people will develope cancer from other reasons
Should also be stated!
REPORTS OF CANCER RISK !!
PEDIATRIC CT
Unique Considerations for Radiation Exposure in Children
•Children are more sensitive to radiation
•Children have longer life expectancy
•Children received higher dose
Immediate Measures to Minimize CT Radiation Exposure in Children
•Perform only necessary CT exams
•Adjust exposure parameters for pediatric CT based on:Consider child sizeMinimize Region scannedSelect lower kV and mA
•Scan resolution. Be familiar with the dose descriptors, minimize multiple scans
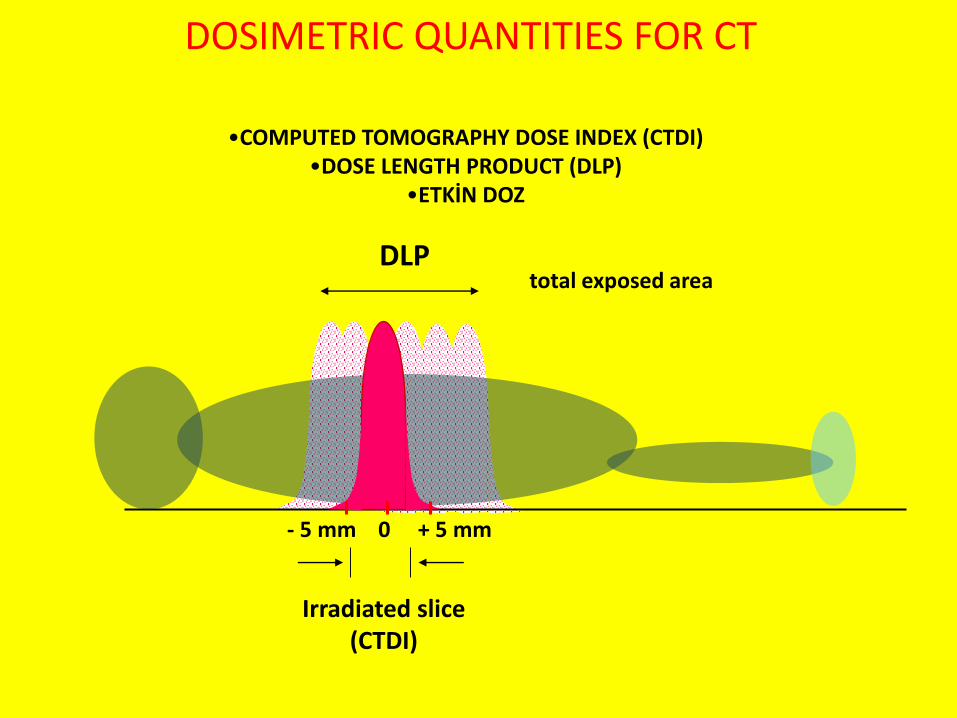
- 5 mm 0 + 5 mm
•COMPUTED TOMOGRAPHY DOSE INDEX (CTDI)•DOSE LENGTH PRODUCT (DLP)
•ETKİN DOZ
DOSIMETRIC QUANTITIES FOR CT
total exposed area
Irradiated slice(CTDI)
DLP
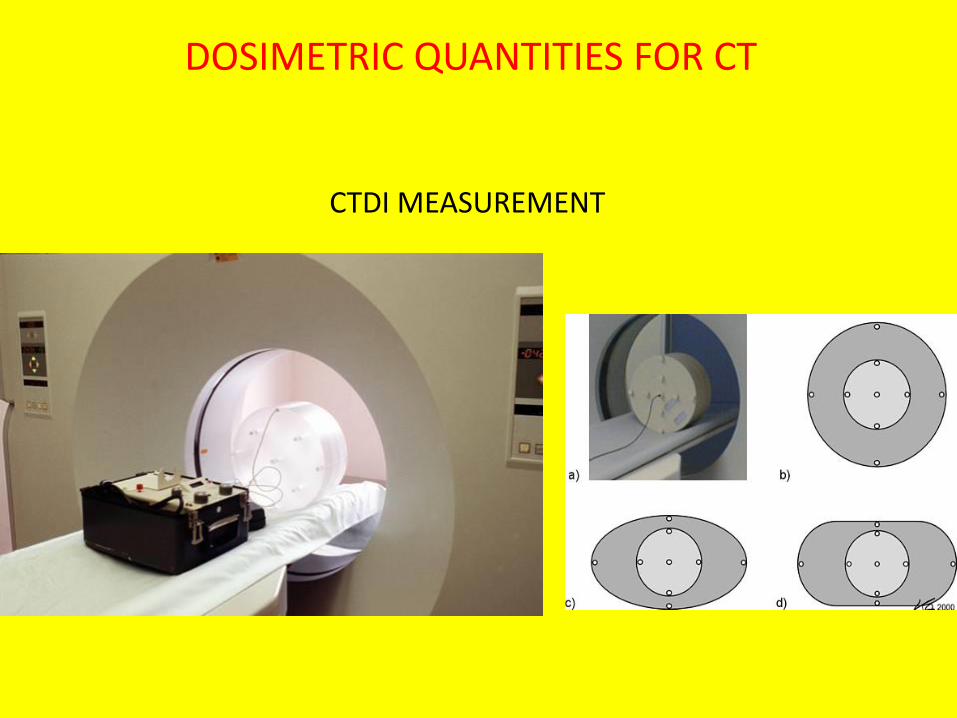
CTDI MEASUREMENT
DOSIMETRIC QUANTITIES FOR CT
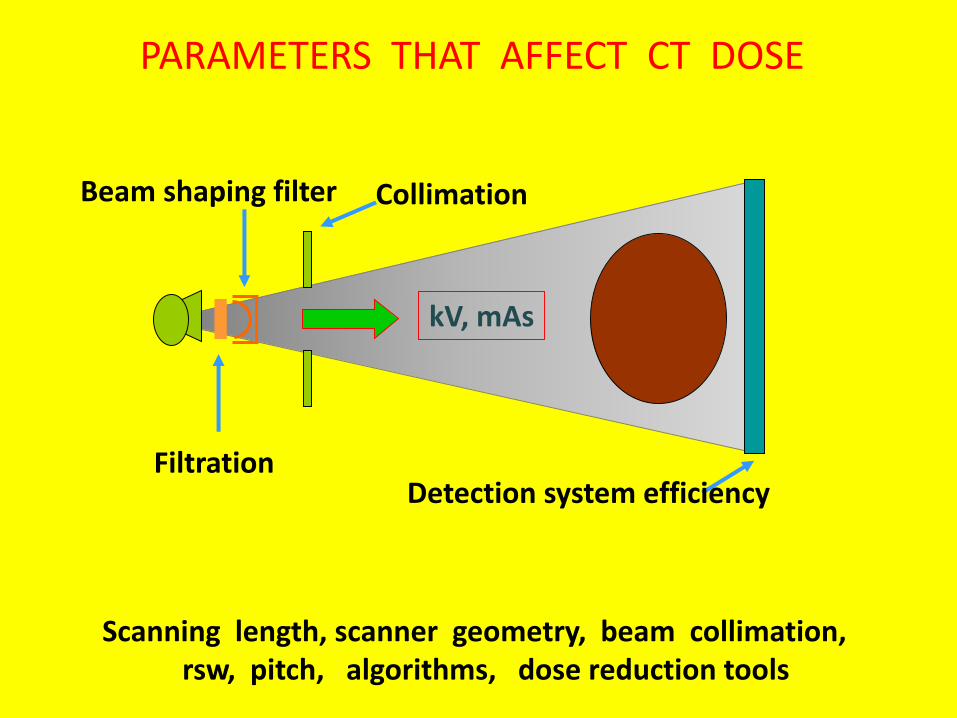
PARAMETERS THAT AFFECT CT DOSE
kV, mAs
Filtration
Beam shaping filter Collimation
Detection system efficiency
Scanning length, scanner geometry, beam collimation, rsw, pitch, algorithms, dose reduction tools
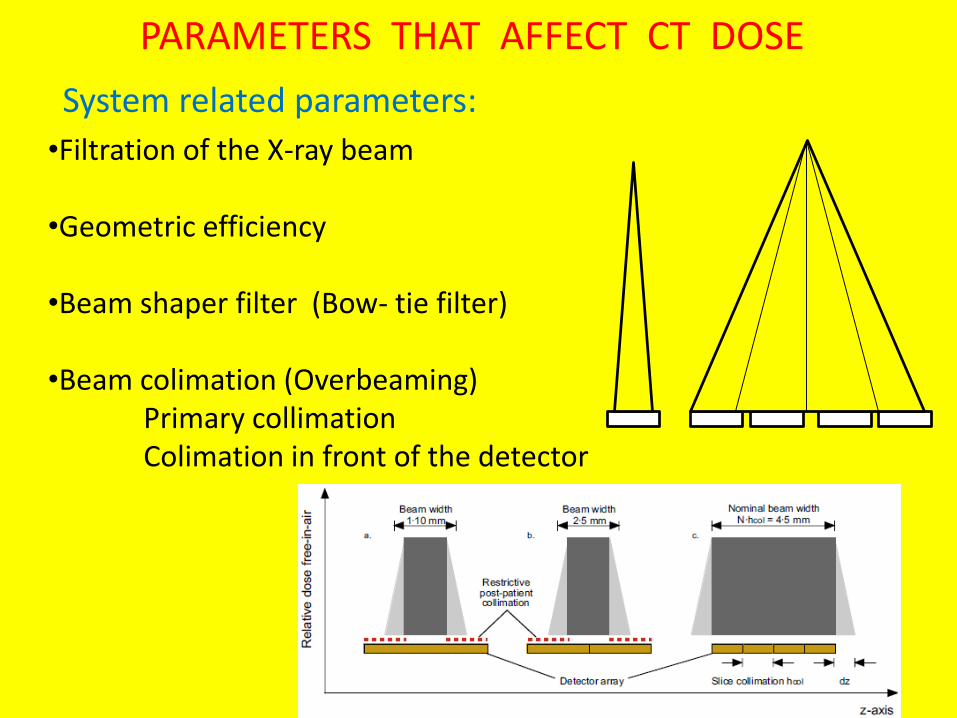
System related parameters:
•Filtration of the X-ray beam
•Geometric efficiency
•Beam shaper filter (Bow- tie filter)
•Beam colimation (Overbeaming)Primary collimationColimation in front of the detector
PARAMETERS THAT AFFECT CT DOSE
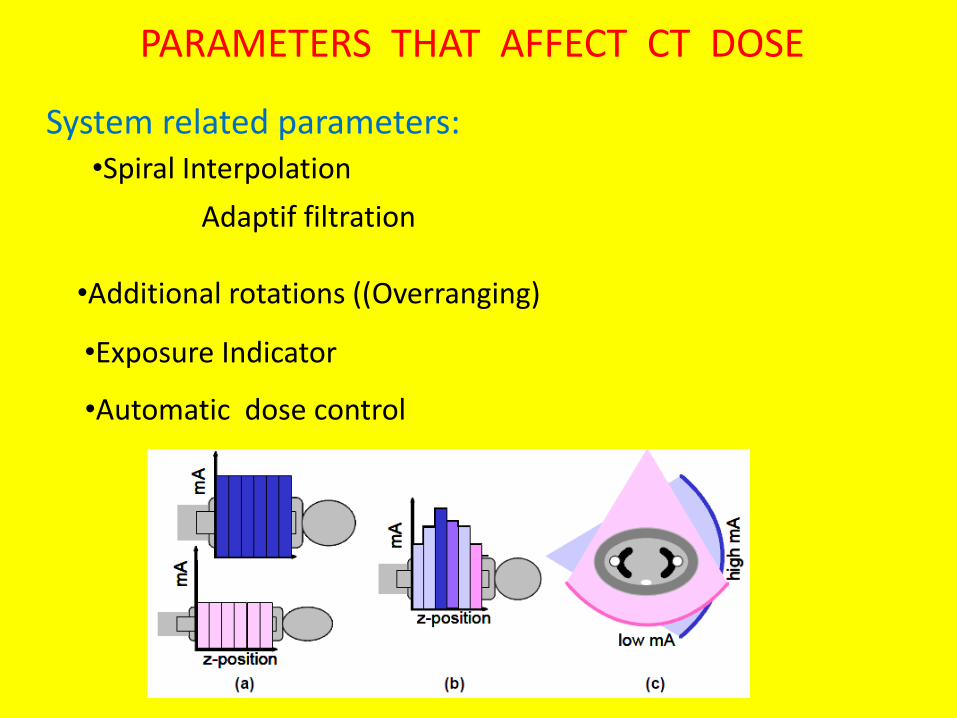
•Spiral Interpolation
Adaptif filtration
•Additional rotations ((Overranging)
•Automatic dose control
•Exposure Indicator
System related parameters:
PARAMETERS THAT AFFECT CT DOSE
Scan and Processing Parameters
•mAs and kVp
•Slice colimation and slice width
•Pitch factor•
•Number of scans
•Number of rotations in dynamic examination
• Reconstruction algorithms and filters
PARAMETERS THAT AFFECT CT DOSE
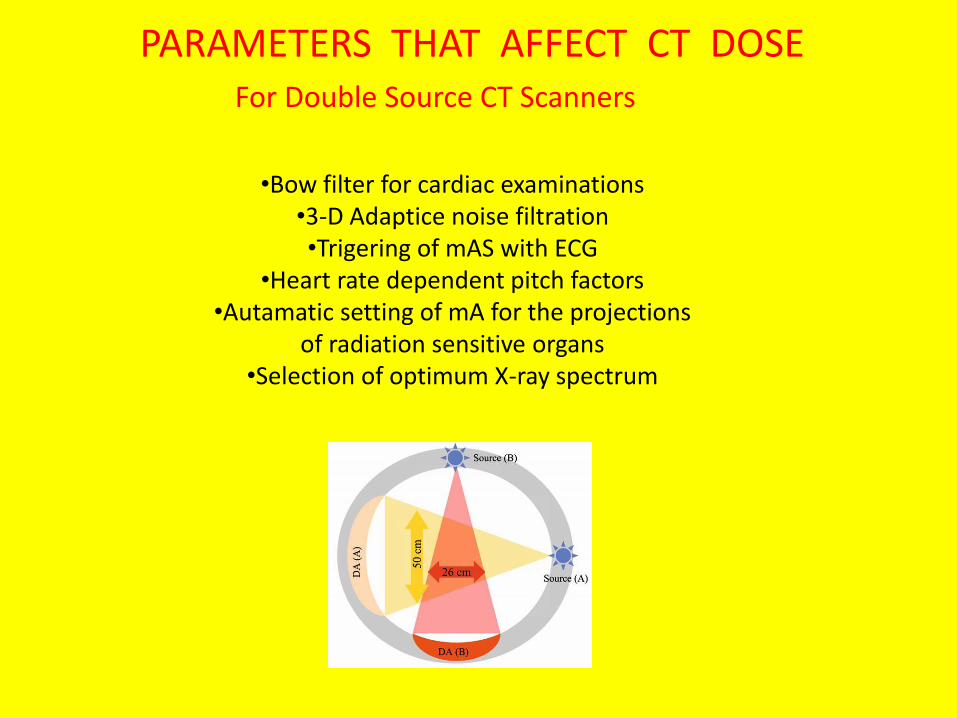
•Bow filter for cardiac examinations•3-D Adaptice noise filtration•Trigering of mAS with ECG
•Heart rate dependent pitch factors•Autamatic setting of mA for the projections
of radiation sensitive organs•Selection of optimum X-ray spectrum
PARAMETERS THAT AFFECT CT DOSE For Double Source CT Scanners
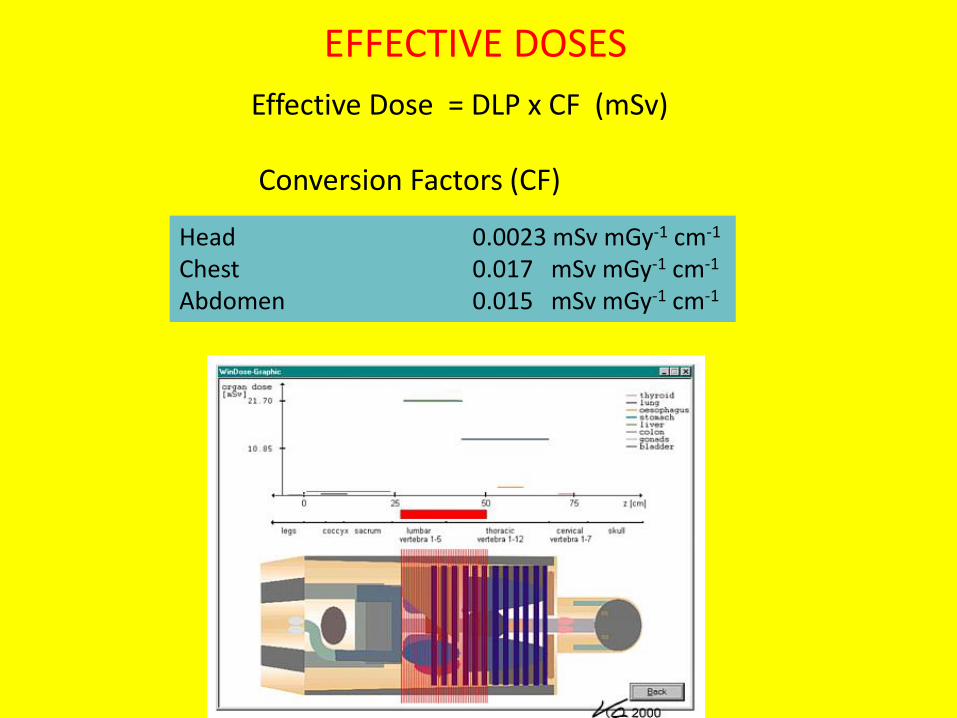
EFFECTIVE DOSES
Effective Dose = DLP x CF (mSv)
Head 0.0023 mSv mGy-1 cm-1
Chest 0.017 mSv mGy-1 cm-1
Abdomen 0.015 mSv mGy-1 cm-1
Conversion Factors (CF)
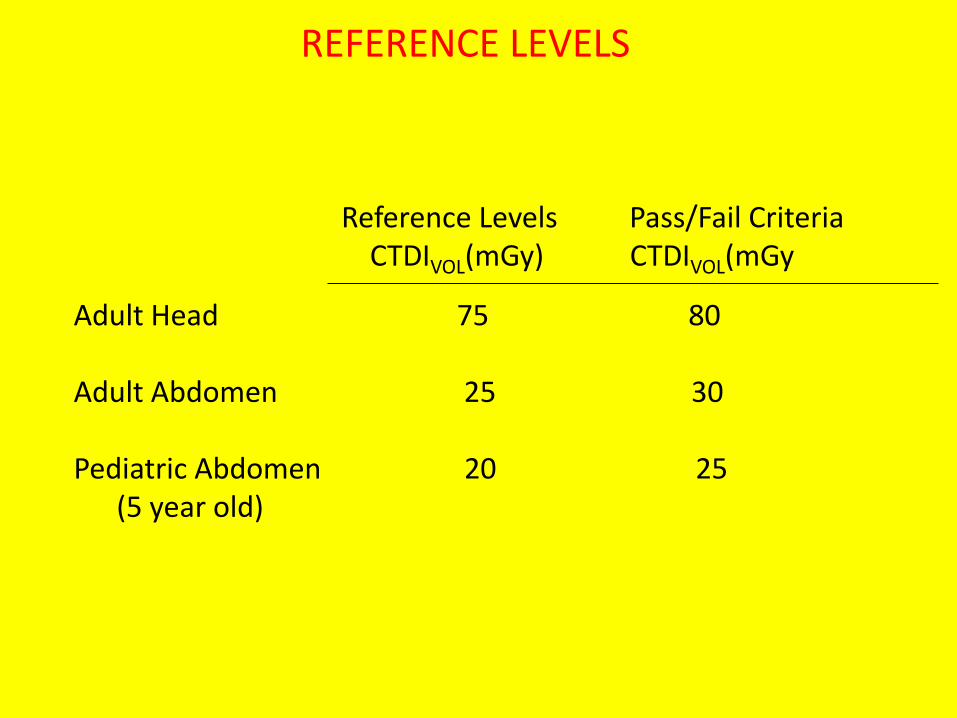
REFERENCE LEVELS
Adult Head 75 80
Adult Abdomen 25 30
Pediatric Abdomen 20 25(5 year old)
Reference Levels Pass/Fail CriteriaCTDIVOL(mGy) CTDIVOL(mGy
DOSIMETRY IN DR and CR SYSTEMS
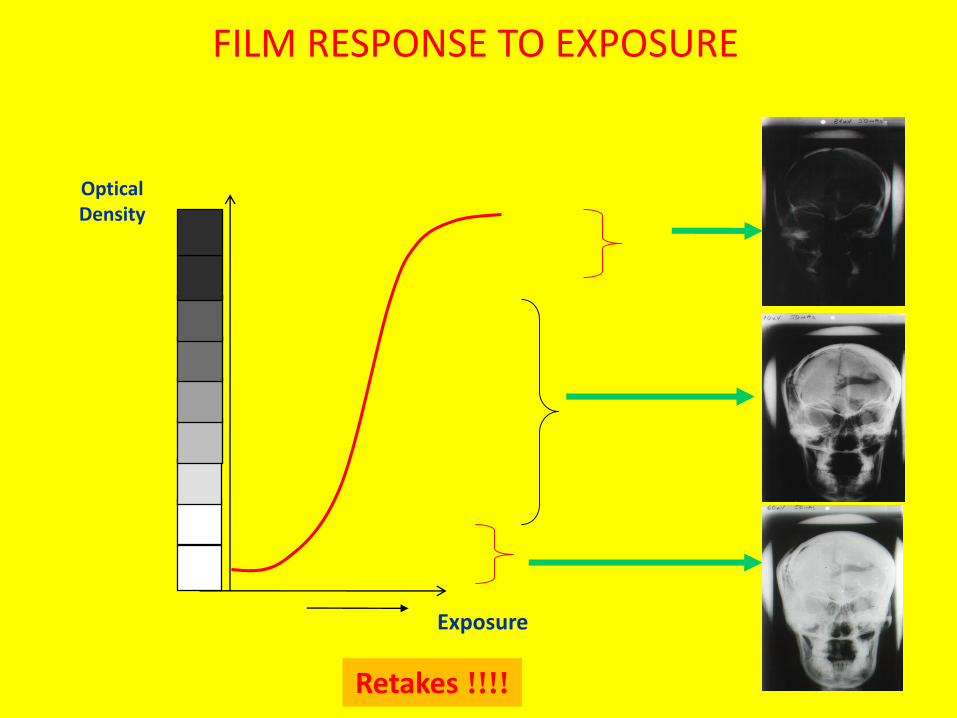
Exposure
OpticalDensity
Retakes !!!!
FILM RESPONSE TO EXPOSURE
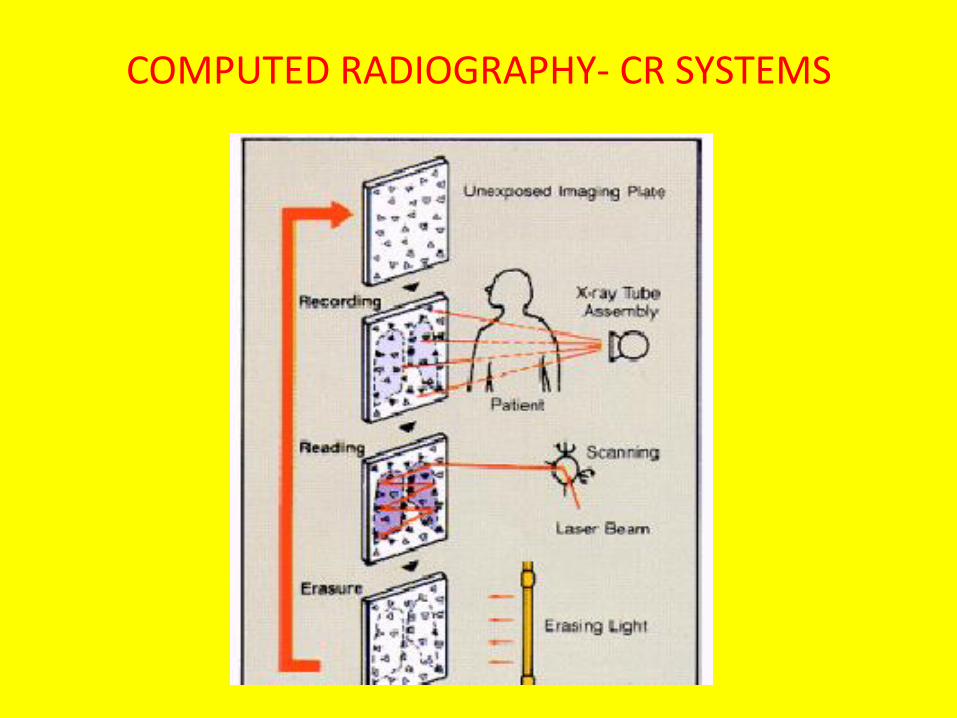
COMPUTED RADIOGRAPHY- CR SYSTEMS
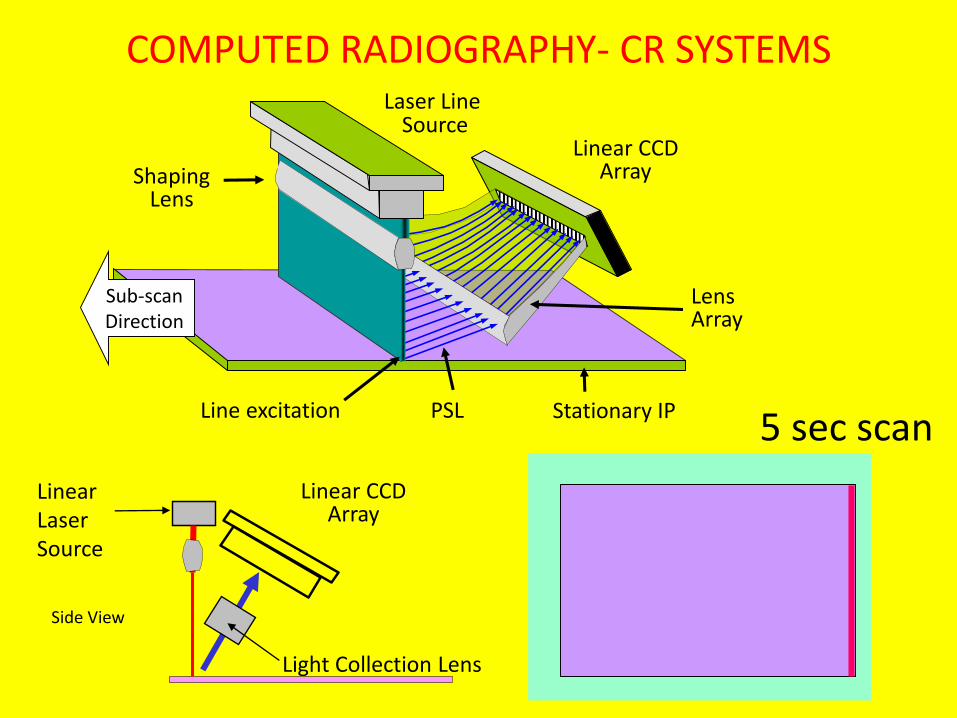
5 sec scan
Laser LineSource
ShapingLens
Linear CCDArray
LensArray
Line excitation PSL
Sub-scanDirection
COMPUTED RADIOGRAPHY- CR SYSTEMS
Side View
Linear Laser Source
Light Collection Lens
Linear CCDArray
Stationary IP
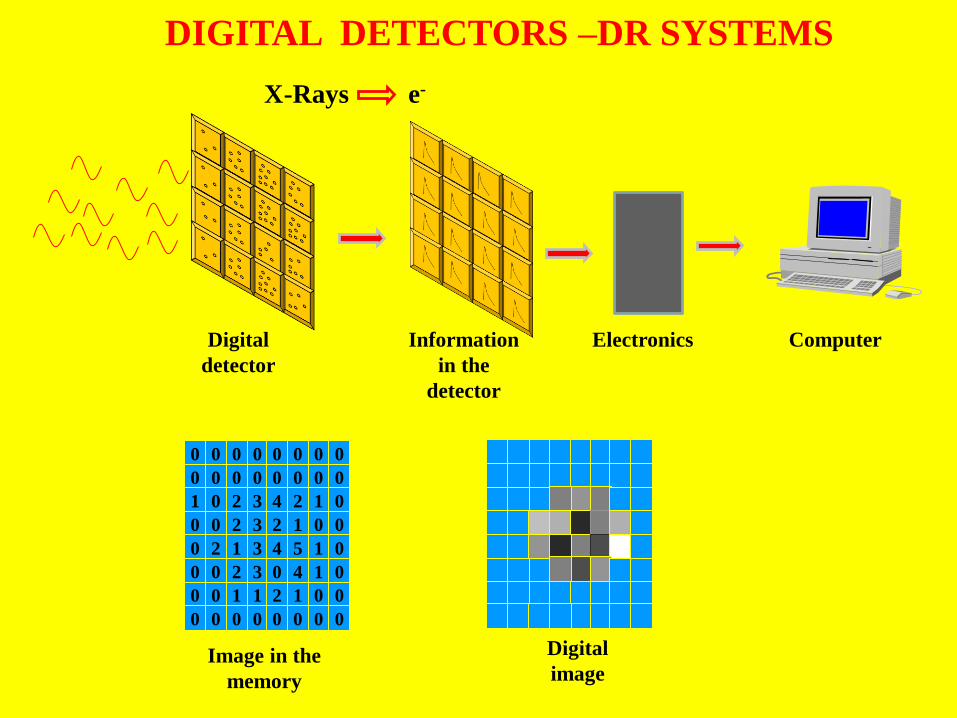
DIGITAL DETECTORS –DR SYSTEMS
X-Rays e-
0 0 0 0 0 0 0 0
0 0 0 0 0 0 0 0
1 0 2 3 4 2 1 0
0 0 2 3 2 1 0 0
0 2 1 3 4 5 1 0
0 0 2 3 0 4 1 0
0 0 1 1 2 1 0 0
0 0 0 0 0 0 0 0
Image in the
memory
Digital
image
Electronics ComputerDigital
detector
Information
in the
detector
Digital
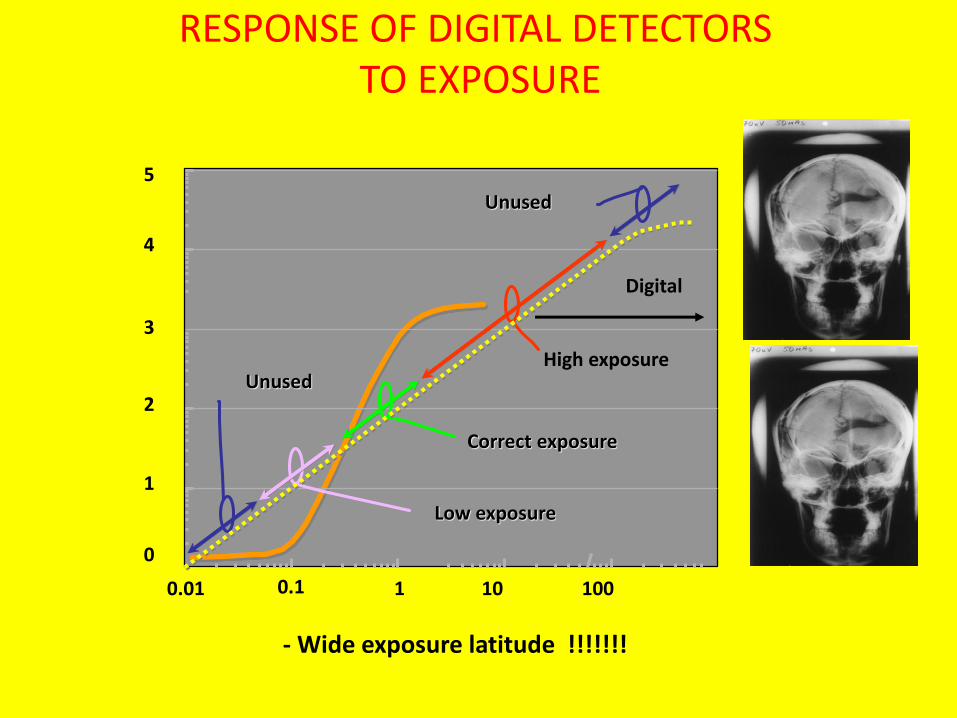
0.01 0.1 1 10 100
0
1
2
3
4
Low exposure
High exposure
Correct exposure
Unused
5
Unused
- Wide exposure latitude !!!!!!!
DİGİTAL RADYOLOJİRESPONSE OF DIGITAL DETECTORSTO EXPOSURE
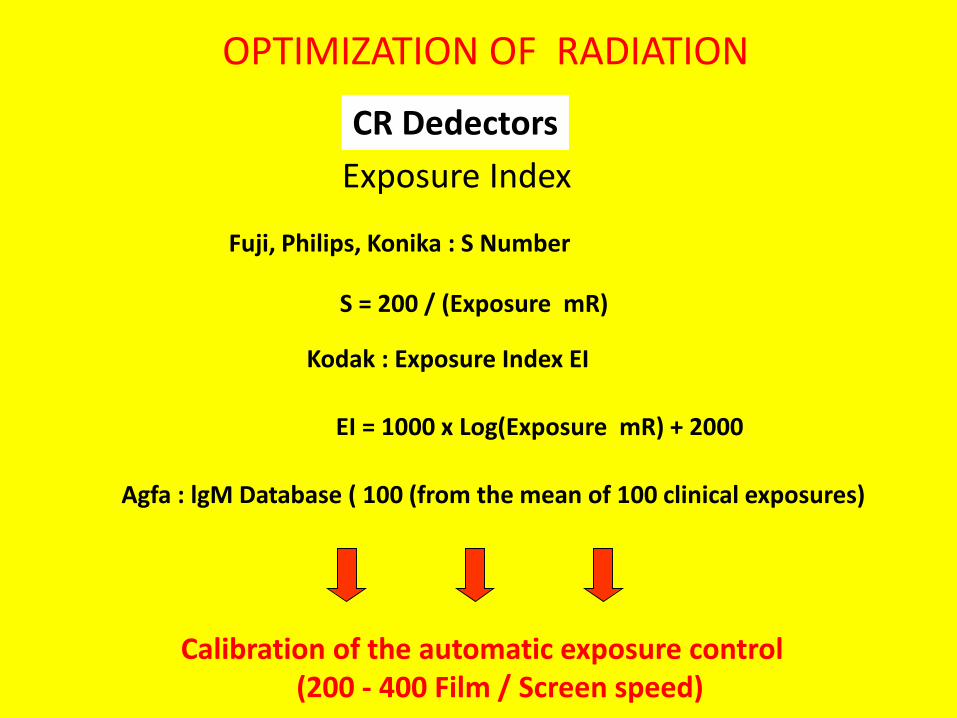
Exposure Index
Calibration of the automatic exposure control(200 - 400 Film / Screen speed)
Fuji, Philips, Konika : S Number
S = 200 / (Exposure mR)
Kodak : Exposure Index EI
EI = 1000 x Log(Exposure mR) + 2000
Agfa : lgM Database ( 100 (from the mean of 100 clinical exposures)
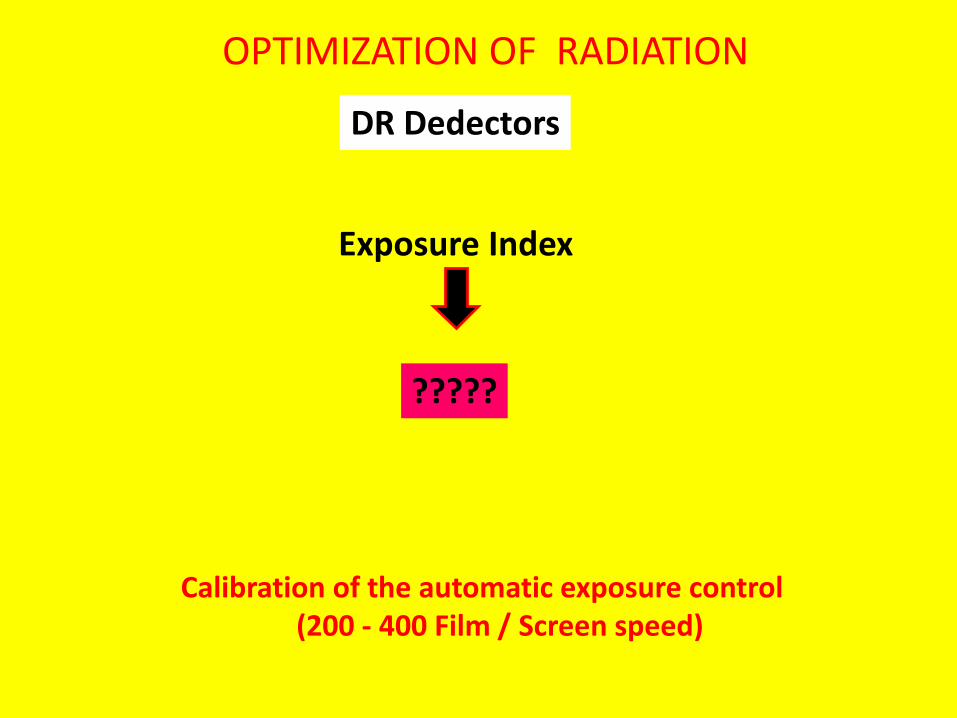
OPTIMIZATION OF RADIATION
CR Dedectors
Exposure Index
DR Dedectors
?????
Calibration of the automatic exposure control(200 - 400 Film / Screen speed)
OPTIMIZATION OF RADIATION