Embed Size (px)
Citation preview
Pathway Analysis of Untargeted Metabolomics Data using the MS Peaks to Pathways Module
By: Jasmine Chong, Jeff Xia
Date: 14/02/2018
The aim of this tutorial is to demonstrate how the MS Peaks to Pathways module of MetaboAnalyst
can be used to directly infer biological activity from mass peaks, bypassing the bottleneck of
metabolite identification. This module implements the mummichog algorithm (Version 1.0.10) from
Li et al. 2013 (https://doi.org/10.1371/journal.pcbi.1003123). The example data used in this tutorial
comes from the original Python implementation, which are human samples that were collected using
an Orbitrap LC-MS.
Introduction to MS Peaks to Pathways
High-throughput analysis and functional interpretation of untargeted MS-based (mass
spectrometry-based) metabolomics data continues to be a major bottleneck in metabolomics.
Conventional MS-based procedures typically include peak identification and annotation prior to
functional interpretation, which are prone to human bias and error. Further, previous versions of
MetaboAnalyst encompassed two modules for functional analysis, metabolic pathway analysis
(MetPA) and metabolite set enrichment analysis (MSEA), which required metabolite identifications
prior to use. However, if users were uncertain of the validity of their metabolite identifications, they
would be even more uncertain about the functional interpretation of metabolic features. One
promising approach to reduce problems associated with compound misidentification and thereby
pathway misinterpretation is to shift the unit of analysis from individual compounds to individual
pathways. In particular, the mummichog algorithm bypasses the bottleneck of metabolite
identification prior to pathway analysis by leveraging a priori pathway and network knowledge to
directly infer biological activity based on MS peaks. Due of its popularity and repeated user requests,
we have implemented the mummichog (version 1.0.10) algorithm in R to be consistent with
MetaboAnalyst workflow in a new, user-friendly interface. The main steps for MS Peaks to Pathways
are as follows:
i. Upload your data as a table containing three columns, m/z features, p-values, and statistical
scores (T-score, fold-change values).
ii. Specify the mass accuracy and the ion mode of your mass-spec instrument, as well as the p-
value cut-off.
iii. Select the organism’s library from which to perform pathway analysis.
iv. View the pathway analysis results.
v. Visualize the results in a global KEGG metabolic network.
Data Upload Preparation
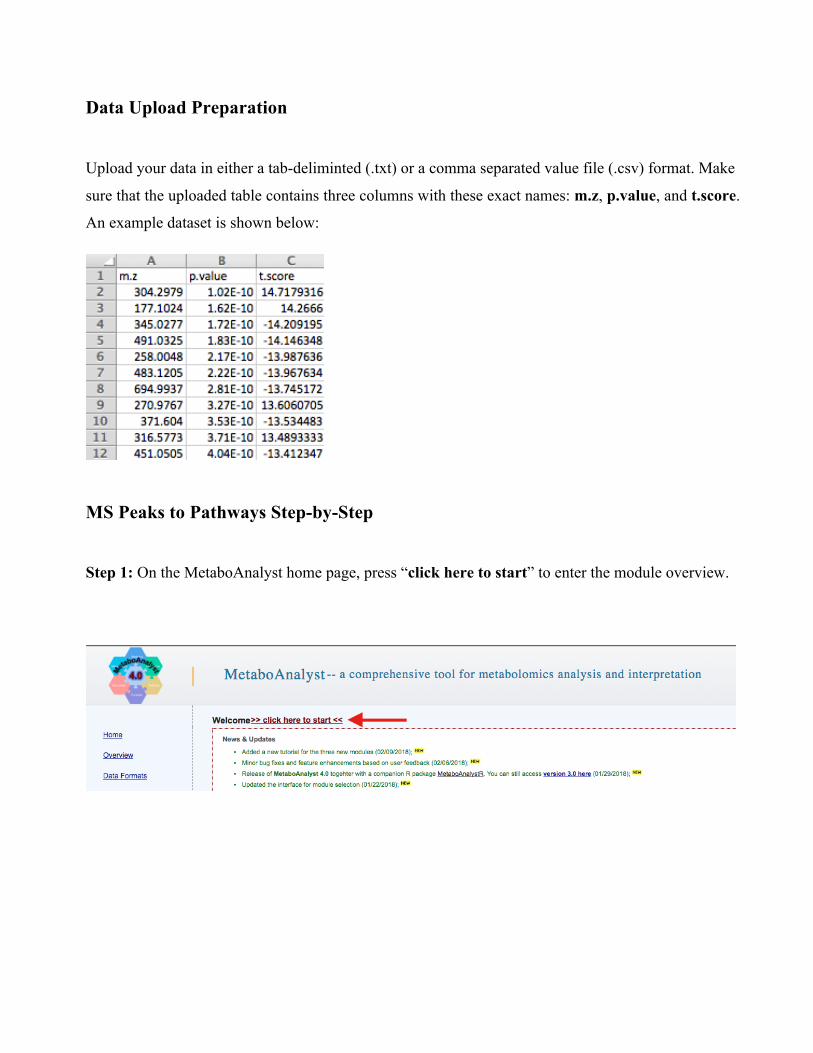
Upload your data in either a tab-deliminted (.txt) or a comma separated value file (.csv) format. Make
sure that the uploaded table contains three columns with these exact names: m.z, p.value, and t.score.
An example dataset is shown below:
MS Peaks to Pathways Step-by-Step
Step 1: On the MetaboAnalyst home page, press “click here to start” to enter the module overview.
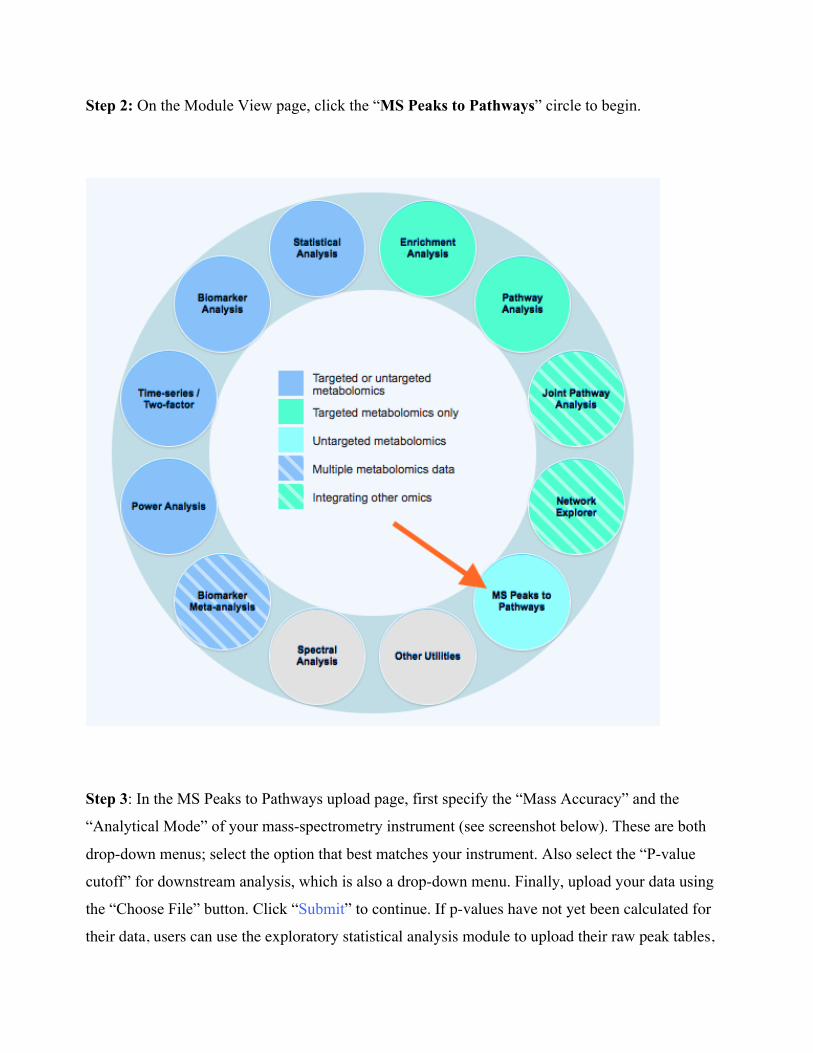
Step 2: On the Module View page, click the “MS Peaks to Pathways” circle to begin.
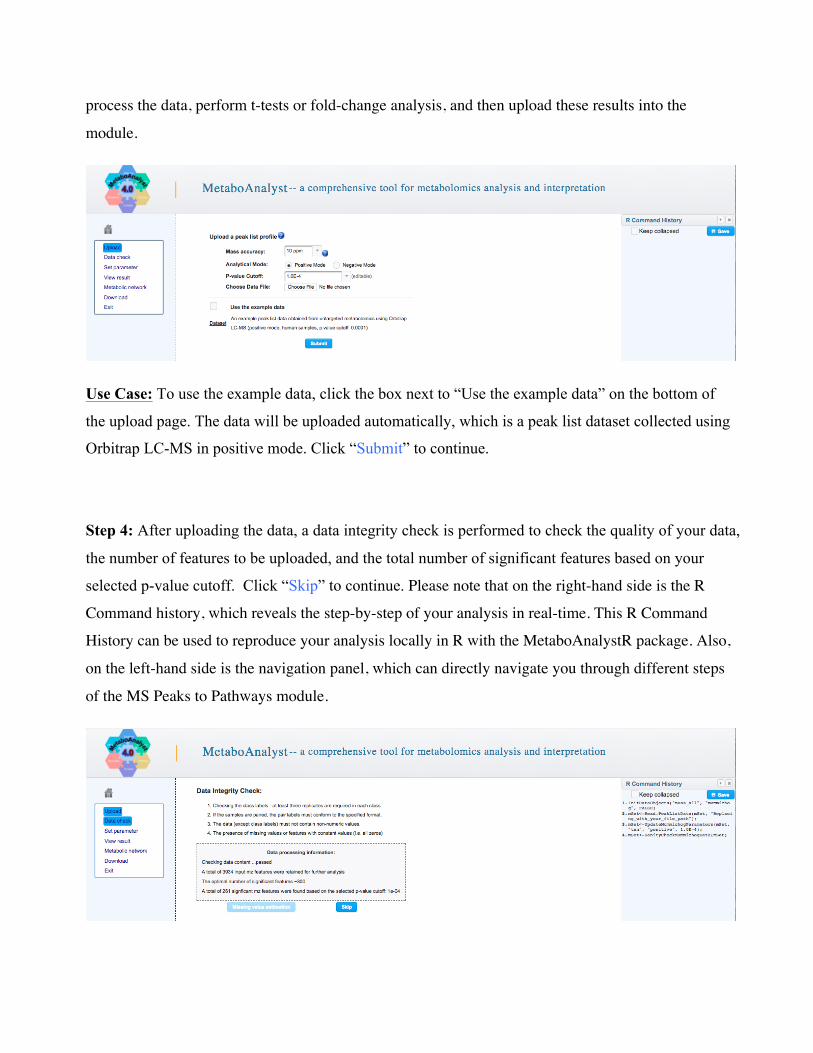
Step 3: In the MS Peaks to Pathways upload page, first specify the “Mass Accuracy” and the
“Analytical Mode” of your mass-spectrometry instrument (see screenshot below). These are both
drop-down menus; select the option that best matches your instrument. Also select the “P-value
cutoff” for downstream analysis, which is also a drop-down menu. Finally, upload your data using
the “Choose File” button. Click “Submit” to continue. If p-values have not yet been calculated for
their data, users can use the exploratory statistical analysis module to upload their raw peak tables,
process the data, perform t-tests or fold-change analysis, and then upload these results into the
module.
Use Case: To use the example data, click the box next to “Use the example data” on the bottom of
the upload page. The data will be uploaded automatically, which is a peak list dataset collected using
Orbitrap LC-MS in positive mode. Click “Submit” to continue.
Step 4: After uploading the data, a data integrity check is performed to check the quality of your data,
the number of features to be uploaded, and the total number of significant features based on your
selected p-value cutoff. Click “Skip” to continue. Please note that on the right-hand side is the R
Command history, which reveals the step-by-step of your analysis in real-time. This R Command
History can be used to reproduce your analysis locally in R with the MetaboAnalystR package. Also,
on the left-hand side is the navigation panel, which can directly navigate you through different steps
of the MS Peaks to Pathways module.
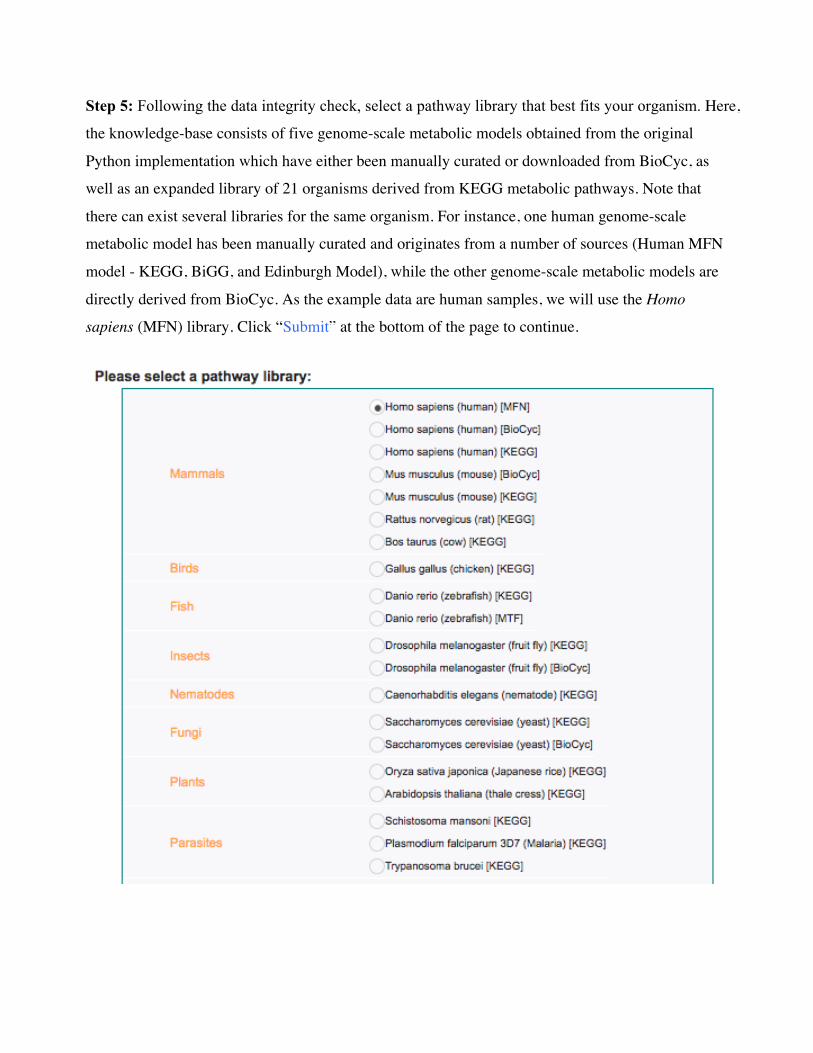
Step 5: Following the data integrity check, select a pathway library that best fits your organism. Here,
the knowledge-base consists of five genome-scale metabolic models obtained from the original
Python implementation which have either been manually curated or downloaded from BioCyc, as
well as an expanded library of 21 organisms derived from KEGG metabolic pathways. Note that
there can exist several libraries for the same organism. For instance, one human genome-scale
metabolic model has been manually curated and originates from a number of sources (Human MFN
model - KEGG, BiGG, and Edinburgh Model), while the other genome-scale metabolic models are
directly derived from BioCyc. As the example data are human samples, we will use the Homo
sapiens (MFN) library. Click “Submit” at the bottom of the page to continue.
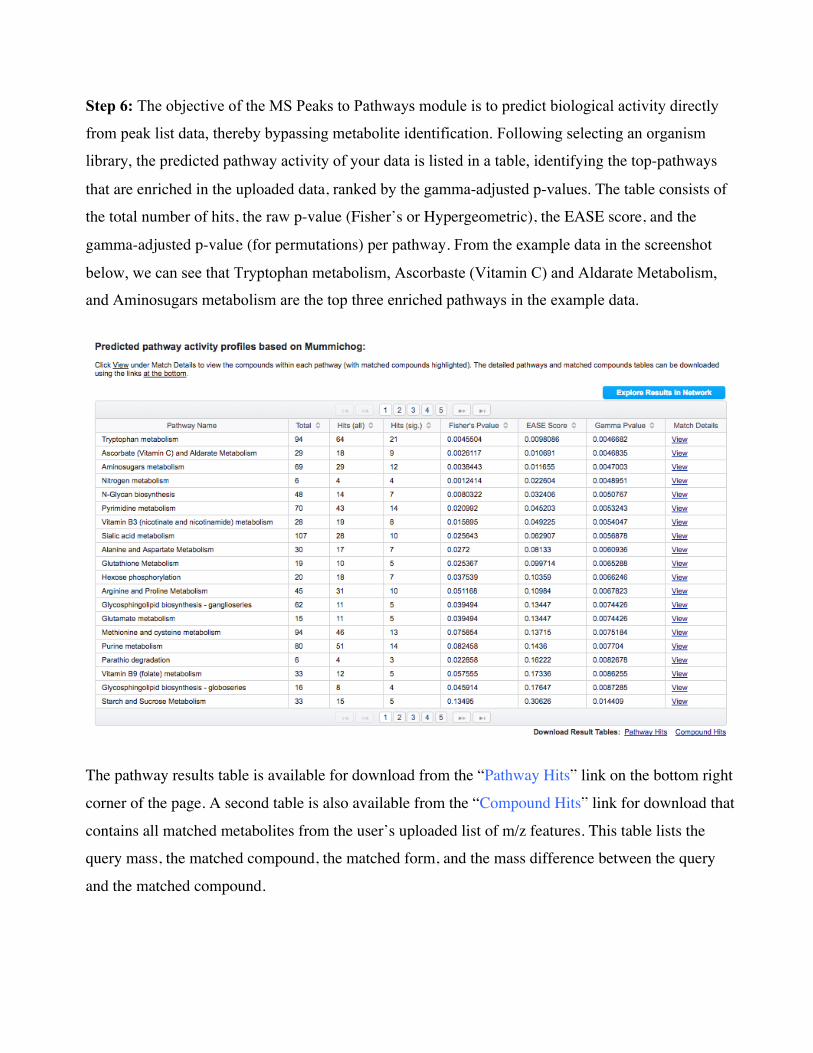
Step 6: The objective of the MS Peaks to Pathways module is to predict biological activity directly
from peak list data, thereby bypassing metabolite identification. Following selecting an organism
library, the predicted pathway activity of your data is listed in a table, identifying the top-pathways
that are enriched in the uploaded data, ranked by the gamma-adjusted p-values. The table consists of
the total number of hits, the raw p-value (Fisher’s or Hypergeometric), the EASE score, and the
gamma-adjusted p-value (for permutations) per pathway. From the example data in the screenshot
below, we can see that Tryptophan metabolism, Ascorbaste (Vitamin C) and Aldarate Metabolism,
and Aminosugars metabolism are the top three enriched pathways in the example data.
The pathway results table is available for download from the “Pathway Hits” link on the bottom right
corner of the page. A second table is also available from the “Compound Hits” link for download that
contains all matched metabolites from the user’s uploaded list of m/z features. This table lists the
query mass, the matched compound, the matched form, and the mass difference between the query
and the matched compound.
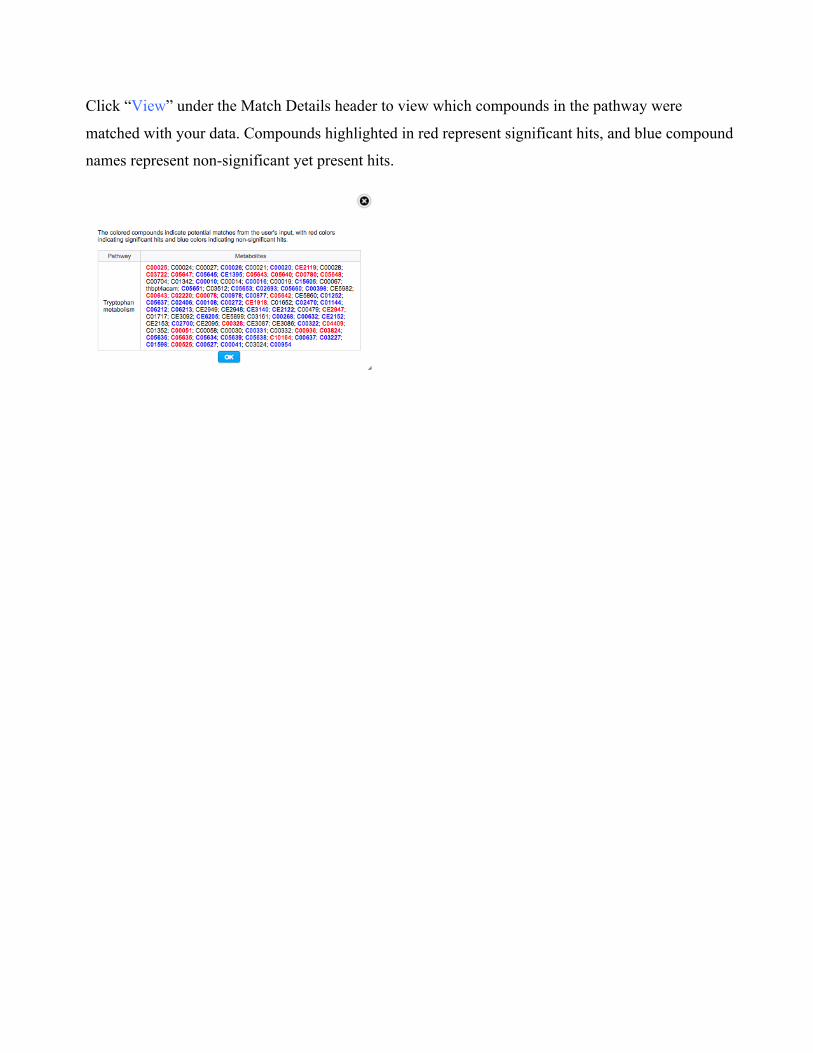
Click “View” under the Match Details header to view which compounds in the pathway were
matched with your data. Compounds highlighted in red represent significant hits, and blue compound
names represent non-significant yet present hits.
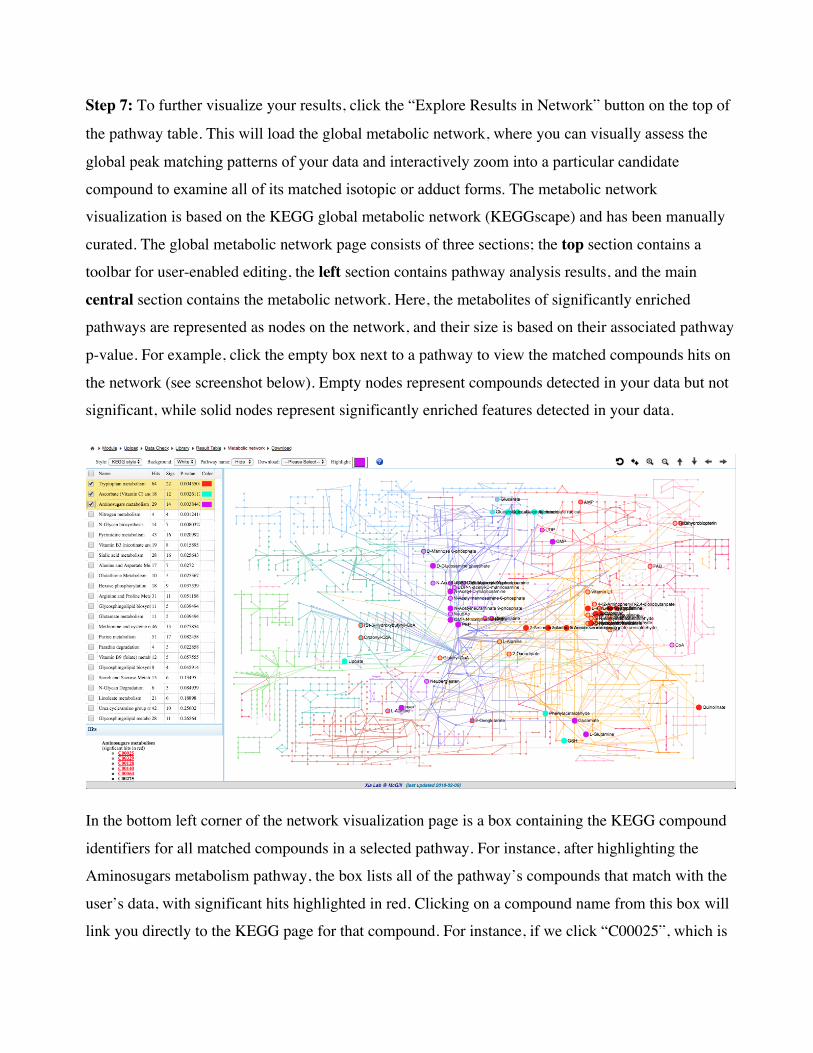
Step 7: To further visualize your results, click the “Explore Results in Network” button on the top of
the pathway table. This will load the global metabolic network, where you can visually assess the
global peak matching patterns of your data and interactively zoom into a particular candidate
compound to examine all of its matched isotopic or adduct forms. The metabolic network
visualization is based on the KEGG global metabolic network (KEGGscape) and has been manually
curated. The global metabolic network page consists of three sections; the top section contains a
toolbar for user-enabled editing, the left section contains pathway analysis results, and the main
central section contains the metabolic network. Here, the metabolites of significantly enriched
pathways are represented as nodes on the network, and their size is based on their associated pathway
p-value. For example, click the empty box next to a pathway to view the matched compounds hits on
the network (see screenshot below). Empty nodes represent compounds detected in your data but not
significant, while solid nodes represent significantly enriched features detected in your data.
In the bottom left corner of the network visualization page is a box containing the KEGG compound
identifiers for all matched compounds in a selected pathway. For instance, after highlighting the
Aminosugars metabolism pathway, the box lists all of the pathway’s compounds that match with the
user’s data, with significant hits highlighted in red. Clicking on a compound name from this box will
link you directly to the KEGG page for that compound. For instance, if we click “C00025”, which is
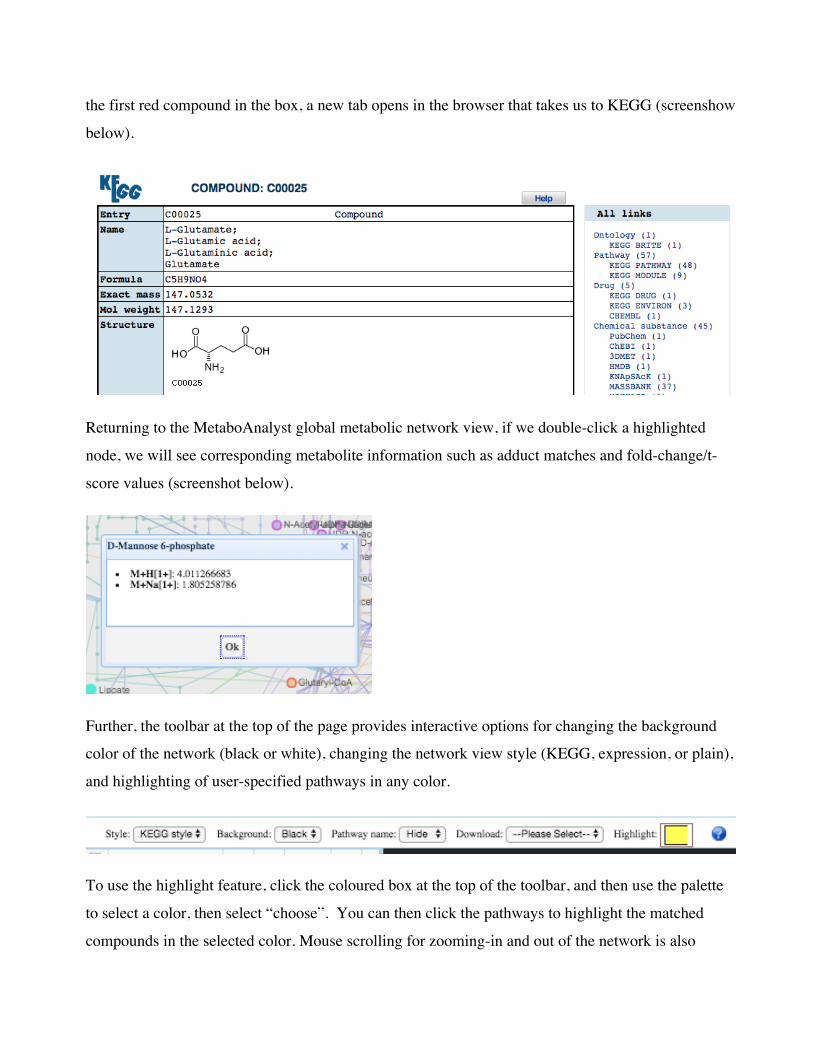
the first red compound in the box, a new tab opens in the browser that takes us to KEGG (screenshow
below).
Returning to the MetaboAnalyst global metabolic network view, if we double-click a highlighted
node, we will see corresponding metabolite information such as adduct matches and fold-change/t-
score values (screenshot below).
Further, the toolbar at the top of the page provides interactive options for changing the background
color of the network (black or white), changing the network view style (KEGG, expression, or plain),
and highlighting of user-specified pathways in any color.
To use the highlight feature, click the coloured box at the top of the toolbar, and then use the palette
to select a color, then select “choose”. You can then click the pathways to highlight the matched
compounds in the selected color. Mouse scrolling for zooming-in and out of the network is also
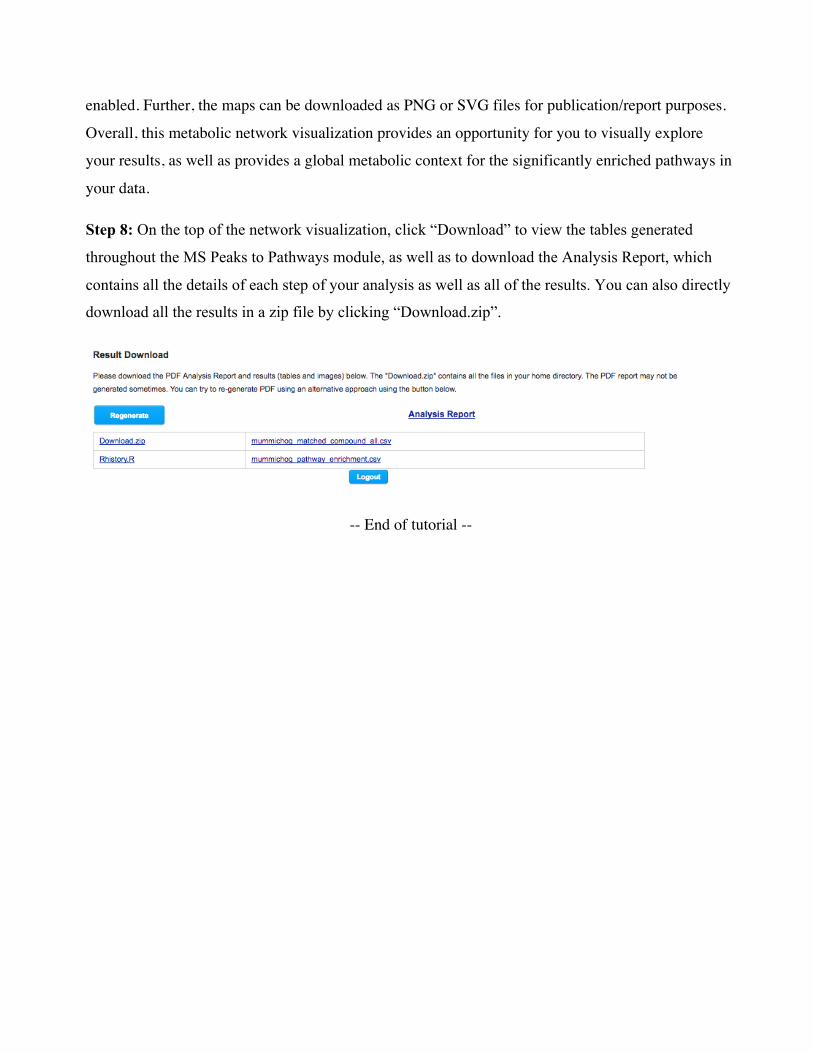
enabled. Further, the maps can be downloaded as PNG or SVG files for publication/report purposes.
Overall, this metabolic network visualization provides an opportunity for you to visually explore
your results, as well as provides a global metabolic context for the significantly enriched pathways in
your data.
Step 8: On the top of the network visualization, click “Download” to view the tables generated
throughout the MS Peaks to Pathways module, as well as to download the Analysis Report, which
contains all the details of each step of your analysis as well as all of the results. You can also directly
download all the results in a zip file by clicking “Download.zip”.
-- End of tutorial --