Embed Size (px)
Citation preview
ORIGINAL EMPIRICAL RESEARCH
Paths to and off purchase: quantifying the impact of traditionalmarketing and online consumer activity
Shuba Srinivasan & Oliver J. Rutz & Koen Pauwels
Received: 8 September 2014 /Accepted: 3 February 2015# Academy of Marketing Science 2015
Abstract This study investigates the effects of consumer ac-tivity in online media (paid, owned, and earned) on sales andtheir interdependencies with the traditional marketing mix el-ements of price, advertising and distribution. We develop anintegrative conceptual framework that links marketing actionsto online consumer activity metrics along the consumer’s pathto purchase (P2P). Our framework proposes that the path topurchase has three basic stages–learning (cognitive), feeling(affective), behavior (conative)—and that these can be mea-sured with novel online consumer activity metrics such asclicking on a paid search ads (cognitive) or Facebook likesand unlikes of the brand (affective). Our empirical analysis ofa fast moving consumer good supports a know–feel–do path-way for the low–involvement product studied. We find, forexample, that earned media can drive sales. However, we findthat the news is not all good as it relates to online consumeractivity: higher consumer activity on earned and owned mediacan lead to consumer disengagement in the form of unlikes.While traditional marketing such as distribution (60%) andprice (20%) are the main drivers of sales variation for the
studied brand, online owned (10%), (un)earned (3%), andpaid (2%) media explain a substantial part of the path to pur-chase. It is noteworthy that TVadvertising (5%) explains sig-nificantly less than online media in our case. Overall, ourstudy should help strengthen marketers’ case for buildingshare in consumers’ hearts and minds, as measured throughconsumer online activity and engagement.
Keywords Paid, owned, and earnedmedia . VAR . FMCG .
Path to purchase . Advertising
Introduction
The new marketing paradigms of the third millennium havemade the notion of a linear consumer purchase process (i.e.,funnel) obsolete and replaced it by a system-type networkstructure (e.g., Achrol and Kotler 2011), often collectivelycalled the path to purchase (P2P). The growing prevalenceof different forms of online media offers exciting new oppor-tunities for marketers to interact with consumers along theirpath to purchase. In 2014, the two leading online media aresearch and social. The search engine Google alone provides40,000 searches per second (or 3.5 billion searches per day,Internet Live Stats 2014) and has a market share of about 67%of the US search traffic as of 2014 (Comscore 2014). RecentlyNielsen (2012) reported that 27% of US consumers havesearched product information based on a TV advertisementand 22% have researched promotions advertised on TV.Ofcom (2013) reported that 16% of UK consumers havesearched for product information or even posted to a socialnetwork about a television advertisement. Social media giantFacebook alone has 1.3 billion active users, 860 million dailylog-ons and generates 4.5 million Blikes^ daily (Zephoria
The authors are listed reverse alphabetically, all authors contributedequally
S. SrinivasanSchool of Management, Boston University, Boston, MA 02215,USAe-mail: [email protected]
O. J. Rutz (*)Foster School of Business, University of Washington,Seattle, WA 98105, USAe-mail: [email protected]
K. PauwelsOzyegin University, Istanbul, Turkeye-mail: [email protected]
J. of the Acad. Mark. Sci.DOI 10.1007/s11747-015-0431-z
2014). Research shows that 26% of consumers have increasedpositive attitudes towards ads posted by friends and another26% find ads targeted using their profile information accept-able (Nielsen 2012). Online media have made it possible toobserve and leverage such behavior throughout the con-sumer’s purchase decision journey. Marketers can now com-municate with consumers through new channels and create abrand space that consumers can easily access and interactwith. It also enables firms to monitor consumers’ conversa-tions, brand attitudes, consumer engagement and disengage-ment in a faster and cost-effective manner than classic surveys(De Matos and Rossi 2008; Pauwels and van Ewijk 2014).
A critical question is how these online media interact witheach other and with traditional marketing mix actions such asprice, distribution and offline advertising. The marketing lit-erature has started to analyze the effectiveness of consumeractivity metrics, but most often in stand-alone fashion withoutaccounting for the effects of traditional media (Li and Kannan2014; Onishi and Manchanda 2012; Wiesel et al. 2011).Moreover, these studies are typically either in high involve-ment product categories (e.g., cars, lodging, or furniture) orproduct categories that allow for online consumption (e.g.,music, movies, books, or newspapers). Both of these factorsmay overstate the role of consumer activity on the path topurchase for more mundane consumer and business products,such as, typically low involvement and non-online consum-able, fast moving consumer goods (FMCGs). This is reflectedin the often-stated managerial opinion that Bnobody looksonline for toothpaste or paper clips^ (Lecinski 2011, p. 37).If valid, this common wisdom implies that marketing commu-nications for FMCGs do not drive higher online (paid, owned,and earned) consumer activity, which in turn will not drivebrand sales. In contrast to survey-based attitude metrics(Srinivasan et al. 2010; Lautman and Pauwels 2009), onlineconsumer activity metrics would therefore not drive (i.e.,Granger-cause) brand sales and therefore not qualify asBleading performance indicators^ for FMCGs. There is a lackof systematic empirical research on the role that consumeractivity metrics play on the path to purchase that either refutesor confirms these managerial expectations for FMCG catego-ries. Accordingly, our research questions are:
(1) Are online consumer activity metrics driven by FMCGmarketing actions?
(2) Are FMCG brand sales driven by online consumer activ-ity metrics?
(3) How large are the effects among marketing, online met-rics, and FMCG brand sales?
A particular feature of our study is that we consider boththe positive and negative sides of online consumer activity.Not only can consumers engage with brands online, e.g., byliking them on Facebook, they can also disengage with
brands, e.g., by unliking them. What is currently unknown iswhether such Bunearned media^ (typically by only a few con-sumers) translate into an overall sales dip and whether they arestimulated by marketing.
Overall, our contribution is threefold. First, we contributeby proposing and testing a conceptual framework of how on-line consumer activity reflected in online media interacts withthe traditional marketing mix actions (price, distribution andadvertising) in driving the path-to-purchase and ultimatelytranslates into sales and consumer engagement. We establishthis web of causal relations with Granger causality tests. Wedemonstrate that brand managers of mundane products canbenefit from tracking online consumer activity as reflected inpaid, owned, and earned media metrics. In so doing, we re-spond to the calls in previous research to offer new empiricalevidence of online media impact in such categories (Onishiand Manchanda 2012).
As our second, empirical, contribution, we quantify the roleof online consumer activity measured by paid, owned, earnedand unearnedmedia metrics in driving sales within the contextof traditional marketing mix variables price, distribution andadvertising. We quantify the long-term impact of a change toeach marketing mix element. Based on the VectorAutoregressive (VAR) model, we derive Generalized ForecastError Variance Decompositions (GFEVD) and GeneralizedImpulse Response Functions (GIRF) to quantify the elasticityand relative influence of consumer activity and traditionalmarketing mix actions on sales. We show to what extent thesedifferent consumer activity metrics contribute to driving sales,as compared to the traditional marketing mix actions of price,distribution and advertising.
Our third contribution is to assess whether, and if so how,tracking online consumer activity through online mediametrics improves prediction of brand sales, as Srinivasanet al. (2010) have done for traditional, survey-based mindsetmetrics. In addition, we add to the understanding on mediaeffects by examining the impact of consumer activity metricson consumer engagement and disengagement and assess thediagnostic value of these consumer activity metrics. First, weinvestigate whether these metrics allow managers to betterevaluate their marketing efforts on the path to purchase. Forexample, to what extent do more Facebook likes translate intosales? Second, we consider whether these metrics can be usedas early indicators of trouble. For example, do a (few)Facebook unlikes indicate a future sales decline? Beyond es-tablishing online consumer activity metrics as leading salesindicators, our study also shows that even small changes toonline engagement metrics can lead to sales declines. As apotential wellspring of strategic intelligence, tracking themcould prove instrumental in expanding the role of marketingin corporate decision making in practice.
In sum, online consumer activity tracking through paid,owned, and earned media offers an important complement to
J. of the Acad. Mark. Sci.
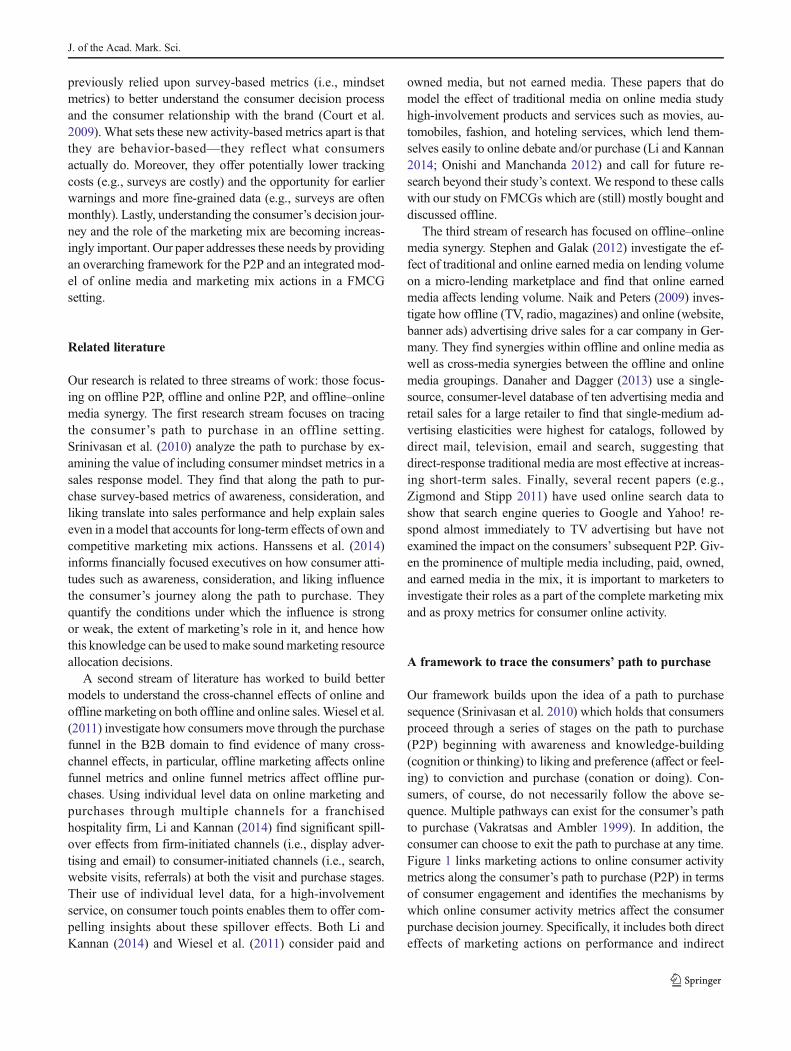
previously relied upon survey-based metrics (i.e., mindsetmetrics) to better understand the consumer decision processand the consumer relationship with the brand (Court et al.2009). What sets these new activity-based metrics apart is thatthey are behavior-based—they reflect what consumersactually do. Moreover, they offer potentially lower trackingcosts (e.g., surveys are costly) and the opportunity for earlierwarnings and more fine-grained data (e.g., surveys are oftenmonthly). Lastly, understanding the consumer’s decision jour-ney and the role of the marketing mix are becoming increas-ingly important. Our paper addresses these needs by providingan overarching framework for the P2P and an integrated mod-el of online media and marketing mix actions in a FMCGsetting.
Related literature
Our research is related to three streams of work: those focus-ing on offline P2P, offline and online P2P, and offline–onlinemedia synergy. The first research stream focuses on tracingthe consumer’s path to purchase in an offline setting.Srinivasan et al. (2010) analyze the path to purchase by ex-amining the value of including consumer mindset metrics in asales response model. They find that along the path to pur-chase survey-based metrics of awareness, consideration, andliking translate into sales performance and help explain saleseven in a model that accounts for long-term effects of own andcompetitive marketing mix actions. Hanssens et al. (2014)informs financially focused executives on how consumer atti-tudes such as awareness, consideration, and liking influencethe consumer’s journey along the path to purchase. Theyquantify the conditions under which the influence is strongor weak, the extent of marketing’s role in it, and hence howthis knowledge can be used tomake soundmarketing resourceallocation decisions.
A second stream of literature has worked to build bettermodels to understand the cross-channel effects of online andoffline marketing on both offline and online sales.Wiesel et al.(2011) investigate how consumers move through the purchasefunnel in the B2B domain to find evidence of many cross-channel effects, in particular, offline marketing affects onlinefunnel metrics and online funnel metrics affect offline pur-chases. Using individual level data on online marketing andpurchases through multiple channels for a franchisedhospitality firm, Li and Kannan (2014) find significant spill-over effects from firm-initiated channels (i.e., display adver-tising and email) to consumer-initiated channels (i.e., search,website visits, referrals) at both the visit and purchase stages.Their use of individual level data, for a high-involvementservice, on consumer touch points enables them to offer com-pelling insights about these spillover effects. Both Li andKannan (2014) and Wiesel et al. (2011) consider paid and
owned media, but not earned media. These papers that domodel the effect of traditional media on online media studyhigh-involvement products and services such as movies, au-tomobiles, fashion, and hoteling services, which lend them-selves easily to online debate and/or purchase (Li and Kannan2014; Onishi and Manchanda 2012) and call for future re-search beyond their study’s context. We respond to these callswith our study on FMCGs which are (still) mostly bought anddiscussed offline.
The third stream of research has focused on offline–onlinemedia synergy. Stephen and Galak (2012) investigate the ef-fect of traditional and online earned media on lending volumeon a micro-lending marketplace and find that online earnedmedia affects lending volume. Naik and Peters (2009) inves-tigate how offline (TV, radio, magazines) and online (website,banner ads) advertising drive sales for a car company in Ger-many. They find synergies within offline and online media aswell as cross-media synergies between the offline and onlinemedia groupings. Danaher and Dagger (2013) use a single-source, consumer-level database of ten advertising media andretail sales for a large retailer to find that single-medium ad-vertising elasticities were highest for catalogs, followed bydirect mail, television, email and search, suggesting thatdirect-response traditional media are most effective at increas-ing short-term sales. Finally, several recent papers (e.g.,Zigmond and Stipp 2011) have used online search data toshow that search engine queries to Google and Yahoo! re-spond almost immediately to TV advertising but have notexamined the impact on the consumers’ subsequent P2P. Giv-en the prominence of multiple media including, paid, owned,and earned media in the mix, it is important to marketers toinvestigate their roles as a part of the complete marketing mixand as proxy metrics for consumer online activity.
A framework to trace the consumers’ path to purchase
Our framework builds upon the idea of a path to purchasesequence (Srinivasan et al. 2010) which holds that consumersproceed through a series of stages on the path to purchase(P2P) beginning with awareness and knowledge-building(cognition or thinking) to liking and preference (affect or feel-ing) to conviction and purchase (conation or doing). Con-sumers, of course, do not necessarily follow the above se-quence. Multiple pathways can exist for the consumer’s pathto purchase (Vakratsas and Ambler 1999). In addition, theconsumer can choose to exit the path to purchase at any time.Figure 1 links marketing actions to online consumer activitymetrics along the consumer’s path to purchase (P2P) in termsof consumer engagement and identifies the mechanisms bywhich online consumer activity metrics affect the consumerpurchase decision journey. Specifically, it includes both directeffects of marketing actions on performance and indirect
J. of the Acad. Mark. Sci.
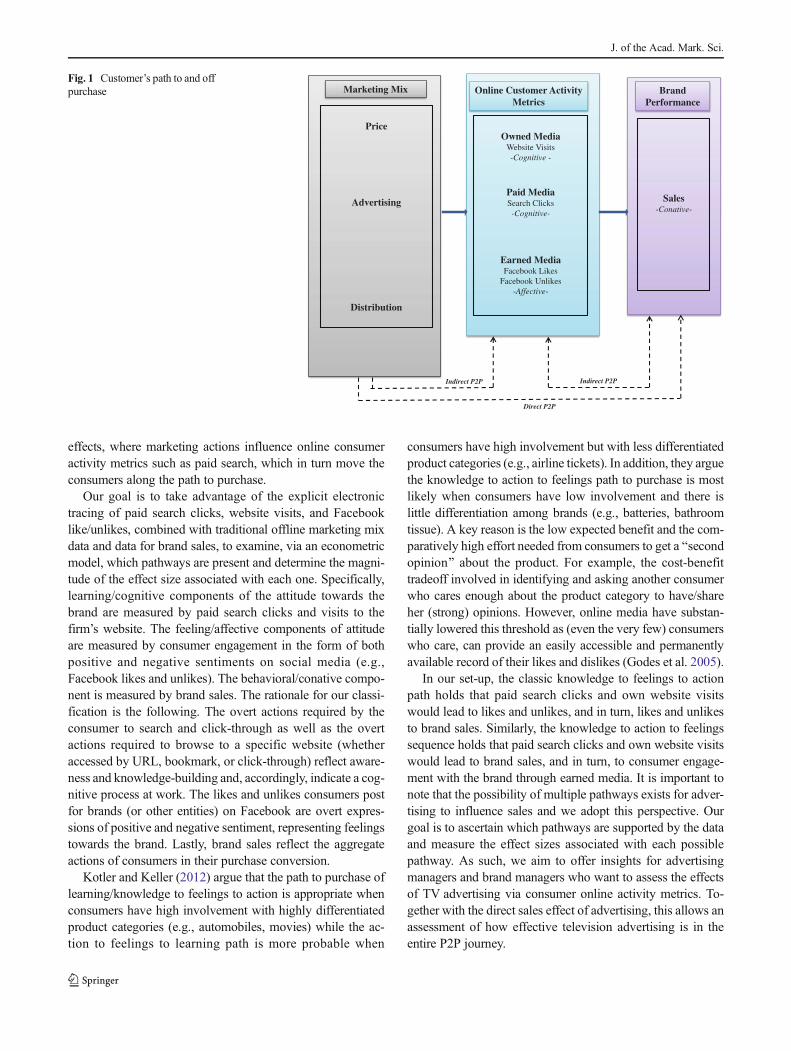
effects, where marketing actions influence online consumeractivity metrics such as paid search, which in turn move theconsumers along the path to purchase.
Our goal is to take advantage of the explicit electronictracing of paid search clicks, website visits, and Facebooklike/unlikes, combined with traditional offline marketing mixdata and data for brand sales, to examine, via an econometricmodel, which pathways are present and determine the magni-tude of the effect size associated with each one. Specifically,learning/cognitive components of the attitude towards thebrand are measured by paid search clicks and visits to thefirm’s website. The feeling/affective components of attitudeare measured by consumer engagement in the form of bothpositive and negative sentiments on social media (e.g.,Facebook likes and unlikes). The behavioral/conative compo-nent is measured by brand sales. The rationale for our classi-fication is the following. The overt actions required by theconsumer to search and click-through as well as the overtactions required to browse to a specific website (whetheraccessed by URL, bookmark, or click-through) reflect aware-ness and knowledge-building and, accordingly, indicate a cog-nitive process at work. The likes and unlikes consumers postfor brands (or other entities) on Facebook are overt expres-sions of positive and negative sentiment, representing feelingstowards the brand. Lastly, brand sales reflect the aggregateactions of consumers in their purchase conversion.
Kotler and Keller (2012) argue that the path to purchase oflearning/knowledge to feelings to action is appropriate whenconsumers have high involvement with highly differentiatedproduct categories (e.g., automobiles, movies) while the ac-tion to feelings to learning path is more probable when
consumers have high involvement but with less differentiatedproduct categories (e.g., airline tickets). In addition, they arguethe knowledge to action to feelings path to purchase is mostlikely when consumers have low involvement and there islittle differentiation among brands (e.g., batteries, bathroomtissue). A key reason is the low expected benefit and the com-paratively high effort needed from consumers to get a Bsecondopinion^ about the product. For example, the cost-benefittradeoff involved in identifying and asking another consumerwho cares enough about the product category to have/shareher (strong) opinions. However, online media have substan-tially lowered this threshold as (even the very few) consumerswho care, can provide an easily accessible and permanentlyavailable record of their likes and dislikes (Godes et al. 2005).
In our set-up, the classic knowledge to feelings to actionpath holds that paid search clicks and own website visitswould lead to likes and unlikes, and in turn, likes and unlikesto brand sales. Similarly, the knowledge to action to feelingssequence holds that paid search clicks and own website visitswould lead to brand sales, and in turn, to consumer engage-ment with the brand through earned media. It is important tonote that the possibility of multiple pathways exists for adver-tising to influence sales and we adopt this perspective. Ourgoal is to ascertain which pathways are supported by the dataand measure the effect sizes associated with each possiblepathway. As such, we aim to offer insights for advertisingmanagers and brand managers who want to assess the effectsof TV advertising via consumer online activity metrics. To-gether with the direct sales effect of advertising, this allows anassessment of how effective television advertising is in theentire P2P journey.
Marketing Mix
Price
Advertising
Distribution
Owned MediaWebsite Visits-Cognitive -
Paid MediaSearch Clicks-Cognitive-
Earned MediaFacebook Likes
Facebook Unlikes-Affective-
Online Customer Activity Metrics
Brand Performance
Sales-Conative-
Indirect P2P
Direct P2P
Indirect P2P
Fig. 1 Customer’s path to and offpurchase
J. of the Acad. Mark. Sci.
In our empirical study, we examine a lower involvementFMCG product category which would presumably drawfew, if any, cognitive resources. Thus, the classic knowl-edge to action to feelings path to purchase seems unlikelyat first glance. However, if some consumers seek to learnmore about the brand (e.g., prompted by TV, friends, socialconnections, or other stimuli) a different path from learn-ing to sales or from learning to feelings to sales might co-exist. To the extent that online media lower search costs,they also lower the costs for consumers to learn about low-involvement products online. Likewise, while few peopleare likely to talk about great experiences with a mundaneproduct category, e.g., toothpaste, at a cocktail party oranother offline WOM opportunity, they may do so onlineby simply clicking Blike.^
Additionally, online consumer activity metrics measuredvia paid, owned, and earned media can serve as early signalsof performance successes and problems for brands(Srinivasan et al. 2010; Ambler 2003). If marketing actionsmove consumers closer to the buying decision in a series ofsteps on the path to purchase, then tracking and interpretingthese customer activity metrics can provide early evaluationsignals. Specific actions that strengthen the competitive po-sition of the brand in consumers’ Bhearts and minds^ maynot translate into sales immediately but the online activitymetrics can verify that marketing moves consumers in theright direction (Keller and Lehmann 2006). In the case ofperformance problems, the consumer may not react imme-diately by switching to another brand, but tracking consum-er attitudes may diagnose declining interest and offer achance for remedial action before sales are affected.
Modeling approach
In this section, we describe our approach to modeling the ef-fects of online consumer activity metrics and traditional mar-keting on brand performance. As our conceptual frameworkshows, we require a methodology that accounts for dual cau-sality and thus for indirect and feedback effects among onlineconsumer activity metrics (paid, owned, and earned), the tradi-tional marketing mix (price, distribution, and TV advertising),and brand performance. For instance, an increase in onlineconsumer activity through paid search clicks may induce webusers to visit the brand’s website and subsequently purchase thebrand, which increases brand revenues and, in turn, leads thefirm to increase paid search (a feedback effect). We anticipate asimilar pattern of causality for traditional marketing activity andbrand sales. It is likely that TV advertising will stimulate con-sumers to engage in paid search (Nielsen 2012) and websitevisits leading to another indirect effect on sales.We also includelagged effects of traditional marketing, online consumer activ-ity, and brands sales to account for varying wear-in and wear-
out effects likely for communication activity. The VectorAutoregressive (VAR) model is specified as:
Y t ¼ AþXp
i−1ΦiY t−i þ ΨX t þΣt; t ¼ 1; 2;…T ; ð1Þ
where Yt is an (8×1) vector of the endogenous variablesconsisting of online consumer activity consisting of paid(i.e., paid search clicks), owned (i.e., website visits), andearned media (i.e., Facebook likes and unlikes), tradition-al marketing mix (i.e., price, distribution, and TV adver-tising) and brand sales, A is a (8×1) vector of intercepts,
Σt∼N 0!;Ω
� �,and A,Φ,Ψ,Ω are parameters to be estimated
and the optimal lag length p is selected by the Bayesian Infor-mation Criterion. VAR models are estimated equation-by-equation: because all right hand side variables are identicalacross equations, Seemingly Unrelated Regression (SUR)does not improve efficiency (Hanssens et al. 2001).
Next, we compare the predictions of the full VAR modelwith the two alternative benchmark models. In addition to thisBfull model,^ we estimated two benchmark models nestedwithin the full model. The first is the model with only market-ing mix where we estimate a 4-equation VAR model obtainedby deleting the online consumer activity consisting of paid(i.e., paid search clicks), owned (i.e., website visits), andearned media (i.e., Facebook likes and unlikes) media equa-tions from the full VAR model. The second is the model withonly online consumer activity variables where we estimate a5-equation VAR model obtained by deleting the traditionalmarketing mix on brand sales (i.e., price, distribution, andtelevision advertising). We compare the performance of thesenested models with the full model to assess the improvedexplanatory power of the different models.
The links represented in the conceptual framework can betested by investigating which variables Granger-cause othervariables (e.g., Hanssens et al. 2001). In essence, Grangercausality implies that knowing the history of a variable Xhelps explain a variable Y, beyond Y’s own history. This tem-poral causality is the closest proxy for causality that can begained from studying the time series of variables (i.e., in theabsence of manipulating causality in controlled experiments).We perform a series of Granger-causality tests on each pair ofkey variables. If indeed brand sales Granger-cause (some of)the consumer activity metrics and traditional marketing vari-ables, we need to capture the complex interactions of Fig. 1 ina full dynamic system. Next, we test for potential permanenteffects of online consumer activity metrics and traditionalmarketing on brand sales.1 In the case of permanent effects,
1 We use both the Augmented Dickey-Fuller test, which maintains evo-lution as the null hypothesis and the KPSS test which maintains station-arity as the null hypothesis (e.g., Pauwels and Weiss 2008).
J. of the Acad. Mark. Sci.
the time series for brand sales would be classified as evolving.The opposite classification, that of stationary, implies thatsales has a fixed mean and that changes (including thosecaused by marketing actions) do not have a permanent impact(e.g., Dekimpe and Hanssens 1995).
In addition, based on the VAR parameters, we also estimatethe short-term and long-term responses of sales to online con-sumer activity metrics and traditional marketing actions andcompute the corresponding elasticities. The impulse responsefunction estimates the net result of a shock to one variable onthe time path of another other variable relative to its baseline.Specifically, we estimate Generalized IRFs (GIRF) with thesimultaneous-shocking approach (Evans and Wells 1983;Dekimpe and Hanssens 1999). This approach does not requireresearchers to specify a causal ordering among variables toobtain their immediate (same-period) interactions. Instead,the GIRF estimates, given a one-unit shock to variable i, theexpected value for shocks occurring simultaneously to theother variables j (i≠j) is shown in Eq. (2)
E uj∣ui ¼ 1� � ¼ σi j=σii; with σi j;σii elements of Σ ð2Þ
Thus, we obtain the immediate (same-period) effect of,e.g., TV advertising on brand sales as the expected valueof the contemporaneous sales change for a one-unitchange to TV advertising. Summing up all significant im-pulse response coefficients,2 we obtain the long-term uniteffects of one endogenous variable (the impulse variable)on another (the response variable). When the responsevariable is evolving, we derive the long-term unit effecton the level (versus the change) in the variable by calcu-lating accumulated impulse response functions and theirstandard errors. Finally, we apply the procedure in Trusovet al. (2009) to derive long-term elasticities from the uniteffects.
In addition, based on the VAR parameters, we deriveGFEVD estimates to investigate whether, and to what extent,consumer activity metrics explain brand sales performancebeyond the impact of marketing mix actions (Pesaran andShin 1998). GFEVD estimates are derived using the followingequation:
θgi j nð Þ ¼X n
l¼0ψgi j lð Þ
� �2
X n
l¼0
X m
j¼0ψgi j lð Þ
� �2 ; i; j ¼ 1;…m: ð3Þ
where ψijg(l) is the value of a Generalized Impulse Response
Function (GIRF) following a one-unit shock to variable i onvariable j at time l. GFEVD quantifies the dynamic explanatoryvalue on sales of each endogenous variable akin to a BdynamicR2.^More specific, GFEVD provides a measure of the relativeimpact over time of shocks initiated by each of the individualendogenous variables in a VARmodel, without the need for theresearcher to specify a causal ordering among these variables.Importantly, the GFEVD attributes 100% of the forecast errorvariance in sales to either (1) the past values of the other en-dogenous variables or (2) the past of sales itself, also known asBpurchase inertia.^ The former (e.g., a past change in earnedmedia drives current sales) is more managerially and concep-tually interesting than the latter (i.e., a past change in salesdrives current sales). Therefore, we assess the dynamic explan-atory value of the online consumer activity metrics by the ex-tent to which they increase the sales forecast error varianceexplained by the potential drivers of sales (i.e., other endoge-nous variables) in the model, and thus reduce the percentageexplained by past sales. The relative importance of the drivers isestablished based on the GFEVD values at 6 months, whichreduces sensitivity to short-term fluctuations. 3
Data
We obtained data from a large consumer packaged goods man-ufacturer in the US marketing a leading brand of a low-in-volvement, paper-based product with over 99% category pen-etration.4 The transactions data are obtained fromA.C. Nielsenfor the entire US. The online consumer activity metrics interms of paid, owned, and earnedmedia data are obtained fromMindShare, also for the entire US, for the period of January2010 to October 2010 (40 weeks). As the focal brand perfor-mance measure, we use sales volume aggregated across allSKUs of the brand, on average 408 K units of the productare sold per week. For the marketing mix, our data includeweekly average price paid, weekly value-weighted distribu-tion coverage, and weekly offline advertising media in GrossRating Points (GRPs). The average weekly price was $7.15per unit. For distribution coverage, a value-weighted overalldistribution presence is calculated at the brand level in theform of a percentage. Stores are weighted for their sales inthe product category, and each UPC is weighted for its contri-bution to sales. TVadvertising data are provided by an adver-tising audit service on a national level. On average, the firmhas 78 GRPs in TVadvertising per week.
(from Eq. 1).
2 We use the one standard error criterion to judge the statistical signifi-cance of each impulse response coefficient (Pesaran and Shin 1998).Standard errors are calculated using a Monte Carlo simulation approachwith 1,000 runs in each case (see Horváth 2003).
3 To evaluate the accuracy of our GFEVD estimates, we obtain standarderrors using Monte Carlo simulations (see Benkwitz et al. 2001).4 Our non-disclosure agreement with the data provider does not allow usto specifically name the product category and brand.
J. of the Acad. Mark. Sci.
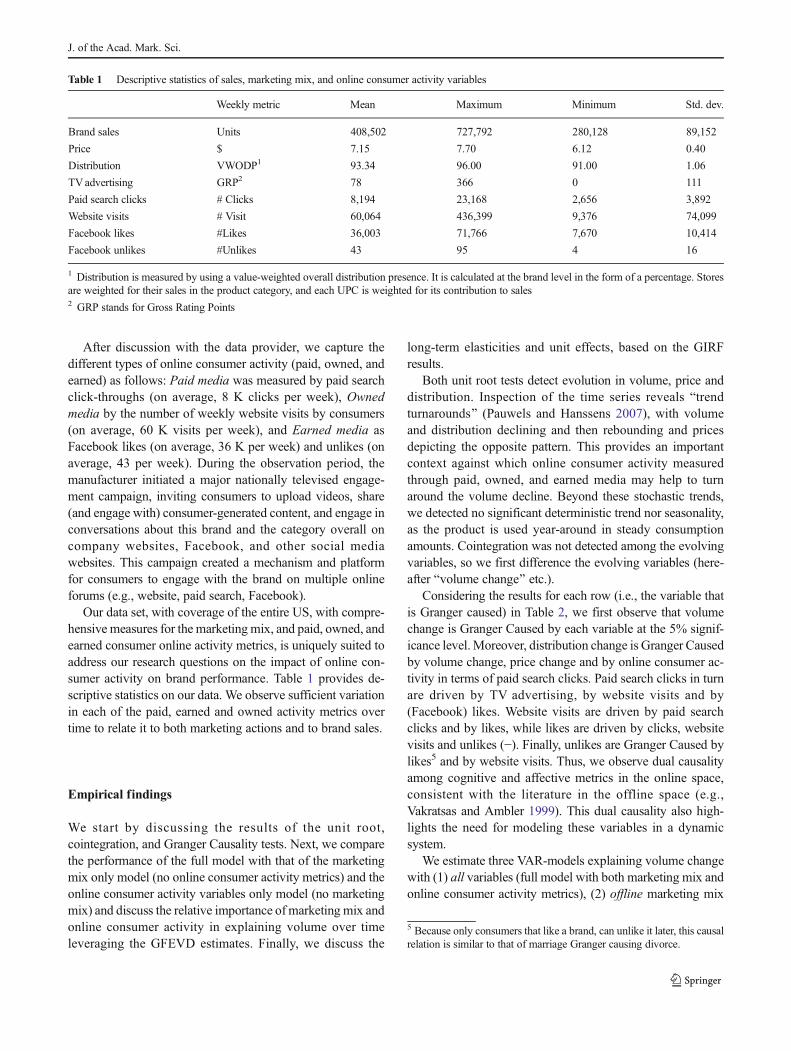
After discussion with the data provider, we capture thedifferent types of online consumer activity (paid, owned, andearned) as follows: Paid media was measured by paid searchclick-throughs (on average, 8 K clicks per week), Ownedmedia by the number of weekly website visits by consumers(on average, 60 K visits per week), and Earned media asFacebook likes (on average, 36 K per week) and unlikes (onaverage, 43 per week). During the observation period, themanufacturer initiated a major nationally televised engage-ment campaign, inviting consumers to upload videos, share(and engage with) consumer-generated content, and engage inconversations about this brand and the category overall oncompany websites, Facebook, and other social mediawebsites. This campaign created a mechanism and platformfor consumers to engage with the brand on multiple onlineforums (e.g., website, paid search, Facebook).
Our data set, with coverage of the entire US, with compre-hensive measures for the marketingmix, and paid, owned, andearned consumer online activity metrics, is uniquely suited toaddress our research questions on the impact of online con-sumer activity on brand performance. Table 1 provides de-scriptive statistics on our data. We observe sufficient variationin each of the paid, earned and owned activity metrics overtime to relate it to both marketing actions and to brand sales.
Empirical findings
We start by discussing the results of the unit root,cointegration, and Granger Causality tests. Next, we comparethe performance of the full model with that of the marketingmix only model (no online consumer activity metrics) and theonline consumer activity variables only model (no marketingmix) and discuss the relative importance of marketing mix andonline consumer activity in explaining volume over timeleveraging the GFEVD estimates. Finally, we discuss the
long-term elasticities and unit effects, based on the GIRFresults.
Both unit root tests detect evolution in volume, price anddistribution. Inspection of the time series reveals Btrendturnarounds^ (Pauwels and Hanssens 2007), with volumeand distribution declining and then rebounding and pricesdepicting the opposite pattern. This provides an importantcontext against which online consumer activity measuredthrough paid, owned, and earned media may help to turnaround the volume decline. Beyond these stochastic trends,we detected no significant deterministic trend nor seasonality,as the product is used year-around in steady consumptionamounts. Cointegration was not detected among the evolvingvariables, so we first difference the evolving variables (here-after Bvolume change^ etc.).
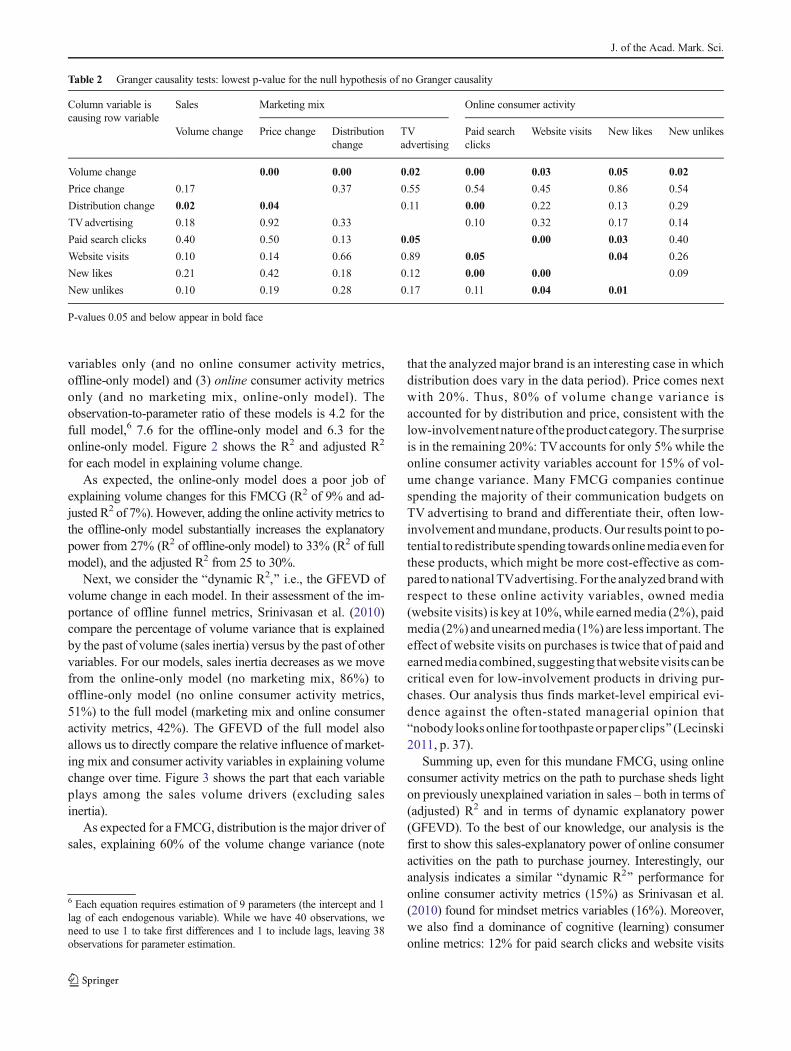
Considering the results for each row (i.e., the variable thatis Granger caused) in Table 2, we first observe that volumechange is Granger Caused by each variable at the 5% signif-icance level.Moreover, distribution change is Granger Causedby volume change, price change and by online consumer ac-tivity in terms of paid search clicks. Paid search clicks in turnare driven by TV advertising, by website visits and by(Facebook) likes. Website visits are driven by paid searchclicks and by likes, while likes are driven by clicks, websitevisits and unlikes (−). Finally, unlikes are Granger Caused bylikes5 and by website visits. Thus, we observe dual causalityamong cognitive and affective metrics in the online space,consistent with the literature in the offline space (e.g.,Vakratsas and Ambler 1999). This dual causality also high-lights the need for modeling these variables in a dynamicsystem.
We estimate three VAR-models explaining volume changewith (1) all variables (full model with both marketing mix andonline consumer activity metrics), (2) offline marketing mix
Table 1 Descriptive statistics of sales, marketing mix, and online consumer activity variables
Weekly metric Mean Maximum Minimum Std. dev.
Brand sales Units 408,502 727,792 280,128 89,152
Price $ 7.15 7.70 6.12 0.40
Distribution VWODP1 93.34 96.00 91.00 1.06
TVadvertising GRP2 78 366 0 111
Paid search clicks # Clicks 8,194 23,168 2,656 3,892
Website visits # Visit 60,064 436,399 9,376 74,099
Facebook likes #Likes 36,003 71,766 7,670 10,414
Facebook unlikes #Unlikes 43 95 4 16
1 Distribution is measured by using a value-weighted overall distribution presence. It is calculated at the brand level in the form of a percentage. Storesare weighted for their sales in the product category, and each UPC is weighted for its contribution to sales2 GRP stands for Gross Rating Points
5 Because only consumers that like a brand, can unlike it later, this causalrelation is similar to that of marriage Granger causing divorce.
J. of the Acad. Mark. Sci.
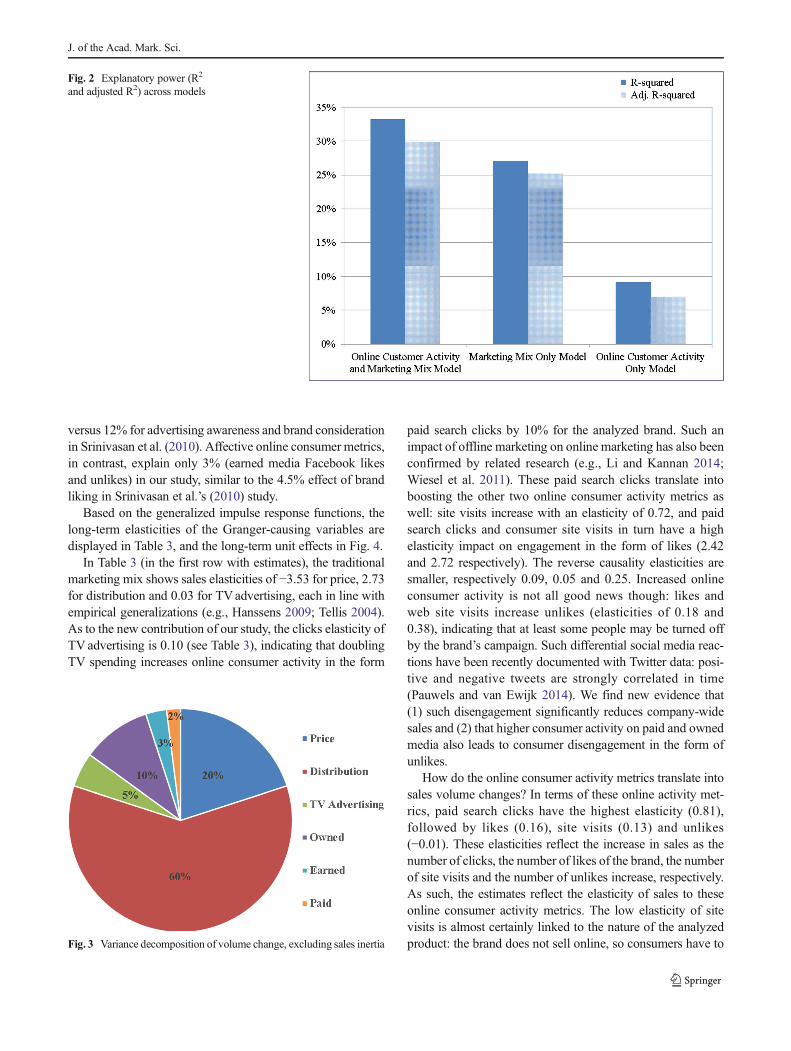
variables only (and no online consumer activity metrics,offline-only model) and (3) online consumer activity metricsonly (and no marketing mix, online-only model). Theobservation-to-parameter ratio of these models is 4.2 for thefull model,6 7.6 for the offline-only model and 6.3 for theonline-only model. Figure 2 shows the R2 and adjusted R2
for each model in explaining volume change.As expected, the online-only model does a poor job of
explaining volume changes for this FMCG (R2 of 9% and ad-justed R2 of 7%). However, adding the online activity metrics tothe offline-only model substantially increases the explanatorypower from 27% (R2 of offline-only model) to 33% (R2 of fullmodel), and the adjusted R2 from 25 to 30%.
Next, we consider the Bdynamic R2,^ i.e., the GFEVD ofvolume change in each model. In their assessment of the im-portance of offline funnel metrics, Srinivasan et al. (2010)compare the percentage of volume variance that is explainedby the past of volume (sales inertia) versus by the past of othervariables. For our models, sales inertia decreases as we movefrom the online-only model (no marketing mix, 86%) tooffline-only model (no online consumer activity metrics,51%) to the full model (marketing mix and online consumeractivity metrics, 42%). The GFEVD of the full model alsoallows us to directly compare the relative influence of market-ing mix and consumer activity variables in explaining volumechange over time. Figure 3 shows the part that each variableplays among the sales volume drivers (excluding salesinertia).
As expected for a FMCG, distribution is the major driver ofsales, explaining 60% of the volume change variance (note
that the analyzed major brand is an interesting case in whichdistribution does vary in the data period). Price comes nextwith 20%. Thus, 80% of volume change variance isaccounted for by distribution and price, consistent with thelow-involvementnatureof theproduct category.Thesurpriseis in the remaining 20%: TVaccounts for only 5% while theonline consumer activity variables account for 15% of vol-ume change variance. Many FMCG companies continuespending the majority of their communication budgets onTV advertising to brand and differentiate their, often low-involvement andmundane, products.Our results point to po-tential to redistribute spending towardsonlinemedia even forthese products, which might be more cost-effective as com-pared to national TVadvertising. For the analyzed brandwithrespect to these online activity variables, owned media(website visits) is key at 10%,while earnedmedia (2%), paidmedia (2%) and unearnedmedia (1%) are less important. Theeffect of website visits on purchases is twice that of paid andearnedmedia combined, suggesting thatwebsite visits canbecritical even for low-involvement products in driving pur-chases. Our analysis thus finds market-level empirical evi-dence against the often-stated managerial opinion thatBnobody looksonline for toothpasteorpaper clips^ (Lecinski2011, p. 37).
Summing up, even for this mundane FMCG, using onlineconsumer activity metrics on the path to purchase sheds lighton previously unexplained variation in sales – both in terms of(adjusted) R2 and in terms of dynamic explanatory power(GFEVD). To the best of our knowledge, our analysis is thefirst to show this sales-explanatory power of online consumeractivities on the path to purchase journey. Interestingly, ouranalysis indicates a similar Bdynamic R2^ performance foronline consumer activity metrics (15%) as Srinivasan et al.(2010) found for mindset metrics variables (16%). Moreover,we also find a dominance of cognitive (learning) consumeronline metrics: 12% for paid search clicks and website visits
Table 2 Granger causality tests: lowest p-value for the null hypothesis of no Granger causality
Column variable iscausing row variable
Sales Marketing mix Online consumer activity
Volume change Price change Distributionchange
TVadvertising
Paid searchclicks
Website visits New likes New unlikes
Volume change 0.00 0.00 0.02 0.00 0.03 0.05 0.02
Price change 0.17 0.37 0.55 0.54 0.45 0.86 0.54
Distribution change 0.02 0.04 0.11 0.00 0.22 0.13 0.29
TVadvertising 0.18 0.92 0.33 0.10 0.32 0.17 0.14
Paid search clicks 0.40 0.50 0.13 0.05 0.00 0.03 0.40
Website visits 0.10 0.14 0.66 0.89 0.05 0.04 0.26
New likes 0.21 0.42 0.18 0.12 0.00 0.00 0.09
New unlikes 0.10 0.19 0.28 0.17 0.11 0.04 0.01
P-values 0.05 and below appear in bold face
6 Each equation requires estimation of 9 parameters (the intercept and 1lag of each endogenous variable). While we have 40 observations, weneed to use 1 to take first differences and 1 to include lags, leaving 38observations for parameter estimation.
J. of the Acad. Mark. Sci.
versus 12% for advertising awareness and brand considerationin Srinivasan et al. (2010). Affective online consumer metrics,in contrast, explain only 3% (earned media Facebook likesand unlikes) in our study, similar to the 4.5% effect of brandliking in Srinivasan et al.’s (2010) study.
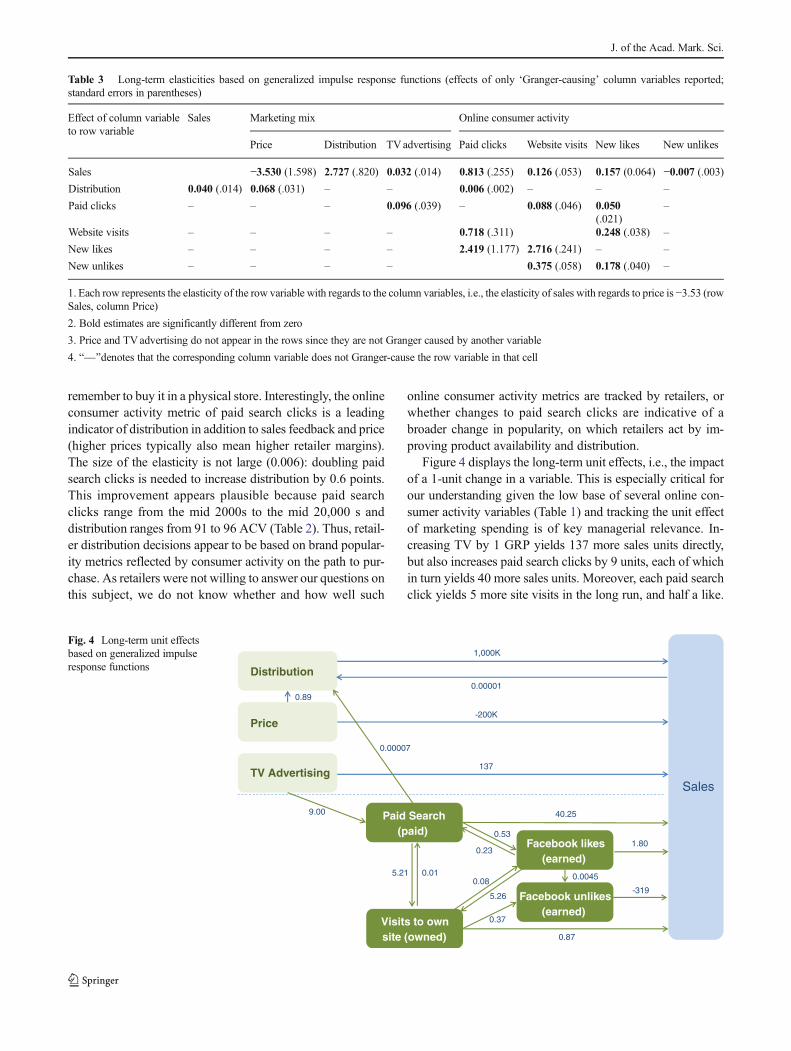
Based on the generalized impulse response functions, thelong-term elasticities of the Granger-causing variables aredisplayed in Table 3, and the long-term unit effects in Fig. 4.
In Table 3 (in the first row with estimates), the traditionalmarketing mix shows sales elasticities of −3.53 for price, 2.73for distribution and 0.03 for TVadvertising, each in line withempirical generalizations (e.g., Hanssens 2009; Tellis 2004).As to the new contribution of our study, the clicks elasticity ofTV advertising is 0.10 (see Table 3), indicating that doublingTV spending increases online consumer activity in the form
paid search clicks by 10% for the analyzed brand. Such animpact of offline marketing on online marketing has also beenconfirmed by related research (e.g., Li and Kannan 2014;Wiesel et al. 2011). These paid search clicks translate intoboosting the other two online consumer activity metrics aswell: site visits increase with an elasticity of 0.72, and paidsearch clicks and consumer site visits in turn have a highelasticity impact on engagement in the form of likes (2.42and 2.72 respectively). The reverse causality elasticities aresmaller, respectively 0.09, 0.05 and 0.25. Increased onlineconsumer activity is not all good news though: likes andweb site visits increase unlikes (elasticities of 0.18 and0.38), indicating that at least some people may be turned offby the brand’s campaign. Such differential social media reac-tions have been recently documented with Twitter data: posi-tive and negative tweets are strongly correlated in time(Pauwels and van Ewijk 2014). We find new evidence that(1) such disengagement significantly reduces company-widesales and (2) that higher consumer activity on paid and ownedmedia also leads to consumer disengagement in the form ofunlikes.
How do the online consumer activity metrics translate intosales volume changes? In terms of these online activity met-rics, paid search clicks have the highest elasticity (0.81),followed by likes (0.16), site visits (0.13) and unlikes(−0.01). These elasticities reflect the increase in sales as thenumber of clicks, the number of likes of the brand, the numberof site visits and the number of unlikes increase, respectively.As such, the estimates reflect the elasticity of sales to theseonline consumer activity metrics. The low elasticity of sitevisits is almost certainly linked to the nature of the analyzedproduct: the brand does not sell online, so consumers have toFig. 3 Variance decomposition of volume change, excluding sales inertia
Fig. 2 Explanatory power (R2
and adjusted R2) across models
J. of the Acad. Mark. Sci.
remember to buy it in a physical store. Interestingly, the onlineconsumer activity metric of paid search clicks is a leadingindicator of distribution in addition to sales feedback and price(higher prices typically also mean higher retailer margins).The size of the elasticity is not large (0.006): doubling paidsearch clicks is needed to increase distribution by 0.6 points.This improvement appears plausible because paid searchclicks range from the mid 2000s to the mid 20,000 s anddistribution ranges from 91 to 96 ACV (Table 2). Thus, retail-er distribution decisions appear to be based on brand popular-ity metrics reflected by consumer activity on the path to pur-chase. As retailers were not willing to answer our questions onthis subject, we do not know whether and how well such
online consumer activity metrics are tracked by retailers, orwhether changes to paid search clicks are indicative of abroader change in popularity, on which retailers act by im-proving product availability and distribution.
Figure 4 displays the long-term unit effects, i.e., the impactof a 1-unit change in a variable. This is especially critical forour understanding given the low base of several online con-sumer activity variables (Table 1) and tracking the unit effectof marketing spending is of key managerial relevance. In-creasing TV by 1 GRP yields 137 more sales units directly,but also increases paid search clicks by 9 units, each of whichin turn yields 40 more sales units. Moreover, each paid searchclick yields 5 more site visits in the long run, and half a like.
Table 3 Long-term elasticities based on generalized impulse response functions (effects of only ‘Granger-causing’ column variables reported;standard errors in parentheses)
Effect of column variableto row variable
Sales Marketing mix Online consumer activity
Price Distribution TVadvertising Paid clicks Website visits New likes New unlikes
Sales −3.530 (1.598) 2.727 (.820) 0.032 (.014) 0.813 (.255) 0.126 (.053) 0.157 (0.064) −0.007 (.003)
Distribution 0.040 (.014) 0.068 (.031) – – 0.006 (.002) – – –
Paid clicks – – – 0.096 (.039) – 0.088 (.046) 0.050(.021)
–
Website visits – – – – 0.718 (.311) 0.248 (.038) –
New likes – – – – 2.419 (1.177) 2.716 (.241) – –
New unlikes – – – – 0.375 (.058) 0.178 (.040) –
1. Each row represents the elasticity of the row variable with regards to the column variables, i.e., the elasticity of sales with regards to price is −3.53 (rowSales, column Price)
2. Bold estimates are significantly different from zero
3. Price and TVadvertising do not appear in the rows since they are not Granger caused by another variable
4. B—^denotes that the corresponding column variable does not Granger-cause the row variable in that cell
Paid Search (paid)
Facebook unlikes (earned)
SalesTV Advertising
Price
Distribution
Visits to own site (owned)
Facebook likes (earned)
1,000K
0.89
137
9.00
0.53
40.25
1.80
-319
0.87
0.00001
0.00007
5.21 0.01
0.23
0.37
0.0045
5.26
0.08
-200K
Fig. 4 Long-term unit effectsbased on generalized impulseresponse functions
J. of the Acad. Mark. Sci.
Especially strong in magnitude are the impact of a like on sitevisits (5.26) and of an unlike on sales (−319). The latter isunlikely to come from reduced purchases only of the personwho unliked the brand. Instead, we believe an unlike is part ofa larger problem of negative word-of-mouth for the brand.Thus, Bunearned^ media, similar to earned media, appears toserve as a useful proxy for general word-of-mouth behavior,which has proven difficult and/or expensive to track in itsentirety. Overall, by investigating the effects of online con-sumer activity metrics on consumer (dis)engagement in theform of (un)likes, we shed new light on consumer‘s path topurchase and off purchase journey.
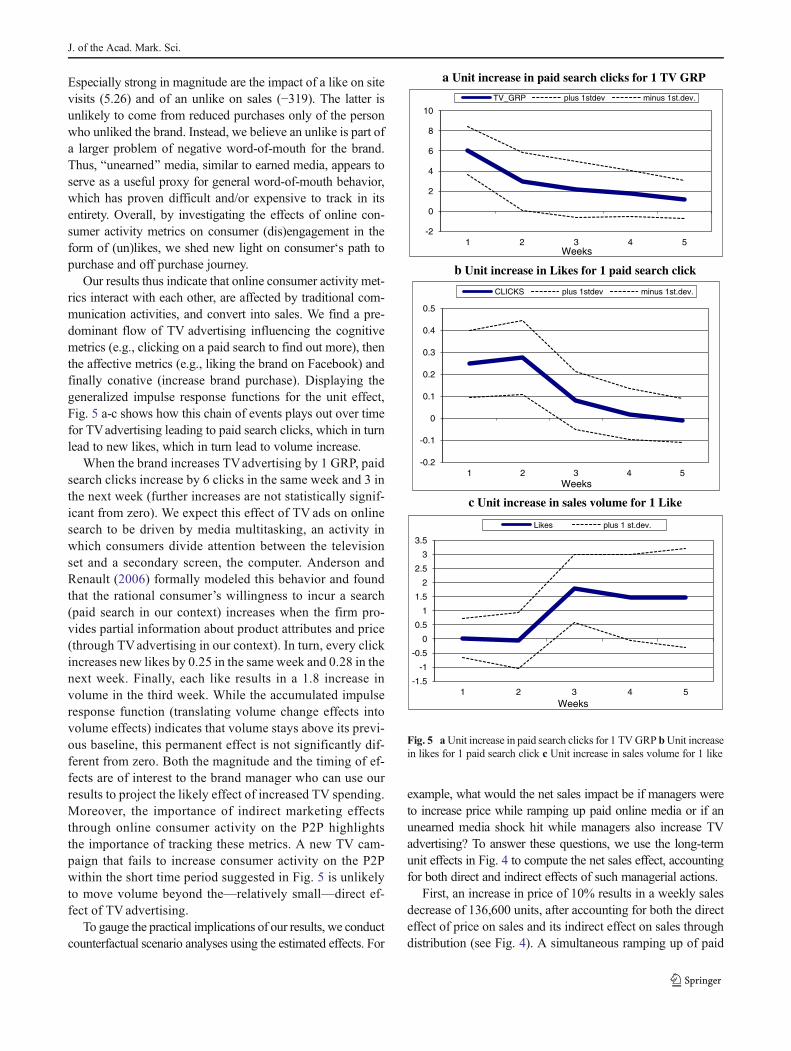
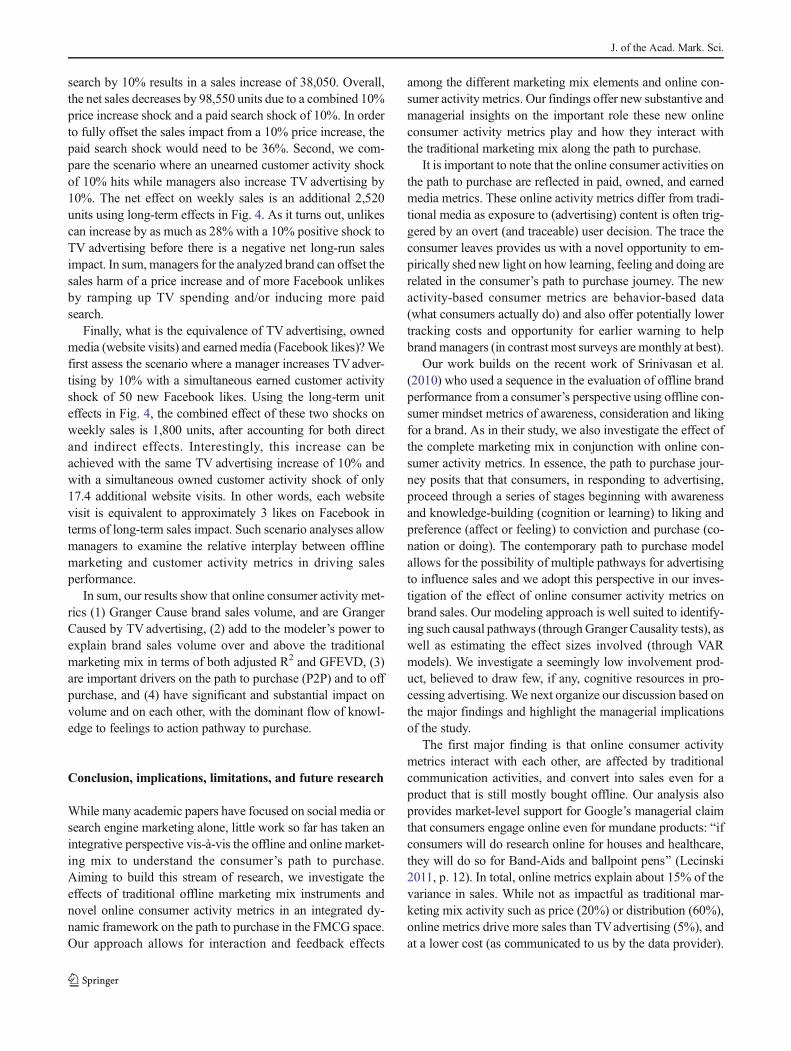
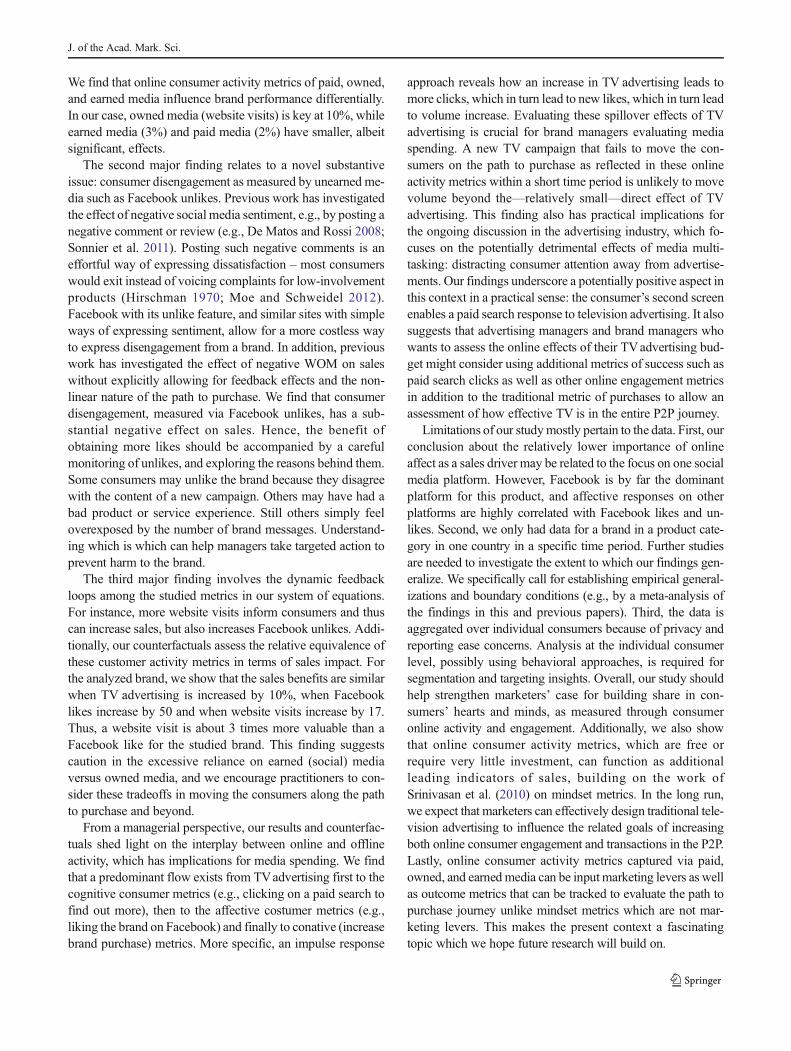
Our results thus indicate that online consumer activity met-rics interact with each other, are affected by traditional com-munication activities, and convert into sales. We find a pre-dominant flow of TV advertising influencing the cognitivemetrics (e.g., clicking on a paid search to find out more), thenthe affective metrics (e.g., liking the brand on Facebook) andfinally conative (increase brand purchase). Displaying thegeneralized impulse response functions for the unit effect,Fig. 5 a-c shows how this chain of events plays out over timefor TVadvertising leading to paid search clicks, which in turnlead to new likes, which in turn lead to volume increase.
When the brand increases TVadvertising by 1 GRP, paidsearch clicks increase by 6 clicks in the same week and 3 inthe next week (further increases are not statistically signif-icant from zero). We expect this effect of TV ads on onlinesearch to be driven by media multitasking, an activity inwhich consumers divide attention between the televisionset and a secondary screen, the computer. Anderson andRenault (2006) formally modeled this behavior and foundthat the rational consumer’s willingness to incur a search(paid search in our context) increases when the firm pro-vides partial information about product attributes and price(through TVadvertising in our context). In turn, every clickincreases new likes by 0.25 in the same week and 0.28 in thenext week. Finally, each like results in a 1.8 increase involume in the third week. While the accumulated impulseresponse function (translating volume change effects intovolume effects) indicates that volume stays above its previ-ous baseline, this permanent effect is not significantly dif-ferent from zero. Both the magnitude and the timing of ef-fects are of interest to the brand manager who can use ourresults to project the likely effect of increased TV spending.Moreover, the importance of indirect marketing effectsthrough online consumer activity on the P2P highlightsthe importance of tracking these metrics. A new TV cam-paign that fails to increase consumer activity on the P2Pwithin the short time period suggested in Fig. 5 is unlikelyto move volume beyond the—relatively small—direct ef-fect of TV advertising.
To gauge the practical implications of our results, we conductcounterfactual scenario analyses using the estimated effects. For
example, what would the net sales impact be if managers wereto increase price while ramping up paid online media or if anunearned media shock hit while managers also increase TVadvertising? To answer these questions, we use the long-termunit effects in Fig. 4 to compute the net sales effect, accountingfor both direct and indirect effects of such managerial actions.
First, an increase in price of 10% results in a weekly salesdecrease of 136,600 units, after accounting for both the directeffect of price on sales and its indirect effect on sales throughdistribution (see Fig. 4). A simultaneous ramping up of paid
a Unit increase in paid search clicks for 1 TV GRP
b Unit increase in Likes for 1 paid search click
c Unit increase in sales volume for 1 Like
-2
0
2
4
6
8
10
1 2 3 4 5
TV_GRP plus 1stdev minus 1st.dev.
-0.2
-0.1
0
0.1
0.2
0.3
0.4
0.5
1 2 3 4 5
CLICKS plus 1stdev minus 1st.dev.
-1.5
-1
-0.5
0
0.5
1
1.5
2
2.5
3
3.5
1 2 3 4 5
Likes plus 1 st.dev.
Weeks
Weeks
Weeks
Fig. 5 aUnit increase in paid search clicks for 1 TVGRP bUnit increasein likes for 1 paid search click c Unit increase in sales volume for 1 like
J. of the Acad. Mark. Sci.
search by 10% results in a sales increase of 38,050. Overall,the net sales decreases by 98,550 units due to a combined 10%price increase shock and a paid search shock of 10%. In orderto fully offset the sales impact from a 10% price increase, thepaid search shock would need to be 36%. Second, we com-pare the scenario where an unearned customer activity shockof 10% hits while managers also increase TV advertising by10%. The net effect on weekly sales is an additional 2,520units using long-term effects in Fig. 4. As it turns out, unlikescan increase by as much as 28% with a 10% positive shock toTV advertising before there is a negative net long-run salesimpact. In sum,managers for the analyzed brand can offset thesales harm of a price increase and of more Facebook unlikesby ramping up TV spending and/or inducing more paidsearch.
Finally, what is the equivalence of TV advertising, ownedmedia (website visits) and earnedmedia (Facebook likes)?Wefirst assess the scenario where a manager increases TVadver-tising by 10% with a simultaneous earned customer activityshock of 50 new Facebook likes. Using the long-term uniteffects in Fig. 4, the combined effect of these two shocks onweekly sales is 1,800 units, after accounting for both directand indirect effects. Interestingly, this increase can beachieved with the same TV advertising increase of 10% andwith a simultaneous owned customer activity shock of only17.4 additional website visits. In other words, each websitevisit is equivalent to approximately 3 likes on Facebook interms of long-term sales impact. Such scenario analyses allowmanagers to examine the relative interplay between offlinemarketing and customer activity metrics in driving salesperformance.
In sum, our results show that online consumer activity met-rics (1) Granger Cause brand sales volume, and are GrangerCaused by TVadvertising, (2) add to the modeler’s power toexplain brand sales volume over and above the traditionalmarketing mix in terms of both adjusted R2 and GFEVD, (3)are important drivers on the path to purchase (P2P) and to offpurchase, and (4) have significant and substantial impact onvolume and on each other, with the dominant flow of knowl-edge to feelings to action pathway to purchase.
Conclusion, implications, limitations, and future research
While many academic papers have focused on social media orsearch engine marketing alone, little work so far has taken anintegrative perspective vis-à-vis the offline and online market-ing mix to understand the consumer’s path to purchase.Aiming to build this stream of research, we investigate theeffects of traditional offline marketing mix instruments andnovel online consumer activity metrics in an integrated dy-namic framework on the path to purchase in the FMCG space.Our approach allows for interaction and feedback effects
among the different marketing mix elements and online con-sumer activity metrics. Our findings offer new substantive andmanagerial insights on the important role these new onlineconsumer activity metrics play and how they interact withthe traditional marketing mix along the path to purchase.
It is important to note that the online consumer activities onthe path to purchase are reflected in paid, owned, and earnedmedia metrics. These online activity metrics differ from tradi-tional media as exposure to (advertising) content is often trig-gered by an overt (and traceable) user decision. The trace theconsumer leaves provides us with a novel opportunity to em-pirically shed new light on how learning, feeling and doing arerelated in the consumer’s path to purchase journey. The newactivity-based consumer metrics are behavior-based data(what consumers actually do) and also offer potentially lowertracking costs and opportunity for earlier warning to helpbrand managers (in contrast most surveys are monthly at best).
Our work builds on the recent work of Srinivasan et al.(2010) who used a sequence in the evaluation of offline brandperformance from a consumer’s perspective using offline con-sumer mindset metrics of awareness, consideration and likingfor a brand. As in their study, we also investigate the effect ofthe complete marketing mix in conjunction with online con-sumer activity metrics. In essence, the path to purchase jour-ney posits that that consumers, in responding to advertising,proceed through a series of stages beginning with awarenessand knowledge-building (cognition or learning) to liking andpreference (affect or feeling) to conviction and purchase (co-nation or doing). The contemporary path to purchase modelallows for the possibility of multiple pathways for advertisingto influence sales and we adopt this perspective in our inves-tigation of the effect of online consumer activity metrics onbrand sales. Our modeling approach is well suited to identify-ing such causal pathways (throughGranger Causality tests), aswell as estimating the effect sizes involved (through VARmodels). We investigate a seemingly low involvement prod-uct, believed to draw few, if any, cognitive resources in pro-cessing advertising. We next organize our discussion based onthe major findings and highlight the managerial implicationsof the study.
The first major finding is that online consumer activitymetrics interact with each other, are affected by traditionalcommunication activities, and convert into sales even for aproduct that is still mostly bought offline. Our analysis alsoprovides market-level support for Google’s managerial claimthat consumers engage online even for mundane products: Bifconsumers will do research online for houses and healthcare,they will do so for Band-Aids and ballpoint pens^ (Lecinski2011, p. 12). In total, online metrics explain about 15% of thevariance in sales. While not as impactful as traditional mar-keting mix activity such as price (20%) or distribution (60%),online metrics drive more sales than TVadvertising (5%), andat a lower cost (as communicated to us by the data provider).
J. of the Acad. Mark. Sci.
We find that online consumer activity metrics of paid, owned,and earned media influence brand performance differentially.In our case, owned media (website visits) is key at 10%, whileearned media (3%) and paid media (2%) have smaller, albeitsignificant, effects.
The second major finding relates to a novel substantiveissue: consumer disengagement as measured by unearned me-dia such as Facebook unlikes. Previous work has investigatedthe effect of negative social media sentiment, e.g., by posting anegative comment or review (e.g., De Matos and Rossi 2008;Sonnier et al. 2011). Posting such negative comments is aneffortful way of expressing dissatisfaction – most consumerswould exit instead of voicing complaints for low-involvementproducts (Hirschman 1970; Moe and Schweidel 2012).Facebook with its unlike feature, and similar sites with simpleways of expressing sentiment, allow for a more costless wayto express disengagement from a brand. In addition, previouswork has investigated the effect of negative WOM on saleswithout explicitly allowing for feedback effects and the non-linear nature of the path to purchase. We find that consumerdisengagement, measured via Facebook unlikes, has a sub-stantial negative effect on sales. Hence, the benefit ofobtaining more likes should be accompanied by a carefulmonitoring of unlikes, and exploring the reasons behind them.Some consumers may unlike the brand because they disagreewith the content of a new campaign. Others may have had abad product or service experience. Still others simply feeloverexposed by the number of brand messages. Understand-ing which is which can help managers take targeted action toprevent harm to the brand.
The third major finding involves the dynamic feedbackloops among the studied metrics in our system of equations.For instance, more website visits inform consumers and thuscan increase sales, but also increases Facebook unlikes. Addi-tionally, our counterfactuals assess the relative equivalence ofthese customer activity metrics in terms of sales impact. Forthe analyzed brand, we show that the sales benefits are similarwhen TV advertising is increased by 10%, when Facebooklikes increase by 50 and when website visits increase by 17.Thus, a website visit is about 3 times more valuable than aFacebook like for the studied brand. This finding suggestscaution in the excessive reliance on earned (social) mediaversus owned media, and we encourage practitioners to con-sider these tradeoffs in moving the consumers along the pathto purchase and beyond.
From a managerial perspective, our results and counterfac-tuals shed light on the interplay between online and offlineactivity, which has implications for media spending. We findthat a predominant flow exists from TVadvertising first to thecognitive consumer metrics (e.g., clicking on a paid search tofind out more), then to the affective costumer metrics (e.g.,liking the brand on Facebook) and finally to conative (increasebrand purchase) metrics. More specific, an impulse response
approach reveals how an increase in TV advertising leads tomore clicks, which in turn lead to new likes, which in turn leadto volume increase. Evaluating these spillover effects of TVadvertising is crucial for brand managers evaluating mediaspending. A new TV campaign that fails to move the con-sumers on the path to purchase as reflected in these onlineactivity metrics within a short time period is unlikely to movevolume beyond the—relatively small—direct effect of TVadvertising. This finding also has practical implications forthe ongoing discussion in the advertising industry, which fo-cuses on the potentially detrimental effects of media multi-tasking: distracting consumer attention away from advertise-ments. Our findings underscore a potentially positive aspect inthis context in a practical sense: the consumer’s second screenenables a paid search response to television advertising. It alsosuggests that advertising managers and brand managers whowants to assess the online effects of their TVadvertising bud-get might consider using additional metrics of success such aspaid search clicks as well as other online engagement metricsin addition to the traditional metric of purchases to allow anassessment of how effective TV is in the entire P2P journey.
Limitations of our studymostly pertain to the data. First, ourconclusion about the relatively lower importance of onlineaffect as a sales driver may be related to the focus on one socialmedia platform. However, Facebook is by far the dominantplatform for this product, and affective responses on otherplatforms are highly correlated with Facebook likes and un-likes. Second, we only had data for a brand in a product cate-gory in one country in a specific time period. Further studiesare needed to investigate the extent to which our findings gen-eralize. We specifically call for establishing empirical general-izations and boundary conditions (e.g., by a meta-analysis ofthe findings in this and previous papers). Third, the data isaggregated over individual consumers because of privacy andreporting ease concerns. Analysis at the individual consumerlevel, possibly using behavioral approaches, is required forsegmentation and targeting insights. Overall, our study shouldhelp strengthen marketers’ case for building share in con-sumers’ hearts and minds, as measured through consumeronline activity and engagement. Additionally, we also showthat online consumer activity metrics, which are free orrequire very little investment, can function as additionalleading indicators of sales, building on the work ofSrinivasan et al. (2010) on mindset metrics. In the long run,we expect that marketers can effectively design traditional tele-vision advertising to influence the related goals of increasingboth online consumer engagement and transactions in the P2P.Lastly, online consumer activity metrics captured via paid,owned, and earnedmedia can be inputmarketing levers as wellas outcome metrics that can be tracked to evaluate the path topurchase journey unlike mindset metrics which are not mar-keting levers. This makes the present context a fascinatingtopic which we hope future research will build on.
J. of the Acad. Mark. Sci.
Acknowledgment The authors thank Google WPP for supporting thiswork with data and funding and Randy Bucklin for insightful commentsand suggestions.
References
Achrol, R. S., & Kotler, P. (2011). Frontiers of the marketing paradigm inthe third millennium. Journal of the Academy of Marketing Science,40, 35–52.
Ambler, T. (2003).Marketing and the bottom line. Harlow: Prentice Hall.Anderson, S. P., & Renault, R. (2006). Advertising content. The
American Economic Review, 39(1), 305–326.Benkwitz, A., Lutkepohl, H., & Wolters, J. (2001). Comparison of boot-
strap confidence intervals for impulse responses of German mone-tary systems. Macroeconomic Dynamics, 5, 81–100.
Comscore (2014). http://www.comscore.com/Insights/Press-Releases/2014/3/comScore-Releases-February-2014-U.S.-Search-Engine-Rankings. Accessed Nov 2014.
Court, D., Elzinga, D., Mulder, S., &Vetvik, O.J. (2009). The ConsumerDecision Journey. McKinsey Quarterly, June.
Danaher, P. J., & Dagger, T. S. (2013). Comparing the relative effective-ness of advertising channels: a case study of a multimedia blitzcampaign. Journal of Marketing Research, 50(4), 517–534.
De Matos, C. A., & Rossi, C. A. V. (2008). Word-of-mouth communica-tions in marketing: a meta-analytic review of the antecedents andmoderators. Journal of the Academy of Marketing Science, 36, 578–596.
Dekimpe, M.G., & Hanssens, D.M. (1995). Empirical GeneralizationsAbout Market Evolution and Stationarity. Marketing Science, 14-(summer, part 2), 109–121.
Dekimpe, M. G., & Hanssens, D. M. (1999). Sustained spending andpersistent response: A new look at long-termmarketing profitability.Journal of Marketing Research, 36(4), 397-412.
Evans, L., & Wells, G. M. (1983). An alternative approach to simulatingVAR models. Economic Letters, 12(1), 23–29.
Godes, D., Mayzlin, D., Chen, Y., Das, S., Dellarocas, C., Pfeiffer, B.,Libai, B., Sen, S., Shi,M., &Verlegh, P. (2005). Firm’s managementof social interactions. Marketing Letters, 16(3/4), 415–428.
Hanssens, D.M. (2009). Advertising Impact Generalizations in aMarketing Mix Context. Journal of Advertising Research, June,127–129.
Hanssens, D.M., Parsons, L.J., & Schultz, R.L. (2001).Market ResponseModels: Econometric and Time Series Analysis. 2nd Edition,Kluwer Academic Publishers.
Hanssens, D., Pauwels, K., Srinivasan, S., Vanhuele, M., & Yildirim, G.(2014). Consumer attitude metrics for guiding marketing Mix deci-sions. Marketing Science, 33(4), 534–550.
Hirschman, A. O. (1970).Organizations, and States. Harvard: Universitypress. Exit, Voice, and Loyalty: Responses to Decline in Firms.
Horváth, C. (2003). Dynamic Analysis of Marketing Systems. DoctoralThesis, University of Groningen, Alblasserdam: LabyrinthPublication.
Internet Live Stats (2014). http://www.internetlivestats.com/google-search-statistics/. Accessed Nov 2014.
Keller, K., & Lehmann, D. (2006). Brands and Branding: ResearchFindings and Future Priorities. Marketing Science, 25(November-December), 740–759.
Kotler, P., & Keller, K. (2012).Marketing management (14th ed.). UpperSaddle: Pearson Prentice-Hall.
Lautman, M. R., & Pauwels, K. (2009). What is important? identifyingmetrics that matter. Journal of Advertising Research, 49(3), 339–359.
Lecinski , J . (2011) . Zero Moment of Truth . http: / /www.zeromomentoftruth.com. Accessed 2014.
Li, H., & Kannan, P. K. (2014). Attributing conversions in a multichannelonline marketing environment: an empirical model and a field ex-periment. Journal of Marketing Research, 51(1), 40–56.
Moe, W., & Schweidel, D. (2012). Online product opinions: Incidence,evaluation, and evolution. Marketing Science, 31(3), 372–386.
Naik, P., & Peters, K. (2009). A hierarchical marketing communicationsmodel of online and offline media synergies. Journal of InteractiveMarketing, 23(4), 288–299.
Nielsen (2012). State of the Media: Advertising and Audience Part 2.http://nielsen.com/content/dam/corporate/us/en/reports-downloads/2012-Reports/nielsen-advertising-audiences-report-spring-2012.pdf. Accessed April 2014.
Ofcom (2013). Communications Market Report 2013. White paper.Onishi, H., & Manchanda, P. (2012). Marketing activity, blogging, and
sales. International Journal of Research in Marketing, 29(3), 221–234.
Pauwels, K., & Hanssens, D. M. (2007). Performance regimes and mar-keting policy shifts. Marketing Science, 26(3), 293–311.
Pauwels, K., & van Ewijk, B. (2014). Do Online Behavior Tracking orAttitude Survey Metrics Drive Brand Sales? An Integrative Modelof Attitudes and Actions on the Consumer Boulevard. MarketingScience Institute, Working Paper #13-118.
Pauwels, K., & Weiss, A. M. (2008). Moving from free to Fee: Howmarketing can stimulate gains and stem losses for an online contentprovider. Journal of Marketing, 72(3), 14–31.
Pesaran,M. H., & Shin, Y. (1998). Generalized impulse response analysisin linear multivariate models. Economics Letters, 58, 17–29.
Sonnier, G. P., McAlister, L., & Rutz, O. J. (2011). A dynamic model ofthe effect of online communications on firm sales. MarketingScience, 30(4), 702–716.
Srinivasan, S., Vanhuele, M., & Pauwels, K. (2010). Mind-set metrics inmarket response models: an integrative approach. Journal ofMarketing Research, 47(4), 672–684.
Stephen, A. T., & Galak, J. (2012). The effect of traditional and socialearned media on sales: an application to a microlending market-place. Journal of Marketing Research, 49(5), 624–639.
Tellis, G. (2004). Effective advertising: How, when, and Why advertisingworks. Thousand Oaks: Sage Publications.
Trusov, M., Bucklin, R. E., & Pauwels, K. (2009). Effects of word-of-mouth versus traditional marketing: findings from an internet socialnetworking site. Journal of Marketing, 73(September), 90–102.
Vakratsas, D., & Ambler, T. (1999). How advertising works: what DoWereally know? Journal of Marketing, 63(January), 26–43.
Wiesel, T., Pauwels, K., & Arts, J. (2011). Marketing’s profit impact:quantifying online and Off-line funnel progression. MarketingScience, 30(4), 604–611.
Zephoria (2014). https://zephoria.com/social-media/top-15-valuable-facebook-statistics/. Accessed Nov 2014.
Zigmond, D., & Stipp, H. (2011). Multitaskers may be advertisers’ bestaudience. Harvard Business Review, 12(1/2), 32–33.
J. of the Acad. Mark. Sci.