Embed Size (px)
Citation preview

Ashling Product Brief APB213 PathFinder-XD for MIPS support for Broadcom On-chip Trace
Page 1 of 56
Ashling Product Brief APB213 v.0.1.7, 10th January 2013
PathFinder-XD for MIPS™ support for Broadcom
Devices
Contents 1. Introduction 3 2. Installation 3
2.1 PathFinder-XD Windows™ Installation 3 2.2 PathFinder-XD Linux Installation 3 2.3 Opella-XD USB Driver Installation 3
2.3.1 Windows™ USB Driver Installation 3 2.3.2 Linux x86 USB Driver Installation 3
2.3.2.1 Ubuntu/Debian libusb installation 4 2.3.2.2 Fedora/other distribution libusb installations 4 2.3.2.3 Setting permissions 4
3. Debugging with PathFinder-XD 4 3.1 Connecting Opella-XD to the Target 5
3.1.1 Verifying Opella-XD is properly connected to your host PC 5 3.2 Using PathFinder-XD 5
3.2.1 Getting started/configuring PathFinder-XD 5 3.2.2 Downloading your program to the target 8 3.2.3 Controlling program execution/using breakpoints 10 3.2.4 File Browser 12 3.2.5 Watching program variables 15 3.2.6 Viewing memory 16 3.2.7 Viewing registers 17 3.2.8 Using the console 17 3.2.9 Viewing the Translation Lookaside Buffer (TLB) 18 3.2.10 Viewing cache 19
4. Multi-core support 21 4.1.1 Multi-core configuration 21 4.1.2 Debugging multiple cores simultaneously 22 4.1.3 Examining individual core context 22 4.1.4 Pin and clone support 22
5. Trace support 23 5.1 Enable/configure trace 23 5.2 Viewing trace 26 5.3 Saving trace 27 5.4 Known issues with trace 28
6. Embedded Linux debugging support 28 6.1 Hardware Setup 28
6.1.1 Connect 20 Software Development Platform Setup for Embedded Linux debugging 29 6.1.2 Setting up Putty 29 6.1.3 Setting up network between host and target 30 Note: If ping fails, then please recheck your host computer IP settings and your firewall. 31 6.1.4 Installing TFTP Server on the host PC 32 6.1.5 Loading the Linux Image using TFTP 32
6.2 Preparing for debugging 33 6.2.1 Building with debug symbols 33 6.2.2 On-demand paging (for stop-mode debugging only) 34
6.3 Stop-mode Debugging 34 6.3.1 Sample Stop-mode Linux Debugging Session 34
6.3.1.1 Loading kernel symbol information to PathFinder-XD 38 6.3.1.2 Debug a module from init_module() 41 6.3.1.3 Debugging a process from main() 44 6.3.1.4 Debugging a running process 45 6.3.1.5 Library debugging 46
6.4 Run-mode Debugging 46

Ashling Product Brief APB213 Page 2 of 56
6.4.1 Sample Run-mode Linux Debugging Session 46 6.4.2 Copying the necessary files to the target 46 6.4.3 Debugging the Module and Process 46
6.5 Application specific hardware breakpoint 52 6.6 Known Issues in SMP Linux Debugging 56
7. Conclusion 56

Ashling Product Brief APB213 Page 3 of 56
1. Introduction This Ashling Product Brief describes how to use Ashling’s PathFinder-XD source-level debugger (v1.0.6 or later) and the Opella-XD debug probe with Broadcom BMIPS5000 devices which support On-chip Trace (Zephyr) such as the BCM742xx family PathFinder-XD is a C/C++/Assembly debugger based on the Eclipse framework and supports debugging using the QEMU software simulator (www.qemu.org) or the Ashling Opella-XD Debug Probe connected to MIPS™ powered target hardware. PathFinder-XD supports both “bare-metal” (no target operating system) and Embedded Linux based debugging. The Ashling Opella-XD as shown below is an entry-level Debug Probe for the MIPS family which connects to the host PC via a USB2.0 HS interface. Opella-XD uses the MIPS EJTAG core extension to provide a comprehensive set of debug features and supports all EJTAG versions from 2.0 onwards.
Figure 1. The Ashling Opella-XD Debug Probe
2. Installation PathFinder-XD can be hosted under Windows™ or x86 based Linux and installation requires full administrative privileges.
2.1 PathFinder-XD Windows™ Installation Run the SETUP.EXE program from the Windows directory on the supplied CD (or download) and follow the on-
screen instructions. Windows XP, Vista and 7 are supported (32-bit and 64-bit versions)
2.2 PathFinder-XD Linux Installation Run the ./SETUP32 (32-bit Linux) or ./SETUP64 (64-bit Linux) program from the supplied CD (or download) and
follow the on-screen instructions. PathFinder-XD for MIPS is tested on the following Linux platforms:
Fedora 13/Ubuntu 10.04 LTS 32-bit/64-bit versions
Please note that the 64-bit Linux version of PathFinder-XD for MIPS requires the 32-bit library package ia32-libs
library, hence, make sure this is installed in your system. For example, to install on Ubuntu/Debian, issue the following command: > $sudo apt-get install ia32-libs
2.3 Opella-XD USB Driver Installation
2.3.1 Windows™ USB Driver Installation When you first connect Opella-XD to your PC you will get a New USB hardware found message and will be prompted to install the appropriate USB drivers. The Ashling Opella-XD drivers are supplied on your Ashling CD and installed in your installation directory. Direct the Windows Hardware Installation Wizard to your installation directory so that it can locate the necessary drivers and complete the installation. Windows only needs to perform this
operation the first time you connect your Opella-XD to the PC. The Opella-XD USB driver is called libusb0.sys
(libusb0_x64.sys for 64-bit operating systems).
2.3.2 Linux x86 USB Driver Installation Opella-XD uses the libusb driver (http://libusb.sourceforge.net/). By default, the driver is stored in: /usr/lib
Check for this as follows: $ ls /usr/lib/libusb* /usr/include/usb.h
Ashling Product Brief APB213 Page 4 of 56
If you see /usr/include/usb.h and libusb-0.1.so.4.4.0 or higher, then they are installed on your system
and you can skip the next section on libusb installation
Please note: If /usr/lib/libusb directory does not include a file titled libusb.so (exact filename), then create
a symlink as follows:
$ln -s /usr/lib/libusb-0.1.so.4.4.0 /usr/lib/libusb.so
2.3.2.1 Ubuntu/Debian libusb installation
Install libusb using the following command: $ sudo apt-get install libusb-dev
If /usr/lib/libusb directory does not include a file titled libusb.so (exact filename), then create a symlink as
follows:
$ln -s /usr/lib/libusb-0.1.so.4.4.0 /usr/lib/libusb.so
2.3.2.2 Fedora/other distribution libusb installations
Download the latest libusb from http://libusb.sourceforge.net/ and install as follows: $ tar zxf libusb-0.1.12.tar.gz (use appropriate version number)
$ ./configure --prefix=/usr
$ make
$ make install
If /usr/lib/libusb directory does not include a file titled libusb.so (exact filename), then create a symlink as
follows:
$ln -s /usr/lib/libusb-0.1.so.4.4.0 /usr/lib/libusb.so
2.3.2.3 Setting permissions
1. Ensure that Opella-XD is connected to the PC, connected to the target and that the target is powered.
2. To ensure the current $USER has access to the Opella-XD device, we recommend using the Linux utility udev
(requires kernel 2.6 or later).
3. Ensure udev is installed and running on your system by checking for the udev daemon process (udevd) e.g.: $ ps –aef | grep udev
4. Create an udev rules file to uniquely identify the Opella-XD device and set permissions as required by owner/
groups. An example udev file is supplied (60-ashling.rules) which identifies Opella-XD device (by Ashling’s
USB Product ID and Vendor ID).
5. The rules file must then be copied into the rules directory (requires root permission) e.g.: $ sudo cp ./60-ashling.rules /etc/udev/rules.d
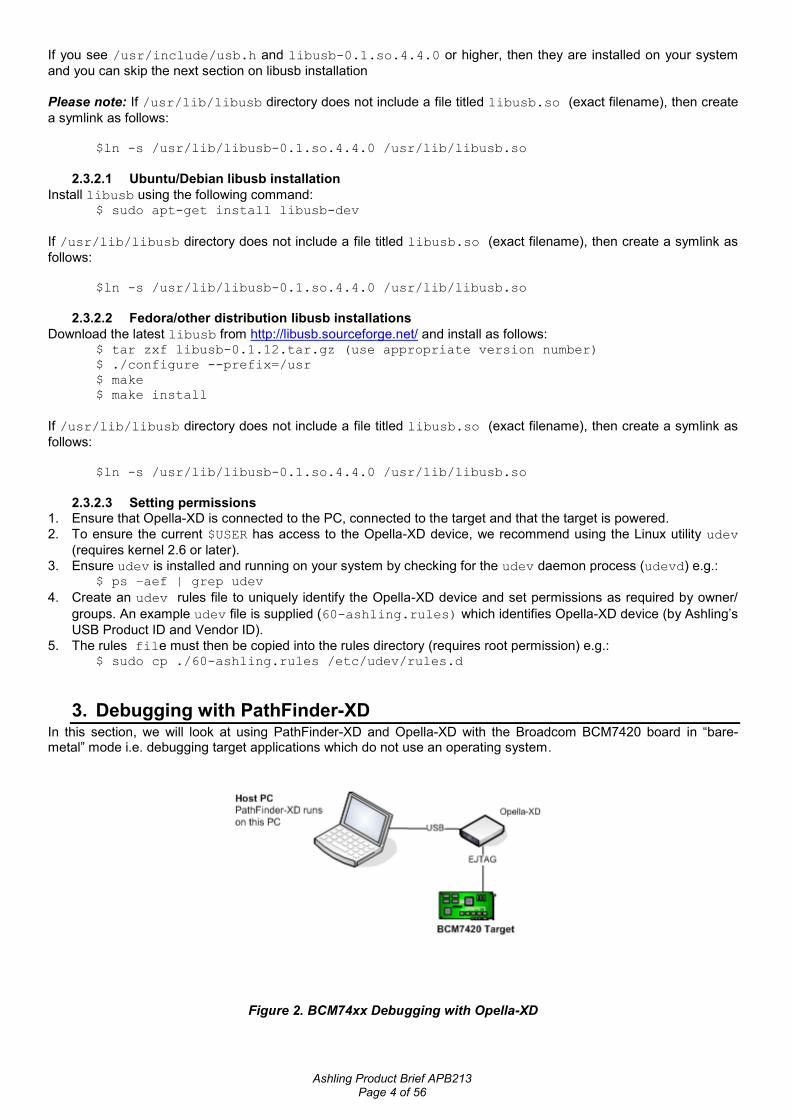
3. Debugging with PathFinder-XD In this section, we will look at using PathFinder-XD and Opella-XD with the Broadcom BCM7420 board in “bare-metal” mode i.e. debugging target applications which do not use an operating system.
Figure 2. BCM74xx Debugging with Opella-XD

Ashling Product Brief APB213 Page 5 of 56
3.1 Connecting Opella-XD to the Target Opella-XD is designed to connect to your PC via the USB cable, and your target via the supplied EJTAG cable. Pin 1 of the Ashling EJTAG Cable Connector is clearly identified by a on the connector; this should mate with pin 1 on your target’s EJTAG connector. Please note the following recommended target connection sequence:
1. Ensure your target is powered off. 2. Connect Opella-XD to your PC using the supplied USB cable and ensure Opella-XD’s Power LED is on. 3. Connect Opella-XD to your target using the supplied EJTAG cable. 4. Power up your target.
3.1.1 Verifying Opella-XD is properly connected to your host PC PathFinder-XD is supplied with an Opella-XD diagnostic command-line executable (“OPXDDAIG.exe” for Windows
and “OPXDDIAG.” for GNU/Linux x86). OPXDDIAG is run from a command-shell and can be used to test and verify
your Opella-XD is installed and working correctly (including the USB driver) . To run all tests, enter: opxddiag --diag 1
Running with-out any parameters displays all available options opxddiag
3.2 Using PathFinder-XD
3.2.1 Getting started/configuring PathFinder-XD
1. To get started, run PathFinder-XD 2. PathFinder-XD will then load. If this is your first-time running, then you will be prompted to specify your
Workspace (default directory for projects etc). Accept the default which is located in PathFinder-XD’s installation directory.
In PathFinder-XD, create a New Target Configuration via the Target
menu:
Figure 3. Target Configuration
and select the Debug using Debug Probe option as shown below:

Ashling Product Brief APB213 Page 6 of 56
Figure 4. Debug using Debug Probe
3. Click Next to configure Opella-XD settings as shown below:
Figure 5. Probe selection
Settings include:
Probe type: The actual Ashling Debug Probe Type to use as the target connection. Select Opella-XD.
Serial number: The serial number of the Debug Probe to use. Specify the serial number or use first found and click on Next.

Ashling Product Brief APB213 Page 7 of 56
Figure 6. Debug probe configuration
The Debug probe configuration settings include:
MIPS device: specifies the MIPS device type you wish to debug. In this example, Broadcom BMIPS5000 is selected.
JTAG frequency: specifies the JTAG TCK frequency to be used for communicating with the EJTAG interface on your MIPS device.
Initial target byte order: allows you to specify the memory Endianess of your target system.
User register settings file: group allows you to initialise other registers or memory locations on PathFinder-XD invocation and after reset. The Browse… button allows these register values to be loaded from a simple text file. The text file format is:
Name Size Address Value
(all values are in HEX). For example, the following text file initialises the R0, R1, R2 and R3 registers: R0 0x00000004 0xb800380c 0x18000000
R1 0x00000004 0xb8003808 0x00000006
R2 0x00000004 0xb8004018 0x00000800
R3 0x00000004 0xb800401c 0x0000000c
Disable interrupts during single step: allows you to disable interrupts when single stepping at assembly level (MIPS instruction level). When checked, PathFinder-XD automatically disables interrupts prior to an assembly level single step and re-enables them after the single step is complete.
Enable DMA Mode: enables DMA mode for high-speed transfer between the debug probe and your target. DMA Mode is only available on systems with EJTAG DMA support.
Single step using software breakpoint: allows you to specify that PathFinder-XD should use software breakpoints for single-stepping (i.e. PathFinder-XD should not use the EJTAG hardware based single-step command).
Halt counters in debug mode: allows you tell PathFinder-XD to halt the MIPS Count register(s) (via writing to the Configuration register) whenever your program is halted. There is a slight delay between your program halting and the write to the Configuration register. Note that the Registers window always shows your application values for the Configuration register.
Ashling Product Brief APB213 Page 8 of 56
Issue no reset on connection: will ensure no hardware reset is issued when you connect to your target (note that this feature requires updated Opella-XD firmware (v1.1.1 or later) which is supplied with PathFinder-XD v1.0.6 or later).
Issue EJTAGBOOT on connection: will issue a hardware reset and halt the target at the reset location.
Issue hard reset and wait ‘N’ ms before entering debug mode: will issue a hardware reset and wait the specified number of ms before entering debug mode. This mode is also known as NORMALBOOT.
Multi-core: allows you to select the core you wish to debug for multi-core devices. The BCM7420 device has two cores (or hardware threads) and the first one (TAP-0) is chosen in this example. Section 4 Multi-core support explains the remaining parameters of Multi-core.
The settings shown are suitable for the BCM7420 target board. Click Finish when done.
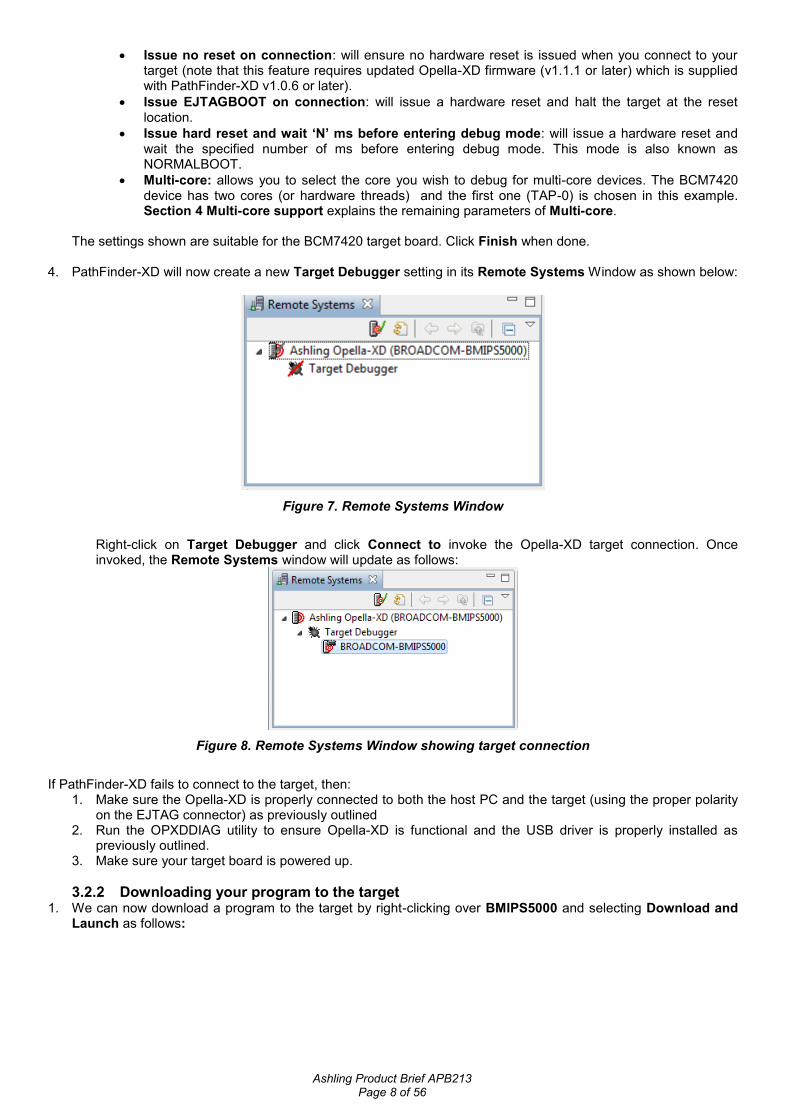
4. PathFinder-XD will now create a new Target Debugger setting in its Remote Systems Window as shown below:
Figure 7. Remote Systems Window
Right-click on Target Debugger and click Connect to invoke the Opella-XD target connection. Once invoked, the Remote Systems window will update as follows:
Figure 8. Remote Systems Window showing target connection
If PathFinder-XD fails to connect to the target, then:
1. Make sure the Opella-XD is properly connected to both the host PC and the target (using the proper polarity on the EJTAG connector) as previously outlined
2. Run the OPXDDIAG utility to ensure Opella-XD is functional and the USB driver is properly installed as previously outlined.
3. Make sure your target board is powered up.
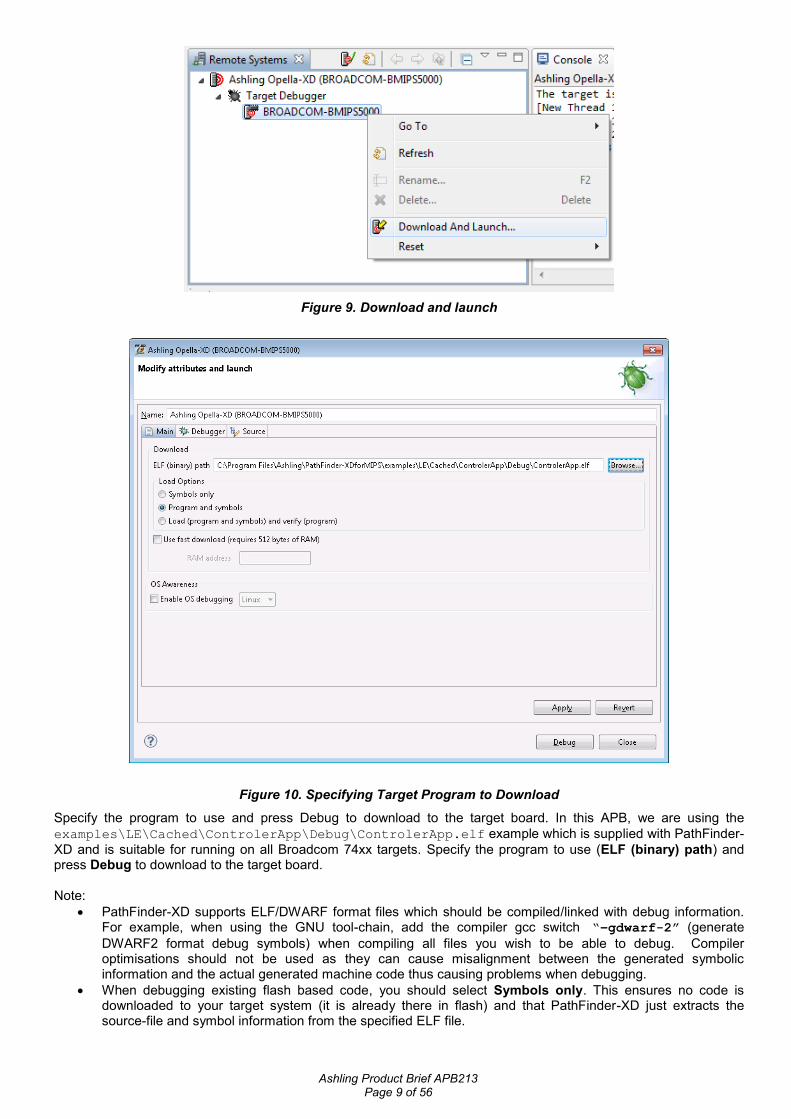
3.2.2 Downloading your program to the target 1. We can now download a program to the target by right-clicking over BMIPS5000 and selecting Download and
Launch as follows:
Ashling Product Brief APB213 Page 9 of 56
Figure 9. Download and launch
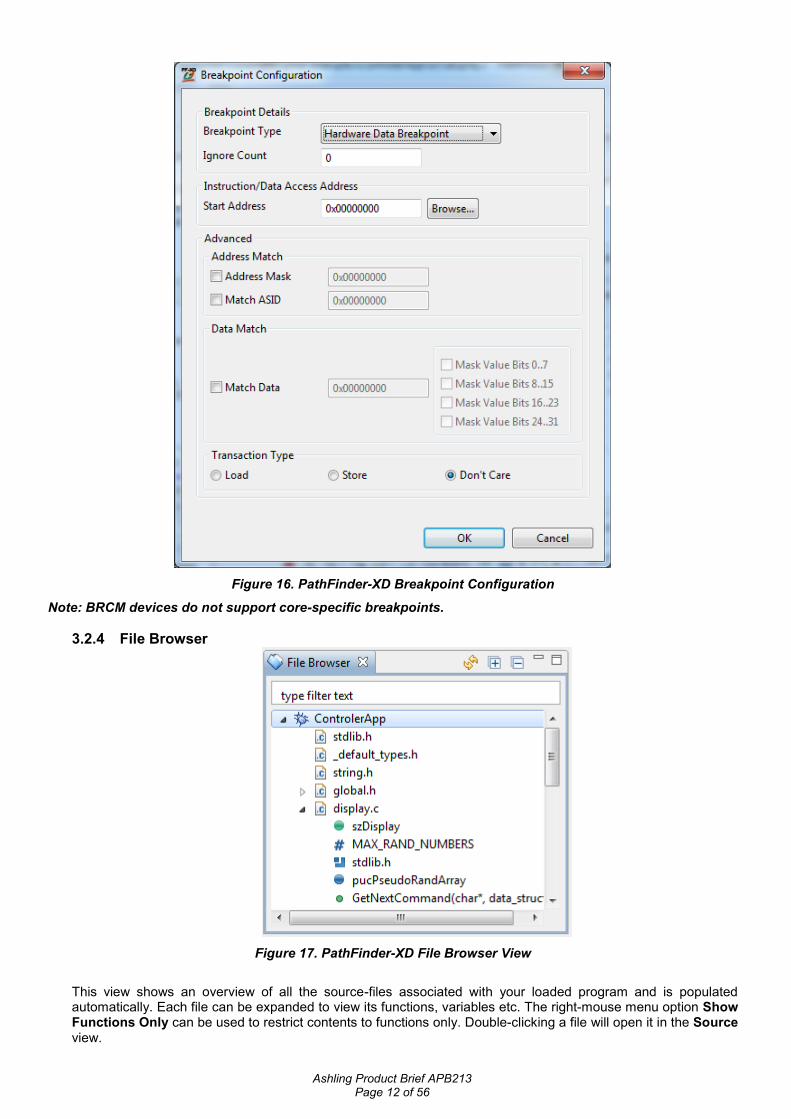
Figure 10. Specifying Target Program to Download
Specify the program to use and press Debug to download to the target board. In this APB, we are using the
examples\LE\Cached\ControlerApp\Debug\ControlerApp.elf example which is supplied with PathFinder-
XD and is suitable for running on all Broadcom 74xx targets. Specify the program to use (ELF (binary) path) and press Debug to download to the target board. Note:
PathFinder-XD supports ELF/DWARF format files which should be compiled/linked with debug information. For example, when using the GNU tool-chain, add the compiler gcc switch “–gdwarf-2” (generate
DWARF2 format debug symbols) when compiling all files you wish to be able to debug. Compiler optimisations should not be used as they can cause misalignment between the generated symbolic information and the actual generated machine code thus causing problems when debugging.
When debugging existing flash based code, you should select Symbols only. This ensures no code is downloaded to your target system (it is already there in flash) and that PathFinder-XD just extracts the source-file and symbol information from the specified ELF file.

Ashling Product Brief APB213 Page 10 of 56
When downloading program and symbols, you can verify that target memory matches the original ELF file code contents by choosing the Load (program and symbols) and verify (program) option, however, note that this option increases the overall time due to the verification step.
Use fast download… will improve your overall program download time, however, it requires that PathFinder-XD download and use a small 512 byte helper-routine to target RAM at the address specified. Make sure you chose a suitable 512 byte RAM location that is not used by your application, as PathFinder-XD does not preserve contents.
2. PathFinder-XD will now download the program and update its Windows as follows allowing you to start your
Debug session:
Figure 11. PathFinder-XD after program download
3.2.3 Controlling program execution/using breakpoints 1. You can control execution (start, stop, step etc.) using the Debug bar:
where the buttons are as follows:
Go
Stop/Halt
Step Into, Over and Return (Out)
Terminate (this button actually terminates the debug session meaning we have to Download and Launch again)
Figure 12. Execution Control

Ashling Product Brief APB213 Page 11 of 56
When setting/toggling breakpoints in the Source and Disassembly Windows, make sure the mouse pointer is hovering over the left-most column (known as the ruler) of the Window as shown below:
Figure 13. Setting a breakpoint
By default, PathFinder-XD sets a software breakpoint. You can set a hardware breakpoint via the right-mouse menu.
Figure 14. Setting a Hardware Breakpoint
The set breakpoints will be shown in the Breakpoints view as below:
Figure 15. Setting a Hardware Breakpoint
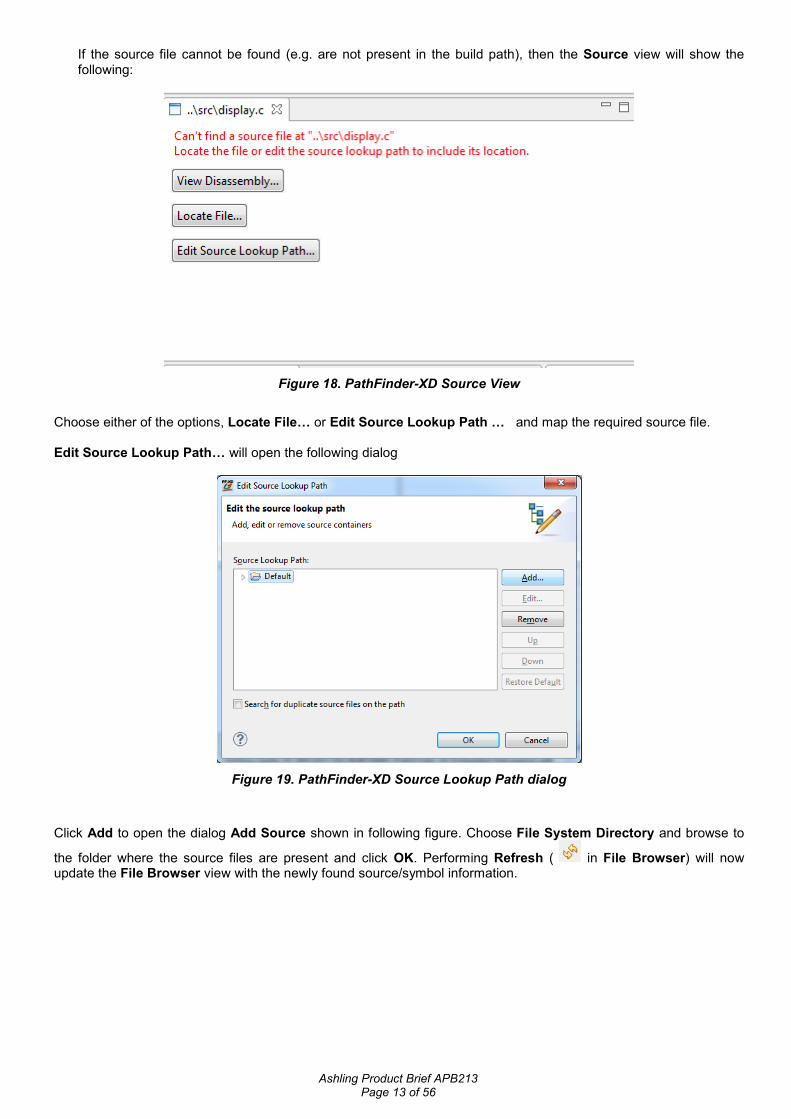
2. Breakpoints can also be set via the Run|Breakpoint Configuration dialog. This allows software (RAM) and
hardware (RAM/ROM) based breakpoints to be set. Advanced hardware breakpoints (including data access and conditional breakpoints) are also supported.
Ashling Product Brief APB213 Page 12 of 56
Figure 16. PathFinder-XD Breakpoint Configuration
Note: BRCM devices do not support core-specific breakpoints.
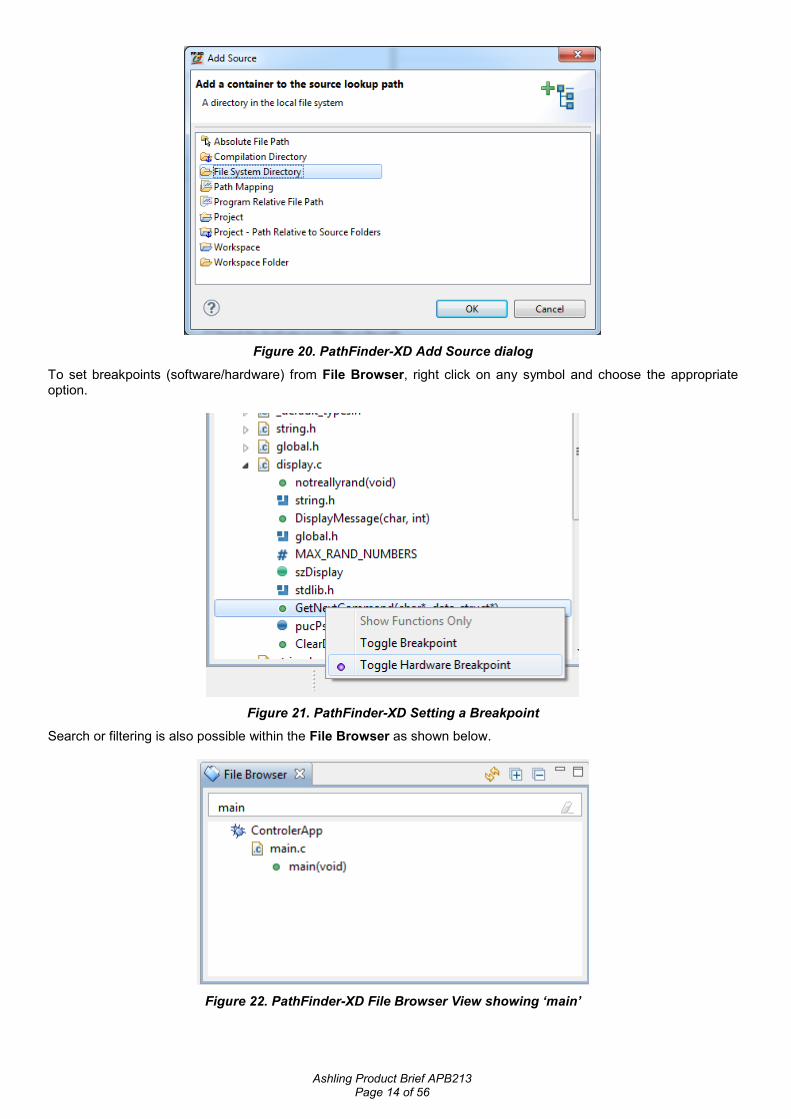
3.2.4 File Browser
Figure 17. PathFinder-XD File Browser View
This view shows an overview of all the source-files associated with your loaded program and is populated automatically. Each file can be expanded to view its functions, variables etc. The right-mouse menu option Show Functions Only can be used to restrict contents to functions only. Double-clicking a file will open it in the Source view.
Ashling Product Brief APB213 Page 13 of 56
If the source file cannot be found (e.g. are not present in the build path), then the Source view will show the following:
Figure 18. PathFinder-XD Source View
Choose either of the options, Locate File… or Edit Source Lookup Path … and map the required source file. Edit Source Lookup Path… will open the following dialog
Figure 19. PathFinder-XD Source Lookup Path dialog
Click Add to open the dialog Add Source shown in following figure. Choose File System Directory and browse to
the folder where the source files are present and click OK. Performing Refresh ( in File Browser) will now update the File Browser view with the newly found source/symbol information.
Ashling Product Brief APB213 Page 14 of 56
Figure 20. PathFinder-XD Add Source dialog
To set breakpoints (software/hardware) from File Browser, right click on any symbol and choose the appropriate option.
Figure 21. PathFinder-XD Setting a Breakpoint
Search or filtering is also possible within the File Browser as shown below.
Figure 22. PathFinder-XD File Browser View showing ‘main’

Ashling Product Brief APB213 Page 15 of 56
3.2.5 Watching program variables 1. To watch a variable or expression, select it using the mouse and Add Watch Expression via the right-mouse
button menu as shown below:
Figure 23. Adding a Watch Expression
Figure 24. Expression window showing watched expression
You can also quickly watch an expression by hovering the mouse pointer over it as shown below:

Ashling Product Brief APB213 Page 16 of 56
Figure 25. Quick watch via mouse hover
3.2.6 Viewing memory 1. Memory can be viewed via Window|Show View|Memory.
Figure 26. PathFinder-XD Memory View
Add a Memory Monitor and specify the address you wish to view (0xA000-0000 in the below example).
Figure 27. Adding a Memory Monitor
Figure 28. Memory Window showing contents at 0xA000-0000
Full point-and-click in-line editing is supported for writable target memory locations. Select New Renderings to show memory as Hex, ASCII etc.

Ashling Product Brief APB213 Page 17 of 56
Figure 29. Selecting Memory Renderings
3.2.7 Viewing registers 1. Register and Peripheral views can be opened via Window|Show View. General registers are shown in the
Register view. CP0 etc. registers are shown in the Peripheral Registers view. All views are in-line editable. .
Figure 30. Registers
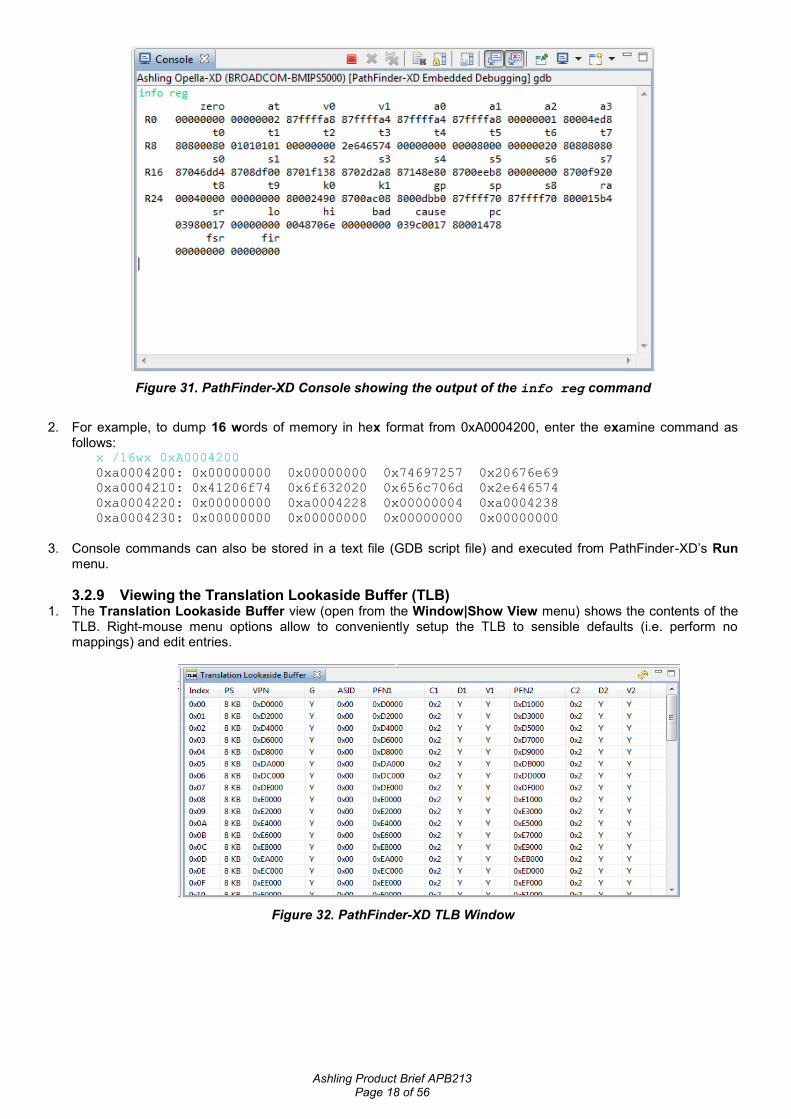
3.2.8 Using the console 1. PathFinder-XD supports a Console which can be opened from the Window menu. The Console allows you to
enter debug commands and view their output. The GNU GDB syntax is fully supported. See here for details: http://sourceware.org/gdb/current/onlinedocs/gdb/index.html or for a handy quick-reference card see here: http://users.ece.utexas.edu/~adnan/gdb-refcard.pdf
Ashling Product Brief APB213 Page 18 of 56
Figure 31. PathFinder-XD Console showing the output of the info reg command
2. For example, to dump 16 words of memory in hex format from 0xA0004200, enter the examine command as
follows: x /16wx 0xA0004200
0xa0004200: 0x00000000 0x00000000 0x74697257 0x20676e69
0xa0004210: 0x41206f74 0x6f632020 0x656c706d 0x2e646574
0xa0004220: 0x00000000 0xa0004228 0x00000004 0xa0004238
0xa0004230: 0x00000000 0x00000000 0x00000000 0x00000000
3. Console commands can also be stored in a text file (GDB script file) and executed from PathFinder-XD’s Run
menu.
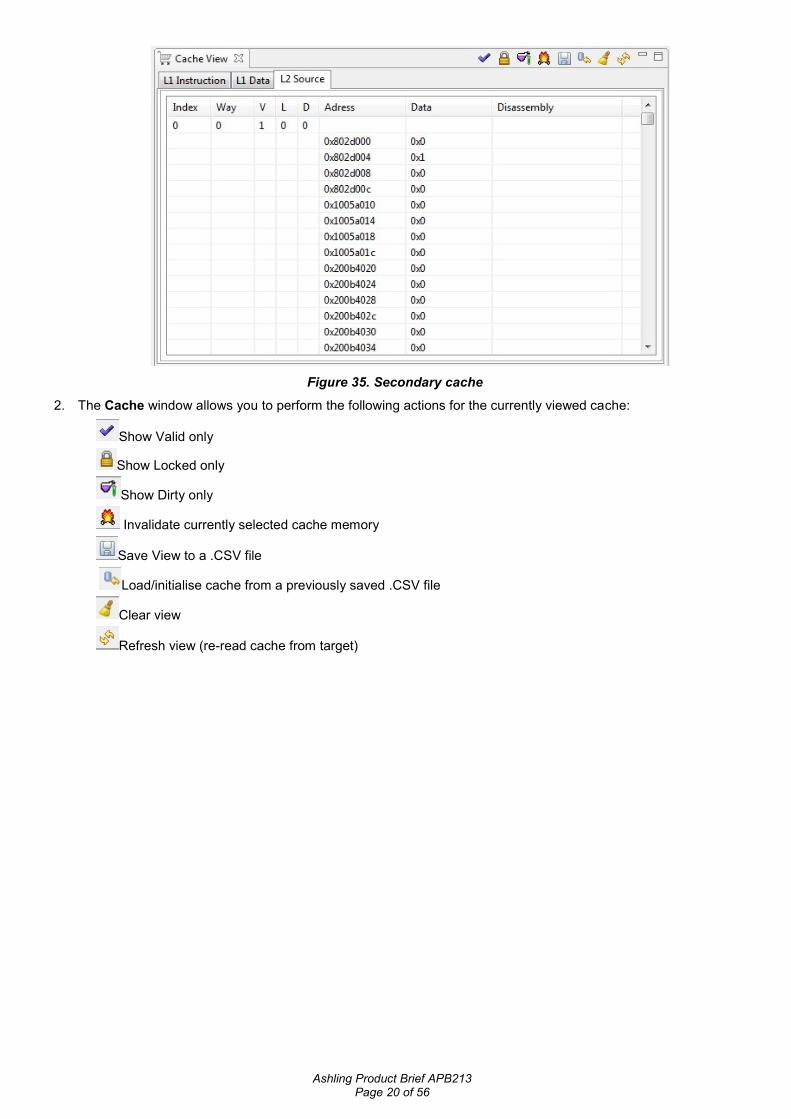
3.2.9 Viewing the Translation Lookaside Buffer (TLB) 1. The Translation Lookaside Buffer view (open from the Window|Show View menu) shows the contents of the
TLB. Right-mouse menu options allow to conveniently setup the TLB to sensible defaults (i.e. perform no mappings) and edit entries.
Figure 32. PathFinder-XD TLB Window

Ashling Product Brief APB213 Page 19 of 56
3.2.10 Viewing cache 1. The Cache View (open from Window|Show View menu) displays the contents of all caches including the
primary L1 caches (data cache and instruction cache) and secondary L2 caches (if present). Each cache is
shown in a separate tab. Each view shows the cache entry (instruction/data), physical address, index, way and
status (Valid, Locked, or Dirty). Instruction disassembly is also show for the Instruction cache. Cache contents
may also be saved to a file.
Figure 33. Instruction cache
Figure 34. Data cache
Ashling Product Brief APB213 Page 20 of 56
Figure 35. Secondary cache
2. The Cache window allows you to perform the following actions for the currently viewed cache:
Show Valid only
Show Locked only
Show Dirty only
Invalidate currently selected cache memory
Save View to a .CSV file
Load/initialise cache from a previously saved .CSV file
Clear view
Refresh view (re-read cache from target)

Ashling Product Brief APB213 Page 21 of 56
4. Multi-core support PathFinder-XD can debug multiple cores simultaneously. Details regarding multi-core configuration and debug operations follow:
4.1.1 Multi-core configuration Multi-core configuration is done via the Target Configuration Wizard. See portion marked in RED in below figure.
Figure 36. Target Configuration Wizard
Multi-core configuration settings include:
Cores on scan chain: specifies the total number of cores on the JTAG scan-chain
Connect to: select the core to which you need to connect initially
Enable multi-core support: enables multi-core debugging. If unchecked, only the core selected via Connect to can be debugged.
Enable non-stop mode: allows examination of halted cores context without intruding/halting other running cores i.e. you can halt individual cores/threads without affecting other cores/threads. By default, this mode is on.
All entries are automatically set to sensible defaults when you select the BRCM device.
Ashling Product Brief APB213 Page 22 of 56
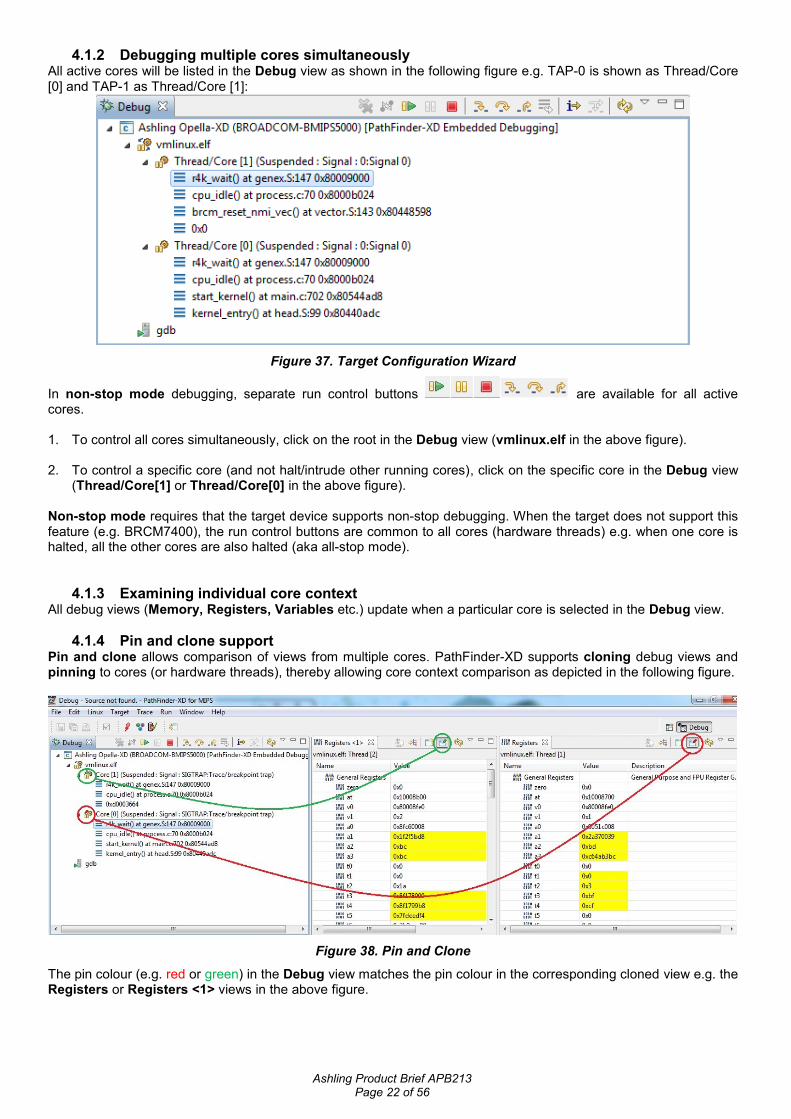
4.1.2 Debugging multiple cores simultaneously All active cores will be listed in the Debug view as shown in the following figure e.g. TAP-0 is shown as Thread/Core [0] and TAP-1 as Thread/Core [1]:
Figure 37. Target Configuration Wizard
In non-stop mode debugging, separate run control buttons are available for all active cores. 1. To control all cores simultaneously, click on the root in the Debug view (vmlinux.elf in the above figure). 2. To control a specific core (and not halt/intrude other running cores), click on the specific core in the Debug view
(Thread/Core[1] or Thread/Core[0] in the above figure). Non-stop mode requires that the target device supports non-stop debugging. When the target does not support this feature (e.g. BRCM7400), the run control buttons are common to all cores (hardware threads) e.g. when one core is halted, all the other cores are also halted (aka all-stop mode).
4.1.3 Examining individual core context All debug views (Memory, Registers, Variables etc.) update when a particular core is selected in the Debug view.
4.1.4 Pin and clone support Pin and clone allows comparison of views from multiple cores. PathFinder-XD supports cloning debug views and pinning to cores (or hardware threads), thereby allowing core context comparison as depicted in the following figure.
Figure 38. Pin and Clone
The pin colour (e.g. red or green) in the Debug view matches the pin colour in the corresponding cloned view e.g. the Registers or Registers <1> views in the above figure.

Ashling Product Brief APB213 Page 23 of 56
5. Trace support PathFinder-XD supports Broadcom’s Zephyr trace. This is a powerful on-chip trace implementation that allows real-time capture of code and data trace for all hardware threads (or cores). Captured Zephyr trace data is stored on the target’s L2 cache (up to 128KB can be allocated for trace) and can be accessed and displayed in PathFinder-XD via the target’s EJTAG debug port (using the Opella-XD connection).
5.1 Enable/configure trace 1. Trace can be enabled as shown below:
Figure 39. Enable trace
Enable Trace will configure trace with the default/current settings. When configuring for the first time, the Trace Configuration dialog will pop up. Subsequently, this can be accessed using the Trace Configuration option from the Trace menu as shown in following figures:
Figure 40. Trace Configuration
Ashling Product Brief APB213 Page 24 of 56
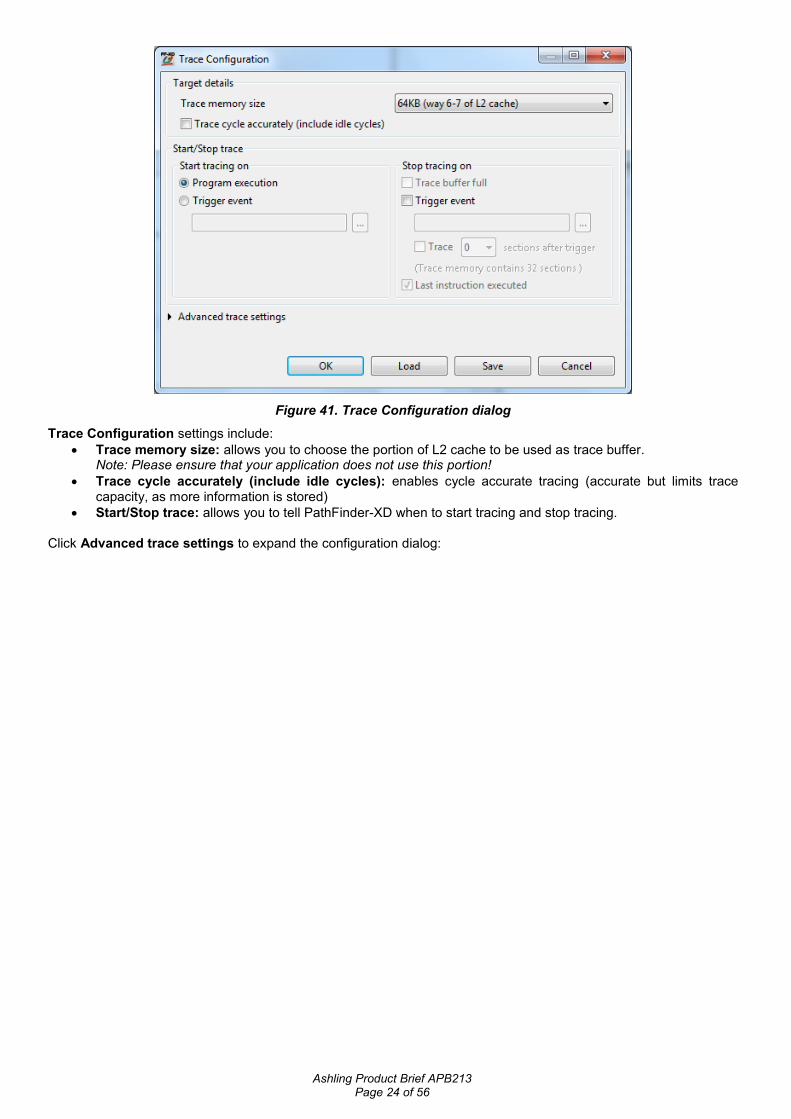
Figure 41. Trace Configuration dialog
Trace Configuration settings include:
Trace memory size: allows you to choose the portion of L2 cache to be used as trace buffer. Note: Please ensure that your application does not use this portion!
Trace cycle accurately (include idle cycles): enables cycle accurate tracing (accurate but limits trace capacity, as more information is stored)
Start/Stop trace: allows you to tell PathFinder-XD when to start tracing and stop tracing. Click Advanced trace settings to expand the configuration dialog:
Ashling Product Brief APB213 Page 25 of 56
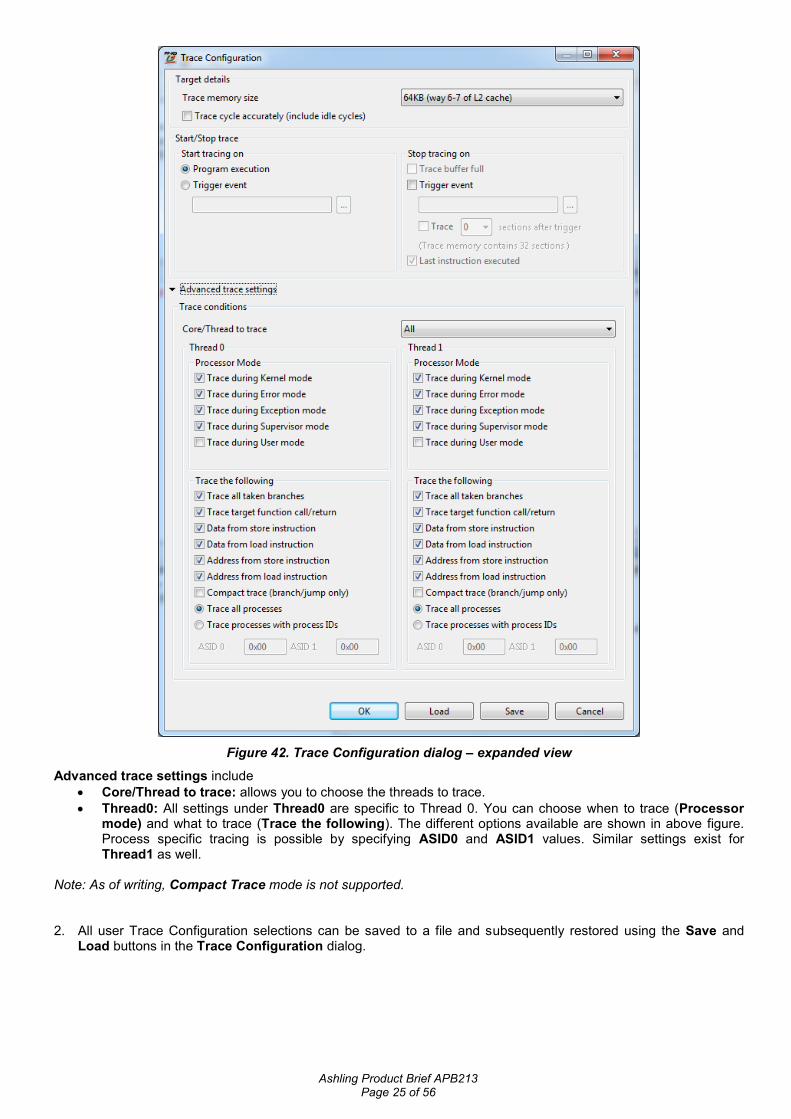
Figure 42. Trace Configuration dialog – expanded view
Advanced trace settings include
Core/Thread to trace: allows you to choose the threads to trace.
Thread0: All settings under Thread0 are specific to Thread 0. You can choose when to trace (Processor mode) and what to trace (Trace the following). The different options available are shown in above figure. Process specific tracing is possible by specifying ASID0 and ASID1 values. Similar settings exist for Thread1 as well.
Note: As of writing, Compact Trace mode is not supported. 2. All user Trace Configuration selections can be saved to a file and subsequently restored using the Save and
Load buttons in the Trace Configuration dialog.

Ashling Product Brief APB213 Page 26 of 56
5.2 Viewing trace 1. Once captured, trace information is shown in the Trace perspective (Trace|View Trace) as follows:
Figure 43. Trace Perspective
The Trace window shows the reconstructed trace information in a human-readable, high-level format. Information is reconstructed using the previously downloaded .ELF file; if the captured code information is not from within this .ELF file, then PathFinder-XD reads target memory to determine the actual executed code. Accessing target memory requires more time to populate the view, however, it allows support for both kernel and application code trace reconstruction when the target is running Linux. Trace information can be filtered (i.e. removed from the window) via the Filter control. Information is colour-coded as follows:
All branch instructions are shown in red
All load instructions are shown in blue
All store instructions are shown in green
All T0/T1 instructions are identified by separate background shades Double-clicking on a line on the Trace window updates the Source window below to show the equivalent line.
Ashling Product Brief APB213 Page 27 of 56
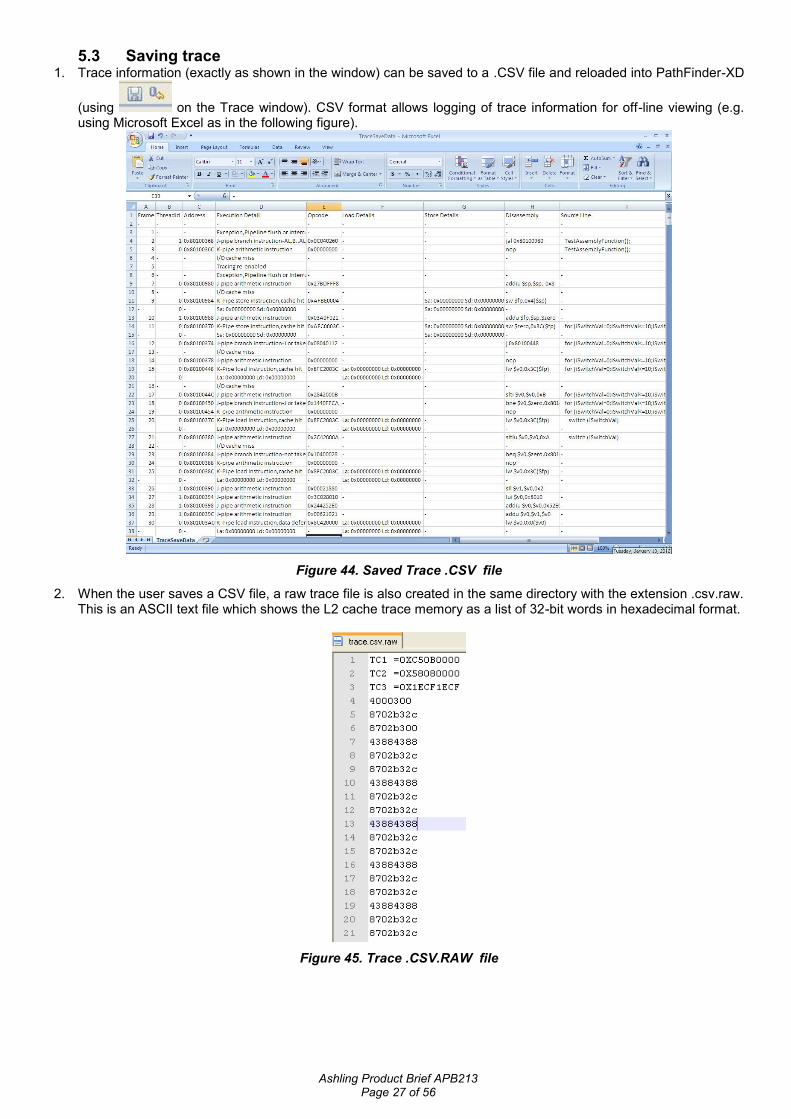
5.3 Saving trace 1. Trace information (exactly as shown in the window) can be saved to a .CSV file and reloaded into PathFinder-XD
(using on the Trace window). CSV format allows logging of trace information for off-line viewing (e.g. using Microsoft Excel as in the following figure).
Figure 44. Saved Trace .CSV file
2. When the user saves a CSV file, a raw trace file is also created in the same directory with the extension .csv.raw. This is an ASCII text file which shows the L2 cache trace memory as a list of 32-bit words in hexadecimal format.
Figure 45. Trace .CSV.RAW file

Ashling Product Brief APB213 Page 28 of 56
5.4 Known issues with trace The BMIPS5000 Zephyr on-chip trace implementation has the following known issues as of writing: 1. Compact Trace Mode is not supported.
2. Data access based triggers are supported; however, Instruction execution based triggers do not work reliably
and should not be used (due to silicon issues).
3. 128KB Upper trace configuration will not work reliably (due to silicon issues) 4. If you are debugging the Linux kernel, then you may experience a kernel crash if trace is configured either before
booting or after booting. This is a known silicon issue and the following workaround should be used:
Enable and configure trace as normal before booting/running the kernel
Temporarily disable trace via the Enable/Disable Trace Activate Bit (via Trace Menu or button) Boot/run the kernel until it is ‘up’.
Now enable trace via the Enable/Disable Trace Activate Bit (via Trace Menu or button)
5. PathFinder-XD supports simultaneous tracing of both kernel and a single application, however, simultaneous tracing of multiple applications is not supported.
6. Embedded Linux debugging support PathFinder-XD (v1.0.6 or later) supports Embedded Linux Debugging for kernels based on v2.6.26 or later. Both Standard (non-SMP) and SMP Linux debugging are fully supported. Support works in two modes:
Stop-mode: Debugging is done via the on-chip debug interface (e.g. via Opella-XD) and the whole system is halted (e.g. kernel and applications) whenever a breakpoint is taken.
Run-mode: Debugging is done purely in software (i.e. no Opella-XD is required) via a target serial/Ethernet interface and requires an application (GDB server) running on the target. In run-mode, the kernel continues to run when an application breakpoint is taken.
Stop-mode debugging is useful for bringing up the kernel as it only requires a functional on-chip debug interface and allows debug from reset. Stop-mode can also be used for process debugging, however, the kernel/interrupts etc. will not continue to run when halted (unlike run-mode). When stop-mode debugging a process, PathFinder-XD automatically scans the kernel MMU mapping for that process and sets up the MIPS core TLB to allow debug access to the process’s memory area. Run-mode debugging requires that the kernel is up and running and allows non-intrusive debug of a process (i.e. the kernel will continue to run even when a process is halted). Run-mode also supports thread-aware breakpoints and simultaneous debug of multiple processes.
6.1 Hardware Setup This section demonstrates SMP Linux Debugging using PathFinder-XD and Opella-XD connected to a Connect 20 Software Development Platform (the ‘target’). This platform is powered by a Broadcom BCM7420 dual-threaded 750MHz MIPS device (http://02f0fbc.netsolstores.com/broadcomopenset-topbox-connect20.aspx) running Linux Kernel v2.6.37. Ashling provides the associated Linux Kernel sources files for download at
http://www.ashling.com/support/MIPS/Connect20/MIPS_CONNECT20_LINUX_v2.6.37.zip and
these should be installed by unzipping to your local hard-disk (ensure you preserve the directory structure as present
in the ZIP file i.e. C:\MIPS_CONNECT20_LINUX_v2.6.37\). These sources are needed for source-level debug of
the kernel and they also include some examples that demonstrate other PathFinder-XD features.
Ashling Product Brief APB213 Page 29 of 56
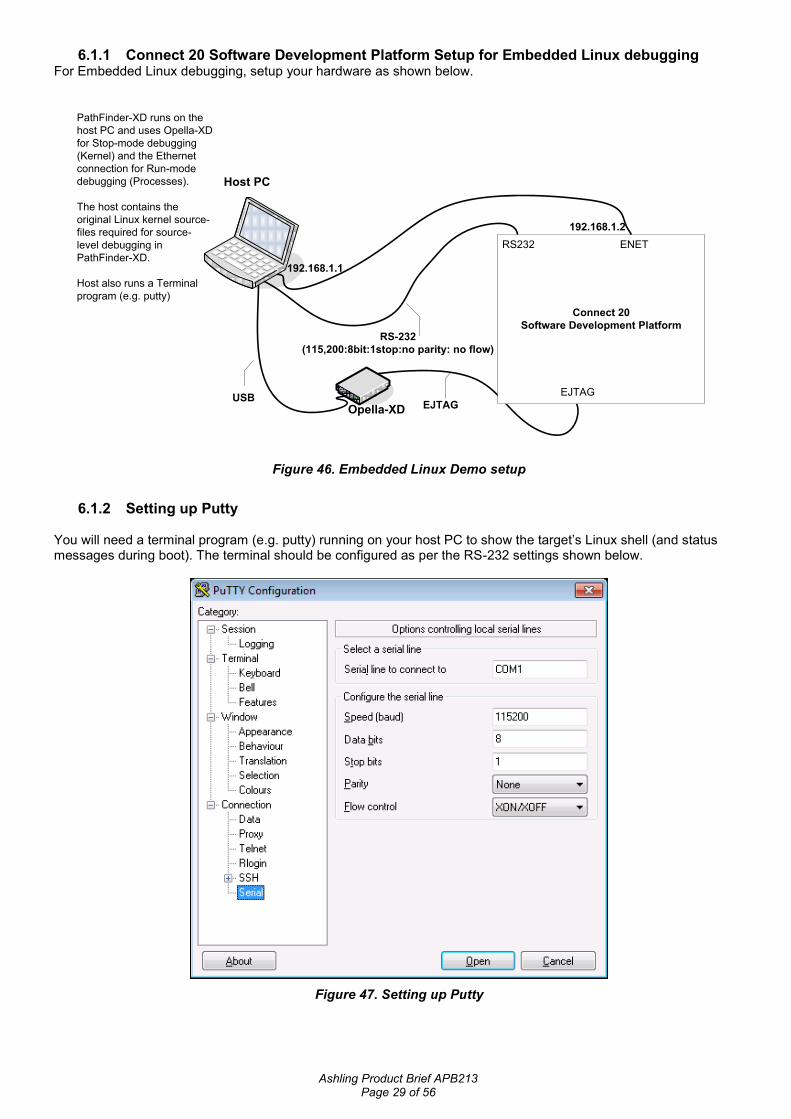
6.1.1 Connect 20 Software Development Platform Setup for Embedded Linux debugging For Embedded Linux debugging, setup your hardware as shown below.
RS-232
(115,200:8bit:1stop:no parity: no flow)
PathFinder-XD runs on the
host PC and uses Opella-XD
for Stop-mode debugging
(Kernel) and the Ethernet
connection for Run-mode
debugging (Processes).
The host contains the
original Linux kernel source-
files required for source-
level debugging in
PathFinder-XD.
Host also runs a Terminal
program (e.g. putty)
Opella-XD
Host PC
USBEJTAG
Connect 20
Software Development Platform
RS232 ENET
EJTAG
192.168.1.1
192.168.1.2
Figure 46. Embedded Linux Demo setup
6.1.2 Setting up Putty
You will need a terminal program (e.g. putty) running on your host PC to show the target’s Linux shell (and status messages during boot). The terminal should be configured as per the RS-232 settings shown below.
Figure 47. Setting up Putty

Ashling Product Brief APB213 Page 30 of 56
6.1.3 Setting up network between host and target Setup the IP address of the host computer (running PathFinder-XD) as shown below:
Figure 48. IP address configuration at Host
When the target is powered on a factory programmed Linux image (from flash memory) is loaded. Press Ctrl+C to
cancel automatic start-up which will allow us to setup the target IP address and load the kernel from our host PC (using tftp)
Figure 49. Connect 20 Boot Loader prompt
Setup the target IP address using the below boot loader command: ifconfig eth0 -addr=192.168.1.2 -mask=255.255.255.0 -gw=192.168.1.254

Ashling Product Brief APB213 Page 31 of 56
Figure 50. Target IP address Configuration
Verify we can communicate with the host PC using ping as follows:
Figure 51. Pinging to the host
Note: If ping fails, then please recheck your host computer IP settings and your firewall.

Ashling Product Brief APB213 Page 32 of 56
6.1.4 Installing TFTP Server on the host PC Download and install TFTP server from: http://www.softpedia.com/progDownload/SolarWinds-TFTP-Server-
Download-81432.html. Run TFTPServer.exe from the installation directory (C:\Program
Files\SolarWinds\TFTPServer) and start TFTP Server via File | Configure | Start option. This will create a
TFTP root directory in C:\TFTP-Root.
Figure 52. TFTP Server Configuration
Now copy the Linux ramdisk image (vmlinuz-initrd-7420c0) image from
C:\MIPS_CONNECT20_LINUX_v2.6.37\ to the C:\TFTP-Root directory.
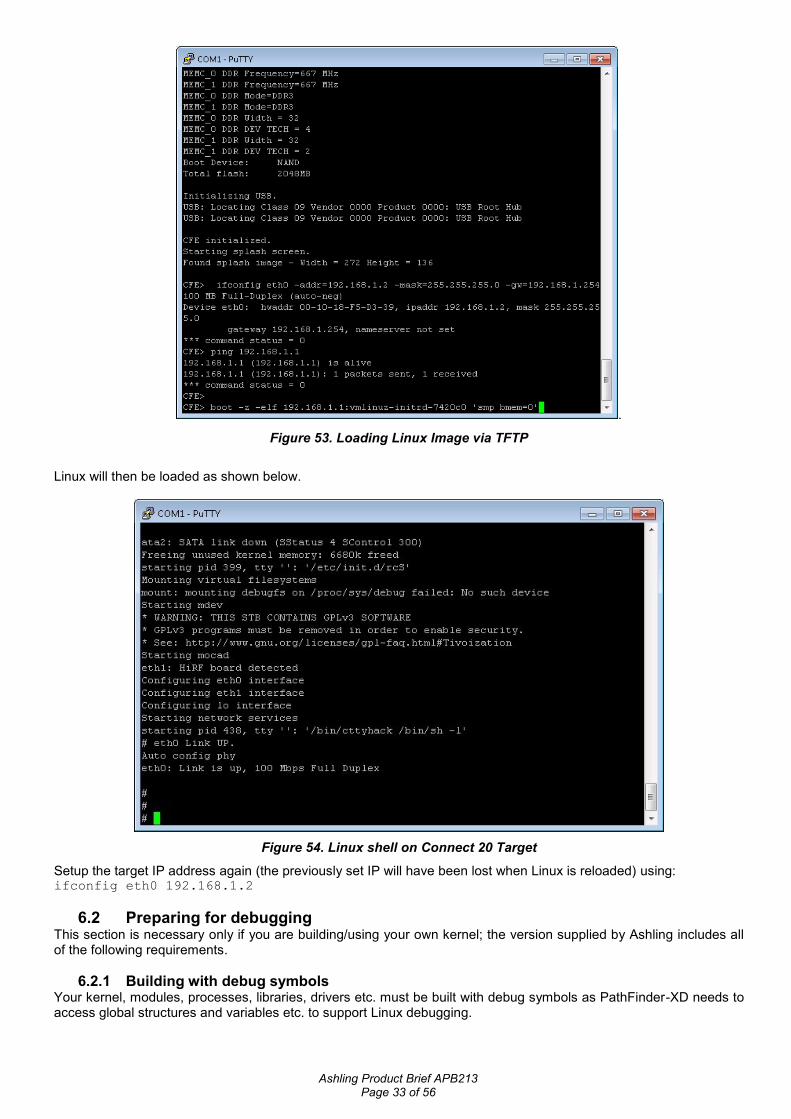
6.1.5 Loading the Linux Image using TFTP The Linux ramdisk image (contains kernel and file system) can now be loaded to the target using the below boot loader command: boot -z -elf 192.168.1.1:vmlinuz-initrd-7420c0 'smp bmem=0'
Ashling Product Brief APB213 Page 33 of 56
.
Figure 53. Loading Linux Image via TFTP
Linux will then be loaded as shown below.
Figure 54. Linux shell on Connect 20 Target
Setup the target IP address again (the previously set IP will have been lost when Linux is reloaded) using: ifconfig eth0 192.168.1.2
6.2 Preparing for debugging This section is necessary only if you are building/using your own kernel; the version supplied by Ashling includes all of the following requirements.
6.2.1 Building with debug symbols Your kernel, modules, processes, libraries, drivers etc. must be built with debug symbols as PathFinder-XD needs to access global structures and variables etc. to support Linux debugging.

Ashling Product Brief APB213 Page 34 of 56
Note: Debug symbols for Linux kernel (vmlinux) are required to debug user-mode applications in stop-mode (to
allow PathFinder-XD to handle memory mapping which requires kernel symbols). Kernel symbols are not required for run-mode debugging.
For the kernel, run make menuconfig, select Kernel hacking, enable Kernel debugging and Compile the kernel with debug and run make to rebuild the kernel with debug symbols.
For non-kernel items, add the compiler gcc switch -g (which will generate debug symbols) to your makefile
and rebuild.
6.2.2 On-demand paging (for stop-mode debugging only) Linux uses “on-demand paging”, meaning a process’ (and its dependant libraries’) code, data and stack are not actually paged into memory until they are first used. This can cause problems when you wish to “stop-mode” debug a process from its initialisation as it may not yet be present in memory. For example, you cannot set software breakpoints which require patching of the software breakpoint instruction into the appropriate process’ memory location until the actual associated process code page is in memory. Depending on the size of your target’s memory space and your Memory Management Unit (MMU) configuration, you may or may not have this issue. If you do have this issue, then Ashling provide a kernel patch that will force all of a process’ code, data and stack pages into
memory. This file is installed with PathFinder-XD and is called ash_load_process_pages.c. Installing the patch
requires that you modify some existing kernel files and rebuild; please refer to the file for full details. Note: This patch is required only for stop-mode debugging.
6.3 Stop-mode Debugging The following features are supported:
Linux Kernel debugging: o Debug modules built as part of the Kernel
Linux dynamically loadable Modules/Driver debugging: o List all inserted modules o Debug an already inserted module o Debug a module from init_module()
Linux process (application) and library debugging: o List all running processes and threads o Debug a running process o Debug a process from main()
o Debug shared libraries
6.3.1 Sample Stop-mode Linux Debugging Session This section demonstrates Linux Kernel Debugging using PathFinder-XD and Opella-XD connected to a Connect 20 target running v2.6.37 Linux Kernel. Make sure that your hardware is configured as per 6.1.1

Ashling Product Brief APB213 Page 35 of 56
Connect 20 Software Development Platform Setup for Embedded Linux debugging. 1. In PathFinder-XD, create a New Target Configuration via the Target menu
Figure 55. Target Configuration
and select the Debug using Debug Probe option as shown below
Figure 56. Debug using Debug Probe
2. Click Next and we can now configure our Opella-XD settings as shown below:

Ashling Product Brief APB213 Page 36 of 56
Figure 57. Probe selection
Settings include:
Probe type: The actual Ashling Debug Probe Type to use as the target connection. Select Opella-XD
Serial number: The serial number of the Debug Probe to use. Specify the serial number or use first found and click on Next
Figure 58. Target Configuration

Ashling Product Brief APB213 Page 37 of 56
The Debug probe configuration settings include:
MIPS device: specifies the MIPS device type you wish to debug. In this example, Broadcom BMIPS5000 is selected.
JTAG frequency: specifies the JTAG TCK frequency to be used for communicating with the EJTAG interface on your MIPS device
Initial target byte order: allows you to specify the memory Endianess of your target system.
User register settings file: group allows you to initialise other registers or memory locations on PathFinder-XD invocation and after reset. The Browse… button allows these register values to be loaded from a simple text file. The text file format is:
Name Size Address Value
(all values are in HEX). For example, the following text file initialises the R0, R1, R2 and R3 registers: R0 0x00000004 0xb800380c 0x18000000
R1 0x00000004 0xb8003808 0x00000006
R2 0x00000004 0xb8004018 0x00000800
R3 0x00000004 0xb800401c 0x0000000c
Disable interrupts during single step: allows you to disable interrupts when single stepping at assembly level (MIPS instruction level). When checked, PathFinder-XD automatically disables interrupts prior to assembly level single step and re-enables them after the single step is complete.
Enable DMA Mode: enables DMA mode for high-speed transfer between the debug probe and your target. DMA Mode is only available on systems with EJTAG DMA support.
Single step using software breakpoint: allows you to specify that PathFinder-XD should use software breakpoints for single-stepping (i.e. PathFinder-XD should not use the EJTAG hardware based single-step command).
Halt counters in debug mode: allows you tell PathFinder-XD to halt the MIPS Count register(s) (via writing to the Configuration register) whenever your program is halted. There is a slight delay between your program halting and the write to the Configuration register. Note that the Registers window always shows your application values for the Configuration register.
Issue no reset on connection: will ensure that no hardware reset is issued when you connect to your target (note that this feature requires updated Opella-XD firmware (v1.1.1 or later) which is supplied with PathFinder-XD v1.0.6 or later).
Issue EJTAGBOOT on connection: will issue a hardware reset and halt the target at the reset location.
Issue hard reset and wait ‘N’ ms before entering debug mode: will issue a hardware reset and wait the specified number of ms before entering debug mode. This mode is also known as NORMALBOOT.
Multi-core: allows you to select the core you wish to debug for multi-core devices. The BCM7420 device has two cores (or hardware threads) and the first one (TAP-0) is chosen in this example.
Enable multi-core support: enables multi-core debugging. Check this as we want to debug both cores (threads) in the BCM7420 device.
Enable non-stop mode: allows examination of halted cores context without intruding/halting other running cores i.e. you can halt individual cores/threads without affecting other cores/threads. By default, this mode is on. The settings shown are suitable for Connect 20 target board. Click Finish when done.
3. PathFinder-XD will now create a new Target Debugger setting in its Remote Systems Window as shown below:
Figure 59. Remote Systems Window
Right-click on Target Debugger and click Connect to invoke the Opella-XD target connection. Once invoked, the Remote Systems window will update as follows:
Ashling Product Brief APB213 Page 38 of 56
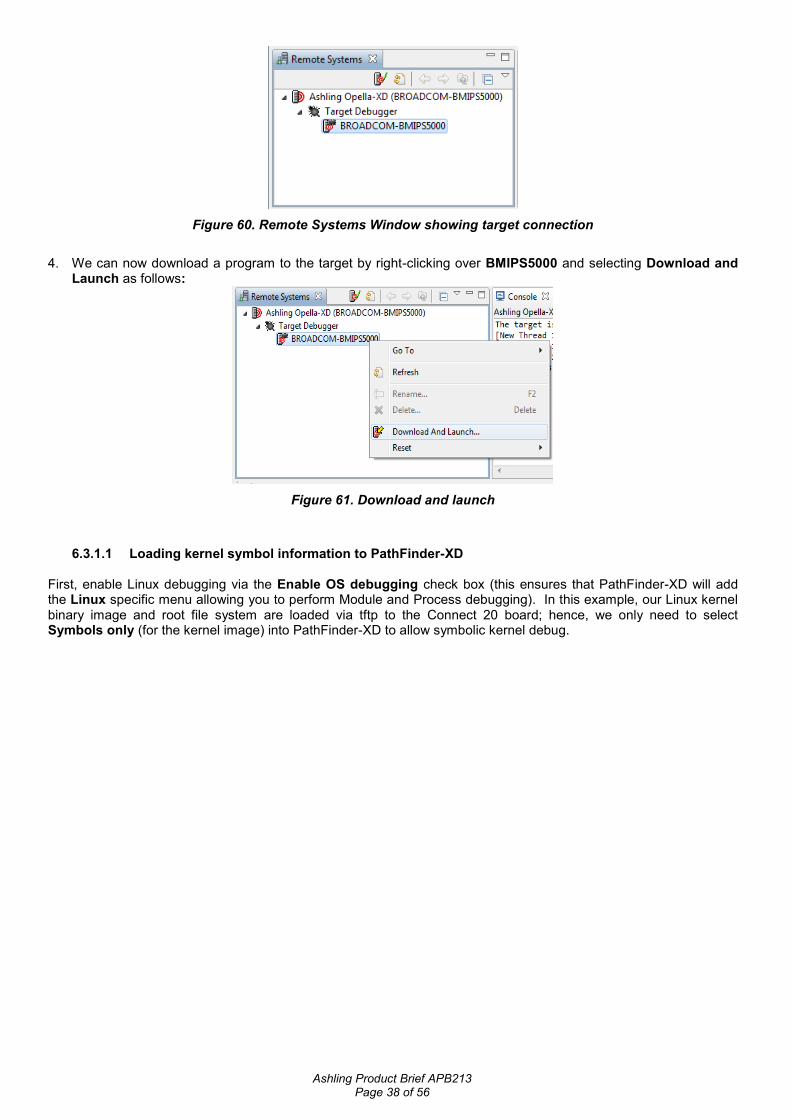
Figure 60. Remote Systems Window showing target connection
4. We can now download a program to the target by right-clicking over BMIPS5000 and selecting Download and
Launch as follows:
Figure 61. Download and launch
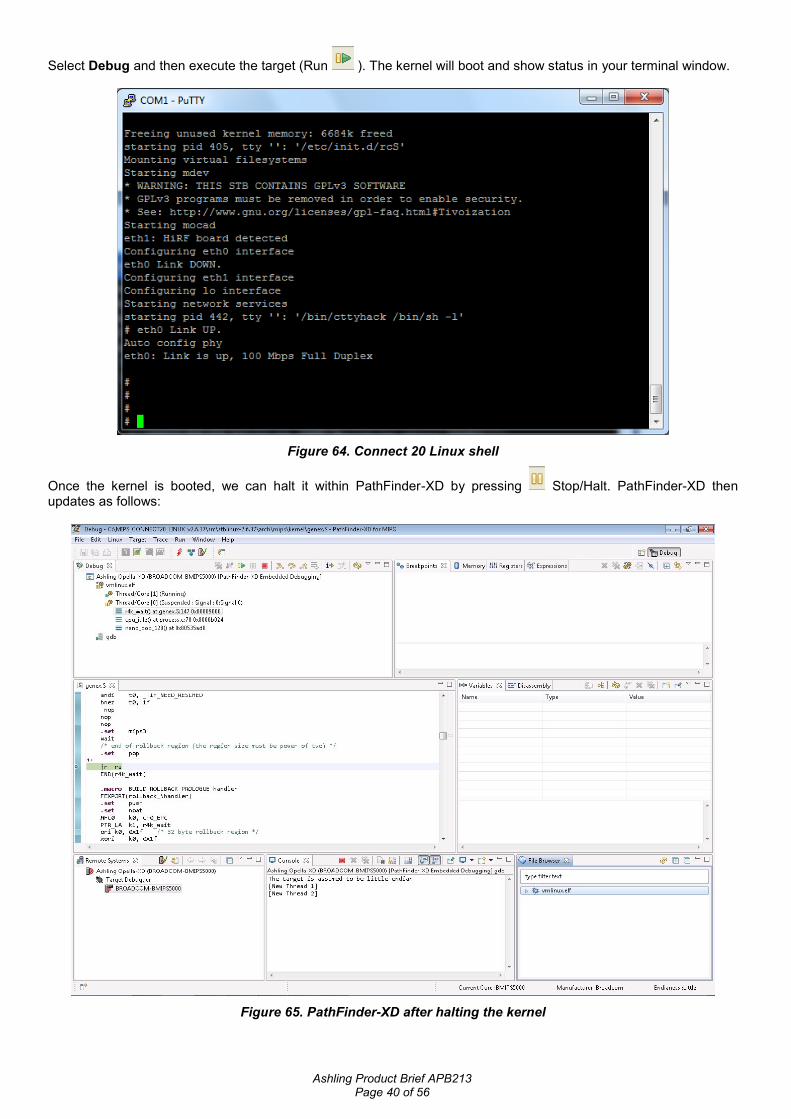
6.3.1.1 Loading kernel symbol information to PathFinder-XD First, enable Linux debugging via the Enable OS debugging check box (this ensures that PathFinder-XD will add the Linux specific menu allowing you to perform Module and Process debugging). In this example, our Linux kernel binary image and root file system are loaded via tftp to the Connect 20 board; hence, we only need to select Symbols only (for the kernel image) into PathFinder-XD to allow symbolic kernel debug.

Ashling Product Brief APB213 Page 39 of 56
Figure 62. Loading the kernel symbols
Select the Debugger tab and make sure that mips-linux-gnu-gdb.exe is specified as the GDB debugger
Figure 63. Specifying the correct GDB debugger
Ashling Product Brief APB213 Page 40 of 56
Select Debug and then execute the target (Run ). The kernel will boot and show status in your terminal window.
Figure 64. Connect 20 Linux shell
Once the kernel is booted, we can halt it within PathFinder-XD by pressing Stop/Halt. PathFinder-XD then updates as follows:
Figure 65. PathFinder-XD after halting the kernel
Ashling Product Brief APB213 Page 41 of 56
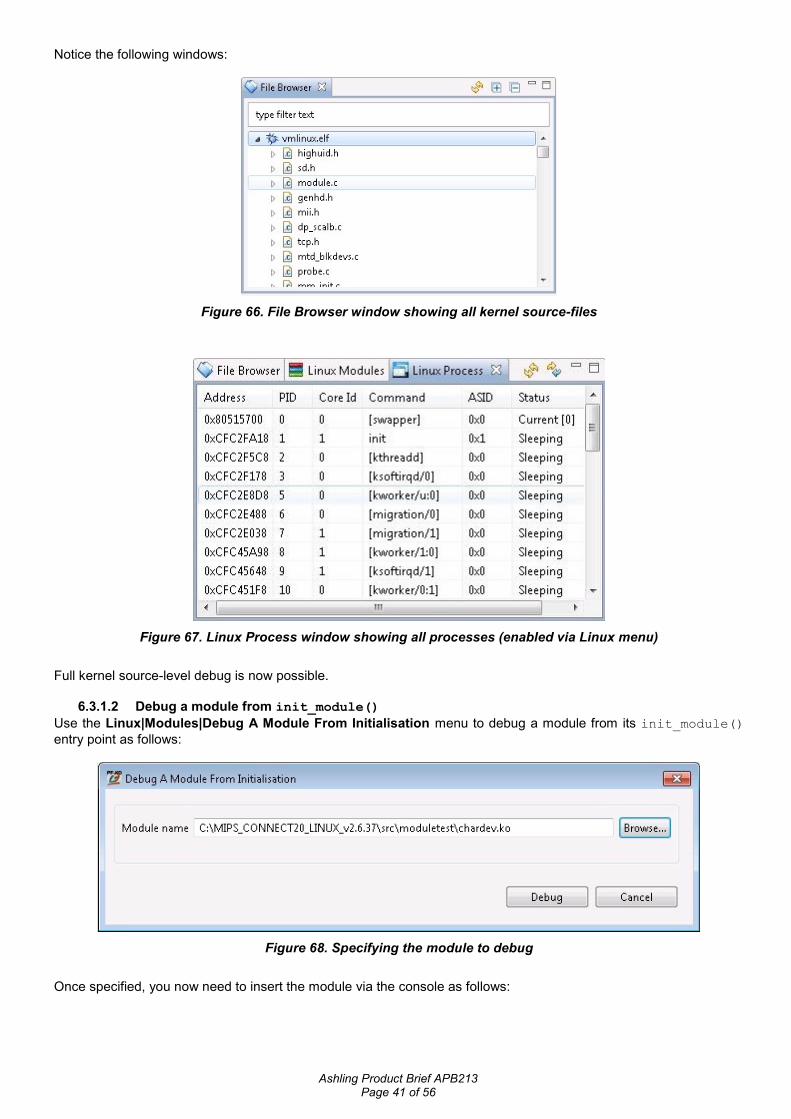
Notice the following windows:
Figure 66. File Browser window showing all kernel source-files
Figure 67. Linux Process window showing all processes (enabled via Linux menu)
Full kernel source-level debug is now possible.
6.3.1.2 Debug a module from init_module()
Use the Linux|Modules|Debug A Module From Initialisation menu to debug a module from its init_module()
entry point as follows:
Figure 68. Specifying the module to debug
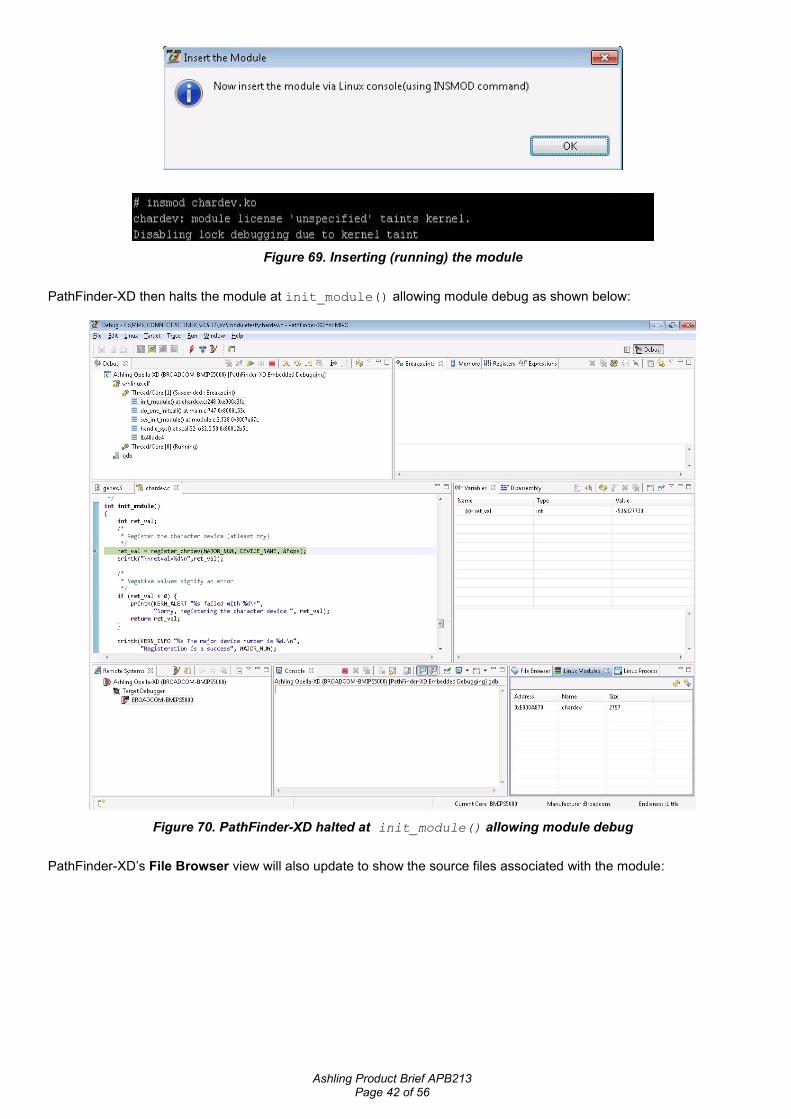
Once specified, you now need to insert the module via the console as follows:
Ashling Product Brief APB213 Page 42 of 56
Figure 69. Inserting (running) the module
PathFinder-XD then halts the module at init_module() allowing module debug as shown below:
Figure 70. PathFinder-XD halted at init_module() allowing module debug
PathFinder-XD’s File Browser view will also update to show the source files associated with the module:

Ashling Product Brief APB213 Page 43 of 56
Figure 71. File Browser window showing modules sources
And the Linux Modules window will now list the new module:
Figure 72. Linux Modules window listing the new module
You can also view the internal module kernel structures via the right-mouse button menu as follows:

Ashling Product Brief APB213 Page 44 of 56
Figure 73. Viewing the internal kernel module structures
In addition, you can load module symbols for a module that is already loaded, using the Load Module Symbol option in the right-mouse button menu.
6.3.1.3 Debugging a process from main()
Use the Linux|Processes|Debug A Process From main() to debug a process from its entry point as follows:
Figure 74. Debugging a process from main()
rootfs Directory specifies where the root file-system (rootfs) resides in your host machine. This location is needed
for loading shared library symbols in PathFinder-XD. Once specified, you need to run the process from the console as follows:

Ashling Product Brief APB213 Page 45 of 56
Press OK and PathFinder will run Linux allowing you to execute the process as follows:
Figure 75. Running the process
PathFinder-XD then halts the process at main() function as shown below:
Figure 76. PathFinder-XD halted at the process’s main() function
The File Browser window will update to show the process’ source code. Note: To exit the application, press Ctrl+C
from the Linux console.
6.3.1.4 Debugging a running process You can load the symbols for a running process via the Linux Process window. Right-click on the process and select Load Process Symbol:
Figure 77. Loading a process’s symbols

Ashling Product Brief APB213 Page 46 of 56
It is recommended that you use hardware breakpoints when debugging a running process (i.e. do not use software breakpoints as the process may not be paged in at this point). Once the hardware breakpoint has been taken, the process is in memory, hence, you can use software breakpoints.
6.3.1.5 Library debugging Debugging of libraries is handled seamlessly without any extra requirements/setup.
6.4 Run-mode Debugging Run-mode debugging is done via a target Serial/Ethernet interface and requires an application (GDB server) running on the target. In run-mode, the kernel continues to run when a process (application) breakpoint is taken. Run-mode debugging requires that the kernel is up and running, and allows non-intrusive debug of process (i.e. the kernel will continue to run even when a process is halted).
6.4.1 Sample Run-mode Linux Debugging Session This section demonstrates Linux Process Debugging using PathFinder-XD and Opella-XD connected to a Connect 20 target running v2.6.37 Linux Kernel. The example will demonstrate debugging of a Process and a Module (that contains functions called from the Process). Kernel/Module level debugging is done via the Opella-XD; Process debugging is done via an Ethernet connection to the target. As before, we have to prepare our kernel for debug, download it to the target, execute it and load the kernel symbols into PathFinder-XD. See previous sections. Once these steps are complete, we are ready to begin debugging our Module and Process as follows:
6.4.2 Copying the necessary files to the target Ashling provides a precompiled version of the GNU gdbserver (v7.2 or later) to support run-mode debugging. By
default, this is included in the root file-system provided by Ashling for debugging the Connect 20 board; hence, no copying is necessary.
When debugging your own target, note that the gdbserver application is installed with PathFinder-XD in
PathFinder-XDforMIPS\target\linux\gdbserver and versions are supplied for big/little endian and
libc/uclibc target libraries.
6.4.3 Debugging the Module and Process
1. First, load the Module (using insmod) from our Linux shell as follows:
Figure 78. Loading the Module to be debugged
Note: Do not attempt to load a module twice, as debugging will not work correctly (use rmmod chardev.ko
if you need to remove or unload the module)
2. Now, halt the kernel in PathFinder-XD and load the Module symbols from within the PathFinder-XD Linux
Modules window:

Ashling Product Brief APB213 Page 47 of 56
Figure 79. Loading the Module symbols
3. Notice how the File Browser now shows the Module and Kernel symbols:
Figure 80. File Browser showing Kernel and Module symbols
We can double-click on the Module to list the files and double-click on a source-file to show it in the Source
Window. In the below example, we have opened the Module source-file chardev.c and set a breakpoint at
the function device_read that we wish to debug (i.e. when this function is called from the Process).
Figure 81. Setting a Breakpoint in the Module
4. Next, run the kernel in PathFinder-XD

Ashling Product Brief APB213 Page 48 of 56
Figure 82. Running the Kernel
and launch gdbserver on the target (i.e. in the Linux shell) specifying the Process we wish to debug
(ashtestapp). Notice how we tell ./gdbserver which port to listen on (1234)
Figure 83. Launching the Process

Ashling Product Brief APB213 Page 49 of 56
5. Next, Debug A Process in Run-mode using PathFinder-XD (the kernel is now running) as follows:
Figure 84. Debugging a Process in Run-mode
We need to specify
a. the Process:
Figure 84. Specifying the Process
b. the location of the shared libraries:
Figure 85. Specifying the Share Library location
c. and finally, the connection mechanism (TCP in our example) and IP address of the target system (i.e. the
Connect 20 at 192.168.1.1 which is running gdbserver on port 1234):
Figure 86. Specifying the Connection mechanism

Ashling Product Brief APB213 Page 50 of 56
Make sure that mips-linux-gnu-gdb.exe is specified as the GDB debugger (default) and press Debug to start
debugging the Process.
Figure 87. Debugging a Process in Run-mode dialog
6. PathFinder-XD will now update as follows:
Figure 88. PathFinder-XD in Run-mode
Ashling Product Brief APB213 Page 51 of 56
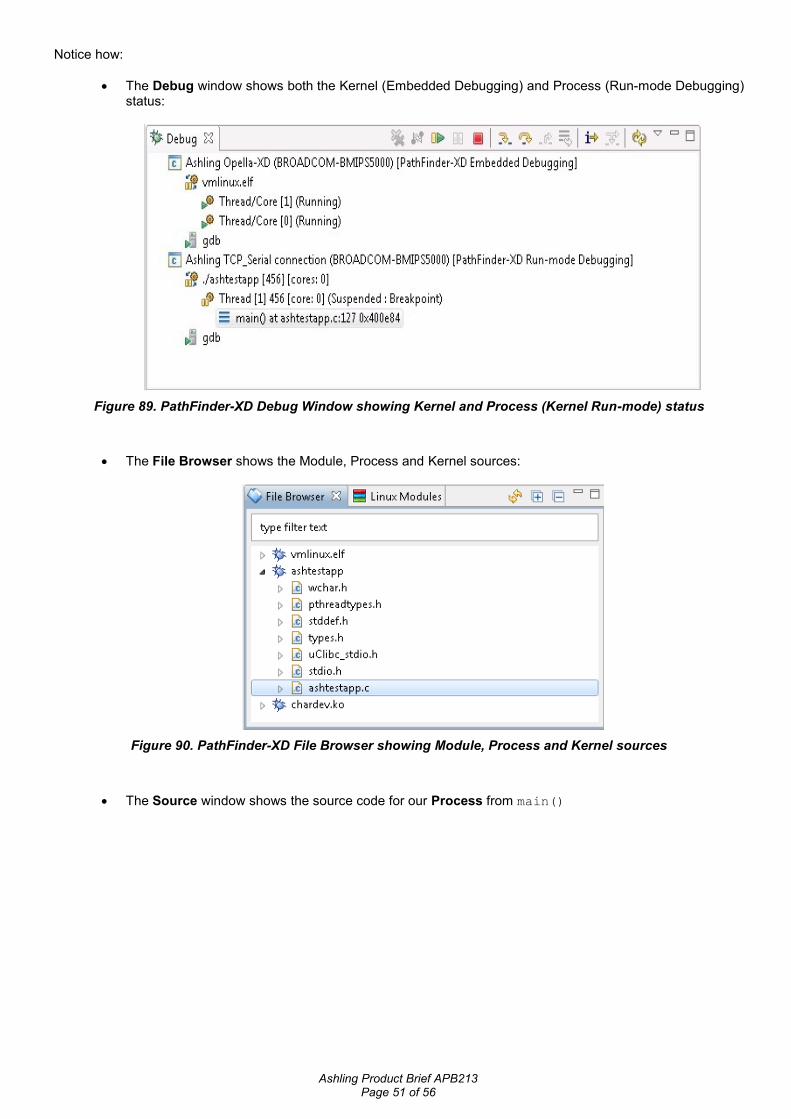
Notice how:
The Debug window shows both the Kernel (Embedded Debugging) and Process (Run-mode Debugging) status:
Figure 89. PathFinder-XD Debug Window showing Kernel and Process (Kernel Run-mode) status
The File Browser shows the Module, Process and Kernel sources:
Figure 90. PathFinder-XD File Browser showing Module, Process and Kernel sources
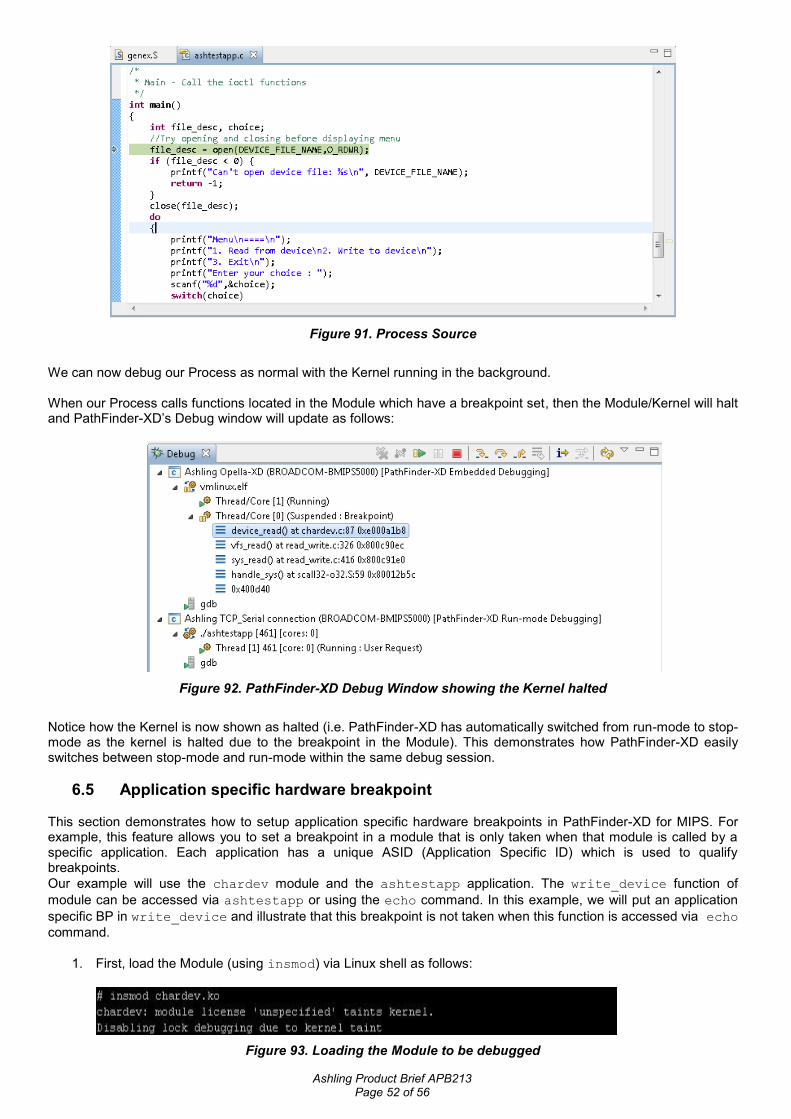
The Source window shows the source code for our Process from main()
Ashling Product Brief APB213 Page 52 of 56
Figure 91. Process Source
We can now debug our Process as normal with the Kernel running in the background. When our Process calls functions located in the Module which have a breakpoint set, then the Module/Kernel will halt and PathFinder-XD’s Debug window will update as follows:
Figure 92. PathFinder-XD Debug Window showing the Kernel halted
Notice how the Kernel is now shown as halted (i.e. PathFinder-XD has automatically switched from run-mode to stop-mode as the kernel is halted due to the breakpoint in the Module). This demonstrates how PathFinder-XD easily switches between stop-mode and run-mode within the same debug session.
6.5 Application specific hardware breakpoint This section demonstrates how to setup application specific hardware breakpoints in PathFinder-XD for MIPS. For example, this feature allows you to set a breakpoint in a module that is only taken when that module is called by a specific application. Each application has a unique ASID (Application Specific ID) which is used to qualify breakpoints.
Our example will use the chardev module and the ashtestapp application. The write_device function of
module can be accessed via ashtestapp or using the echo command. In this example, we will put an application
specific BP in write_device and illustrate that this breakpoint is not taken when this function is accessed via echo
command.
1. First, load the Module (using insmod) via Linux shell as follows:
Figure 93. Loading the Module to be debugged
Ashling Product Brief APB213 Page 53 of 56
Note: Do not attempt to load a module twice, as debugging will not work correctly (use rmmod chardev.ko
if you need to remove or unload the module)
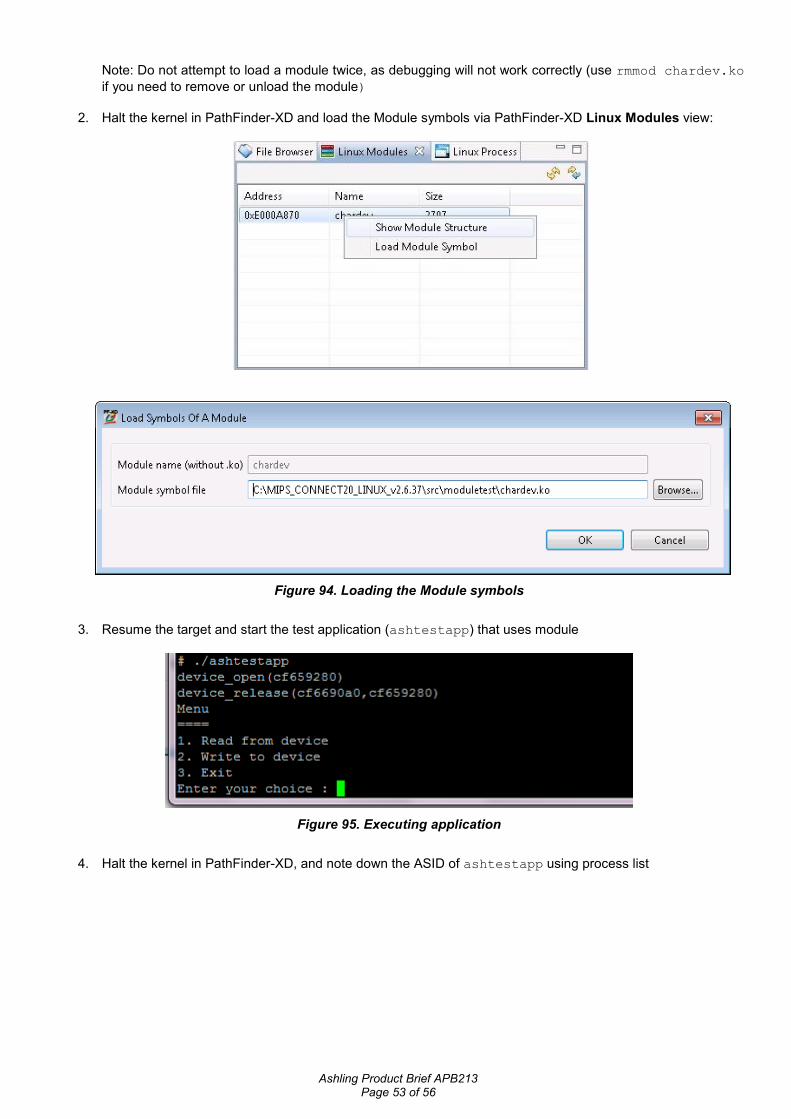
2. Halt the kernel in PathFinder-XD and load the Module symbols via PathFinder-XD Linux Modules view:
Figure 94. Loading the Module symbols
3. Resume the target and start the test application (ashtestapp) that uses module
Figure 95. Executing application
4. Halt the kernel in PathFinder-XD, and note down the ASID of ashtestapp using process list

Ashling Product Brief APB213 Page 54 of 56
Figure 96. Note ASID of the process
5. Set a hardware Instruction breakpoint in device_write function with the process ASID specified
Figure 97. Set hardware breakpoint
Ashling Product Brief APB213 Page 55 of 56
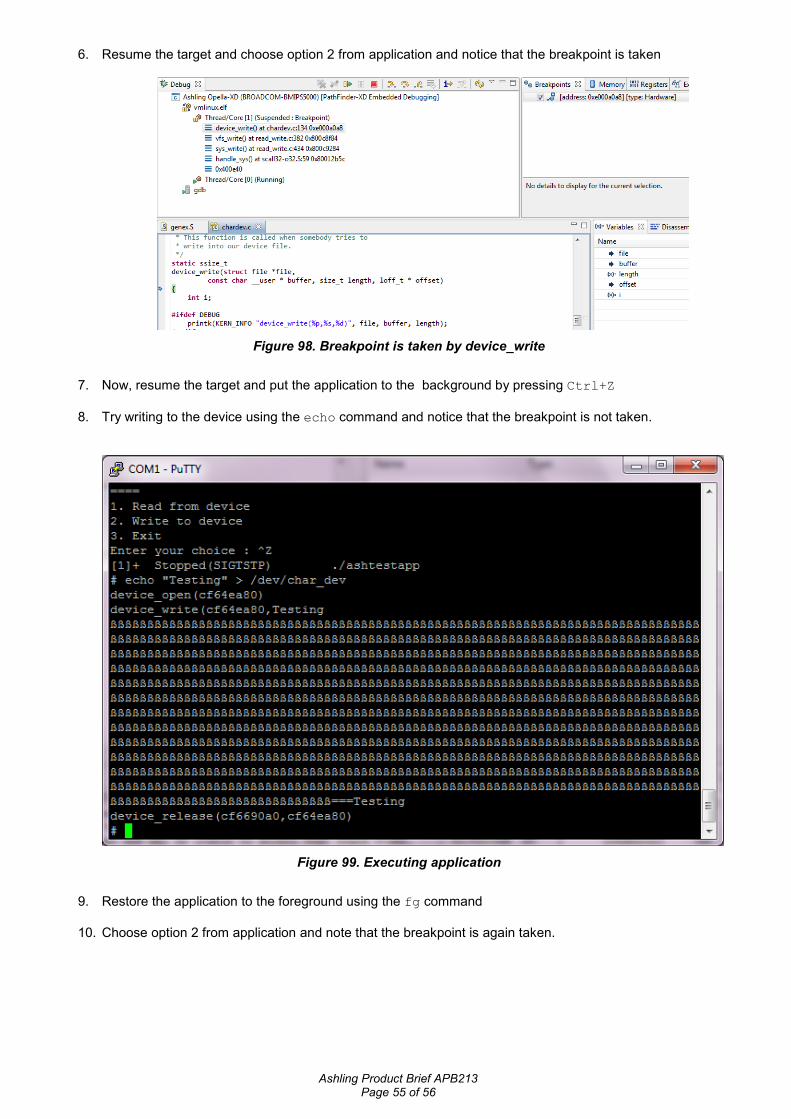
6. Resume the target and choose option 2 from application and notice that the breakpoint is taken
Figure 98. Breakpoint is taken by device_write
7. Now, resume the target and put the application to the background by pressing Ctrl+Z
8. Try writing to the device using the echo command and notice that the breakpoint is not taken.
Figure 99. Executing application
9. Restore the application to the foreground using the fg command
10. Choose option 2 from application and note that the breakpoint is again taken.

Ashling Product Brief APB213 Page 56 of 56
6.6 Known Issues in SMP Linux Debugging
1. SMP Linux kernel stepping will not work when common code (e.g. a module or a driver) is simultaneously accessed by both threads/cores. This will result in an “Error 45: Command not allowed...” message which will be displayed in the GDB console view in PathFinder-XD. If this is an issue then select all-stop mode in the Target Configuration dialog (i.e. uncheck Enable non-stop mode) as shown below:
Figure 100. All-stop mode configuration
2. If a GDB crash occurs during SMP debugging then just re-launch the application being debugged using Download and Launch option; there is no need to exit and restart PathFinder-XD.
3. When multi-core debugging, the Debug view may sometimes not be updated automatically after stepping.
Use the refresh button in the Debug view to force a manual update.
7. Conclusion This APB shows the debugging capabilities of PathFinder-XD when used in-conjunction with the advanced features of the Broadcom BMIPS5000 on-chip debug interface. Powerful features such as multi-core debug, real-time trace capture and Embedded Linux debugging are easily configured and used from within PathFinder-XD’s user-interface. These features allow real-time, non-intrusive debug and analysis of your Broadcom based embedded application thus helping you to achieve on-time delivery to market. We hope you like it! Please send your feedback to [email protected] Doc: APB213-PF-XD_MIPS_BRCM.DOC, Hugh O’Keeffe, Ashling Microsystems