Embed Size (px)
Citation preview

Path planning and optimization in the traveling salesmanproblem: Nearest neighbor vs. region-based strategies
J.M. Wiener1 2 , Nicole N. Ehbauer1 & H.A. Mallot1
November 23, 2006
1Cognitive Neuroscience 2CNRS/Collège de FranceUniversity of Tübingen LPPAAuf der Morgenstelle 28 11, place Marcelin Berthelot
72076 Tübingen 75231 ParisGermany France
Keywords: spatial cognition, navigation, route planning, path complexity, traveling salesman problem,regions, hierarchical planning, nearest neighbor strategy
Abstract
For large numbers of targets, route planning can be a very complex and computationally expensivetask. Human navigators, however, usually solve route planning tasks fastly and efficiently. Here twoexperiments are presented that studied human route planning performance as well as the cognitivestrategies and processes involved. 25 places were arranged on a regular grid in a large room. Each placewas marked by a unique symbol. Subjects were repeatedly asked to solve traveling salesman problems(TSP), i.e. to find the shortest closed loop connecting a given start place with a number of target places.For each trial, subjects were given a so-called ’shopping list’ depicting the symbols of the start place andthe target places. While the exact TSP is computationally hard, approximate solutions can be found bysimple strategies such as the nearest neighbor strategy. Experiment 1 tested whether humans employedthe nearest neighbor (NN) strategy when solving the TSP. Results showed that subjects outperformedthe NN strategy in cases in which the NN strategy did not predict the optimal solution, demonstratingthat the NN strategy is not sufficient to explain human route planning behavior. As a second possiblepath planning strategy a region-based approach was tested in Experiment 2. When optimal routesrequired more region transitions than other, sub-optimal routes, subjects preferred these sub-optimalroutes. This result suggests that subjects first planned a coarse route on the region level and thenrefined this route plan during navigation. Such a hierarchical planning strategy allows to reduce both,computational effort and working memory load during path planning.
1 Introduction
Path planning is a non-trivial problem. Consider planning a route in order to visit multiple locationsin your home town. According to the number of target locations, planning a reasonably short path canbe a very complex and computationally expensive task. This is best demonstrated by the well-knowntraveling salesman problem (TSP). The TSP can be stated as follows: Given a number of target places andthe cost of traveling from one to the other (usually distance), what is the cheapest round trip route thatvisits each target place and returns to the start place. The number of possible round trips is computedas (N-1)!, with N being the number of places to visit. For visiting 5 places and returning to the startingplace 120 different round trips are possible, for visiting 9 cities, already over 360 000 different roundtips are possible. For humans, route planning tasks similar to the TSP are actually quite common, forexample, on a typical shopping route on which multiple stores have to be visited. Usually, humanssolve such route planning tasks fastly and efficiently. Obviously, rather than actually calculating andcomparing all possible path alternatives, human navigators rely on strategies and heuristics allowingfor the reduction of cognitive effort while resulting in reasonably short routes.
1Dagstuhl Seminar Proceedings 05491Spatial Cognition: Specialization and Integrationhttp://drops.dagstuhl.de/opus/volltexte/2007/984

Strategies and heuristics involved in path planning. Route planning and path selection behavior innavigation, both for animals and humans, has been investigated in only few studies. Consequently,knowledge about the underlying mechanisms, strategies, and heuristics as well as the cognitive com-ponents and processes involved is far from comprehensive as emphasized by Golledge (1995): “Tradi-tionally, the path selection problem has been ignored or assumed to be the result of minimizing procedures such asselecting the shortest path, the quickest path or the least costly path.“.
Gärling & Gärling (1988), for example, investigated pedestrian shopping behavior with respect to dis-tance minimization in multi-stop shopping routes. Most shoppers, that minimized the distance of theirshopping routes, first chose the location farthest away, most probably to minimize effort to carry boughtgoods, and then minimized distances locally between shopping locations (see also Gärling, Säisä, Böök,& Lindberg, 1986). This so called locally-minimizing-distance (LMD) heuristics is similar to the near-est neighbor algorithm (NN) in artificial intelligence approaches (e.g. Golden, Bodin, Doyle, & Stewart,1980). The NN-algorithm is a simple algorithm to solve TSPs fastly. From its current location, which cor-responds to the starting location in step one, the NN algorithm visits the closest target location that hasnot been visited before. By simply repeating this procedure until all target locations have been visitedand by returning to the starting place, the NN algorithm usually finds good or near-optimal solutionsfor TSPs of small sizes. On TSPs of large sizes, however, the NN-algorithm is known to often fail infinding reasonably cheap (short) solutions. Christenfeld (1995) studied human subjects’ preference tochoose a certain route from a series of almost identical routes. In three conditions (route choice from ar-tificial maps, from street maps or in real world environments) subjects had the choice between a numberof routes, identical with starting place and target place, metric length, and the number of turns. The onlydifference between the alternative routes was when along the route subjects had to make the turns. In allthree conditions subjects delayed the turning decision as long as possible. Christenfeld suggested thatthis resulted from subjects’ tendency to minimize mental effort, i.e. subjects did not worry about whenand where to turn until they had to turn. This strategy offers a possible explanation for the fact thatpeople’s route choices are often asymmetric; i.e. people choose different routes from A to B than from Bto A (e.g. Stern & Leiser, 1988). Bailenson, Shum, & Uttal (1998) investigated route planning from mapsand formulated the road climbing principle, which states that instead of calculating the globally shortestroute, subjects relied on routes that allowed to leave the region containing the start place sooner ratherthan later. In addition, subjects take the straightness and length of the initial route segment into account(Bailenson, Shum, & Uttal, 2000). This so-called Initial Segment Strategy (ISS) assumes that subjectsprefer routes with the longest initial straight segment above alternative routes of equal length.
Wiener & Mallot (2003) studied the influence of environmental regions on human route planning be-havior in active navigation. For this, subjects first learned virtual environments that were divided intodifferent regions by active navigation and were then asked to solve different route planning and nav-igation tasks, i.e. to find the shortest route connecting a given starting place with a single or multipletarget places. During navigation, subjects minimized the number of region boundaries they crossedduring navigation and preferred paths that allowed for fastest access to the region containing the target.These results not only demonstrate that regional information is explicitly represented in spatial memory,but also demonstrates that route planning takes into account this regional information and is not basedon place information and place-connectivity alone. Wiener & Mallot proposed a cognitive model, thefine-to-coarse planning strategy, to account for the empirical findings. This hierarchical route planningscheme reduces mental effort and working memory load during route planning by using fine spatialinformation for the close surrounding exclusively and coarse spatial information for distant places. Ineveryday route planning, multiple information sources are available, allowing for various wayfindingstrategies. In a series of navigation experiments in virtual environments consisting of multiple regions,Wiener et al. (2004) studied the use and interaction of different route planning strategies. In additionto the fine-to-coarse planning strategy, two other wayfinding strategies could be identified, the cluster-strategy and the least-decision-load strategy. Essentially, the cluster-strategy states that route planningtakes into account the distribution of target locations within an environment, predicting that subjectstry to increase the number of visited targets as fast as possible. The least-decision-load strategy statesthat subjects prefer paths that minimize the number of possible movement decisions. The latter strategycould be employed because the risk of getting lost is smaller on less complex routes.
Further insights into route planning and navigation strategies comes from the animal literature. Gallistel& Cramer (1996), for example, studied vervet monkeys ability to navigate the shortest route connectingmultiple locations, by arranging baited locations in a group of four to one side and a group of two tothe other side. As the nearest baited location of both food patches were equidistant from the starting
2

point, an algorithm like the nearest neighbor algorithm (NN) predicts that the monkeys choose to firstvisit both of the food patches equally often. However, the vervet monkeys first visited the richer foodpatch in all trials (c.f. cluster-strategy). In a second experiment Gallistel & Cramer (1996) arrangedbaited locations in a diamond shape. If the monkeys intended to return to the starting position that waspart of the diamond, because it was baited only after the monkey left it, the monkeys generally chosethe shortest route in this traveling salesman task. Here a NN strategy would predict that the monkeysfollowed a different non-optimal route. Gallistel & Cramer (1996) concluded that the vervet monkeys’route planning algorithm not only took into account the next step (as predicted by the NN), but isindeed planning three steps ahead. Rats, in contrast, have been suggested to use the NN strategy, i.e. torepeatedly visit the nearest not yet visited target, when trained to visit an array of cylindrical feeders inan open field (Bures, Buresova, & Nerad, 1992) (see also Menzel (1973) for chimpanzees’ performancein a modification of the TSP).
Visual versions of the TSP. Human path planning and optimization behavior has been investigatedin several studies by means of visual versions of the Traveling Salesman Problem (e.g., MacGregor &Ormerod, 1996; MacGregor, Ormerod, & Chronicle, 1999, 2000; MacGregor, Chronicle, & Ormerod, 2004;Van Rooij, Stege, & Schactman, 2003; Graham, Joshi, & Pizlo, 2000; Vickers, Lee, Dry, & Hughes, 2003b;Vickers, Bovet, Lee, & Hughes, 2003a; Vickers, Lee, Dry, Hughes, & McMahon, 2006). In these experi-ments subjects are usually confronted with a number of dots on a computer monitor. Subjects’ task is toconnect these dots by straight line segments such that the resulting path (tour) is optimal with respect tooverall length. Generally, results from these studies show that humans are very good in solving visualTSPs. There is an ongoing debate on the strategies subjects applied in these experiments. MacGregor& Ormerod (1996), for example, have proposed that humans apply the convex hull method, assumingthat subjects used the convex hull as part of their strategy (see also MacGregor et al., 2000, 2004). Theconvex hull is easily visualized by imagining an elastic band stretched open to encompass all dots; whenreleased, it will assume the shape of the convex hull, touching all boundary dots of the TSP (the remain-ing cities are referred to as interior cities). Afterwards, the segment of the elastic band which is closestto an unconnected dot, will be stretched to include that dot into the tour. This latter step is repeateduntil all dots are incorporated in the overall tour. MacGregor & Ormerod (1996) argue that the fact thata tour that follows the convex hull method is by definition free of crossings and that humans tend toavoid crossings is one important piece of supporting evidence for the convex hull method. Van Rooijet al. (2003), however, argue that subjects know that crossings will result in sub-optimal solutions. Theyhave proposed the crossing avoidance hypothesis, stating that humans avoid crossings when solvingTSPs, rather than following the convex hull method. Vickers et al. (2003a) proposed a hierarchical near-est neighbor (NN) method, assuming that subjects first establish clusters of several cities based on NNdistances, which they then sequentially link into a tour, using some variant of the nearest neighbor al-gorithm. Graham et al. (2000) proposed another hierarchical model, assuming that from the originalstimulus (dot pattern) a series of images are generated which are increasingly blurred and compressed.By these means a hierarchy of images is generated in which neighboring dots collapse to clusters. Thealgorithm then starts with generating a tour upon an image which is so high in the hierarchy that only3 clusters exist. By progressively moving to the next lower layer in the hierarchy further clusters, andeventually dots, are inserted into the tour.
The objective of this study is to develop an increased understanding of the cognitive components andprocesses involved in human navigation by studying planning and navigation behavior when solvingTSPs. It is therefore important to consider differences between visual TSPs, as introduced above, andnavigational TSPs, as studied here. For example, as subjects actively move through the environment innavigational TSPs, their spatial relation to the different target places constantly changes. Accordingly,subjects permanently have to deal with perspective changes and they usually do not have an overviewof the environment as a whole. Also, in the visual TSPs, the path from the start to the current location isdisplayed as a polygonal line segment during the trial and subjects are allowed to correct their choicesby undoing links between cities. Both of the latter properties are usually not available during real worldnavigation. Moreover, in everyday path planning, the navigator is faced with a number of memorytasks that are absent in visual TSPs. For example, if no external representation of space (e.g., a streetmap) is available, the target locations have to be retrieved from spatial memory. Additionally, once thetargets have been localized, they have to be held active in a working memory during the actual processof planning a path. Here, it can be assumed that navigators have to deal with different memory relatedconstraints, such as imprecise spatial knowledge or capacity limits of working memory. While this list is
3
far from being comprehensive, it demonstrates that solving visual TSPs and navigational TSPs can not,a priori, be assumed to be based on the same cognitive principles.
Local and global path planning. In the field of artificial intelligence, route planning algorithms areusually classified as either local or global. Global route planning algorithms take into account all theinformation available. The entire route is planned from the start to all goal locations before the first moveis executed. Local planning algorithms, on the other hand, plan only few steps or even only a single stepahead. A prototypical example for a local planning algorithm is the nearest neighbor algorithm (NN)for solving the TSP. As introduced before, at each step the NN simply selects and visits the closestnon-visited target location. In the field of human spatial cognition, another class of algorithms, thehierarchical planning algorithms, have been used to explain subjects navigation behavior. Hierarchicalplanning algorithms reduce computational effort during route planning by using spatial information atdifferent levels of abstraction (e.g., fine-to-coarse planning strategy introduced above Wiener & Mallot,2003). Kuipers, Tecuci, & Stankiewicz (2003), for example, have proposed a route planning scheme thatis mainly based on a ’skeleton’, i.e. a well-known subset of all paths in the environment. Rather thantaking all paths into account during route planning, primarily the skeleton of well-known routes is used.Using such an abstraction of the environment reduces search space during route planning and thereforereduces computational effort.
Synopsis. In this work, two navigation experiments studying cognitive strategies underlying pathplanning behavior are presented. In the experiments subjects were repeatedly asked to solve differenttraveling salesman problems (TSP). By varying the number of target places to visit, subjects general per-formance in solving TSPs in active navigation was studied. The cognitive strategies that subjects appliedduring path planning and navigation were studied by varying the characteristics of the experimental en-vironment and the specific route planning tasks. For each strategy in question, we designed two typesof TSP tasks, one in which application of the strategy yields optimal solutions (strategy-adequate tasks)and one in which application of the strategy yields suboptimal solutions (strategy-inadequate tasks). Ifa particular strategy is used by the subjects, we expect better performance in the according strategy-adequate tasks. Special interest concerned the role of the Nearest Neighbor (NN) Strategy, the role ofenvironmental regions, and the role of spatially clustered targets for path planning.
2 Experiment 1
2.1 Motivation
This experiment pursued two main purposes. First, it was designed to test for subjects’ general per-formance in solving TSPs by active navigation. For this, subjects’ performance of finding the shortestpath in TSPs with varying number of targets was evaluated. Second, the experiment tested for the con-tribution of two simple route planning strategies, the Nearest Neighbor (NN) strategy and the cluster-strategy (see Section 1), when solving TSPs.
2.2 Material & Methods
2.2.1 The experimental setup
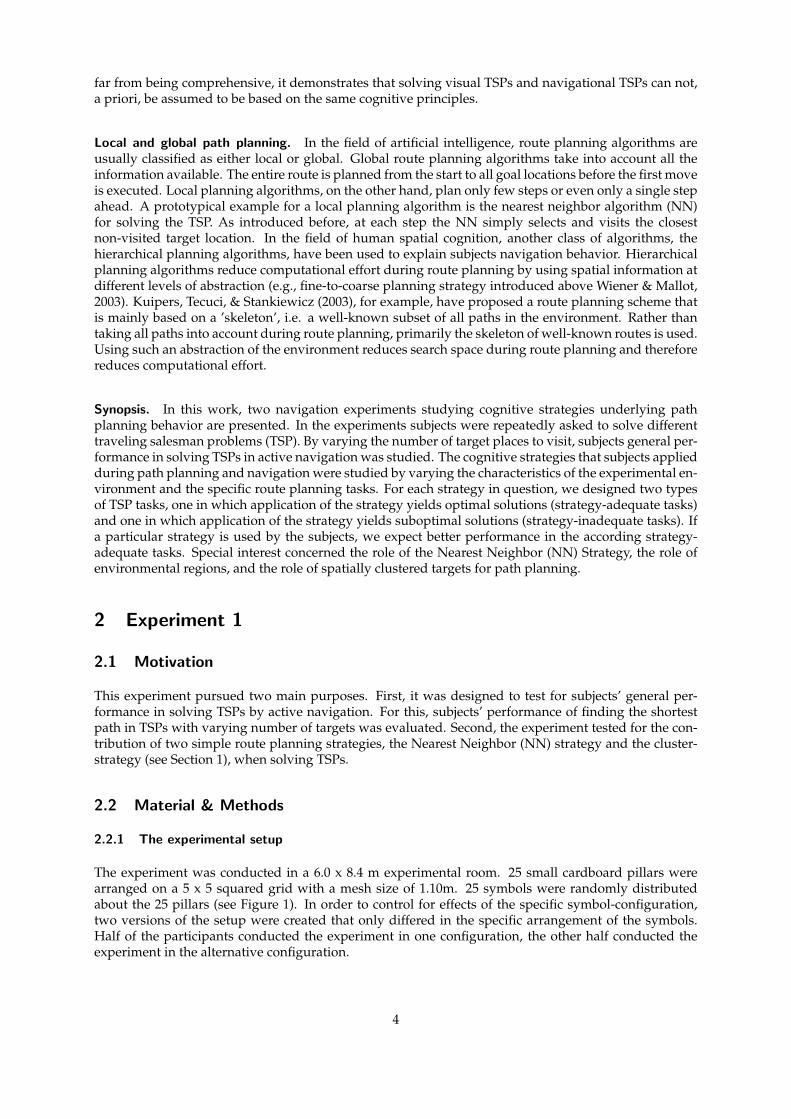
The experiment was conducted in a 6.0 x 8.4 m experimental room. 25 small cardboard pillars werearranged on a 5 x 5 squared grid with a mesh size of 1.10m. 25 symbols were randomly distributedabout the 25 pillars (see Figure 1). In order to control for effects of the specific symbol-configuration,two versions of the setup were created that only differed in the specific arrangement of the symbols.Half of the participants conducted the experiment in one configuration, the other half conducted theexperiment in the alternative configuration.
4

Figure 1: Left: schematic drawing of the experimental setup; right: subject solving a navigation task.
Figure 2: Example of a ’shopping list’ for a navigation task with 9 target places.
2.2.2 Navigation tasks
During the experiment, subjects were asked to solve different navigation tasks, i.e. to solve differenttraveling salesman tasks (TSP). For each TSP they received a specific ’shopping list’ depicting the symbolthat defined the start place and the symbols that defined the target places that had to be visited duringnavigation. Subjects were given the lists one at a time and upside-down, such that they could not seewhat was on the list. They were, however, verbally informed about the start place and asked to moveto that start place. After subjects reached the start place, they were allowed to turn around the shoppinglist and the trial started. Subjects’ task was to navigate the shortest route connecting the start place withall target-places and return to the start place. During navigation, subjects kept the shopping list andmarked the target places they had already visited with little black markers.
In order to control for the influence of the specific sequence of the symbols depicted on the shopping list,two versions of each shopping list were generated. Half of the participants received one version of theshopping lists, while the other half received the other version of the shopping lists.
Types of navigation tasks. Each subject solved 36 different TSPs consisting of 4, 5, 6, 7, 8 or 9 targetplaces (see Table 1). The 36 navigation tasks could be further subdivided into three types, the NN-adequate tasks, the NN-inadequate tasks, and the cluster-tasks (NN-ambiguous tasks) (see Figure 3).
1. NN-adequate tasks: For these set of navigation tasks, the predictions of the NN algorithm wereidentical with the optimal, i.e. the shortest possible, path (see Figure 4).
2. NN-inadequate tasks: For these set of navigation tasks, the NN strategy did not generate the opti-mal path (see Figure 4). If subjects applied the NN strategy on these TSPs, they were systematicallylead on paths longer than the optimal paths.
3. Cluster tasks (NN-ambiguous): On cluster tasks the target places were distributed in two distincttarget clusters of unequal size. In contrast to NN-adequate and NN-inadequate tasks, these TSPswere NN-ambiguous, i.e., the nearest neighbor algorithm did not make clear predictions for asingle path. First, because the closest target places were always equidistant from the starting place,and second, because similar situations also re-occur during navigation, i.e. close target places wereequidistant from the current position.
5

Figure 3: Example TSPs with six target places for the NN-adequate tasks (left), the NN-inadequate tasks (middle),and the cluster tasks (right). Start places are represented by grey circles, target places are represented by solidblack circles, and black lines depict the optimal paths.
Navigation Tasks Number of target places Start place (target places)
cluster 4
5 19 (20,15,14,7 ), 21 (19,20,15,14),
6
7
89 20 (9,10,5,4,3,8,17,18,23), 21 (6,1,2,7,8,3,4,20,24)
control
NN-adequate 4 3 (11,22,19,10), 6 (17,24,15,4)5 11 (16,23,14,3), 21 (24,15,4,1,12)
6
7
8
9control 15 (19,24,22,16,12,1,4), 1 (4,10,14,19,22,16,12,7), 10 (4,8,2,1,11,16,18,24,20)
NN-inadequate 4 3 (16,23,25,13), 1 (13,10,19,21)5 21 (24, 14,13,3,2), 11 (21,13,10,4,7)
6
7
8
9
control
3 (17,16,22,19), 15 (8,17,23,18)
4 (1,6,18,23,24,19), 25 (10,5,4,9,8,22)
11 (18,24,10,9,4,3,8), 5 (2,1,6,7,19,24,20)
23 (14,15,10,5,4,9,6,12), 24 (22,21,16,11,17,14,9,15)
16 (6,1,2,7,18,19,23), 1 (3,4,12,17,22,21,16,11), 3 (12,11,17,19,24,25,20,15,14)
22 (23,19,15,8,2,16), 25 (14,9,8,2,6,16)
5 (15,25,18,16,11,1,2), 24 (15,10,3,7,11,17,18)
20 (19,24,22,12,6,2,4,9), 3 (8,12,11,22,23,19,20,15)
25 (20,14,9,10,5,2,1,12,21), 23 (24,25,20,9,7,6,11,16,17)
23 (19,10,5,13,7,16), 4 (8,1,11,12,24,20)
16 (12,13,19,25,9,8,1), 5 (9,20,13,18,22,16,2)
1 (11,22,25,18,13,8,5,2), 3 (2,12,21,18,20,14,9,5)
24 (18,21,12,7,6,1,3,5,19,24), 23 (19,14,10,5,8,2,6,16,22,23)
15 (25,23,22,13,14,4,5), 6 (3,9,10,15,19,18,21,12), 25 (24,18,22,21,11,12,13,9,15,25)
Table 1: The table lists all navigation tasks of Experiment 1. The starting place is followed by the target places(in brackets). The numbers correspond to the place numbers in the schematized drawing of the experimentalenvironment (see Figure 1).
6

2.2.3 Control condition.
In the control condition, subjects solved 12 TSPs. Here, the target places themselves were marked withblack markers, i.e. all the target locations were visually identifiable from the start position withoutthe help of the shopping lists. In contrast to the experimental condition, here subjects did not have toidentify, localize, and remember the target positions. By these means the contribution of these cognitiveprocesses for subjects’ performance when solving the TSP could be studied.
Before each trial, subjects were asked to close their eyes. They were led to the start place and were ori-ented towards the wall rather than towards the experimental setup. The experimenter now distributedthe markers according to the specific TSP. Only afterwards subjects were allowed to turn around, nowfacing the experimental setup, and to start the trial. While half of the subjects performed the controlcondition before the experimental condition, the other half performed the control condition after theexperimental condition.
2.2.4 Participants
24 subjects (12 females, 12 males, mean age: 22.88 years) participated in the experiment. They weremostly university students and were paid 8 Euro an hour.
2.2.5 Analysis
Subjects trajectories, i.e. the sequence of places visited, were recorded for each TSP and the length of thistrajectory was calculated, assuming linear route segments between target points. For each navigationtask also the shortest possible path was computed. By dividing the length of the traveled path by thelength of the shortest possible path an overshoot value was obtained. By subtracting 1 and multiplyingthe result with 100 the overshoot in percent was obtained. An overshoot value of 100% therefore corre-sponded to a path with twice the length of the shortest possible path. Furthermore, the percentage oftrials in which subjects actually found the shortest possible route was calculated (found optimal route).For each trial also the start time, i.e. the time from turning around the shopping route until starting tonavigate was recorded.
The error bars of all barplots in this study display standard errors of the mean (s.e.m.).
2.3 Hypotheses and predictions
General predictions. It was expected that subjects’ navigation performance, i.e. subjects’ performanceof finding the shortest possible route, decreased with increasing number of targets of the TSP. Thisexpectation was supported by two considerations. First, the number of route alternatives that has to beconsidered in route planning increases with higher numbers of targets. Second, working memory loadis higher if more targets have to be memorized and dealt with. At some point, it will not be possibleto simultaneously hold the positions of all target places in working memory such that paths can not beplanned taking all targets into account. Accordingly, as in the control condition, subjects did not haveto identify and remember the positions of the target places based on the shopping list, it is expected thatperformance in the control condition clearly exceeded performance in the experimental condition.
The following list summarizes the predictions for the different types of navigation tasks designed to testthe assumed path planning heuristics, i.e. the NN-strategy and the cluster strategy.
1. NN-adequate tasks: If subjects applied the NN-strategy, they should be led along the optimalroute (see Figure 4).
2. NN-inadequate tasks: If subjects followed the NN-strategy, they should systematically fail to findthe optimal paths on these routes (see Figure 4).
3. Cluster tasks (NN-ambiguous): The NN strategy did not make predictions for cluster-routes. Thecluster strategy, however, states that subjects plan their routes such that they visit as many targetsplaces as fast as possible (see Wiener et al., 2004), thus predicting that subjects first visit the largetarget cluster rather than the small target cluster.
7

Figure 4: Predictions of the NN strategy for the NN-adequate task (left) and NN-inadequate task (right) depictedin Figure 3.
2.4 Results
2.4.1 Experimental Condition
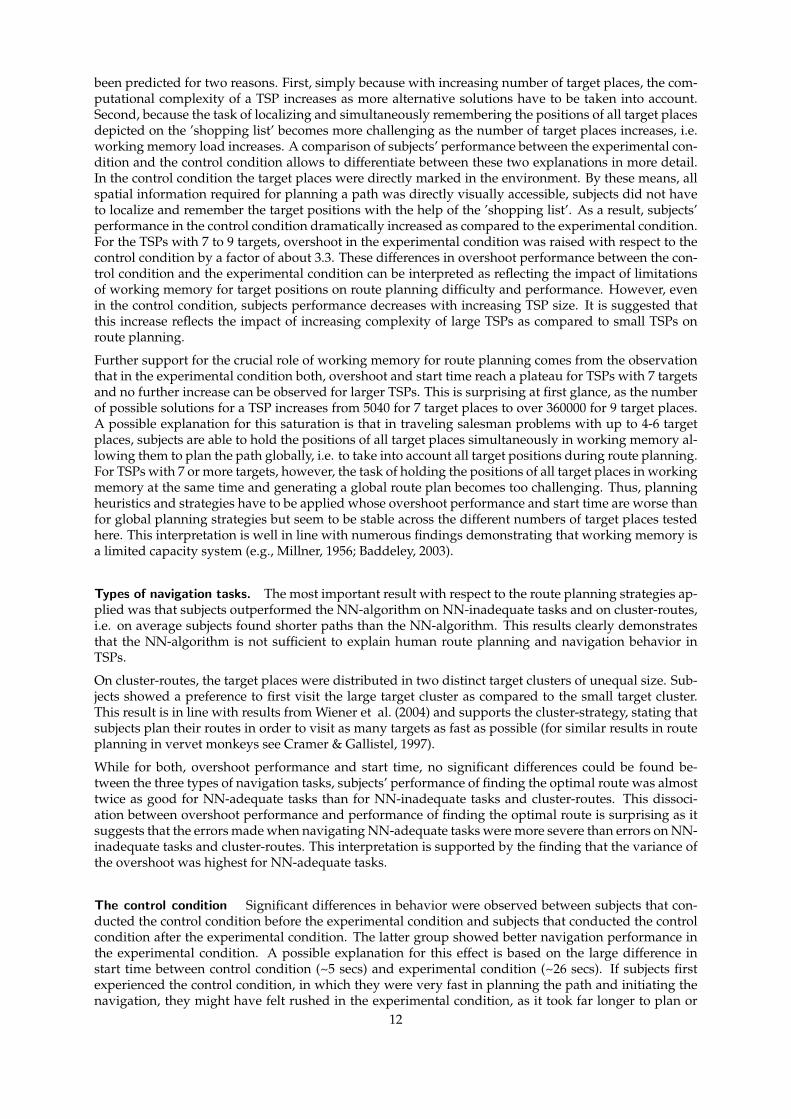
Overshoot Subjects’ overshoot performance when solving the TSPs was remarkably good. On aver-age, overshoot in the experimental condition was 5.86%. Even for the most complex navigation tasks (9targets), subjects produced less than 10% overshoot (see Figure 5). For three of the TSPs with 9 targets,the overshoot values for all 362880 path alternatives was exemplarily calculated (see histogram in Fig-ure 6). Less than .04% of all path alternatives produced comparable or smaller overshoot values thansubjects.
An ANOVA revealed a highly significant main effect of the number of targets (F=17.25, df=5, p<.001),while no main effect for the type of navigation task (F=1.57, df=2, p=.22) and no interaction (F=1.53,df=10, p=.13) were found. While no significant significant effect between the different types of nav-igation tasks was found, overshoot values in NN-adequate tasks showed the highest variance (RS-adequate:120.1, RS-inadequate: 100.38, cluster: 71.67). Subjects’ overshoot increased with increasingnumber of targets (Pearson’s product-moment correlation: r=.94, p<.01). In experimental block 1 sub-jects produced slightly higher overshoot values than in experimental block 2 (6.43% vs. 5.04%, pairedt-test: t=2.29, df=23, p=.03). Overshoot performance did not differ between female and male subjects(6.71% v 4.76%, t-test: t=1.63, df=22, p=.12).
Found Correct Route. On average subjects found the shortest possible route in 47.3% of the trials. AnANOVA revealed a highly significant main effects for the number of targets (F=25.37, df=5, p<.001) andthe type of navigation task (F=79.09, df=2, p<.001) as well as a significant interaction (F=6.88, df=10,p<.001). While a Pearson’s product-moment correlation revealed only a marginally significant correla-tion between performance of finding the optimal route and the number of target places (r=-.80, p=.055),a highly significant difference was found between ’easy’ tasks, i.e. tasks with 4-6 targets, and ’difficult’tasks, i.e. tasks with 7-9 targets (32.7% vs 61.6%, paired t-test: t=8.89, df=23, p<.001). Performance offinding the optimal route did not differ between female and male subjects (44.13% vs 50.87%, t-test:t=-1.43, df=22, p=.17)
Subjects’ performance in finding the optimal route did not differ between cluster tasks and NN-inadequatetasks (34.28% vs 35.86%, paired t-test: t=.47, df=23, p=.64), but differed both, between cluster tasks andNN-adequate tasks (34.28% vs 72.32%, paired t-test: t=10.88, df=23, p<.001), and between NN-adequatetasks and NN-inadequate tasks (72.32% vs 35.86%, paired t-test: t=10.19, df=23, p<.001).
Start time. On average subjects’ start time was 22.10 seconds. An ANOVA revealed a highly sig-nificant main effect for the number of targets (F=24.02, df=5, p<.001) while no main effect for type ofnavigation task (F=1.75, df=2, p=.19) and no interaction (F=1.21, df=10, p=.29) was found. Subjects’ starttime increased with increasing number of targets (Pearson’s product-moment correlation: r=.95, p<.01).Start time did not differ between female and male subjects (23.2 sec v 20.9 sec, t-test: t=.63, df=22, p=.53).
8
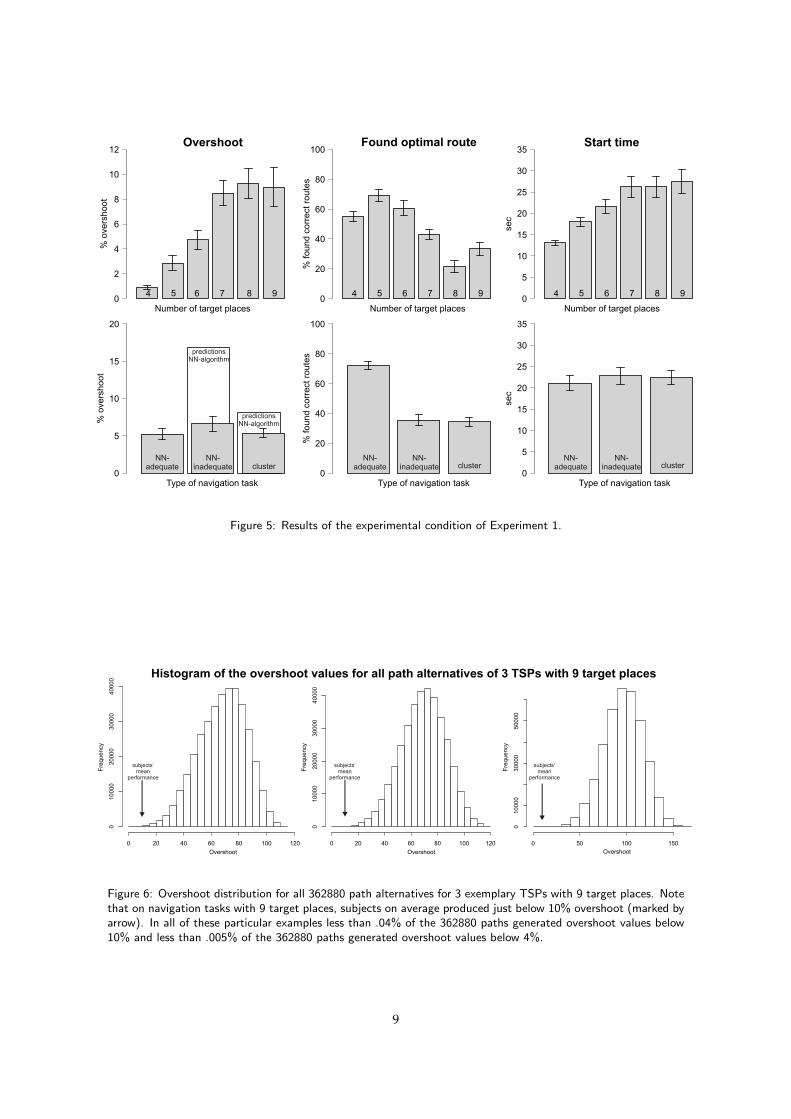
Figure 5: Results of the experimental condition of Experiment 1.
Figure 6: Overshoot distribution for all 362880 path alternatives for 3 exemplary TSPs with 9 target places. Notethat on navigation tasks with 9 target places, subjects on average produced just below 10% overshoot (marked byarrow). In all of these particular examples less than .04% of the 362880 paths generated overshoot values below10% and less than .005% of the 362880 paths generated overshoot values below 4%.
9

mean T p-value
Shopping list list A list Bovershoot in % 6.29 5.18 .89 22 .38start time in seconds 21.56 22.64 .30 22 .77found correct routes in % 44.71 50.28 1.16 22 .26
Configurationovershoot in % 5.18 6.29 .88 22 .38start time in seconds 24.44 19.75 1.37 22 .19found correct routes in % 49.10 45.89 .65 22 .52
Control condition before afterovershoot in % 7.26 4.21 2.79 22 .01 *start time in seconds 18.14 26.05 2.52 22 .02 *found correct routes in % 42.46 52.53 2.26 22 .04 *
df
config A config B
Table 2: Results of t-tests on the influence of the various control factors.
Control parameters. Neither the control parameters shopping list, i.e. the specific arrangement of thesymbols on the shopping lists (see Section 2.2.2) nor configuration, i.e. the specific arrangement of thesymbols in the environments (see Section 2.2.1) had a significant influence on overshoot performance,start time, or performance in finding the optimal route (see Table 2). However, systematic differenceswere found, depending on whether the control condition was carried out before or after the experimen-tal condition (see Section 2.2.3). Subjects showed better navigation performance and longer start timeswhen they conducted the control condition after the experimental condition (see Table 2).
Predictions of the NN-algorithm. The overshoot predictions when using a NN strategy were cal-culated for the different types of navigation tasks: for NN-adequate tasks it was obviously 0%, forNN-inadequate tasks it was 16.92% and for cluster-tasks it was 8.13% (Note that cluster tasks were NN-ambiguous: the NN strategy did not predict a single but multiple solutions as it was faced with one ormultiple situations along the path in which the closest target places were equidistant from the currentposition). Subjects’ overshoot for both, the cluster-tasks and the NN-inadequate tasks was significantlysmaller than predicted by the NN-algorithm (cluster-tasks: 5.38% vs 8.13%, t-test: T=4.39, df=23, p<.001;NN-inadequate tasks: 6.60% vs 16.92%, t-test: T=10.56, df=23, p<.001) .
Correlations between subjects’ start time and overshoot performance. Subjects’ mean start time wasnegatively correlated with subjects’ overshoot performance (r=-.42, p=.04), demonstrating that subjectswho took longer before initiating the trial showed better navigation performance.
Cluster tasks. On cluster tasks the target places were distributed in two distinct target clusters ofunequal size. Overall, subjects showed a significant preference to first visit the large cluster (59.02% vschance level [50%], t-test: t=3.09, df=23, p<.01).
2.4.2 Control condition
Overshoot. On average subjects’ overshoot in the control condition was 2.71%. An ANOVA revealeda main effect of the number of targets (F=6.41, df=2, p<.01) and type of navigation task (F=11.80, df=2,p<.01), while no significant interaction was found (F=1,59, df=4, p=.18). Overshoot increased with in-creasing number of targets. In contrast to the experimental condition, here overshoot for NN-adequatetasks was smaller than for NN-inadequate tasks (.96% vs 2.60%, paired t-test: t=2.71, df=23, p=.01) andfor cluster-tasks (.96% vs 4.55%, paired t-test: t=4.48, df=23, p<.001).
Found correct routes. In the control condition subjects’ found the optimal route in 62.5% of the tri-als. An ANOVA revealed significant main effects of the number of targets (F=4.38, df=2, p=.02) andtype of navigation tasks (F=45.35, df=2, p<.001) as well as an significant interaction (F=6.01, df=4,p<.001). Performance of finding the optimal route was stronger for NN-adequate tasks than for both,NN-inadequate tasks (88.9% vs 68.1%, t-test: t=4.73, df=23, p<.001) and cluster tasks (88.9% vs 30.6%,
10

Figure 7: Results of the control condition of Experiment 1.
t-test: t=9.56, df=23, p<.001). In contrast to the experimental condition, subjects’ performance for theNN-inadequate tasks was higher than for the cluster-tasks (68.1% vs 30.6%, t-test: t=4.94, df=23, p<.001).
Start time. On average subjects’ start time in the control condition was 5.31 seconds. An ANOVArevealed a main effect for the type of navigation task (F=4.19, df=2, p=.02) while no main effect of thenumber of targets (F=2.08, df=2, p=.14), and no interaction was found (F=1.39, df=4, p=.24).
Comparison experimental-condition and control-condition. In the control condition, subjects weretested only on TSPs with 7, 8, and 9 targets. They showed a significant reduction both for overshootand start time as compared to the experimental condition on routes with 7,8, and 9 targets (overshootcontrol: 2.71%, overshoot experiment: 8.72%, paired t-test: t=5.98, df=23 , p<.001, start time control:5.31 sec, start time experiment: 26.66 sec, paired t-test: t=9.13, df=23 , p<.001). In the control condition,subjects’ performance of finding the optimal path almost doubled as compared to navigation tasks with7,8, and 9 targets in the experimental condition (control: 62.5%, experimental: 32.7%, t-test: t=8.31,Df=23, p<.001).
2.5 Discussion
Overall, subjects overshoot performance when solving the TSPs was remarkably good. On average,subjects produced less than 6% overshoot. Even for the most complex navigation tasks with 9 targets,subjects produced ~10% overshoot in the experimental condition and only ~4% overshoot in the controlcondition. The fact that less than .04% of all path alternatives of TSPs with 9 targets produce overshootvalues below 10%, and less than .005% produced overshoot values below 4% emphasizes subjects’ goodperformance.
Number of target places. With increasing size of the TSPs, subjects performance for finding the op-timal solution decreased while subjects’ start time increased. These results were expected and have
11
been predicted for two reasons. First, simply because with increasing number of target places, the com-putational complexity of a TSP increases as more alternative solutions have to be taken into account.Second, because the task of localizing and simultaneously remembering the positions of all target placesdepicted on the ’shopping list’ becomes more challenging as the number of target places increases, i.e.working memory load increases. A comparison of subjects’ performance between the experimental con-dition and the control condition allows to differentiate between these two explanations in more detail.In the control condition the target places were directly marked in the environment. By these means, allspatial information required for planning a path was directly visually accessible, subjects did not haveto localize and remember the target positions with the help of the ’shopping list’. As a result, subjects’performance in the control condition dramatically increased as compared to the experimental condition.For the TSPs with 7 to 9 targets, overshoot in the experimental condition was raised with respect to thecontrol condition by a factor of about 3.3. These differences in overshoot performance between the con-trol condition and the experimental condition can be interpreted as reflecting the impact of limitationsof working memory for target positions on route planning difficulty and performance. However, evenin the control condition, subjects performance decreases with increasing TSP size. It is suggested thatthis increase reflects the impact of increasing complexity of large TSPs as compared to small TSPs onroute planning.
Further support for the crucial role of working memory for route planning comes from the observationthat in the experimental condition both, overshoot and start time reach a plateau for TSPs with 7 targetsand no further increase can be observed for larger TSPs. This is surprising at first glance, as the numberof possible solutions for a TSP increases from 5040 for 7 target places to over 360000 for 9 target places.A possible explanation for this saturation is that in traveling salesman problems with up to 4-6 targetplaces, subjects are able to hold the positions of all target places simultaneously in working memory al-lowing them to plan the path globally, i.e. to take into account all target positions during route planning.For TSPs with 7 or more targets, however, the task of holding the positions of all target places in workingmemory at the same time and generating a global route plan becomes too challenging. Thus, planningheuristics and strategies have to be applied whose overshoot performance and start time are worse thanfor global planning strategies but seem to be stable across the different numbers of target places testedhere. This interpretation is well in line with numerous findings demonstrating that working memory isa limited capacity system (e.g., Millner, 1956; Baddeley, 2003).
Types of navigation tasks. The most important result with respect to the route planning strategies ap-plied was that subjects outperformed the NN-algorithm on NN-inadequate tasks and on cluster-routes,i.e. on average subjects found shorter paths than the NN-algorithm. This results clearly demonstratesthat the NN-algorithm is not sufficient to explain human route planning and navigation behavior inTSPs.
On cluster-routes, the target places were distributed in two distinct target clusters of unequal size. Sub-jects showed a preference to first visit the large target cluster as compared to the small target cluster.This result is in line with results from Wiener et al. (2004) and supports the cluster-strategy, stating thatsubjects plan their routes in order to visit as many targets as fast as possible (for similar results in routeplanning in vervet monkeys see Cramer & Gallistel, 1997).
While for both, overshoot performance and start time, no significant differences could be found be-tween the three types of navigation tasks, subjects’ performance of finding the optimal route was almosttwice as good for NN-adequate tasks than for NN-inadequate tasks and cluster-routes. This dissoci-ation between overshoot performance and performance of finding the optimal route is surprising as itsuggests that the errors made when navigating NN-adequate tasks were more severe than errors on NN-inadequate tasks and cluster-routes. This interpretation is supported by the finding that the variance ofthe overshoot was highest for NN-adequate tasks.
The control condition Significant differences in behavior were observed between subjects that con-ducted the control condition before the experimental condition and subjects that conducted the controlcondition after the experimental condition. The latter group showed better navigation performance inthe experimental condition. A possible explanation for this effect is based on the large difference instart time between control condition (~5 secs) and experimental condition (~26 secs). If subjects firstexperienced the control condition, in which they were very fast in planning the path and initiating thenavigation, they might have felt rushed in the experimental condition, as it took far longer to plan or
12

prepare the route. Accordingly, they spent less time in localizing and remembering the target placesand planning the route, which could either result in clearly sub-optimal route plans or in errors such asforgetting target places along the route. Such errors usually have to be corrected by taking large detours.This interpretation is supported by the finding that the group of subjects who first conducted the controlcondition showed shorter start time in the experimental condition as compared to the group that firstconducted the experimental condition.
Interviews with subjects. Further insights into possible strategies and mechanisms applied came frominformal interviews with the subjects after the experiments. Most subjects reported to have applied oneof two strategies when faced with large TSPs. The first strategy was based on a regionalization of theenvironment. Subjects reported that they individually subdivided the 25 target places into a numberof different regions. During route planning they then assigned the target places to be visited to theseregions, allowing them to first plan a coarse route visiting the relevant regions. Such a coarse route issimple and easily remembered and the fine route plan can then be created by inserting close target placesduring navigation. The second strategy reported was to first select a subset of target places depicted onthe shopping list according to some criteria, for example color. Then a coarse route plan was generatedtaking into account only the selected subset of target places. Again this route plan is simple and easilyremembered and can be refined either before or during navigation by inserting the missing target placesinto the route.
Both of the reported navigation strategies follow essentially the same logic: they simplify the routeplanning task by applying a hierarchical planning scheme. First, a coarse route that is simple and easyto remember is generated on basis of an abstraction of the environment. This route plan is then refinedduring navigation by inserting target places.
Also results from the cluster-tasks, demonstrating that subjects preferred to first visit the large targetcluster, can be interpreted in terms of such hierarchical planning schemes. If subjects understood thatthe target places were arranged in two distinct target clusters in these tasks, this information essentiallyrepresented an abstraction of the environment that reduced the number of targets to two: the largecluster and the small cluster. If one assumes that the attractivity of a target cluster or target region,respectively, correlates with the number of actual targets residing within that cluster (or region), a coarseroute plan takes the form of: (1.) visit the large cluster, (2.) visit the small cluster, (3.) return to startplace. Only when entering a target cluster a fine route plan has to be generated that determines thesequence in which single target places within that cluster are visited.
3 Experiment 2
3.1 Motivation
In Experiment 1, informal interviews with subjects suggested that one possible route planning and nav-igation strategy was based on a subjective regionalization of the environment (see Section 2.5). If basedon regions, route planing becomes a hierarchical process. First, a coarse route plan is generated on thelevel of the regions exclusively. This route plan is then refined during navigation. Employing sucha region-based planning scheme proposes that subjects first visit all target places in one region beforemoving on to the next region. This experiment was designed to empirically test this region-based plan-ning strategy. For this, the environment was subdivided into different regions and subjects had to solvesimilar TSPs as in Experiment 1.
3.2 Material and methods
3.2.1 The experimental setup
The experimental setup was identical to Experiment 1, but differed in the arrangement of the symbolson the 5x5 grid. Symbols of equal color were neighboring each other, thus creating 5 clearly distinct
13

Figure 8: Experimental setup of Experiment 2. By arranging the symbols according to their color, 5 distinctregions were generated.
regions in the environment (see Figure 8). As in Experiment 1, two versions of the setup were createdthat only differed in the specific arrangement of the symbols in order to control for effects of the specificsymbol-configuration. Half of the participants conducted the experiment in one configuration, the otherhalf conducted the experiment in the alternative configuration.
3.2.2 The navigation tasks
The general navigation task, i.e. solving the TSP, was identical to the experimental condition of Exper-iment 1 (see Section 2.2.2). Subjects were given a shopping list for each navigation task, depicting thesymbol defining the start place and the symbols defining the target places that had to be visited duringnavigation. To control for the influence of the specific sequence of symbols depicted on the shopping list,two versions of each shopping list were generated. Half of the participants received one version of theshopping lists, while the other half received the other version of the shopping lists.
As in Experiment 1, each subject solved 36 TSPs consisting of 4, 5, 6, 7, 8, or 9 target places (for a detaileddescription of all routes see Table 1). Each navigation task could be assigned to one of two types, theRegion-Strategy adequate tasks (RS-adequate tasks) and the Region-Strategy-inadequate tasks (RS-inadequatetasks) (see Figure 9).
1. Region-Strategy-adequate tasks (RS-adequate): If subjects employed a region-based planningstrategy, i.e. if subjects first visited all targets in one region before moving on to the next region,it was possible to find the optimal route (see Figure 9). By these means, a region-based strategycould support finding the optimal route.
2. Region-Strategy-inadequate tasks (RS-inadequate): Employing a region-based planning strategyon RS-inadequate tasks will systematically lead to sub-optimal paths (see Figure 9). Furthermore,if routes are planned on the region level, the resulting paths should systematically cross fewerregion boundaries as compared to the optimal path.
It is important to note that the configuration of start place and target places was always identical forpairs of two TSPs, one of which always was a navigation task from the RS-adequate group while theother routes always was of the RS-inadequate group. Any differences in behavior between the RS-adequate and the RS-inadequate group can thus be clearly attributed the the region characteristics ofthe navigation tasks.
3.2.3 Participants
24 subjects (15 females, 9 males, mean age: 25.13 years) participated in the experiment. They weremostly university students and paid 8 Euro an hour.
14

Figure 9: Examples for a RS-adequate task (left) and a RS-inadequate task (right). Grey circles represent thestarting places, solid black circles represent target places, and the black line represents the optimal solution. Ifroutes are planned on the region level, solution to the RS-adequate TSPs should be optimal while solution foundfor RS-inadequate TSPs should be more prone to error. Note that these two routes are identical with respect tonumber of targets, spatial configuration of start and target places, and therefore also with respect to the optimalsolution. The two different types of navigation tasks used in Experiment 2 are generated by simply mirroringand/or shifting the configuration of start and target places.
Navigation task Number of target places Start place (target places)
RS-adequate 4 6(9,5,10,19), 22(12,3,13,20), 6(7,13,15,17)
5 22(12,2,4,5,18), 17(11,13,4,15,19), 25(13,7,4,5,9) 6 13(22,20,14,9,5,7), 25(13,7,3,4,5,9), 2(17,21,22,23,19,18) 7 9(8,1,12,11,21,17,18), 11(6,8,14,10,15,25,19), 1(16,12,13,18,24,14,9) 8 4(9,14,19,23,16,17,13,2), 10(9,8,13,12,11,16,21,19), 20(18,17,21,16,7,13,9,10) 9 15(9,3,7,13,12,11,16,22,24), 9(4,5,10,14,19,25,24,18,8), 10(4,8,2,1,16,13,18,24,20)
RS-inadequate 4 23(18,14,4,20), 15(12,6,11,22), 5(15,24,14,7) 5 20(24,14,7,4,10), 10(18,22,11,6,12), 1(3,5,15,20,7) 6 12(21,19,13,8,4,6), 20(17,21,16,11,7,12), 10(18,22,16,11,6,12) 7 6(1,3,9,5,10,20,14), 21(6,12,13,8,4,14,19), 20(19,22,13,12,2,8,9) 8 11(13,14,20,15,4,8,2,1), 25(20,15,14,9,4,3,2,18), 1(2,3,4,10,19,14,8,11) 9 20(19,24,23,18,14,9,3,4,10), 6(2,8,4,5,20,13,18,22,16), 11(22,24,20,15,14,13,9,3,7)
Table 3: The table lists all routes of Experiment 2. The starting place is followed by the target places (in brackets).The numbers correspond to the place numbers in the schematized drawing of the experimental environment (seeFigure 8).
15

Figure 10: Analysis on the region level (each region is is represented by a capital-letter): On the region level theleft route (RS-adequate) is described as C-C-D-D-D-A-E-B-B-C while the right route (RS-inadequate) is describedas D-A-A-A-B-B-C-B-E-D.
3.2.4 Analysis
In addition to the analysis described in Section 2.2.5, in this experiment subjects’ trajectories were alsoanalyzed on the region level. For this, every navigation task was described both at the place level aswell as on the region level: For example, the left route displayed in Figure 10 can be described on theplace level as follows: 20-18-17-21-16-7-13-9-10. On the region level the route is represented as C-C-D-D-D-A-E-B-B-C. From this region representation, the number of region crossings was calculated forevery traveled path as well as for all the corresponding optimal solution. Furthermore, by comparingthe region-representation of a traveled route with the region-representation of the optimal route, errorat the region level were analyzed independent from errors at the place level.
3.3 Predictions
Employing a region-based route planning strategy, i.e. first planning a coarse route at the region-leveland refining the route only afterwards, will prevent subjects from finding the optimal solution whennavigating RS-inadequate navigation tasks (see Section 3.2.2). It is therefore expected that subjects willshow decreased performance on RS-inadequate tasks as compared to RS-adequate tasks.
More specifically, if subjects employed a region-based strategy, it was expected that they produce moreerrors on the region-level (see Section 3.2.4) when navigating RS-inadequate tasks as compared to RS-adequate tasks. On RS-inadequate tasks these errors on the region level should systematically lead tofewer region crossings as compared to the optimal solution.
3.4 Results
Overshoot. Average overshoot in Experiment 2 was 5.03%. An ANOVA revealed a highly significantmain effect of the number of target places (F=6.89, df=5, p<.001), while no main effect for route type(F=2.34, df=1, p=.14), and no interaction was found (F=.14, df=5, p<.94). Generally, subjects’ overshootincreased with increasing number of targets (Pearson’s product-moment correlation: r=.98, p<.001). Inexperimental block 1 subjects produced higher overshoot values than in experimental block 2 (5.73% vs.4.35%, paired t-test: t=3.21, df=23, p<.01). Overshoot performance did not differ between female andmale subjects (4.76% vs. 5.47%, t-test: t=.95, df=22, p=.65).
Found optimal routes. On average, subjects found the optimal route in 29.85% of the trials. AnANOVA revealed a significant main effect for the number of target places (F=7.56, df=5, p<.001), amain effect for route type (F=22.98, df=1, p<.001), while no significant interaction was found (F=.70,df=5, p=.624). A Pearson’s product-moment correlation did not reveal a significant correlation betweenperformance of finding the optimal route and the number of target places (r=-.54, p=.27). Performance
16

Figure 11: Results of Experiment 2.
Figure 12: Results of the region based analysis of Experiment 2.
of finding the optimal route did not differ between female and male subjects (28.53% vs 32.26, t-test:t=.61, df=22, p=.55).
Start time. Average start time in Experiment 2 was 16.17 sec. An ANOVA revealed a highly significantmain effect for the number of target places (F=8.86, df=5, p<.001), while no main effect for route type(F=.91, df=1, p=.35), and no interaction was found (F=.54, df=5, p<.75). Subjects’ start time increasedwith increasing number of targets (Pearson’s product-moment correlation: r=.98, p<.001). Start time didnot differ between female and male subjects (14.78 sec vs 18.48 sec, t-test: t=.75, df=22, p=.47).
Optimal region route. An ANOVA revealed a significant main effect for the number of target places(F=3.87, df=5, p<.01), a highly significant main effect for route type (F=93.42, df=1, p<.001), as wellas a significant interaction (F=9.24, df=5, p<.001). Subjects followed the optimal region route moreoften when navigating RS-adequate tasks than when navigating RS-inadequate tasks (55.02% vs 22.58%,paired t-test: t=10.04, df=23, p<.001, see Figure 12).
17

mean T p-value
Shopping list list A list Bovershoot in % 4.37 5.69 1.09 22 .29start time in seconds 15.15 17.19 .46 22 .65found correct routes in % 28.13 31.70 .68 22 .50
Configurationovershoot in % 4.83 5.23 .32 22 .75start time in seconds 16.31 16.03 .06 22 .95found correct routes in % 28.28 31.58 .62 22 .54
df
config A config B
Table 4: Results of t-tests on the influence of the control factors list and configuration.
Region crossings. When solving the RS-inadequate navigation tasks, subjects crossed less region bound-aries than would have been expected for optimal solutions. On average, 4.11 region transitions weremade on RS-inadequate tasks, which is a reduction by .61 from the expected 4.72 region transition foroptimal solutions (4.11 vs 4.72, t-test: t=14.69, df=23, p<.001, see Figure12). On RS-adequate routes, onthe other hand, on average, 4.37 region transitions were made, which is an increase of .17 from the ex-pected 4.22 region transitions for optimal solutions (4.37 vs 4.22, t-test: t=6.36, df=23, p<.001, see Figure12).
Further control factors. Neither of the control factors shopping list (see Section 3.2.2) and configura-tion (see Section 8) had a significant influence on overshoot performance, start time, or performance offinding the optimal route (see Table 4).
3.5 Discussion
With respect to overshoot performance, performance in finding the optimal route, and start time, resultsfrom Experiment 2 rendered a very similar picture as results from Experiment 1. Again, subjects showedremarkably good overshoot performance (~5%). Also, their performance in both, overshoot and findingthe optimal solution decreased with increasing TSP size, while their start time increased.
This special purpose of this experiment was to test whether subjects employed a region-based planningstrategy when faced with TSPs. Such a strategy states that during route planning first a coarse path isplanned on the region-level that is then refined during navigation by including close target locations. Totest this hypothesis two types of navigation tasks were generated, Region-Strategy-adequate tasks (RS-adequate) and Region-Strategy-inadequate tasks (RS-inadequate). If routes are planned on the regionlevel, solution to the RS-adequate tasks should be optimal while solution found for RS-inadequate tasksshould be more prone to error, both on the region level as well as on the place level (see Section 3.2.2). Itwas therefore predicted that differences in overshoot performance between the route types were found(see Section 3.3). Contrary to this prediction, subjects’ overshoot performance did not significantly differbetween the two types of navigation tasks. However, performance in finding the optimal route was bet-ter when navigating RS-adequate tasks as compared to RS-inadequate tasks. This latter result was in linewith the predictions. The dissociation between overshoot performance and performance of finding theoptimal route between the two types of navigation tasks suggests that the errors made when navigatingRS-adequate navigation tasks were more severe than errors on RS-inadequate tasks. It is interesting tonote that a similar dissociation between overshoot performance and performance of finding the optimalroute has already been observed in Experiment 1.
Although, contrary to the predictions, no overshoot difference was observed between RS-adequate tasksand RS-inadequate tasks, the use of a region-based planning strategy is not necessarily disproved. Sub-jects navigated sub-optimal paths in both types of navigation tasks. It is therefore possible that subjectsemployed a region-based planning strategy in both route types but the predicted performance differ-ences were shadowed by non-specific errors. Furthermore, as also in Experiment 1 overshoot perfor-mance did not allow to differentiate between the different types of navigation tasks, it can be arguedthat in the current context the overshoot measure is not sensitive enough to distinguish between navi-gation strategies.
While the analysis of subjects’ overshoot performance did not render a clear picture, the analysis ofsubjects’ navigation behavior on the level of the regions revealed strong differences between the route
18

types. On the region level subjects followed the optimal route more often when navigating RS-adequatetasks than when navigating RS-inadequate tasks. Combined with the result, that on average subjectscrossed fewer region boundaries on RS-inadequate tasks as compared to the optimal solution, demon-strated that subjects minimized the number of region crossings during route planning and navigation.Remember that on RS-inadequate tasks, employing a region-based strategy will not only result in sub-optimal paths, but also in paths that cross fewer region boundaries as compared to the optimal route.The analysis of navigation behavior on the region level therefore strongly suggests that subjects haveemployed a region-based planning strategy during route planning.
4 Conclusion
Planning a path covering multiple target locations is a complex and computationally expensive task.In this study, subjects were faced with path planning tasks in which they had to visit up to 9 targetplaces. In such tasks more than 360 000 alternative paths for visiting all target places exist. Even thoughsubjects had to first localize all target places from a so-called shopping list, on average they took lessthan 20 seconds before initiating their movement. Furthermore, on average they produced paths withless than 6% overshoot. While this performance was remarkably good, start time as well as navigationperformance strongly suggest that, when faced with navigation tasks in which many target places hadto be visited, subjects relied on planning heuristics, rather than computing and comparing all possiblepath-alternatives and selecting the optimal solution. The most simple heuristics to solve multi-targetplanning tasks is probably the well-known nearest neighbor algorithm (NN), in which a navigator isrepeatedly visiting the closest non-visited target. The NN has therefore been suggested to be involvedin animal and human navigation (e.g., Gärling & Gärling, 1988; Bures et al., 1992). Results of Experiment1, however, showed that subjects were able to outperform the NN-algorithm, i.e. subjects found shorterpaths than the NN-algorithm predicted. This result demonstrates that the NN-algorithm is not sufficientto explain human navigation behavior. Results of Experiment 2 suggest that subjects rather relied on aregion-based planning heuristics. In such a region-based planning scheme, first a coarse path is plannedon the level of the regions. This coarse route plan is then refined during navigation by the inclusion ofclose target places.
The outlined region-based planning strategy constitutes a hierarchical planning heuristic that reducesboth, computational effort during route planning as well as memory load while resulting in reasonablyshort paths. During initial planning an abstraction of the environment is used. By these means notonly the complexity of the environment is reduced but also target places residing in the same region arecollapsed such that fewer target locations have to be taken into account during initial route planning.The resulting route plans are therefore simple and easy to remember. Following the classification intro-duced above (see Section 1), this first planning step resembles a global planning algorithm, in which theentire route is planned from the start to all goal locations. As the route plan was generated on the regionlevel it is, however, coarse and not sufficient for actual navigation. The coarse route plan therefore hasto be refined during navigation. Here several possibilities exist. For example, a simple local planningalgorithm such as the NN-algorithm could be used for route planning and navigation within a givenregion.
Taken together, the presented experiments shed some light on how humans solve complex and compu-tationally expensive navigation tasks. The general finding is that the complexity of the navigation taskswas broken down by applying fast but very efficient hierarchical planning schemes.
5 Acknowledgments
This work was supported by the DFG (Deutsche Forschungsgemeinschaft) MA 1038/9-1 and WI 2729/1-1. Special thanks to Dominik Seffer for his help during designing and carrying out the experiments.
19
References
Baddeley, A. (2003). Working memory: looking back and looking forward. Nat Rev Neurosci, 4(10), 829–839.
Bailenson, J. N., Shum, M. S., & Uttal, D. H. (1998). Road Climbing: Principles Governing AsymmetricRoute Choices On Maps. Journal of Environmental Psychology, 18, 251–264.
Bailenson, J. N., Shum, M. S., & Uttal, D. H. (2000). The initial segment strategy: A heuristic for routeselection. Memory & Cognition, 28(2), 306–318.
Bures, J., Buresova, O., & Nerad, L. (1992). Can rats solve a simple version of the traveling salesmanproblem?. Behavioral Brain Research, 52(2), 133–142.
Christenfeld, N. (1995). Choices from identical Options. Psychological Science, 6, 50–55.
Cramer, A. E. & Gallistel, C. R. (1997). Vervet monkeys as travelling salesmen. Nature, 387(6632), 464–464.
Gallistel, C. R. & Cramer, A. E. (1996). Computations on metric maps in mammals: Getting oriented andchoosing a multi-destination. Journal of Experimental Biology, 199(1), 211–217.
Gärling, T. & Gärling, E. (1988). Distance minimization in downtown pedestrian shopping. Environmentand Planning A, 20, 547–554.
Gärling, T., Säisä, J., Böök, J., & Lindberg, E. (1986). The spatiotemporal sequencing of everyday activitiesin the large-scale environment. Journal of Environmental Psychology, 6, 261–280.
Golden, B., Bodin, L., Doyle, T., & Stewart, W. (1980). Approximate traveling salesman algorithms.Operations Research, 28, 694–711.
Golledge, R. (1995). Path selection and Route Preference in Human Navigation: A Progress Report. InA. Frank & W. Kuhn (Eds.), Spatial Information Theory: A Theoretical Basis for GIS (COSIT’95). Number988 in Lecture Notes in Computer Science (pp. 207–222). Berlin, Springer.
Graham, S. M., Joshi, A., & Pizlo, Z. (2000). The travelling sdalesman problem: A hierarchical model.Memory & Cognition, 28(7), 1191–1204.
Kuipers, B., Tecuci, D., & Stankiewicz, B. (2003). The skeleton in the cognitive map: a computational andempirical exploration. Environment and Behavior, 35(1), 80–106.
MacGregor, J. N. & Ormerod, T. C. (1996). Human performance on the traveling salesman problem.Perception and Psychophysics, 58, 527–539.
MacGregor, J. N., Ormerod, T. C., & Chronicle, E. (2000). A model of human performance on the travel-ling salesperson problem. Memory & Cognition, 28(7), 1183–1190.
MacGregor, J. N., Ormerod, T. C., & Chronicle, E. P. (1999). Spatial and contextual factors in humanperformance on the travelling salesperson problem. Perception, 28(11), 1417–1427.
MacGregor, J. N., Chronicle, E. P., & Ormerod, T. C. (2004). Convex hull or crossing avoidance? Solutionheuristics in the traveling salesperson problem. Memory & Cognition, 32(2), 260–270. Clinical Trial.
Menzel, E. W. (1973). Chimpanzee spatial memory organization. Science, 182(4115), 943–945.
Millner, G. A. (1956). The magical number seven, plus or minus two: Some limits on our capacity forprocessing information.. Psychological Review, 63, 81–97.
Stern, E. & Leiser, D. (1988). Levels of spatial knowledge and urban travel modeling. Geographical Anal-ysis, 20, 140–155.
Van Rooij, I., Stege, U., & Schactman, A. (2003). Convex hull and tour crossings in the Euclidean travelingsalesperson problem: implications for human performance studies. Memory & Cognition, 31(2), 215–220.
20

Vickers, D., Bovet, P., Lee, M. D., & Hughes, P. (2003a). The perception of minimal structures: perfor-mance on open and closed versions of visually presented Euclidean travelling salesperson problems.Perception, 32(7), 871–886.
Vickers, D., Lee, M. D., Dry, M., & Hughes, P. (2003b). The roles of the convex hull and the number ofpotential intersections in performance on visually presented traveling salesperson problems. Memory& Cognition, 31(7), 1094–1104.
Vickers, D., Lee, M. D., Dry, M., Hughes, P., & McMahon, J. A. (2006). The aesthetic appeal of min-imal structures: judging the attractiveness of solutions to traveling salesperson problems. PerceptPsychophys, 68(1), 32–42.
Wiener, J. M. & Mallot, H. A. (2003). Fine-to-Coarse Route Planning and Navigation in RegionalizedEnvironments. Spatial Cognition and Computation, 3(4), 331 – 358.
Wiener, J. M., Schnee, A., & Mallot, H. A. (2004). Use and Interaction of Navigation Strategies in Region-alized Environments. Journal of Environmental Psychology, 24(4), 475 – 493.
21