Embed Size (px)
Citation preview

PatentViz
Mike Wooldridge and Ken Langford
Information Visualization and Presentation
Fall 2005

What is a patent?
A grant of a property right by the government to an inventor.
Allows the inventor to exclude others from making, using, or selling an invention.
Currently in the U.S., the term of a patent is 20 years from filing with the USPTO (utility & plant patents).

Patent Data Set
More than 6 million patents have been issued by the U.S. Patent and Trademark Office.
More than 150,000 new ones are issued each year.
There are more than 400 patent classes, and 120,000 subclasses (continuously evolving).

Structure of a Patent
Patent Number Title Abstract Inventor Assignee Filing Date Issue Date
Class Subclass Citations Claims Specifications Diagrams

Example Patent
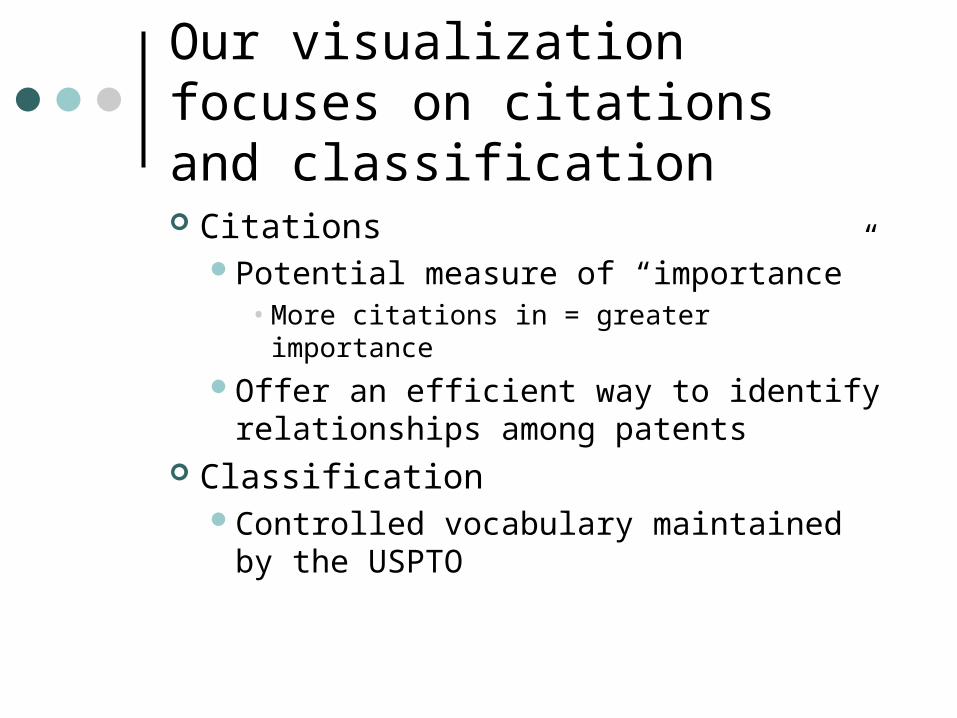
Our visualization focuses on citations and classification
CitationsPotential measure of “importance”
• More citations in = greater importance
Offer an efficient way to identify relationships among patents
ClassificationControlled vocabulary maintained by
the USPTO

NBER Patent Database(National Bureau of Economic Research)
Freely available, maintained at UC Berkeley
3 million patents from 1963-1999 Includes 16 million citation records:
Citations outCitations inMeasures of “generality” and
“originality” based on citations

Goals of Visualization
Understand patent distribution. Pinpoint potentially important patents. See if importance relates to other
characteristics. Show how patents are connected to
one another.

Related Work
Commercial patent research tools. Visualization of scholarly citations.

Three Directions
Tree Map Scatter Plot Graph

Tree Map
Treemap 4.1 UI: http://www.cs.umd.edu/hcil/treemap/
6 categories (e.g. Computers and Communications)36 subcategories (e.g. Computer
Peripherals)• 420 classes (e.g. Incremental Printing of
Symbolic Information)

Tree Map (2-Level)
Class #
Main category
Color = patent count

Tree Map (3-Level)
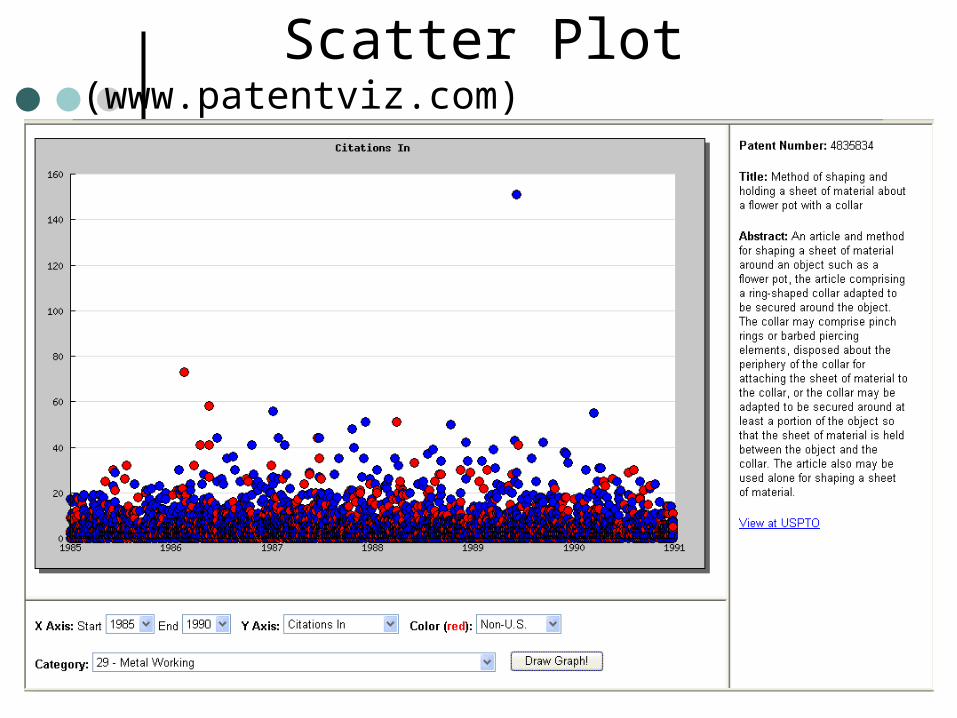
Scatter Plot (www.patentviz.com)
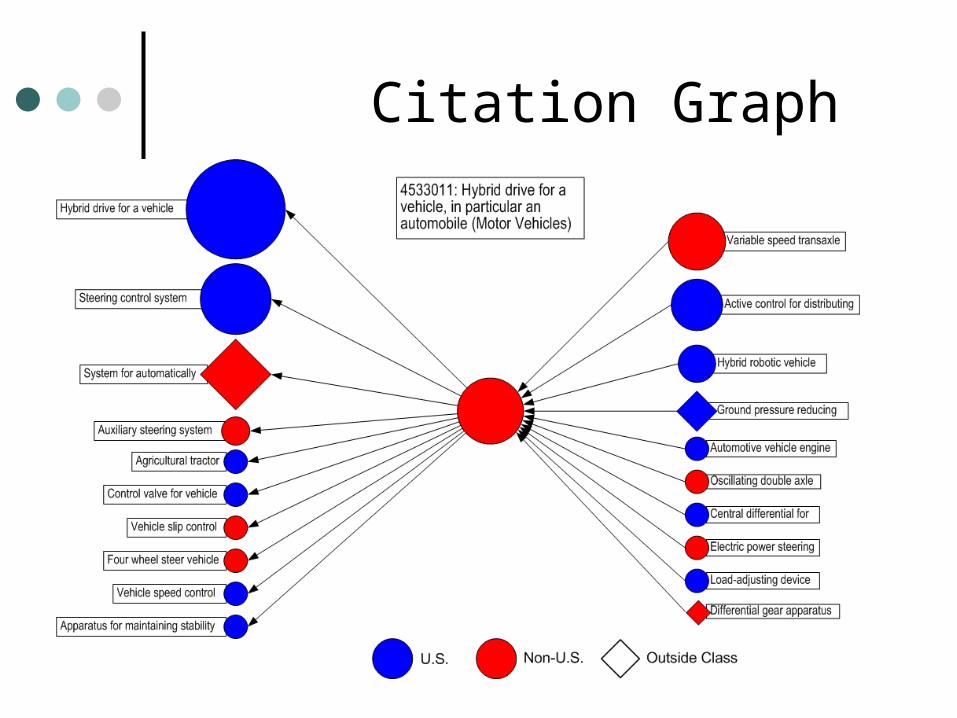
Citation Graph

Future Work
Test users. Manage the data. Integrate the different pieces.

Comments/Suggestions?

Comments/Suggestions?