Embed Size (px)
Citation preview

Patent Analysis of Biometrics
Technology MIS 480/580 - Project Report
Shaokun Fan | Noyan Ilk | Pooja Bhandari
With the guidance of:
Dr. Hsinchun Chen
Professor, Management Information Systems
Eller College of Management
University of Arizona

Patent Analysis of Biometrics Technology
Team 2 Page 2
Table of Contents 1. Introduction .......................................................................................................................................... 3
2. Literature Review .................................................................................................................................. 3
3. Research Objectives .............................................................................................................................. 4
4. Data Source ........................................................................................................................................... 5
5. Data Analysis ......................................................................................................................................... 6
5.1. Patent Publication Analysis ........................................................................................................... 6
5.2. Topic Coverage Analysis ................................................................................................................ 9
5.3. Patent Citation Analysis .............................................................................................................. 10
6. Conclusions ......................................................................................................................................... 15
7. References .......................................................................................................................................... 15

Patent Analysis of Biometrics Technology
Team 2 Page 3
1. Introduction
Biometrics refers to automatic recognition of an individual based on her behavioral and/or
physiological characteristics. A biometric system is essentially a pattern recognition system that
operates by acquiring biometric data from an individual, extracting a feature set from the acquired
data, and comparing this feature set against the template set in the database [1].
The applications of biometrics can be divided into the following two main groups:
Commercial applications such as computer network login, electronic data security, ecommerce,
Internet access, ATM, credit card, physical access control, cellular phone, PDA, medical records
management, distance learning, etc.
Government applications such as national ID card, correctional facility, driver’s license, social
security, welfare-disbursement, border control, passport control, criminal investigation, etc.
Biometric traits can mainly be classified into two groups: Physiological and Behavioral. Physiological
biometrics includes face, fingerprint, hand, iris and DNA recognition. Behavioral biometric traits involve
keystroke patterns, signature analysis and voice recognition [2]. In this context, we propose to conduct
a knowledge mapping research on patents involving biometrics technologies and applications.
Specifically, we plan to analyze and compare patents based on classification schemes, systems and
developers of biometrics.
2. Literature Review
A number of biometric characteristics exist and are in use in various applications [2]. Each biometric has
its strengths and weaknesses, and the choice depends on the application. No single biometric is
expected to effectively meet the requirements of all the applications. In other words, no biometric is
“optimal”. The match between a specific biometric and an application is determined depending upon
the operational mode of the application and the properties of the biometric characteristic. A brief
introduction of the commonly used biometrics is given below:
Fingerprint [3]: Humans have used fingerprints for personal identification for many centuries
and the matching accuracy using fingerprints has been shown to be very high. A fingerprint is
Patent Analysis of Biometrics Technology
Team 2 Page 4
the pattern of ridges and valleys on the surface of a fingertip, the formation of which is
determined during the first seven months of fetal development. Fingerprints of identical twins
are different and so are the prints on each finger of the same person.
Face [4]: Face recognition is a non-intrusive method, and facial images are probably the most
common biometric characteristic used by humans to make a personal recognition.
DNA [5]: Deoxyribo Nucleic Acid (DNA) is the one-dimensional ultimate unique code for one’s
individuality - except for the fact that identical twins have identical DNA patterns.
Signature: The way a person signs her name is known to be a characteristic of that individual.
Although signatures require contact with the writing instrument and an effort on the part of
the user, they have been accepted in government, legal, and commercial transactions as a
method of verification. Signatures are a behavioral biometric that change over a period of time
and are influenced by physical and emotional conditions of the signatories.
Voice: Voice is a combination of physiological and behavioral biometrics. The features of an
individual’s voice are based on the shape and size of the appendages (e.g., vocal tracts, mouth,
nasal cavities, and lips) that are used in the synthesis of the sound. These physiological
characteristics of human speech are invariant for an individual, but the behavioral part of the
speech of a person changes over time due to age, medical conditions (such as common cold),
emotional state, etc.
3. Research Objectives
The main objective of this research project is to extract information from the US Patent Office and
assess the research and development status of biometrics. We also want to analyze the growth of
biometrics sub-fields and identify interesting historical trends. More specifically, we are looking to
figure out:
Number of patents by each country each year
Citation clustering
Number of patents each year by category, such as fingerprint, facial, etc.
Number of patents each institution

Patent Analysis of Biometrics Technology
Team 2 Page 5
4. Data Source
During the data collection phase of the project, the team first did a domain analysis based on several
surveys and books in the field of biometrics [1], [6]. Then we defined a set of keywords and did our test
search in USPTO. After we manually retrieved some patents from USPTO, we went through those
patents one by one and identify the keywords that are common in those patents. In order to make sure
that our keyword set is a relatively complete, we also compared our keywords with those in wikipedia
[2] and google keywords (https://adwords.google.com/select/KeywordToolExternal). In the end, our
keyword set includes 75 keywords which are shown in our presentation slides.
The keyword list was then used to search the USPTO database website. The programming source code
used to search the database was provided by Teaching Assistant Mandy Dang. The following steps were
used to retrieve and format the patent data:
• Patent ID retrieval – A Perl script was used to search the USPTO website and retrieve all patent
numbers related to each keyword. This program returned a list of keywords and the related
patent numbers.
• Patent fulltext retrieval – A Perl script was used to search the USPTO website and retrieve the
patent source content for each patent number. The program returned the patent content in
HTML format (one HTML file per patent).
• Data Parsing – A Java program was used to parse the data in the HTML files into text files. The
program returned eight text files which are later imported into database.
• Data Cleaning – Duplicated patents are removed.
Patent Analysis of Biometrics Technology
Team 2 Page 6
5. Data Analysis
5.1. Patent Publication Analysis
5.1.1. Number of patents by Country
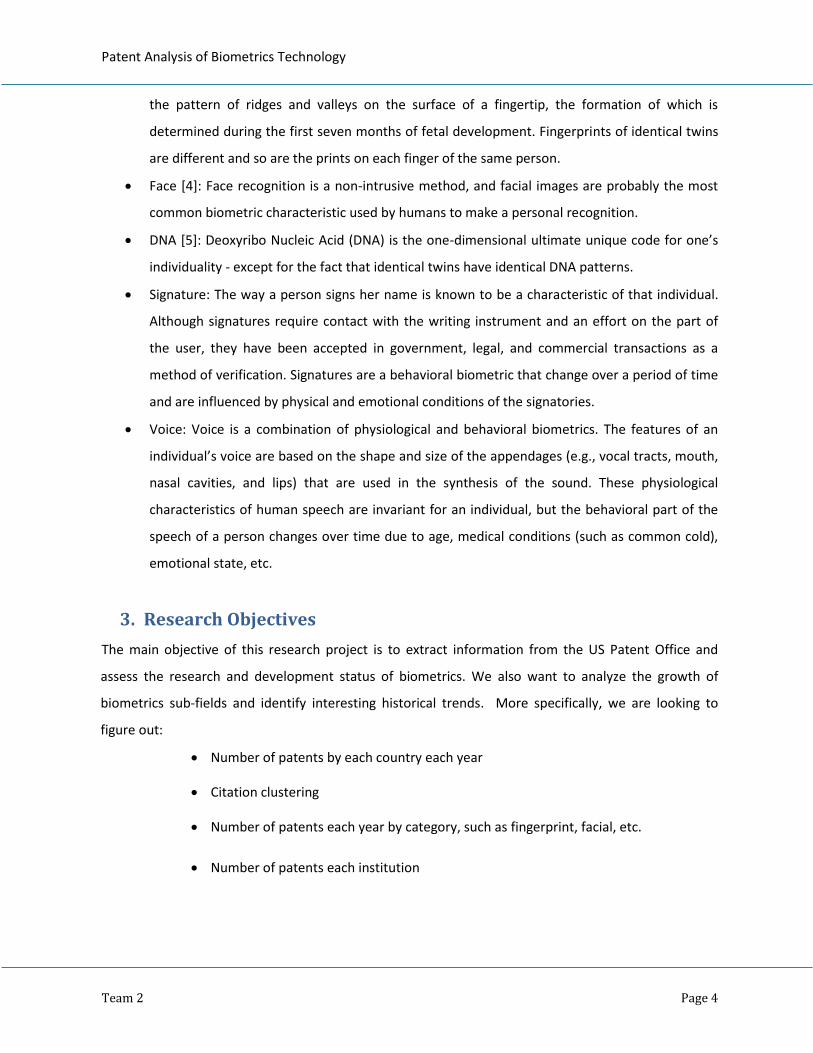
Figure 1: Number of patents by country
Figure 1 illustrates the total number of Biometric patents issued by country from year 1976-2008. It is
apparent that the US is the world leader followed by Japan. The United States has produced 3,079
patents, followed by Japan with 857, making up 65.8% of the total patents issued respectively. The
figure 2 gives the year wise distribution of number of patents issued by the Top 5 countries from year
2000-2008. Considering the US and Japan historical trends there was large growth in this area during
year 2005-2006 since highest number of patents were filed during this period.
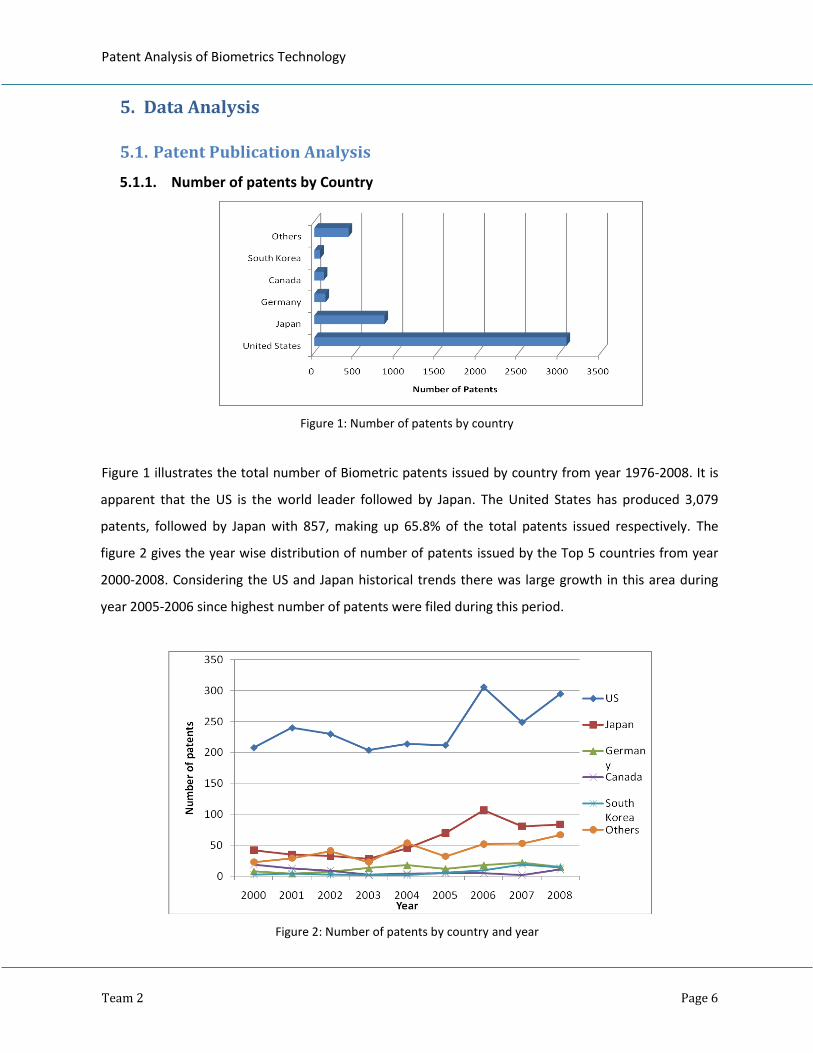
Figure 2: Number of patents by country and year
Patent Analysis of Biometrics Technology
Team 2 Page 7
5.1.2. Number of patents by Country group
Figure 3: Number of patents by country group
The figure 3 shows the number of patents by the country group. Here North America including
United States and Canada takes the lead again, followed by Japan. Europe is number three and
includes the countries Germany, Great Britain, France, Netherlands, Finland, Sweden and Italy. Asia-
Pacific includes Korea, Singapore, China, Taiwan and Hong Kong.
5.1.3. Number of patents by Institution
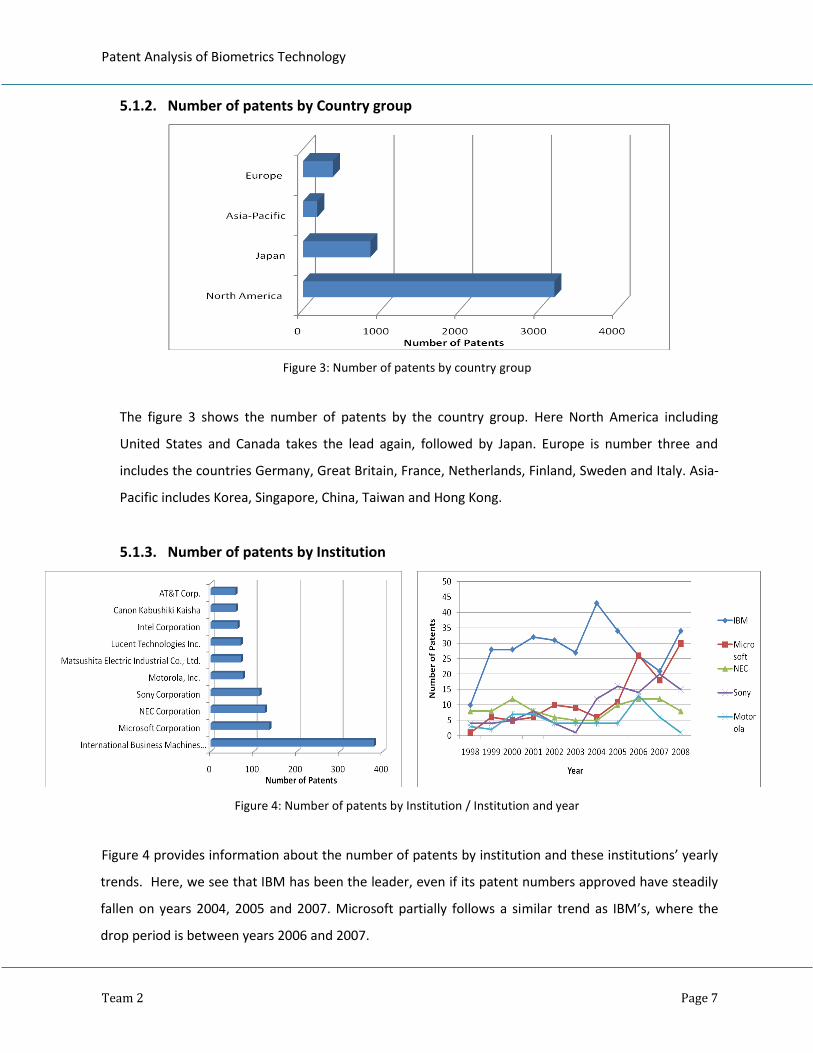
Figure 4: Number of patents by Institution / Institution and year
Figure 4 provides information about the number of patents by institution and these institutions’ yearly
trends. Here, we see that IBM has been the leader, even if its patent numbers approved have steadily
fallen on years 2004, 2005 and 2007. Microsoft partially follows a similar trend as IBM’s, where the
drop period is between years 2006 and 2007.

Patent Analysis of Biometrics Technology
Team 2 Page 8
5.1.4. Number of patents by Technology fields
Figure 5: Number of patents by Technology fields
Figure 5 provides number of patents by technology fields. These fields are obtained from US class
definitions formally made by USPTO.
5.1.5. Patent pending period statistics
Figure 6: Patent Period Statistics
Patent Analysis of Biometrics Technology
Team 2 Page 9
On the left side of figure 6, we can see the distribution of number of patents approved with respect to pending
periods. We see that it is very rare for a patent to get approved in one or two years, or be pended 8 years and
more. The data tells us that, on average, it would take 4.3 years for a patent to get approved. On the right side of
the figure we see the average patent approval period with respect to particular years. In 2000, the average time
for a patent to get approved was 2.5 years, whereas this number went up to more than 4 years for 2008. This
information indicates that while more patents are being filed every year, the US Patent Office has not been able to
improve itself and keep its patent analysis rate steady. These data have been obtained by looking at the difference
between patent approval and patent filing times.
5.2. Topic Coverage Analysis
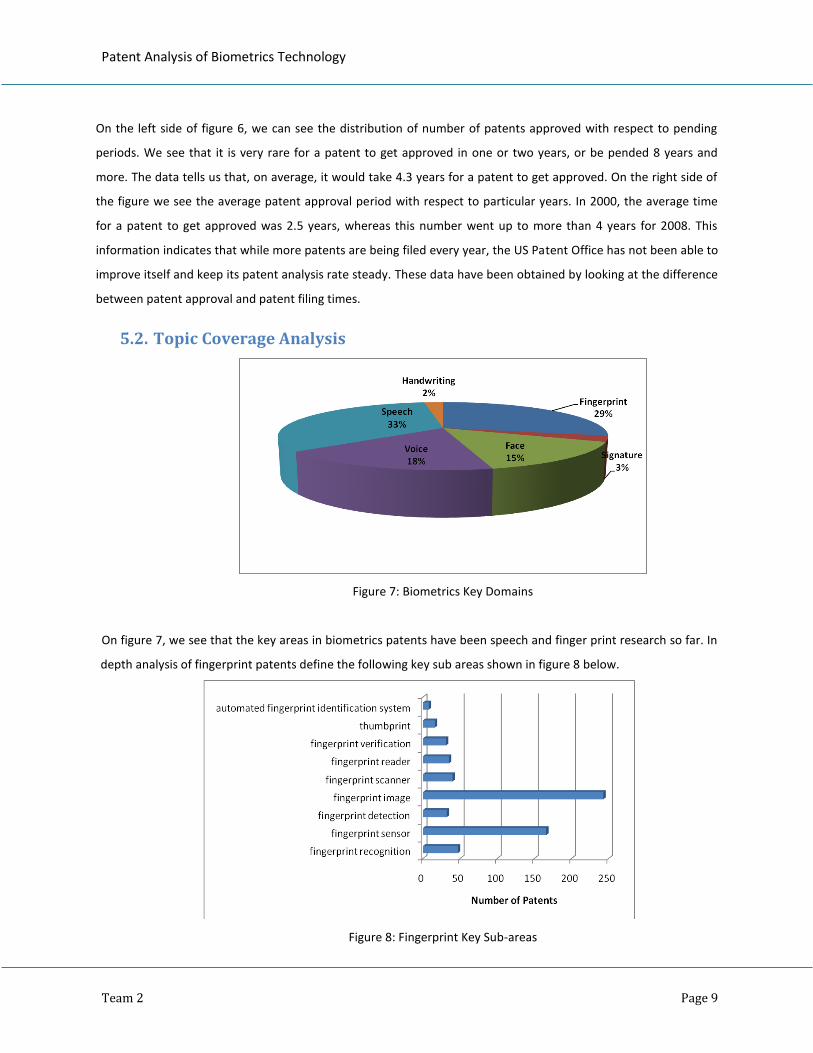
Figure 7: Biometrics Key Domains
On figure 7, we see that the key areas in biometrics patents have been speech and finger print research so far. In
depth analysis of fingerprint patents define the following key sub areas shown in figure 8 below.
Figure 8: Fingerprint Key Sub-areas

Patent Analysis of Biometrics Technology
Team 2 Page 10
5.3. Patent Citation Analysis
5.3.1. Top 10 Cited Patents
Name # cited App. Date Institution
Unforgeable personal identification system 210 12-Feb-91 Motorola, Inc.
Fingerprint sensing device and recognition system having
predetermined electrode activation 123 28-Jun-94
U.S. Philips
Corporation
Method for interactive speech recognition and training 105 25-Jun-91 Dragon Systems, Inc.
Method and apparatus for verifying identity using image correlation 103 19-Nov-91 Identix Incorporated
Fingerprint-based access control and identification apparatus 102 1-Jul-80 Fingermatrix, Inc.
System for verifying use of a credit/identification card including
recording of physical attributes of unauthorized users 99 30-Apr-96 Wizards, LLC
Continuous biometric authentication matrix 97 20-Jul-93
Data carrier 96 15-Apr-86
Capacitive fingerprint sensor 96 5-Oct-82 Siemens Corporation
Arrangement and procedure for determining the authorization of
individuals by verifying their fingerprints 95 19-Feb-91
Siemens
Aktiengesellschaft
Table 1: Top 10 Cited Patents
Table 1 above shows the top 10 cited patents in biometrics area including their names, how many
times they are cites, their approval dates and institutions. Here, we see several fingerprint patents as
highly cited. This is expected since about 30% of the patents in the biometrics area are fingerprint
related. We see that the highest number of citation is 210, a patent from Motorola, Inc. organization.
5.3.2. Top 5 Citing Patents
Name # cited Institution
Authenticating fingerprints for radio frequency payment transactions 999 Xatra Fund MX, LLC
Biometrics for radio frequency payment transactions 999 Xatra Fund MX, LLC
Smartcard transaction method and system using voiceprint recognition 999
American Express
Services Company
Biometric security using a fob 999 Xatra Fund MX, LLC
Method and system for proffering multiple biometrics for use with a FOB 971
American Express
Services Company
Table 2: Top 5 Citing Patents
Patent Analysis of Biometrics Technology
Team 2 Page 11
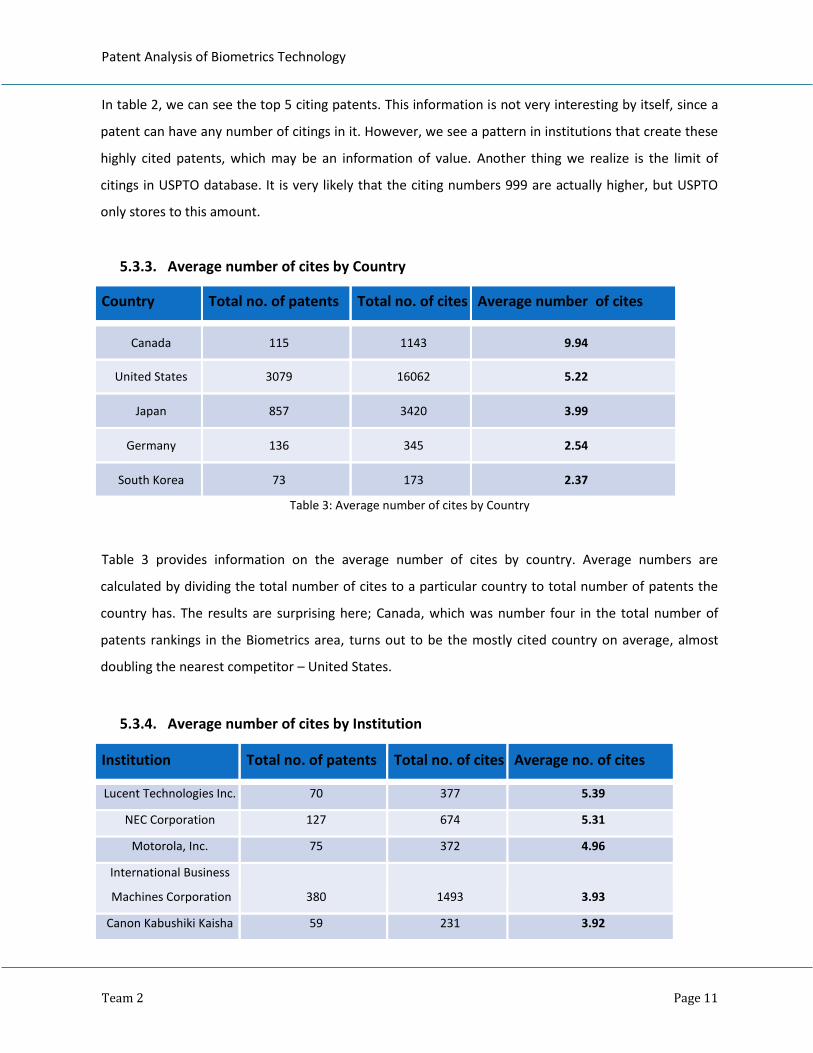
In table 2, we can see the top 5 citing patents. This information is not very interesting by itself, since a
patent can have any number of citings in it. However, we see a pattern in institutions that create these
highly cited patents, which may be an information of value. Another thing we realize is the limit of
citings in USPTO database. It is very likely that the citing numbers 999 are actually higher, but USPTO
only stores to this amount.
5.3.3. Average number of cites by Country
Country Total no. of patents Total no. of cites Average number of cites
Canada 115 1143 9.94
United States 3079 16062 5.22
Japan 857 3420 3.99
Germany 136 345 2.54
South Korea 73 173 2.37
Table 3: Average number of cites by Country
Table 3 provides information on the average number of cites by country. Average numbers are
calculated by dividing the total number of cites to a particular country to total number of patents the
country has. The results are surprising here; Canada, which was number four in the total number of
patents rankings in the Biometrics area, turns out to be the mostly cited country on average, almost
doubling the nearest competitor – United States.
5.3.4. Average number of cites by Institution
Institution Total no. of patents Total no. of cites Average no. of cites
Lucent Technologies Inc. 70 377 5.39
NEC Corporation 127 674 5.31
Motorola, Inc. 75 372 4.96
International Business
Machines Corporation 380 1493 3.93
Canon Kabushiki Kaisha 59 231 3.92

Patent Analysis of Biometrics Technology
Team 2 Page 12
Matsushita Electric
Industrial Co., Ltd. 71 188 2.65
AT&T Corp. 58 144 2.48
Microsoft Corporation 137 240 1.75
Sony Corporation 114 145 1.27
Intel Corporation 63 72 1.14
Table 4: Average number of cites by Institution
Table 4 provides information on the average number of cites by Institution. Here, we see that Lucent
Technologies, who was ranked seven in total number of patent ranking, is the mostly cited institution
on average. Average cites rankings are thought to be an indication of the quality/importance of patents
these institutions generate.
5.3.5. Country citation network analysis
Below is Figure 9, which is a graphical representation of citation network between the top five patent
produced countries in the Biometrics area. The number near to the country name on the line
represents the number of citations made from that country to the country at the other end of the line.
The thickness of the lines and arrow heads are proportional to the number of citations.
Figure 9: Country Citation Network
Patent Analysis of Biometrics Technology
Team 2 Page 13
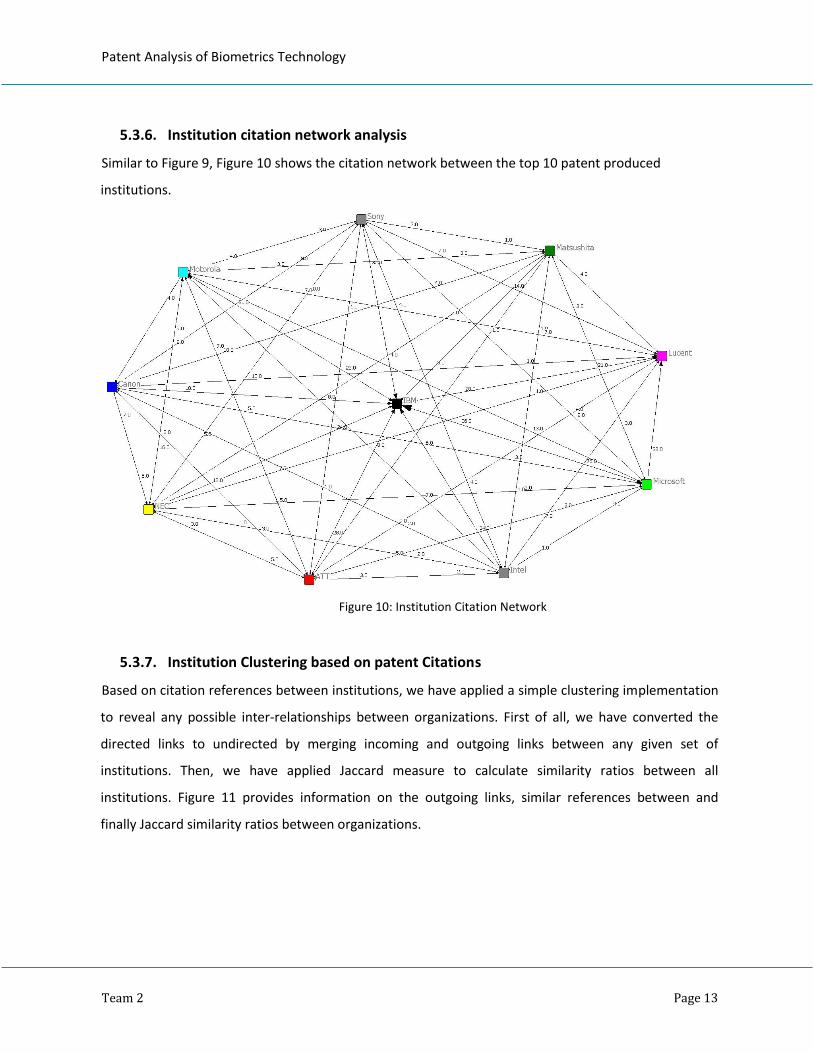
5.3.6. Institution citation network analysis
Similar to Figure 9, Figure 10 shows the citation network between the top 10 patent produced
institutions.
Figure 10: Institution Citation Network
5.3.7. Institution Clustering based on patent Citations
Based on citation references between institutions, we have applied a simple clustering implementation
to reveal any possible inter-relationships between organizations. First of all, we have converted the
directed links to undirected by merging incoming and outgoing links between any given set of
institutions. Then, we have applied Jaccard measure to calculate similarity ratios between all
institutions. Figure 11 provides information on the outgoing links, similar references between and
finally Jaccard similarity ratios between organizations.

Patent Analysis of Biometrics Technology
Team 2 Page 14
Figure 11: Similarity Calculations between Institutions
Figure 12: Clustering Result of Institutions as Dendogram and Sets
Figure 12 above provides the classification information of institutions based on citations after the single
linkage clustering based on Jaccard similarities. The left side of the figure shows the dendogram tree,
while the right side is a representation of institutions as sets where dotted lines represent identified
clusters.

Patent Analysis of Biometrics Technology
Team 2 Page 15
6. Conclusions
To summarize, we have identified some potentially significant information from our analysis of the
Biometrics patents data. We found out that the US is the leading patent holder in Biometrics area, with
more than 2/3 of all patents approved. However, based on citation averages, Canada takes the lead in
terms of producing the important patents. In terms of patent pending period statistics, we see an
increase in the average patent approval period through the years. This information is consistent with
the increasing number of patents being filed every year. Overall, we couldn’t see that the US Patent
Office would be able to match the speed of patent filing rate in terms of analyzing the patents and
making the approval decision. We also found out that the key areas in biometrics patents have been
speech and finger print research so far. Finally, another interesting result with this study was that we
managed to cluster institutions based on patent citations. We have seen that there are indeed small
clusters of institutions that cite each other more often than citing any other institutions outside the
cluster. Overall, this was a very valuable study that made us learn about the automation of vast
amount of data collection from external resources, filtering and cleaning collected data, and analyzing
the data to test assumptions and reveal any underlying patterns such as trends and clusters.
7. References
[1] Jain, A. K.; Ross, Arun; Prabhakar, Salil, "An introduction to biometric recognition", IEEE
Transactions on Circuits and Systems for Video Technology Vol. 14, No.1, pp. 4 – 20, 2004.
[2] http://en.wikipedia.org/wiki/Biometrics
[3] D. Maltoni, D. Maio, A. K. Jain, and S. Prabhakar, Handbook of Fingerprint Recognition, Springer,
NY, 2003.
[4] L. Hong and A. K. Jain, “Integrating Faces and Fingerprints for Personal Identification”, IEEE Trans.
on Pattern Analysis and Machine Intelligence, Vol. 20, No. 12, pp. 1295-1307, Dec 1998.
[5] R. Brunelli and D. Falavigna, “Person Identification Using Multiple Cues”, IEEE Trans. On Pattern
Analysis and Machine Intelligence, Vol. 12, No. 10, pp. 955-966, Oct 1995.
[6] David D. Zhang, “Biometric solutions for authentication in an E-world,” Kluwer academic
publishers, 2002, ISBN 1402071426.