Embed Size (px)
Citation preview
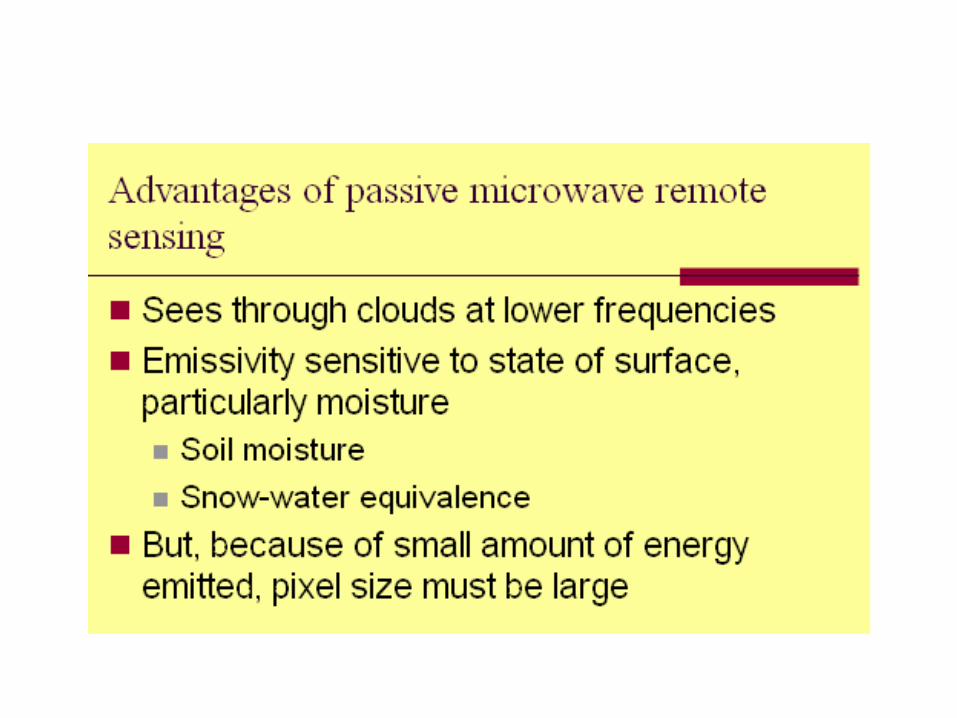
Passive Microwave Remote Sensing
Lecture 11
Principals
While dominate wavelength of Earth is 9.7 um (thermal), a continuum of energy is emitted from Earth to the atmosphere. In fact, the Earth emits a steady stream of microwave energy as well, though it is relatively weak in intensity due to its long wavelength.
The spatial resolution usually low (kms) since the weak signal. A suit of radiometers can record it. They measure the
brightness temperature emitted from the terrain or the atmospheric gasses, dusts. This is much like the thermal infrared radiometer for temperature measurement as we discussed before.
A matrix of brightness temperature values can then be used to construct a passive microwave image.
To measure soil moisture, precipitation, ice water content, sea-surface temperature, snow-ice temperature, and etc., based on brightness temperature images.
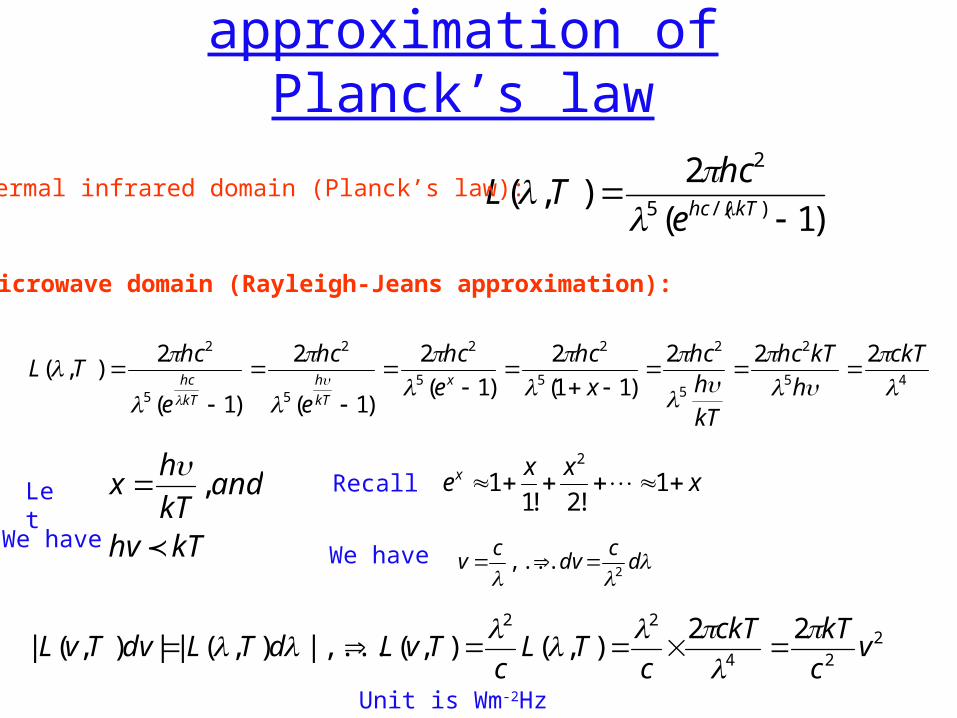
Rayleigh-Jeans approximation of Planck’s law
)1(
2),(
)/(5
2
kThce
hcTL
45
2
5
2
5
2
5
2
5
2
5
2 222
)11(
2
)1(
2
)1(
2
)1(
2),(
ckT
h
kThc
kT
hhc
x
hc
e
hc
e
hc
e
hcTL
x
kT
h
kT
hc
Thermal infrared domain (Planck’s law):
Microwave domain (Rayleigh-Jeans approximation):
xxx
ex 1!2!1
12
kThv
andkT
hx
,
Let Recall
We haveWe have
d
cdv
cv
2,...
224
22 22),(),(|,...),(||),(| v
c
kTckT
cTL
cTvLdTLdvTvL
Unit is Wm-2Hz
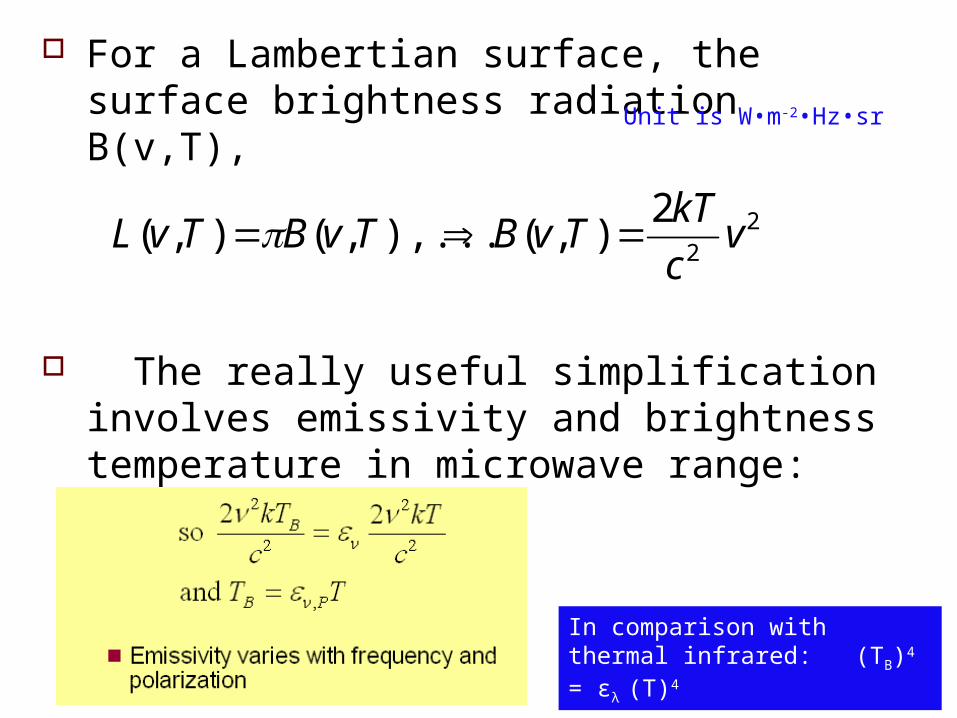
For a Lambertian surface, the surface brightness radiation B(v,T),
The really useful simplification involves emissivity and brightness temperature in microwave range:
Unit is W•m-2•Hz•sr
22
2),(),...,(),( v
c
kTTvBTvBTvL
In comparison with thermal infrared: (TB)4 = ελ (T)4
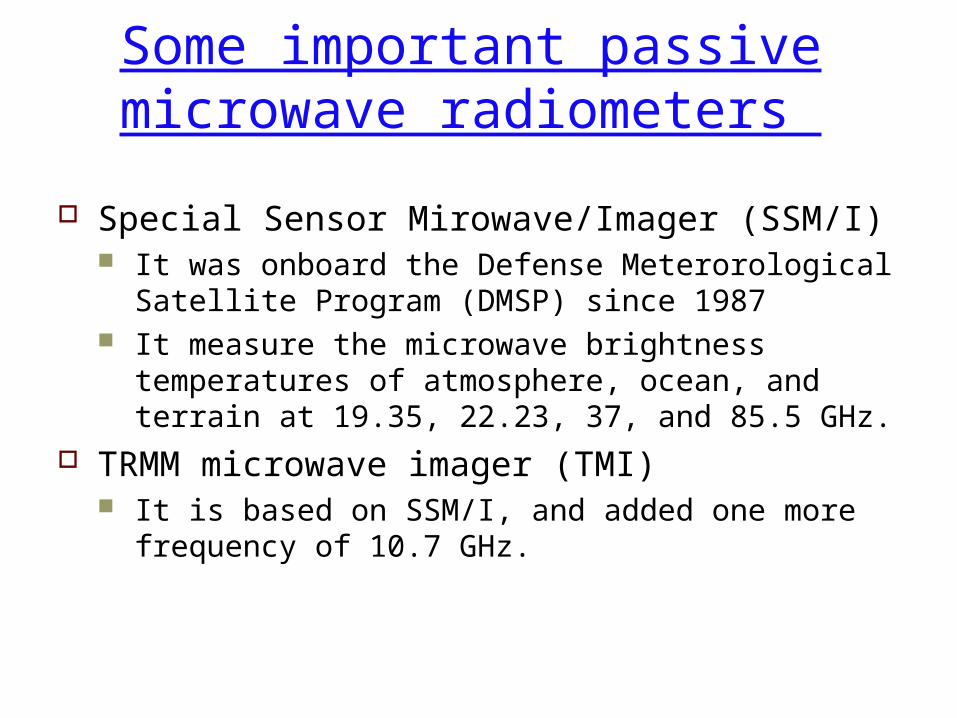
Some important passive microwave radiometers
Special Sensor Mirowave/Imager (SSM/I) It was onboard the Defense Meterorological
Satellite Program (DMSP) since 1987 It measure the microwave brightness
temperatures of atmosphere, ocean, and terrain at 19.35, 22.23, 37, and 85.5 GHz.
TRMM microwave imager (TMI) It is based on SSM/I, and added one more
frequency of 10.7 GHz.
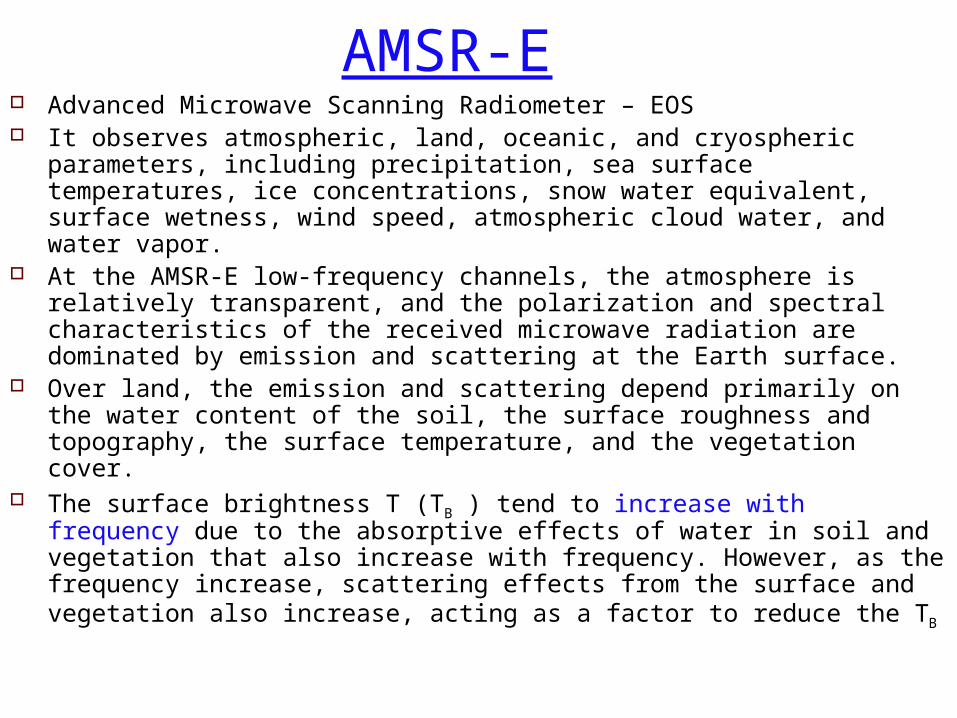
AMSR-E Advanced Microwave Scanning Radiometer – EOS It observes atmospheric, land, oceanic, and cryospheric parameters,
including precipitation, sea surface temperatures, ice concentrations, snow water equivalent, surface wetness, wind speed, atmospheric cloud water, and water vapor.
At the AMSR-E low-frequency channels, the atmosphere is relatively transparent, and the polarization and spectral characteristics of the received microwave radiation are dominated by emission and scattering at the Earth surface.
Over land, the emission and scattering depend primarily on the water content of the soil, the surface roughness and topography, the surface temperature, and the vegetation cover.
The surface brightness T (TB ) tend to increase with frequency due to the absorptive effects of water in soil and vegetation that also increase with frequency. However, as the frequency increase, scattering effects from the surface and vegetation also increase, acting as a factor to reduce the TB
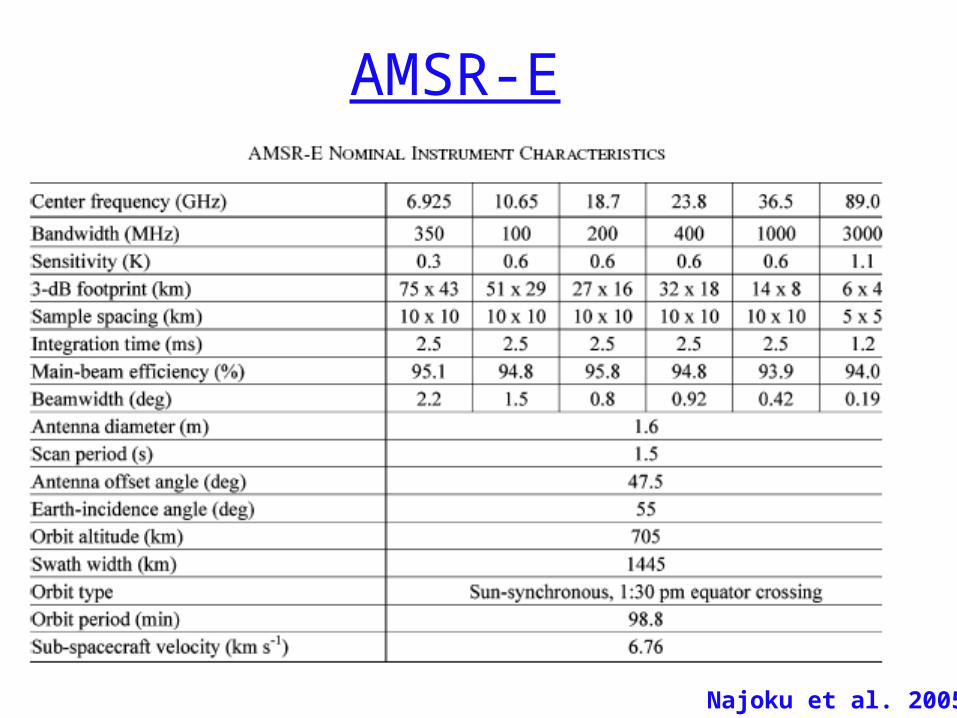
AMSR-E
Najoku et al. 2005

Example1: Snow depth or snow water equivalent (SWE)
The microwave brightness temperature emitted from a snow cover is related to the snow mass which can be represented by the combined snow density and depth, or the SWE (a hydrological quantity that is obtained from the product of snow depth and density).
∆Tb = Tb19V-Tb37V
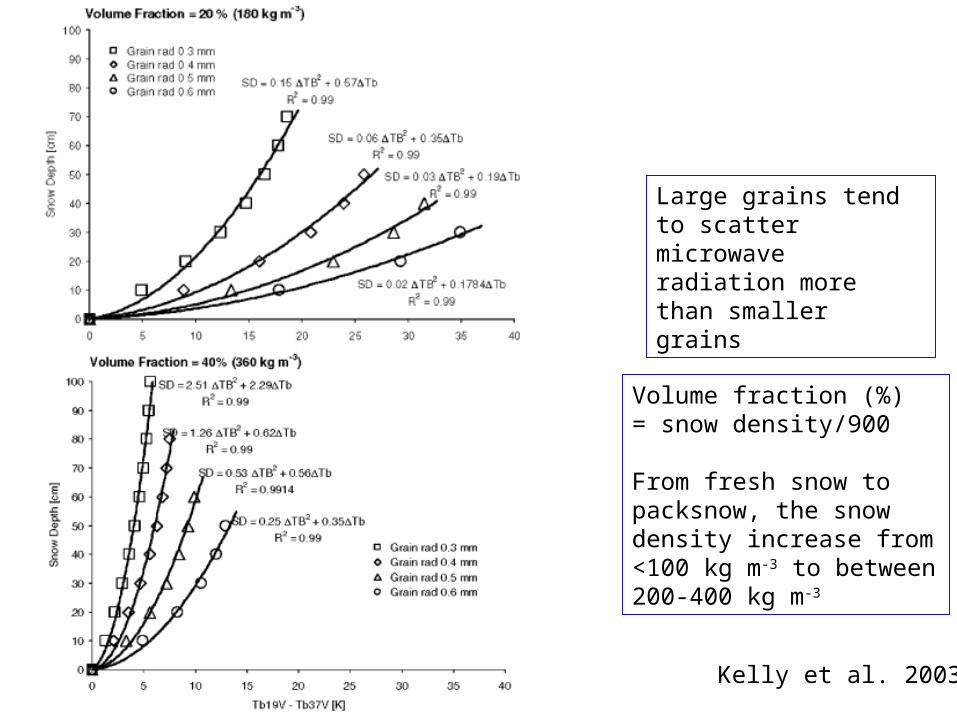
Kelly et al. 2003
Large grains tend to scatter microwave radiation more than smaller grains
Volume fraction (%)= snow density/900
From fresh snow to packsnow, the snow density increase from <100 kg m-3 to between 200-400 kg m-3
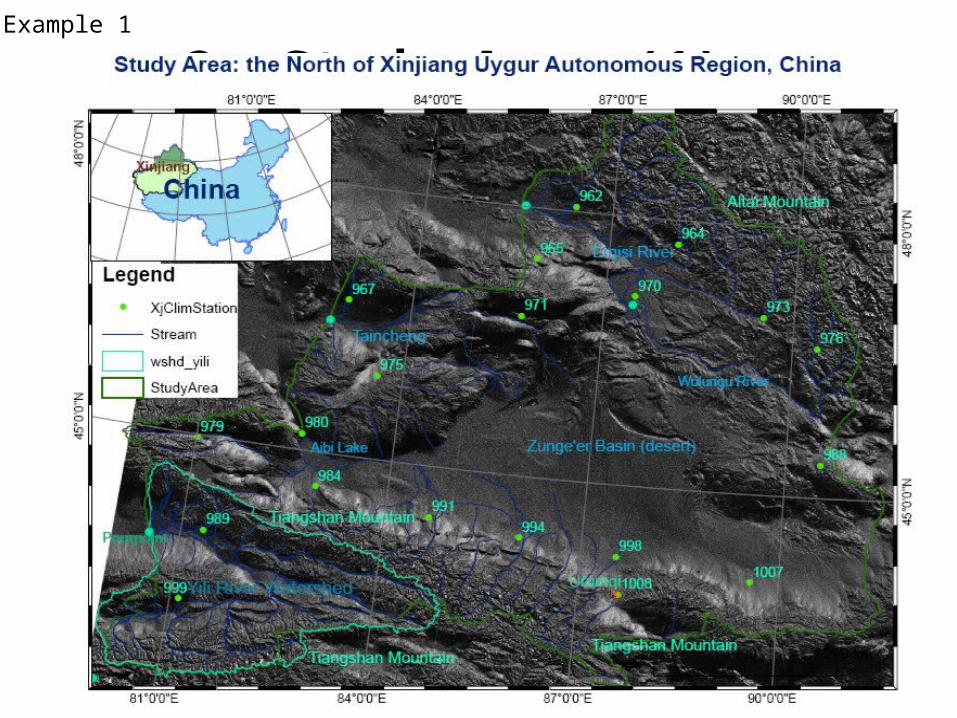
3. Study Area (1)Example 1
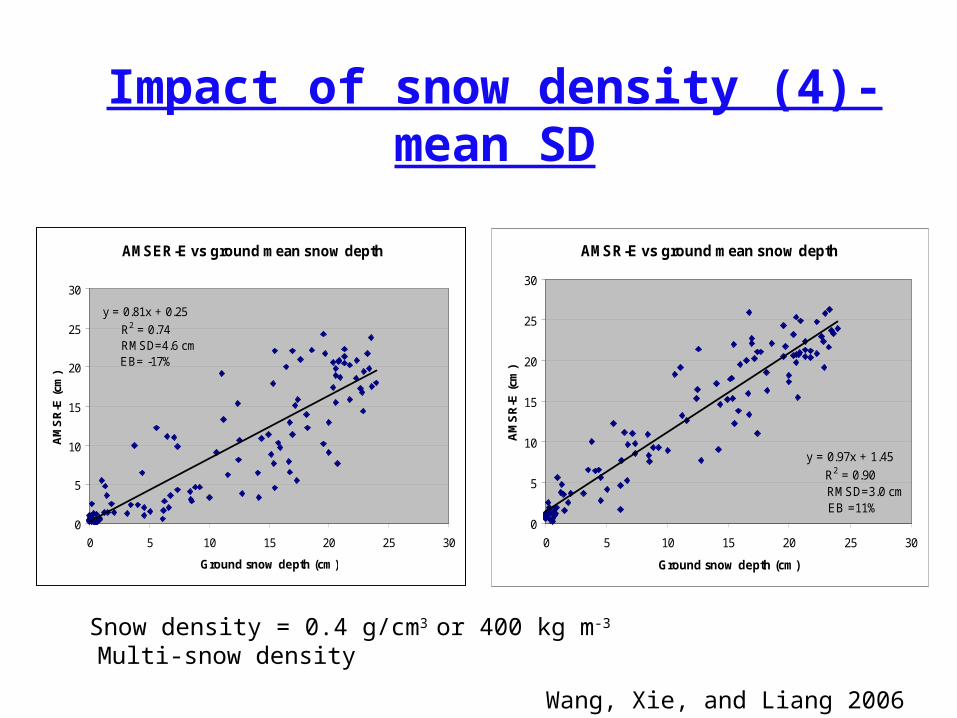
Impact of snow density (4)-mean SD
AMSER-E vs ground mean snow depth
y = 0.81x + 0.25
R2 = 0.74 RMSD=4.6 cm
EB= -17%
0
5
10
15
20
25
30
0 5 10 15 20 25 30
Ground snow depth (cm)
AM
SR
-E (
cm)
Snow density = 0.4 g/cm3 or 400 kg m-3 Multi-snow density
AMSR-E vs ground mean snow depth
y = 0.97x + 1.45
R2 = 0.90 RMSD=3.0 cm
EB =11%0
5
10
15
20
25
30
0 5 10 15 20 25 30
Ground snow depth (cm)
AM
SR
-E (
cm)
Wang, Xie, and Liang 2006

Results: AMSR-E vs ground- SD at individual stations (snow density = 0.4 g/cm3)
Zhaoshu
y = 0.82x + 1.46
R2 = 0.65
0
10
20
30
40
50
0 10 20 30 40 50
Caijiahu
y = 1.28x - 3.20
R2 = 0.52
0
10
20
30
40
50
0 10 20 30 40 50
Qinhe
y = 0.69x + 4.06
R2 = 0.40
0
10
20
30
40
50
0 10 20 30 40 50
jinhe
y = 0.78x + 1.65
R2 = 0.40
0
5
10
15
20
25
0 5 10 15 20 25
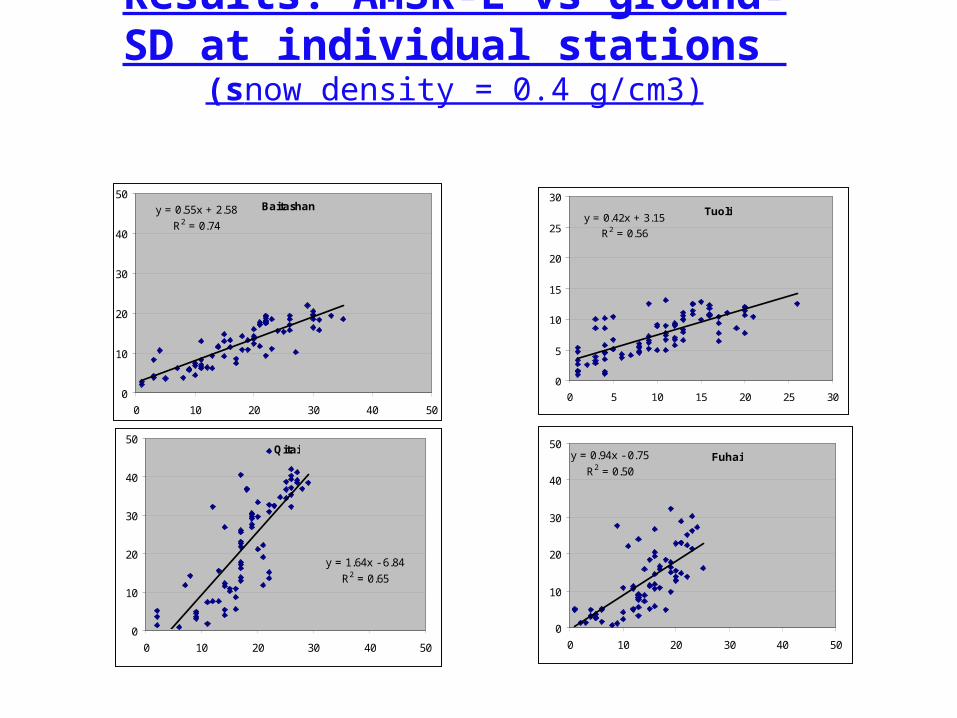
Baitashany = 0.55x + 2.58
R2 = 0.74
0
10
20
30
40
50
0 10 20 30 40 50
Tuoliy = 0.42x + 3.15
R2 = 0.56
0
5
10
15
20
25
30
0 5 10 15 20 25 30
Qitai
y = 1.64x - 6.84
R2 = 0.65
0
10
20
30
40
50
0 10 20 30 40 50
Fuhaiy = 0.94x - 0.75
R2 = 0.50
0
10
20
30
40
50
0 10 20 30 40 50
Results: AMSR-E vs ground- SD at individual stations (snow density = 0.4 g/cm3)
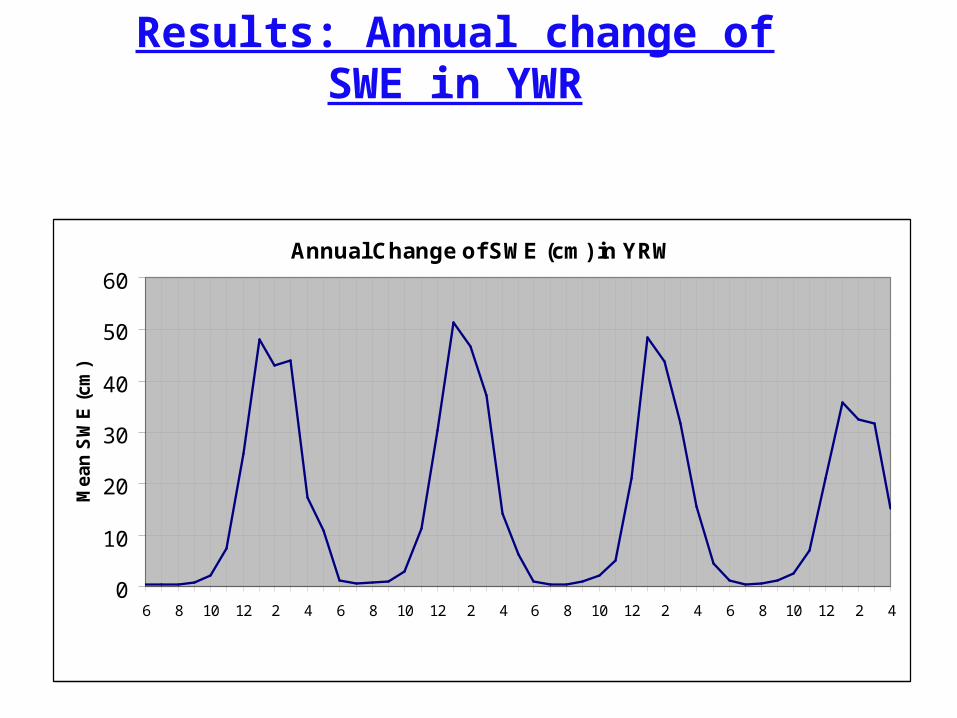
Results: Annual change of SWE in YWR
Annual Change of SWE (cm) in YRW
0
10
20
30
40
50
60
6 8 10 12 2 4 6 8 10 12 2 4 6 8 10 12 2 4 6 8 10 12 2 4
Me
an
SW
E (
cm
)
02-03 03-04 04-05 05-06Hydrologic Year
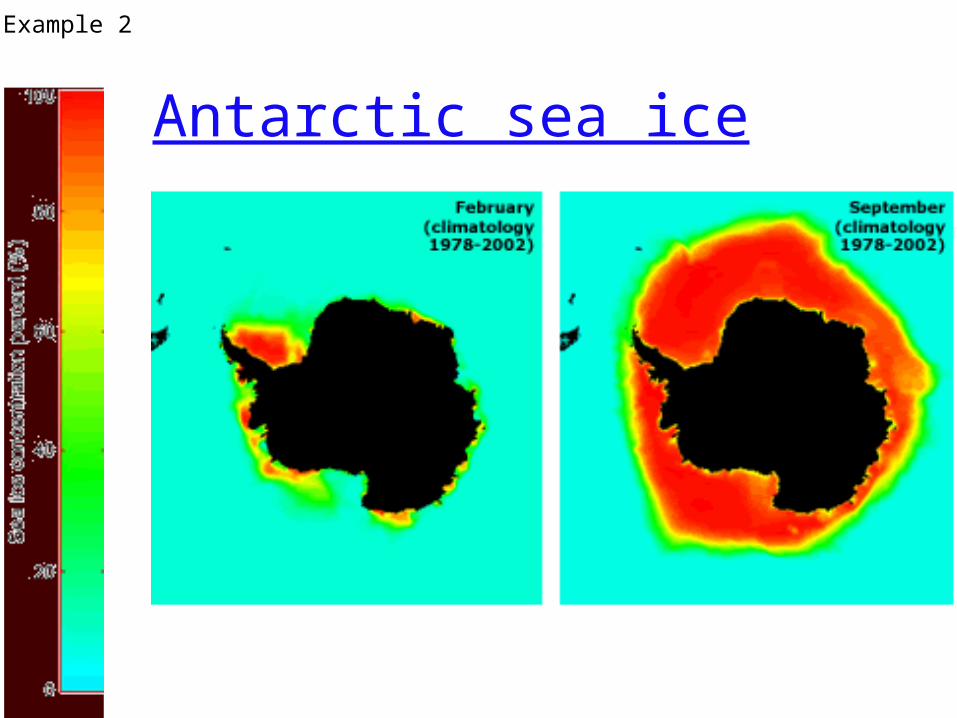
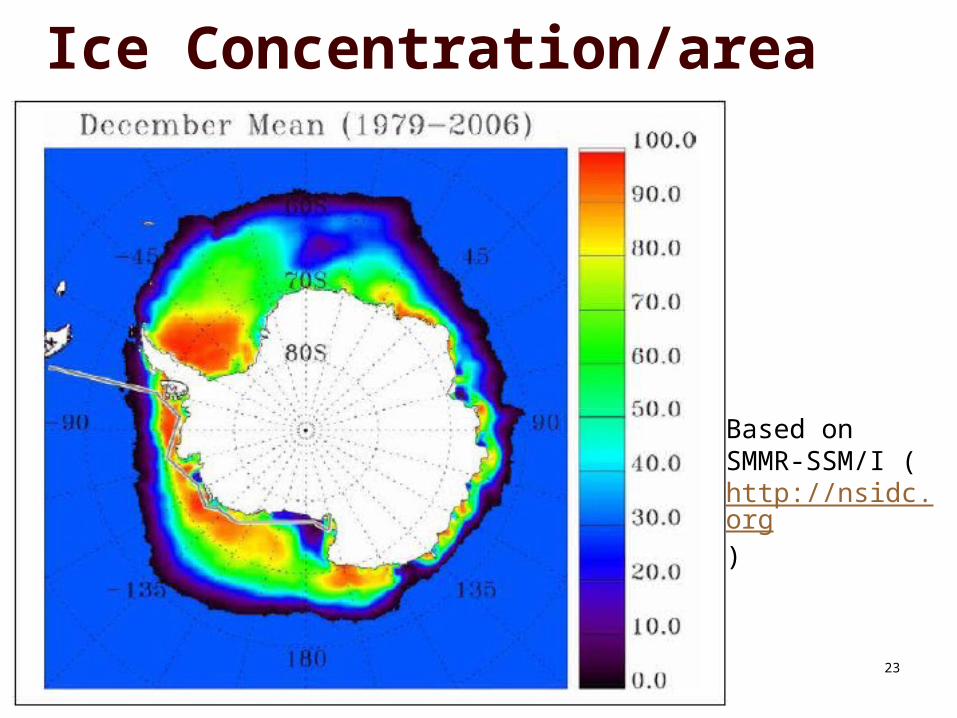
Antarctic sea ice
Example 2
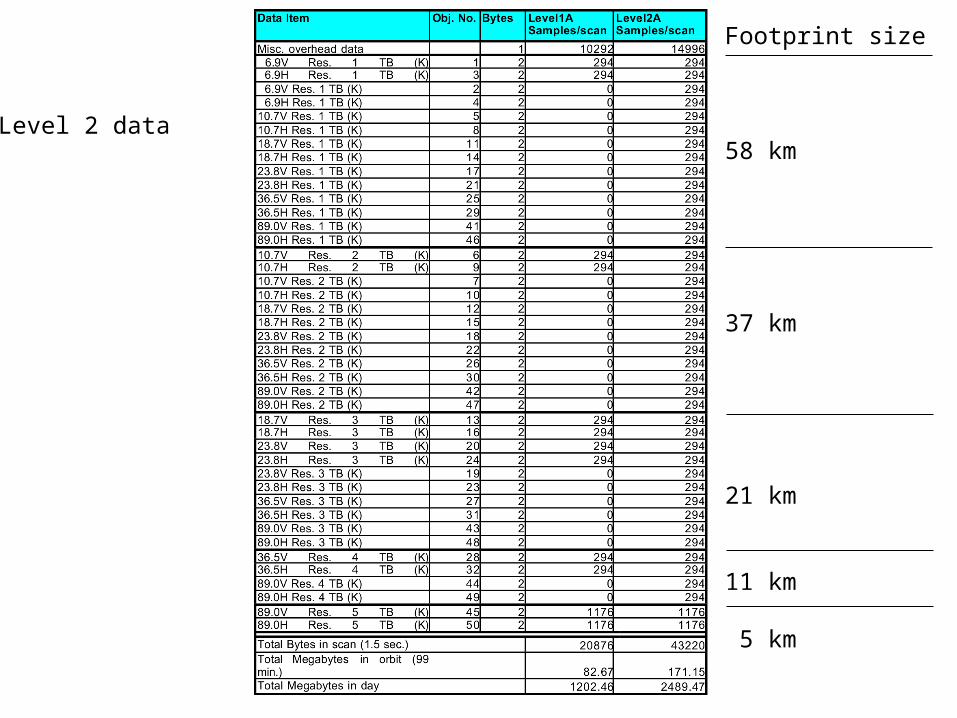
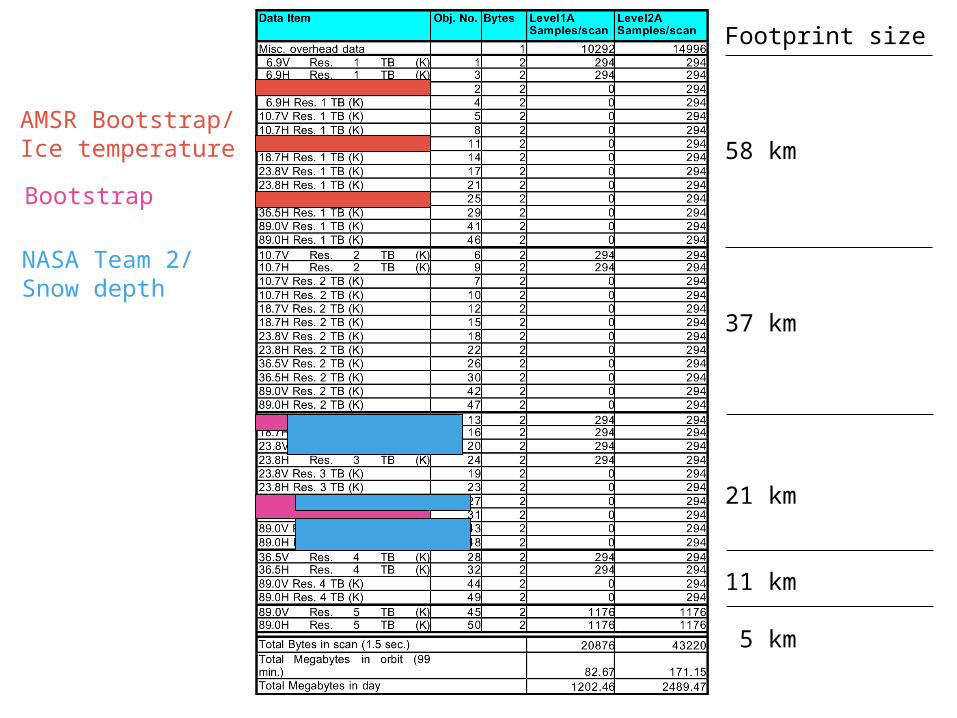
Footprint size
58 km
37 km
21 km
11 km
5 km
Level 2 data
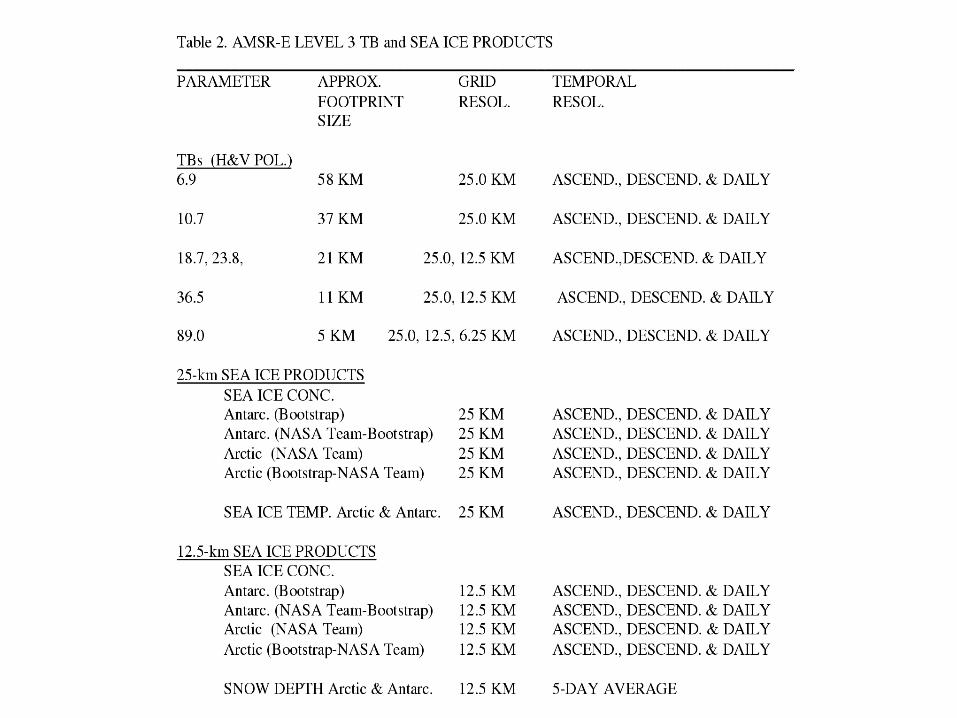

AMSR Bootstrap/Ice temperature
Footprint size
58 km
37 km
21 km
11 km
5 km

AMSR Bootstrap/Ice temperature
Bootstrap
Footprint size
58 km
37 km
21 km
11 km
5 km
AMSR Bootstrap/Ice temperature
Bootstrap
NASA Team 2/Snow depth
Footprint size
58 km
37 km
21 km
11 km
5 km
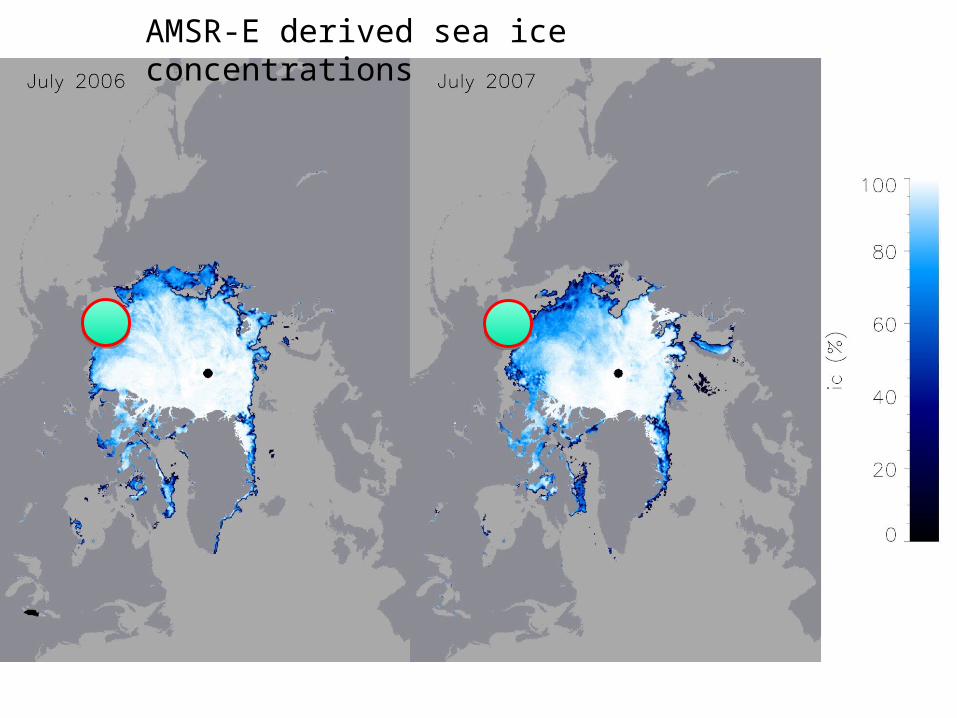
AMSR-E derived sea ice concentrations
24
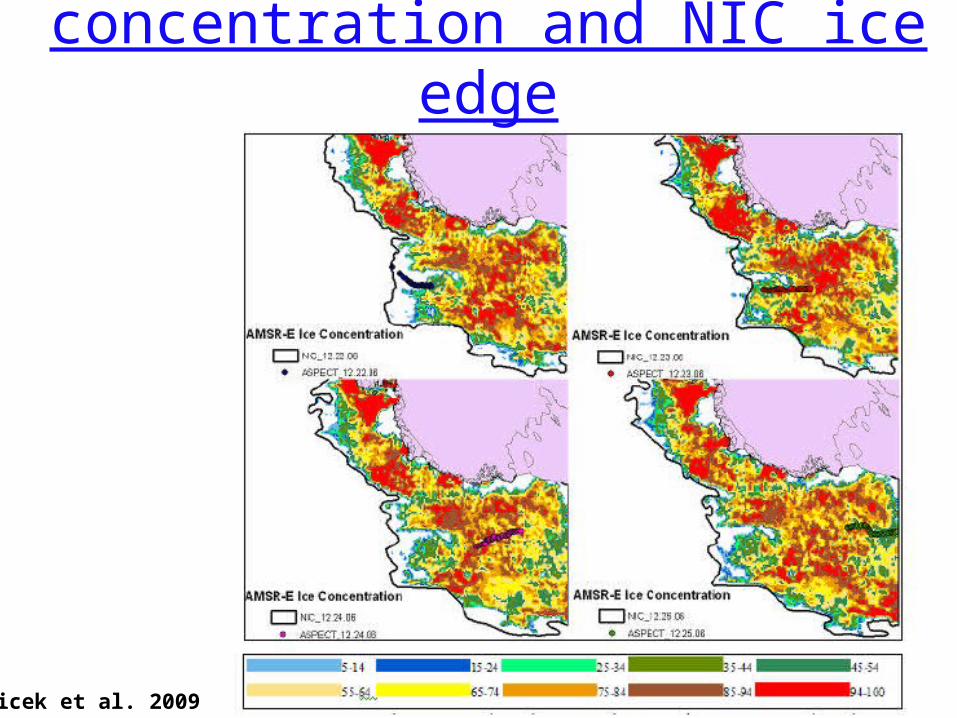
Compare AMSR-E ice concentration and NIC ice edge
Cicek et al. 2009
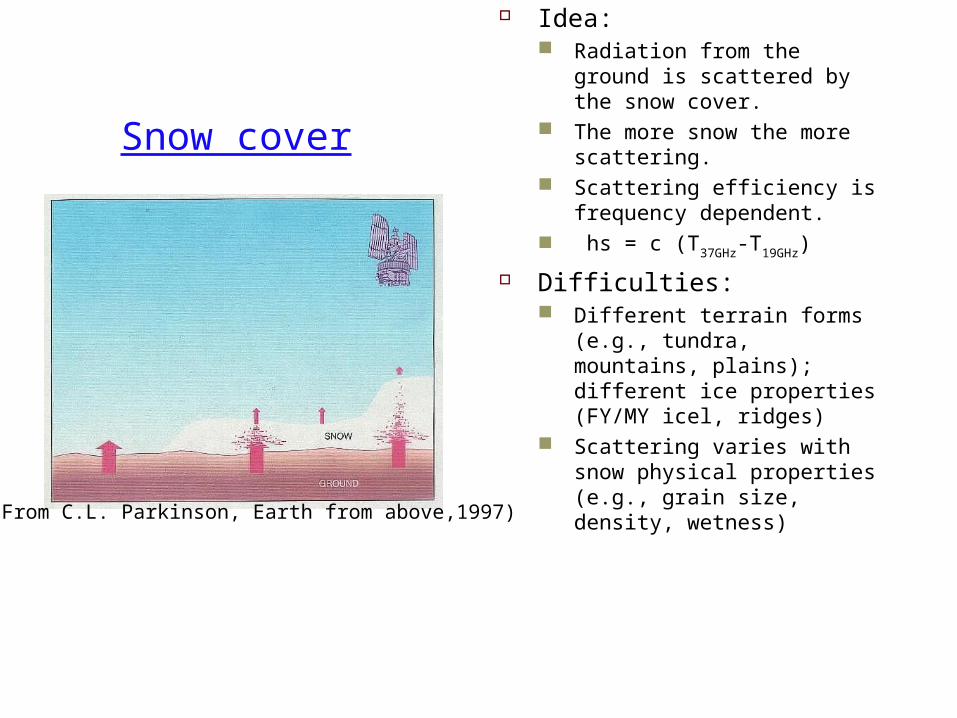
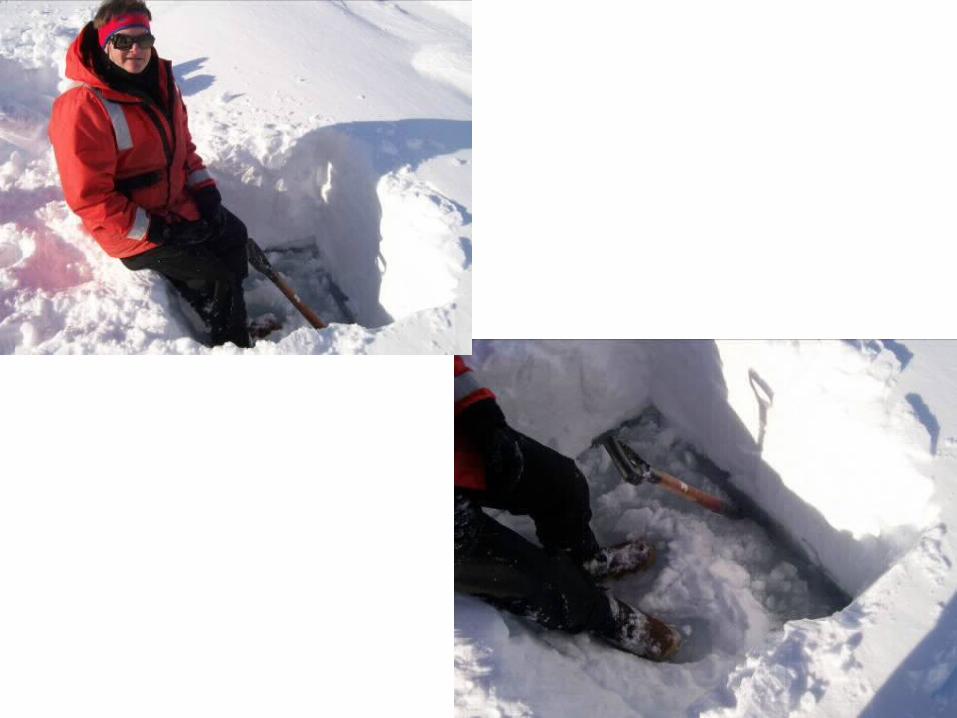
Snow cover
Idea: Radiation from the
ground is scattered by the snow cover.
The more snow the more scattering.
Scattering efficiency is frequency dependent.
hs = c (T37GHz-T19GHz)
Difficulties: Different terrain forms
(e.g., tundra, mountains, plains); different ice properties (FY/MY icel, ridges)
Scattering varies with snow physical properties (e.g., grain size, density, wetness)
(From C.L. Parkinson, Earth from above,1997)
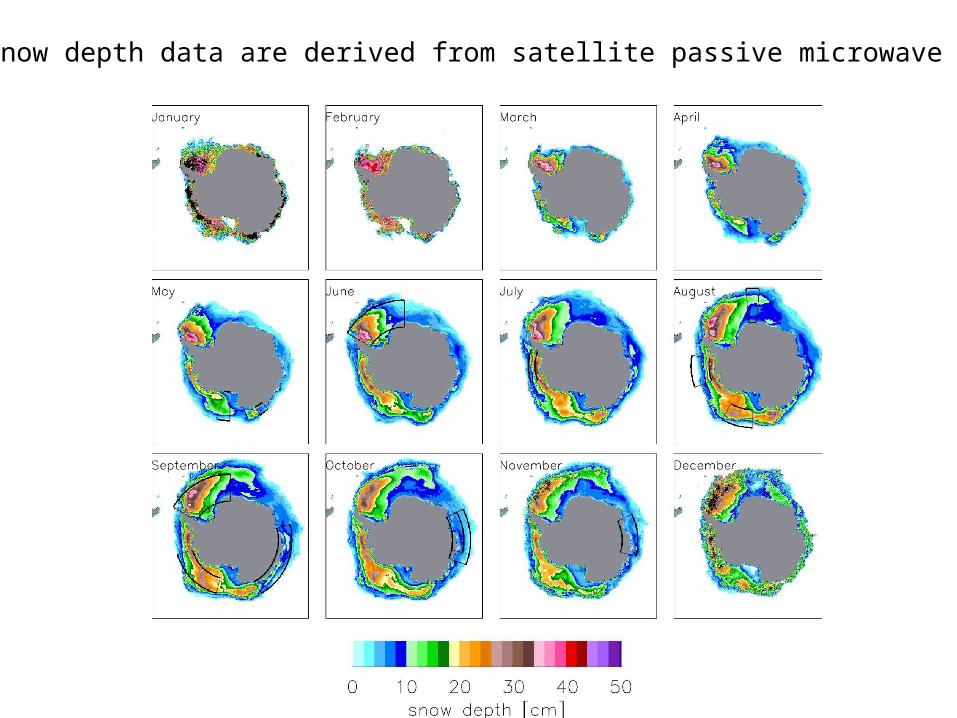
Monthly snow depth data are derived from satellite passive microwave data
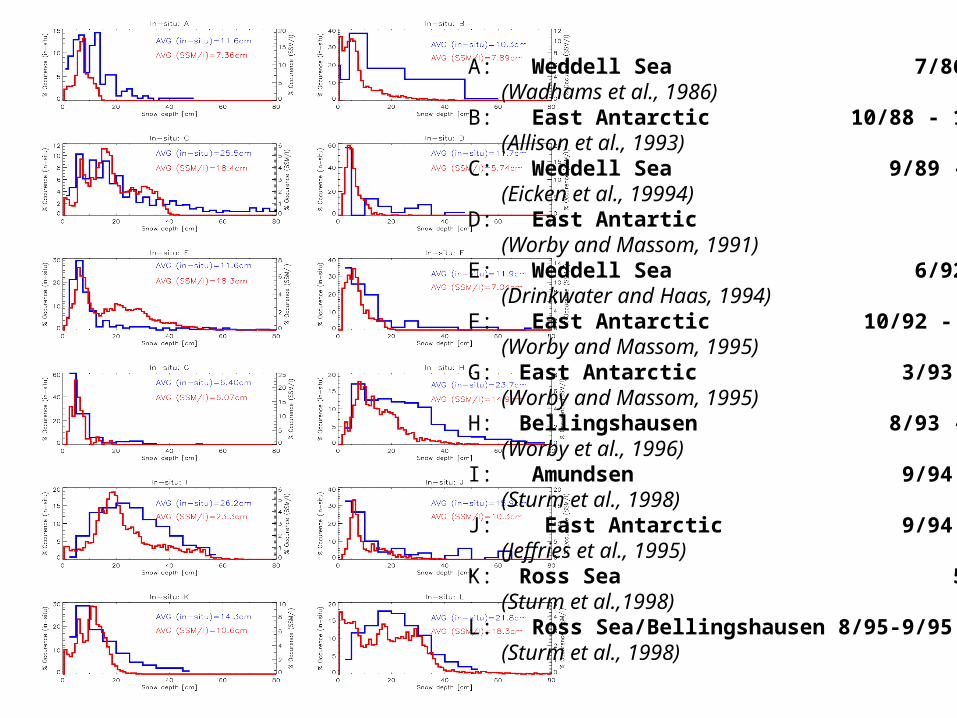
A: Weddell Sea 7/86 - 9/86 (Wadhams et al., 1986)B: East Antarctic 10/88 - 12/88 (Allison et al., 1993)C: Weddell Sea 9/89 - 10/89 (Eicken et al., 19994)D: East Antartic 11/91 (Worby and Massom, 1991)E: Weddell Sea 6/92 - 7/92 (Drinkwater and Haas, 1994)F: East Antarctic 10/92 - 11/92 (Worby and Massom, 1995)G: East Antarctic 3/93 - 5/93 (Worby and Massom, 1995)H: Bellingshausen 8/93 - 9/93 (Worby et al., 1996)I: Amundsen 9/94 - 10/94 (Sturm et al., 1998)J: East Antarctic 9/94 - 10/94 (Jeffries et al., 1995)K: Ross Sea 5/95 - 6/95 (Sturm et al.,1998)L: Ross Sea/Bellingshausen 8/95-9/95 (Sturm et al., 1998)
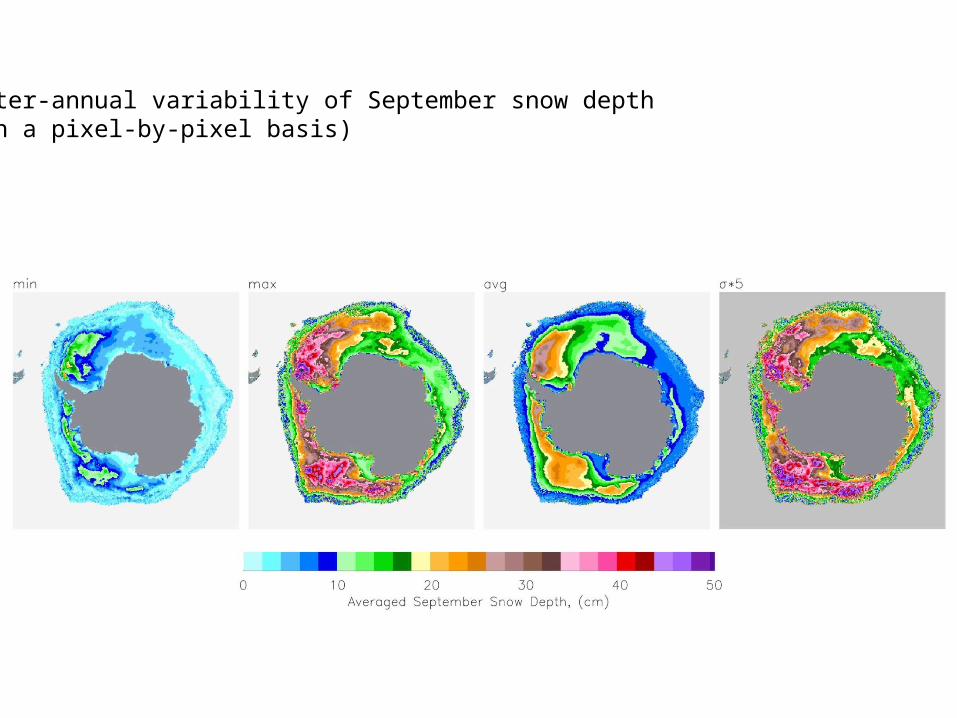
Inter-annual variability of September snow depth(on a pixel-by-pixel basis)
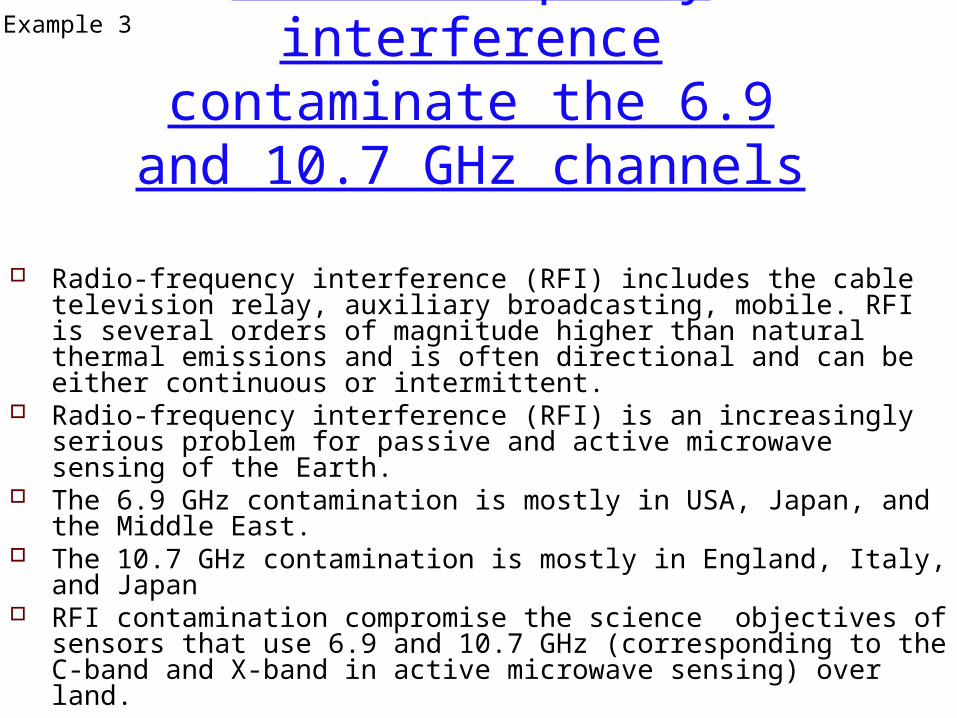
Radio-frequency interference (RFI) includes the cable television relay, auxiliary broadcasting, mobile. RFI is several orders of magnitude higher than natural thermal emissions and is often directional and can be either continuous or intermittent.
Radio-frequency interference (RFI) is an increasingly serious problem for passive and active microwave sensing of the Earth.
The 6.9 GHz contamination is mostly in USA, Japan, and the Middle East.
The 10.7 GHz contamination is mostly in England, Italy, and Japan RFI contamination compromise the science objectives of sensors
that use 6.9 and 10.7 GHz (corresponding to the C-band and X-band in active microwave sensing) over land.
Radio-frequency interference contaminate the 6.9 and 10.7
GHz channels
Example 3

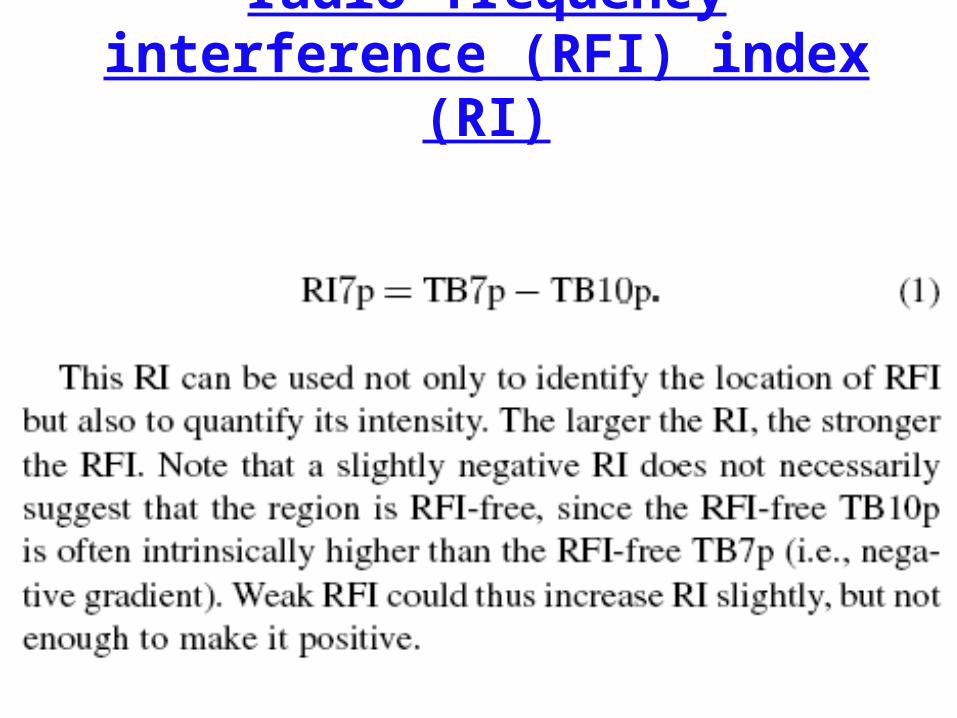
radio-frequency interference (RFI) index (RI)
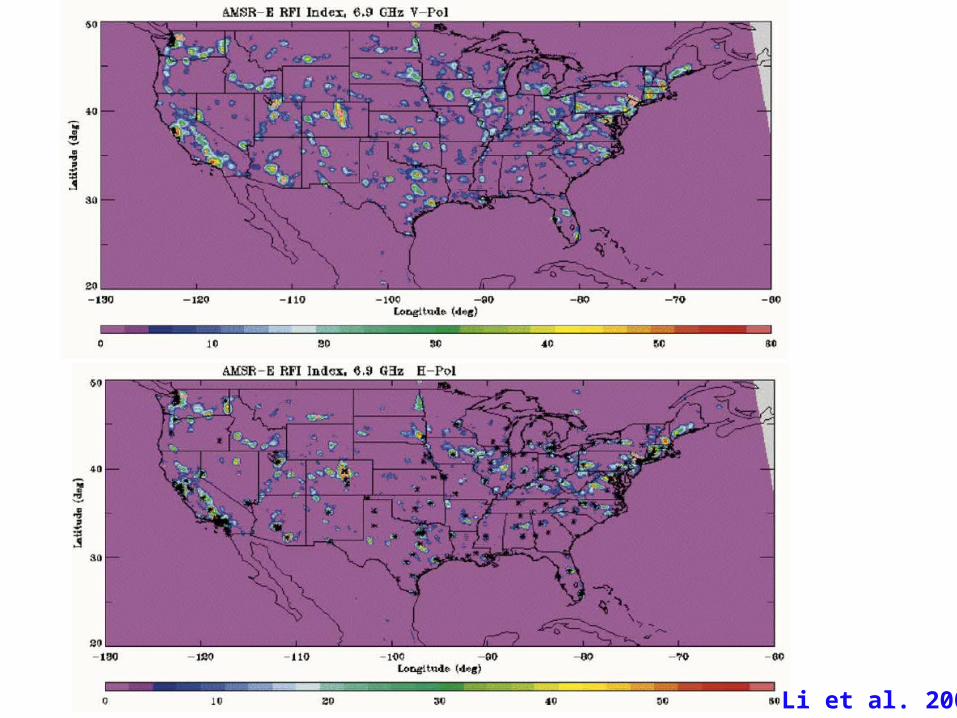
Li et al. 2004
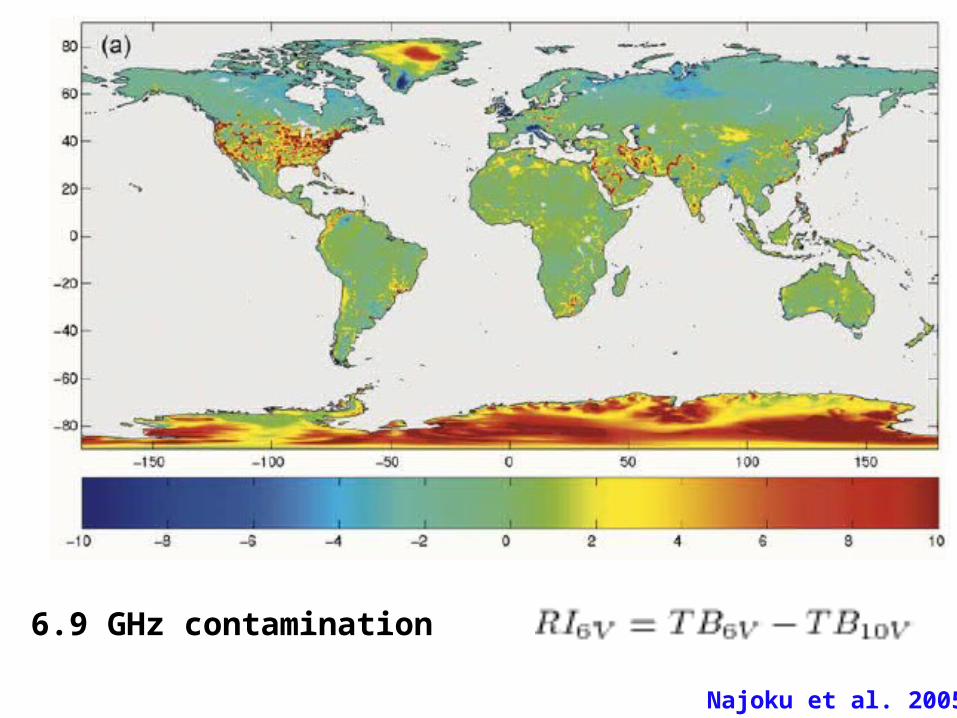
6.9 GHz contamination
Najoku et al. 2005