Embed Size (px)
Citation preview

PDE Method (v3, 07/30/2015) Page 1
PARTNERSHIP FOR THE DELAWARE ESTUARY Science Group
Methods for Marsh Futures Area of Interest (AOI) Elevation Zone Delineation
Date Prepared: 07/30/2015
Prepared By: __ Joshua Moody___ Suggested Citation: Moody, J. 2015. Methods for Marsh Futures Area of Interest (AOI) Elevation Zone Delineation. Partnership for the Delaware Estuary. PDE Method No. 40. 12pp.
PDE Method (v3, 07/30/2015) Page 2
Methods for Marsh Futures Area of Interest (AOI) Elevation Zone Delineation
Partnership for the Delaware Estuary (PDE) Method Joshua Moody Description This method describes GIS procedure for the transformation of survey elevation point data into elevation zone polygons relative to local Mean High Water (MHW) for Marsh Futures Areas of Interest (AOIs) Equipment
ArcGIS ArcGIS point data shapefile for AOI ArcGIS Geostatistical Analyst Extension
Procedure
1. Calculate local MHW relative to NAVD88
a. Go to http://tidesandcurrents.noaa.gov/stations.html?type=Datums
b. Select state
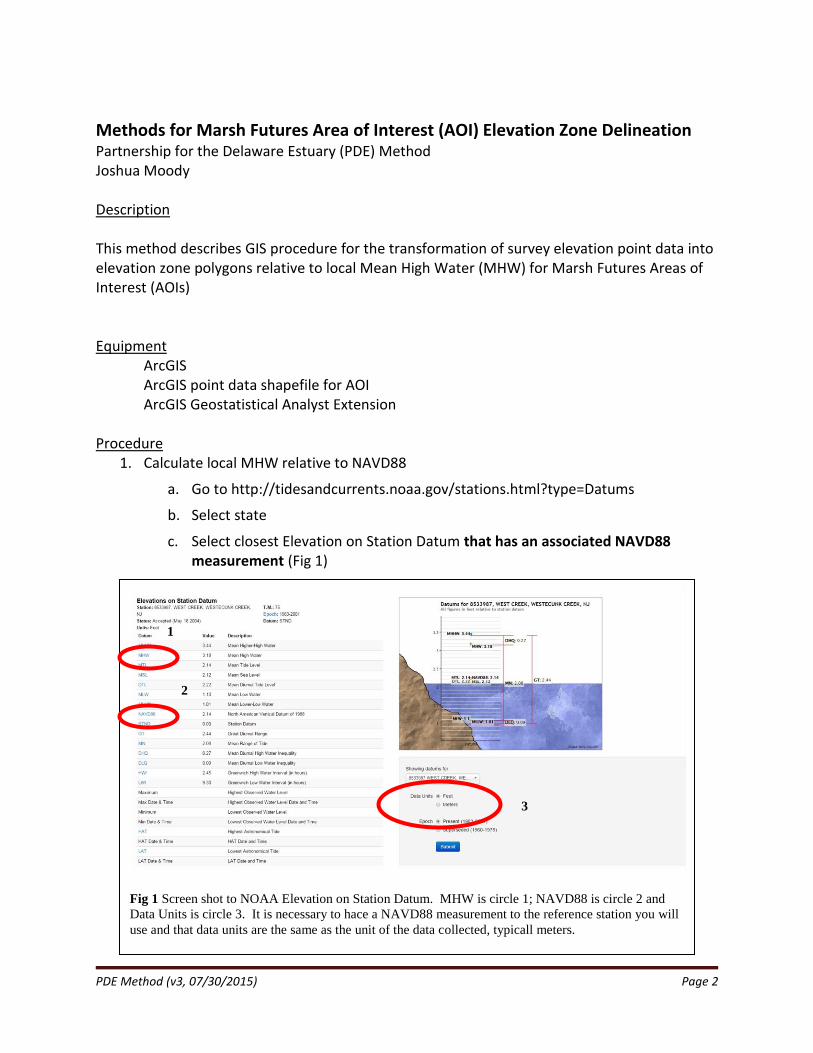
c. Select closest Elevation on Station Datum that has an associated NAVD88 measurement (Fig 1)
Fig 1 Screen shot to NOAA Elevation on Station Datum. MHW is circle 1; NAVD88 is circle 2 and
Data Units is circle 3. It is necessary to hace a NAVD88 measurement to the reference station you will
use and that data units are the same as the unit of the data collected, typicall meters.
1
2
3

PDE Method (v3, 07/30/2015) Page 3
d. Select meters as data unit (below schematic for datum on right) to match with RTK collected data and submit
e. Subtract the NAVD88 value from the MHW value this is your local value for MHW
i. The RTK collects data referenced to NAVD88
ii. The elevations in the RTK are above and below NAVD88 = 0
iii. By subtracting the NAVD88 from MHW listed in the station datum, you calculate a value that references the position of MHW relative to your RTK data
iv. e.g.: MHW=3.011m and NAVD88 = 2.157m in the station datum; the position of MHW in your RTK collected data is 0.854m
2. Open and project RTK collected point data in ArcMap
a. Open Arc Catalog, right click on point file, go to properties and inspect projection
b. Add point data to data frame
c. If projection needs to be changed, use projection tool to change projection
d. In ArcMap right click on data frame, go to properties and select same projection
e. Add base map to data frame and make sure data is being projected correctly
3. Add three (3) new fields to the attribute table associated with the RTK collected point data
a. Open attribute table
b. Table Options>Add Field>
i. Add the following fields:
1. LocalMHW (Type=Float; Precision and Scale =10)
2. El_Rel_MHW : "Elevation Relative to Local MHW" (Type=Float; Precision and Scale =10)
3. Marsh Type (Text; Length=50)
4. Zone (Text; Length=50)
4. Populate LocalMHW field with your local value for MHW (step 1e)
a. right click on field>field calculator
b. Select "yes" when asked if it ok to edit outside of an edit session
c. In the bottom box below "LocalMHW=" type value for local MHW (1e)
d. Select OK
5. Populate El_Rel_MHW with the distance of each points elevation from local MHW
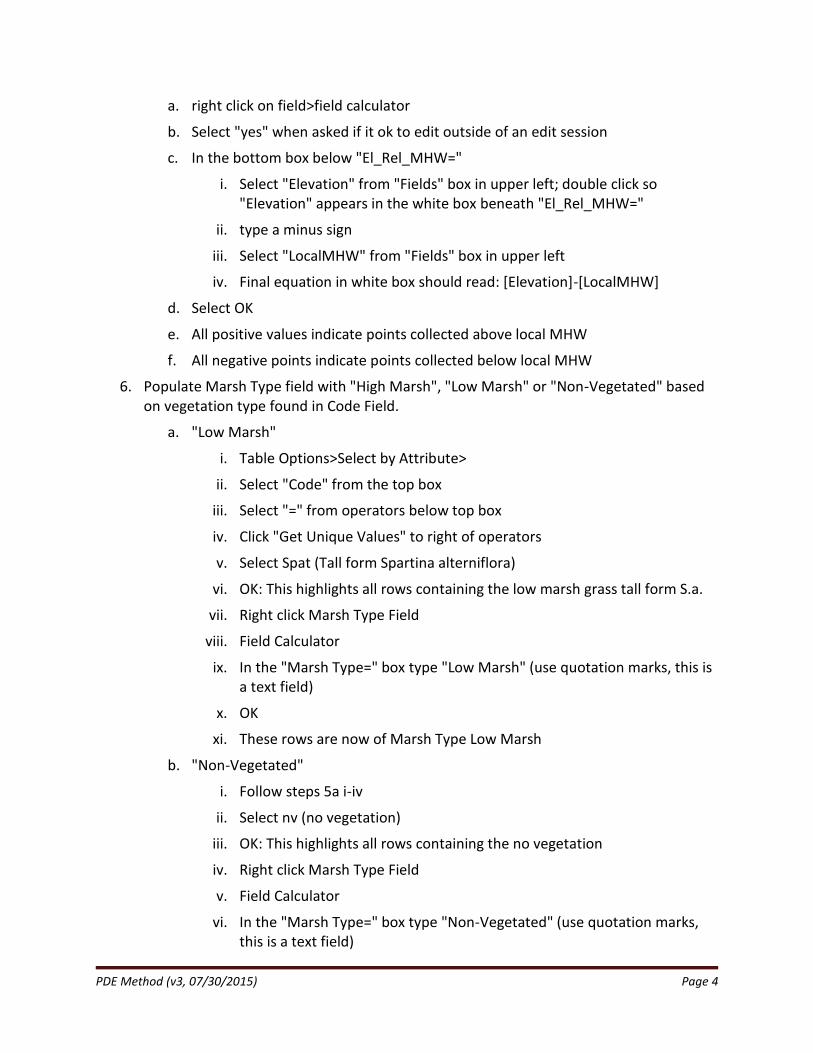
PDE Method (v3, 07/30/2015) Page 4
a. right click on field>field calculator
b. Select "yes" when asked if it ok to edit outside of an edit session
c. In the bottom box below "El_Rel_MHW="
i. Select "Elevation" from "Fields" box in upper left; double click so "Elevation" appears in the white box beneath "El_Rel_MHW="
ii. type a minus sign
iii. Select "LocalMHW" from "Fields" box in upper left
iv. Final equation in white box should read: [Elevation]-[LocalMHW]
d. Select OK
e. All positive values indicate points collected above local MHW
f. All negative points indicate points collected below local MHW
6. Populate Marsh Type field with "High Marsh", "Low Marsh" or "Non-Vegetated" based on vegetation type found in Code Field.
a. "Low Marsh"
i. Table Options>Select by Attribute>
ii. Select "Code" from the top box
iii. Select "=" from operators below top box
iv. Click "Get Unique Values" to right of operators
v. Select Spat (Tall form Spartina alterniflora)
vi. OK: This highlights all rows containing the low marsh grass tall form S.a.
vii. Right click Marsh Type Field
viii. Field Calculator
ix. In the "Marsh Type=" box type "Low Marsh" (use quotation marks, this is a text field)
x. OK
xi. These rows are now of Marsh Type Low Marsh
b. "Non-Vegetated"
i. Follow steps 5a i-iv
ii. Select nv (no vegetation)
iii. OK: This highlights all rows containing the no vegetation
iv. Right click Marsh Type Field
v. Field Calculator
vi. In the "Marsh Type=" box type "Non-Vegetated" (use quotation marks, this is a text field)

PDE Method (v3, 07/30/2015) Page 5
vii. OK
viii. These rows are now of Marsh Type Non-Vegetated
c. "High Marsh"
i. Right click field "Marsh Type" >"sort descending"
ii. This will re-order your rows according to Marsh Type
iii. All Low Marsh vegetation row will be on top, Non-Vegetated row below them, and blank rows on the bottom
iv. Highlight these blank rows and click "Highlight Selected Record" from bottom of attribute table
v. All blank rows should have Code= some type of high marsh vegetation (e.g. spp, spas, dist, etc....)
vi. If some rows contain "Code=spa" as the surveyor could discern whether the vegetation was short or tall form Spartina, we will sort them by elevation. Skip to step "xii" if this the case. If all rows contain high marsh species use steps "vii-x"
vii. Right click Marsh Type Field
viii. Field Calculator
ix. In the "Marsh Type=" box type "High Marsh" (use quotation marks, this is a text field)
x. OK
xi. Steps below are if rows contain Code=spa
xii. Select all rows in which Code= a high marsh species
1. Table Options>Select by Attribute>
2. Select "Code" from the top box
3. Select "=" from operators below top box
4. Click "Get Unique Values" to right of operators
5. Select all high marsh species placing an "OR" operator between each type Do not select spa
6. OK: This highlights all rows containing high marsh species
7. Right click Marsh Type Field
8. Field Calculator
9. In the "Marsh Type=" box type "High Marsh" (use quotation marks, this is a text field)
10. OK
11. These rows are now of Marsh Type High Marsh

PDE Method (v3, 07/30/2015) Page 6
xiii. Right click field "Marsh Type" >"sort descending"
xiv. This will re-order your rows according to Marsh Type
xv. All High Marsh vegetation row will be on top, Low Marsh vegetation below, Non-Vegetated row below them, and blank rows on the bottom
xvi. Highlight these blank rows and click "Highlight Selected Record" from bottom of attribute table
xvii. All blank rows should have Code= spa
xviii. With only the row selected in which Code=spa......
xix. Table Options>Select by Attribute>
xx. Select "El_Rel_MHW" from the top box
xxi. Select ">" from operators below top box
xxii. Type "0" (zero) in box
xxiii. This will select all rows in which the unknown Spartina type points are located above MHW
xxiv. Right click Marsh Type Field
xxv. Field Calculator
xxvi. In the "Marsh Type=" box type "High Marsh" (use quotation marks, this is a text field)
xxvii. OK
xxviii. These rows are now of Marsh Type High Marsh: since we did not know whether the vegetation was short or tall form based on appearance, we will have to categorize it as high marsh veg based on its elevation
xxix. Table Options>Select by Attribute>
xxx. Select "El_Rel_MHW" from the top box
xxxi. Select "<" from operators below top box
xxxii. Type "0" (zero) in box
xxxiii. This will select all rows in which the unknown Spartina type points are located below MHW
xxxiv. Right click Marsh Type Field
xxxv. Field Calculator
xxxvi. In the "Marsh Type=" box type "Low Marsh" (use quotation marks, this is a text field)
xxxvii. OK
PDE Method (v3, 07/30/2015) Page 7
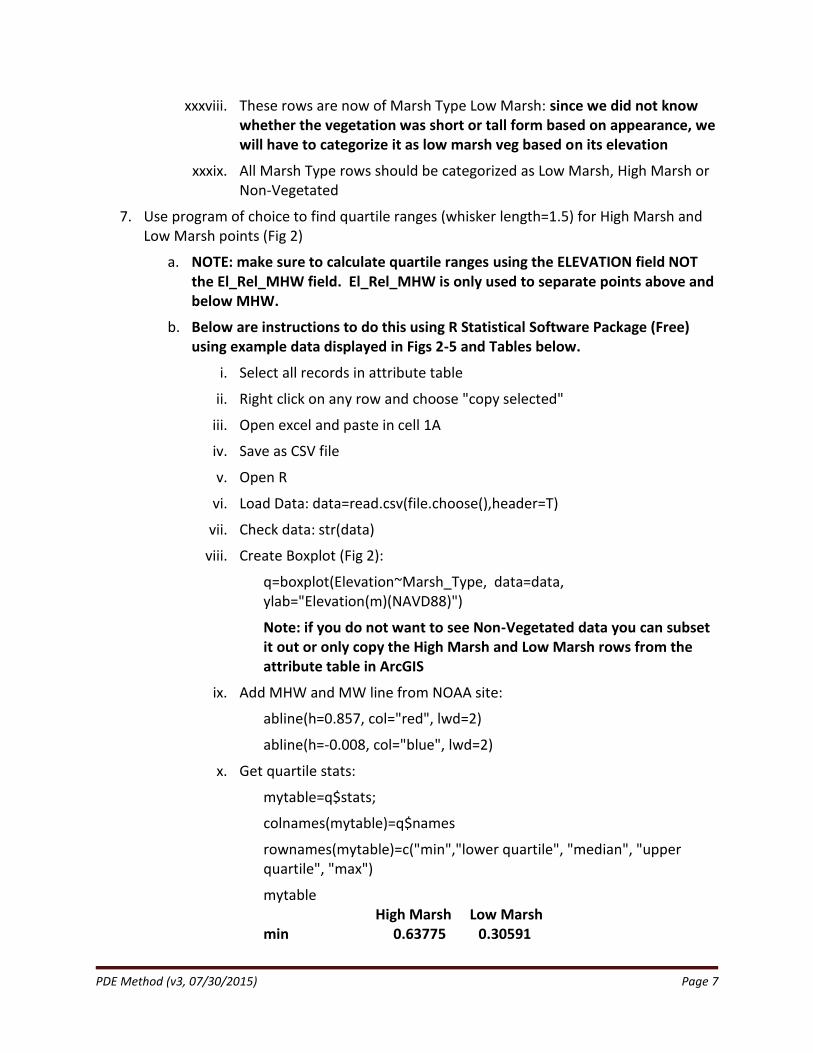
xxxviii. These rows are now of Marsh Type Low Marsh: since we did not know whether the vegetation was short or tall form based on appearance, we will have to categorize it as low marsh veg based on its elevation
xxxix. All Marsh Type rows should be categorized as Low Marsh, High Marsh or Non-Vegetated
7. Use program of choice to find quartile ranges (whisker length=1.5) for High Marsh and Low Marsh points (Fig 2)
a. NOTE: make sure to calculate quartile ranges using the ELEVATION field NOT the El_Rel_MHW field. El_Rel_MHW is only used to separate points above and below MHW.
b. Below are instructions to do this using R Statistical Software Package (Free) using example data displayed in Figs 2-5 and Tables below.
i. Select all records in attribute table
ii. Right click on any row and choose "copy selected"
iii. Open excel and paste in cell 1A
iv. Save as CSV file
v. Open R
vi. Load Data: data=read.csv(file.choose(),header=T)
vii. Check data: str(data)
viii. Create Boxplot (Fig 2):
q=boxplot(Elevation~Marsh_Type, data=data, ylab="Elevation(m)(NAVD88)")
Note: if you do not want to see Non-Vegetated data you can subset it out or only copy the High Marsh and Low Marsh rows from the attribute table in ArcGIS
ix. Add MHW and MW line from NOAA site:
abline(h=0.857, col="red", lwd=2)
abline(h=-0.008, col="blue", lwd=2)
x. Get quartile stats:
mytable=q$stats;
colnames(mytable)=q$names
rownames(mytable)=c("min","lower quartile", "median", "upper quartile", "max")
mytable High Marsh Low Marsh min 0.63775 0.30591

PDE Method (v3, 07/30/2015) Page 8
lower quartile 0.76934 0.52455 median 0.82507 0.61824 upper quartile 0.86560 0.68225 max 0.98080 0.87452
xi. Separate into Zones (See Fig 2)
Zone Table: MHW=0.857 (Fig 2)
Zone Elevation Max
Elevation Min
Position Relative to MHW
Marsh Type Vegetation Present
5 0.98080a 0.87453b Above High Marsh
4 0.87452c 0.857d Above High Marsh & Low Marsh
3 0.856e 0.63775f Below High Marsh & Low Marsh
2 0.63774g 0.52456h Below Low Marsh
1 0.52455i 0.30591j Below Low Marsh
0 0.30590k Below Low Marsh
Note: this leaves out outlier points (Fig 2)
Note2: The letter at the end of each number in columns 2&3 denotes the cell number and will be used in the steps below to guide the user in assigning the correct zones to points. You do not need to insert letters in your own tables

PDE Method (v3, 07/30/2015) Page 9
8. Populate Zone field: use values in Zone Table for each AOI to place points in to their correct zones:
a. Zone 5
i. In attribute table: Table Options>Select by Attribute
ii. Elevation >="b"
1. Values in quotes above are values you get from Zone Table
iii. this will highlight all rows that fall within Zone 5
iv. Right click Zone field> Field Calculator>Type 5 in white box below "Zone="
b. Zone 4
i. In attribute table: Table Options>Select by Attribute
ii. Elevation <"b" AND Elevation >="d"
1. Values in quotes above are values you get from Zone Table
iii. this will highlight all rows that fall within Zone 5
Fig 2 Boxplot showing distribution of high and low marsh vegetation. Red line denotes MHW and blue line
denotes MW. Notice the overlapping portions; these are areas of interest as they represent potential "transition
zones". At this example AOI, there is only a small overlap of vegetation above MHW, but the is a large overlap
of low and high marsh vegetation below MHW.

PDE Method (v3, 07/30/2015) Page 10
iv. Right click Zone field> Field Calculator>Type 4 in white box below "Zone="
c. Repeat for the Zones 3 to 1 using the correct values to select points that fall into each zone based on their elevation
d. Zone 0
i. In attribute table: Table Options>Select by Attribute
1. Elevation <"j"
ii. Values in quotes above are values you get from Zone Table this will highlight all rows that fall within Zone 0
iii. Right click Zone field> Field Calculator>Type 0 in white box below "Zone="
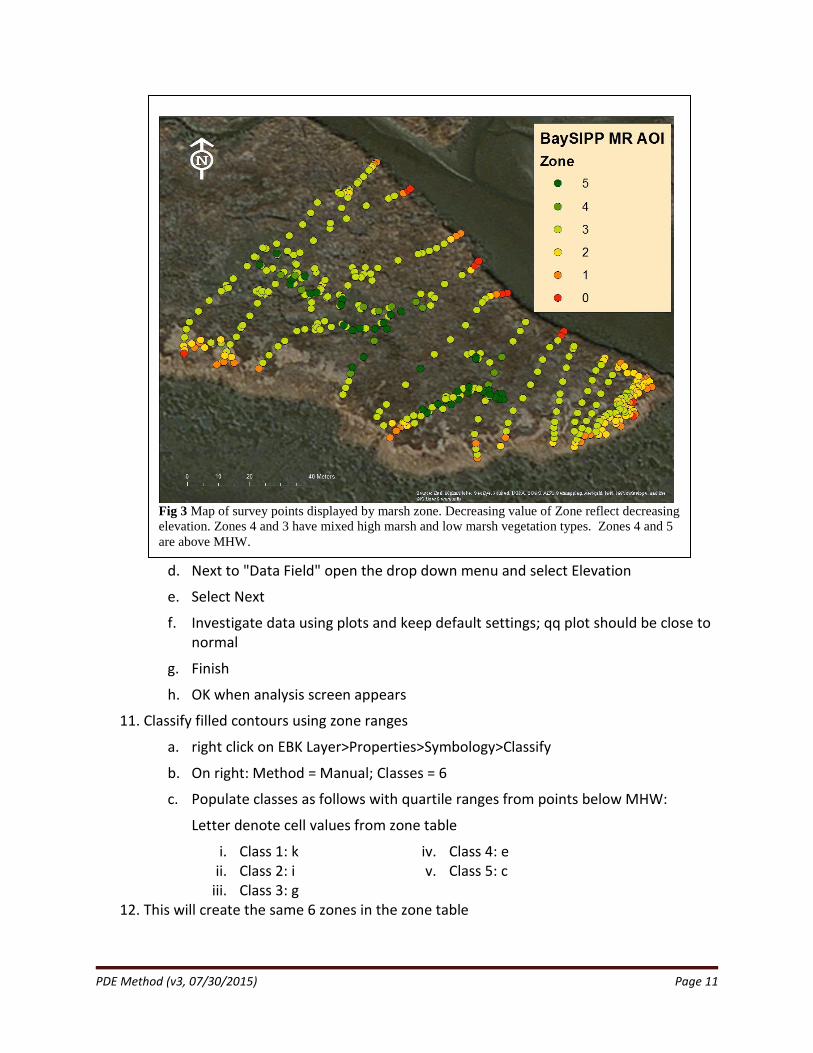
9. Map points based on zonation to get an idea how elevation is changing over the AOI (Fig 3)
a. Properties>Synbology>Categories/Unique Values
b. Value Field = Zone
10. Create digital elevation model of the marsh surface in the AOI using Empirical Bayesian Kriging (EBK)
a. Open Geostatistical Analyst
b. Open Geostatistical Wizard
c. Choose Empirical Bayesian Kriging on left side bar
PDE Method (v3, 07/30/2015) Page 11
d. Next to "Data Field" open the drop down menu and select Elevation
e. Select Next
f. Investigate data using plots and keep default settings; qq plot should be close to normal
g. Finish
h. OK when analysis screen appears
11. Classify filled contours using zone ranges
a. right click on EBK Layer>Properties>Symbology>Classify
b. On right: Method = Manual; Classes = 6
c. Populate classes as follows with quartile ranges from points below MHW:
Letter denote cell values from zone table
i. Class 1: k ii. Class 2: i
iii. Class 3: g
iv. Class 4: e v. Class 5: c
12. This will create the same 6 zones in the zone table
Fig 3 Map of survey points displayed by marsh zone. Decreasing value of Zone reflect decreasing
elevation. Zones 4 and 3 have mixed high marsh and low marsh vegetation types. Zones 4 and 5
are above MHW.

PDE Method (v3, 07/30/2015) Page 12
13. Export a polygon file of the 6 classes of marsh zones for the AOI from the EBK digital elevation model
a. Right click EBK Layer>Data>Export to Vector
i. EBK layer as input geostatistical layer
ii. Contour Type=Filled Contour
b. OK
14. Overlay point data displayed by zone on EBK exported polygon file to insure that the correct points in each zone overlay their corresponding elevation polygon (Fig 4)
a. There may be some points that are not in the correct zone due to complex topography in the area (e.g. hummock/hollow areas when points of highly different elevations are clustered together, but these should be few
b. The Zone number associated with the point file (derived from position relative to MHW and quartile ranges) will be reflected under "ObjectID" and "Classes" in the exported EBK polygons
15. Create MarshZone Field in the exported EBK polygon layer
a. Open attribute table
b. Table Options>Add Field>"MarshZone" (Float; Precision and Scale =1)
c. OK
Fig 4 Map of Empirical Bayesian Kriging digital elevation model classified by quartile ranges used to
delineate marsh zones. RTK point data displayed by marsh zone is overlaid
PDE Method (v3, 07/30/2015) Page 13
16. Populate MarshZone field with ObjectID field values
a. Right click field "MarshZone">Field Calculator>Yes
b. Double click ObjectID in box in upper left so that it appears in the white box below "MarshZone="
c. OK
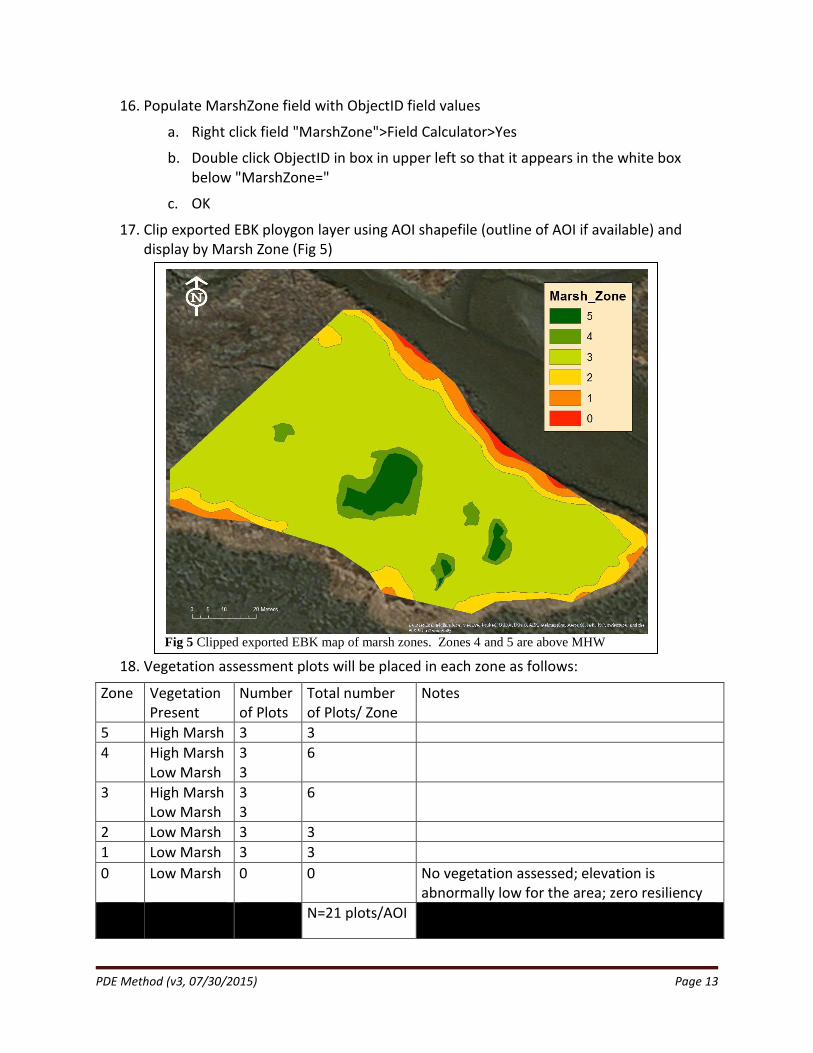
17. Clip exported EBK ploygon layer using AOI shapefile (outline of AOI if available) and display by Marsh Zone (Fig 5)
18. Vegetation assessment plots will be placed in each zone as follows:
Zone Vegetation Present
Number of Plots
Total number of Plots/ Zone
Notes
5 High Marsh 3 3
4 High Marsh Low Marsh
3 3
6
3 High Marsh Low Marsh
3 3
6
2 Low Marsh 3 3
1 Low Marsh 3 3
0 Low Marsh 0 0 No vegetation assessed; elevation is abnormally low for the area; zero resiliency
N=21 plots/AOI
Fig 5 Clipped exported EBK map of marsh zones. Zones 4 and 5 are above MHW