Embed Size (px)
Citation preview
8/6/2019 part_ii_1
http://slidepdf.com/reader/full/partii1 1/20
8/6/2019 part_ii_1
http://slidepdf.com/reader/full/partii1 2/20
8/6/2019 part_ii_1
http://slidepdf.com/reader/full/partii1 3/20
8/6/2019 part_ii_1
http://slidepdf.com/reader/full/partii1 4/20
8/6/2019 part_ii_1
http://slidepdf.com/reader/full/partii1 5/20
8/6/2019 part_ii_1
http://slidepdf.com/reader/full/partii1 6/20
8/6/2019 part_ii_1
http://slidepdf.com/reader/full/partii1 7/20
8/6/2019 part_ii_1
http://slidepdf.com/reader/full/partii1 8/20
8/6/2019 part_ii_1
http://slidepdf.com/reader/full/partii1 9/20
8/6/2019 part_ii_1
http://slidepdf.com/reader/full/partii1 10/20
8/6/2019 part_ii_1
http://slidepdf.com/reader/full/partii1 11/20
8/6/2019 part_ii_1
http://slidepdf.com/reader/full/partii1 12/20
8/6/2019 part_ii_1
http://slidepdf.com/reader/full/partii1 13/20
8/6/2019 part_ii_1
http://slidepdf.com/reader/full/partii1 14/20
8/6/2019 part_ii_1
http://slidepdf.com/reader/full/partii1 15/20
8/6/2019 part_ii_1
http://slidepdf.com/reader/full/partii1 16/20
8/6/2019 part_ii_1
http://slidepdf.com/reader/full/partii1 17/20
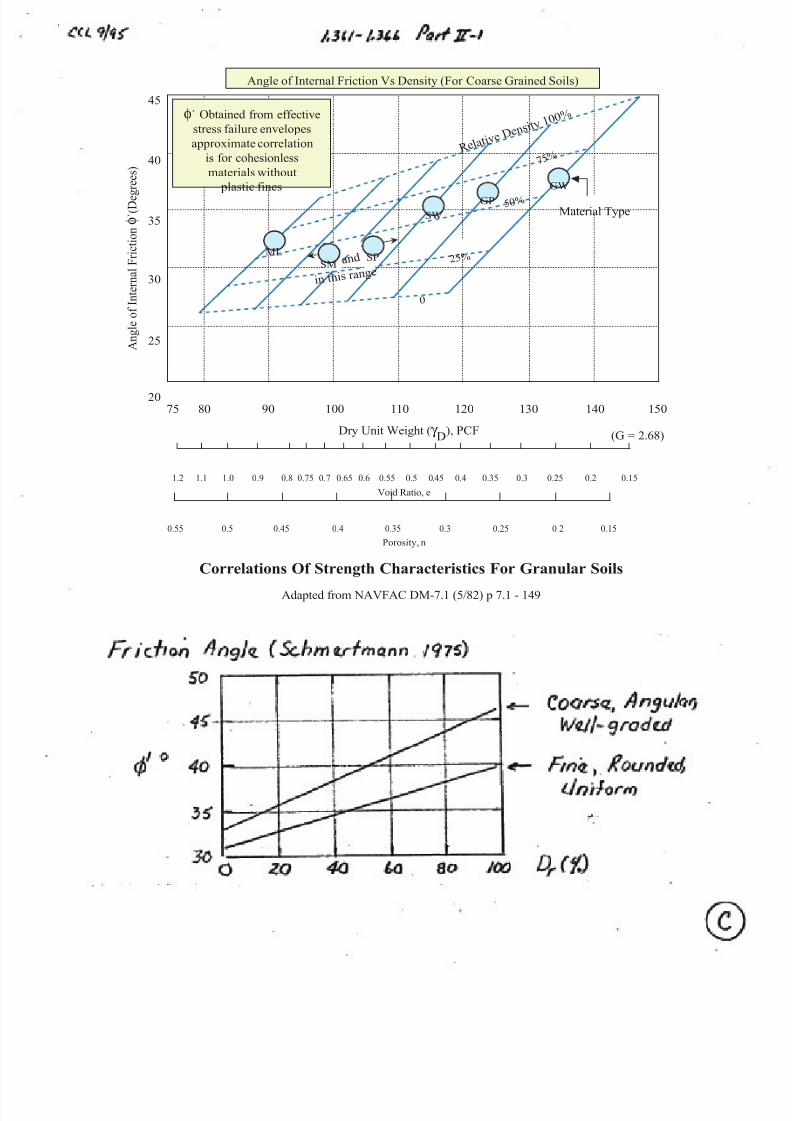
45
40
35
30
25
2075
1.2 1.1 1.0 0.9 0.8 0.75 0.7 0.65 0.6 0.55
0.55 0.5 0.45 0.4 0.35 0.3 0.25 0.2 0.15
(G = 2.68)
0.5 0.45 0.4 0.35 0.3 0.25 0.2 0.15
80 90 100 110 120 130 140 150
φ` Obtained from effective
stress failure envelopes
approximate correlation
is for cohesionless
materials without
plastic fines
ML
SMSP
SW
GP
GW
R e l a t i v e
D e n s i t y
1 0 0 %
i n t h i s ra nge
a n d
0
25 %
5 0 %
7 5 %
Angle of Internal Friction Vs Density (For Coarse Grained Soils)
Adapted from NAVFAC DM-7.1 (5/82) p 7.1 - 149
Correlations Of Strength Characteristics For Granular Soils
Material Type
A n g l e o f I n t e r n a l F r i c t i o n
φ ` ( D e g r e e s )
Dry Unit Weight (γ D
), PCF
Void Ratio, e
Porosity, n
8/6/2019 part_ii_1
http://slidepdf.com/reader/full/partii1 18/20
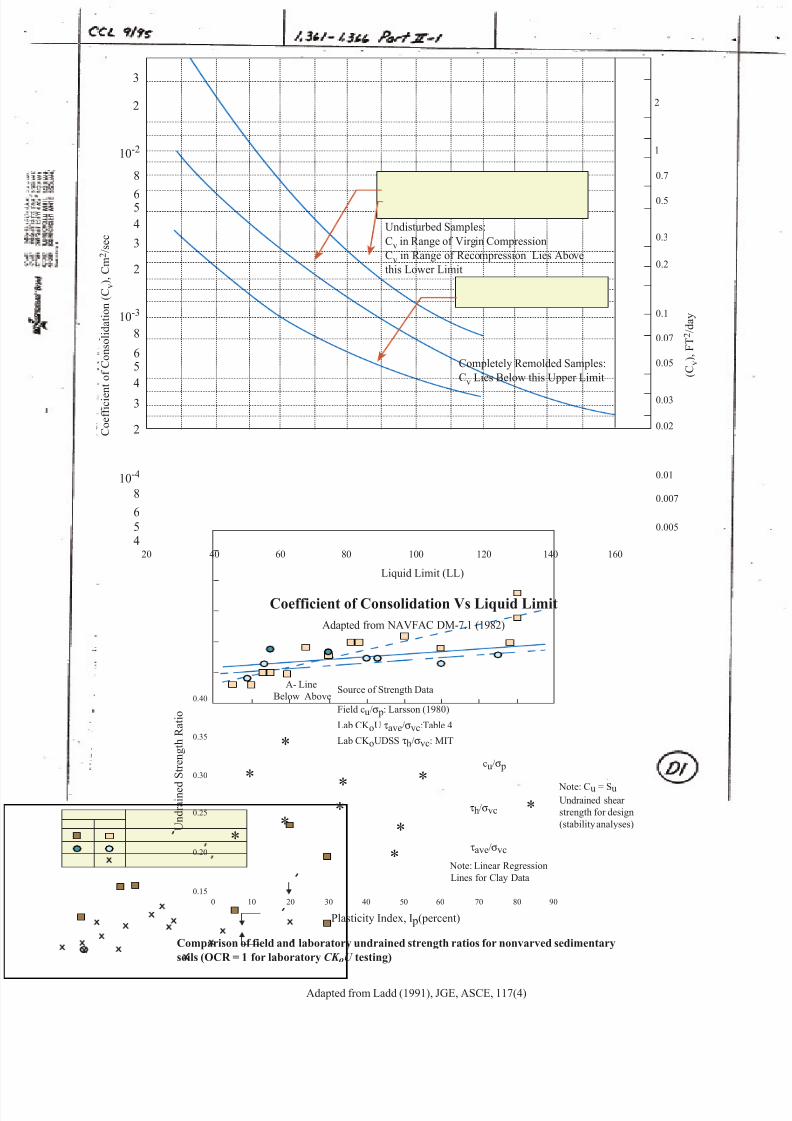
Coefficient of Consolidation Vs Liquid Limit
Adapted from NAVFAC DM-7.1 (1982)
3
2
10-2
10-3
10-4
Liquid Limit (LL)
( C v
) , F T 2 / d a y
C o e f f i c i e n
t o f C o n s o l i d a t i o n ( C v
) , C m
2 / s e c
8
8
65
4
3
2
65
4
8
6
54
3
2
2
1
0.7
0.5
0.3
0.2
0.1
0.07
0.05
0.03
0.02
0.01
0.007
0.005
20 40 60 80 100 120 140 160
Undisturbed Samples:
Cv in Range of Virgin Compression
Cv in Range of Recompression Lies Above
this Lower Limit
Completely Remolded Samples:
Cv Lies Below this Upper Limit
0.40
0.35
0.30
0.25
0.20
0.15
0 10 20 30 40 50 60 70 80 90
U n d r a i n e d
S t r e n g t h R a t i o
Plasticity Index, I p(percent)
Adapted from Ladd (1991), JGE, ASCE, 117(4)
Comparison of field and laboratory undrained strength ratios for nonvarved sedimentary
soils (OCR = 1 for laboratory CK oU testing)
Note: Cu = SuUndrained shear
strength for design
(stability analyses)
Note: Linear Regression
Lines for Clay Data
**
*
**
*
**
*
Source of Strength DataA- Line
AboveBelow
Field cu/σ p: Larsson (1980)
Lab CK oU τave/σvc:Table 4
Lab CK oUDSS τh/σvc: MIT*cu/σ p
τh/σvc
τave/σvc
8/6/2019 part_ii_1
http://slidepdf.com/reader/full/partii1 19/20
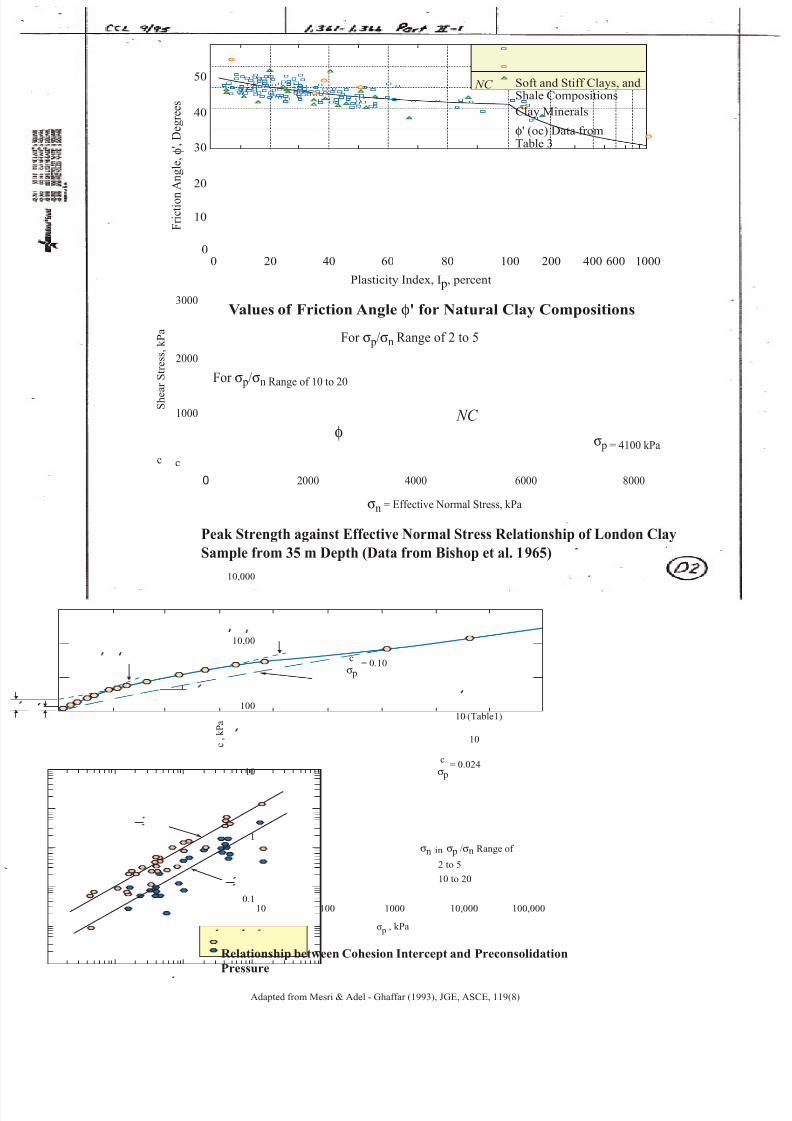
50
40
30
20
10
00 20 40 60 80 100 200 400 600 1000
F r i c t i o n
A n g l e ,
φ ' , D e g r e e s
Plasticity Index, I p, percent
Soft and Stiff Clays, andShale Compositions
Clay Minerals
φ' (oc) Data fromTable 3
NC
Values of Friction Angle φ' for Natural Clay Compositions
NC
For σ p/σn Range of 10 to 20
For σ p/σn Range of 2 to 5
σ p = 4100 kPa
c c
3000
2000
1000
0 2000 4000 6000 8000
S h e a r S t r e s s ,
k P a
σn = Effective Normal Stress, kPa
φ
Peak Strength against Effective Normal Stress Relationship of London Clay
Sample from 35 m Depth (Data from Bishop et al. 1965)
10,000
10,00
100
10
1
0.110 100 1000 10,000 100,000
c
pσ= 0.024
10 (Table1)
10
c
pσ= 0.10
c
, k P a
σ p , kPa
Relationship between Cohesion Intercept and Preconsolidation
Pressure
Adapted from Mesri & Adel - Ghaffar (1993), JGE, ASCE, 119(8)
2 to 5
10 to 20
nσ pσin /σn Range of
8/6/2019 part_ii_1
http://slidepdf.com/reader/full/partii1 20/20
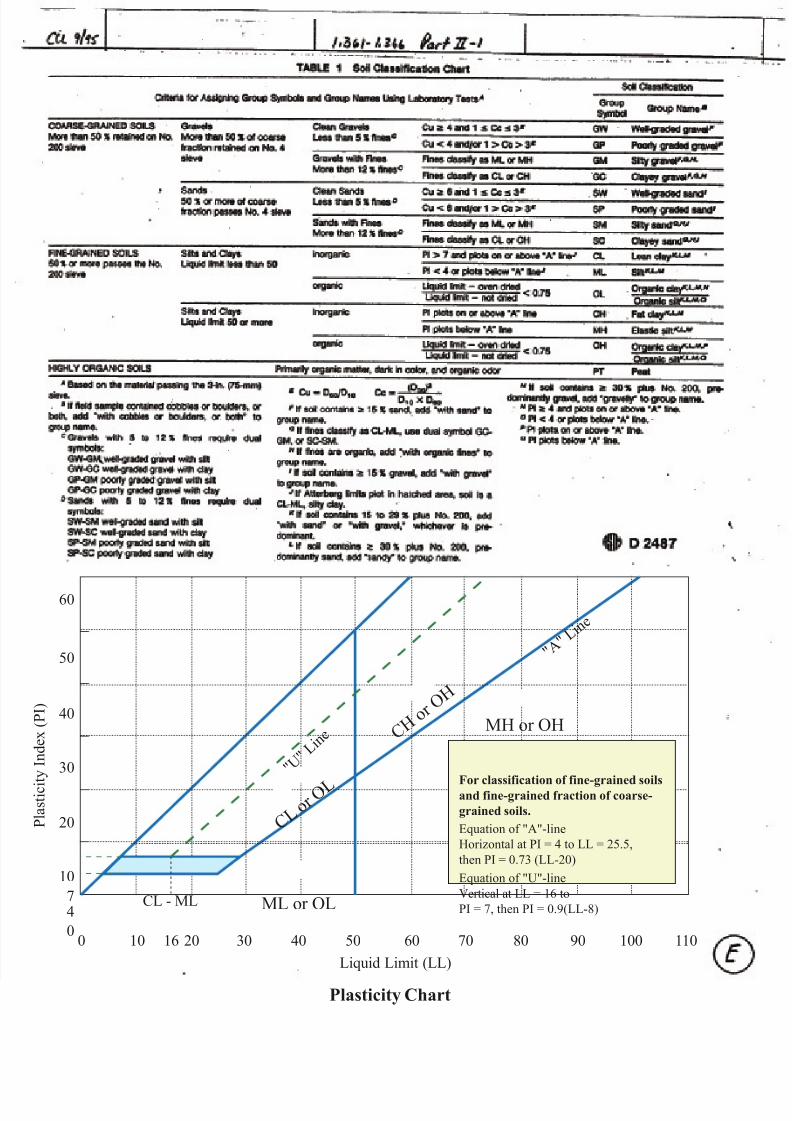
60
50
40
30
20
10
74
00 10 16 20 30 40 50
ML or OL
MH or OH
60 70 80 90 100 110
P l a s t i c i
t y
I n d e x
( P I )
Li id Li it (LL)
" U " L
i n e
C L o r
O L
C H o r
O H
" A " L
i n e
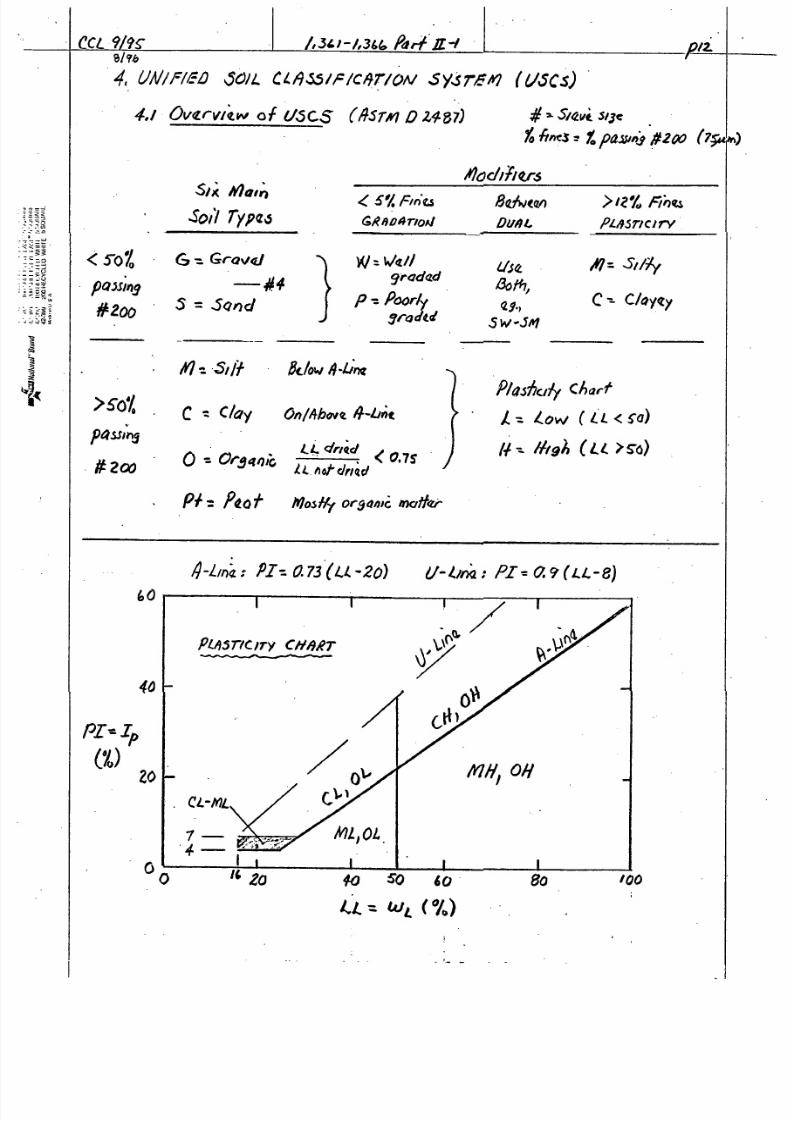
For classification of fine-grained soilsand fine-grained fraction of coarse-
grained soils.
Equation of "A"-line
Horizontal at PI = 4 to LL = 25.5,
then PI = 0.73 (LL-20)
Equation of "U"-line
Vertical at LL = 16 to
PI = 7, then PI = 0.9(LL-8)CL - ML


