Embed Size (px)
Citation preview
Participatory GIS in design of the Wroclaw University of Science and Technology campus web map and spatial analysis of campus area quality
Jan Blachowski1,*, Jakub Łuczak1, and Paulina Zagrodnik1
1Wroclaw University of Science and Technology, Faculty of Geoengineering, Mining and Geology, 27 Wyb. Wyspianskiego St., 50-370 Wroclaw, Poland
Abstract. Public participation geographic information system (GIS) and participatory mapping data collection methods are means that enhance capacity in generating, managing, and communicating spatial information in various fields ranging from local planning to environmental management. In this study these methods have been used in two ways. The first one, to gather information on the additional functionality of campus web map expected by its potential users, i.e. students, staff and visitors, through web based survey. The second, to collect geographically referenced information on campus areas that are liked and disliked in a geo-survey carried out with ArcGIS Online GeoForm Application. The results of the first survey were used to map facilities such as: bicycle infrastructure, building entrances, wheelchair accessible infrastructure and benches. The results of the second one, to analyse the most and the least attractive parts of the campus with heat and hot spot analyses in GIS. In addition, the answers have been studied with regard to the visual and functional aspects of campus area raised in the survey. The thematic layers developed in the results of field mapping and geoprocessing of geosurvey data were included in the campus web map project. The paper describes the applied methodology of data collection, processing, analysis, interpretation and geovisualisation.
1 Introduction According to [1] Public Participation Geographic Information Systems (PPGIS) pertains to the use of geographic information systems (GIS) to broaden public involvement in policymaking, as well as to the value of GIS to promote the goals of non-governmental organizations, community-based organizations etc. The concept may be traced back to Carver [2]. The article [1] provides a comprehensive view of PPGIS: its origins, potential, criticisms and evolution to date. Another term, Participatory Geographic Information Systems (PGIS) refers to participatory approach to spatial planning, spatial information and communication management [3]. The main difference as distinguished by [4] between PGIS and PPGIS is that the first one is used to collect and display community collected information, whereas the * Corresponding author: [email protected]
© The Authors, published by EDP Sciences. This is an open access article distributed under the terms of the Creative Commons Attribution License 4.0 (http://creativecommons.org/licenses/by/4.0/).
E3S Web of Conferences 29, 00025 (2018) https://doi.org/10.1051/e3sconf/20182900025XVIIth Conference of PhD Students and Young Scientists
other one (PPGIS) works with existing public data and visualising them according the needs of the community. The study [1] also provides a discussion of the difference between PPGIS and PGIS and the current campaign to merge the two perspectives and practices under a single acronym. Schlossberg and Shuford [5] note inconsistencies in how practitioners and scholars utilize the term PPGIS across uses and applications. They provide background on the two terms and present a two-plane matrix to help users and researchers provide a more methodical and deliberate context for PPGIS. Recent examples of PPGIS applications include: use of public participation GIS for park visitor management with focus on mountain biking [6], assessment of the value of public lands and social landscape metrics [7]. Studies also focus on quality of PPGIS crowd-sourced spatial data as in the example of PPGIS for conservation planning [8].
Furthermore, other terms found in literature that are associated with Participatory GIS include: Volunteered Geographic Information (VGI), citizen science, crowdsourcing, collaborative or web mapping and mashups. VGI are the tools to create, assemble, and disseminate geographic data provided voluntarily by individuals [9]. Examples of VGI include OpenStreetMap or WikiMapia - online editable maps. Citizen science or crowd-sourced science can be thought as public participation in scientific research [10]. In this scope, collaborative mapping is the aggregation of web mapping and user-generated content. Applications, use mainly two types of collaboration, i.e.: edition of the map itself or overlay layers to the basemap. Exampe uses include support for humanitarian objectives such as disease mitigation [11] or response to effects of natural hazards [12]. Whereas, crowdsourcing is the idea of using the power of a crowd to collect data that is too vast, heterogeneous, or expensive to be collected by other types of sensors. Web mapping is the process of using internet maps delivered by geographic information systems (GIS). A web map on the Internet is both served and consumed, thus web mapping is more than just web cartography, it is a service by which consumers may choose what the map will show [13]. Web GIS facilitates public participation systems using web GIS tools to provide public participants with data, analysis tools, and various communication channels. Mashups are defined by [14] as ‘web applications that combine data from multiple sources to form a new integrated resource’. The study by [15] analysing the impact of using a concept map-based ‘mashup’ to provide user contributed (volunteered) ease of access information to travellers with limited mobility is an example. Peng [16] has proposed a taxonomy of a web-based public participation systems that includes: web browsing, static map images (clickable maps), communication channels (discussing and voting), interactive map-based search query and analysis, scenario building and on-line editing. Authors of the project Linkage – linking systems, perspectives and disciplines for active bioversity governance that utilised workshop and internet based participatory mapping methods list the following main advantages and disadvantages of these two approaches (Table 1) [17].
Table 1. Advantages and disadvantages of participatory mapping methods [17].
Workshop Internet based survey
High control of mapping process Low control of mapping process
Likely higher involvement of participants
Risk of low interest of potential respondents
Limited number of participants Possible participation of greater and representative number of people
Limited time for collection of information No time constraints for respondents
2
E3S Web of Conferences 29, 00025 (2018) https://doi.org/10.1051/e3sconf/20182900025XVIIth Conference of PhD Students and Young Scientists
other one (PPGIS) works with existing public data and visualising them according the needs of the community. The study [1] also provides a discussion of the difference between PPGIS and PGIS and the current campaign to merge the two perspectives and practices under a single acronym. Schlossberg and Shuford [5] note inconsistencies in how practitioners and scholars utilize the term PPGIS across uses and applications. They provide background on the two terms and present a two-plane matrix to help users and researchers provide a more methodical and deliberate context for PPGIS. Recent examples of PPGIS applications include: use of public participation GIS for park visitor management with focus on mountain biking [6], assessment of the value of public lands and social landscape metrics [7]. Studies also focus on quality of PPGIS crowd-sourced spatial data as in the example of PPGIS for conservation planning [8].
Furthermore, other terms found in literature that are associated with Participatory GIS include: Volunteered Geographic Information (VGI), citizen science, crowdsourcing, collaborative or web mapping and mashups. VGI are the tools to create, assemble, and disseminate geographic data provided voluntarily by individuals [9]. Examples of VGI include OpenStreetMap or WikiMapia - online editable maps. Citizen science or crowd-sourced science can be thought as public participation in scientific research [10]. In this scope, collaborative mapping is the aggregation of web mapping and user-generated content. Applications, use mainly two types of collaboration, i.e.: edition of the map itself or overlay layers to the basemap. Exampe uses include support for humanitarian objectives such as disease mitigation [11] or response to effects of natural hazards [12]. Whereas, crowdsourcing is the idea of using the power of a crowd to collect data that is too vast, heterogeneous, or expensive to be collected by other types of sensors. Web mapping is the process of using internet maps delivered by geographic information systems (GIS). A web map on the Internet is both served and consumed, thus web mapping is more than just web cartography, it is a service by which consumers may choose what the map will show [13]. Web GIS facilitates public participation systems using web GIS tools to provide public participants with data, analysis tools, and various communication channels. Mashups are defined by [14] as ‘web applications that combine data from multiple sources to form a new integrated resource’. The study by [15] analysing the impact of using a concept map-based ‘mashup’ to provide user contributed (volunteered) ease of access information to travellers with limited mobility is an example. Peng [16] has proposed a taxonomy of a web-based public participation systems that includes: web browsing, static map images (clickable maps), communication channels (discussing and voting), interactive map-based search query and analysis, scenario building and on-line editing. Authors of the project Linkage – linking systems, perspectives and disciplines for active bioversity governance that utilised workshop and internet based participatory mapping methods list the following main advantages and disadvantages of these two approaches (Table 1) [17].
Table 1. Advantages and disadvantages of participatory mapping methods [17].
Workshop Internet based survey
High control of mapping process Low control of mapping process
Likely higher involvement of participants
Risk of low interest of potential respondents
Limited number of participants Possible participation of greater and representative number of people
Limited time for collection of information No time constraints for respondents
Ability to collect more detailed information
Detailed (further) information can not be collected
Possibility to obtain more accurate spatial data -
In our study we focus on using selected participatory GIS methods, from the above
mentioned approaches, to collect information with the aim to aid design and development of campus web map and to study perception of campus area. The target group is the academic community of the Wroclaw University of Science and Technology (Poland). The tasks have been realised within student bachelor diploma theses and activities of student GIS science club. The scope of work consisted of: internet based survey of the usefulness of present-day campus map and the desired thematic content and functionality of campus web map, mapping campus features indicated in the survey with mobile GIS, as well as analysis and identification of most and least likeable places on the campus with spatial statistic methods based on results of second internet-based geo-survey.
The methodology, data processing and analysis and discussion of results have been described in the following sections of the paper.
2 Wroclaw University of Science and Technology Campus and campus maps
Wroclaw University of Science and Technology (WUST) is one of biggest and best technical universities in Poland with approx. 34,000 students being educated by 2000 academic teachers in 16 faculties. There are 157 student scientific clubs and 22 student organizations operating within the University. WUST has been dynamically developing in recent years with new investments on its campus, e.g.: Bibliotech Library building, which is the seat of the Centre of Knowledge and Science and Technology Information, Technopolis, Student Cultural Zone, as well as cable car named “Polinka” across the Odra River connecting main campus of the University with the new Geocentrum building - an educational and research complex where a new Geocentrum III extension is under development [18].
Most of the WUST facilities in Wroclaw are located on the campus located between Wybrzeze Wyspianskiego and Cuire-Sklodowska Streets and Plac Grunwaldzki (Fig. 1). There are several other smaller campuses hosting Faculty of Architecture, sport facilities, laboratory and administrative buildings.
The present interactive map of the University available on its web site has been prepared with Google Maps API and offers functionality and content limited to locations of buildings marked with point symbols. Map user can access information, in a pop-up window, limited to building name and geographical location by clicking symbol representing a given building.
The map is available at the following url address [19] and its visualisation has been shown in Fig. 1.
3
E3S Web of Conferences 29, 00025 (2018) https://doi.org/10.1051/e3sconf/20182900025XVIIth Conference of PhD Students and Young Scientists
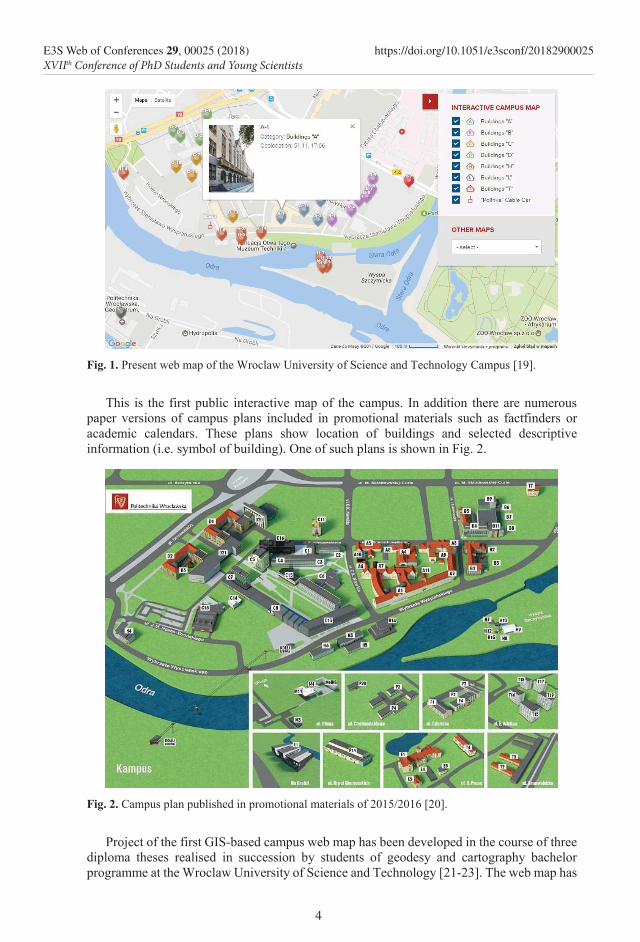
Fig. 1. Present web map of the Wroclaw University of Science and Technology Campus [19].
This is the first public interactive map of the campus. In addition there are numerous
paper versions of campus plans included in promotional materials such as factfinders or academic calendars. These plans show location of buildings and selected descriptive information (i.e. symbol of building). One of such plans is shown in Fig. 2.
Fig. 2. Campus plan published in promotional materials of 2015/2016 [20].
Project of the first GIS-based campus web map has been developed in the course of three
diploma theses realised in succession by students of geodesy and cartography bachelor programme at the Wroclaw University of Science and Technology [21-23]. The web map has
4
E3S Web of Conferences 29, 00025 (2018) https://doi.org/10.1051/e3sconf/20182900025XVIIth Conference of PhD Students and Young Scientists
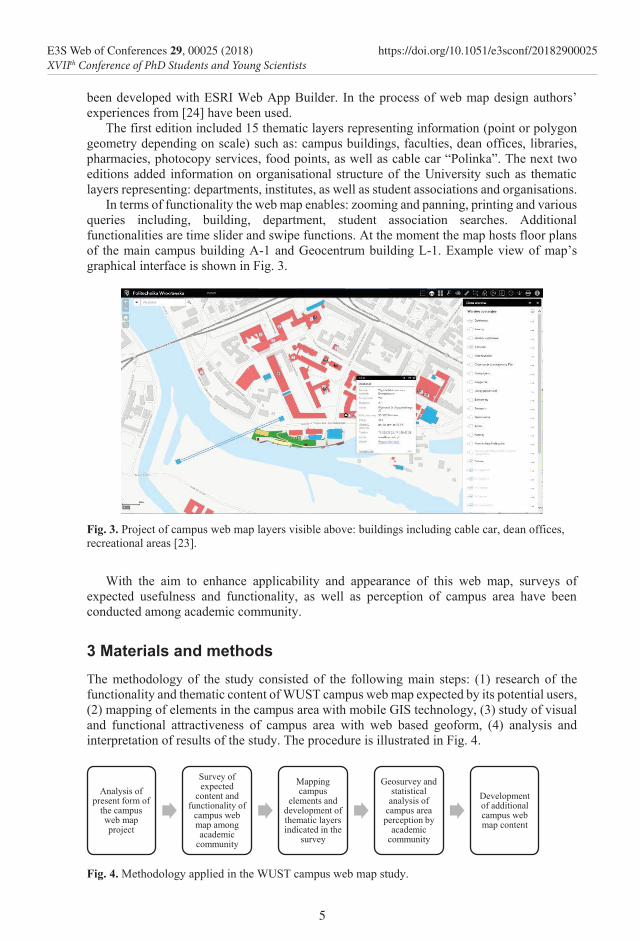
Fig. 1. Present web map of the Wroclaw University of Science and Technology Campus [19].
This is the first public interactive map of the campus. In addition there are numerous
paper versions of campus plans included in promotional materials such as factfinders or academic calendars. These plans show location of buildings and selected descriptive information (i.e. symbol of building). One of such plans is shown in Fig. 2.
Fig. 2. Campus plan published in promotional materials of 2015/2016 [20].
Project of the first GIS-based campus web map has been developed in the course of three
diploma theses realised in succession by students of geodesy and cartography bachelor programme at the Wroclaw University of Science and Technology [21-23]. The web map has
been developed with ESRI Web App Builder. In the process of web map design authors’ experiences from [24] have been used.
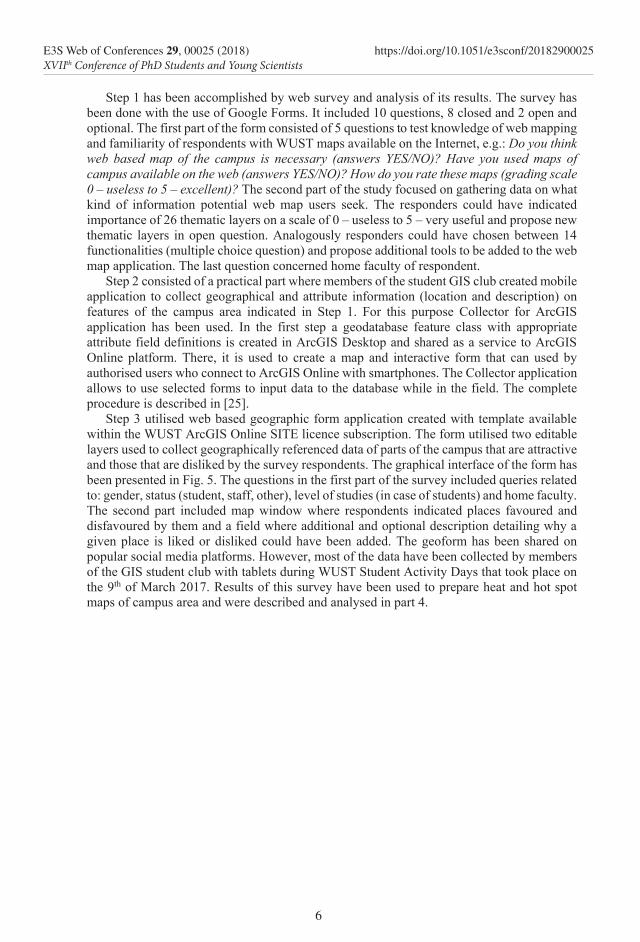
The first edition included 15 thematic layers representing information (point or polygon geometry depending on scale) such as: campus buildings, faculties, dean offices, libraries, pharmacies, photocopy services, food points, as well as cable car “Polinka”. The next two editions added information on organisational structure of the University such as thematic layers representing: departments, institutes, as well as student associations and organisations.
In terms of functionality the web map enables: zooming and panning, printing and various queries including, building, department, student association searches. Additional functionalities are time slider and swipe functions. At the moment the map hosts floor plans of the main campus building A-1 and Geocentrum building L-1. Example view of map’s graphical interface is shown in Fig. 3.
Fig. 3. Project of campus web map layers visible above: buildings including cable car, dean offices, recreational areas [23].
With the aim to enhance applicability and appearance of this web map, surveys of
expected usefulness and functionality, as well as perception of campus area have been conducted among academic community.
3 Materials and methods
The methodology of the study consisted of the following main steps: (1) research of the functionality and thematic content of WUST campus web map expected by its potential users, (2) mapping of elements in the campus area with mobile GIS technology, (3) study of visual and functional attractiveness of campus area with web based geoform, (4) analysis and interpretation of results of the study. The procedure is illustrated in Fig. 4.
Fig. 4. Methodology applied in the WUST campus web map study.
Analysis of present form of
the campus web mapproject
Survey of expected
content and functionality of
campus web map among academic
community
Mapping campus
elements and development of thematic layers indicated in the
survey
Geosurvey and statistical
analysis of campus area perception by
academic community
Development of additional campus web map content
5
E3S Web of Conferences 29, 00025 (2018) https://doi.org/10.1051/e3sconf/20182900025XVIIth Conference of PhD Students and Young Scientists
Step 1 has been accomplished by web survey and analysis of its results. The survey has been done with the use of Google Forms. It included 10 questions, 8 closed and 2 open and optional. The first part of the form consisted of 5 questions to test knowledge of web mapping and familiarity of respondents with WUST maps available on the Internet, e.g.: Do you think web based map of the campus is necessary (answers YES/NO)? Have you used maps of campus available on the web (answers YES/NO)? How do you rate these maps (grading scale 0 – useless to 5 – excellent)? The second part of the study focused on gathering data on what kind of information potential web map users seek. The responders could have indicated importance of 26 thematic layers on a scale of 0 – useless to 5 – very useful and propose new thematic layers in open question. Analogously responders could have chosen between 14 functionalities (multiple choice question) and propose additional tools to be added to the web map application. The last question concerned home faculty of respondent.
Step 2 consisted of a practical part where members of the student GIS club created mobile application to collect geographical and attribute information (location and description) on features of the campus area indicated in Step 1. For this purpose Collector for ArcGIS application has been used. In the first step a geodatabase feature class with appropriate attribute field definitions is created in ArcGIS Desktop and shared as a service to ArcGIS Online platform. There, it is used to create a map and interactive form that can used by authorised users who connect to ArcGIS Online with smartphones. The Collector application allows to use selected forms to input data to the database while in the field. The complete procedure is described in [25].
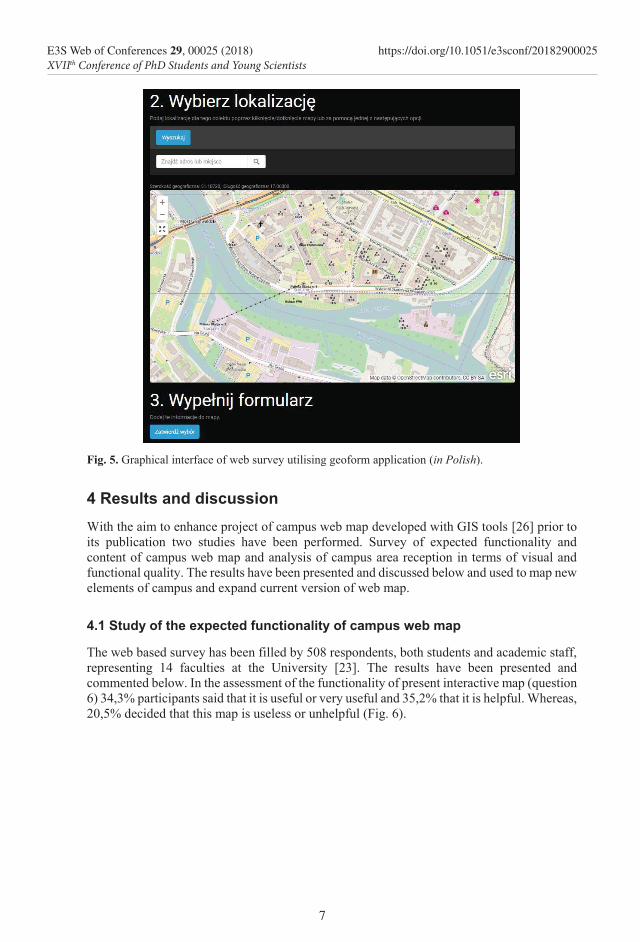
Step 3 utilised web based geographic form application created with template available within the WUST ArcGIS Online SITE licence subscription. The form utilised two editable layers used to collect geographically referenced data of parts of the campus that are attractive and those that are disliked by the survey respondents. The graphical interface of the form has been presented in Fig. 5. The questions in the first part of the survey included queries related to: gender, status (student, staff, other), level of studies (in case of students) and home faculty. The second part included map window where respondents indicated places favoured and disfavoured by them and a field where additional and optional description detailing why a given place is liked or disliked could have been added. The geoform has been shared on popular social media platforms. However, most of the data have been collected by members of the GIS student club with tablets during WUST Student Activity Days that took place on the 9th of March 2017. Results of this survey have been used to prepare heat and hot spot maps of campus area and were described and analysed in part 4.
6
E3S Web of Conferences 29, 00025 (2018) https://doi.org/10.1051/e3sconf/20182900025XVIIth Conference of PhD Students and Young Scientists
Step 1 has been accomplished by web survey and analysis of its results. The survey has been done with the use of Google Forms. It included 10 questions, 8 closed and 2 open and optional. The first part of the form consisted of 5 questions to test knowledge of web mapping and familiarity of respondents with WUST maps available on the Internet, e.g.: Do you think web based map of the campus is necessary (answers YES/NO)? Have you used maps of campus available on the web (answers YES/NO)? How do you rate these maps (grading scale 0 – useless to 5 – excellent)? The second part of the study focused on gathering data on what kind of information potential web map users seek. The responders could have indicated importance of 26 thematic layers on a scale of 0 – useless to 5 – very useful and propose new thematic layers in open question. Analogously responders could have chosen between 14 functionalities (multiple choice question) and propose additional tools to be added to the web map application. The last question concerned home faculty of respondent.
Step 2 consisted of a practical part where members of the student GIS club created mobile application to collect geographical and attribute information (location and description) on features of the campus area indicated in Step 1. For this purpose Collector for ArcGIS application has been used. In the first step a geodatabase feature class with appropriate attribute field definitions is created in ArcGIS Desktop and shared as a service to ArcGIS Online platform. There, it is used to create a map and interactive form that can used by authorised users who connect to ArcGIS Online with smartphones. The Collector application allows to use selected forms to input data to the database while in the field. The complete procedure is described in [25].
Step 3 utilised web based geographic form application created with template available within the WUST ArcGIS Online SITE licence subscription. The form utilised two editable layers used to collect geographically referenced data of parts of the campus that are attractive and those that are disliked by the survey respondents. The graphical interface of the form has been presented in Fig. 5. The questions in the first part of the survey included queries related to: gender, status (student, staff, other), level of studies (in case of students) and home faculty. The second part included map window where respondents indicated places favoured and disfavoured by them and a field where additional and optional description detailing why a given place is liked or disliked could have been added. The geoform has been shared on popular social media platforms. However, most of the data have been collected by members of the GIS student club with tablets during WUST Student Activity Days that took place on the 9th of March 2017. Results of this survey have been used to prepare heat and hot spot maps of campus area and were described and analysed in part 4.
Fig. 5. Graphical interface of web survey utilising geoform application (in Polish).
4 Results and discussion
With the aim to enhance project of campus web map developed with GIS tools [26] prior to its publication two studies have been performed. Survey of expected functionality and content of campus web map and analysis of campus area reception in terms of visual and functional quality. The results have been presented and discussed below and used to map new elements of campus and expand current version of web map.
4.1 Study of the expected functionality of campus web map
The web based survey has been filled by 508 respondents, both students and academic staff, representing 14 faculties at the University [23]. The results have been presented and commented below. In the assessment of the functionality of present interactive map (question 6) 34,3% participants said that it is useful or very useful and 35,2% that it is helpful. Whereas, 20,5% decided that this map is useless or unhelpful (Fig. 6).
7
E3S Web of Conferences 29, 00025 (2018) https://doi.org/10.1051/e3sconf/20182900025XVIIth Conference of PhD Students and Young Scientists
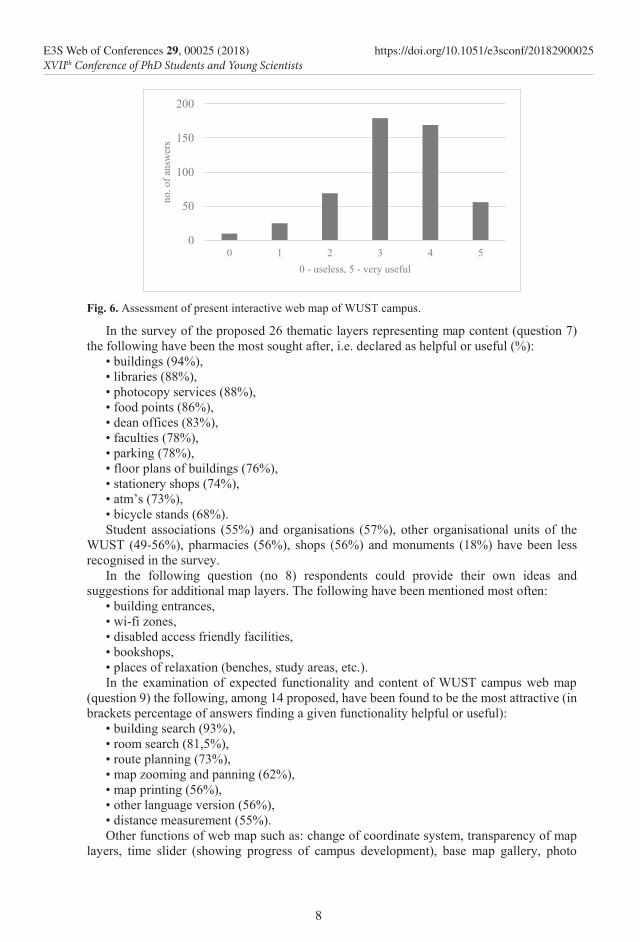
Fig. 6. Assessment of present interactive web map of WUST campus.
In the survey of the proposed 26 thematic layers representing map content (question 7) the following have been the most sought after, i.e. declared as helpful or useful (%):
• buildings (94%), • libraries (88%), • photocopy services (88%), • food points (86%), • dean offices (83%), • faculties (78%), • parking (78%), • floor plans of buildings (76%), • stationery shops (74%), • atm’s (73%), • bicycle stands (68%). Student associations (55%) and organisations (57%), other organisational units of the
WUST (49-56%), pharmacies (56%), shops (56%) and monuments (18%) have been less recognised in the survey.
In the following question (no 8) respondents could provide their own ideas and suggestions for additional map layers. The following have been mentioned most often:
• building entrances, • wi-fi zones, • disabled access friendly facilities, • bookshops, • places of relaxation (benches, study areas, etc.). In the examination of expected functionality and content of WUST campus web map
(question 9) the following, among 14 proposed, have been found to be the most attractive (in brackets percentage of answers finding a given functionality helpful or useful):
• building search (93%), • room search (81,5%), • route planning (73%), • map zooming and panning (62%), • map printing (56%), • other language version (56%), • distance measurement (55%). Other functions of web map such as: change of coordinate system, transparency of map
layers, time slider (showing progress of campus development), base map gallery, photo
0
50
100
150
200
0 1 2 3 4 5
no. o
f ans
wer
s
0 - useless, 5 - very useful
8
E3S Web of Conferences 29, 00025 (2018) https://doi.org/10.1051/e3sconf/20182900025XVIIth Conference of PhD Students and Young Scientists
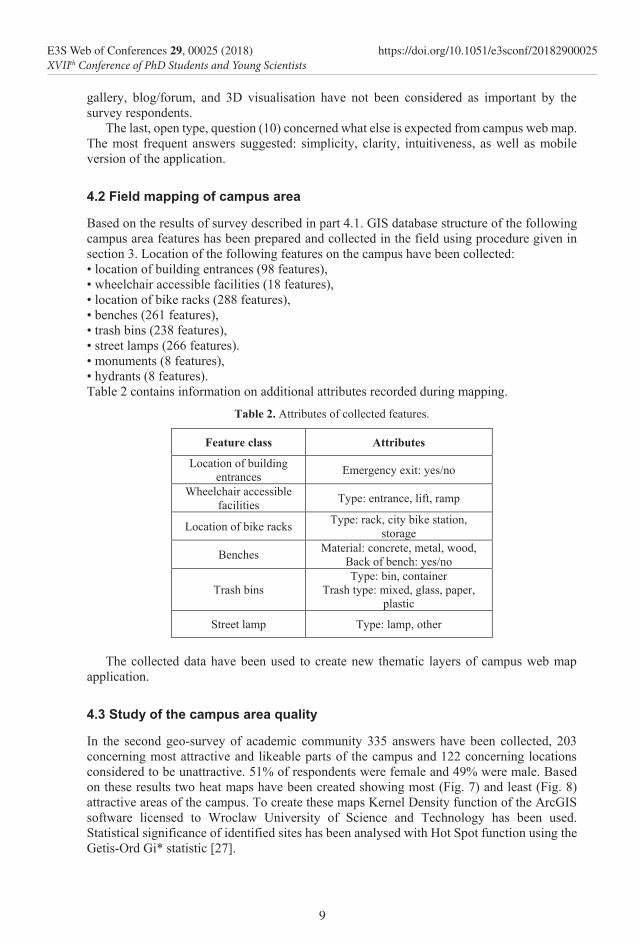
Fig. 6. Assessment of present interactive web map of WUST campus.
In the survey of the proposed 26 thematic layers representing map content (question 7) the following have been the most sought after, i.e. declared as helpful or useful (%):
• buildings (94%), • libraries (88%), • photocopy services (88%), • food points (86%), • dean offices (83%), • faculties (78%), • parking (78%), • floor plans of buildings (76%), • stationery shops (74%), • atm’s (73%), • bicycle stands (68%). Student associations (55%) and organisations (57%), other organisational units of the
WUST (49-56%), pharmacies (56%), shops (56%) and monuments (18%) have been less recognised in the survey.
In the following question (no 8) respondents could provide their own ideas and suggestions for additional map layers. The following have been mentioned most often:
• building entrances, • wi-fi zones, • disabled access friendly facilities, • bookshops, • places of relaxation (benches, study areas, etc.). In the examination of expected functionality and content of WUST campus web map
(question 9) the following, among 14 proposed, have been found to be the most attractive (in brackets percentage of answers finding a given functionality helpful or useful):
• building search (93%), • room search (81,5%), • route planning (73%), • map zooming and panning (62%), • map printing (56%), • other language version (56%), • distance measurement (55%). Other functions of web map such as: change of coordinate system, transparency of map
layers, time slider (showing progress of campus development), base map gallery, photo
0
50
100
150
200
0 1 2 3 4 5
no. o
f ans
wer
s
0 - useless, 5 - very useful
gallery, blog/forum, and 3D visualisation have not been considered as important by the survey respondents.
The last, open type, question (10) concerned what else is expected from campus web map. The most frequent answers suggested: simplicity, clarity, intuitiveness, as well as mobile version of the application.
4.2 Field mapping of campus area
Based on the results of survey described in part 4.1. GIS database structure of the following campus area features has been prepared and collected in the field using procedure given in section 3. Location of the following features on the campus have been collected: • location of building entrances (98 features), • wheelchair accessible facilities (18 features), • location of bike racks (288 features), • benches (261 features), • trash bins (238 features), • street lamps (266 features). • monuments (8 features), • hydrants (8 features). Table 2 contains information on additional attributes recorded during mapping.
Table 2. Attributes of collected features.
Feature class Attributes
Location of building entrances Emergency exit: yes/no
Wheelchair accessible facilities Type: entrance, lift, ramp
Location of bike racks Type: rack, city bike station, storage
Benches Material: concrete, metal, wood, Back of bench: yes/no
Trash bins Type: bin, container
Trash type: mixed, glass, paper, plastic
Street lamp Type: lamp, other
The collected data have been used to create new thematic layers of campus web map
application.
4.3 Study of the campus area quality
In the second geo-survey of academic community 335 answers have been collected, 203 concerning most attractive and likeable parts of the campus and 122 concerning locations considered to be unattractive. 51% of respondents were female and 49% were male. Based on these results two heat maps have been created showing most (Fig. 7) and least (Fig. 8) attractive areas of the campus. To create these maps Kernel Density function of the ArcGIS software licensed to Wroclaw University of Science and Technology has been used. Statistical significance of identified sites has been analysed with Hot Spot function using the Getis-Ord Gi* statistic [27].
9
E3S Web of Conferences 29, 00025 (2018) https://doi.org/10.1051/e3sconf/20182900025XVIIth Conference of PhD Students and Young Scientists
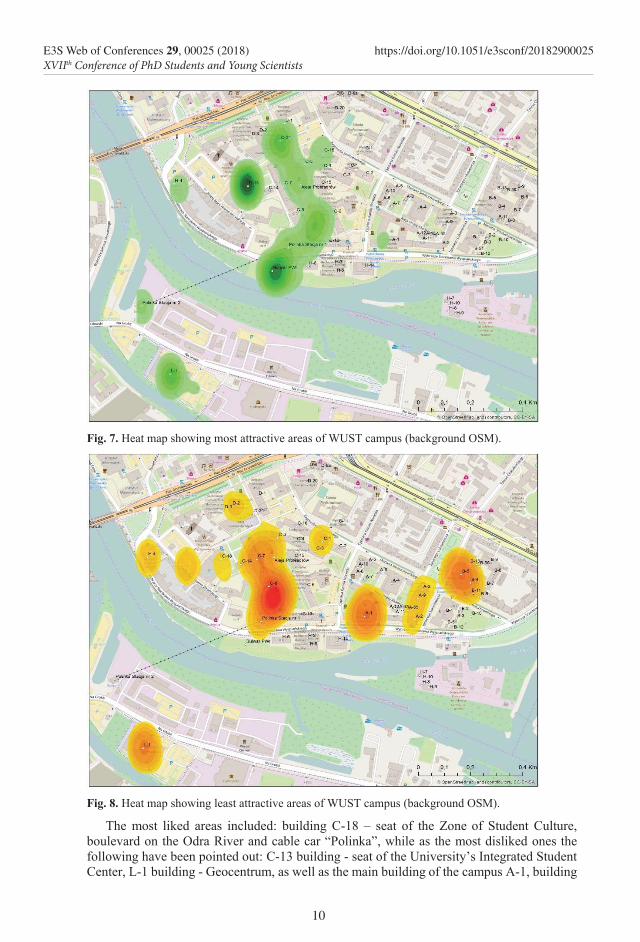
Fig. 7. Heat map showing most attractive areas of WUST campus (background OSM).
Fig. 8. Heat map showing least attractive areas of WUST campus (background OSM).
The most liked areas included: building C-18 – seat of the Zone of Student Culture, boulevard on the Odra River and cable car “Polinka”, while as the most disliked ones the following have been pointed out: C-13 building - seat of the University’s Integrated Student Center, L-1 building - Geocentrum, as well as the main building of the campus A-1, building
10
E3S Web of Conferences 29, 00025 (2018) https://doi.org/10.1051/e3sconf/20182900025XVIIth Conference of PhD Students and Young Scientists
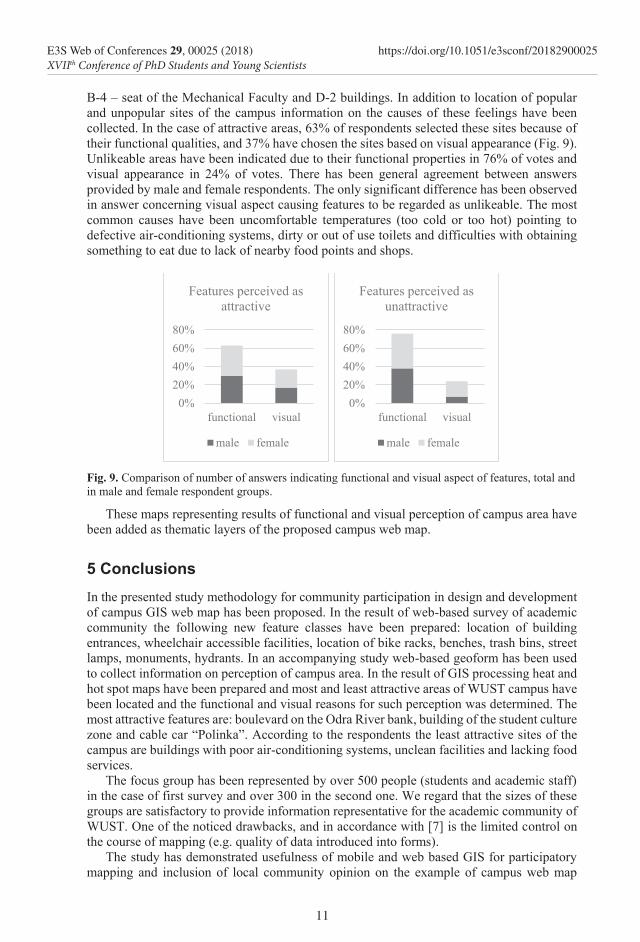
Fig. 7. Heat map showing most attractive areas of WUST campus (background OSM).
Fig. 8. Heat map showing least attractive areas of WUST campus (background OSM).
The most liked areas included: building C-18 – seat of the Zone of Student Culture, boulevard on the Odra River and cable car “Polinka”, while as the most disliked ones the following have been pointed out: C-13 building - seat of the University’s Integrated Student Center, L-1 building - Geocentrum, as well as the main building of the campus A-1, building
B-4 – seat of the Mechanical Faculty and D-2 buildings. In addition to location of popular and unpopular sites of the campus information on the causes of these feelings have been collected. In the case of attractive areas, 63% of respondents selected these sites because of their functional qualities, and 37% have chosen the sites based on visual appearance (Fig. 9). Unlikeable areas have been indicated due to their functional properties in 76% of votes and visual appearance in 24% of votes. There has been general agreement between answers provided by male and female respondents. The only significant difference has been observed in answer concerning visual aspect causing features to be regarded as unlikeable. The most common causes have been uncomfortable temperatures (too cold or too hot) pointing to defective air-conditioning systems, dirty or out of use toilets and difficulties with obtaining something to eat due to lack of nearby food points and shops.
Fig. 9. Comparison of number of answers indicating functional and visual aspect of features, total and in male and female respondent groups.
These maps representing results of functional and visual perception of campus area have been added as thematic layers of the proposed campus web map.
5 Conclusions In the presented study methodology for community participation in design and development of campus GIS web map has been proposed. In the result of web-based survey of academic community the following new feature classes have been prepared: location of building entrances, wheelchair accessible facilities, location of bike racks, benches, trash bins, street lamps, monuments, hydrants. In an accompanying study web-based geoform has been used to collect information on perception of campus area. In the result of GIS processing heat and hot spot maps have been prepared and most and least attractive areas of WUST campus have been located and the functional and visual reasons for such perception was determined. The most attractive features are: boulevard on the Odra River bank, building of the student culture zone and cable car “Polinka”. According to the respondents the least attractive sites of the campus are buildings with poor air-conditioning systems, unclean facilities and lacking food services.
The focus group has been represented by over 500 people (students and academic staff) in the case of first survey and over 300 in the second one. We regard that the sizes of these groups are satisfactory to provide information representative for the academic community of WUST. One of the noticed drawbacks, and in accordance with [7] is the limited control on the course of mapping (e.g. quality of data introduced into forms).
The study has demonstrated usefulness of mobile and web based GIS for participatory mapping and inclusion of local community opinion on the example of campus web map
0%20%40%60%80%
functional visual
Features perceived as attractive
male female
0%20%40%60%80%
functional visual
Features perceived as unattractive
male female
11
E3S Web of Conferences 29, 00025 (2018) https://doi.org/10.1051/e3sconf/20182900025XVIIth Conference of PhD Students and Young Scientists
project and assessment of campus area quality and atmosphere. The proposed methodology and tools will be used in further studies concerning assessment of condition of WUST facilities.
This work was financed by the Grant no. 0401/0128/17.
References 1. R. Sieber, Annals of the Association of American Geographers, 96(3), 491–507 (2006) 2. S. Carver, Int. J. Geogr. Inf. Sci., 5(3), 321-339 (1991) 3. J. Abbot, R. Chambers, Ch. Dunn, T. Harris, E. de Merode, G. Porter, J. Townsend, D.
Weiner, IIED, Sustainable Agriculture & Rural Livelihoods, 33, 27-34 (1998) 4. J. Forrester, S. Cinderby, A Guide to using Community Mapping and Participatory GIS,
Retrieved May 16, 2017 5. M. Schlossberg, E. Shuford, URISA Journal 16 (2), 15-16 (2005) 6. I. Wolf, T. Wohlfart, G. Brown, A.B. Lasa, Tourism Management 51, 112-130 (2015) 7. G. Brown, D. Weber, K. Bie, Applied Geography 53, 77-89 (2014) 8. G. Brown, D. Weber, K. Bie, Land Use Policy 43, 228-238 (2015) 9. M. Goodchild, Geojournal, 69, 211-221, (2007) 10. M. Haklay, Knowledge: Volunteered Geographic Information (VGI) in Theory and
Practice, Springer, 105-122 (2013) 11. L. Palen, R. Soden, T.J. Anderson, M. Barrenechea, M. Proceedings of the 33rd annual
ACM conference on human factors in computing systems, 4113-4122 (2015) 12. L. Palen, R. Soden, In COOP 2014-Proceedings of the 11th International Conference on
the Design of Cooperative Systems, 311-326 (2014) 13. P. Fu, J. Sun, Web GIS: Principles and Applications (2010) 14. A.J. Flanagin, M.J. Metzger, GeoJournal, 72 (3-4), 137-148 (2008) 15. A. May, Ch. Parker, N. Taylor, T. Ross, Transportation Research Part C: Emerging
Technologies, 49, 103-113 (2014) 16. Z. Peng, Environment and Planning B: Planning and Design, 28, 889-905 (2001) 17. http://linkage.iop.krakow.pl/en, Retrieved May 18, 2017 18. http://pwr.edu.pl/en/university/about-us/general-information, Retrieved May 18, 2017 19. http://pwr.edu.pl/en/university/campus-map, Retrieved May 18, 2017 20. http://pwr.edu.pl, Retrieved May 17, 2017 21. J. Spych, Project of web map of the Wroclaw University of Science and Technology
campus, Bachelor Thesis (2015) 22. K. Stec, Update of the project of web map of the Wroclaw University of Science and
Technology campus, Bachelor Thesis (2016) 23. P. Zagrodnik, Development of interactive map of the Wroclaw University of Science
and Technology campus, Bachelor Thesis (2017) 24. J. Blachowski, A. Nowacka, Mining Science 133, 37-47 (2011) 25. http://doc.arcgis.com/en/collector/, Retrieved May 15, 2017 26. J. Blachowski, Arcana GIS, March (2017) 27. ArcGIS 10.4 Desktop Help, ESRI (2016)
12
E3S Web of Conferences 29, 00025 (2018) https://doi.org/10.1051/e3sconf/20182900025XVIIth Conference of PhD Students and Young Scientists