Embed Size (px)
Citation preview
Copyright 2014 Market Data Retrieval
Parthenon Perspectives
Trends in K-12 Education
September 30, 2014
Copyright 2014 Market Data Retrieval
Agenda
What Informs Our Perspective?
Parthenon Perspectives on U.S. K-12 Market Trends
Copyright 2014 Market Data Retrieval
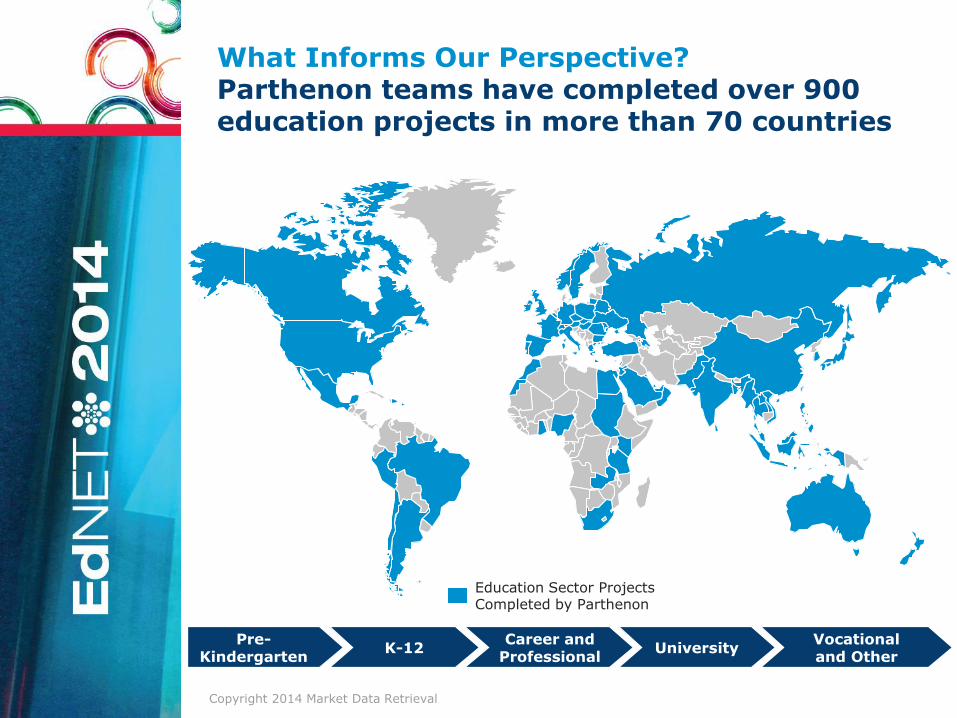
What Informs Our Perspective? Parthenon teams have completed over 900 education projects in more than 70 countries
Pre-Kindergarten
K-12 University Vocational and Other
Career and Professional
Education Sector Projects Completed by Parthenon
Copyright 2014 Market Data Retrieval
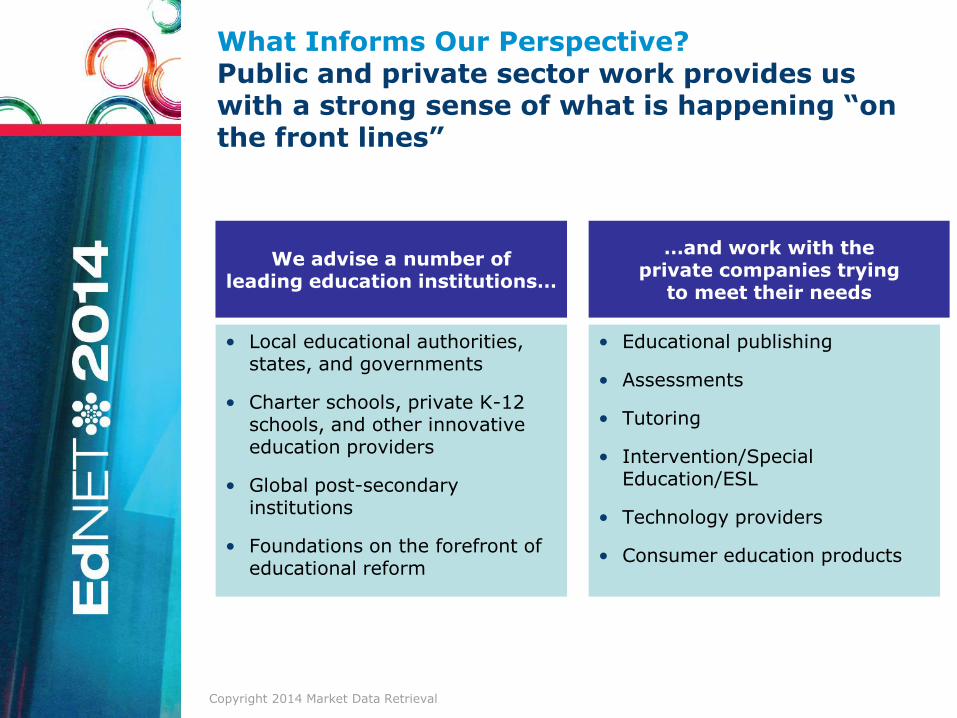
• Educational publishing
• Assessments
• Tutoring
• Intervention/Special Education/ESL
• Technology providers
• Consumer education products
• Local educational authorities, states, and governments
• Charter schools, private K-12 schools, and other innovative education providers
• Global post-secondary institutions
• Foundations on the forefront of educational reform
What Informs Our Perspective? Public and private sector work provides us with a strong sense of what is happening “on the front lines”
We advise a number of leading education institutions…
…and work with the private companies trying
to meet their needs
Copyright 2014 Market Data Retrieval
Agenda
What Informs our Perspective?
Parthenon Perspectives on U.S. K-12 Market Trends
Copyright 2014 Market Data Retrieval
A Macro View A lot is happening in the K-12 landscape
• A recovering economy…
• Rising acceptance of digital products and services…
• Wide ranging impacts as the Common Core is implemented…
• Evolving points of view on long-term policy issues:
– Managing Human Capital
– Role of “Choice” in districts
– Definitions of accountability
Provide some perspective on “what is happening” and how these trends will shape district leader
and consumer needs and the conversations you are likely to have with them
Copyright 2014 Market Data Retrieval
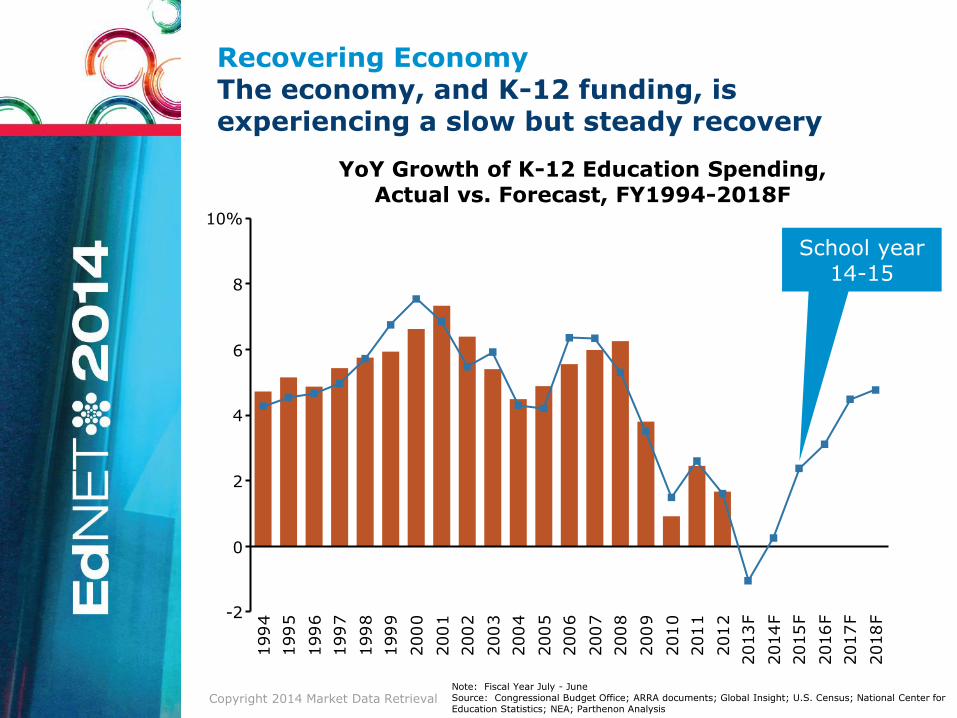
Recovering Economy The economy, and K-12 funding, is experiencing a slow but steady recovery
-2
0
2
4
6
8
10%
1994
1995
1996
1997
1998
1999
2000
2001
2002
2003
2004
2005
2006
2007
2008
2009
2010
2011
2012
2013F
2014F
2015F
2016F
2017F
2018F
Note: Fiscal Year July - June Source: Congressional Budget Office; ARRA documents; Global Insight; U.S. Census; National Center for Education Statistics; NEA; Parthenon Analysis
YoY Growth of K-12 Education Spending, Actual vs. Forecast, FY1994-2018F
School year 14-15
Copyright 2014 Market Data Retrieval
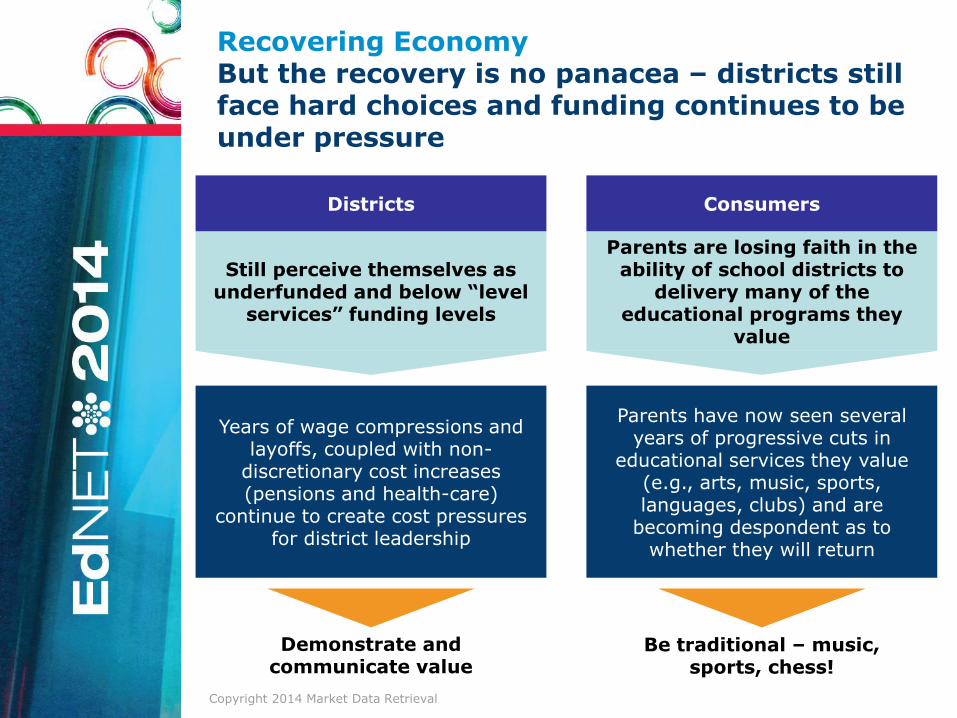
Recovering Economy But the recovery is no panacea – districts still face hard choices and funding continues to be under pressure
Still perceive themselves as underfunded and below “level
services” funding levels
Parents are losing faith in the ability of school districts to
delivery many of the educational programs they
value
Districts Consumers
Years of wage compressions and layoffs, coupled with non-
discretionary cost increases (pensions and health-care)
continue to create cost pressures for district leadership
Parents have now seen several years of progressive cuts in
educational services they value (e.g., arts, music, sports, languages, clubs) and are
becoming despondent as to whether they will return
Demonstrate and communicate value
Be traditional – music, sports, chess!
Copyright 2014 Market Data Retrieval
0
20
40
60
80
100%
Childcare
Childcare
$16B
Instructional
Materials
Non-DigitalSupplemental
Basal
Intervention
Other DigitalSupplemental
Online Courses
$8B
Form
ative
Sum
mative
$2B
General
Technology
IT Services
Software
Telecom
General Support
Hardware
$9B
SIS
LM
SS
tudent
Support
Serv
ices
Outs
ourc
ed
SES/
Tuto
ring
In-H
ouse
VirtualSchools
EMO
$4B
Prof.
Development
Outs
ourc
ed
-N
on-P
rofit
Outs
ourc
ed
-In
div
iduals
Outsourced- For-Profit
$4B
Consumer
Private Tutoring
Software/Apps
Courseware
$10B
Testing &
Assessments Stu
dent
&LM
S
$1B$1B
Outsourced
SchoolMgmt
Total = $54B
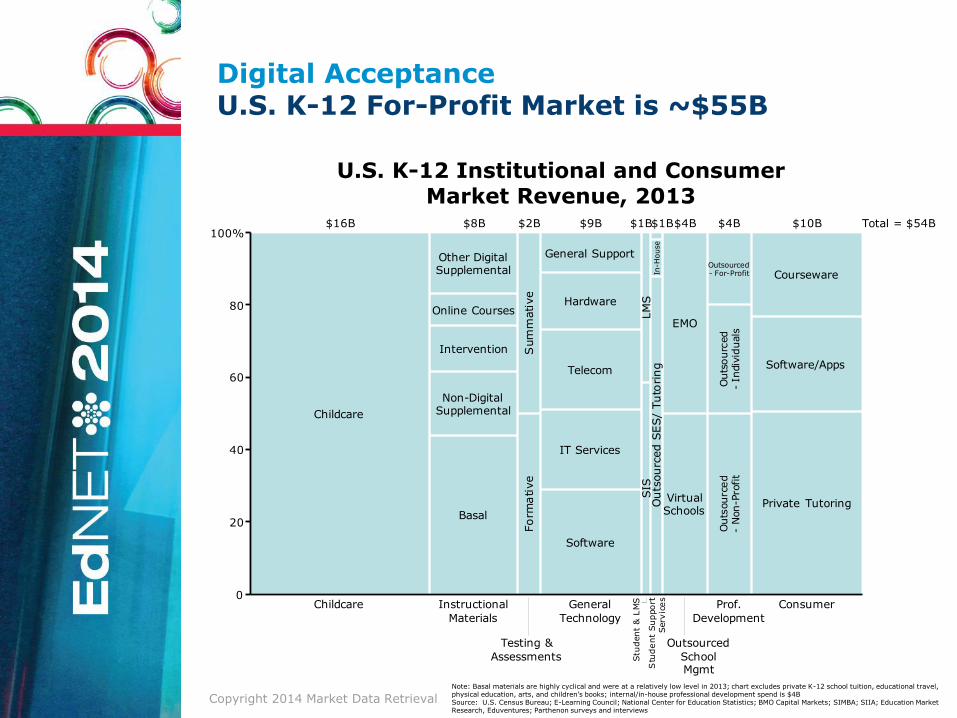
Digital Acceptance U.S. K-12 For-Profit Market is ~$55B
U.S. K-12 Institutional and Consumer Market Revenue, 2013
Note: Basal materials are highly cyclical and were at a relatively low level in 2013; chart excludes private K-12 school tuition, educational travel, physical education, arts, and children’s books; internal/in-house professional development spend is $4B Source: U.S. Census Bureau; E-Learning Council; National Center for Education Statistics; BMO Capital Markets; SIMBA; SIIA; Education Market Research, Eduventures; Parthenon surveys and interviews
Copyright 2014 Market Data Retrieval
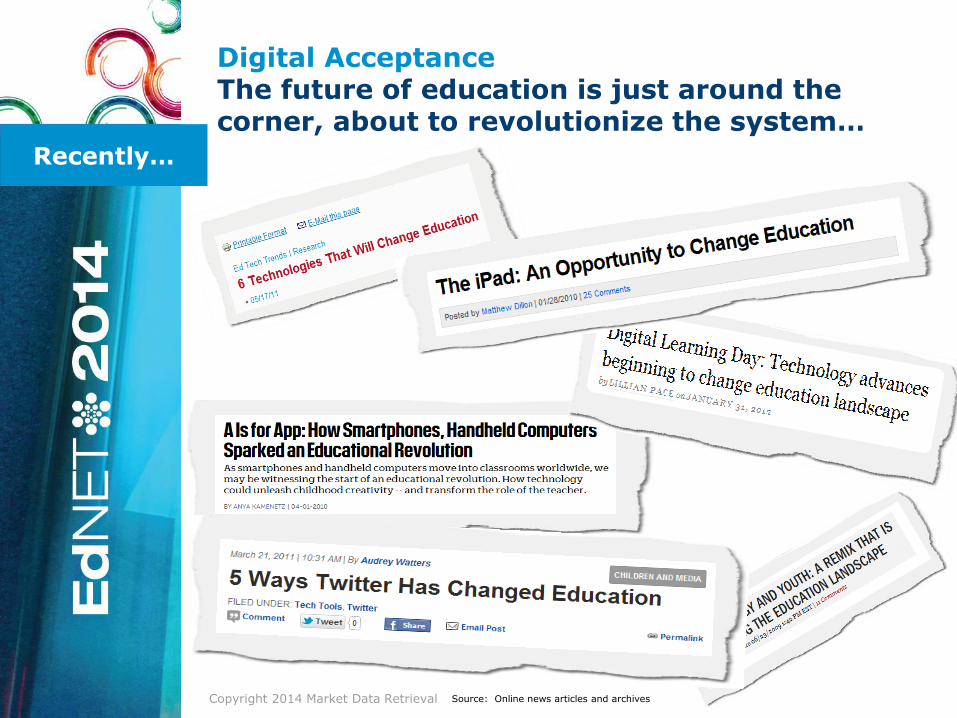
Digital Acceptance The future of education is just around the corner, about to revolutionize the system…
Source: Online news articles and archives
Recently…
Copyright 2014 Market Data Retrieval
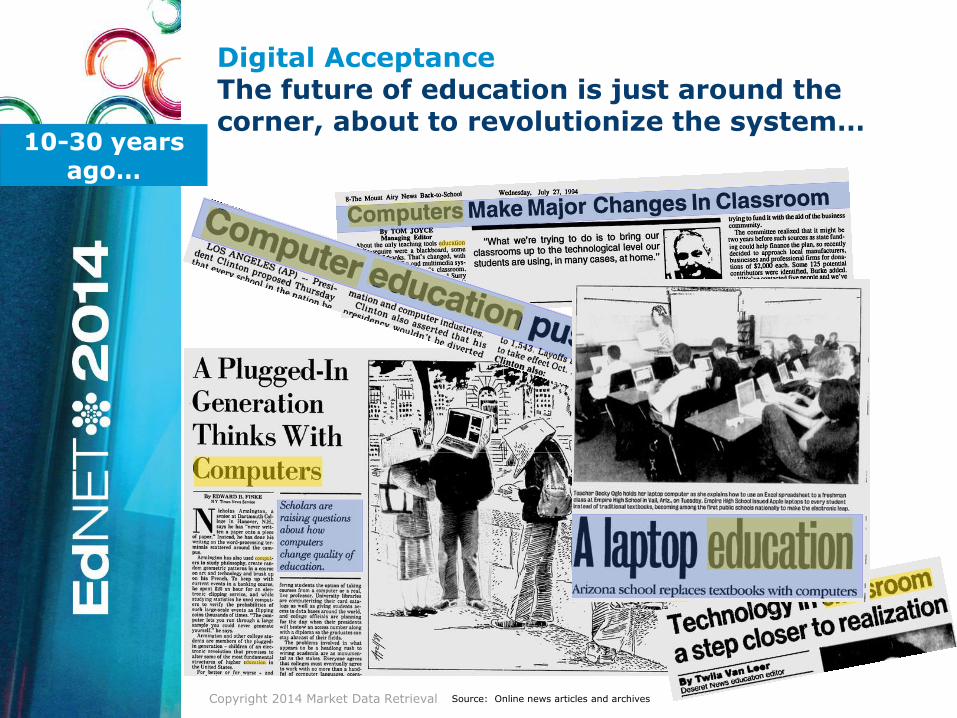
Digital Acceptance The future of education is just around the corner, about to revolutionize the system…
10-30 years ago…
Source: Online news articles and archives
Copyright 2014 Market Data Retrieval
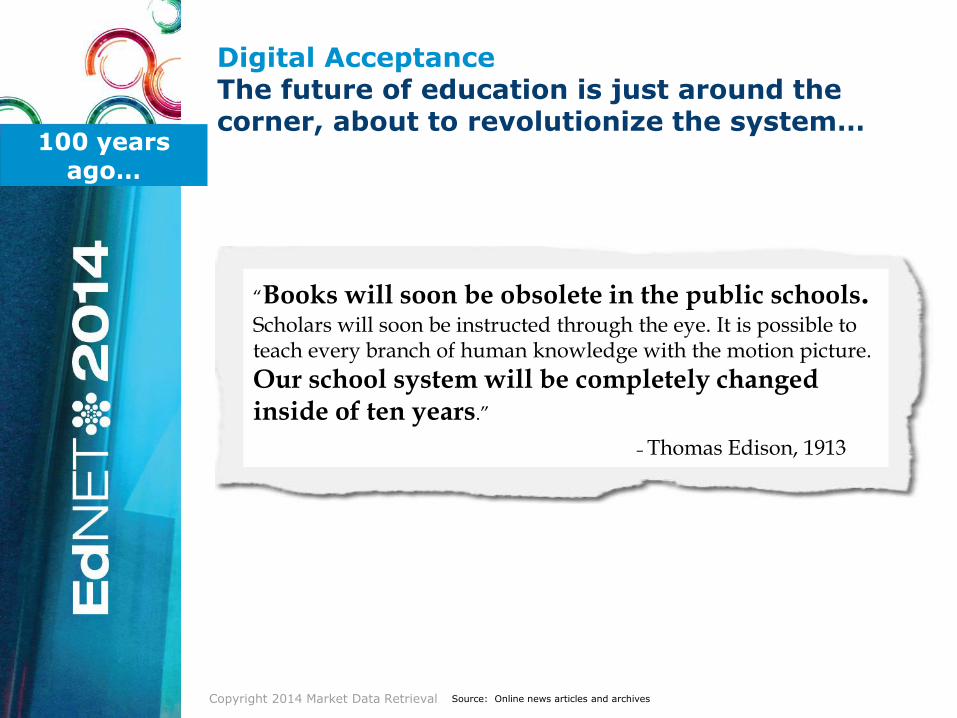
Digital Acceptance The future of education is just around the corner, about to revolutionize the system…
“Books will soon be obsolete in the public schools. Scholars will soon be instructed through the eye. It is possible to teach every branch of human knowledge with the motion picture.
Our school system will be completely changed inside of ten years.”
– Thomas Edison, 1913
100 years ago…
Source: Online news articles and archives
Copyright 2014 Market Data Retrieval
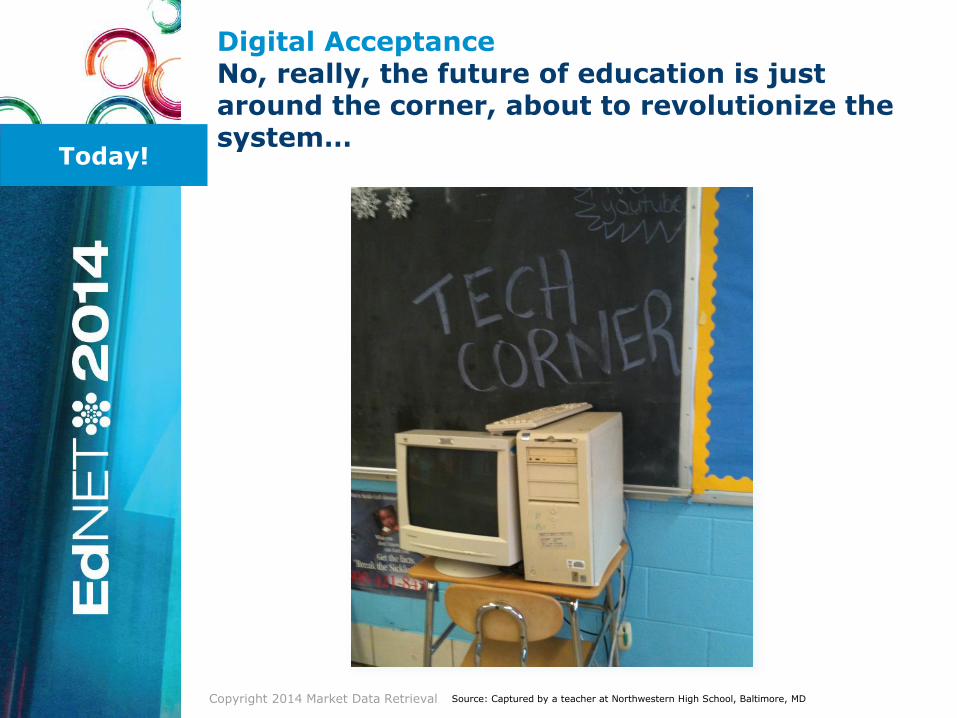
Digital Acceptance No, really, the future of education is just around the corner, about to revolutionize the system…
Today!
Source: Captured by a teacher at Northwestern High School, Baltimore, MD
Copyright 2014 Market Data Retrieval
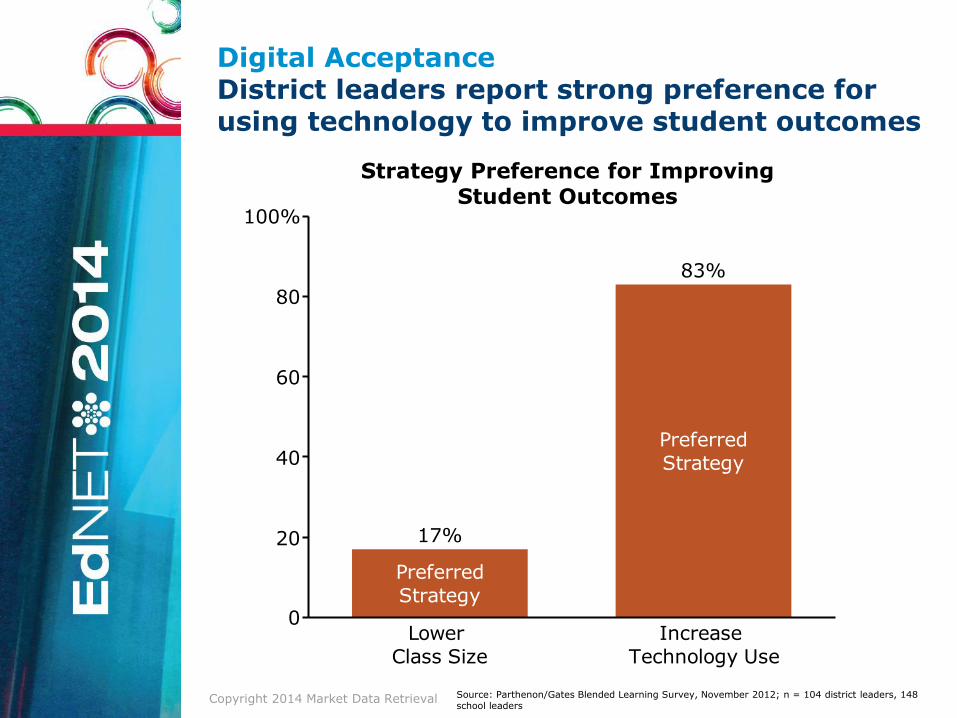
Digital Acceptance District leaders report strong preference for using technology to improve student outcomes
Source: Parthenon/Gates Blended Learning Survey, November 2012; n = 104 district leaders, 148 school leaders
0
20
40
60
80
100%
LowerClass Size
PreferredStrategy
17%
IncreaseTechnology Use
PreferredStrategy
83%
Strategy Preference for Improving Student Outcomes
Copyright 2014 Market Data Retrieval
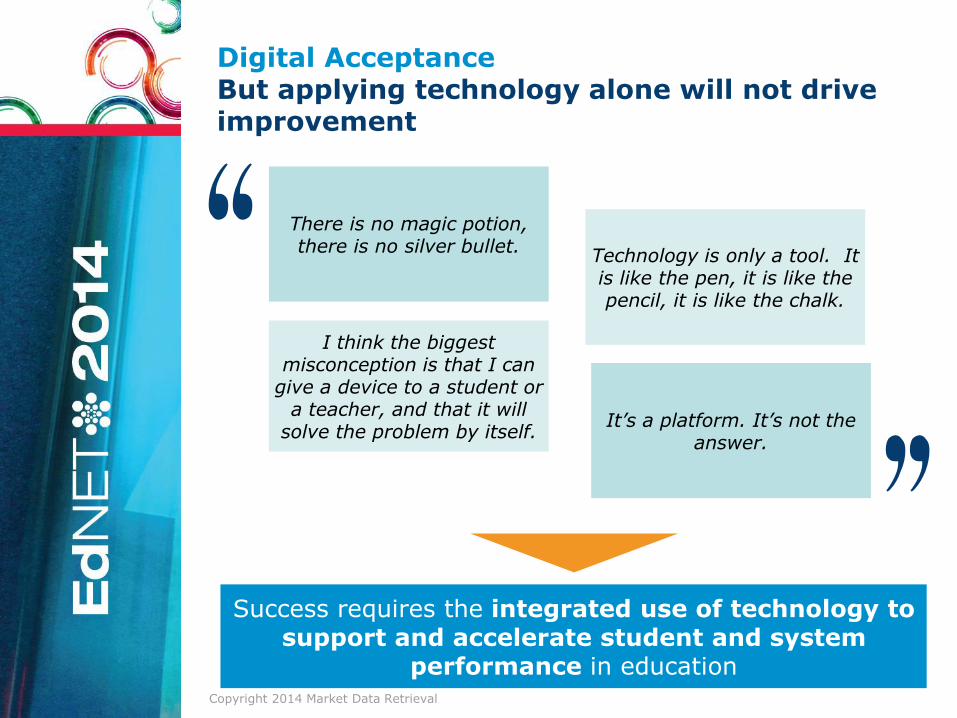
It’s a platform. It’s not the answer.
Digital Acceptance But applying technology alone will not drive improvement
Success requires the integrated use of technology to support and accelerate student and system
performance in education
Technology is only a tool. It is like the pen, it is like the pencil, it is like the chalk.
There is no magic potion, there is no silver bullet.
I think the biggest misconception is that I can
give a device to a student or a teacher, and that it will
solve the problem by itself.
Copyright 2014 Market Data Retrieval
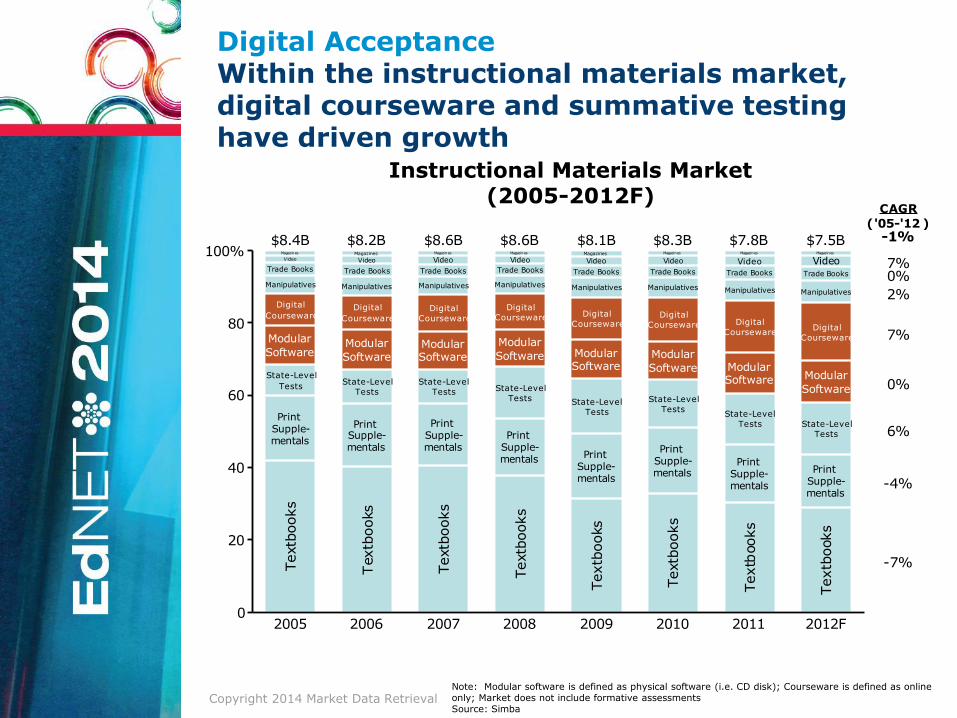
Digital Acceptance Within the instructional materials market, digital courseware and summative testing have driven growth
0
20
40
60
80
100%
2005
State-Level
Tests
Modular
Software
Textb
ooks
PrintSupple-mentals
Digital
Courseware
Video
Magazines
Manipulatives
Trade Books
$8.4B
2006
State-Level
Tests
Modular
SoftwareTextb
ooks
PrintSupple-mentals
Digital
Courseware
VideoMagazines
Manipulatives
Trade Books
$8.2B
2007
State-Level
Tests
ModularSoftware
Textb
ooks
PrintSupple-mentals
Digital
Courseware
VideoMagazines
Manipulatives
Trade Books
$8.6B
2008
State-Level
Tests
Modular
Software
Textb
ooks
PrintSupple-mentals
Digital
Courseware
VideoMagazines
Manipulatives
Trade Books
$8.6B
2009
State-Level
Tests
ModularSoftware
Textb
ooks
PrintSupple-mentals
Digital
Courseware
VideoMagazines
Manipulatives
Trade Books
$8.1B
2010
State-Level
Tests
Modular
Software
Textb
ooks
PrintSupple-mentals
Digital
Courseware
Video
Magazines
Manipulatives
Trade Books
$8.3B
2011
State-Level
Tests
ModularSoftware
Textb
ooks
PrintSupple-mentals
Digital
Courseware
Video
Magazines
Manipulatives
Trade Books
$7.8B
2012F
State-Level
Tests
Modular
Software
Textb
ooks
PrintSupple-mentals
Digital
Courseware
VideoMagazines
Manipulatives
Trade Books
$7.5B
-7%
-4%
6%
0%
7%
2%
0%7%
('05-'12 )-1%
CAGR
Instructional Materials Market (2005-2012F)
Note: Modular software is defined as physical software (i.e. CD disk); Courseware is defined as online only; Market does not include formative assessments Source: Simba
Copyright 2014 Market Data Retrieval
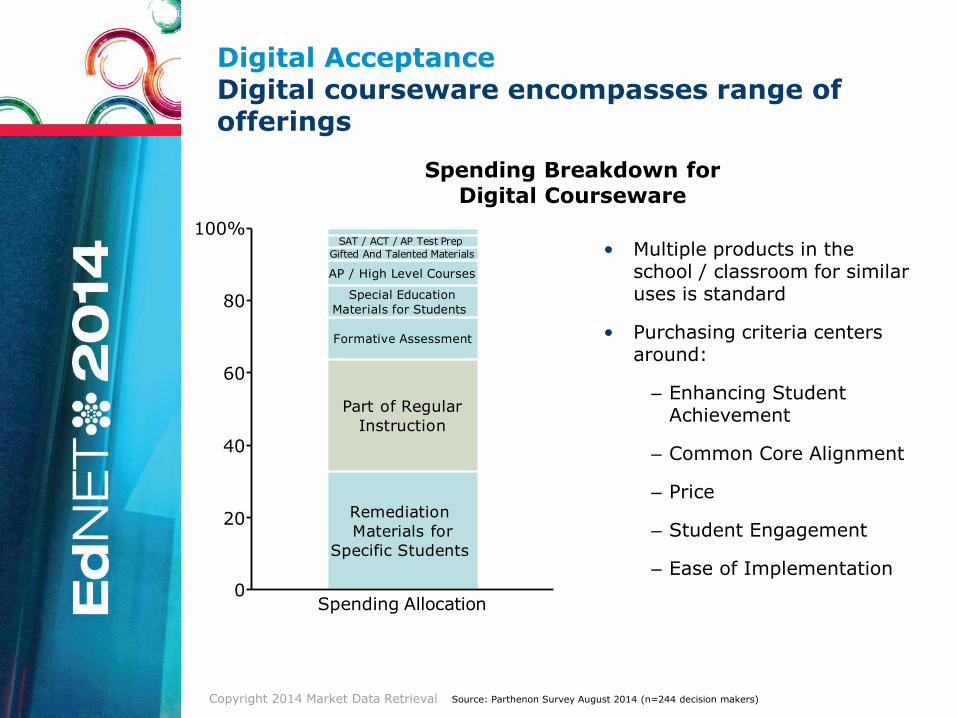
Digital Acceptance Digital courseware encompasses range of offerings
0
20
40
60
80
100%
Spending Allocation
SAT / ACT / AP Test Prep
Gifted And Talented Materials
AP / High Level Courses
Special Education
Materials for Students
Formative Assessment
Part of Regular
Instruction
Remediation
Materials for
Specific Students
• Multiple products in the school / classroom for similar uses is standard
• Purchasing criteria centers around:
‒ Enhancing Student Achievement
‒ Common Core Alignment
‒ Price
‒ Student Engagement
‒ Ease of Implementation
Spending Breakdown for Digital Courseware
Source: Parthenon Survey August 2014 (n=244 decision makers)
Copyright 2014 Market Data Retrieval
-50
0
50
100%
Significantly
Decrease
SlightlyDecrease
Slightly Increase
Significantly
Increase
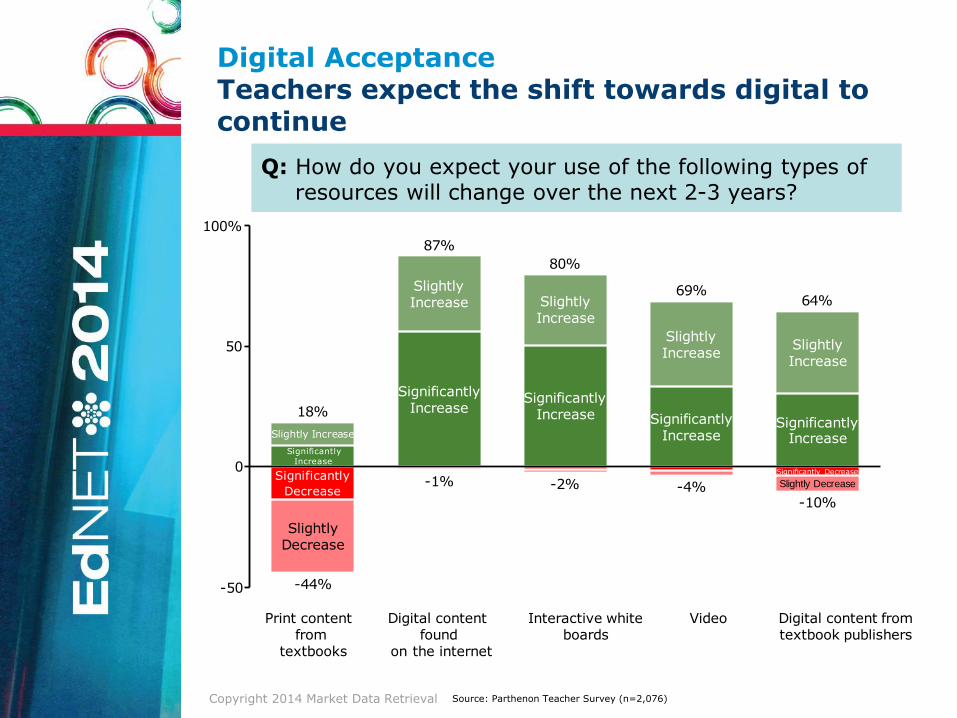
18%
-44%
SlightlyIncrease
SignificantlyIncrease
87%
-1%
SlightlyIncrease
SignificantlyIncrease
80%
-2%
SlightlyIncrease
SignificantlyIncrease
69%
-4%
Significantly Decrease
Slightly Decrease
SlightlyIncrease
SignificantlyIncrease
64%
-10%
Print contentfrom
textbooks
Digital contentfound
on the internet
Interactive whiteboards
Video Digital content fromtextbook publishers
Digital Acceptance Teachers expect the shift towards digital to continue
Q: How do you expect your use of the following types of resources will change over the next 2-3 years?
Source: Parthenon Teacher Survey (n=2,076)
Copyright 2014 Market Data Retrieval
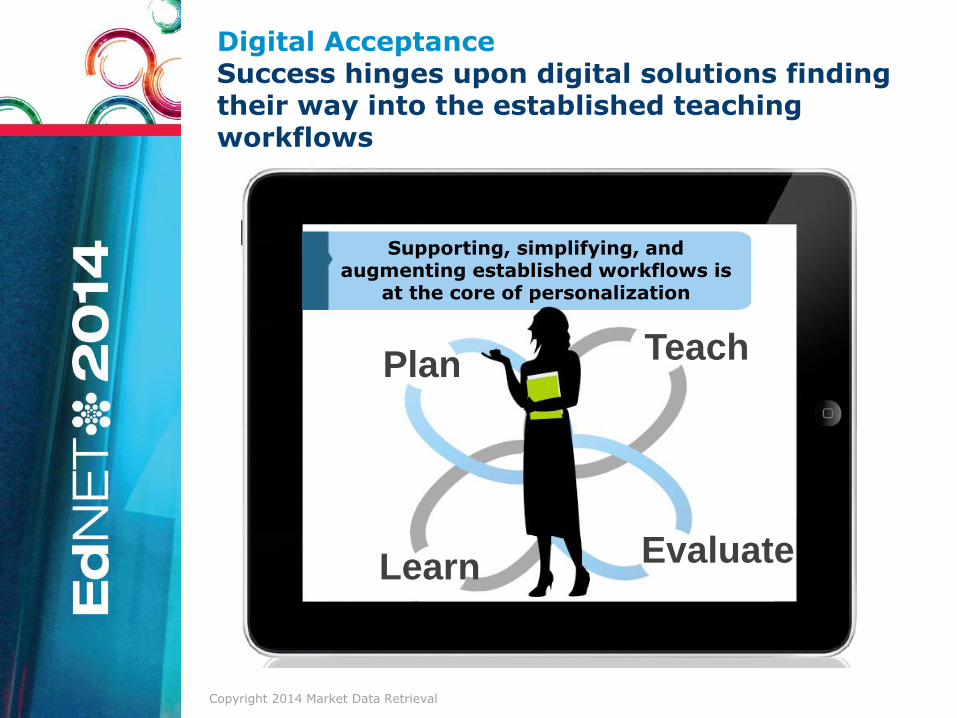
How do these digital
products integrate into the workflow?
Plan
Teach
Learn
Evaluate
Supporting, simplifying, and augmenting established workflows is
at the core of personalization
Digital Acceptance Success hinges upon digital solutions finding their way into the established teaching workflows
Copyright 2014 Market Data Retrieval
0
20
40
60
80
100%
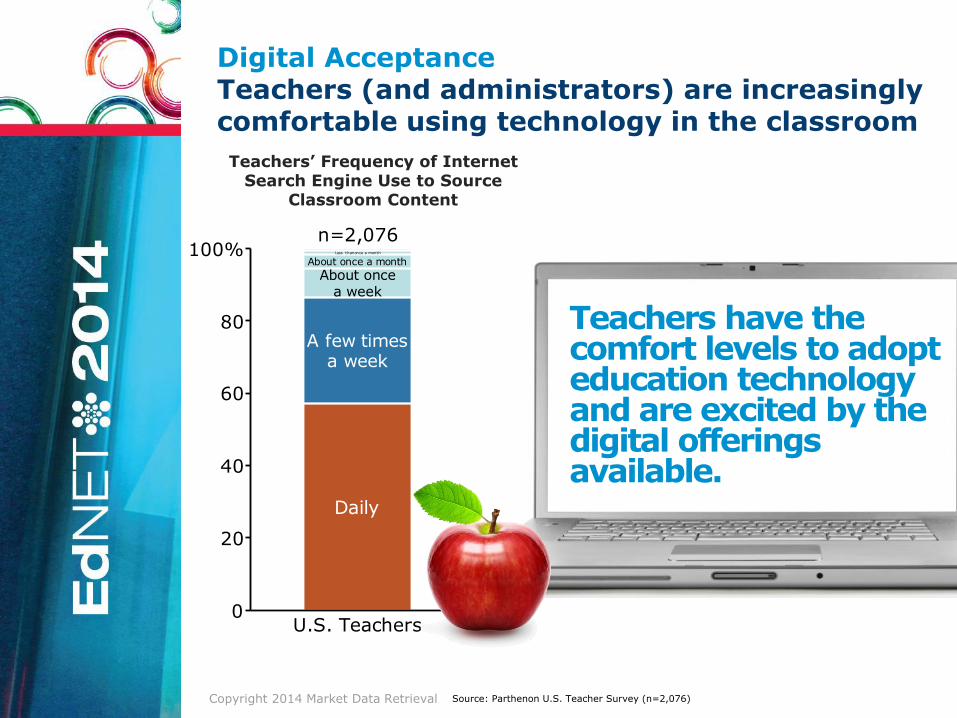
U.S. Teachers
About oncea week
A few timesa week
Daily
Less thanonce a month
About once a month
n=2,076
Teachers have the comfort levels to adopt education technology and are excited by the digital offerings available.
Teachers’ Frequency of Internet Search Engine Use to Source
Classroom Content
Digital Acceptance Teachers (and administrators) are increasingly comfortable using technology in the classroom
Source: Parthenon U.S. Teacher Survey (n=2,076)
Copyright 2014 Market Data Retrieval
Where are the pain points?
Digital Acceptance Surprise, digital adoption is not always smooth and painless!
Copyright 2014 Market Data Retrieval
0
20
40
60
80
100%
Digital Products thatHelp Students Learn Standards
Products with 10 orless mentions(454 products)
Products with 11-30
mentions
(85 products)
Products with 31-50mentions (19 products)
Products with 51-100
mentions
(19 products)
Products with >100
mentions
(12 products)
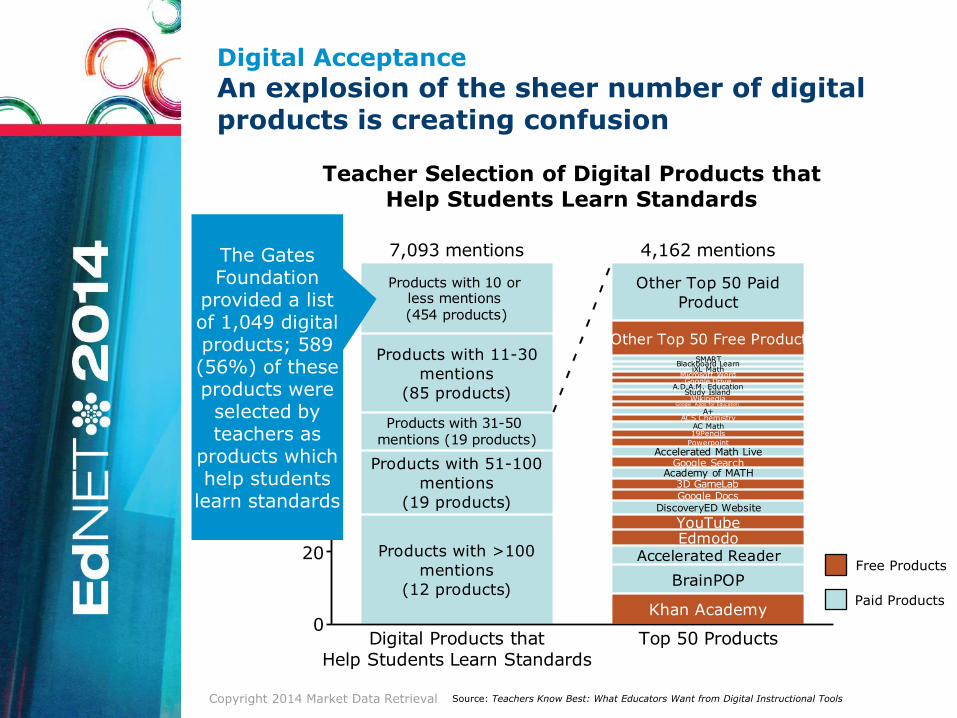
7,093 mentions
Top 50 Products
Other Top 50 Paid
Product
Other Top 50 Free ProductSMART
Blackboard LearniXL Math
Microsoft WordGoogle Drive
A.D.A.M. EducationStudy Island
WikipediaGoogle Apps for Education
A+ACS Chemistry
AC Math19Pencils
Powerpoint
Accelerated Math LiveGoogle Search
Academy of MATH3D GameLabGoogle Docs
DiscoveryED Website
YouTubeEdmodo
Accelerated Reader
BrainPOP
Khan Academy
4,162 mentions
Digital Acceptance
An explosion of the sheer number of digital products is creating confusion
Teacher Selection of Digital Products that Help Students Learn Standards
The Gates Foundation
provided a list of 1,049 digital products; 589 (56%) of these products were
selected by teachers as
products which help students
learn standards
Free Products
Paid Products
Source: Teachers Know Best: What Educators Want from Digital Instructional Tools
Copyright 2014 Market Data Retrieval
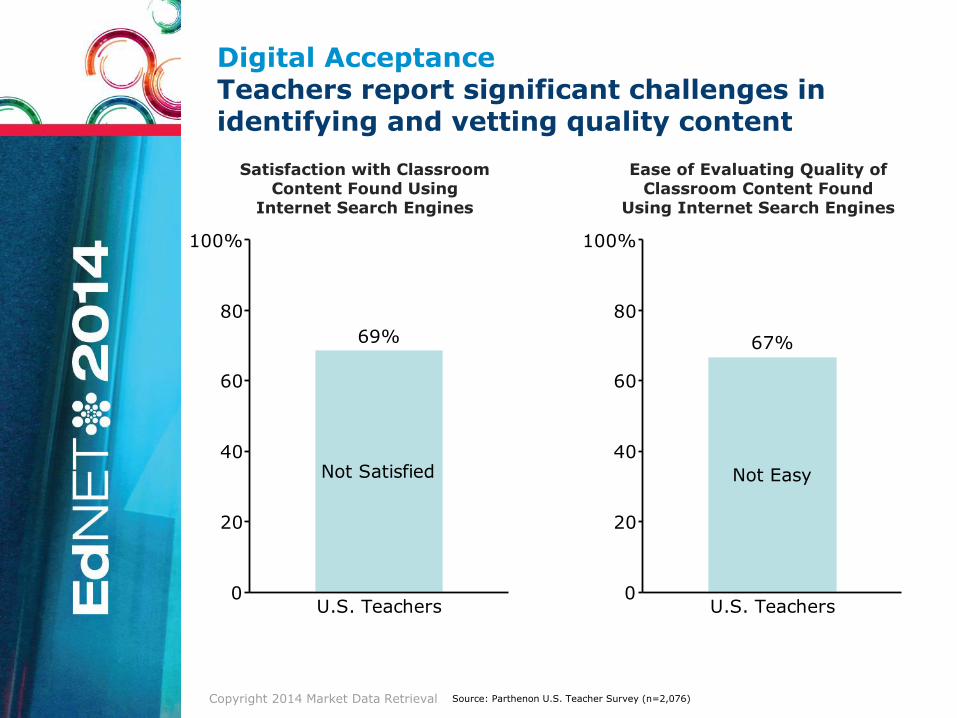
Digital Acceptance Teachers report significant challenges in identifying and vetting quality content
0
20
40
60
80
100%
U.S. Teachers
Not Satisfied
69%
Satisfaction with Classroom Content Found Using
Internet Search Engines
Ease of Evaluating Quality of Classroom Content Found
Using Internet Search Engines
0
20
40
60
80
100%
U.S. Teachers
Not Easy
67%
Source: Parthenon U.S. Teacher Survey (n=2,076)
Copyright 2014 Market Data Retrieval
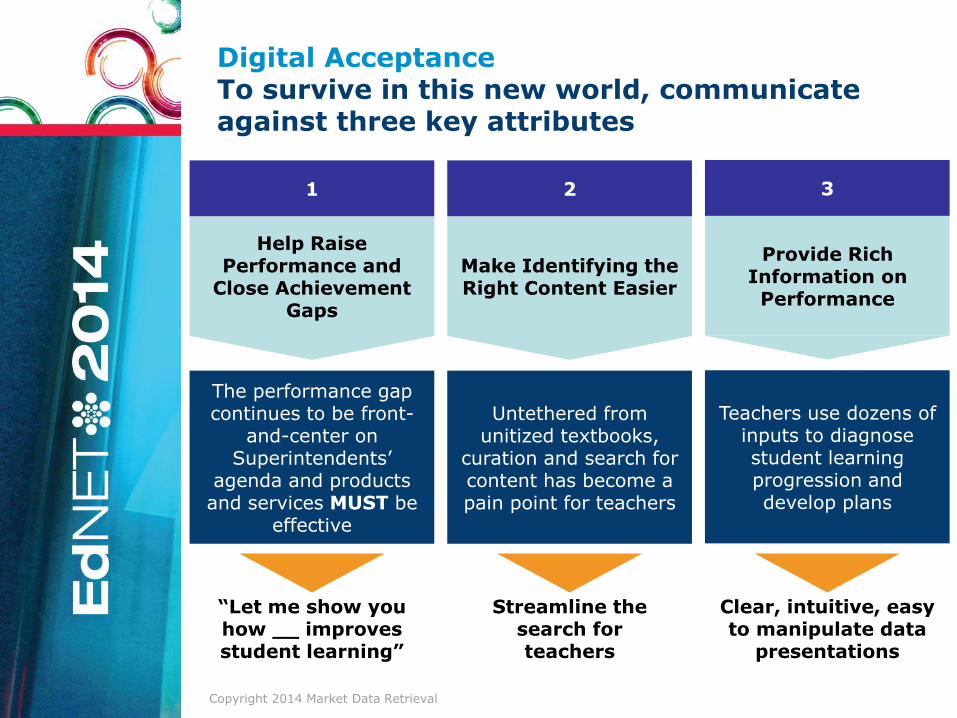
Digital Acceptance To survive in this new world, communicate against three key attributes
Help Raise Performance and
Close Achievement Gaps
1
The performance gap continues to be front-
and-center on Superintendents’
agenda and products and services MUST be
effective
“Let me show you how __ improves student learning”
Make Identifying the Right Content Easier
2
Untethered from unitized textbooks,
curation and search for content has become a pain point for teachers
Streamline the search for teachers
Provide Rich Information on Performance
3
Teachers use dozens of inputs to diagnose student learning progression and develop plans
Clear, intuitive, easy to manipulate data
presentations
Copyright 2014 Market Data Retrieval
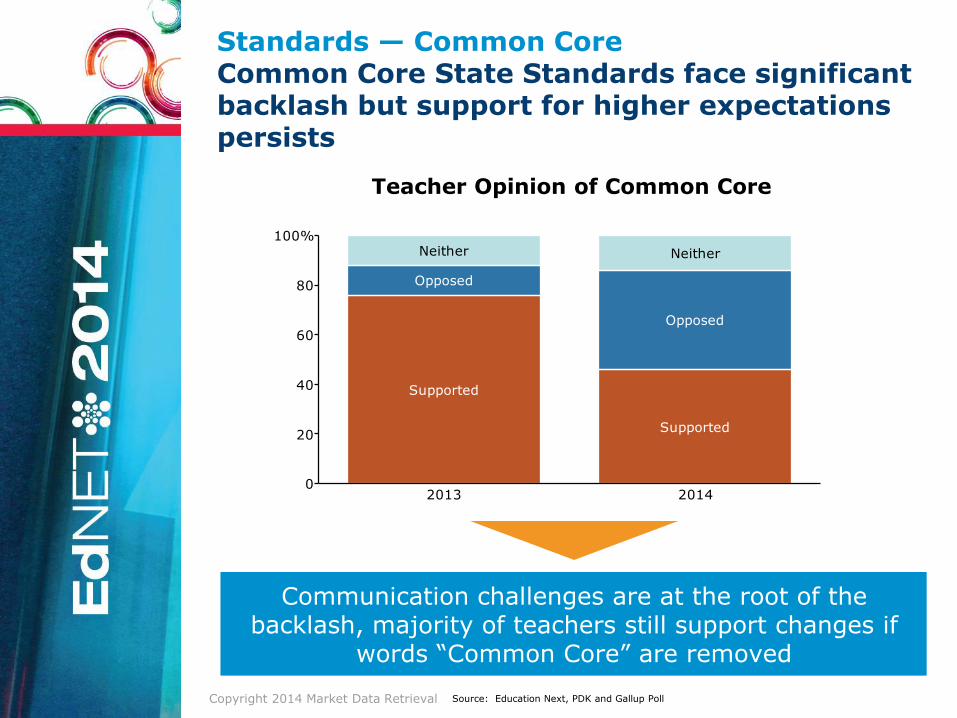
Standards — Common Core Common Core State Standards face significant backlash but support for higher expectations persists
Source: Education Next, PDK and Gallup Poll
Communication challenges are at the root of the backlash, majority of teachers still support changes if
words “Common Core” are removed
0
20
40
60
80
100%
2013
Neither
Opposed
Supported
2014
Neither
Opposed
Supported
Teacher Opinion of Common Core
Copyright 2014 Market Data Retrieval
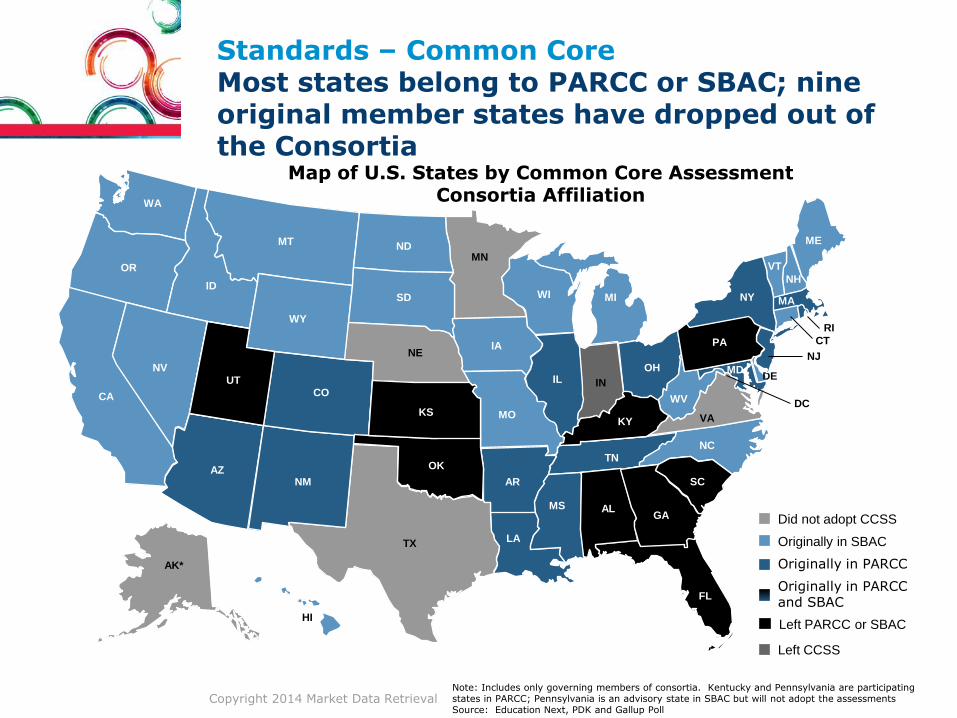
Standards – Common Core Most states belong to PARCC or SBAC; nine original member states have dropped out of the Consortia
Map of U.S. States by Common Core Assessment Consortia Affiliation
Review/Revision
Adopted
Never Adopted
Repealed
MA
FL
IA
AR
LA
MN
WI
MO
NH
VT
MI
PA
NY
ME
TN
KY
IN
OH
AL MS
IL
NC
SC
GA
WV
MD
VA
DE
CA
WA
OR
ID
NV
AZ
TX
UT
NM
CO
MT
WY
OK
KS
ND
SD
NE
AK*
HI
CT
RI
NJ
DC
Left PARCC or SBAC
Originally in SBAC
Originally in PARCC
Did not adopt CCSS
IN
Left CCSS
Originally in PARCC and SBAC
FL
PA
KY
AL GA
UT
OK
KS
SC
Note: Includes only governing members of consortia. Kentucky and Pennsylvania are participating states in PARCC; Pennsylvania is an advisory state in SBAC but will not adopt the assessments Source: Education Next, PDK and Gallup Poll
Copyright 2014 Market Data Retrieval
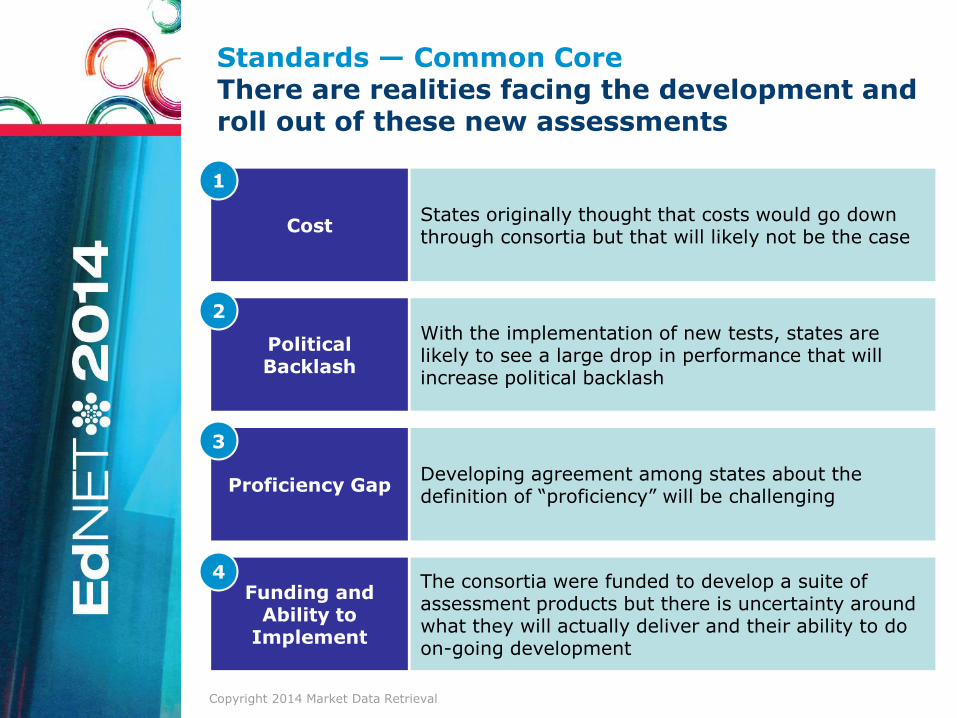
Standards — Common Core There are realities facing the development and roll out of these new assessments
With the implementation of new tests, states are likely to see a large drop in performance that will increase political backlash
Developing agreement among states about the definition of “proficiency” will be challenging
The consortia were funded to develop a suite of assessment products but there is uncertainty around what they will actually deliver and their ability to do on-going development
States originally thought that costs would go down through consortia but that will likely not be the case
Cost
1
Political Backlash
2
Proficiency Gap
3
Funding and Ability to
Implement
4
Copyright 2014 Market Data Retrieval
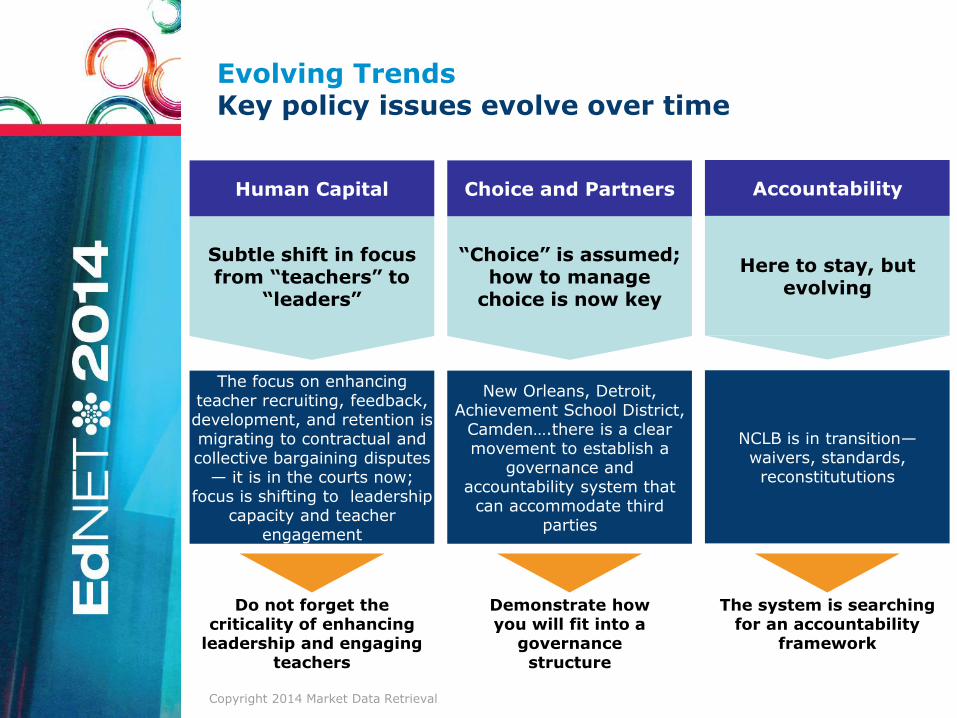
Evolving Trends Key policy issues evolve over time
Subtle shift in focus from “teachers” to
“leaders”
Human Capital
The focus on enhancing teacher recruiting, feedback, development, and retention is migrating to contractual and collective bargaining disputes
— it is in the courts now; focus is shifting to leadership
capacity and teacher engagement
Do not forget the criticality of enhancing
leadership and engaging teachers
“Choice” is assumed; how to manage
choice is now key
Choice and Partners
New Orleans, Detroit, Achievement School District,
Camden….there is a clear movement to establish a
governance and accountability system that
can accommodate third parties
Demonstrate how you will fit into a
governance structure
Here to stay, but evolving
Accountability
NCLB is in transition—waivers, standards, reconstitututions
The system is searching for an accountability
framework

Copyright 2014 Market Data Retrieval
About Parthenon
About Parthenon
Parthenon has served as an advisor to the education sector since our inception in 1991. Our Education Practice – the first of its
kind across management consulting firms – has an explicit mission and vision to be the leading strategy advisor to the global
education industry. To achieve this, we invest significantly in dedicated management and team resources to ensure that our
global expertise extends across public sector and non-profit education providers, foundations, for-profit companies and service
providers, and investors. Parthenon has deep experience and a track record of consistent success in working closely with
universities, colleges, states, districts, and leading educational reform and service organizations across the globe.
Learn more about us at www.parthenon.com.
Twitter | @Parthenon_Group
Facebook | www.facebook.com/ParthenonGroup
LinkedIn | www.linkedin.com/company/the-parthenon-group
Follow Us
for Regular
Updates
Robert Lytle
Partner, Co-Head of Education Practice
617.478.7096
Executive Assistant:
Deb Spitzley
617.478.6312
Twitter | @Robert_S_Lytle