Embed Size (px)
Citation preview

House K-12 Finance Work Group
Part IIIK-12 Finance Structure
Presenters:Calvin W. Brodie, Office of the Superintendent of Public InstructionJennifer Priddy, Office of the Superintendent of Public Instruction
Denise Graham, Office of Program Research

House K-12 Finance Work Group
Part III Contents
A. State FundingB. Federal FundingC. Local RevenuesD. Per Student FundingE. CompensationF. Appendix

April 13, 2004 OSPI 1
HouseK-12 Finance Work Group
Part III A: State Funds
Calvin W. BrodieDirector, School Apportionment and Finance Services
Office of the Superintendent of Public Instruction

April 13, 2004 OSPIPart III A
Page 2
HouseK-12 Finance Work Group
School district sources of revenue include state, federal and local funds.
State70%
Other5%
Local Taxes16%
Federal9%
100.0%$ 7,306.7 Total4.7%$ 346.0 Other9.5%$ 691.3 Federal
15.6%$ 1,139.2 Local Taxes70.2%$ 5,130.1 State
$ in Millions2002-03 School Year
District General Fund Revenues

April 13, 2004 OSPIPart III A
Page 3
HouseK-12 Finance Work Group
From a budgeting perspective, K-12 funding can be divided into two primary buckets: Basic Education and Non-basic Education.
Non-Basic Education
12.4%
Basic Education
87.6%
GF-S and SAF, 2003-05 biennium after the 04 supplemental budget.

April 13, 2004 OSPIPart III A
Page 4
HouseK-12 Finance Work Group
Almost 88 percent of state funding for K-12 goes to basic education programs.
Office of Program Research
General Apportionment $7,697 72.8%
Special Education 862 8.2%
Transportation 434 4.1%
Learning Assistance Program 127 1.2%
Transitional Bilingual Program 105 1.0%
Institutions 36 0.3%Subtotal: Basic Education $9,261 87.6%
Non-Basic Education Programs $1,313 12.4%Total - State Funds $10,575 100.0%
Basic Education Programs 2003-05 Funding Levels$s in Millions

April 13, 2004 OSPIPart III A
Page 5
HouseK-12 Finance Work Group
Enrollment
Formula Staff Units (Teachers, Administrators & Aides)
Salaries & Benefits
Nonemployee Related Costs (NERC)State General Apportionment Allocation
General Apportionment Basic Funding Concepts
April 13, 2004 OSPIPart III A
Page 6
HouseK-12 Finance Work Group
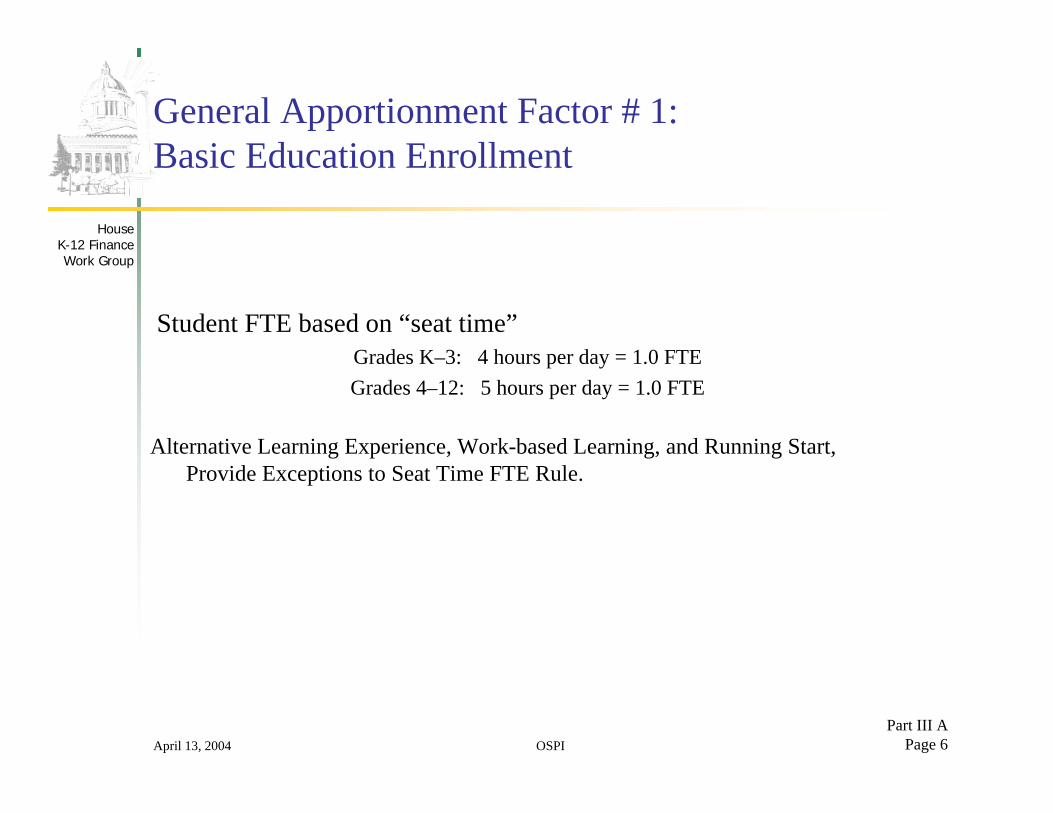
General Apportionment Factor # 1: Basic Education Enrollment
Student FTE based on “seat time”Grades K–3: 4 hours per day = 1.0 FTEGrades 4–12: 5 hours per day = 1.0 FTE
Alternative Learning Experience, Work-based Learning, and Running Start, Provide Exceptions to Seat Time FTE Rule.

April 13, 2004 OSPIPart III A
Page 7
HouseK-12 Finance Work Group
General Apportionment Factor # 2:Funded Staffing Ratios
1,000 FTE students generate:4.0 Certificated Administrative Staff (CAS)
e.g. Superintendents, Principals etc. 46.0 Certificated Instructional Staff (CIS)
e.g. Teachers, Program Supervisors16.7 Classified Staff - e.g. Business office, classroom aides.
Enhanced staffing (per 1,000 FTEs):K–3 = 49.0 – 53.2CIS (use it or lose it)4th grade = 46.0 – 53.2 CIS “ “

April 13, 2004 OSPIPart III A
Page 8
HouseK-12 Finance Work Group
In addition to the staffing ratios required by the Basic Ed Act, the budget provides funding for enhanced CIS staffing ratios in grades K-4.
*The enhanced staffing ratio known as Better Schools is not funded for the 2004-05 SY.
Grades K-3 Grade 4 Basic Ed Act 49.0 46.0Non-Basic Ed
Enhanced 4.2 7.2Better Schools* 0.8 0.8
Total 54.0 54.0
Grades K-3 Grade 4 Basic Ed Act 20.4 21.7
Basic and Non-Basic 18.8 18.8
2003-04 SY
Certificated Instructional Staff Per 1,000 Students
Staffing Ratios Expressed as the Number of Students for Each CIS
2003-04 SY
April 13, 2004 OSPIPart III A
Page 9
HouseK-12 Finance Work Group
General Apportionment Factor #3:Certificated Instructional Salary Allocations
Funding for formula certificated instructional staff is based upon two factors:
the state recognized formula base salary for the district multiplied bythe district’s staff mix factor.

April 13, 2004 OSPIPart III A
Page 10
HouseK-12 Finance Work Group
General Apportionment Factor #3:Certificated Instructional Salary Allocations
Base Salary is state allocation for a CIS with a B.A. degree and zero years of experience.34 districts are grandfathered at higher base salaries than the other districts (see Appendix).Accountability
Salaries for new teachers (zero years experience) with a baccalaureate degree or masters degree may not be less than the state allocated salary for that level. Salary compliance requires than the district’s actual average salary paid to basic education and special education staff not be greater than the district’s state allocated salary for formula staff units.

April 13, 2004 OSPIPart III A
Page 11
HouseK-12 Finance Work Group
General Apportionment Factor #3:Certificated Instructional Salary Allocations
The staff mix factor is significant in determining the formula salary funding level for certificated instructional staff.The staff mix factor is a five-decimal number between 1.00000 and 1.94134 that quantifies the educational and experience level of instructional staff of the district.
1.00000 = a new teacher with no experience1.94134 = a teacher with a PhD and 15 years experience
April 13, 2004 OSPIPart III A
Page 12
HouseK-12 Finance Work Group
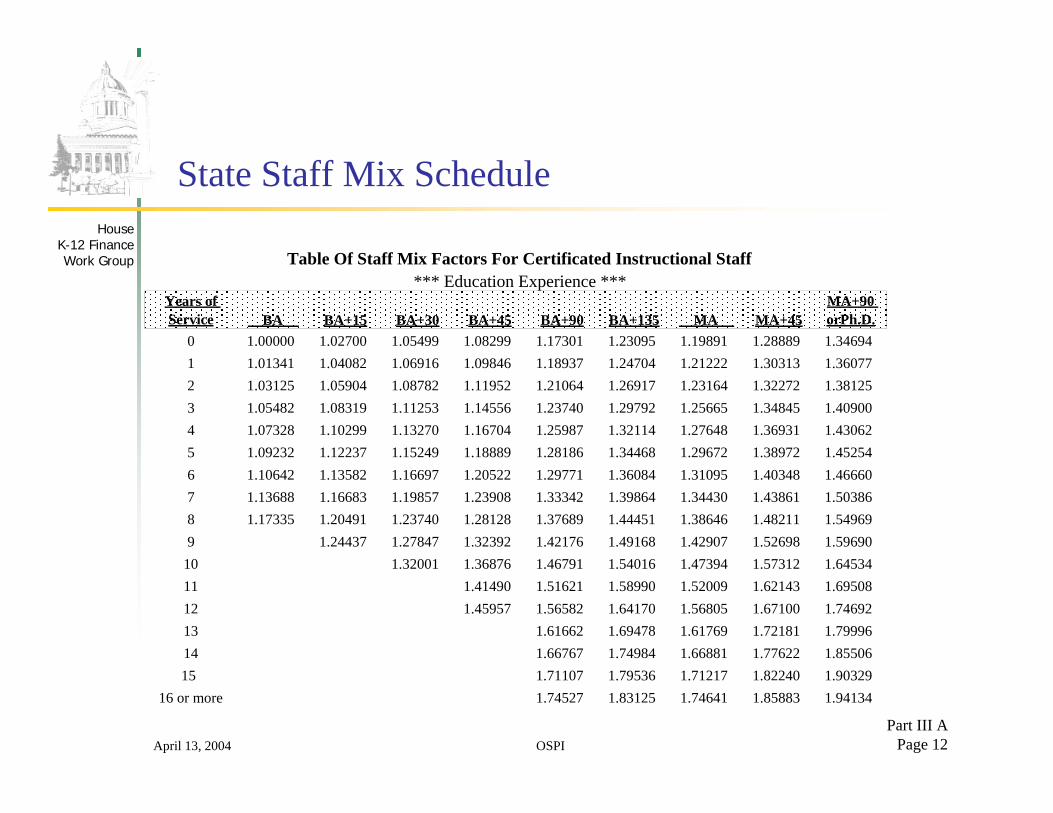
State Staff Mix Schedule
Table Of Staff Mix Factors For Certificated Instructional Staff*** Education Experience ***
Years of Service BA BA+15 BA+30 BA+45 BA+90 BA+135 MA MA+45
MA+90 orPh.D.
0 1.00000 1.02700 1.05499 1.08299 1.17301 1.23095 1.19891 1.28889 1.346941 1.01341 1.04082 1.06916 1.09846 1.18937 1.24704 1.21222 1.30313 1.360772 1.03125 1.05904 1.08782 1.11952 1.21064 1.26917 1.23164 1.32272 1.381253 1.05482 1.08319 1.11253 1.14556 1.23740 1.29792 1.25665 1.34845 1.409004 1.07328 1.10299 1.13270 1.16704 1.25987 1.32114 1.27648 1.36931 1.430625 1.09232 1.12237 1.15249 1.18889 1.28186 1.34468 1.29672 1.38972 1.452546 1.10642 1.13582 1.16697 1.20522 1.29771 1.36084 1.31095 1.40348 1.466607 1.13688 1.16683 1.19857 1.23908 1.33342 1.39864 1.34430 1.43861 1.503868 1.17335 1.20491 1.23740 1.28128 1.37689 1.44451 1.38646 1.48211 1.549699 1.24437 1.27847 1.32392 1.42176 1.49168 1.42907 1.52698 1.59690
10 1.32001 1.36876 1.46791 1.54016 1.47394 1.57312 1.6453411 1.41490 1.51621 1.58990 1.52009 1.62143 1.6950812 1.45957 1.56582 1.64170 1.56805 1.67100 1.7469213 1.61662 1.69478 1.61769 1.72181 1.7999614 1.66767 1.74984 1.66881 1.77622 1.8550615 1.71107 1.79536 1.71217 1.82240 1.90329
16 or more 1.74527 1.83125 1.74641 1.85883 1.94134

April 13, 2004 OSPIPart III A
Page 13
HouseK-12 Finance Work Group
The 2003-04 State Salary Allocation Schedulefor Certificated Instructional Staff
K-12 Salary Allocation Schedule For Certificated Instructional Staff
2003-04 School YearMA+90
Years of OR
Service BA BA+15 BA+30 BA+45 BA+90 BA+135 MA MA+45 Ph.D.
0 29,149 29,936 30,752 31,568 34,192 35,881 34,947 37,570 39,262
1 29,540 30,339 31,165 32,019 34,669 36,350 35,335 37,985 39,665
2 30,060 30,870 31,709 32,633 35,289 36,995 35,901 38,556 40,262
3 30,747 31,574 32,429 33,392 36,069 37,833 36,630 39,306 41,071
4 31,285 32,151 33,017 34,018 36,724 38,510 37,208 39,914 41,701
5 31,840 32,716 33,594 34,655 37,365 39,196 37,798 40,509 42,340
6 32,251 33,108 34,016 35,131 37,827 39,667 38,213 40,910 42,750
7 33,139 34,012 34,937 36,118 38,868 40,769 39,185 41,934 43,836
8 34,202 35,122 36,069 37,348 40,135 42,106 40,414 43,202 45,172
9 36,272 37,266 38,591 41,443 43,481 41,656 44,510 46,548
10 38,477 39,898 42,788 44,894 42,964 45,855 47,960
11 41,243 44,196 46,344 44,309 47,263 49,410
12 42,545 45,642 47,854 45,707 48,708 50,921
13 47,123 49,401 47,154 50,189 52,467
14 48,611 51,006 48,644 51,775 54,073
15 49,876 52,333 49,908 53,121 55,479
16 or more 50,873 53,379 50,906 54,183 56,588
State Funded Salary Amounts

April 13, 2004 OSPIPart III A
Page 14
HouseK-12 Finance Work Group
General Apportionment Factor # 4:Certificated Administrative Staff Salary Allocations
Based on each district’s average administrative salaries in the 1980’s, adjusted by across-the-board salary increases since then. For 2003-04, the highest funded salary is $74,541, the lowest funded salary is $30,583.
20 districts funded above $70,000 per unit.87 districts are funded between $55,000 and $65,000 per unit.133 districts are funded between $50,000 to $55,000 per unit.37 districts are funded between $40,000 to $50,000 per unit.19 districts are funded below $40,000 per unit.
Accountability.There are no salary requirements for what a district may pay an administrator.There are no requirements to fill the number of state-funded positions.

April 13, 2004 OSPIPart III A
Page 15
HouseK-12 Finance Work Group
General Apportionment Factor # 5:Classified Staff Salary Allocations
Based on each district’s average classified salaries in the 1980’s, adjusted by across-the-board salary increases since then. For 2003-04 – the highest funded salary is $32,173, the lowest funded salary is $21,266.
4 districts funded above $30,000 per unit.121 districts are funded between $27,500 and $30,000 per unit.156 districts are funded between $25,000 and $27,500 per unit.15 districts are funded below $25,000 per unit.
Accountability.There are no salary requirements for what a district may pay classified staff employees.There are no requirements to fill the number of state-funded positions.

April 13, 2004 OSPIPart III A
Page 16
HouseK-12 Finance Work Group
General Apportionment Factor #6:Nonemployee-Related Costs
Nonemployee-related costs are those costs other than salaries and benefits.
E.g., instructional supplies, textbooks, staff travel, equipment and services such as heat, light, insurance
The state currently funds NERC at $8,785 per allocated certificated unit. The NERC rate is increased by inflation each year.

April 13, 2004 OSPIPart III A
Page 17
HouseK-12 Finance Work Group
Additional Funding Factors Included in Apportionment Allocations
Small school districts and remote and necessary plantsFormulas ensure a minimum number of staff
Vocational Education ProgramsEnhanced staffing ratio of 1 staff per 19.5 voc studentsEnhanced NERC at $21,573 per staff
Skills CentersEnhanced staffing ratio of 1 staff per 16.67 skill center studentsEnhanced NERC at $16,739 per staff

April 13, 2004 OSPIPart III A
Page 18
HouseK-12 Finance Work Group
2003–2004 General Apportionment - Example
1,000 FTE StudentsStaff Units and Salaries
46 certificated instructional staff X 1.56490 X $29,149 = $ 2,098,302 4 certificated administrative staff X $52,366 = 209,46416.7 classified staff X $27,850 = 465,095
Mandatory BenefitsCertificated staff - ($2,098,302 + 209,464) X 9.68 = 223,392Classified - $465,095 X 12.25% = 56,974
Insurance Benefits50 certificated staff X $481.31 X 12 months = 288,78616.7 classified staff X 1.15 X $481.31 X 12 months = 110,923
Nonemployee Related Costs50 certificated staff X $8,785 = 439,250
TOTAL ALLOCATION. . . . . . . . . . . . . . . . . . . . . .$ 3,892,186Per Student $ 3,892

April 13, 2004 OSPIPart III A
Page 19
HouseK-12 Finance Work Group
General Apportionment –Fiscal Accountability
Must maintain 46/1000 certificated instructional staff.Must use K–4 enhancement for K–4 staffing.Must pay minimum salaries for beginning teachers.Must not exceed state average allocated salary for average base salaries of certificated staff (salary compliance).Must use state accounting and program structure.
April 13, 2004 OSPIPart III A
Page 20
HouseK-12 Finance Work Group
Special Education FundingSpecial education funding is provided for up to 12.7% of the district’s resident FTE population on an excess cost basis.Children age birth through 2 are funded at 115% of the district’s unenhanced basic education funding rate.Children aged 3 to 21 are funded at 93.09% of the district’s unenhanced basic education funding rate.All special education students in kindergarten through 12th grade generate the basic education funding based upon the student FTE.

April 13, 2004 OSPIPart III A
Page 21
HouseK-12 Finance Work Group
State Special Education –Fiscal Accountability
Funding is provided only for identified students with current Individualized education programs (IEPs). Districts must spend state special education funding in the state special education program. Carryover of unused funds is allowed up to 10% of the district state special education funding. Unused amounts above 10% are recovered.Indirects are allowed at the district’s state recovery rate calculated by OSPI.Districts must use a state prescribed excess costs methodology.

April 13, 2004 OSPIPart III A
Page 22
HouseK-12 Finance Work Group
Transportation Funding – Operations Allocations
Based on radius mile from bus stop to school of enrollment (1 to 17 miles)
Distance weighting factors to take into account geography, non-radius roads, etc.Minimum load factor
Designed to fund school districts unable to fully load school buses (usually small rural districts)
K-5 Funding: based on number of K-5 students within one radius mile of school of enrollment. Can be used for:
Transportation within 1 radius mile (any age)Walkway improvementsAdult crossing guards

April 13, 2004 OSPIPart III A
Page 23
HouseK-12 Finance Work Group
Transportation Funding – School Bus Reimbursement
School District Owned School BusesReplacement systemDepreciation basis recalculated annually based on current state price for school busesState price for school buses determined by annual bid process at OSPI
In Lieu of Depreciation - Contracting DistrictsPrice determined by state bid process

April 13, 2004 OSPIPart III A
Page 24
HouseK-12 Finance Work Group
Institutional Education220-day instructional programs run by school districts for youth in certain institutions
Residential habilitation centers State group homes Institutions for juvenile delinquents County detention centers State correctional facilities

April 13, 2004 OSPIPart III A
Page 25
HouseK-12 Finance Work Group
Additional Categorical Programs Included in Basic Education
Transitional Bilingual ProgramFunding is provided at $721.36 for each student identified and enrolled in a state approved bilingual program.
Learning Assistance ProgramProvides assistance to students who are deficient in reading, mathematics or language arts. Current formula 90 percent: number of students testing in the lowest quartile for grades spans K-6, 7-9 and 10-11; and 10 percent: district’s percentage of students qualifying for free and reduced price lunch in excess of the state average.Current Rate: $435.92 per funded unit.Beginning 2005-06
50% Assessments50% Poverty

April 13, 2004 OSPIPart III A
Page 26
HouseK-12 Finance Work Group
Categorical Funding –Fiscal Accountability
Fiscal AccountabilityFunding must be expended within the categorical program. Indirects are limited.10% of revenues may be carried over to the next year.Unused funds in excess of the 10% are recovered.

April 13, 2004 OSPIPart III A
Page 27
HouseK-12 Finance Work Group
Non-Basic Education Items in the 2003-05 Operating Budget
$s in Millions
Office of Program Research
Student Achievement Fund (I-728) $410 3.9%Levy Equalization 329 3.1%K-4 Enhanced Staffing Ratio 209 2.0%Salary and Health Benefit Increases 161 1.5%Education Reform Programs 76 0.7%Two Learning Improvement Days 54 0.5%State Office 23 0.2%Statewide Programs/Allocations 19 0.2%Highly Capable 13 0.1%Educational Service Districts 7 0.1%Food Services 6 0.1%Summer & Extended Day Skills Centers 5 0.0%Pupil Transportation Coordinators 2 0.0%Subtotal: Non-Basic Education Programs $1,313 12.4%
Basic Education Programs $9,261 87.6%Total - State Funds $10,575 100%

April 13, 2004 OSPIPart III A
Page 28
HouseK-12 Finance Work Group
Major Non-Basic Education ProgramsStudent Achievement Fund (I-728) $410 Million
Distributed as a flat amount per student.$219/student in the current year$254/student next year
Uses include reducing class size, professional development, early learning programs, extended learning programs.
Education Reform Programs $76 Million$28.7 million for WASL$12.1 million for professional development programs$17.8 million for school improvement
Including Focused Assistance, Math Helping Corps, Reading Corps$12.2 million for food and social services programs
Office of Program Research

April 13, 2004 OSPIPart III A
Page 29
HouseK-12 Finance Work Group
Major Non-Basic Education ProgramsStatewide Grants/Programs $18.6 Million
Health and Safety Programs $5.8 MillionIncludes $5.1 million for nurse corps
Technology $3.9 MillionMisc. Grants and Allocations $8.9 Million
Includes $4.6 million to Pacific Science Center, $1.9 million for Alternative Routes to Teacher Certification.
Highly Capable Program $13 Million2% of a district’s enrollment is funded at $335/student
Levy Equalization $329 Million
Office of Program Research

April 13, 2004 OSPIPart III A
Page 30
HouseK-12 Finance Work Group
Strengths of the Current System
Recognized by a General Accounting Office study as one of the more equitable state funding systems in the nation.Recognizes cost difference between school districts:
Salary differences based upon the education and experience of staff hired.Small schools
Provides enhanced funding for special need populations:Students with disabilities (Special Education)Second language students (Bilingual Education)Low achieving students (Learning Assistance Program)

1
HouseK-12 Finance Work Group
Part III B: Federal Funds
Jennifer PriddyAssistant Superintendent, School Apportionment and Financial Services
Office of the Superintendent of Public Instruction

April 13, 2004 OSPIPart III B
Page 2
HouseK-12 Finance Work Group
Major Sources of Federal Funds
FY 2003-04 Funding Levels
Individuals with Disabilities Education Act $178 millionNo Child Left Behind Act $348 millionCarl D. Perkins Vocational Education $10 millionUnited Stated Department of Agriculture Food Programs $145 millionTotal $681 million

April 13, 2004 OSPIPart III B
Page 3
HouseK-12 Finance Work Group
Federal funds have increased from $401 million in 2001-02 to an estimated $594 million in 2004-05.
K-12 Federal Funds Excluding Food Programs
$300
$350
$400
$450
$500
$550
$600
$650
$700
2001-02 2002-03 2003-04 2004-05 Estimated 2005-06 Pres. Request
Millions of $
Federal Fiscal Year

April 13, 2004 OSPIPart III B
Page 4
HouseK-12 Finance Work Group
Since FY 1993, federal revenue to districts as percent of all other revenue has increased from 6% to nearly 10%.
5%
6%
7%
8%
9%
10%
FY 92-93 FY 93-94 FY 94-95 FY 95-96 FY 96-97 FY 97-98 FY 98-99 FY 99-00 FY 00-01 FY 01-02 FY 02-03
Perc
ent o
f Tot
al R
even
ue

April 13, 2004 OSPIPart III B
Page 5
HouseK-12 Finance Work Group
Federal Funds Generally
Financial support for service requirements.Leverage change with seed-money.Focus on under-served or disadvantaged students.Maintenance of Effort and Supplement Not Supplant requirements.Allocations to districts, reserved amounts for state-level technical assistance and administration.

April 13, 2004 OSPIPart III B
Page 6
HouseK-12 Finance Work Group
Special Education: Overview
IDEA reauthorized in 1997; 2005 reauthorization expected.IDEA Purpose: ensure all children with disabilities are provided with a free, appropriate public education that emphasizes services designed to meet students’ unique needs and prepare them for employment and independent living.Preschool: facilitate provision of preschool and related services to children with disabilities aged 3 through 5.

April 13, 2004 OSPIPart III B
Page 7
HouseK-12 Finance Work Group
Special Education: 2003-2004 Funding
$ in 1,000s
Formula $158,437 89%
Capacity 11,115 6%
Discretionary 6,290 4%
Administration 2,712 2%
Total $178,554 100%

April 13, 2004 OSPIPart III B
Page 8
HouseK-12 Finance Work Group
Per student federal special education funds have increased over 300% in 8 years.
$0
$200
$400
$600
$800
$1,000
$1,200
$1,400
$1,600
$1,800
$2,000
1996-97 1997-98 1998-99 1999-00 2000-01 2001-02 2002-03 2003-04 2004-05
Per S
tude
nt
Per Student IDEAAfter State Integration
Estimated

April 13, 2004 OSPIPart III B
Page 9
HouseK-12 Finance Work Group
While having increased significantly, federal special education funding is well below federal goal of 40%.
Based on district expenditures of state, federal, and local funds.
5%
10%
15%
20%
25%
30%
35%
40%
45%
FY 92-93 FY 93-94 FY 94-95 FY 95-96 FY 96-97 FY 97-98 FY 98-99 FY 99-00 FY 00-01 FY 01-02 FY 02-03
Perc
ent o
f Tot
al S
peci
al E
d Ex
pend
iture
s
Federal as % of Total Expenditure Federal Goal

April 13, 2004 OSPIPart III B
Page 10
HouseK-12 Finance Work Group
No Child Left Behind (NCLB) Overview$ in Millions
Title I - Title I Part A $157.2Reading $17.0Migrant $15.5All Other $5.5
Title II - Teacher Quality $47.3Math/Science $1.4 Technology $8.3
Title III - Language Instruction $8.1Title IV - 21st Century $7.4
Safe/Drug Free $7.1Title V - Innovative Ed $7.7
Charter Schools ??Title VI – Assessment $7.6
Rural Ed $2.4Title VII - Native American $5.2Title VIII – Impact Aid $50.1

April 13, 2004 OSPIPart III B
Page 11
HouseK-12 Finance Work Group
Title I, Part A: Improving the Academic Achievement of the Disadvantaged
Purpose: Help improve instruction in high-poverty schools and ensure that poor and minority children have the same opportunity to meet standards.Most common services for preschool to grade 12:
Supplemental instruction in reading and mathematics.Extended learning opportunities to increase learning time.Professional development for Title I teachers and paraprofessionals.
Required set asides for parental involvement, corrective action, and professional development.

April 13, 2004 OSPIPart III B
Page 12
HouseK-12 Finance Work Group
Title I, Part A funds have grown by $50 million since 2001-02, and may grow further.
NCLB Enacted
$100
$110
$120
$130
$140
$150
$160
$170
$180
$190
2001-02 2002-03 2003-04 2004-05 Estimated 2005-06 Pres. Request
$ in Millions

April 13, 2004 OSPIPart III B
Page 13
HouseK-12 Finance Work Group
Title I, Part A Uses of FundsFY 2003-04
$ in 1,000s
To Districts (by formula) $150,816 96%
School Improvement (District-level) 2,986 1.9%
School Improvement (State-level) 157 .0%
Institutions (Neglected & Delinquent) 913 .6%
School Academic Achievement Awards 723 .4%
Administration (State-level) 1,572 1.0%
Total $157,167 100%

April 13, 2004 OSPIPart III B
Page 14
HouseK-12 Finance Work Group
Title I, Part A: Funds Reserved for School Improvement
$ in 1,000s
FY 2003-04
Federal Funds State Funds Total
State-level $157 $365 $522
School-level 2,986 2,680 5,666
Total $3,143 $3,045 $6,188

April 13, 2004 OSPIPart III B
Page 15
HouseK-12 Finance Work Group
Title II: Improving Teacher and Principal Quality
Purpose: Increase student academic achievement by improving teacher and principal quality and increasing the number of highly qualified teachers and leaders.
Districts distribute funds targeting high-need schools:Lowest % of federally highly qualified teachers.Largest average class size.Identified for improvement.

April 13, 2004 OSPIPart III B
Page 16
HouseK-12 Finance Work Group
Title II: Improving Teacher and Principal Quality
Eisenhower P.D. &
Class Size Reduction Title II
2001-2002 $33,800 $0
2002-2003 0 $46,260
2003-2004 0 $47,373
2004-2005 0 $47,660
(estimated)
2005-2006 0 $47,660
(President’s request)
$ in 1,000s

April 13, 2004 OSPIPart III B
Page 17
HouseK-12 Finance Work Group
Title II: Improving Teacher and Principal Quality
$ in 1000s
Uses of Funds2003-2004 Funding
To Districts (by formula) $ 44,555 94.0%To HECB 1,231 2.6%OSPI State-level Activities 1,172 2.4%Administration (OSPI) 415 1.0%
Total $ 47,373 100%

April 13, 2004 OSPIPart III B
Page 18
HouseK-12 Finance Work Group
USDE grant to Workforce Training and Education Coordinating Board (WTECB). Responsibilities and funds are shared through inter-local agreement:
PurposeAgencyPortion ofTotal
Institutionalized ServicesEmployment Security1%
Admin / OversightWTECB2%
Secondary EducationOSPI40%
Postsecondary EducationState for Board for Community and Technical Colleges
57%
Carl D. Perkins Vocational and Applied Technology
April 13, 2004 OSPIPart III B
Page 19
HouseK-12 Finance Work Group
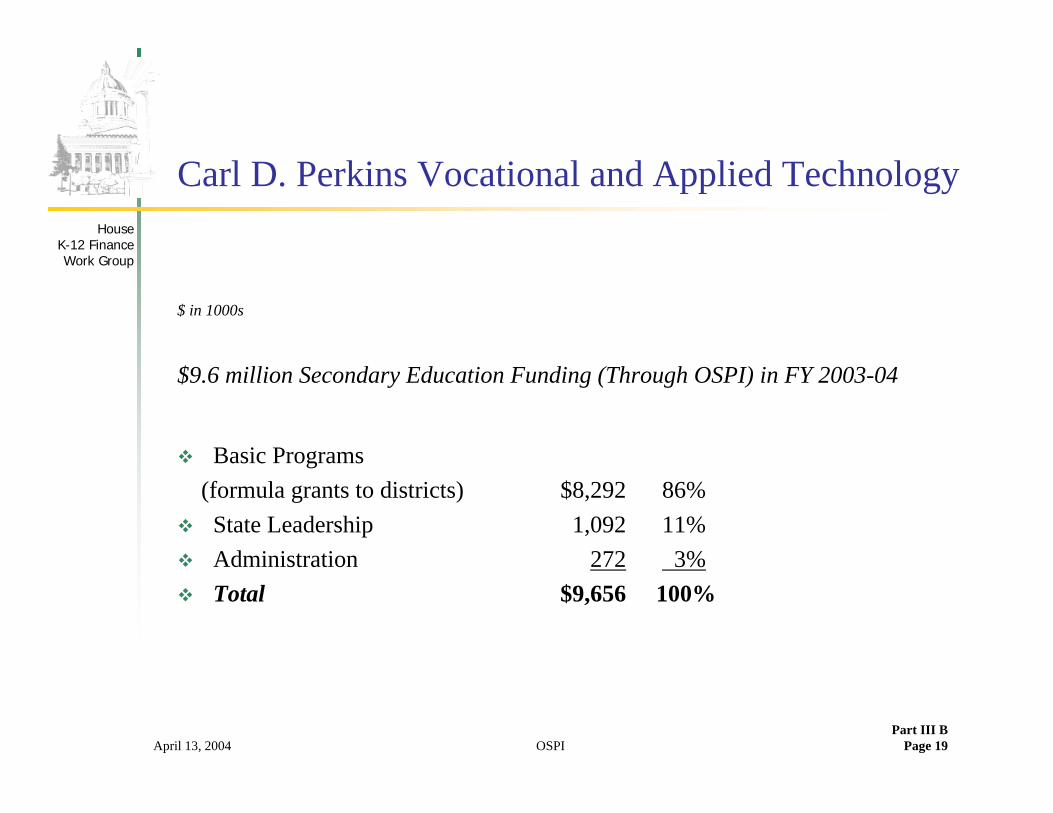
Carl D. Perkins Vocational and Applied Technology
$ in 1000s
$9.6 million Secondary Education Funding (Through OSPI) in FY 2003-04
Basic Programs (formula grants to districts) $8,292 86%State Leadership 1,092 11%Administration 272 3% Total $9,656 100%

April 13, 2004 OSPIPart III B
Page 20
HouseK-12 Finance Work Group
USDA--School Food ServicesNational School Lunch and Breakfast
Free @ 130% of FPL; Reduced price @ 185%FY 2002-03, $128.8 million
Special MilkReimbursement for milk served to children, where other nutritionprograms are not available.FY 2002-03, $255,000
Summer FoodApproved sites in low-income areas; children < 18 yearsBreakfast, lunch, snacks; 460 sites; 25,000 children per dayFY 2002-03, $2.5 million
Commodity Distribution$13.7 million in FY 2002-03; 19 million poundsValued at 16 cents per lunch served

April 13, 2004 Office of Program ResearchPart III C
Page 1
HouseK-12 Finance Work Group
Part III C: Local Maintenance and Operation Levies and Levy Equalization
Denise GrahamSenior Fiscal Analyst, Office of Program Research
House of Representatives

April 13, 2004 Office of Program ResearchPart III C
Page 2
HouseK-12 Finance Work Group
Local Maintenance and Operation Levies
The State Constitution gives school districts authority to levy property taxes with a 60 percent “Yes” vote in a district-wide election.One to four years in duration.If a levy fails at the polls, a district can seek voter approval one more time in that calendar year. Called “excess levies” because they are in excess of the statutory 1 percent limit on property tax. Revenues are for enhancements to the state basic education program –e.g., extracurricular activities, enhanced class offerings, additional salaries for additional duties for teachers.
April 13, 2004 Office of Program ResearchPart III C
Page 3
HouseK-12 Finance Work Group
Local Maintenance and Operation Levies
274 districts have levies in CY 2004, totaling $1.2 billionThe amount a district can raise is limited by the Levy Lid Law.
April 13, 2004 Office of Program ResearchPart III C
Page 4
HouseK-12 Finance Work Group
Prior to the enactment of the Levy Lid Law in 1977…
In 197532 percent of district revenues were from local property tax levies
Compared to 15.6 percent currentlythe average local levy tax rate was $7.10 per $1,000 of assessed value
compared to $2.32/$1000 in CY 2003For the 1976 collection year
277 districts asked voters to approve almost $390 million in local levies. 65 districts failed to pass levies totaling almost $184 million, impacting about 40 percent of the students.
Result of the levy failures: Seattle School District lawsuit against the state and the first Doran decision.

April 13, 2004 Office of Program ResearchPart III C
Page 5
HouseK-12 Finance Work Group
The Levy Lid Law of 1977The goal was to limit each districts’ M&O levy revenue to 10% oftheir basic apportionment allocations.Included grandfather provisions permitting districts to exceed the 10 percent limit until 1982.
The levy lid law has been changed many times over the last 27 years, increasing the amounts that districts can raise in local levies.
The legislative response: Increase state funding to districts (the Basic Education Act) and limit local M&O levies (the Levy Lid Act).

April 13, 2004 Office of Program ResearchPart III C
Page 6
HouseK-12 Finance Work Group
Levies are limited by the lesser of …
Amount approved by voters.Maximum levy authority – a.k.a. levy lid
Levy BaseLevy Lid Percent

April 13, 2004 Office of Program ResearchPart III C
Page 7
HouseK-12 Finance Work Group
Levy Base
A district’s levy base consists of most state and federal revenues to the district
In 2004, the Legislature expanded the levy base for 2005 through 2007 collections. This will increase districts’ maximum levy authority and the amount some districts can collect.

April 13, 2004 Office of Program ResearchPart III C
Page 8
HouseK-12 Finance Work Group
Levy Lid Percent
A district may raise an amount equal to the levy base multiplied by the levy lid percent.24% for most districts91 districts have grandfathered levy percentages greater than 24%
Range from 24.01% to 33.9%See Appendix for grandfathered levy lid districts.

April 13, 2004 Office of Program ResearchPart III C
Page 9
HouseK-12 Finance Work Group
Statewide, what if M&O levies today were subject to the limits in the 1977 law….
The amount raised in local levies would be less than $400 million.Actual = $1.2 billion - 310% more than 1977 goal.
The average amount raised per student would be about $414.Actual = about $1,280/student
The average property taxes due for M&O levies on a $200,000 homewould be about $150
Actual = almost $462 under current lawThe statewide average tax rate for M&O levies would be about $0.74 per $1,000 in assessed value
Actual = $2.31 per $1,000 in assessed value under current laws.
In 2004, at 10% of the apportionment allocation:

April 13, 2004 Office of Program ResearchPart III C
Page 10
HouseK-12 Finance Work Group
Why does the state limit the amount that districts can raise in excess property taxes?
Concerns about equityConcerns about levy failuresConcerns about “collective wisdom”

April 13, 2004 Office of Program ResearchPart III C
Page 11
HouseK-12 Finance Work Group
M&O levy revenues have been growing as a portion of total district revenues since the early 1980s.
0%
5%
10%
15%
20%
25%
30%
35%
75 76 77 78 79 80 81 82 83 84 85 86 87 88 89 90 91 92 93 94 95 96 97 98 99 00 01 02 03
School Y ear - E nd
S e a t t l e S c hool D i st r i c t l e v y f a i l s
Fi r st f ul l y e a r of l e v y l i d.

April 13, 2004 Office of Program ResearchPart III C
Page 12
HouseK-12 Finance Work Group
M&O levy revenues make up as much as 23% of some districts’ total revenues.
21%Tacoma21%Shoreline22%Bellevue22%Blaine22%Ocosta22%Seattle23%Tukwila23%Mercer Island
Levy Revenue as % of TotalDistrict
April 13, 2004 Office of Program ResearchPart III C
Page 13
HouseK-12 Finance Work Group
There is one additional limitation on maximum levy authority.
The amount a district receives in levy equalization reduces the amount the district can raise in local levies.

April 13, 2004 Office of Program ResearchPart III C
Page 14
HouseK-12 Finance Work Group
“ The purpose of these funds is to mitigate the effect that above average property tax rates might have on the ability of a school district to raise local revenues to supplement the state’s basic program of education. These funds serve to equalize the property tax rates that individual taxpayers would pay for such levies and to provide tax relief to tax payers in high tax rate school districts.”
RCW 28A.500.010
The local effort assistance (levy equalization) program was enacted in 1987.

April 13, 2004 Office of Program ResearchPart III C
Page 15
HouseK-12 Finance Work Group
The local effort assistance (LEA) program helps to equalize across the state the tax rate necessary to raise a portion of a district’s levy.
The concept: Each district should be able to raise an amount equal to 12% of its levy base by imposing a tax rate that is no higher than the statewide average tax rate for a 12% levy. If the district’s 12% levy tax rate is higher than the statewide average, the district receives an allocation from the state to make up the difference.

April 13, 2004 Office of Program ResearchPart III C
Page 16
HouseK-12 Finance Work Group
Districts with 12% levy rates greater than the statewide average 12% levy rate are eligible for levy equalization allocations.
$0.44
$1.76
74%
26% CY 2004 State Average
$1.30
$0.00
$1.00
$2.00
Seattle Tacoma
12%
Lev
y Ra
te P
er $
1,00
0 Ad
just
ed A
sses
sed
Valu
e
Example: Each $74 raised by the Tacoma School District will be matched by $26 from the state.
April 13, 2004 Office of Program ResearchPart III C
Page 17
HouseK-12 Finance Work Group
Levy EqualizationTo qualify, a district must
Pass a levyHave a tax rate for a 12% levy that exceeds the statewide average rate for a 12% levy.
The tax rate needed for a 12% levy will be a function of the relative size of a district’s levy base compared to the assessed value of property in the district.
Large levy base and low assessed values = high tax ratesSmall levy base and high assessed value = low tax rates
April 13, 2004 Office of Program ResearchPart III C
Page 18
HouseK-12 Finance Work Group
Levy Equalization - 2004
217 districts will receive levy equalization allocations totaling $164 million.
Another 18 districts are eligible but are not receiving levy equalization because they had not passed levies.

April 13, 2004 Office of Program ResearchPart III C
Page 19
HouseK-12 Finance Work Group
Districts Receiving Levy Equalization in 2004
Map created by LEAP Committee staff.
Part III CPage 19

April 13, 2004 Office of Program ResearchPart III C
Page 20
HouseK-12 Finance Work Group
Most of the districts in the Puget Sound area can pass levies close to or above their levy lids.
Map created by LEAP Committee staff.
Part III CPage 20

April 13, 2004 Office of Program ResearchPart III C
Page 21
HouseK-12 Finance Work Group
Many of the districts with the highest levy revenues per student are in Eastern Washington.
Part III CPage 21R
Map created by LEAP Committee staff from calendar year 2004 levy data.

April 13, 2004 Office of Program ResearchPart III C
Page 22
HouseK-12 Finance Work Group
Combining levy equalization with levy revenue increases from 175 to 241 the number of districts above $1,000 per student.
Map created by LEAP Committee staff from calendar year 2004 levy data.
Part III CPage 22R

April 13, 2004 1
HouseK-12 Finance Work Group
Part III D: Per Student Funding
Calvin W. BrodieDirector, School Apportionment and Finance Services
Office of the Superintendent of Public Instruction

April 13, 2004 OSPIPart III D
Page 2
HouseK-12 Finance Work Group
Why do some district get more state funding than others?
State recognized salary base differences.Different levels of staff experience and education.Small school allocationsLow test scores affect LAP funding.Levy Equalization funding. Different levels of students participating in:
Bilingual ProgramsSpecial EducationVocational EducationTransportation

April 13, 2004 OSPIPart III D
Page 3
HouseK-12 Finance Work Group
2002-03 State Revenues Per Student
No LEALow Categorical
$ 4,910Fife
Skewed by Green Hill Institution$ 6,304Rochester
Low Staff Mix, No LEA, Low Categorical
$ 4,772Bellevue
$ 5,343Seattle
Small School$ 23,597North River
$ 4,058 is Basic Apportionment$ 5,274State Average
CommentAvg. Per FTE

April 13, 2004 OSPIPart III D
Page 4
HouseK-12 Finance Work Group
Why do some district get more federal funding than others?
Higher poverty as measured by the US census. This is a major driver for Title I and others under NCLB.Presence of federal property such as military bases or Indian reservations that generate Impact Aid revenues. Higher free and reduced school lunch percentage which generates school lunch monies. High presence of populations targeted for federal assistance such as Special Education, Native Americans, Bilingual and Migrant.

April 13, 2004 OSPIPart III D
Page 5
HouseK-12 Finance Work Group
2002-03 Federal Revenues Per Student
4% Poverty$ 178Mercer Island
19% Poverty$ 1,080Seattle
Small District 8% Poverty$ 91Damman
Small District 1% Poverty$ 83Hockinson
Impact Aid – Indian Reservation $8,200 PS. Title 1 $1,119 PS
$ 11,887Keller
Title 1, School Lunch and IDEA = $429
$ 710State Average
CommentAvg. Per FTE

April 13, 2004 Office of Program Research Page 1
HouseK-12 Finance Work Group
Part III E: Compensation
Denise GrahamSenior Fiscal Analyst, Office of Program Research
House of Representatives
April 13, 2004Part III E
Page 2
HouseK-12 Finance Work Group
State-Funded Salary IncreasesThe state provides funding for legislatively-authorized salary increases for state-formula school districts staff.
April 13, 2004Part III E
Page 3
HouseK-12 Finance Work Group
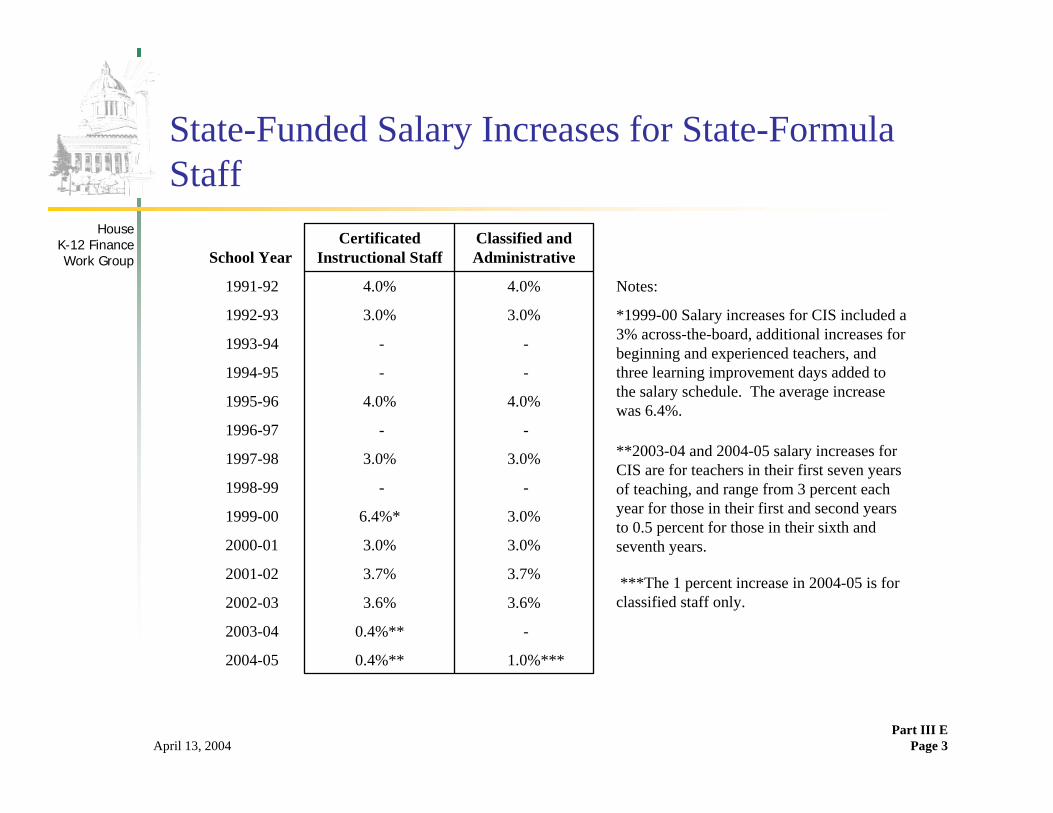
State-Funded Salary Increases for State-Formula Staff
1.0%***0.4%**2004-05
-0.4%**2003-04
3.6%3.6%2002-03
3.7%3.7%2001-02
3.0%3.0%2000-01
3.0%6.4%*1999-00
--1998-99
3.0%3.0%1997-98
--1996-97
4.0%4.0%1995-96
--1994-95
--1993-94
3.0%3.0%1992-93
4.0%4.0%1991-92
Classified and Administrative
Certificated Instructional StaffSchool Year
Notes:
*1999-00 Salary increases for CIS included a 3% across-the-board, additional increases for beginning and experienced teachers, and three learning improvement days added to the salary schedule. The average increase was 6.4%.
**2003-04 and 2004-05 salary increases for CIS are for teachers in their first seven years of teaching, and range from 3 percent each year for those in their first and second years to 0.5 percent for those in their sixth and seventh years.
***The 1 percent increase in 2004-05 is for classified staff only.

April 13, 2004Part III E
Page 4
HouseK-12 Finance Work Group
Initiative 732 – Salary Increases for School District Staff
Passed in 2000, required salary increases for educational employees beginning with the 2001-02 school year.Salary increases are to be based on the Seattle Consumer Price Index for the previous calendar year. As originally passed and as interpreted by the State Supreme Court, required the state to fund the salary increases for all school district employees. Amended by the 2003 Legislature
Suspended the increases for the 2003-05 bienniumFunding to be provided for state-formula staff onlyDeleted the section declaring the increases to be part of basic education, consistent with the court decision
April 13, 2004Part III E
Page 5
HouseK-12 Finance Work Group
Certificated Administrators and Classified Salaries
State provides funding for state-formula staff based on “average” salary for each district.
Actual salaries are determined at the local level.
Average actual salaries in 2002-03Classified $31,814 (annualized)Certificated Administrative Staff $82,517 (annualized)

April 13, 2004Part III E
Page 6
HouseK-12 Finance Work Group
Certificated Instructional Staff Salaries
Certificated Instructional Staff (CIS) can receive two types of salaries
Base contracts – typically tied to the state funding schedule.Supplemental contracts for additional time, responsibilities, and incentives (TRI).

April 13, 2004Part III E
Page 7
HouseK-12 Finance Work Group
CIS – Base Salaries
Districts receive state allocations for teacher salaries based on the state salary allocation schedule.
Local bargaining takes place over the structure of the salary scheduleUse state schedule or locally developed schedule?
Subject to specific provisions and limitations contained in RCW 28A.400.200
District’s actual average salary cannot exceed the district’s average salary as calculated on the state salary allocation schedule. Salaries for BA and 0 years and MA and 0 years cannot be less than those salaries on the state salary allocation schedule.

April 13, 2004Part III E
Page 8
HouseK-12 Finance Work Group
The 2003-04 State Salary Allocation Schedule
K-12 Salary Allocation Schedule For Certificated Instructional Staff
2003-04 School YearMA+90
Years of OR
Service BA BA+15 BA+30 BA+45 BA+90 BA+135 MA MA+45 Ph.D.
0 29,149 29,936 30,752 31,568 34,192 35,881 34,947 37,570 39,262
1 29,540 30,339 31,165 32,019 34,669 36,350 35,335 37,985 39,665
2 30,060 30,870 31,709 32,633 35,289 36,995 35,901 38,556 40,262
3 30,747 31,574 32,429 33,392 36,069 37,833 36,630 39,306 41,071
4 31,285 32,151 33,017 34,018 36,724 38,510 37,208 39,914 41,701
5 31,840 32,716 33,594 34,655 37,365 39,196 37,798 40,509 42,340
6 32,251 33,108 34,016 35,131 37,827 39,667 38,213 40,910 42,750
7 33,139 34,012 34,937 36,118 38,868 40,769 39,185 41,934 43,836
8 34,202 35,122 36,069 37,348 40,135 42,106 40,414 43,202 45,172
9 36,272 37,266 38,591 41,443 43,481 41,656 44,510 46,548
10 38,477 39,898 42,788 44,894 42,964 45,855 47,960
11 41,243 44,196 46,344 44,309 47,263 49,410
12 42,545 45,642 47,854 45,707 48,708 50,921
13 47,123 49,401 47,154 50,189 52,467
14 48,611 51,006 48,644 51,775 54,073
15 49,876 52,333 49,908 53,121 55,479
16 or more 50,873 53,379 50,906 54,183 56,588

April 13, 2004Part III E
Page 9
HouseK-12 Finance Work Group
CIS - TRI Contracts
TRI salaries are for time and activities outside of regular classroom time and duties - grading papers, professional development, curriculum planning, coaching.
Locally bargained: rate of pay, number of days, optional teacher-directed vs. mandatory district-directed, duties.
Locally bargained salary increases above any state-provided salary increases are through TRI contracts.
can take the form of additional time/responsibilities or increased rate of pay
“Supplemental contracts shall not cause the state to incur any present or future funding obligation.” 28A.400.200(4) RCW

April 13, 2004Part III E
Page 10
HouseK-12 Finance Work Group
Example TRI Schedule: Cosmopolis School District 2002-03
Source: WEA Research Report #2002/03-6, TRI Pay Report.
Step BA BA+15 BA+30 BA+45 BA+90 BA+135 MA MA+45 MA+90 DOC
0 600 600 600 600 600 600 600 600 6001 ... ... ... ... ... ... ... ... ...2 ... ... ... ... ... ... ... ... ...3 ... ... ... ... ... ... ... ... ...4 ... ... ... ... ... ... ... ... ...5 ... ... ... ... ... ... ... ... ...6 ... ... ... ... ... ... ... ... ...7 ... ... ... ... ... ... ... ... ...8 ... ... ... ... ... ... ... ... ...9 ... ... ... ... ... ... ... ...10 ... ... ... ... ... ... ...11 ... ... ... ... ... ...12 ... ... ... ... ... ...13 ... ... ... ... ...14 ... ... ... ... ...15 ... ... ... ... ...16 ... ... ... ... ...
Schedule is for 3 optional days (2 weekdays prior to start of school and 1 optional day/7 hours for work such as open house, music concerts etc.) beyond the basic 182 day contract workyear.
April 13, 2004Part III E
Page 11
HouseK-12 Finance Work Group
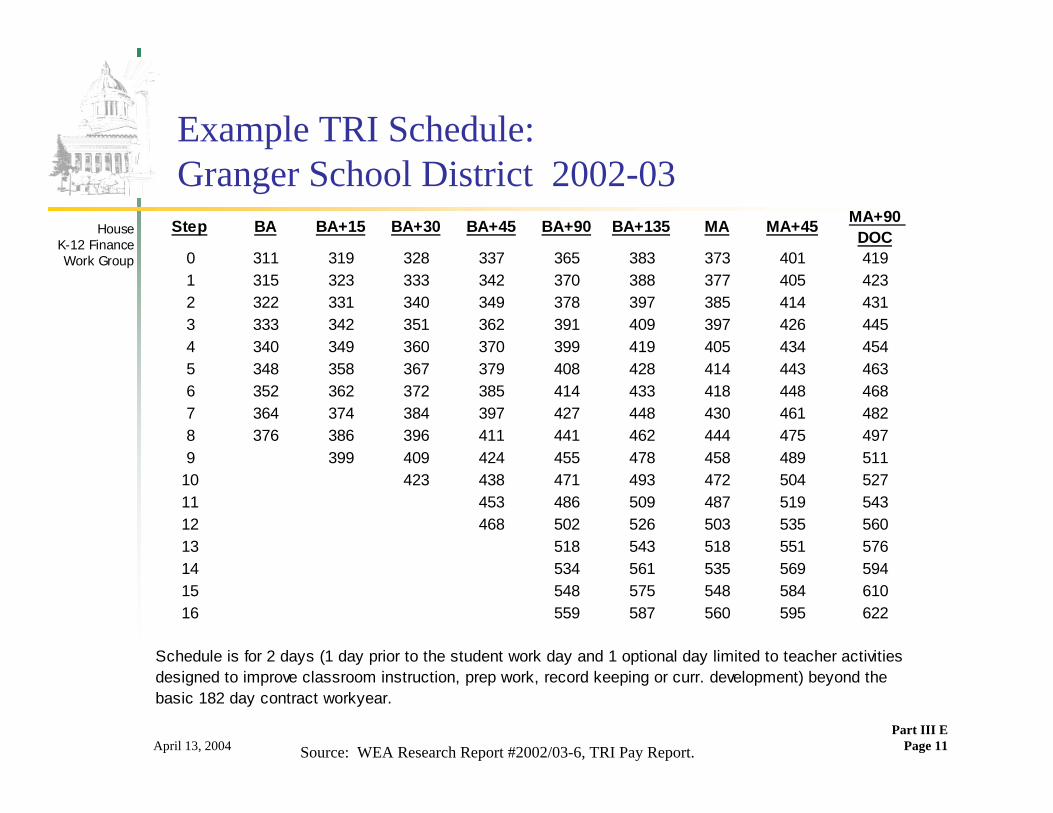
Example TRI Schedule: Granger School District 2002-03
Source: WEA Research Report #2002/03-6, TRI Pay Report.
Step BA BA+15 BA+30 BA+45 BA+90 BA+135 MA MA+45 MA+90 DOC
0 311 319 328 337 365 383 373 401 4191 315 323 333 342 370 388 377 405 4232 322 331 340 349 378 397 385 414 4313 333 342 351 362 391 409 397 426 4454 340 349 360 370 399 419 405 434 4545 348 358 367 379 408 428 414 443 4636 352 362 372 385 414 433 418 448 4687 364 374 384 397 427 448 430 461 4828 376 386 396 411 441 462 444 475 4979 399 409 424 455 478 458 489 511
10 423 438 471 493 472 504 52711 453 486 509 487 519 54312 468 502 526 503 535 56013 518 543 518 551 57614 534 561 535 569 59415 548 575 548 584 61016 559 587 560 595 622
Schedule is for 2 days (1 day prior to the student work day and 1 optional day limited to teacher activities designed to improve classroom instruction, prep work, record keeping or curr. development) beyond the basic 182 day contract workyear.

April 13, 2004Part III E
Page 12
HouseK-12 Finance Work Group
Example TRI Schedule: Spokane School District 2002-03
Source: WEA Research Report #2002/03-6, TRI Pay Report.
Step BA BA+15 BA+30 BA+45 BA+90 BA+135 MA MA+45 MA+90DOC
0 2,136 2,194 2,254 2,314 2,506 2,630 2,561 2,754 2,8781 2,165 2,224 2,284 2,347 2,541 2,664 2,590 2,784 2,9072 2,214 2,274 2,335 2,404 2,599 2,725 2,644 2,840 2,9653 2,287 2,348 2,412 2,484 2,683 2,814 2,725 2,924 3,0554 2,338 2,403 2,468 2,543 2,745 2,879 2,781 2,983 3,1175 2,392 2,458 2,524 2,603 2,807 2,944 2,839 3,043 3,1816 2,423 2,487 2,555 2,639 2,842 2,980 2,871 3,073 3,2117 2,502 2,568 2,638 2,727 2,934 3,078 2,958 3,166 3,3098 2,582 2,652 2,723 2,820 3,030 3,179 3,051 3,262 3,4109 2,738 2,813 2,913 3,129 3,283 3,145 3,360 3,514
10 2,905 3,012 3,230 3,389 3,244 3,462 3,62111 3,114 3,337 3,499 3,345 3,568 3,73012 3,212 3,446 3,613 3,451 3,677 3,84413 3,558 3,730 3,560 3,789 3,96114 3,670 3,851 3,672 3,909 4,08215 3,765 3,951 3,768 4,010 4,18816 3,841 4,030 3,843 4,091 4,27217 -- -- -- -- --18 -- -- -- -- --19 -- -- -- -- --20 -- -- -- -- --21 -- -- -- -- --22 -- -- -- -- --23 -- -- -- -- --24 4,960 5,204 4,963 5,283 5,517
The schedule represents a professional responsibility stipend of 6% (or approximately 11 days), a professional development day, and 2 days for staff development, plus a small supplies stipend. These extra work hours are in recognition of duties outside of the regular work day. These are beyond the basic 182 day contract work year.

April 13, 2004Part III E
Page 13
HouseK-12 Finance Work Group
Example TRI Schedule:Tacoma School District 2002-03
Source: WEA Research Report #2002/03-6, TRI Pay Report.
Step BA BA+15 BA+30 BA+45 BA+90 MA BA+135 MA+45 MA+90 DOC0 1,303 1,578 1,853 2,325 3,940 1,507 4,662 2,282 3,896 5,1791 1,578 1,788 2,595 3,672 4,477 1,782 4,846 3,627 5,216 5,3642 2,325 3,133 3,940 4,439 4,662 2,282 5,031 4,973 5,402 5,5493 3,672 4,365 4,477 4,624 4,846 3,627 5,216 5,364 5,586 5,7354 4,439 4,550 4,662 4,810 5,031 4,973 5,402 5,549 5,771 5,9195 4,624 4,736 4,846 4,995 5,216 5,364 5,586 5,735 5,956 6,1046 4,810 4,920 5,031 5,179 5,402 5,549 5,771 5,919 6,142 6,2897 4,995 5,105 5,216 5,364 5,586 5,735 5,956 6,104 6,327 6,4758 5,179 5,290 5,402 5,549 5,771 5,919 6,142 6,289 6,511 6,6599 5,364 5,476 5,586 5,735 5,956 6,104 6,327 6,475 6,696 6,844
10 5,549 5,660 5,771 5,919 6,142 6,289 6,511 6,659 6,881 7,02911 5,735 5,845 5,956 6,104 6,327 6,475 6,696 6,844 7,067 7,21412 ... ... ... 6,289 6,511 6,659 6,881 7,029 7,251 7,39913 ... ... ... ... ... 6,844 7,067 7,584 7,806 7,95414 ... ... ... ... ... ... ... ... ... ...15 ... ... ... ... ... ... ... ... ... ...16 ... ... ... ... ... ... ... ... ... ...17 .. ... ... ... ... ... ... ... ... ...18 ... ... ... ... ... ... ... ... ... ...19 ... ... ... ... ... ... ... ... ... ...20 6,022 6,138 6,254 6,604 6,837 7,187 7,419 7,963 8,197 8,352
Schedule is for 7 days (1 day before school, 1 conference/semester day & 5 optional days) and a Professional Responsibility Stipend as an incentive to provide additional services required beyond the basic 182 day contract workyear. Schedule is for teachers hired after 9/99. BA+135 column closed 9/1/92.

April 13, 2004 Office of Program Research Page 14
HouseK-12 Finance Work Group
Map created by LEAP Committee staff from 2002-03 S275 data from OSPI.
Most of the districts with the highest TRI salaries for teachers are concentrated in the Puget Sound area.
Part III EPage 14

April 13, 2004Part III E
Page 15
HouseK-12 Finance Work Group
Statewide Average Teacher Salaries 2002-03 SY
$51,129Total5,865TRI*
$45,264Base
Average TRI salaries calculated based on reported total salaries and base salaries.

April 13, 2004Part III E
Page 16
HouseK-12 Finance Work Group
Health Benefits
The state allocates health benefits to school districts as a flat amount per FTE staff.
The actual amounts districts and employees spend on health benefits are the result of local bargaining.
Employee premiums, employee co-pays, and the benefit packages are all subject to local bargaining.

April 13, 2004Part III E
Page 17
HouseK-12 Finance Work Group
The 2003 state funding rates for K-12 health benefits were “de-linked” from the funding rates for state employees. The rates were brought back to parity in the 04 supplemental budget for the 2004-05 SY.
$300.00
$350.00
$400.00
$450.00
$500.00
$550.00
$600.00
Per
Empl
oyee
Per
Mon
th
State Employees $324.20 $323.70 $305.32 $313.95 $314.51 $317.34 $341.75 $391.15 $436.16 $457.29 $482.38 $504.89 $584.58
K-12 Allocation $317.79 $317.79 $322.90 $313.95 $314.51 $317.34 $335.75 $388.02 $425.89 $455.27 $457.07 $481.31 $582.47
93 94 95 96 97 98 99* 00* 01* 02* 03 04 05*
“De-linked”
Parity
*The difference between state employee and K-12 employee funding rates in 1999 through 2002 and in 2005 is due to lawsuit settlements related to the state employee funding rate.

April 13, 2004 Office of Program ResearchPart III Appendix
Page 1
K-12 Finance Work Group
Part III AppendixPage
234
5-6789
101112
Sources of District Revenues 1995-96 to 2002-03 SY GraphList of Grandfathered Salary DistrictsMap of Grandfathered Salary DistrictsGeneral Apportionment Small School EnhancementMap of Districts Receiving Small School Allocation Student Achievement Fund Per Student Distributions 2002 – 08 GraphStudent Achievement Fund Total Distributions 2002 – 2008 GraphList of Grandfathered Levy Lid DistrictsMap of Grandfathered Levy Lid DistrictsMap of Grandfathered Levy Lid and Salary Districts

April 13, 2004 Office of Program ResearchPart III Appendix
Page 2
K-12 Finance Work Group
Since the 1995-96 SY, state dollars as a portion of district revenues have declined while federal dollars and local taxes have increased.
0%
20%
40%
60%
80%
100%
Perc
ent o
f T
otal
Dist
rict
Rev
enue
s
Other 3.9% 4.0% 4.4% 4.6% 4.5% 4.7% 4.8% 4.7%
Federal 6.2% 6.3% 6.8% 7.1% 7.7% 8.2% 8.8% 9.5%
Local Taxes 14.3% 14.8% 14.4% 14.5% 15.2% 15.2% 15.1% 15.6%
State 75.6% 74.8% 74.4% 73.8% 72.6% 71.9% 71.2% 70.2%
1995-96
1996-97
1997-98
1998-99
1999-00
2000-01
2001-02
2002-03

April 13, 2004 Office of Program ResearchPart III Appendix
Page 3
K-12 Finance Work Group
Thirty-four districts are grandfathered at higher state salary allocations than other districts.
% Higher % HigherBase Than Base Than
District Salaries "All Others" District Salaries "All Others"
1. Everett 30,998 6.3% 18. Eatonville 29,379 0.8%2. Orondo 30,938 6.1% 19. Taholah 29,358 0.7%3. Northshore 30,760 5.5% 20. Green Mountain 29,350 0.7%4. Marysville 30,669 5.2% 21. Benge 29,349 0.7%5. Puyallup 30,128 3.4% 22. Darrington 29,349 0.7%6. Vader 30,117 3.3% 23. Evaline 29,342 0.7%7. Shaw Island 30,096 3.2% 24. Loon Lake 29,342 0.7%8. Southside 29,979 2.8% 25. Thorp 29,319 0.6%9. Lake Chelan 29,967 2.8% 26. Wenatchee 29,312 0.6%
10. Mukilteo 29,884 2.5% 27. Lake Washington 29,295 0.5%11. Lopez Island 29,852 2.4% 28. Bellevue 29,228 0.3%12. Seattle 29,732 2.0% 29. Centerville 29,220 0.2%13. Oak Harbor 29,724 2.0% 30. Port Townsend 29,219 0.2%14. Edmonds 29,502 1.2% 31. Sumner 29,204 0.2%15. McCleary 29,487 1.2% 32. Kelso 29,194 0.2%16. Eastmont 29,459 1.1% 33. Toppenish 29,173 0.1%17. Boistfort 29,414 0.9% 34. Cosmopolis 29,172 0.1%
All others: $29,149

April 13, 2004 4
K-12 Finance Work Group
Thirty-four districts receive state apportionment allocations based on higher salaries than the other districts.
Map created by LEAP Committee staff.
Part III AppendixPage 4

April 13, 2004 Office of Program ResearchPart III Appendix
Page 5
K-12 Finance Work Group
General Apportionment Small School Enhancements
For small school districts and remote and necessary plants the formulas ensure a minimum number of staff units.
Less than 25 students a minimum of 2 staff units are provided.For K-6 with enrollment GT 25 LTE 60 a minimum of 3 staff units.For 7-8 with LTE 20 a minimum of 1 staff unit.
Small high school funding –For districts operating not more than two high schools and having total high school enrollment of not more than 300 the funding formula provides a minimum of 9 certificated instructional staff units and .5 administrative staff units.
Small high schools and remote and necessary plants must be approved by the State Board of Education.

April 13, 2004 Office of Program ResearchPart III Appendix
Page 6
K-12 Finance Work Group
General Apportionment Small School Enhancements – Numbers
Small school districts:7 districts with less than 25 FTE are funded.31 districts with 25-100 FTE are funded. 16 nonhigh districts with 50-180 FTE are funded.
Remote and necessary plants7 R & N plants with less than 25 FTE are funded.4 R & N plants with 25-100 FTE are funded.
Small high schools101 Small high schools (under 300 FTE) are funded

April 13, 2004 7
K-12 Finance Work Group
144 districts received additional general apportionment allocations under the small school or remote-and-necessary-plant formulas in the 2002-03 school year.
Map created by LEAP Committee staff.
Part III AppendixPage 7

April 13, 2004 Office of Program ResearchPart III Appendix
Page 8
K-12 Finance Work Group
The per student allocation to school districts from the Student Achievement Fund increases over time.
$204.10
$300.00
$450.00
$219.32
$375.00
$183.86
$254.00
$0$50
$100$150$200$250$300$350$400$450$500
2002 2003 2004 2005 2006 2007 2008
School Year
Per
Stud
ent A
lloca
tion
April 13, 2004 Office of Program ResearchPart III Appendix
Page 9
K-12 Finance Work Group
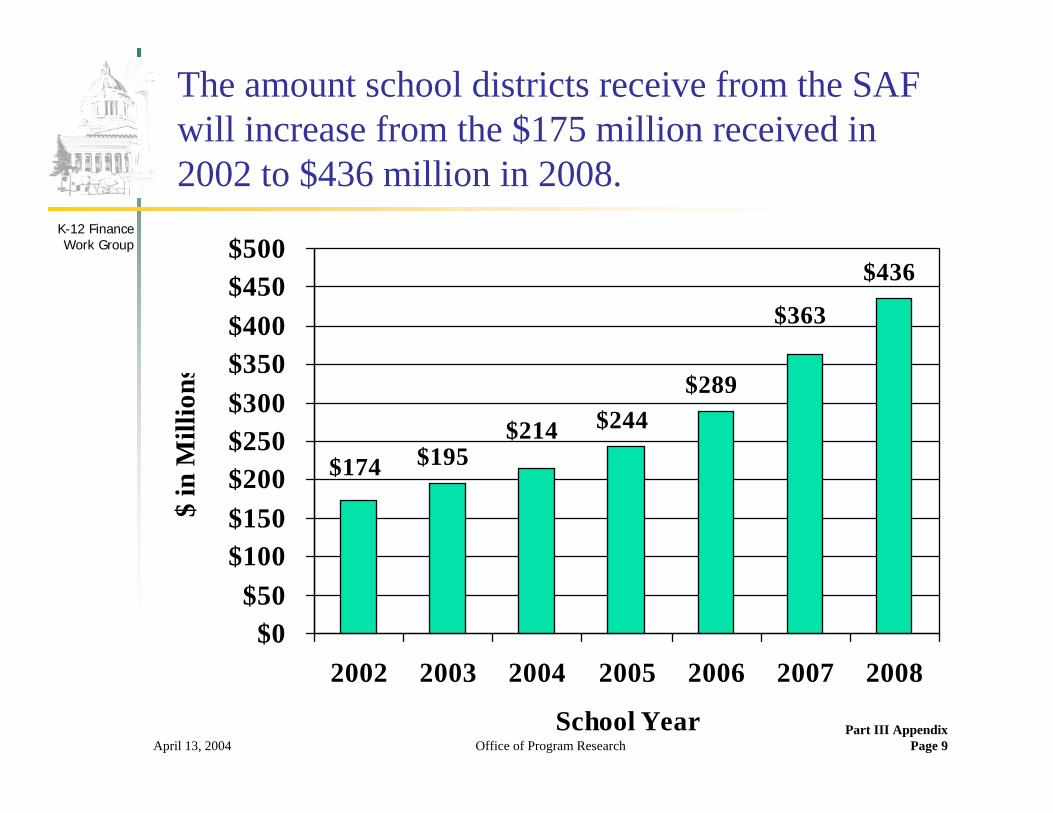
The amount school districts receive from the SAF will increase from the $175 million received in 2002 to $436 million in 2008.
$195$244
$289
$436
$174$214
$363
$0$50
$100$150$200$250$300$350$400$450$500
2002 2003 2004 2005 2006 2007 2008
School Year
$ in
Mill
ions

April 13, 2004 Office of Program ResearchPart III Appendix
Page 10
K-12 Finance Work Group
91 districts are grandfathered above 24% levy lid.
Rank Highest School
Max Levy
Rank Highest School
Max Levy
Rank Highest School
Max Levy
=1 County District % =1 County District % =1 County District %59 Adams Lind 25.20% 68 King Auburn 24.90% 33 Pierce Dieringer 28.85%40 Adams Ritzville 28.12% 71 King Tahoma 24.89% 83 Pierce Orting 24.78%82 Chelan Cashmere 24.79% 80 King Snoqualmie Valley 24.83% 52 Pierce Clover Park 26.76%12 Clark Green Mountain 33.58% 61 King Issaquah 24.97% 67 Pierce Peninsula 24.91%11 Columbia Starbuck 33.61% 42 King Shoreline 27.93% 61 Pierce Franklin Pierce 24.97%27 Cow litz Toutle Lake 31.19% 71 King Lake Washington 24.89% 71 Pierce Bethel 24.89%87 Cow litz Kalama 24.24% 71 King Kent 24.89% 61 Pierce Eatonville 24.97%15 Douglas Orondo 33.51% 68 King Northshore 24.90% 84 Pierce White River 24.77%91 Douglas Bridgeport 24.01% 60 Kitsap Bainbridge 24.98% 81 Pierce Fife 24.82%5 Douglas Palisades 33.73% 17 Kittitas Damman 33.44% 2 San Juan Shaw 33.82%41 Douglas Mansfield 28.00% 6 Klickitat Centerville 33.71% 29 Skagit Anacortes 30.54%24 Douglas Waterville 32.00% 89 Klickitat Roosevelt 24.14% 32 Skagit Conw ay 29.15%25 Franklin North Franklin 31.70% 46 Lew is Vader 27.29% 16 Skamania Mount Pleasant 33.46%1 Franklin Kahlotus 33.90% 20 Lew is Evaline 33.36% 88 Spokane Spokane 24.18%8 Grant Wahluke 33.69% 58 Lew is Boistfort 25.32% 39 Spokane West Valley (Spo) 28.20%53 Grant Quincy 26.67% 31 Lew is White Pass 29.43% 50 Stevens Valley 26.91%51 Grant Coulee/Hartline 26.79% 3 Lincoln Sprague 33.77% 49 Stevens Loon Lake 27.01%19 Grays Harbor Cosmopolis 33.40% 55 Lincoln Reardan 26.02% 86 Thurston Olympia 24.34%43 Jefferson Brinnon 27.50% 30 Lincoln Creston 30.42% 7 Walla Walla Dixie 33.70%22 King Seattle 32.97% 9 Lincoln Odessa 33.67% 18 Walla Walla College Place 33.43%68 King Federal Way 24.90% 21 Lincoln Harrington 33.01% 48 Walla Walla Columbia (Walla) 27.07%75 King Enumclaw 24.88% 38 Lincoln Davenport 28.21% 54 Whatcom Bellingham 26.35%9 King Mercer Island 33.67% 43 Okanogan Pateros 27.50% 35 Whatcom Blaine 28.51%64 King Highline 24.95% 56 Pend Oreille Selkirk 25.47% 34 Whitman Lacrosse Joint 28.75%75 King Vashon Island 24.88% 65 Pierce Steilacoom Hist. 24.93% 75 Whitman Lamont 24.88%65 King Renton 24.93% 78 Pierce Puyallup 24.87% 89 Whitman Tekoa 24.14%57 King Skykomish 25.43% 26 Pierce Tacoma 31.47% 47 Whitman Pullman 27.27%28 King Bellevue 30.66% 14 Pierce Carbonado 33.52% 37 Whitman Palouse 28.27%13 King Tukw ila 33.54% 36 Pierce University Place 28.29% 4 Whitman Garfield 33.76%85 King Riverview 24.72% 79 Pierce Sumner 24.86% 23 Whitman Steptoe 32.42%
45 Whitman Colton 27.35%

April 13, 2004 11
K-12 Finance Work Group
Grandfathered Levy Lid Districts
Map created by LEAP Committee staff.
Part III AppendixPage 11

April 13, 2004 12
K-12 Finance Work Group
Map created by LEAP Committee staff.
Grandfathered Levy Lid and Salary Districts
Part III AppendixPage 12