Embed Size (px)
Citation preview
Chapter III
Finance for sustainable development
Closing the investment gap to achieve the Sustainable Development Goals (SDGs) by 2030 requires the mobilization of significant financial resources. Estimates of the financing needs for public and private investments vary, but are invariably large (United Nations, 2014). As noted in chapter 1, addressing the shortfall in productivity growth in the least developed countries (LDCs) alone will require investment in these countries to rise at an annual average rate of at least 11 per cent through 2030. This significantly exceeds the rate of investment growth between 2010 and 2015, which averaged 8.9 per cent annually. At the same time, the global environment, including the weak economy, low trade growth, soft commodity prices, volatile international capital flows, and the increase of geopolitical risks make raising long-term investment and increasing capital formation particularly challenging.
At the Third International Conference on Financing for Development in July 2015 in Addis Ababa, Member States of the United Nations agreed that both private sources of finance (including financial and direct investment) and public resources (including domes-tic and international) are necessary to achieve sustainable development and the SDGs. Pub-lic and private resources should not be seen as substitutes, as they have different investment objectives. For example, despite growing pockets of socially conscious and/or impact inves-tors, most investors of private capital remain driven by a profit motive, and will under-in-vest in public goals when the expected financial return underperforms compared to other opportunities on a risk-adjusted basis.
Public goods, such as combating climate change, are generally not sufficiently incor-porated into risk-return analyses by private investors, requiring policy intervention, such as carbon pricing or strengthened regulations. Investment in sustainable development is further challenged as many investors evaluate risk and return over a short-term horizon. This myopia leads to not only herd behaviour and volatility, but also failure to incorporate long-term risks, such as those associated with climate change, in investment decisions.
This short-term investment perspective is reflected in the behaviour of international capital flows, particularly commercial bank lending and portfolio flows from institutional investors. While there is much discussion on rising risk aversion and increasing volatility of capital, the data shows that, for the countries analysed, volatility has not increased com-pared to earlier decades and is still lower than that in past crisis periods (see the section on the analysis of volatility).
Rather, international capital inflows remain subject to periodic episodes of high vola-tility as in the past, often triggered by global systemic risks. Nonetheless, the section on the trends in private resources for sustainable development shows that total net capital flows to developing countries and transition economies, which turned negative in 2014, are estimat-ed to remain negative at least through 2017. This represents the longest multi-year reversal of flows since the United Nations began monitoring them in 1990, although divergence between countries and regions is significant, with some large emerging market countries experiencing increasingly large outflows and others registering inflows.
International capital inflows remain subject to volatility and net flows to developing countries are projected to remain negative at least through 2017
74 World Economic Situation and Prospects 2017
Achieving the SDGs will require policies and regulatory frameworks that incen-tivize changes in investment patterns to better align investment with sustainable devel-opment. Despite the challenging global economy, public and private actions can effect change. Though still somewhat limited, there are ongoing efforts within the private sector to improve reporting and better align investment with sustainable development. Changes in public policies and regulatory frameworks can help mainstream these efforts, while also reducing excessive capital market volatility. Public policies are thus the lynchpin of financ-ing for sustainable development.
Changes in public policies and regulatory frameworks have to be accompanied by increases in and more effective use of public finance. Official development assistance (ODA) and other international public finance is a critical complement to domestic revenue mobilization. As described in detail in the section on trends in public resources flows, both concessional and non-concessional international public financial flows to developing coun-tries rose in 2015, albeit modestly. In this context, multilateral development banks (MDBs) have taken initial steps to optimise their balance sheets and expand lending, as well as to better align their investments with the SDGs. Building on these efforts, development banks, both national and multilateral, are well-placed to contribute to the mobilization of additional resources, in particular with the provision of long-term capital for sustainable infrastructure investments.
Trends in net resource transfers and international reserves
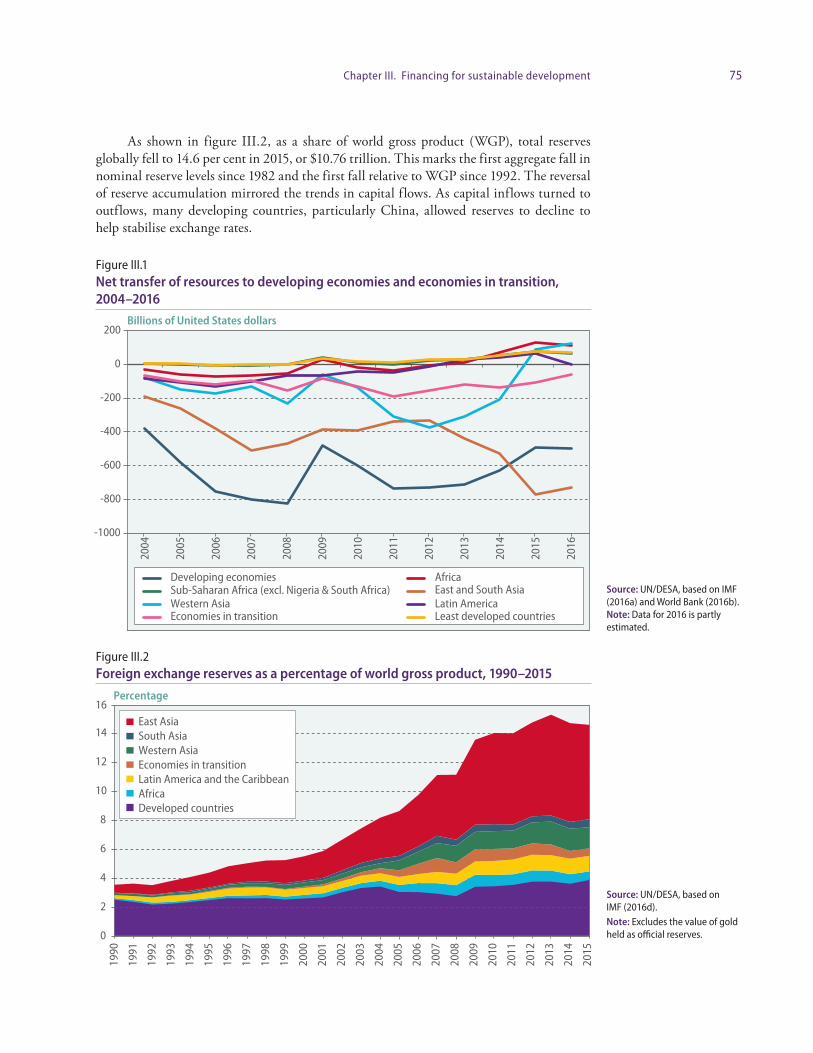
For many years, developing countries as a whole have experienced negative net resource transfers, as shown in figure III.1, meaning that capital has flowed from developing to developed countries. Such resource transfers consist of the net flow of funds to a country, including capital flows, capital servicing, income and current transfers (i.e. grants and other transfers, including ODA), as well as the net change in a country’s official international reserves.1 In 2016, net transfers from developing countries are estimated to have totalled close to $500 billion, slightly more than 2015 levels, but significantly below their peak of $800 billion in 2008 at the time the global financial crisis erupted.
The aggregate numbers, however, mask significant differences across regions and countries. While East and South Asia continues to experience significant negative trans-fers, driven in large part by China, net resource transfers have turned positive in most other regions, albeit at low levels. LDCs, where the need for resource transfers is the greatest, continue to see only a small positive net transfer of resources.
The trends in the flow of net resources in large part reflect the build-up of interna-tional foreign exchange reserves, which are generally recycled back into high quality foreign assets, such as United States Treasury bills, and are thus included in the calculation of net resource transfers. In the first quarter of 2016, 64 per cent of official reported reserves were held in assets denominated in US dollars, up from 61 per cent in 2014 (IMF, 2016d). Over-all, developing countries’ foreign exchange reserves fell to $7.5 trillion in 2015, down from $8.2 trillion in 2014, with further reductions estimated in 2016.
1 For a full definition of net transfer of resources, please see Box IV.1 of United Nations (1990) and Annex III of United Nations (1986).
International public finance is a critical
complement to domestic revenue mobilization,
which remains insufficient to meet
public investment needs
East and South Asia continue to experience
significant negative net resource transfers, but
transfers have turned positive in most
other regions
75Chapter III. Financing for sustainable development
As shown in figure III.2, as a share of world gross product (WGP), total reserves globally fell to 14.6 per cent in 2015, or $10.76 trillion. This marks the first aggregate fall in nominal reserve levels since 1982 and the first fall relative to WGP since 1992. The reversal of reserve accumulation mirrored the trends in capital flows. As capital inflows turned to outflows, many developing countries, particularly China, allowed reserves to decline to help stabilise exchange rates.
Figure III.1 Net transfer of resources to developing economies and economies in transition, 2004–2016
Figure III.2 Foreign exchange reserves as a percentage of world gross product, 1990–2015
Source: UN/DESA, based on IMF (2016a) and World Bank (2016b). Note: Data for 2016 is partly estimated.
Source: UN/DESA, based on IMF (2016d). Note: Excludes the value of gold held as official reserves.
Billions of United States dollars
-1000
-800
-600
-400
-200
0
200
2004
2005
2006
2007
2008
2009
2010
2011
2012
2013
2014
2015
2016
Developing economies AfricaSub-Saharan Africa (excl. Nigeria & South Africa) East and South AsiaWestern Asia Latin AmericaEconomies in transition Least developed countries
Percentage
0
2
4
6
8
10
12
14
16
1990
1991
1992
1993
1994
1995
1996
1997
1998
1999
2000
2001
2002
2003
2004
2005
2006
2007
2008
2009
2010
2011
2012
2013
2014
2015
East AsiaSouth AsiaWestern AsiaEconomies in transitionLatin America and the CaribbeanAfricaDeveloped countries
76 World Economic Situation and Prospects 2017
Trends in private resources for sustainable development
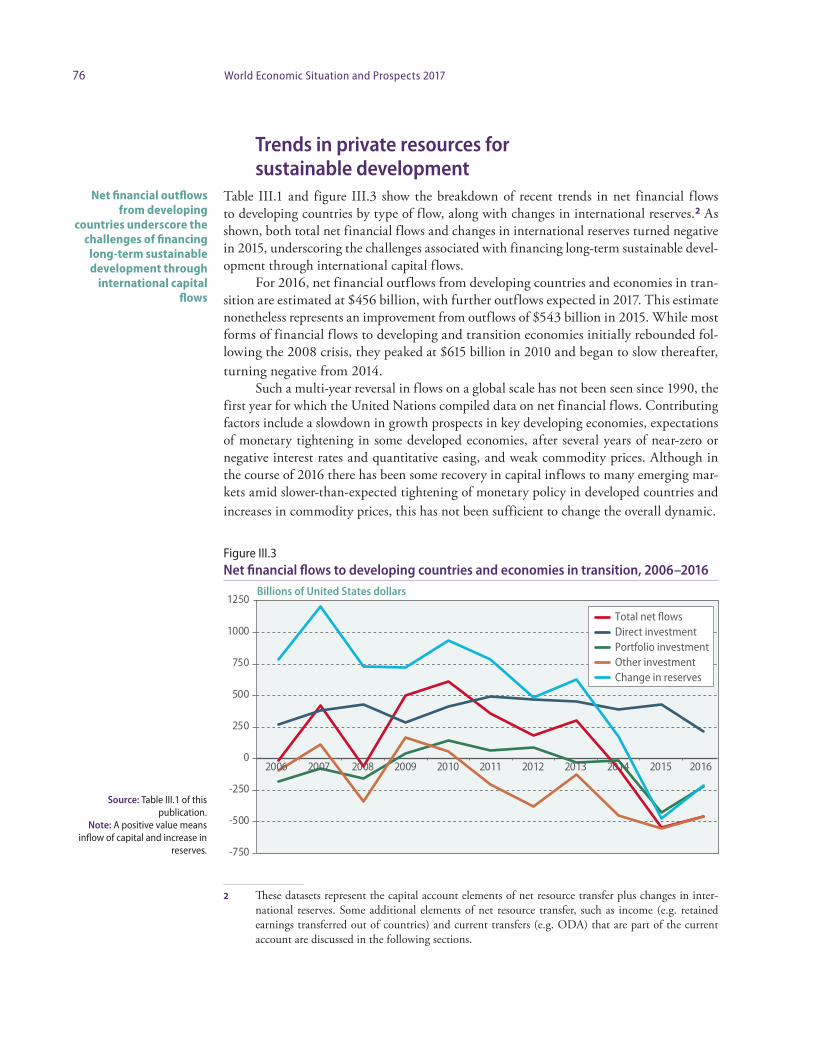
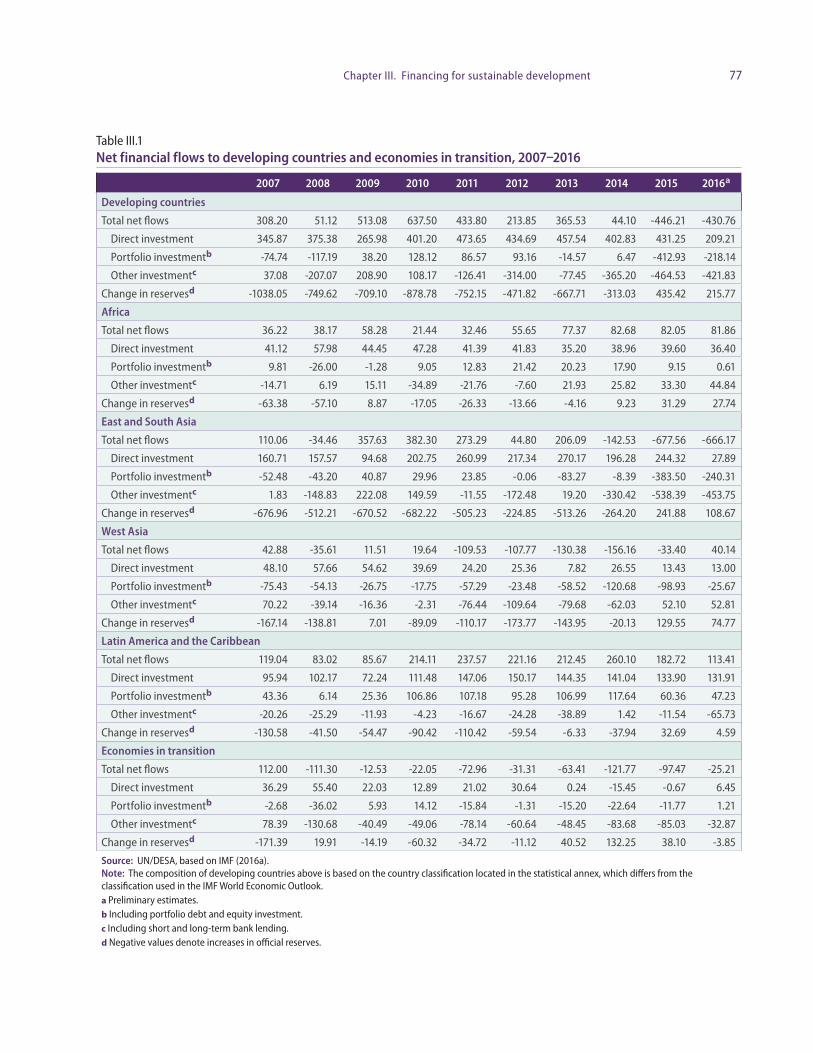
Table III.1 and figure III.3 show the breakdown of recent trends in net financial flows to developing countries by type of flow, along with changes in international reserves.2 As shown, both total net financial flows and changes in international reserves turned negative in 2015, underscoring the challenges associated with financing long-term sustainable devel-opment through international capital flows.
For 2016, net financial outflows from developing countries and economies in tran-sition are estimated at $456 billion, with further outflows expected in 2017. This estimate nonetheless represents an improvement from outflows of $543 billion in 2015. While most forms of financial flows to developing and transition economies initially rebounded fol-lowing the 2008 crisis, they peaked at $615 billion in 2010 and began to slow thereafter, turning negative from 2014.
Such a multi-year reversal in flows on a global scale has not been seen since 1990, the first year for which the United Nations compiled data on net financial flows. Contributing factors include a slowdown in growth prospects in key developing economies, expectations of monetary tightening in some developed economies, after several years of near-zero or negative interest rates and quantitative easing, and weak commodity prices. Although in the course of 2016 there has been some recovery in capital inflows to many emerging mar-kets amid slower-than-expected tightening of monetary policy in developed countries and increases in commodity prices, this has not been sufficient to change the overall dynamic.
2 These datasets represent the capital account elements of net resource transfer plus changes in inter-national reserves. Some additional elements of net resource transfer, such as income (e.g. retained earnings transferred out of countries) and current transfers (e.g. ODA) that are part of the current account are discussed in the following sections.
Net financial outflows from developing
countries underscore the challenges of financing
long-term sustainable development through
international capital flows
Figure III.3 Net financial flows to developing countries and economies in transition, 2006–2016
Source: Table III.1 of this publication.
Note: A positive value means inflow of capital and increase in
reserves. -750
-500
-250
0
250
500
750
1000
1250
2006 2007 2008 2009 2010 2011 2012 2013 2014 2015 2016
Total net flowsDirect investmentPortfolio investmentOther investmentChange in reserves
Billions of United States dollars
77Chapter III. Financing for sustainable development
Table III.1 Net financial flows to developing countries and economies in transition, 2007–2016
2007 2008 2009 2010 2011 2012 2013 2014 2015 2016a
Developing countries
Total net flows 308.20 51.12 513.08 637.50 433.80 213.85 365.53 44.10 -446.21 -430.76
Direct investment 345.87 375.38 265.98 401.20 473.65 434.69 457.54 402.83 431.25 209.21
Portfolio investmentb -74.74 -117.19 38.20 128.12 86.57 93.16 -14.57 6.47 -412.93 -218.14
Other investmentc 37.08 -207.07 208.90 108.17 -126.41 -314.00 -77.45 -365.20 -464.53 -421.83
Change in reservesd -1038.05 -749.62 -709.10 -878.78 -752.15 -471.82 -667.71 -313.03 435.42 215.77
Africa
Total net flows 36.22 38.17 58.28 21.44 32.46 55.65 77.37 82.68 82.05 81.86
Direct investment 41.12 57.98 44.45 47.28 41.39 41.83 35.20 38.96 39.60 36.40
Portfolio investmentb 9.81 -26.00 -1.28 9.05 12.83 21.42 20.23 17.90 9.15 0.61
Other investmentc -14.71 6.19 15.11 -34.89 -21.76 -7.60 21.93 25.82 33.30 44.84
Change in reservesd -63.38 -57.10 8.87 -17.05 -26.33 -13.66 -4.16 9.23 31.29 27.74
East and South Asia
Total net flows 110.06 -34.46 357.63 382.30 273.29 44.80 206.09 -142.53 -677.56 -666.17
Direct investment 160.71 157.57 94.68 202.75 260.99 217.34 270.17 196.28 244.32 27.89
Portfolio investmentb -52.48 -43.20 40.87 29.96 23.85 -0.06 -83.27 -8.39 -383.50 -240.31
Other investmentc 1.83 -148.83 222.08 149.59 -11.55 -172.48 19.20 -330.42 -538.39 -453.75
Change in reservesd -676.96 -512.21 -670.52 -682.22 -505.23 -224.85 -513.26 -264.20 241.88 108.67
West Asia
Total net flows 42.88 -35.61 11.51 19.64 -109.53 -107.77 -130.38 -156.16 -33.40 40.14
Direct investment 48.10 57.66 54.62 39.69 24.20 25.36 7.82 26.55 13.43 13.00
Portfolio investmentb -75.43 -54.13 -26.75 -17.75 -57.29 -23.48 -58.52 -120.68 -98.93 -25.67
Other investmentc 70.22 -39.14 -16.36 -2.31 -76.44 -109.64 -79.68 -62.03 52.10 52.81
Change in reservesd -167.14 -138.81 7.01 -89.09 -110.17 -173.77 -143.95 -20.13 129.55 74.77
Latin America and the Caribbean
Total net flows 119.04 83.02 85.67 214.11 237.57 221.16 212.45 260.10 182.72 113.41
Direct investment 95.94 102.17 72.24 111.48 147.06 150.17 144.35 141.04 133.90 131.91
Portfolio investmentb 43.36 6.14 25.36 106.86 107.18 95.28 106.99 117.64 60.36 47.23
Other investmentc -20.26 -25.29 -11.93 -4.23 -16.67 -24.28 -38.89 1.42 -11.54 -65.73
Change in reservesd -130.58 -41.50 -54.47 -90.42 -110.42 -59.54 -6.33 -37.94 32.69 4.59
Economies in transition
Total net flows 112.00 -111.30 -12.53 -22.05 -72.96 -31.31 -63.41 -121.77 -97.47 -25.21
Direct investment 36.29 55.40 22.03 12.89 21.02 30.64 0.24 -15.45 -0.67 6.45
Portfolio investmentb -2.68 -36.02 5.93 14.12 -15.84 -1.31 -15.20 -22.64 -11.77 1.21
Other investmentc 78.39 -130.68 -40.49 -49.06 -78.14 -60.64 -48.45 -83.68 -85.03 -32.87
Change in reservesd -171.39 19.91 -14.19 -60.32 -34.72 -11.12 40.52 132.25 38.10 -3.85
Source: UN/DESA, based on IMF (2016a). Note: The composition of developing countries above is based on the country classification located in the statistical annex, which differs from the classification used in the IMF World Economic Outlook. a Preliminary estimates. b Including portfolio debt and equity investment. c Including short and long-term bank lending. d Negative values denote increases in official reserves.
78 World Economic Situation and Prospects 2017
Nonetheless, compared to previous episodes of financial crises in emerging markets, high levels of international reserves and greater exchange-rate flexibility in many develop-ing economies have provided a cushion in coping with the reversal in capital flows. The volatility of capital flows, while still high compared to the period before capital account liberalization, is below the volatility associated with earlier episodes in many countries (see the section on the analysis of volatility). It is unclear, however, whether all developing coun-tries will be able to continue to smoothly manage such volatility, given their current rate of drawdown in international reserves and the potential for greater capital withdrawal when monetary policy normalizes in developed countries.
Specific national economic and political circumstances affect the cross-country dis-tribution of these flows. East and South Asia drove the overall trend due to continued large outflows of portfolio and other investment, and growing net outflows of direct investment. While economies in transition also experienced net capital outflows, characterized both by low levels of direct investment and continued deleveraging, all other regions are estimated to have experienced positive net flows in 2016. The Africa region has had relatively stable total net inflows over the past three years, at about $82 billion annually. Direct investment remained more or less constant, albeit at relatively low levels. Portfolio investment collapsed to net zero, but was offset by an increase in other investments, such as cross-border bank loans. West Asia and Latin America and the Caribbean also experienced positive inflows in 2016, though at a low level compared to the first half of the decade.
While table III.1 is based on net flows (inflows net of outflows), gross capital flows, by all indications, have increased in size, both nominally and as a proportion of GDP. The growing magnitude of both gross inflows and outflows reflects in part growing South-South flows (including outward foreign direct investment, as discussed below), as well as institutional developments such as the emergence of pension funds and sovereign wealth funds (SWFs) in some countries (IMF, 2016e).
Table III.1 shows that across regions, portfolio investments and other investments (mostly bank loans and currency/deposits, trade credits, and other equity) have been the largest source of outflows, as well as the most volatile. As shown in table III.1, foreign direct investment (FDI), which has generally tended to be relatively more stable than other flows, is estimated to have fallen significantly in net terms in 2016.
Foreign direct investmentFDI to developing countries fell to an estimated $209 billion in 2016, from $431 billion in 2015. In spite of this, and as indicated in table III.1 and figure III.3, FDI has tended to be relatively more stable and longer-term than the other types of cross-border private finance, such as bank lending and portfolio flows. When FDI is invested in sustainable develop-ment-enhancing sectors, such as resilient infrastructure, it can help to further sustainable development and implementation of the SDGs. While FDI flows to developing countries have been on an upward trend since 2000 (when they amounted to around $149 billion), they peaked at $474 billion in 2011 and have registered lower levels in subsequent years. They have in general been suppressed by the fragility of the global economy, weak growth in emerging economies, and low commodity prices. The sharp fall in 2016 is largely driven by FDI trends in China, with mainland China projected to record a net outflow of FDI of about $48 billion. At the same time, inward FDI in China has slowed in response to the lower Chinese growth trajectory and lower global trade growth. Over the medium term,
79Chapter III. Financing for sustainable development
an expected pick-up in economic activity around the world should lead to higher levels of global FDI flows.
There are concerns, however, regarding the concentration and development impact of many forms of FDI. The large majority of FDI to developing countries continues to be channelled to Asia and Latin America. Developing Asia remained the largest FDI recip-ient region in the world in 2015 and will likely continue to attract large inflows, despite estimates of a net decline in 2016. During the past year, falling commodity prices have depressed foreign investment in natural-resource-based economies in sub-Saharan Africa and South America, limiting FDI flows to those regions (UNCTAD, 2016b).
Compared to their 2012 peak, 2015 net FDI flows were down nearly 11 per cent in Latin America and the Caribbean, but FDI inflows have stabilized at between 3.5 per cent and 3.7 per cent of GDP in the region. FDI to LDCs as a group increased in 2015 to $35 billion on a gross basis, or 5 per cent of gross FDI to developing countries. This upturn was largely due to investment in one country, Angola, over three-quarters of which were loans provided by foreign parent firms to their Angolan affiliates. FDI to LDCs is estimated to decline in 2016 due to falling commodity prices leading to sluggish investment, along with cancellation of projects in a number of countries (UNCTAD, 2016b).
The Addis Ababa Action Agenda (AAAA) emphasized the importance of the quality of FDI, along with quantity, in supporting sustainable development. Current FDI patterns do not appear to be fully aligned with sustainable development. Greenfield investment tends to have a greater impact on jobs and development than other forms of FDI, but an increase in global FDI projected for 2016 is principally driven by a surge in cross-border mergers and acquisitions, which hit an all-time high in 2014. At the same time, FDI to LDCs and small island developing States (SIDS) remains concentrated in extractive indus-tries; the number of investments in the natural resource sector in LDCs more than doubled in 2015 to reach a three-year high, while announced greenfield projects fell by 6 per cent (UNCTAD, 2016b).
In gross terms, FDI flows to developing economies amounted to $765 billion in 2015, representing an increase of 9 per cent over the previous year, while outward investment from some developing and transition economies has been limited by weakening aggre-gate demand and declining commodity prices, accompanied by depreciating national cur-rencies. Nonetheless, from a longer-term perspective, developing economies have become important sources of investments in LDCs, landlocked developing countries and SIDS (UNCTAD, 2016b).
Other investment, including bank lending In gross terms, international bank claims (cross-border bank claims plus local claims in foreign currencies) are amongst the largest form of international capital flows, with trillions of dollars moving across borders. Total gross international bank claims totalled $31.6 tril-lion in 2016, with cross-border bank credit to emerging market economies of $3.2 trillion (BIS, 2016a). On a net basis, the “other investment” category (which includes bank claims) represents the largest capital outflow from developing countries, at $465 billion in 2015 and an estimated $422 billion in 2016. The impact of this was greatest in China, where cross-border lending to residents of mainland China dropped $305 billion from its mid-2014 peak (BIS, 2016b).
There are concerns regarding the concentration and development impact of FDI
Developing economies have become important sources of investments in the LDCs
80 World Economic Situation and Prospects 2017
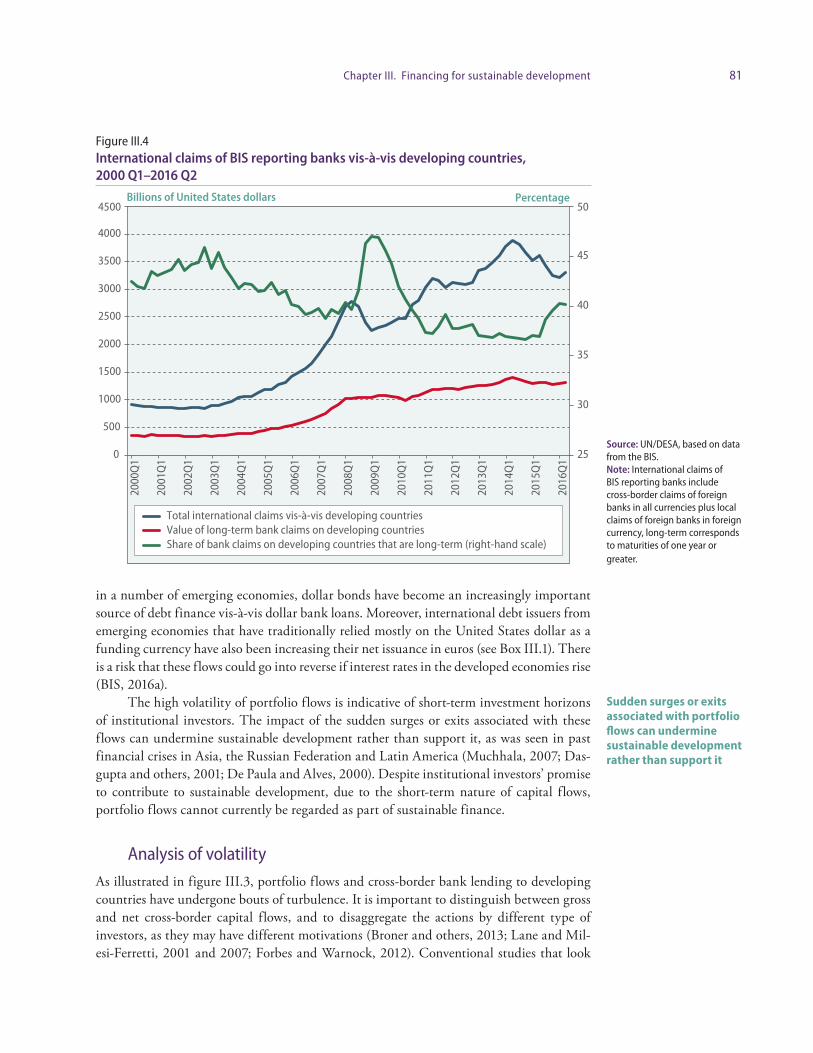
Cross-border bank lending has been subdued in recent years as a number of inter-national banks — particularly from Europe — continue to face deleveraging pressures. Figures released by the Bank for International Settlements (BIS) show a decline in global cross-border bank claims since 2008, with a peak-to-trough drop of 26.2 per cent from the first quarter of 2008 until end-2015. As illustrated in figure III.4, in contrast to total cross-border claims, bank credit to developing economies increased by over 72 per cent from early 2009 to mid-2014, at which point it also began a downward trend (despite a small increase in the second quarter of 2016).3
There is some concern that the Basel capital adequacy rules for banks might, by rais-ing the cost of long-term and riskier lending, have the effect of reducing the availability of long-term financing, with a particularly negative impact on investment in developing coun-tries as well as on riskier investments such as some clean technologies. While it is difficult to calculate the impact of the regulations because the counterfactual is not known, figure III.4 does show that long-term lending to developing countries has been stagnant since the crisis, with annual growth remaining low or at zero for most years since 2008.
The declining share of long-term claims further shows that the growth of bank credit has been fuelled by short-term loans. Indeed, volatility of total flows to developing coun-tries has been almost entirely due to shifts in short-term lending. The lack of growth in long-term commercial bank flows to developing and transition economies is of particular concern for sustainable development since they have historically played an important role in financing longer-term infrastructure projects in these countries.
Portfolio flowsGiven the drop in bank lending, institutional investors have been viewed as a potential source of financing for sustainable development. Indeed, institutional investors manage assets of between $75 and $85 trillion. However, similar to bank lending, portfolio flows (which are driven by institutional investors) to developing countries have turned negative in recent years. Developing countries and economies in transition experienced net outflows of $425 billion in 2015 and estimated outflows of $217 billion in 2016. Declines have been strongest in East and South Asia, particularly reflecting large capital outflows from China.
Chinese domestic actors have sought overseas assets as China has slowly liberalized outward investment, while foreign investors have withdrawn capital due to downgraded growth expectations. This follows several years of robust inflows to developing countries and transition economies following the financial crisis of 2008, as portfolio investors in developed countries searched for higher yields in the context of low interest rates in devel-oped countries.
While a large part of the volatility in portfolio flows has been witnessed in equity markets, emerging market bonds have also experienced turbulence. Over the past couple of years, there have been concerns regarding a trend of increasing levels of borrowing through international debt securities by companies in emerging economies, as discussed below.
International bond issuance recovered sharply in developing countries after the glob-al financial crisis, in contrast to bank loans, which have remained subdued. As a result,
3 Debt securities are covered in multiple categories of the balance of payments. Foreign investment in domestically issued debt is covered under portfolio flows below. External sovereign debt is covered in the section on debt and debt sustainability. External debt issued by emerging market and developing country corporations is covered in Box III.1.
The growth of international bank credit has been fuelled by short
term loans
Portfolio flows to developing countries
have turned negative in recent years
There is a risk that capital flows into emerging
market debt securities could go into reverse
if interest rates in the developed
economies rise
81Chapter III. Financing for sustainable development
in a number of emerging economies, dollar bonds have become an increasingly important source of debt finance vis-à-vis dollar bank loans. Moreover, international debt issuers from emerging economies that have traditionally relied mostly on the United States dollar as a funding currency have also been increasing their net issuance in euros (see Box III.1). There is a risk that these flows could go into reverse if interest rates in the developed economies rise (BIS, 2016a).
The high volatility of portfolio flows is indicative of short-term investment horizons of institutional investors. The impact of the sudden surges or exits associated with these flows can undermine sustainable development rather than support it, as was seen in past financial crises in Asia, the Russian Federation and Latin America (Muchhala, 2007; Das-gupta and others, 2001; De Paula and Alves, 2000). Despite institutional investors’ promise to contribute to sustainable development, due to the short-term nature of capital flows, portfolio flows cannot currently be regarded as part of sustainable finance.
Analysis of volatilityAs illustrated in figure III.3, portfolio flows and cross-border bank lending to developing countries have undergone bouts of turbulence. It is important to distinguish between gross and net cross-border capital flows, and to disaggregate the actions by different type of investors, as they may have different motivations (Broner and others, 2013; Lane and Mil-esi-Ferretti, 2001 and 2007; Forbes and Warnock, 2012). Conventional studies that look
Sudden surges or exits associated with portfolio flows can undermine sustainable development rather than support it
Figure III.4 International claims of BIS reporting banks vis-à-vis developing countries, 2000 Q1–2016 Q2
Source: UN/DESA, based on data from the BIS. Note: International claims of BIS reporting banks include cross-border claims of foreign banks in all currencies plus local claims of foreign banks in foreign currency, long-term corresponds to maturities of one year or greater.
25
30
35
40
45
50
0
500
1000
1500
2000
2500
3000
3500
4000
4500
2000
Q1
2001
Q1
2002
Q1
2003
Q1
2004
Q1
2005
Q1
2006
Q1
2007
Q1
2008
Q1
2009
Q1
2010
Q1
2011
Q1
2012
Q1
2013
Q1
2014
Q1
2015
Q1
2016
Q1
Total international claims vis-à-vis developing countriesValue of long-term bank claims on developing countriesShare of bank claims on developing countries that are long-term (right-hand scale)
Billions of United States dollars Percentage
82 World Economic Situation and Prospects 2017
at cross-country regressions on the impact of capital flows tend to use quarterly or annual data, often on a net basis (Ariyoshi and others, 2000; Broner and others, 2013). Rapid movements in capital can be masked, as sudden surges (withdrawals) in some months may be netted out by a slowdown (return of inflows) in the next month. To examine the vola-tility trends, analysis was conducted on five developing countries’ capital flows for which monthly disaggregated data was available going back at least 12 years.
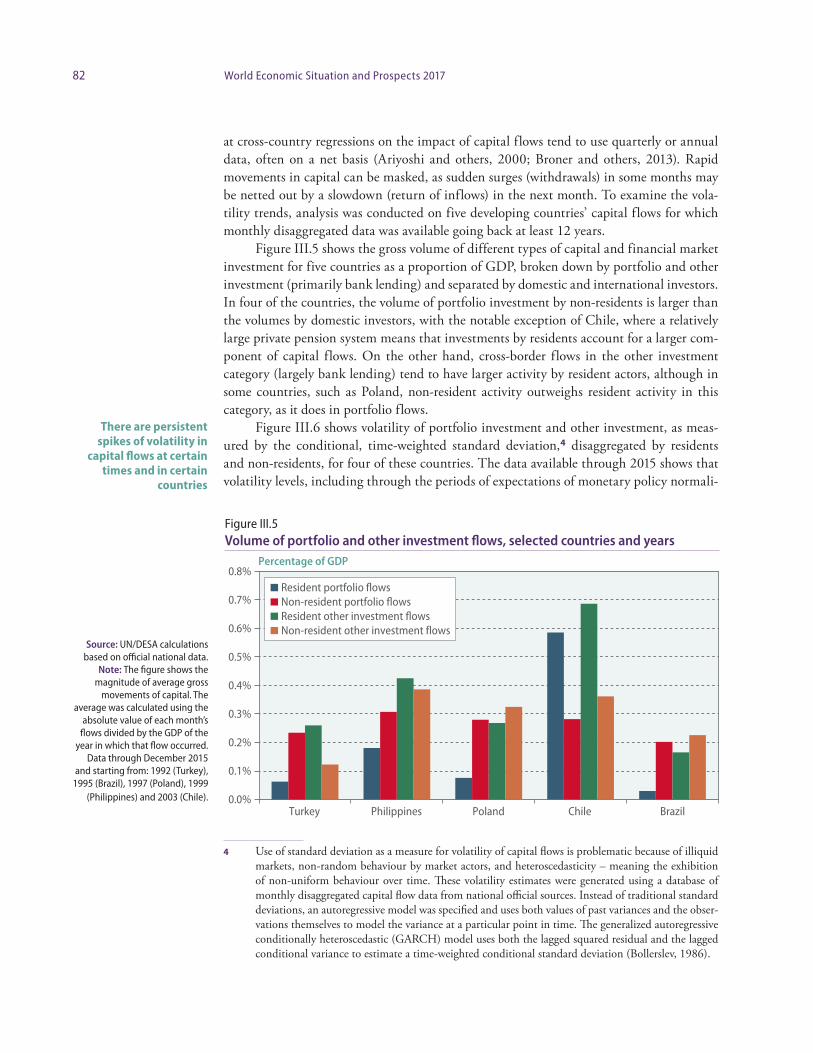
Figure III.5 shows the gross volume of different types of capital and financial market investment for five countries as a proportion of GDP, broken down by portfolio and other investment (primarily bank lending) and separated by domestic and international investors. In four of the countries, the volume of portfolio investment by non-residents is larger than the volumes by domestic investors, with the notable exception of Chile, where a relatively large private pension system means that investments by residents account for a larger com-ponent of capital flows. On the other hand, cross-border flows in the other investment category (largely bank lending) tend to have larger activity by resident actors, although in some countries, such as Poland, non-resident activity outweighs resident activity in this category, as it does in portfolio flows.
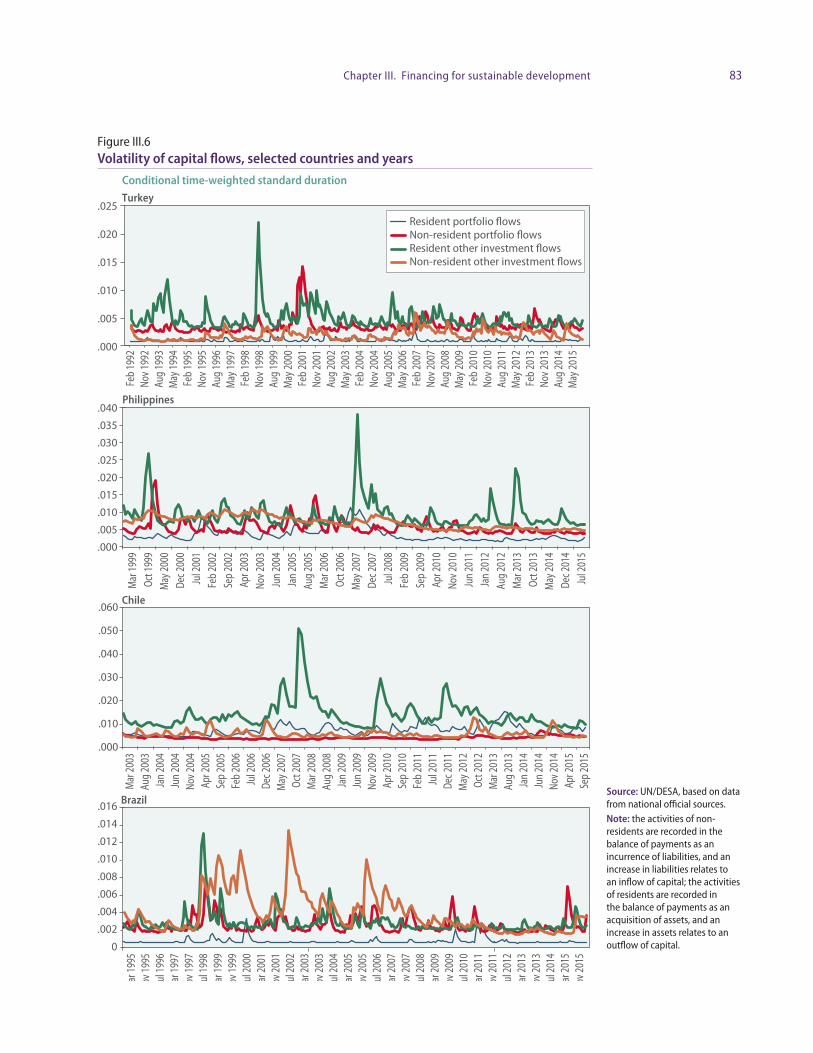
Figure III.6 shows volatility of portfolio investment and other investment, as meas-ured by the conditional, time-weighted standard deviation,4 disaggregated by residents and non-residents, for four of these countries. The data available through 2015 shows that vola tility levels, including through the periods of expectations of monetary policy normali-
4 Use of standard deviation as a measure for volatility of capital flows is problematic because of illiquid markets, non-random behaviour by market actors, and heteroscedasticity – meaning the exhibition of non-uniform behaviour over time. These volatility estimates were generated using a database of monthly disaggregated capital flow data from national official sources. Instead of traditional standard deviations, an autoregressive model was specified and uses both values of past variances and the obser-vations themselves to model the variance at a particular point in time. The generalized autoregressive conditionally heteroscedastic (GARCH) model uses both the lagged squared residual and the lagged conditional variance to estimate a time-weighted conditional standard deviation (Bollerslev, 1986).
There are persistent spikes of volatility in
capital flows at certain times and in certain
countries
0.0%
0.1%
0.2%
0.3%
0.4%
0.5%
0.6%
0.7%
0.8%
Turkey Philippines Poland Chile Brazil
Percentage of GDP
Resident portfolio flowsNon-resident portfolio flowsResident other investment flowsNon-resident other investment flows
Figure III.5 Volume of portfolio and other investment flows, selected countries and years
Source: UN/DESA calculations based on official national data.
Note: The figure shows the magnitude of average gross
movements of capital. The average was calculated using the
absolute value of each month’s flows divided by the GDP of the
year in which that flow occurred. Data through December 2015
and starting from: 1992 (Turkey), 1995 (Brazil), 1997 (Poland), 1999
(Philippines) and 2003 (Chile).
83Chapter III. Financing for sustainable development
Turkey
Philippines
Chile
Brazil
.000
.005
.010
.015
.020
.025
Conditional time-weighted standard duration
Resident portfolio flowsNon-resident portfolio flowsResident other investment flowsNon-resident other investment flows
Feb
1992
Nov 1
992
Aug
1993
May
199
4Fe
b 19
95No
v 199
5Au
g 19
96M
ay 1
997
Feb
1998
Nov 1
998
Aug
1999
May
200
0Fe
b 20
01No
v 200
1Au
g 20
02M
ay 2
003
Feb
2004
Nov 2
004
Aug
2005
May
200
6Fe
b 20
07No
v 200
7Au
g 20
08M
ay 2
009
Feb
2010
Nov 2
010
Aug
2011
May
201
2Fe
b 20
13No
v 201
3Au
g 20
14M
ay 2
015
.000
.005
.010
.015
.020
.025
.030
.035
.040
Mar
1999
Oct 1
999
May
2000
Dec 2
000
Jul 2
001
Feb
2002
Sep
2002
Apr 2
003
Nov 2
003
Jun
2004
Jan
2005
Aug
2005
Mar
2006
Oct 2
006
May
2007
Dec 2
007
Jul 2
008
Feb
2009
Sep
2009
Apr 2
010
Nov 2
010
Jun
2011
Jan
2012
Aug
2012
Mar
2013
Oct 2
013
May
2014
Dec 2
014
Jul 2
015
Mar
2003
Aug
2003
Jan
2004
Jun
2004
Nov 2
004
Apr 2
005
Sep
2005
Feb
2006
Jul 2
006
Dec 2
006
May
2007
Oct 2
007
Mar
2008
Aug
2008
Jan
2009
Jun
2009
Nov 2
009
Apr 2
010
Sep
2010
Feb
2011
Jul 2
011
Dec 2
011
May
2012
Oct 2
012
Mar
2013
Aug
2013
Jan
2014
Jun
2014
Nov 2
014
Apr 2
015
Sep
2015
Mar
1995
Nov 1
995
Jul 1
996
Mar
1997
Nov 1
997
Jul 1
998
Mar
1999
Nov 1
999
Jul 2
000
Mar
2001
Nov 2
001
Jul 2
002
Mar
2003
Nov 2
003
Jul 2
004
Mar
2005
Nov 2
005
Jul 2
006
Mar
2007
Nov 2
007
Jul 2
008
Mar
2009
Nov 2
009
Jul 2
010
Mar
2011
Nov 2
011
Jul 2
012
Mar
2013
Nov 2
013
Jul 2
014
Mar
2015
Nov 2
015
.000
.010
.020
.030
.040
.050
.060
0
.002
.004
.006
.008
.010
.012
.014
.016
Figure III.6 Volatility of capital flows, selected countries and years
Source: UN/DESA, based on data from national official sources. Note: the activities of non-residents are recorded in the balance of payments as an incurrence of liabilities, and an increase in liabilities relates to an inflow of capital; the activities of residents are recorded in the balance of payments as an acquisition of assets, and an increase in assets relates to an outflow of capital.
84 World Economic Situation and Prospects 2017
sation in the United States in 2014 and 2015, have remained low, and not reached the peaks seen at times of domestic financial crises in the past. While there is no discernible trend toward increasing volatility over time, there are persistent high volatility spikes at certain times and in certain countries.
The charts also show that volatility is often driven by global systemic risk. For exam-ple, volatility spiked across countries during the 1998-2000 emerging market crises and the 2007-2008 global financial crisis.5 However, other spikes in volatility correspond to idio-syncratic risks, based on domestic factors. For example, the notably high average number of months of elevated volatility of non-resident other investment in the Philippines, as shown in table III.2, corresponds to a prolonged bout of elevated volatility in 1999 and the early 2000s, which has diminished along with the volume of capital flows as a share of GDP since the 2008 crisis.
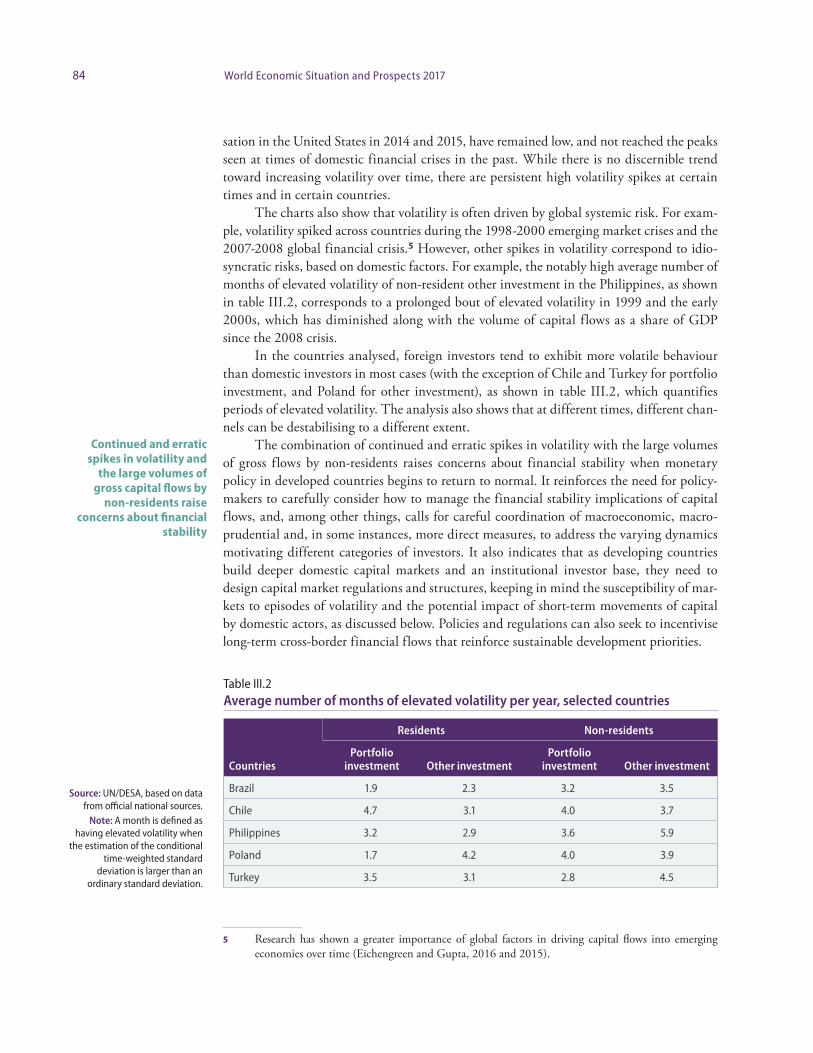
In the countries analysed, foreign investors tend to exhibit more volatile behaviour than domestic investors in most cases (with the exception of Chile and Turkey for portfolio investment, and Poland for other investment), as shown in table III.2, which quantifies periods of elevated volatility. The analysis also shows that at different times, different chan-nels can be destabilising to a different extent.
The combination of continued and erratic spikes in volatility with the large volumes of gross flows by non-residents raises concerns about financial stability when monetary policy in developed countries begins to return to normal. It reinforces the need for policy-makers to carefully consider how to manage the financial stability implications of capital flows, and, among other things, calls for careful coordination of macroeconomic, macro- prudential and, in some instances, more direct measures, to address the varying dynamics motivating different categories of investors. It also indicates that as developing countries build deeper domestic capital markets and an institutional investor base, they need to design capital market regulations and structures, keeping in mind the susceptibility of mar-kets to episodes of volatility and the potential impact of short-term movements of capital by domestic actors, as discussed below. Policies and regulations can also seek to incentivise long-term cross-border financial flows that reinforce sustainable development priorities.
5 Research has shown a greater importance of global factors in driving capital flows into emerging economies over time (Eichengreen and Gupta, 2016 and 2015).
Continued and erratic spikes in volatility and
the large volumes of gross capital flows by
non-residents raise concerns about financial
stability
Table III.2 Average number of months of elevated volatility per year, selected countries
Residents Non-residents
CountriesPortfolio
investment Other investmentPortfolio
investment Other investment
Brazil 1.9 2.3 3.2 3.5
Chile 4.7 3.1 4.0 3.7
Philippines 3.2 2.9 3.6 5.9
Poland 1.7 4.2 4.0 3.9
Turkey 3.5 3.1 2.8 4.5
Source: UN/DESA, based on data from official national sources.
Note: A month is defined as having elevated volatility when
the estimation of the conditional time-weighted standard
deviation is larger than an ordinary standard deviation.
85Chapter III. Financing for sustainable development
Incentives to align institutional investment with sustainable development
Institutional investors have been looked to as a potential source of financing for sustainable development, both because of the size of assets under their management, and because of the long-term liabilities of some investors, which should enable the longer-term investment necessary for sustainable development. Around $78 trillion of the total $115 trillion in in-stitutional investor assets at the end 2014 is held by “primary” institutional investors, such as pension funds, insurance companies, and sovereign wealth funds (SWFs), with long-du-ration liabilities (TheCityUK, 2015).
A reallocation of a small percentage of institutional investor assets, say 3 to 5 per cent, towards long-term investment in sustainable development could have an enormous impact. Yet, a shift of even this relatively small percentage will be extremely challenging. Indeed, it is unlikely to happen without a significant shift in behaviour, necessitating changes in both private actions and public policies. This is because the incentives in capital markets are not well-aligned with long-term investment or with sustainable development.
To date, investment by institutional investors in long-term illiquid assets necessary for sustainable development has been limited — in both developed and developing countries. For instance, direct investment in infrastructure globally represents less than 3 per cent of pension fund assets, with even lower allocations to infrastructure in developing countries and low-carbon infrastructure (Della Croce, 2012). This low level of investment reflects the duality of illiquidity of assets on the one hand and a short-term investment horizon of institutional investors on the other, as manifested in the volatility of international portfolio flows to developing countries, as well as in volatility in developed-country capital markets. In the United States, for example, the average holding period for stocks fell from about eight years in the 1960s to approximately six months in 2010 (Kleintop, 2012).
In this regard, the AAAA includes a commitment by Member States of the United Nations to “endeavour to design policies, including capital market regulations where appro-priate, that promote incentives along the investment chain that are aligned with long-term performance and sustainability indicators, and that reduce excess volatility.” While there has been significant research on impediments to investment at the country level, includ-ing regulatory uncertainty and weak governance, imperfect information and other market failures, there is less research on impediments on the investor side. In this regard, an under-standing of the incentives across the full range of players in capital markets, particularly for long-term investing, is crucial.
For the purpose of financing long-term sustainable development, long-term invest-ment should meet two criteria: the investor’s time horizon should be sufficiently long to finance long-duration assets of say, 10 to 20 years, and the investor should be able to hold a position through economic cycles and downside events. In other words, long-term investors should have the willingness not only to buy long-term illiquid assets, but also the ability to hold these assets for a full holding period, irrespective of market pressures. For example, managers that invested in long-duration illiquid assets funded by short-term liabilities prior to the global economic and financial crisis were forced to sell these assets when liquidity became scarce and debt refinancing became difficult. This was seen in the fields of renew-able energy and biofuels.
While investment in renewable energy grew by 85 per cent in 2007, it fell by 42 per cent during the crisis. When investment and financing dried up, many companies were
The incentives in capital markets are not well- aligned with long-term investment or with sustainable development
To analyse the impediments to long-term investment, we must understand the incentives of investors in capital markets
86 World Economic Situation and Prospects 2017
forced to exit the market and/or file for bankruptcy (IEA, 2009). Investors’ inability to maintain illiquid positions through the crisis had severe implications for investments in sustainable development as well as for the real economy.
Indeed, for investors able to hold long-term positions, buying and holding illiquid assets should be a profitable strategy. Short-term investors that need liquidity are often willing to pay a higher price for liquid assets; hence long-term investors can buy cheaper illiquid assets, and earn the higher return, or the “liquidity premium”. In essence, they can arbitrage the short-term nature of markets, buying illiquid assets when the liquidity premi-um is high, and selling them when it is low. They would also play a stabilizing role in the market because they act counter-cyclically to liquidity cycles.
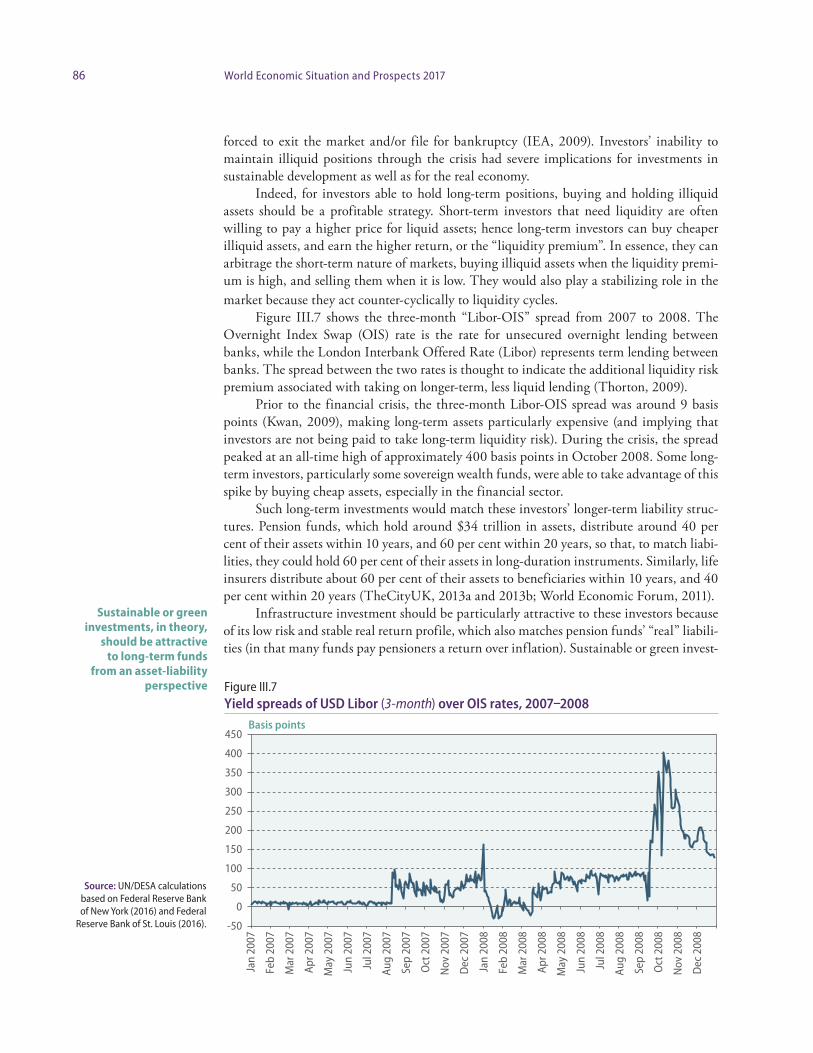
Figure III.7 shows the three-month “Libor-OIS” spread from 2007 to 2008. The Overnight Index Swap (OIS) rate is the rate for unsecured overnight lending between banks, while the London Interbank Offered Rate (Libor) represents term lending between banks. The spread between the two rates is thought to indicate the additional liquidity risk premium associated with taking on longer-term, less liquid lending (Thorton, 2009).
Prior to the financial crisis, the three-month Libor-OIS spread was around 9 basis points (Kwan, 2009), making long-term assets particularly expensive (and implying that investors are not being paid to take long-term liquidity risk). During the crisis, the spread peaked at an all-time high of approximately 400 basis points in October 2008. Some long-term investors, particularly some sovereign wealth funds, were able to take advantage of this spike by buying cheap assets, especially in the financial sector.
Such long-term investments would match these investors’ longer-term liability struc-tures. Pension funds, which hold around $34 trillion in assets, distribute around 40 per cent of their assets within 10 years, and 60 per cent within 20 years, so that, to match liabi-lities, they could hold 60 per cent of their assets in long-duration instruments. Similarly, life insurers distribute about 60 per cent of their assets to beneficiaries within 10 years, and 40 per cent within 20 years (TheCityUK, 2013a and 2013b; World Economic Forum, 2011).
Infrastructure investment should be particularly attractive to these investors because of its low risk and stable real return profile, which also matches pension funds’ “real” liabili-ties (in that many funds pay pensioners a return over inflation). Sustainable or green invest-
Sustainable or green investments, in theory,
should be attractive to long-term funds
from an asset-liability perspective Figure III.7
Yield spreads of USD Libor (3-month) over OIS rates, 2007–2008
Source: UN/DESA calculations based on Federal Reserve Bank of New York (2016) and Federal
Reserve Bank of St. Louis (2016).
Basis points
Jan
2007
Feb
2007
Mar
200
7
Apr 2
007
May
200
7
Jun
2007
Jul 2
007
Aug
2007
Sep
2007
Oct
200
7
Nov
200
7
Dec
200
7
Jan
2008
Feb
2008
Mar
200
8
Apr 2
008
May
200
8
Jun
2008
Jul 2
008
Aug
2008
Sep
2008
Oct
200
8
Nov
200
8
Dec
200
8
-50
0
50
100
150
200
250
300
350
400
450
87Chapter III. Financing for sustainable development
ments, in theory, should be attractive to long-term funds from an asset-liability perspective, since the risks associated with climate change can be seen as a potential liability in the long run (Bolton and others, 2010).
Nonetheless, and despite their ability to arbitrage short-termism, most primary inter-mediaries have traditionally held relatively liquid portfolios. The largest pension markets hold 76 per cent of their portfolios in liquid assets (Willis Towers Watson, 2016). The majority of insurance assets are liquid securities, with 70 per cent in bonds and 10 per cent in equities in the United States (National Association of Insurance Commissioners, 2011), and 90 per cent in bonds, and 7 per cent in equities in Europe (Deutsche Bank, 2011). Many SWFs hold the bulk of their funds in liquid financial assets in the mature economies, with less than 5 per cent in direct investments (UNCTAD, 2013b). Since the financial crisis, however, an important trend has been a substantial increase in institutional investor allocation to less liquid alternative investments, particularly by pension funds. Allocations to alternative asset classes increased from around 5 per cent in 1995 to around 19 per cent in 2012 in the largest pension markets (Towers Watson, 2013) and around 7 per cent overall (Prosser, 2013).
However, much of this increase is being outsourced to secondary financial interme-diaries, such as private equity firms and hedge funds. Those intermediary funds, many of which were designed for high net worth individuals willing to take high risks, are not necessarily well-aligned with either the interest of the investors, or with public goals. In particular, many have shorter-term liabilities and/or incorporate a greater degree of short-term incentives in compensation, neither of which is conducive to long-term sustainable investment.
The fee structure (of a 2 per cent management fee and 20 per cent performance fee) is characterized by asymmetric returns — managers have a potential upside monetary gain but no downside penalty when losses are realized. This asymmetry provides strong incen-tives for managers to increase risk and leverage in order to boost short-term returns.6
Hedge funds are often highly leveraged, with quarterly, semi-annual, or annual redemptions, and are not well-suited for long-term investment. Private equity funds are longer-term, and typically feature a maturity of ten years with two optional one-year exten-sions. However, the private equity investment approach is generally built around an “exit strategy”, based on buying risky assets, transforming them, and selling them to investors who might have been unwilling or unable to take the initial high risks. While this can play an important role in financing the economy, it is not clear that these are appropriate as long-term investment vehicles, especially given the relatively low risk tolerance of pension funds and other primary intermediaries. Infrastructure funds are a case in point. While infrastructure investment in developed countries is generally more stable and less correlated with market indices than private equity, infrastructure funds are less stable and are, in fact, correlated with market indices (Bitsch and others, 2010). This is partially attributable to the effect of the exit strategy, which links returns on the fund to the exit price, making the returns susceptible to market sentiment.
Other institutional factors can also have an impact. First, the structure of the firm affects incentives. For example, in the case of a publicly traded insurance company, share-holders may have a much shorter time horizon than policyholders and may encourage man-
6 This issue is mitigated to an extent for private equity funds, which only receive performance fees on realized gains, once an asset has been sold. Nonetheless, managers can still earn performance fees by selling profitable assets, even when all other assets in the fund are at an unrealized loss.
The interests of intermediary funds are not necessarily well- aligned with either institutional investors’ interests or with public goals
88 World Economic Situation and Prospects 2017
agers to shift the portfolio towards a shorter horizon. Second, both long-term and riskier investments will have losses in the short-term. If trustees, senior managers, or in the case of public pension funds and SWFs, politicians, do not have appetite for short-term losses it will be difficult for managers to maintain longer-term positions. Third, the high mobi-lity of portfolio managers between firms may represent a further disincentive to long-term investing, as managers can earn a high bonus, and then move to another firm before the “tail-risk” has materialized.
For instance, the average tenure of a chief investment officer of a public pension plan is four years, with even shorter periods for more junior staff (World Economic Forum, 2011). Finally, firm culture can affect investment strategies, including how fiduciary responsibil-ities and non-financial impacts are viewed and taken into account in performance evalua-tions of individual managers.
In addition, many managers lack in-house expertise in certain sectors, such as infra-structure and new technologies. Facing increased pressure to reduce costs, public funds are sometimes unable to pay salaries and bonuses that compete with other areas of finance. While this has benefits from the perspective of incentives as discussed above, it makes it dif-ficult to attract the best talent and build expertise, especially in new areas. As a result many primary intermediaries are increasing their exposure to alternatives by investing through external managers.
Regulations and accounting standards can reduce the appetite for long-term invest-ment. In the insurance sector, Solvency II in the European Union includes new capital ade-quacy and risk management requirements, which impose higher costs for riskier holdings, based on maturity and credit rating, thus penalizing both long-term investment and invest-ment in riskier assets. The new requirements include the need for equities to be backed by reserves of 30-40 per cent, which has further strengthened the trend, started after the crisis, of insurers reducing exposure to equities.
Mark-to-market accounting also impacts investors’ ability to hold positions over the long term. Mark-to-market accounting values assets based on daily market prices in the open market. While this reflects the most up-to-date valuations, it also incorporates short-term market fluctuations into portfolio asset values. This can be particularly problematic for illiquid assets that only trade infrequently, as daily price fluctuations often do not reflect the intrinsic value of the assets. Managers whose incentives are linked to the value of assets under management and their returns are often incentivized to readjust their portfolios based on these short-term movements.
Many pension funds are subject to minimum funding, accounting and other require-ments. While these rules are important for ensuring solvency, combined with mark-to-mar-ket accounting, they can inhibit long-term investment. For example, during the crisis, some pension funds breached their funding ratios due to a collapse in prices.
The decline in prices was largely due to the liquidity crisis, and not due to the sol-vency of the underlying assets, and many asset prices later rebounded. Nonetheless, some pension funds had to reduce risk to meet ratios, forcing some to sell, and inhibiting others from buying cheap long-term assets during the crisis.
In addition to the long-term horizon of investments, the AAAA notes that financing flows need to be aligned with sustainable development. This can be done through various policy mixes, including pricing externalities, blended finance and guarantees and leverag-ing private investment through public intermediaries such as development banks.
Regulations and accounting standards
can reduce the appetite for long-term investment
Aligning financing flows with sustainable
development can be done through various
policies
89Chapter III. Financing for sustainable development
Box III.1 Emerging markets’ corporate debt
Recent years have been marked by growing concerns about financial fragility in emerging economies and, in particular, about fast rising corporate debt in these economies. According to the BIS, the debt of non-financial corporations in emerging and large developing economiesa more than tripled from $7.6 trillion at the end of 2008 to $24.5 trillion in the first quarter of 2016, reaching just over 100 per cent of GDP on average.
This rapid increase of corporate debt in emerging economies has taken place against a back-ground of highly volatile international capital flows. Between 2009 and mid-2014, these economies faced a deluge of financial inflows and cheap credit through bank loans and bonds, driven largely by low in-terest rate policies and extensive asset purchasing programmes (quantitative easing) in major advanced economies. With yields on financial assets in the main financial centres dramatically lowered through these policies, investors adjusted their portfolios to include more “high-risk high-yield” assets in emerg-ing markets, widely considered, at the time, to have “decoupled” from troubled developed economies and capable of delivering self-sustained high growth.
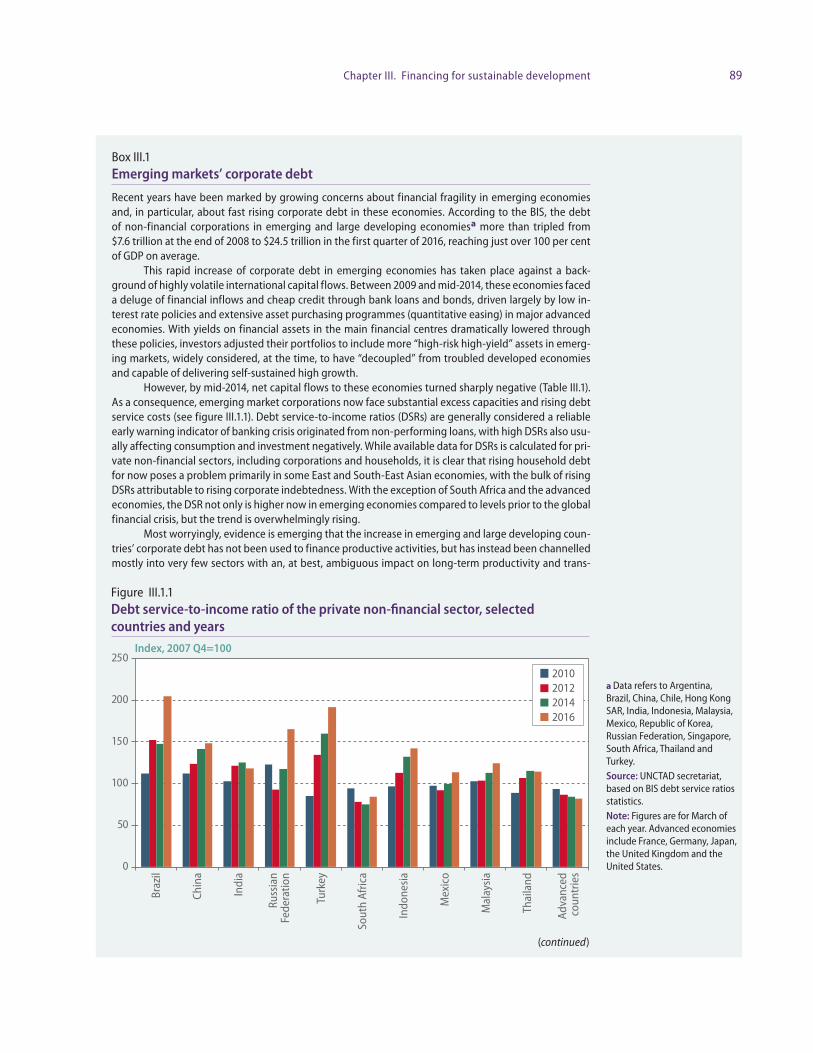
However, by mid-2014, net capital flows to these economies turned sharply negative (Table III.1). As a consequence, emerging market corporations now face substantial excess capacities and rising debt service costs (see figure III.1.1). Debt service-to-income ratios (DSRs) are generally considered a reliable early warning indicator of banking crisis originated from non-performing loans, with high DSRs also usu-ally affecting consumption and investment negatively. While available data for DSRs is calculated for pri-vate non-financial sectors, including corporations and households, it is clear that rising household debt for now poses a problem primarily in some East and South-East Asian economies, with the bulk of rising DSRs attributable to rising corporate indebtedness. With the exception of South Africa and the advanced economies, the DSR not only is higher now in emerging economies compared to levels prior to the global financial crisis, but the trend is overwhelmingly rising.
Most worryingly, evidence is emerging that the increase in emerging and large developing coun-tries’ corporate debt has not been used to finance productive activities, but has instead been channelled mostly into very few sectors with an, at best, ambiguous impact on long-term productivity and trans-
(continued)
Figure III.1.1 Debt service-to-income ratio of the private non-financial sector, selected countries and years
a Data refers to Argentina, Brazil, China, Chile, Hong Kong SAR, India, Indonesia, Malaysia, Mexico, Republic of Korea, Russian Federation, Singapore, South Africa, Thailand and Turkey. Source: UNCTAD secretariat, based on BIS debt service ratios statistics. Note: Figures are for March of each year. Advanced economies include France, Germany, Japan, the United Kingdom and the United States.
Index, 2007 Q4=100
0
50
100
150
200
250
Braz
il
Chin
a
Indi
a
Russ
ian
Fede
ratio
n
Turk
ey
Sout
h Af
rica
Indo
nesi
a
Mex
ico
Mal
aysi
a
Thai
land
Adva
nced
coun
trie
s
2010201220142016
90 World Economic Situation and Prospects 2017
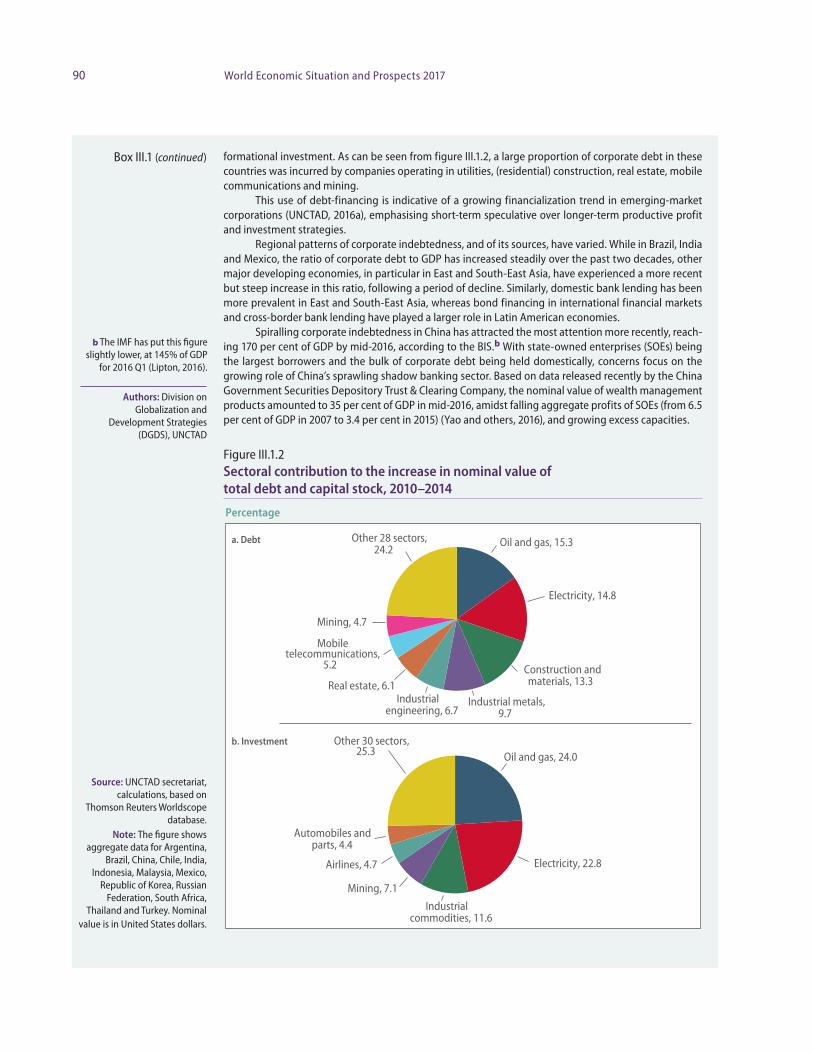
formational investment. As can be seen from figure III.1.2, a large proportion of corporate debt in these countries was incurred by companies operating in utilities, (residential) construction, real estate, mobile communications and mining.
This use of debt-financing is indicative of a growing financialization trend in emerging-market corporations (UNCTAD, 2016a), emphasising short-term speculative over longer-term productive profit and investment strategies.
Regional patterns of corporate indebtedness, and of its sources, have varied. While in Brazil, India and Mexico, the ratio of corporate debt to GDP has increased steadily over the past two decades, other major developing economies, in particular in East and South-East Asia, have experienced a more recent but steep increase in this ratio, following a period of decline. Similarly, domestic bank lending has been more prevalent in East and South-East Asia, whereas bond financing in international financial markets and cross-border bank lending have played a larger role in Latin American economies.
Spiralling corporate indebtedness in China has attracted the most attention more recently, reach-ing 170 per cent of GDP by mid-2016, according to the BIS.b With state-owned enterprises (SOEs) being the largest borrowers and the bulk of corporate debt being held domestically, concerns focus on the growing role of China’s sprawling shadow banking sector. Based on data released recently by the China Government Securities Depository Trust & Clearing Company, the nominal value of wealth management products amounted to 35 per cent of GDP in mid-2016, amidst falling aggregate profits of SOEs (from 6.5 per cent of GDP in 2007 to 3.4 per cent in 2015) (Yao and others, 2016), and growing excess capacities.
Figure III.1.2 Sectoral contribution to the increase in nominal value of total debt and capital stock, 2010–2014
b The IMF has put this figure slightly lower, at 145% of GDP
for 2016 Q1 (Lipton, 2016).
Source: UNCTAD secretariat, calculations, based on
Thomson Reuters Worldscope database.
Note: The figure shows aggregate data for Argentina,
Brazil, China, Chile, India, Indonesia, Malaysia, Mexico,
Republic of Korea, Russian Federation, South Africa,
Thailand and Turkey. Nominal value is in United States dollars.
Authors: Division on Globalization and
Development Strategies (DGDS), UNCTAD
Percentage
Oil and gas, 15.3
Electricity, 14.8
Construction and materials, 13.3
Industrial metals, 9.7
Industrial engineering, 6.7
Real estate, 6.1
Mobile telecommunications,
5.2
Mining, 4.7
Other 28 sectors, 24.2
Oil and gas, 24.0
Electricity, 22.8
Industrial commodities, 11.6
Mining, 7.1
Airlines, 4.7
Automobiles and parts, 4.4
Other 30 sectors, 25.3
a. Debt
b. Investment
Box III.1 (continued)
91Chapter III. Financing for sustainable development
It can also be included in the financial governance architecture. For example, the Central Bank of Brazil focuses on socio-environmental risk management flows as part of its core functions as a prudential bank regulator; the Bangladesh Bank supports rural enter-prises and green finance; and the Bank of England has a prudential review of climate risks for the United Kingdom’s insurance sector based on a connection between its core pruden-tial duties and the United Kingdom Climate Change Act (for example, see UNEP, 2016 and 2015).
Trends in public resource flows Public sources of financing are indispensable to making progress in key areas of sustaina-ble development. It is primarily the public sector that addresses unmet social needs of the population, takes action to relieve poverty, finances health care and education for all, and provides funding for infrastructure investments and basic research. In most countries, these tasks are overwhelmingly funded through public domestic resource mobilization.
In addition, from a broader perspective, public spending can be employed to promote equity and stability in a country, which are widely considered to be among the core func-tions of the state. Therefore, domestic resource mobilization to finance their provision is also important for the state’s legitimacy.
At the same time, developing countries and LDCs, land locked developing countries, SIDS and conflict-affected countries in particular — also rely on ODA and other exter-nal sources to finance public expenditure. In the LDCs for example, concessional public finance represents over 70 per cent of all external financing available to close the savings gap (OECD, 2014).
As noted in the AAAA, international public finance complements efforts by develop-ing countries to raise such resources domestically. In addition, international public finance has an important role to play in financing global public goods. The provision of interna-tional public finance, including ODA from Members of the OECD Development Assis-tance Committee (DAC) and lending by MDBs, has increased between 2014 and 2015 (see the section on the provision of international public finance), continuing a rising trend since the turn of the millennium.
In addition, the provision of international public finance from developing countries — in the form of South-South cooperation and more recently through the establishment of two new development banks — has risen commensurate with rapid growth in developing countries. Despite this expansion, international public financial flows remain insufficient to fill the financing gap for public investments in sustainable development, particularly in developing countries with limited ability to increase domestic resource mobilization (see the section on cross-border aid flows). Partly in response to this shortfall, and partly due to the favourable financing conditions, developing countries have also increased borrowing from capital markets. Sovereign bond issuances in particular have increased significantly, raising concerns over debt sustainability (see the section on debt and debt sustainability).
Provision of international public financeODA from Members of the OECD DAC amounted to $131.6 billion in 2015, represent-ing an increase of 6.9 per cent in constant prices and exchange rates (“real terms”) over 2014. Additional spending on refugees reported as ODA accounts for a major share of this increase. Stripping out funds spent on refugees, 2015 aid increased by 1.7 per cent in real
International public financial flows remain insufficient to fill the financing gap for public investments in sustainable development
92 World Economic Situation and Prospects 2017
terms from 2014. This continues a long-term rising trend in ODA, which has increased by 83 per cent in real terms since the adoption of the Millennium Declaration in 2000.
However, at 0.3 per cent of gross national income (GNI) of OECD DAC members, ODA falls short of the commitment by many developed countries to provide ODA equiv-alent to 0.7 per cent of GNI. Only six countries — Denmark (0.85 per cent), Luxembourg (0.93 per cent), the Netherlands (0.76 per cent), Norway (1.05 per cent), Sweden (1.4 per cent) and the United Kingdom (0.71 per cent) — met or exceeded the United Nations tar-get of providing ODA equivalent to 0.7 per cent of GNI in 2015 (OECD, 2016a).
Preliminary figures by the OECD indicate that ODA to LDCs increased in 2015 for the first time in several years. Bilateral aid to LDCs rose by 4 per cent in real terms in 2015 from the previous year, amounting to $25 billion. This represents a reversal of the earlier trend of falling ODA to LDCs. In 2014, the latest year for which comprehensive data is available, total ODA from DAC members to LDCs was $41 billion or 0.09 per cent of GNI, significantly below the UN targets of 0.15-0.20 per cent.
Denmark, Finland, Luxembourg, Norway, Sweden and the United Kingdom provid-ed ODA to LDCs in excess of 0.2 per cent of their GNI, while Belgium and Ireland provid-ed between 0.15 and 0.2 per cent (OECD, 2016a). The 2015 data will reflect the recent rise in ODA to LDCs, and the OECD survey of donor spending plans through 2019 (OECD, 2016b) suggests that ODA flows to LDCs will continue to rise.
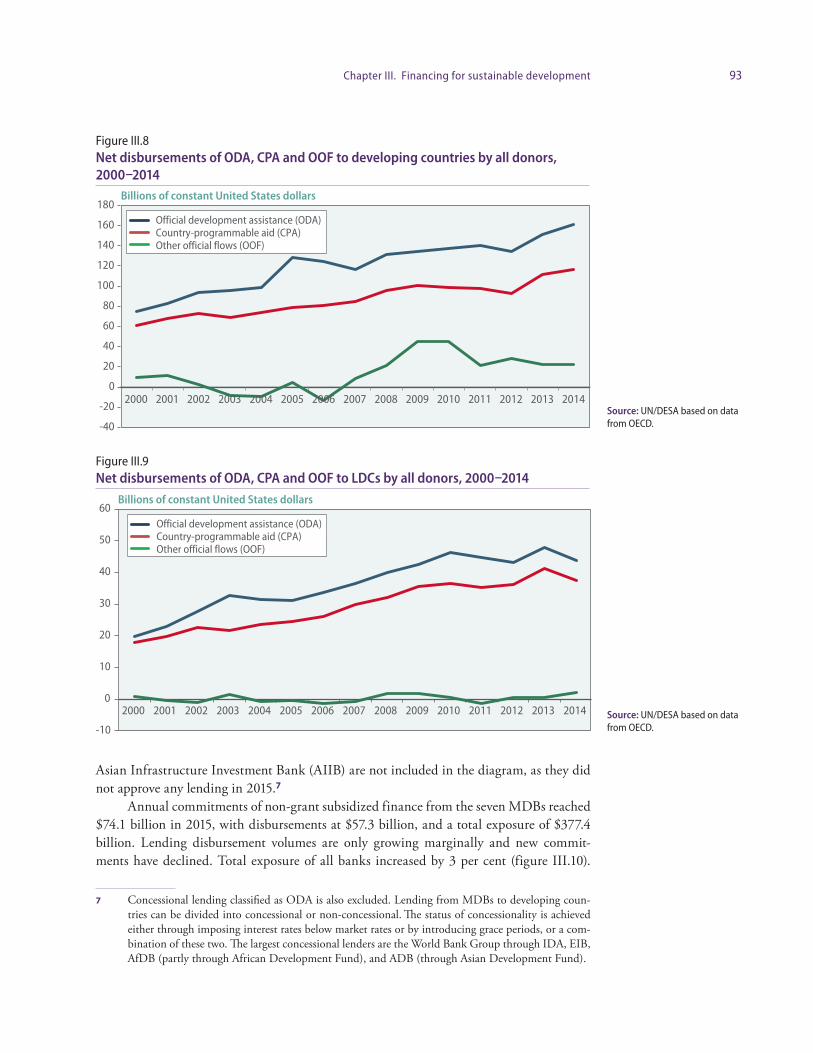
Donors who report their aid to the DAC also report other official flows (OOF) toward ODA-eligible countries — these include flows that do not meet the concessionality criteria of ODA, such as non-concessional lending by bilateral providers and multilateral development banks, and export credits. Net disbursements of total official flows (ODA and OOF), including from a number of countries that are not members of the DAC but report their transactions to the OECD, amounted to $183 billion in 2014 for all developing countries. In LDCs, OOF and non-concessional lending in particular play a much smaller role (figures III.8 and III.9).
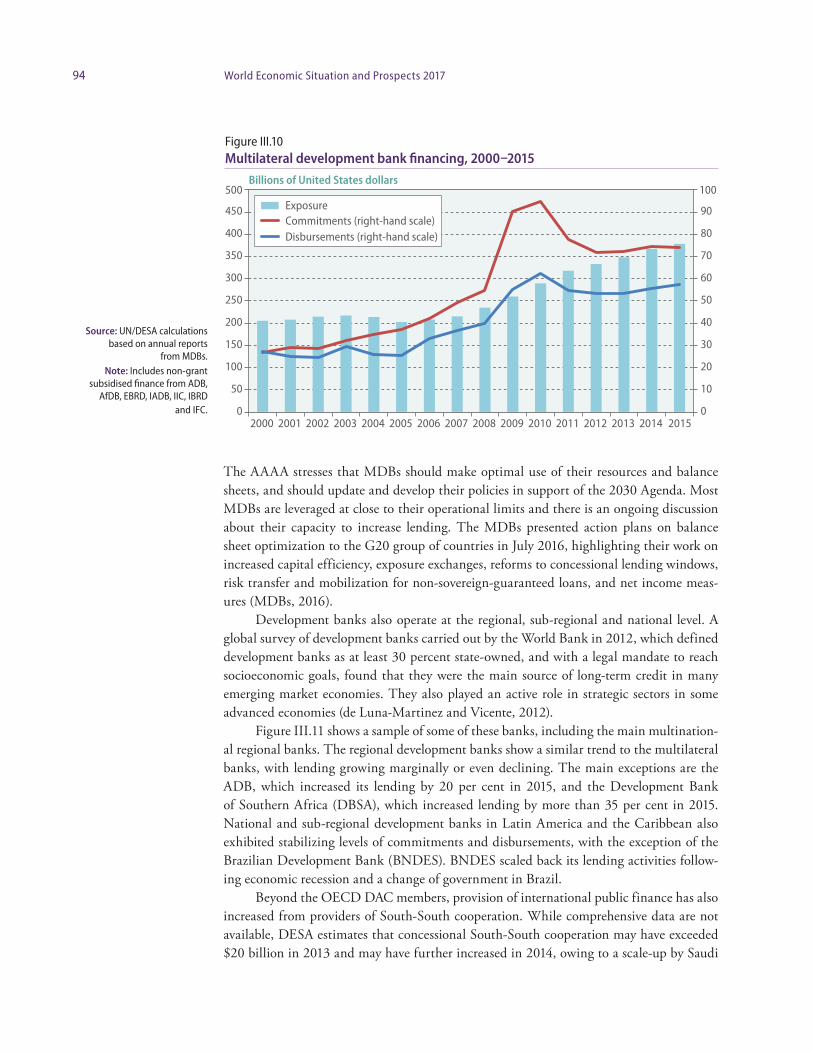
Other official flows contain lending by MDBs disbursed to developing countries. The AAAA recognizes the significant potential of MDBs to provide stable, long-term finance for sustainable development investments. Overall, MDBs’ disbursements increased only marginally in 2015. The World Bank’s International Bank for Reconstruction and Development (IBRD) commitments rose sharply to $23.5 billion in 2015 over 2014 (World Bank, 2016c).
At the same time, the International Finance Corporation (IFC), the private sector arm of the World Bank Group, saw a decline in lending to $10.5 billion. Commitments by the World Bank’s concessional lending arm, the International Development Association (IDA), which relies on donor contributions to provide concessional credits and grants to low-income countries, have grown in nominal terms over the past five years, but did expe-rience a decline from 2014 to 2015 (World Bank, 2016c). The last IDA replenishment, agreed in 2013, saw an increase in pledges of 5 per cent in nominal terms over the sixteenth replenishment round in 2010, but growth was broadly flat in real terms (IDA, 2014).
Figure III.10 displays recent trends in MDB lending for the African Development Bank (AfDB), Asian Development Bank (ADB), European Bank for Reconstruction and Development (EBRD), Inter-American Development Bank (IDB), Inter-American Invest-ment Corporation (IIC), International Bank for Reconstruction and Development (IBRD), and International Finance Corporation (IFC). The New Development Bank (NDB) and
Spending plans through 2019 suggests that ODA flows to LDCs
will continue to rise, reversing the earlier
decline
MDBs’ disbursements increased only
marginally in 2015
93Chapter III. Financing for sustainable development
Asian Infrastructure Investment Bank (AIIB) are not included in the diagram, as they did not approve any lending in 2015.7
Annual commitments of non-grant subsidized finance from the seven MDBs reached $74.1 billion in 2015, with disbursements at $57.3 billion, and a total exposure of $377.4 billion. Lending disbursement volumes are only growing marginally and new commit-ments have declined. Total exposure of all banks increased by 3 per cent (figure III.10).
7 Concessional lending classified as ODA is also excluded. Lending from MDBs to developing coun-tries can be divided into concessional or non-concessional. The status of concessionality is achieved either through imposing interest rates below market rates or by introducing grace periods, or a com-bination of these two. The largest concessional lenders are the World Bank Group through IDA, EIB, AfDB (partly through African Development Fund), and ADB (through Asian Development Fund).
Figure III.8 Net disbursements of ODA, CPA and OOF to developing countries by all donors, 2000–2014
Figure III.9 Net disbursements of ODA, CPA and OOF to LDCs by all donors, 2000–2014
Source: UN/DESA based on data from OECD.
Source: UN/DESA based on data from OECD.
Billions of constant United States dollars
-40
-20
0
20
40
60
80
100
120
140
160
180
2000 2001 2002 2003 2004 2005 2006 2007 2008 2009 2010 2011 2012 2013 2014
Official development assistance (ODA)Country-programmable aid (CPA)Other official flows (OOF)
Billions of constant United States dollars
Official development assistance (ODA)Country-programmable aid (CPA)Other official flows (OOF)
-10
0
10
20
30
40
50
60
2000 2001 2002 2003 2004 2005 2006 2007 2008 2009 2010 2011 2012 2013 2014
94 World Economic Situation and Prospects 2017
The AAAA stresses that MDBs should make optimal use of their resources and balance sheets, and should update and develop their policies in support of the 2030 Agenda. Most MDBs are leveraged at close to their operational limits and there is an ongoing discussion about their capacity to increase lending. The MDBs presented action plans on balance sheet optimization to the G20 group of countries in July 2016, highlighting their work on increased capital efficiency, exposure exchanges, reforms to concessional lending windows, risk transfer and mobilization for non-sovereign-guaranteed loans, and net income meas-ures (MDBs, 2016).
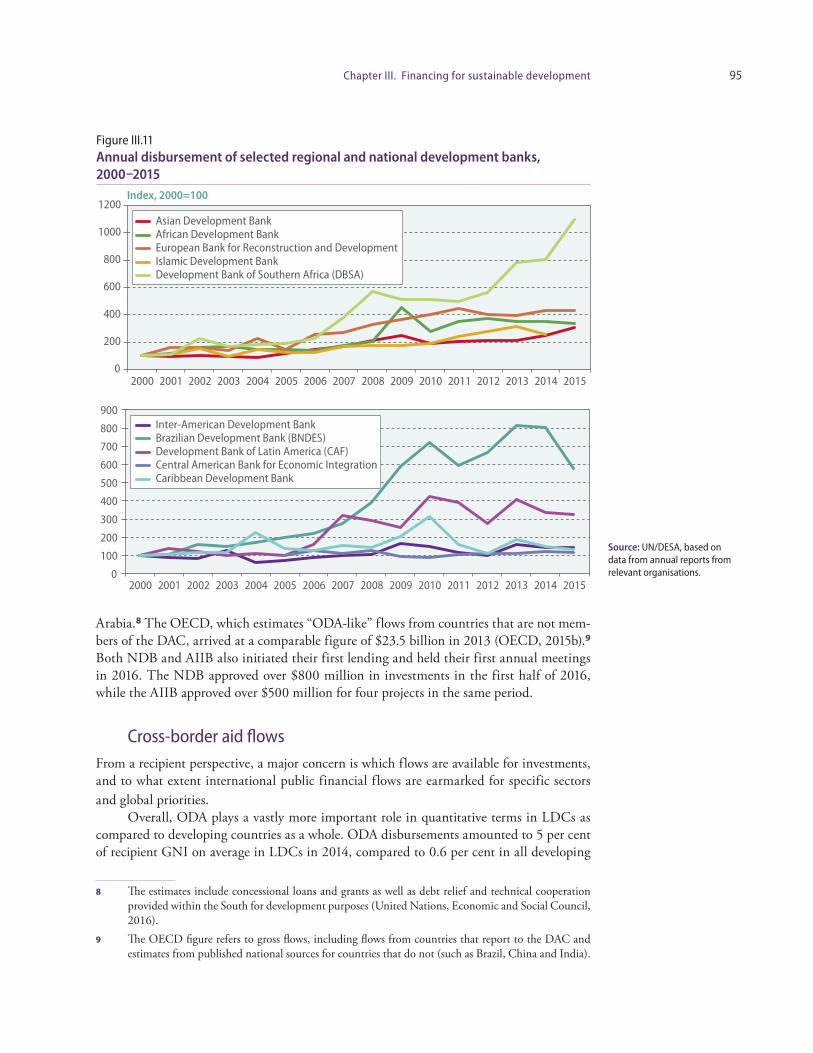
Development banks also operate at the regional, sub-regional and national level. A global survey of development banks carried out by the World Bank in 2012, which defined development banks as at least 30 percent state-owned, and with a legal mandate to reach socioeconomic goals, found that they were the main source of long-term credit in many emerging market economies. They also played an active role in strategic sectors in some advanced economies (de Luna-Martinez and Vicente, 2012).
Figure III.11 shows a sample of some of these banks, including the main multination-al regional banks. The regional development banks show a similar trend to the multilateral banks, with lending growing marginally or even declining. The main exceptions are the ADB, which increased its lending by 20 per cent in 2015, and the Development Bank of Southern Africa (DBSA), which increased lending by more than 35 per cent in 2015. National and sub-regional development banks in Latin America and the Caribbean also exhibited stabilizing levels of commitments and disbursements, with the exception of the Brazilian Development Bank (BNDES). BNDES scaled back its lending activities follow-ing economic recession and a change of government in Brazil.
Beyond the OECD DAC members, provision of international public finance has also increased from providers of South-South cooperation. While comprehensive data are not available, DESA estimates that concessional South-South cooperation may have exceeded $20 billion in 2013 and may have further increased in 2014, owing to a scale-up by Saudi
Figure III.10 Multilateral development bank financing, 2000–2015
Source: UN/DESA calculations based on annual reports
from MDBs. Note: Includes non-grant
subsidised finance from ADB, AfDB, EBRD, IADB, IIC, IBRD
and IFC.
Billions of United States dollars
0
10
20
30
40
50
60
70
80
90
100
0
50
100
150
200
250
300
350
400
450
500
2000 2001 2002 2003 2004 2005 2006 2007 2008 2009 2010 2011 2012 2013 2014 2015
ExposureCommitments (right-hand scale)Disbursements (right-hand scale)
95Chapter III. Financing for sustainable development
Arabia.8 The OECD, which estimates “ODA-like” flows from countries that are not mem-bers of the DAC, arrived at a comparable figure of $23.5 billion in 2013 (OECD, 2015b).9
Both NDB and AIIB also initiated their first lending and held their first annual meetings in 2016. The NDB approved over $800 million in investments in the first half of 2016, while the AIIB approved over $500 million for four projects in the same period.
Cross-border aid flows From a recipient perspective, a major concern is which flows are available for investments, and to what extent international public financial flows are earmarked for specific sectors and global priorities.
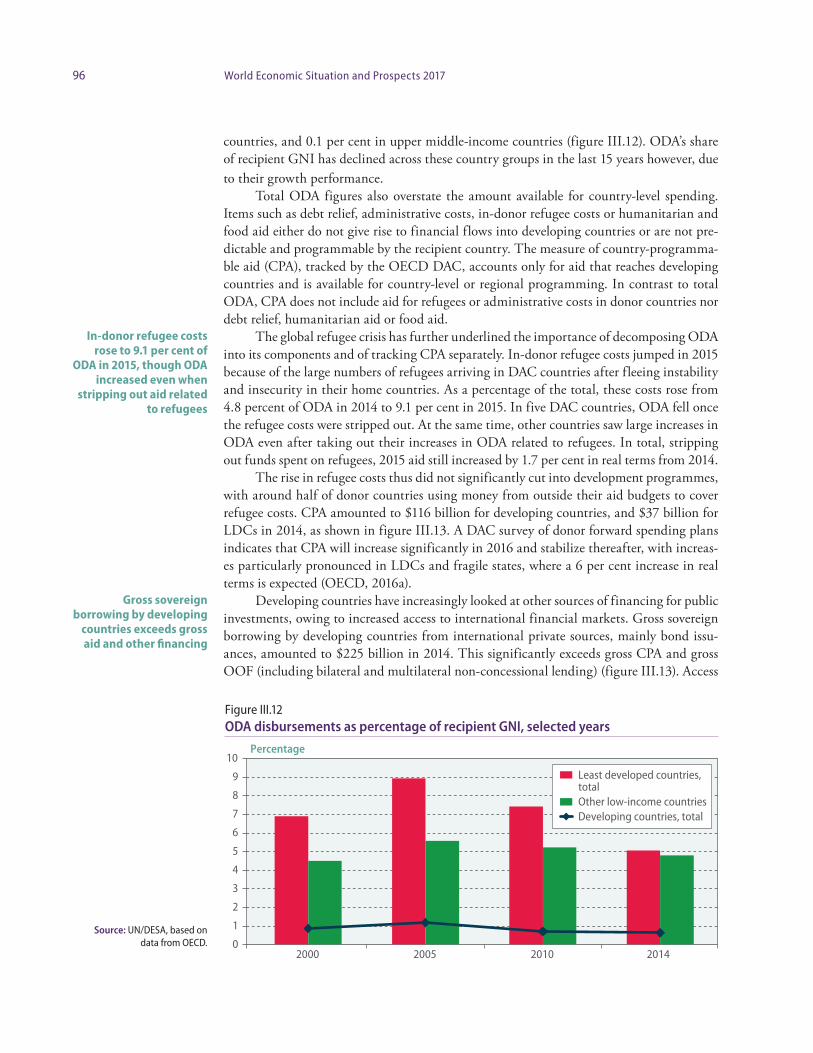
Overall, ODA plays a vastly more important role in quantitative terms in LDCs as compared to developing countries as a whole. ODA disbursements amounted to 5 per cent of recipient GNI on average in LDCs in 2014, compared to 0.6 per cent in all developing
8 The estimates include concessional loans and grants as well as debt relief and technical cooperation provided within the South for development purposes (United Nations, Economic and Social Council, 2016).
9 The OECD figure refers to gross flows, including flows from countries that report to the DAC and estimates from published national sources for countries that do not (such as Brazil, China and India).
Figure III.11 Annual disbursement of selected regional and national development banks, 2000–2015
Source: UN/DESA, based on data from annual reports from relevant organisations.
Index, 2000=100
0
200
400
600
800
1000
1200
2000 2001 2002 2003 2004 2005 2006 2007 2008 2009 2010 2011 2012 2013 2014 2015
0
100
200
300
400
500
600
700
800
900
2000 2001 2002 2003 2004 2005 2006 2007 2008 2009 2010 2011 2012 2013 2014 2015
Asian Development BankAfrican Development BankEuropean Bank for Reconstruction and DevelopmentIslamic Development BankDevelopment Bank of Southern Africa (DBSA)
Inter-American Development BankBrazilian Development Bank (BNDES)Development Bank of Latin America (CAF)Central American Bank for Economic IntegrationCaribbean Development Bank
96 World Economic Situation and Prospects 2017
countries, and 0.1 per cent in upper middle-income countries (figure III.12). ODA’s share of recipient GNI has declined across these country groups in the last 15 years however, due to their growth performance.
Total ODA figures also overstate the amount available for country-level spending. Items such as debt relief, administrative costs, in-donor refugee costs or humanitarian and food aid either do not give rise to financial flows into developing countries or are not pre-dictable and programmable by the recipient country. The measure of country-programma-ble aid (CPA), tracked by the OECD DAC, accounts only for aid that reaches developing countries and is available for country-level or regional programming. In contrast to total ODA, CPA does not include aid for refugees or administrative costs in donor countries nor debt relief, humanitarian aid or food aid.
The global refugee crisis has further underlined the importance of decomposing ODA into its components and of tracking CPA separately. In-donor refugee costs jumped in 2015 because of the large numbers of refugees arriving in DAC countries after fleeing instability and insecurity in their home countries. As a percentage of the total, these costs rose from 4.8 percent of ODA in 2014 to 9.1 per cent in 2015. In five DAC countries, ODA fell once the refugee costs were stripped out. At the same time, other countries saw large increases in ODA even after taking out their increases in ODA related to refugees. In total, stripping out funds spent on refugees, 2015 aid still increased by 1.7 per cent in real terms from 2014.
The rise in refugee costs thus did not significantly cut into development programmes, with around half of donor countries using money from outside their aid budgets to cover refugee costs. CPA amounted to $116 billion for developing countries, and $37 billion for LDCs in 2014, as shown in figure III.13. A DAC survey of donor forward spending plans indicates that CPA will increase significantly in 2016 and stabilize thereafter, with increas-es particularly pronounced in LDCs and fragile states, where a 6 per cent increase in real terms is expected (OECD, 2016a).
Developing countries have increasingly looked at other sources of financing for public investments, owing to increased access to international financial markets. Gross sovereign borrowing by developing countries from international private sources, mainly bond issu-ances, amounted to $225 billion in 2014. This significantly exceeds gross CPA and gross OOF (including bilateral and multilateral non-concessional lending) (figure III.13). Access
In-donor refugee costs rose to 9.1 per cent of
ODA in 2015, though ODA increased even when
stripping out aid related to refugees
Gross sovereign borrowing by developing
countries exceeds gross aid and other financing
Percentage
0
1
2
3
4
5
6
7
8
9
10
2000 2005 2010 2014
Least developed countries, totalOther low-income countriesDeveloping countries, total
Figure III.12 ODA disbursements as percentage of recipient GNI, selected years
Source: UN/DESA, based on data from OECD.
97Chapter III. Financing for sustainable development
by LDCs to markets is much more limited. Gross sovereign borrowing from capital markets is concentrated in a small number of LDCs (primarily Angola, as well as Ethiopia, Mozam-bique, Senegal, Tanzania and Zambia) and remains only a fraction of official concessional financing (World Bank, 2016d).
In order to paint a more complete picture of international financing sources available for public investments in sustainable development, efforts are underway to comprehen-sively monitor all relevant financing sources. The Inter-agency Task Force on Financing for Development is mandated to monitor all international public financing flows in its reporting on the commitments related to action area II.C of the AAAA on International Development Cooperation and related Financing for Development outcomes. The OECD DAC has also initiated discussions on Total Official Support for Sustainable Development (TOSSD), which would measure all officially supported resource flows that support sus-tainable development in developing countries.
The Inter-agency Task Force on Financing for Development monitoring will thus cover most of the same areas under discussion in TOSSD. However, while TOSSD pro-poses to add up all relevant financing flows from both OECD DAC countries and other providers into one metric (e.g. concessional finance including ODA, and non-concessional lending, as well as possibly private finance mobilized by public interventions), the Task Force has not agreed on which, if any, elements should be added up to a composite total, due to their different qualities, characteristics and development impacts.
In any such exercise, accounting for the quality of financing flows is a major chal-lenge. For example, private investment leveraged with public funds does not necessarily have the same developmental impact as public finance. Even within such private finance, the development impact of leveraging private investments from foreign companies is likely to differ from the development impact of leveraging funds from domestic companies, as the latter generally have a greater impact on domestic employment and resource mobilization.
Similarly, short-term government borrowing at high cost (e.g. on international mar-kets) differs in its budgetary implications from long-term concessional loans from multilater-al sources. These differences are even larger across different types of financing flows. There are concerns about the implicit incentives associated with more comprehensive measures of development finance, which could, for example, encourage the use of instruments to lever-age large amounts of private finance at the expense of grant finance. One solution that the Task Force is exploring is to create a measurement framework that presents different inter-national public financing flows separately but in a harmonized and comparable manner.
Domestic public resource mobilization In general, developing countries have increased their tax revenue over the last 15 years. While generating consistent, comparable revenue data and measuring revenue as a percent-age of GDP is a complex undertaking,10 the overall trends in domestic resource mobiliza-
10 For example, there are changes in and uneven implementation of the system of national accounts, dis-continuities in time series, differences between federal and non-federal systems, differences between budgetary and other central government information, and different measures of GDP as reported by different institutions. These challenges create difficulties in aggregation, as well as in measuring trends over time. In addition, the methodology used for aggregation will often depend on the expected use of the data set. For example, the treatment of revenue from natural resource extraction varies across data sets, partially reflecting the different purposes for which they were designed.
Accounting for the quality of financing flows is a major challenge
Tax revenues are orders of magnitude greater than ODA or development bank lending as a financing source for public investment
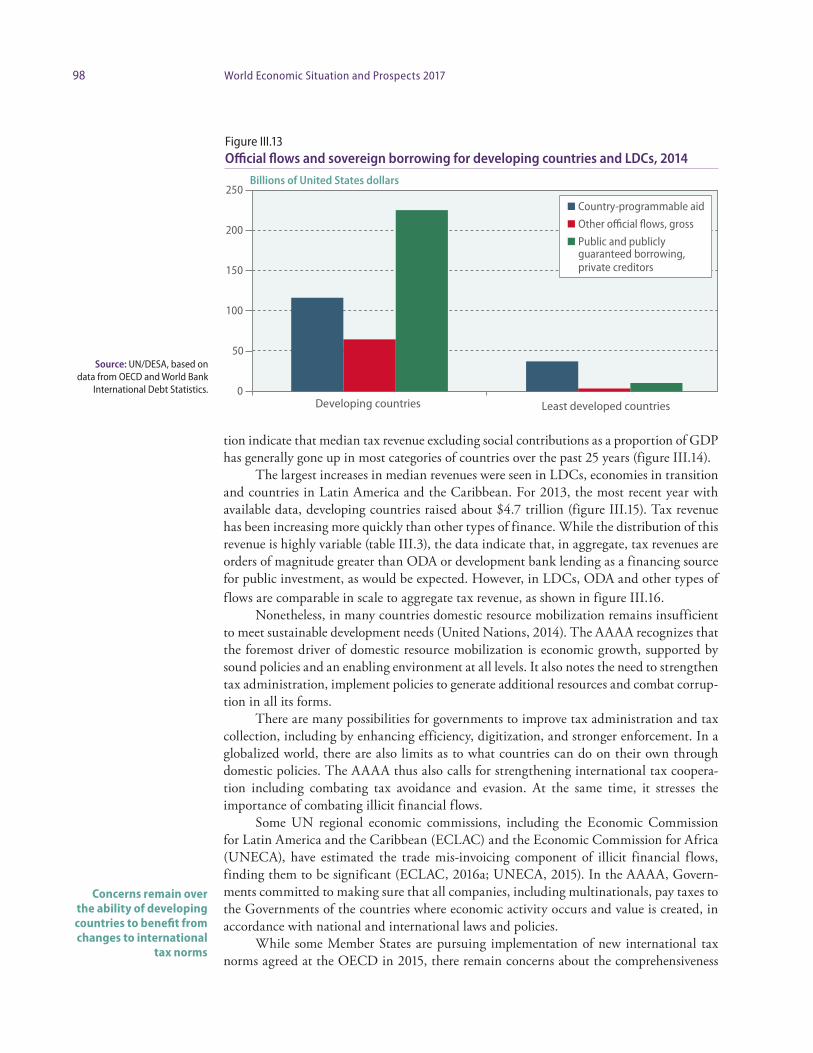
98 World Economic Situation and Prospects 2017
tion indicate that median tax revenue excluding social contributions as a proportion of GDP has generally gone up in most categories of countries over the past 25 years (figure III.14).
The largest increases in median revenues were seen in LDCs, economies in transition and countries in Latin America and the Caribbean. For 2013, the most recent year with available data, developing countries raised about $4.7 trillion (figure III.15). Tax revenue has been increasing more quickly than other types of finance. While the distribution of this revenue is highly variable (table III.3), the data indicate that, in aggregate, tax revenues are orders of magnitude greater than ODA or development bank lending as a financing source for public investment, as would be expected. However, in LDCs, ODA and other types of flows are comparable in scale to aggregate tax revenue, as shown in figure III.16.
Nonetheless, in many countries domestic resource mobilization remains insufficient to meet sustainable development needs (United Nations, 2014). The AAAA recognizes that the foremost driver of domestic resource mobilization is economic growth, supported by sound policies and an enabling environment at all levels. It also notes the need to strengthen tax administration, implement policies to generate additional resources and combat corrup-tion in all its forms.
There are many possibilities for governments to improve tax administration and tax collection, including by enhancing efficiency, digitization, and stronger enforcement. In a globalized world, there are also limits as to what countries can do on their own through domestic policies. The AAAA thus also calls for strengthening international tax coopera-tion including combating tax avoidance and evasion. At the same time, it stresses the importance of combating illicit financial flows.
Some UN regional economic commissions, including the Economic Commission for Latin America and the Caribbean (ECLAC) and the Economic Commission for Africa (UNECA), have estimated the trade mis-invoicing component of illicit financial flows, finding them to be significant (ECLAC, 2016a; UNECA, 2015). In the AAAA, Govern-ments committed to making sure that all companies, including multinationals, pay taxes to the Governments of the countries where economic activity occurs and value is created, in accordance with national and international laws and policies.
While some Member States are pursuing implementation of new international tax norms agreed at the OECD in 2015, there remain concerns about the comprehensiveness
Concerns remain over the ability of developing countries to benefit from changes to international
tax norms
Figure III.13 Official flows and sovereign borrowing for developing countries and LDCs, 2014
Source: UN/DESA, based on data from OECD and World Bank
International Debt Statistics.
Billions of United States dollars
0
50
100
150
200
250
Developing countries Least developed countries
Country-programmable aid
Other official flows, gross
Public and publiclyguaranteed borrowing,private creditors
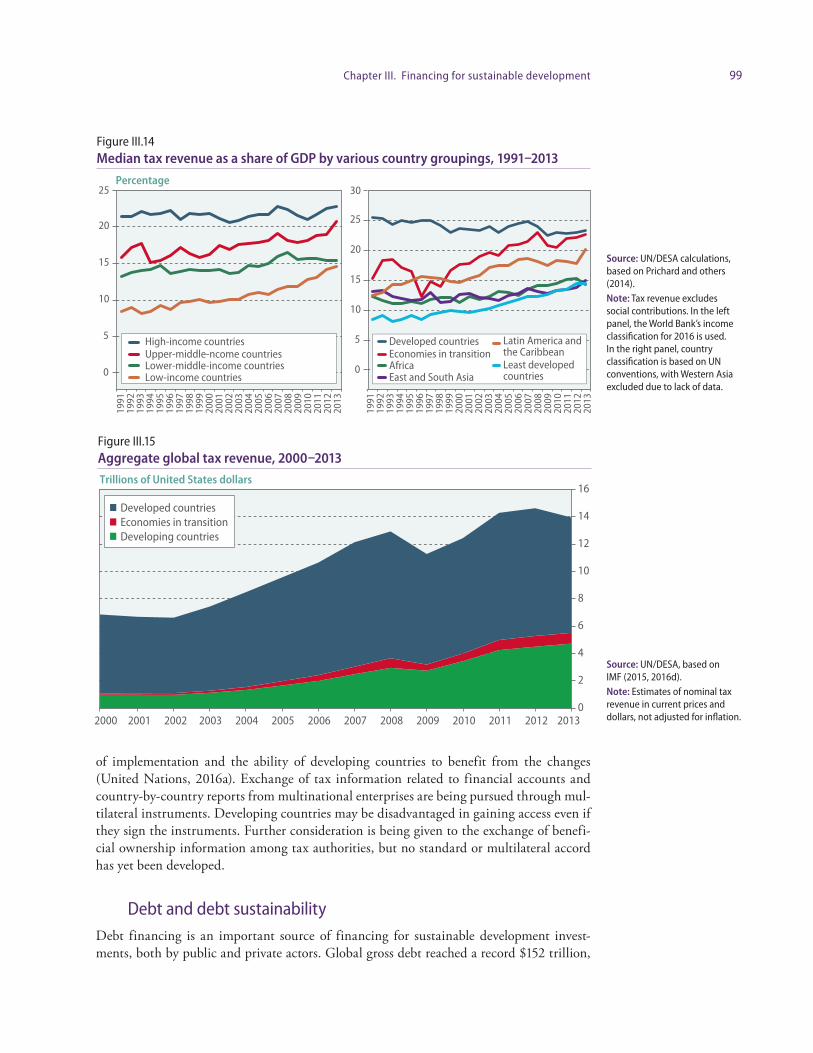
99Chapter III. Financing for sustainable development
of implementation and the ability of developing countries to benefit from the changes (United Nations, 2016a). Exchange of tax information related to financial accounts and country-by-country reports from multinational enterprises are being pursued through mul-tilateral instruments. Developing countries may be disadvantaged in gaining access even if they sign the instruments. Further consideration is being given to the exchange of benefi-cial ownership information among tax authorities, but no standard or multilateral accord has yet been developed.
Debt and debt sustainability Debt financing is an important source of financing for sustainable development invest-ments, both by public and private actors. Global gross debt reached a record $152 trillion,
Figure III.14 Median tax revenue as a share of GDP by various country groupings, 1991–2013
Figure III.15 Aggregate global tax revenue, 2000–2013
Source: UN/DESA calculations, based on Prichard and others (2014). Note: Tax revenue excludes social contributions. In the left panel, the World Bank’s income classification for 2016 is used. In the right panel, country classification is based on UN conventions, with Western Asia excluded due to lack of data.
Source: UN/DESA, based on IMF (2015, 2016d). Note: Estimates of nominal tax revenue in current prices and dollars, not adjusted for inflation.
Percentage
0
5
10
15
20
25
High-income countriesUpper-middle-ncome countriesLower-middle-income countriesLow-income countries
0
5
10
15
20
25
30
1991
1992
1993
1994
1995
1996
1997
1998
1999
2000
2001
2002
2003
2004
2005
2006
2007
2008
2009
2010
2011
2012
2013
1991
1992
1993
1994
1995
1996
1997
1998
1999
2000
2001
2002
2003
2004
2005
2006
2007
2008
2009
2010
2011
2012
2013
Developed countriesEconomies in transitionAfricaEast and South Asia
Latin America and the CaribbeanLeast developed countries
Trillions of United States dollars
0
2
4
6
8
10
12
14
16
2000 2001 2002 2003 2004 2005 2006 2007 2008 2009 2010 2011 2012 2013
Developed countriesEconomies in transitionDeveloping countries
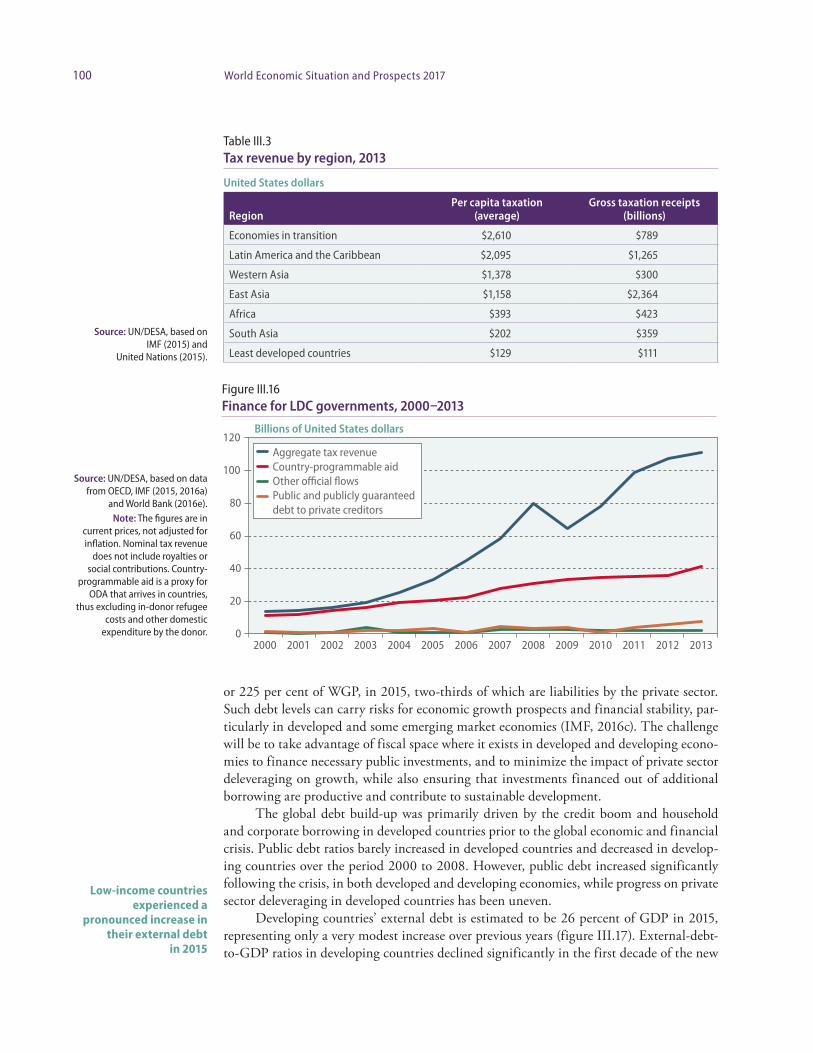
100 World Economic Situation and Prospects 2017
or 225 per cent of WGP, in 2015, two-thirds of which are liabilities by the private sector. Such debt levels can carry risks for economic growth prospects and financial stability, par-ticularly in developed and some emerging market economies (IMF, 2016c). The challenge will be to take advantage of fiscal space where it exists in developed and developing econo-mies to finance necessary public investments, and to minimize the impact of private sector deleveraging on growth, while also ensuring that investments financed out of additional borrowing are productive and contribute to sustainable development.
The global debt build-up was primarily driven by the credit boom and household and corporate borrowing in developed countries prior to the global economic and financial crisis. Public debt ratios barely increased in developed countries and decreased in develop-ing countries over the period 2000 to 2008. However, public debt increased significantly following the crisis, in both developed and developing economies, while progress on private sector deleveraging in developed countries has been uneven.
Developing countries’ external debt is estimated to be 26 percent of GDP in 2015, representing only a very modest increase over previous years (figure III.17). External-debt-to-GDP ratios in developing countries declined significantly in the first decade of the new
Low-income countries experienced a
pronounced increase in their external debt
in 2015
Table III.3 Tax revenue by region, 2013
United States dollars
RegionPer capita taxation
(average)Gross taxation receipts
(billions)
Economies in transition $2,610 $789
Latin America and the Caribbean $2,095 $1,265
Western Asia $1,378 $300
East Asia $1,158 $2,364
Africa $393 $423
South Asia $202 $359
Least developed countries $129 $111
Figure III.16 Finance for LDC governments, 2000–2013
Source: UN/DESA, based on data from OECD, IMF (2015, 2016a)
and World Bank (2016e). Note: The figures are in
current prices, not adjusted for inflation. Nominal tax revenue
does not include royalties or social contributions. Country-
programmable aid is a proxy for ODA that arrives in countries,
thus excluding in-donor refugee costs and other domestic
expenditure by the donor.
Source: UN/DESA, based on IMF (2015) and
United Nations (2015).
Billions of United States dollars
0
20
40
60
80
100
120
2000 2001 2002 2003 2004 2005 2006 2007 2008 2009 2010 2011 2012 2013
Aggregate tax revenueCountry-programmable aidOther official flowsPublic and publicly guaranteeddebt to private creditors
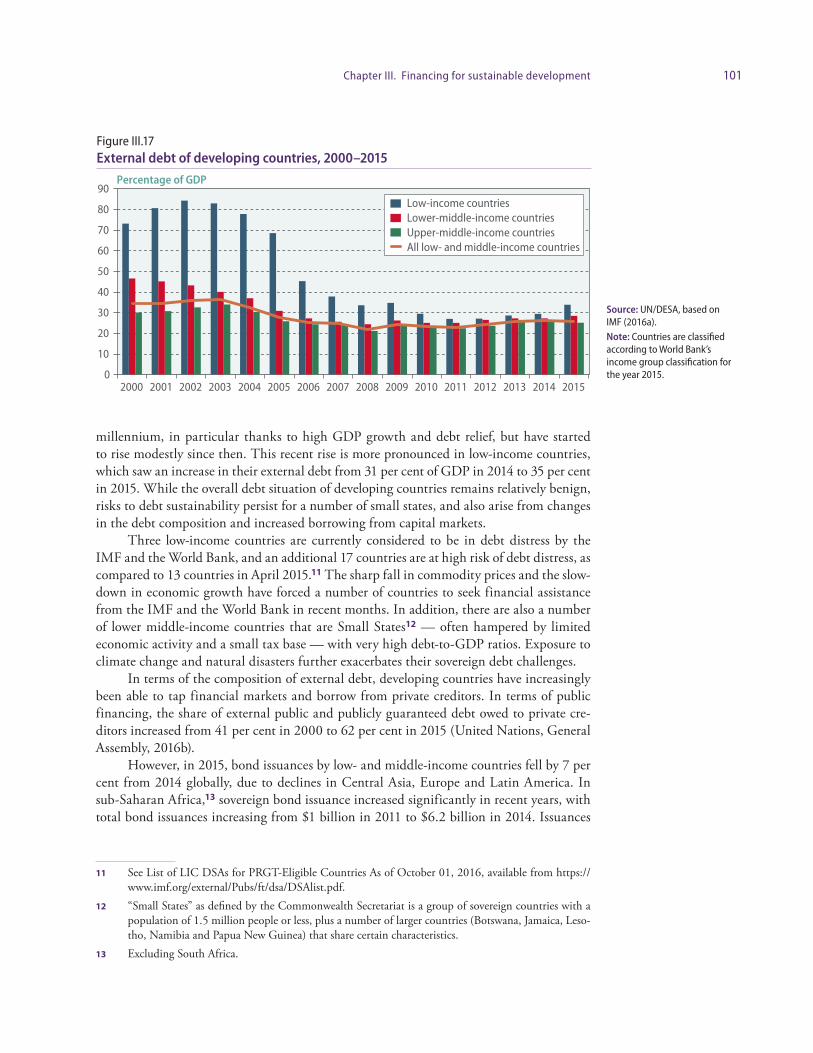
101Chapter III. Financing for sustainable development
millennium, in particular thanks to high GDP growth and debt relief, but have started to rise modestly since then. This recent rise is more pronounced in low-income countries, which saw an increase in their external debt from 31 per cent of GDP in 2014 to 35 per cent in 2015. While the overall debt situation of developing countries remains relatively benign, risks to debt sustainability persist for a number of small states, and also arise from changes in the debt composition and increased borrowing from capital markets.
Three low-income countries are currently considered to be in debt distress by the IMF and the World Bank, and an additional 17 countries are at high risk of debt distress, as compared to 13 countries in April 2015.11 The sharp fall in commodity prices and the slow-down in economic growth have forced a number of countries to seek financial assistance from the IMF and the World Bank in recent months. In addition, there are also a number of lower middle-income countries that are Small States12 — often hampered by limited economic activity and a small tax base — with very high debt-to-GDP ratios. Exposure to climate change and natural disasters further exacerbates their sovereign debt challenges.
In terms of the composition of external debt, developing countries have increasingly been able to tap financial markets and borrow from private creditors. In terms of public financing, the share of external public and publicly guaranteed debt owed to private cre-ditors increased from 41 per cent in 2000 to 62 per cent in 2015 (United Nations, General Assembly, 2016b).
However, in 2015, bond issuances by low- and middle-income countries fell by 7 per cent from 2014 globally, due to declines in Central Asia, Europe and Latin America. In sub-Saharan Africa,13 sovereign bond issuance increased significantly in recent years, with total bond issuances increasing from $1 billion in 2011 to $6.2 billion in 2014. Issuances
11 See List of LIC DSAs for PRGT-Eligible Countries As of October 01, 2016, available from https://www.imf.org/external/Pubs/ft/dsa/DSAlist.pdf.
12 “Small States” as defined by the Commonwealth Secretariat is a group of sovereign countries with a population of 1.5 million people or less, plus a number of larger countries (Botswana, Jamaica, Leso-tho, Namibia and Papua New Guinea) that share certain characteristics.
13 Excluding South Africa.
Figure III.17 External debt of developing countries, 2000–2015
Source: UN/DESA, based on IMF (2016a). Note: Countries are classified according to World Bank’s income group classification for the year 2015.
Percentage of GDP
0
10
20
30
40
50
60
70
80
90
2000 2001 2002 2003 2004 2005 2006 2007 2008 2009 2010 2011 2012 2013 2014 2015
Low-income countriesLower-middle-income countriesUpper-middle-income countriesAll low- and middle-income countries
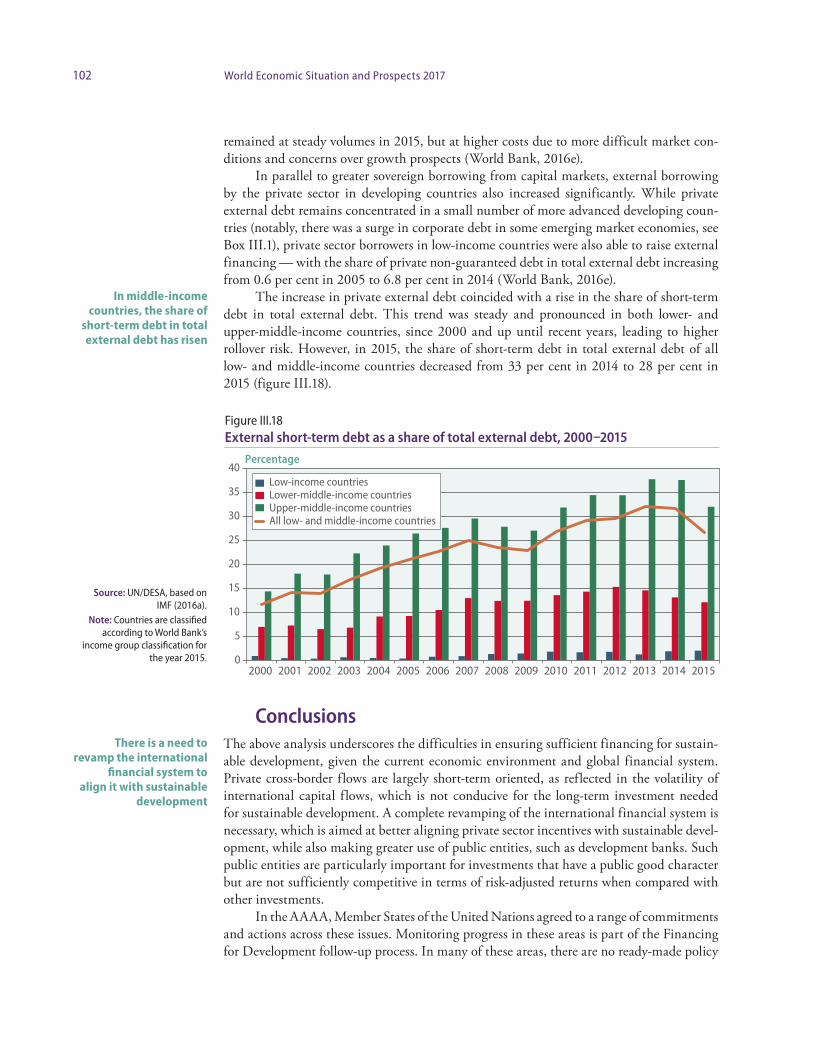
102 World Economic Situation and Prospects 2017
remained at steady volumes in 2015, but at higher costs due to more difficult market con-ditions and concerns over growth prospects (World Bank, 2016e).
In parallel to greater sovereign borrowing from capital markets, external borrowing by the private sector in developing countries also increased significantly. While private external debt remains concentrated in a small number of more advanced developing coun-tries (notably, there was a surge in corporate debt in some emerging market economies, see Box III.1), private sector borrowers in low-income countries were also able to raise external financing — with the share of private non-guaranteed debt in total external debt increasing from 0.6 per cent in 2005 to 6.8 per cent in 2014 (World Bank, 2016e).
The increase in private external debt coincided with a rise in the share of short-term debt in total external debt. This trend was steady and pronounced in both lower- and upper-middle-income countries, since 2000 and up until recent years, leading to higher rollover risk. However, in 2015, the share of short-term debt in total external debt of all low- and middle-income countries decreased from 33 per cent in 2014 to 28 per cent in 2015 (figure III.18).
ConclusionsThe above analysis underscores the difficulties in ensuring sufficient financing for sustain-able development, given the current economic environment and global financial system. Private cross-border flows are largely short-term oriented, as reflected in the volatility of international capital flows, which is not conducive for the long-term investment needed for sustainable development. A complete revamping of the international financial system is necessary, which is aimed at better aligning private sector incentives with sustainable devel-opment, while also making greater use of public entities, such as development banks. Such public entities are particularly important for investments that have a public good character but are not sufficiently competitive in terms of risk-adjusted returns when compared with other investments.
In the AAAA, Member States of the United Nations agreed to a range of commitments and actions across these issues. Monitoring progress in these areas is part of the Financing for Development follow-up process. In many of these areas, there are no ready-made policy
In middle-income countries, the share of
short-term debt in total external debt has risen
There is a need to revamp the international
financial system to align it with sustainable
development
Figure III.18 External short-term debt as a share of total external debt, 2000–2015
Source: UN/DESA, based on IMF (2016a).
Note: Countries are classified according to World Bank’s
income group classification for the year 2015.
Percentage
0
5
10
15
20
25
30
35
40
2000 2001 2002 2003 2004 2005 2006 2007 2008 2009 2010 2011 2012 2013 2014 2015
Low-income countriesLower-middle-income countriesUpper-middle-income countriesAll low- and middle-income countries
103Chapter III. Financing for sustainable development
solutions applicable across different country or regional contexts. The Inter-agency Task Force on Financing for Development has set up a series of work streams to explore policy options.
Current streams include work on illicit financial flows, measures of official support for sustainable development, and aligning capital market incentives with sustainable devel-opment. In each of these areas, the Task Force will explore new ideas and new mechanisms to promote the alignment of all financing flows with sustainable development, and to fur-ther implementation of the 2030 Agenda and achievement of the SDGs.