Embed Size (px)
Citation preview

© 2014 OnCourse Learning. All Rights Reserved. 1
Part II
Urban Economics & Real Estate Market Analysis

Urban Economics and Real Estate Market Analysis
Financial Economics Knowledge about the R.E. Asset Market.
Urban Economics Knowledge about the R.E. Space Market (Fundamental source of value).
5% of U.S. land is in urban areas, but 90% of real estate value is in urban areas.
Real estate is an urban phenomenon
To understand real estate, you need to understand cities.
2© 2014 OnCourse Learning. All Rights Reserved.
Urban Economics & Geography:
Why/how do some cities grow faster than others?…
What determines locations of different types of activities?…
What determines location value (& land value)?… How does location value change over time in
different parts of a city?… How can we analyze the market for different types
of space usage in different types of locations?…
3© 2014 OnCourse Learning. All Rights Reserved.

Chapter 3
Central Place Theory & the System of Cities
4© 2014 OnCourse Learning. All Rights Reserved.
Central Place Theory and the System of Cities
The “Big Picture” of cities… Why cities form, grow, & decline What are the centralizing & decentralizing forces
that explain the number and sizes of cities What is a "system" of cities, and the essential
characteristics of the US system of cities The key practical insights and principles of
central place theory and urban hierarchy theory, and how real estate decision makers can use these
What is meant by the economic base and export base of a city
Employment & population multipliers5© 2014 OnCourse Learning. All Rights Reserved.
Central Place Theory and the System of Cities
“Central Place Theory” “Urban Hierarchy” “Economic Base”
6© 2014 OnCourse Learning. All Rights Reserved.
3.1 The Pattern of City Size
Cities are not isolated phenomena.Each city is part of a “system” of cities.Each city has a place and role as an element
in this system.
Example: A high-rise, upscale apartment building can
make lots of money in New York City. The same building would probably lose lots of
money in Des Moines, IA.
7© 2014 OnCourse Learning. All Rights Reserved.
Two Fundamental Characteristics of Cities:
Size Location
Consider the pattern in the sizes of cities…
8© 2014 OnCourse Learning. All Rights Reserved.
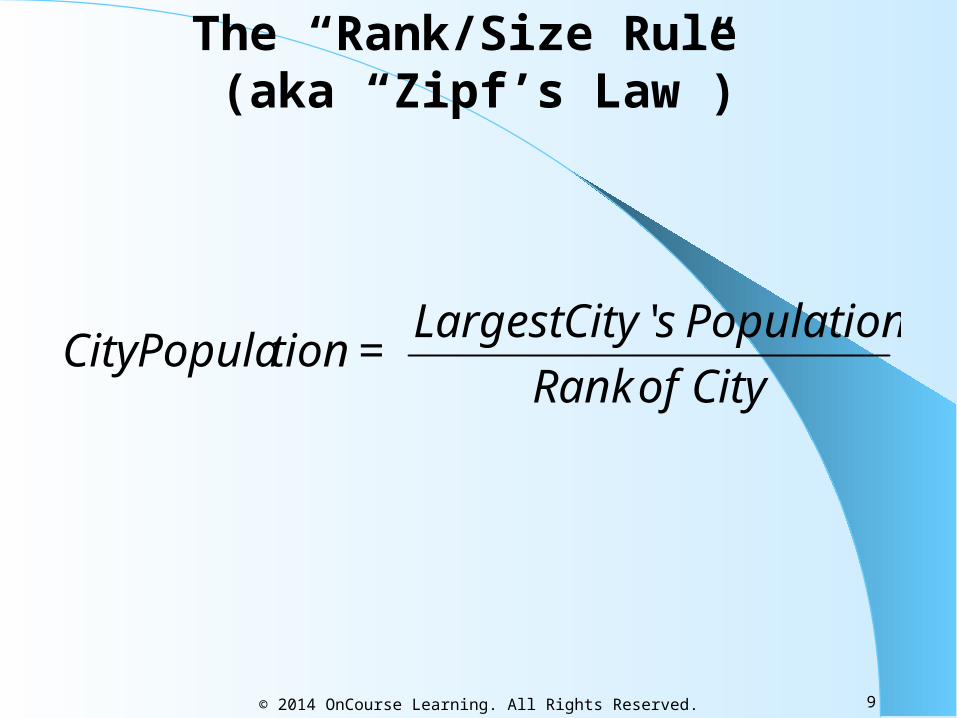
The “Rank/Size Rule”(aka “Zipf’s Law”)
City of Rank
Population sCity Largest = tionCityPopula
'
9© 2014 OnCourse Learning. All Rights Reserved.

© 2014 OnCourse Learning. All Rights Reserved. 10
EXHIBIT 3-1A Theoretical Rank/Size Rule
Theoretical picture:
© 2014 OnCourse Learning. All Rights Reserved. 11
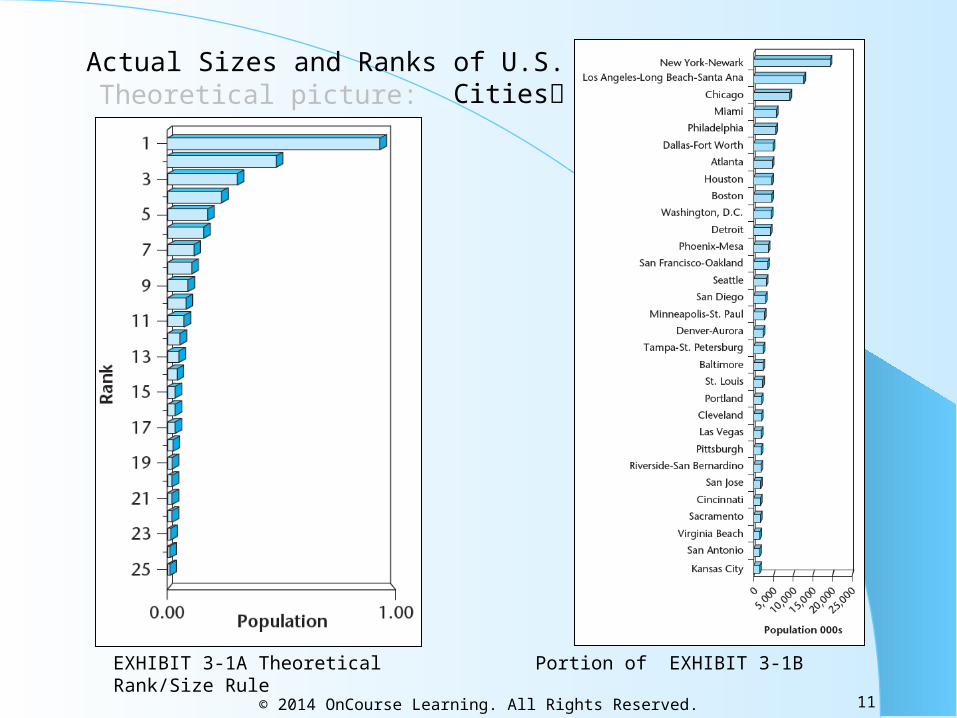
Actual Sizes and Ranks of U.S. Cities
EXHIBIT 3-1A Theoretical Rank/Size Rule Portion of EXHIBIT 3-1B
Theoretical picture:
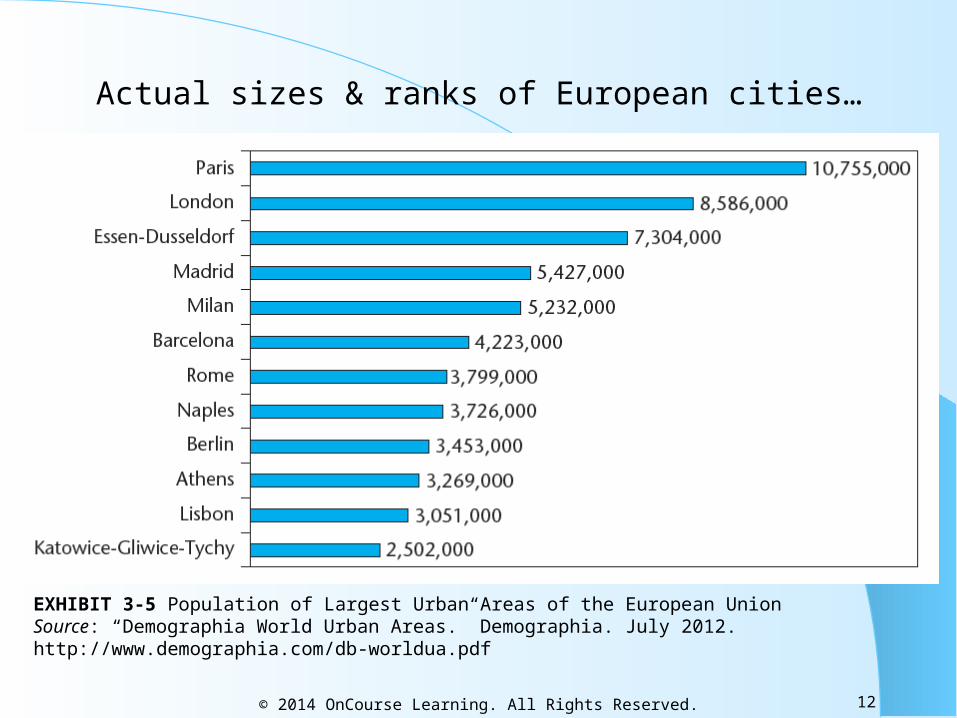
Actual sizes & ranks of European cities…
12© 2014 OnCourse Learning. All Rights Reserved.
EXHIBIT 3-5 Population of Largest Urban Areas of the European UnionSource: “Demographia World Urban Areas.” Demographia. July 2012. http://www.demographia.com/db-worldua.pdf
What causes the rank/size rule?…
In part, it’s pure Mathematics… · Suppose all cities grow at random rates over time. · Suppose all cities tend to grow at the same average rate. · Suppose all cities have the same “volatility” in their growth rates. Then the “Zipf’s Law” rank/size pattern will result.
13© 2014 OnCourse Learning. All Rights Reserved.
But why would all cities tend to grow at the same average rate?…
The number of new jobs is proportional to the number of existing jobs.
14© 2014 OnCourse Learning. All Rights Reserved.
Why would all cities have the same volatility of growth?
Once a certain size, cities tend to have diversified economic bases.
Smaller towns do not have diversified economies, so they experience more volatility, causing many to “die out”.
So there are fewer small towns than Zipf’s Law would predict.
15© 2014 OnCourse Learning. All Rights Reserved.
What this math cannot explain:
Why do cities change rank so rarely?…Rank changes tend to be systematic, not
random (e.g., southern & western cities tend to move up in rank, eastern cities move down. To understand the size pattern of cities, we must also consider location . . .
16© 2014 OnCourse Learning. All Rights Reserved.
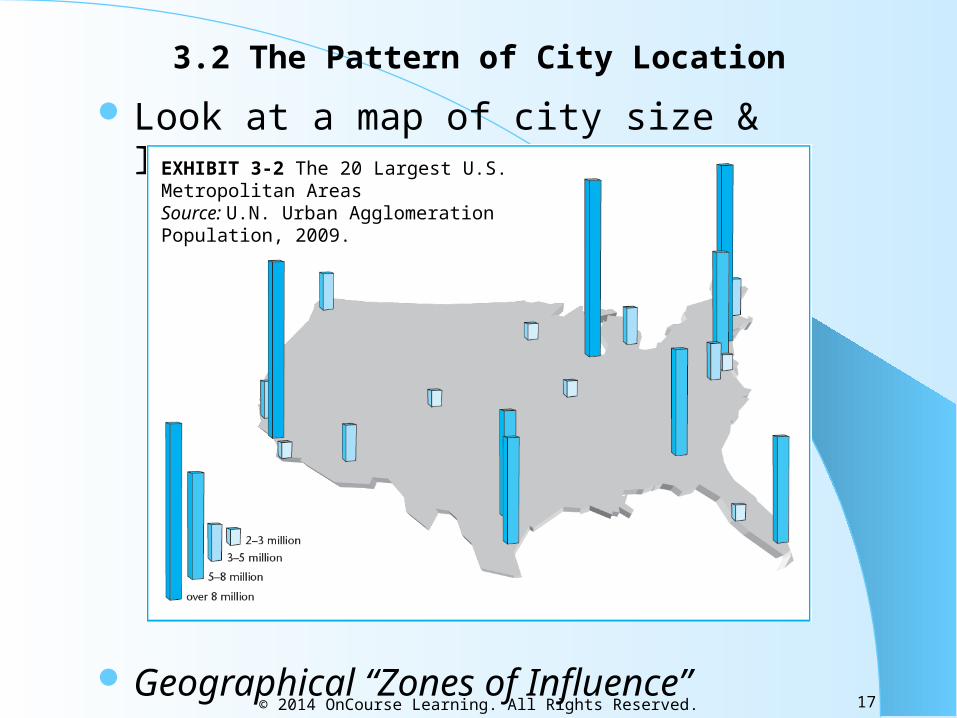
3.2 The Pattern of City Location
Look at a map of city size & location in the U.S.
Geographical “Zones of Influence”
17© 2014 OnCourse Learning. All Rights Reserved.
EXHIBIT 3-2 The 20 Largest U.S. Metropolitan AreasSource: U.N. Urban Agglomeration Population, 2009.
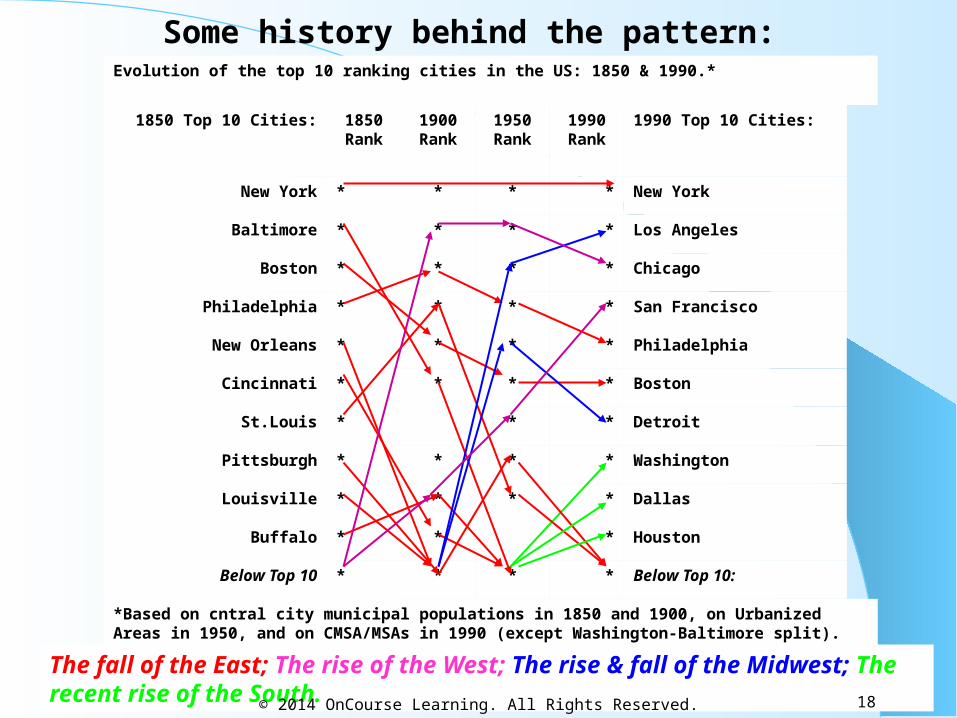
Evolution of the top 10 ranking cities in the US: 1850 & 1990.*
1850 Top 10 Cities: 1850Rank
1900 Rank
1950 Rank
1990 Rank
1990 Top 10 Cities:
New York * * * * New York
Baltimore * * * * Los Angeles
Boston * * * * Chicago
Philadelphia * * * * San Francisco
New Orleans * * * * Philadelphia
Cincinnati * * * * Boston
St.Louis * * * Detroit
Pittsburgh * * * * Washington
Louisville * * * * Dallas
Buffalo * * * Houston
Below Top 10 * * * * Below Top 10:
*Based on cntral city municipal populations in 1850 and 1900, on Urbanized Areas in 1950, and on CMSA/MSAs in 1990 (except Washington-Baltimore split).
Some history behind the pattern:
The fall of the East; The rise of the West; The rise & fall of the Midwest; The recent rise of the South. 18© 2014 OnCourse Learning. All Rights Reserved.
3.3 Factors underlying the pattern:
The “Rank/Size Rule”, & the Geographical “Zones of Influence”
i Centralizing city-causation ("centripital") forces are counter-balanced by opposing "decentralizing" ("centrifugal") forces.
ii The relative strength of the centralizing and decentralizing forces differs for different functions and activities.
19© 2014 OnCourse Learning. All Rights Reserved.
3.3.1 Centripetal Forces:
Would lead to fewer, larger cities…
20© 2014 OnCourse Learning. All Rights Reserved.
1) Economies of Scale
– Cheaper per unit to produce more stuff at one place.
– i.e., Declining average costs with larger production capacity.
– Due to “fixed” costs.– Example: Auto factory with 200,000 cars/yr
production capacity is more efficient than auto factory with 50,000 cars/yr capacity.
21© 2014 OnCourse Learning. All Rights Reserved.
2) Economies of Agglomeration
– Productivity advantage of physical clustering.– Vertical & horizontal production linkages
(synergy, critical mass).– Example: Silicon Valley.
22© 2014 OnCourse Learning. All Rights Reserved.
3) Positive Locational Externalities
– One firm benefits another firm nearby.– Example: Trucking firm & Airfreight firm hub.
“Growth Spirals”, “Cumulative Causation”…
23© 2014 OnCourse Learning. All Rights Reserved.
3.3.2 Centrifugal Forces Decentralizing forces that put a break on urban
agglomeration, result in a larger number of smaller cities.
Congestion Pollution Crime High intra-urban transportation costs High rents & urban land costs High inter-urban transportation costs (with greater
distance between fewer larger cities)
24© 2014 OnCourse Learning. All Rights Reserved.

3.3.3 The Balance of Centripetal & Centrifugal Forces…
Centralizing forces are relatively stronger in comparison with decentralizing forces for some types of activities than for others…
National Government functions?… International financial services?… Corporate headquarters?… Corporate research facilities?… Light manufacturing?… Distribution?… Corporate branch offices, sales offices?…
25© 2014 OnCourse Learning. All Rights Reserved.
3.3.4 Central Place Theory & Urban Hierarchy
Central Place Theory (CPT)…
Suppose “everyone” (13 people) lived on a 12-inch ruler…
In order to reduce 'spatial friction', places of similar size, rank, or function will tend to be EVENLY SPACED across geographical space and/or population.
26© 2014 OnCourse Learning. All Rights Reserved.

Here’s what it looks like in 2 dimensions…
27© 2014 OnCourse Learning. All Rights Reserved.
3.3.5 Why Does CPT Matter?…
Just a pretty academic theory?…
Tell that to the developers of Forest Fair Mall! (and their lenders!)
CPT is location theory
In real estate, three things matter: location, location, & location!
28© 2014 OnCourse Learning. All Rights Reserved.
Two practical principles of CPT:
1) If there is an under-served
territory there is room for a new "central site"; and
2) If there is already a central site
effectively located to serve a territory, it is going to be very hard to develop a new such site nearby the existing site.
29© 2014 OnCourse Learning. All Rights Reserved.
CPT applies at various levels…Which cities will grow fastest, and slowest?
…Where can you build a new mall?…Which sites cast “agglomeration shadows”?
…
30© 2014 OnCourse Learning. All Rights Reserved.
3.4 Economic Base & the Growth of Cities & Regions
Why would two cities, equally ranked and equally well located, grow at different rates over a period of time?…
CPT cannot tell us.
Enter:
“Economic Base Theory”. . .
31© 2014 OnCourse Learning. All Rights Reserved.
Definition: “Economic Base” (of a city or region):
The sources of the city’s (or region’s) income.
The engine that drives & underlies all real estate activity in a region.
32© 2014 OnCourse Learning. All Rights Reserved.
Economic Base Analysis is a tool to help:
Identify which cities or regions will grow.
Help characterize what kind of growth (e.g.: "blue collar" vs "white collar").
Help quantify how much growth.
33© 2014 OnCourse Learning. All Rights Reserved.
Three major components of the Economic Base:
1. Local production of goods and services both for local needs and for "export" beyond the local urban area;
2. Investment returns to or of capital owned in the local area, such as investment returns on the stored financial wealth of retirees;
3. Government transfers such as social security payments.
(1) (local production) is most important in most urban areas.
34© 2014 OnCourse Learning. All Rights Reserved.
3.4.2 The “Export” Base…
In any city or region two types of goods and services are produced by the local economy:
35© 2014 OnCourse Learning. All Rights Reserved.
Export Goods
Export goods and services are those produced in greater quantities than needed for local consumption. These goods and services are exported to other cities, regions, and countries. These are referred to as “basic” products (or basic production). The sector of the local economy that produces such goods and services is called the “basic” (or “export”) sector.
36© 2014 OnCourse Learning. All Rights Reserved.
Local Goods
Local goods and services are those produced in quantities equal to or less than what is needed for local consumption. These are referred to as “non-basic” goods and services (or non-basic production). The sector of the local economy that produces such goods and services is called the “non-basic” (or “service”) sector. (This sector serves the local population and the export sector.)
37© 2014 OnCourse Learning. All Rights Reserved.
Export Base Theory:
According to “Export Base Theory”: Economic growth of the city or region is dependent entirely on growth in the export ("basic") sector of the local economy. Because the non-export (service) sector exists only to serve (directly or indirectly) the export sector.
38© 2014 OnCourse Learning. All Rights Reserved.
Example:
Suppose Fidelity Investments adds 500 employees to their N.Ky facility. Where do those 500 employees come from?…
Some from out of town (growth), others from the local area.
The employees that come from the local area would have to leave their previous existing jobs in the local area. They will have to be replaced in those jobs. Where will those replacements come from?…
Some from out of town (growth), others from the local area.
Etc., etc., … Eventually all 500 Fidelity jobs are a net addition to the local area total employment.
This is because Fidelity is part of the Cincinnati MSA’s economy’s “export base”.
39© 2014 OnCourse Learning. All Rights Reserved.
Example:
Kroger builds a new supermarket on Beechmont Ave, which requires 100 employees to operate. Where do those 100 employees come from?…
Most from the local area, some from out of town.
The ones that came from out of town prevent other local Cincinnati residents from getting those new jobs at Kroger, because the new Kroger jobs do not add to the total jobs in the Cincinnati MSA, because it does not increase Cincinnati’s exports to other regions. The new Kroger does not cause Cincinnati residents to eat more food than they otherwise would without the new Kroger.
40© 2014 OnCourse Learning. All Rights Reserved.

Which of the following are examples of Cincinnati’s export base?…
· GE Aircraft Engines
· Fidelity Investments
· Procter & Gamble Research Facility
· Procter & Gamble corporate headquarters
· The Burger-King on McMillan Ave
· The Kroger on Beechmont Ave
· The Lazarus at Kenwood Towne Center
· A new Nordstrom
· Corporex construction of Madison Place
41© 2014 OnCourse Learning. All Rights Reserved.
According to export base theory,
2-step process to forecast metro growth:
1) Identify which are the export base industries in the local region;
2) Forecast employment growth in those industries.
42© 2014 OnCourse Learning. All Rights Reserved.
Step 1:
Identify which industries are in a given region’s export base (i.e., “characterize” the economic base of the metro area).
How can we do this? . . .
43© 2014 OnCourse Learning. All Rights Reserved.
N / N
N / N = LQi
mmimi
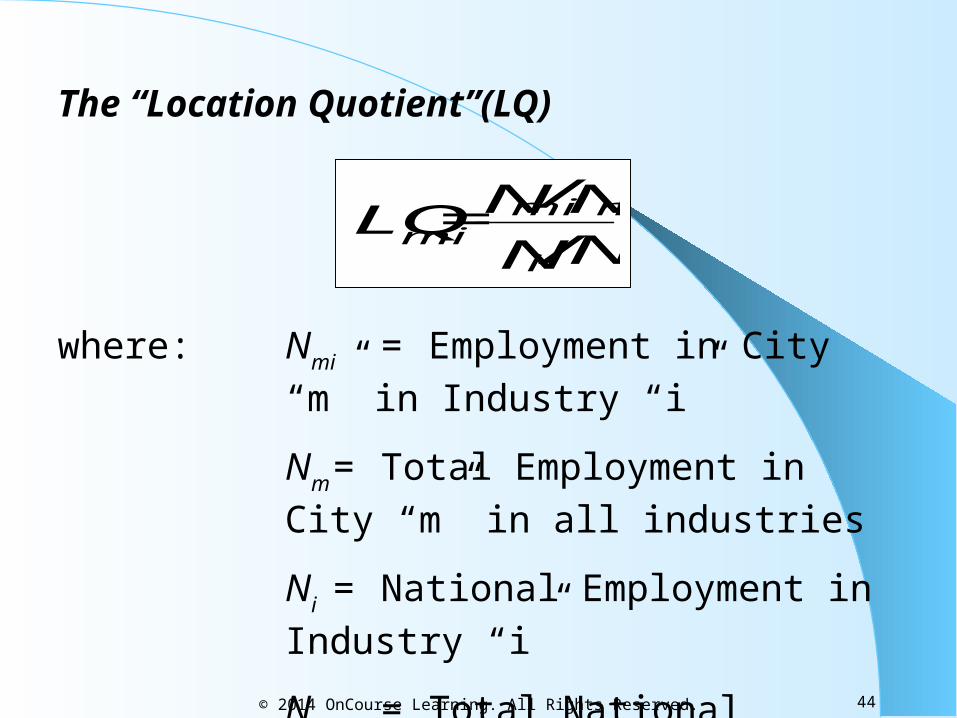
The “Location Quotient”(LQ)
where: Nmi = Employment in City “m” in
Industry “i”
Nm = Total Employment in City
“m” in all industries
Ni = National Employment in
Industry “i”
N = Total National Employment in all industries
44© 2014 OnCourse Learning. All Rights Reserved.
The “Location Quotient”(LQ)
LQ = 1.0 → same proportion of local workers work in a particular industry as work in that industry in the nation as a whole.
LQ > 1.0 → local area is more heavily concentrated in that industry than is the average city or region across the country.
In practice, it is usually considered that a location quotient must be significantly greater than 1.0 in order to indicate that the industry is part of the export sector of the local economic base.
45© 2014 OnCourse Learning. All Rights Reserved.
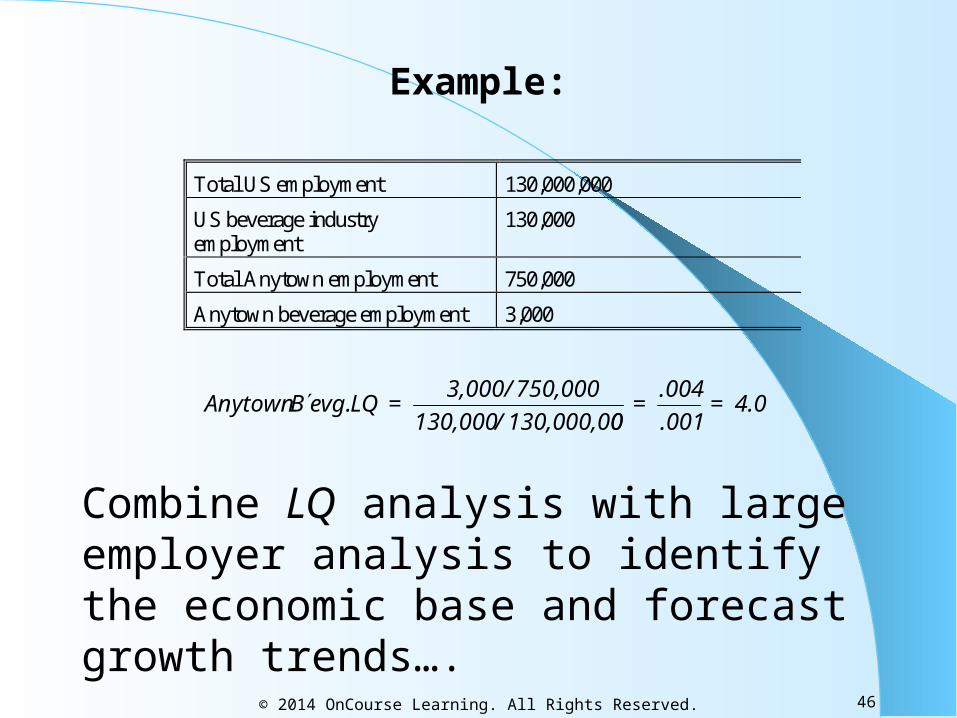
Example:
Total US employment 130,000,000
US beverage industry employment
130,000
Total Anytown employment 750,000
Anytown beverage employment 3,000
4.0 = .001
.004 =
0130,000,00 / 130,000
750,000 / 3,000 = LQ evg.B Anytown
Combine LQ analysis with large employer analysis to identify the economic base and forecast growth trends….
46© 2014 OnCourse Learning. All Rights Reserved.
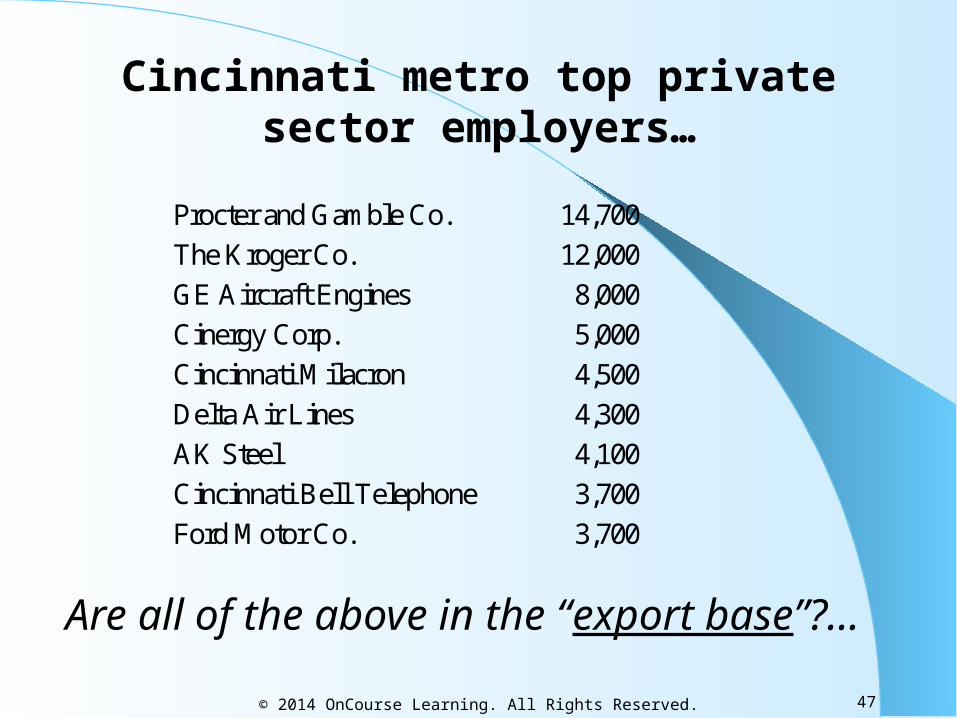
Cincinnati metro top private sector employers…
Procter and Gamble Co. 14,700
The Kroger Co. 12,000
GE Aircraft Engines 8,000
Cinergy Corp. 5,000
Cincinnati Milacron 4,500
Delta Air Lines 4,300
AK Steel 4,100
Cincinnati Bell Telephone 3,700
Ford Motor Co. 3,700
Are all of the above in the “export base”?…
47© 2014 OnCourse Learning. All Rights Reserved.

Information sources…
U.S. Govt Bureau of Labor Statistics (BLS) collects and reports data on employment, by MSA. Jobs are classified according to the hierarchical Standard Industrial Classification (SIC), identified by SIC Code numbers. Number of “digits” indicates level of hierarchical classification…
48© 2014 OnCourse Learning. All Rights Reserved.
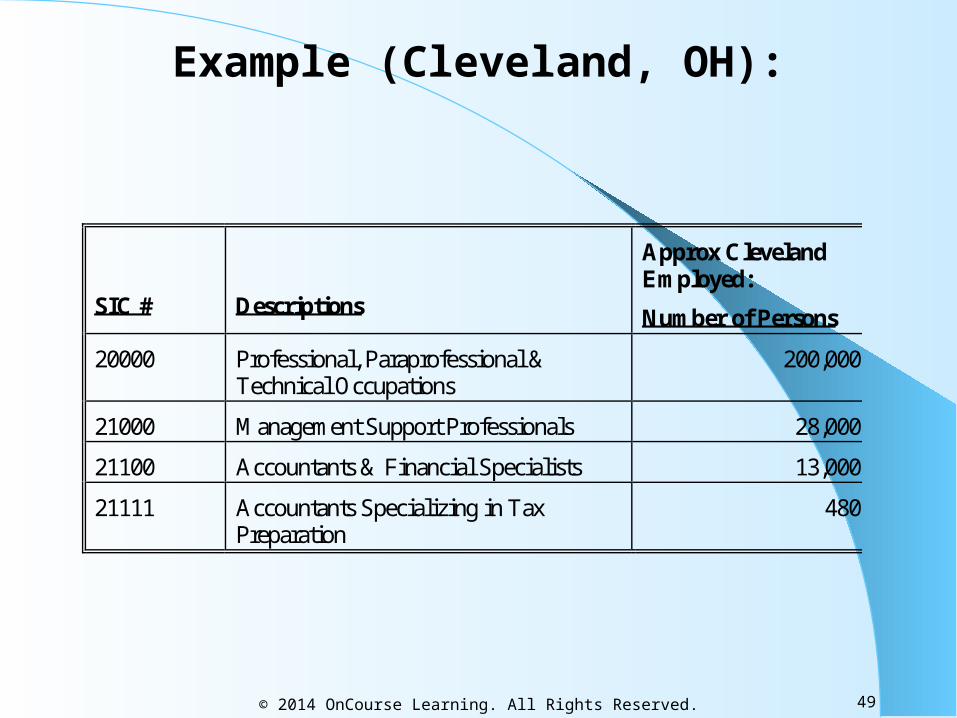
Example (Cleveland, OH):
SIC #
Descriptions
Approx Cleveland Employed:
Number of Persons
20000 Professional, Paraprofessional & Technical Occupations
200,000
21000 Management Support Professionals 28,000
21100 Accountants & Financial Specialists 13,000
21111 Accountants Specializing in Tax Preparation
480
49© 2014 OnCourse Learning. All Rights Reserved.

Example data search . . .
Go to the Bureau of Labor Statistics web site at www.bls.gov
On their home page, under the “Get Detailed Statistics” heading, click on “Create Customized Tables (1 screen)”
Fill in the form to get the data to estimate the location quotient for the Cincinnati MSA for SIC 3724 “Aircraft Engines & Engine Parts”
e.g., for 2000:
7513076
1045
813,925,29341,99
45286299. =
.00
.0 =
1 /
,/ ,00 = LQ AirEngineCinci
50© 2014 OnCourse Learning. All Rights Reserved.
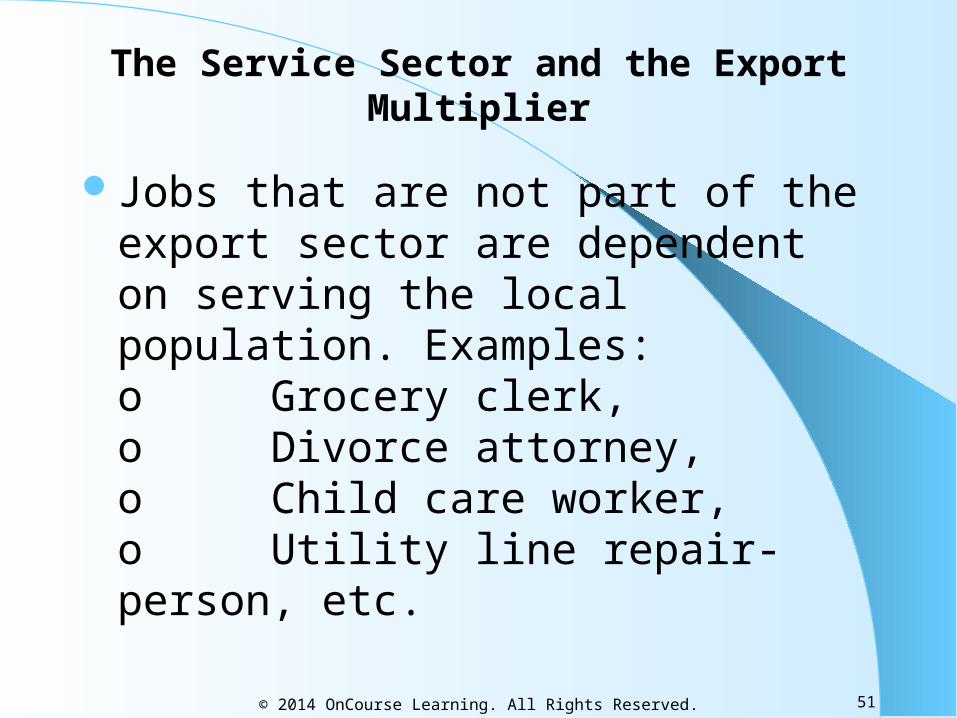
Jobs that are not part of the export sector are dependent on serving the local population. Examples:o Grocery clerk, o Divorce attorney, o Child care worker, o Utility line repair-person, etc.
The Service Sector and the Export Multiplier
51© 2014 OnCourse Learning. All Rights Reserved.
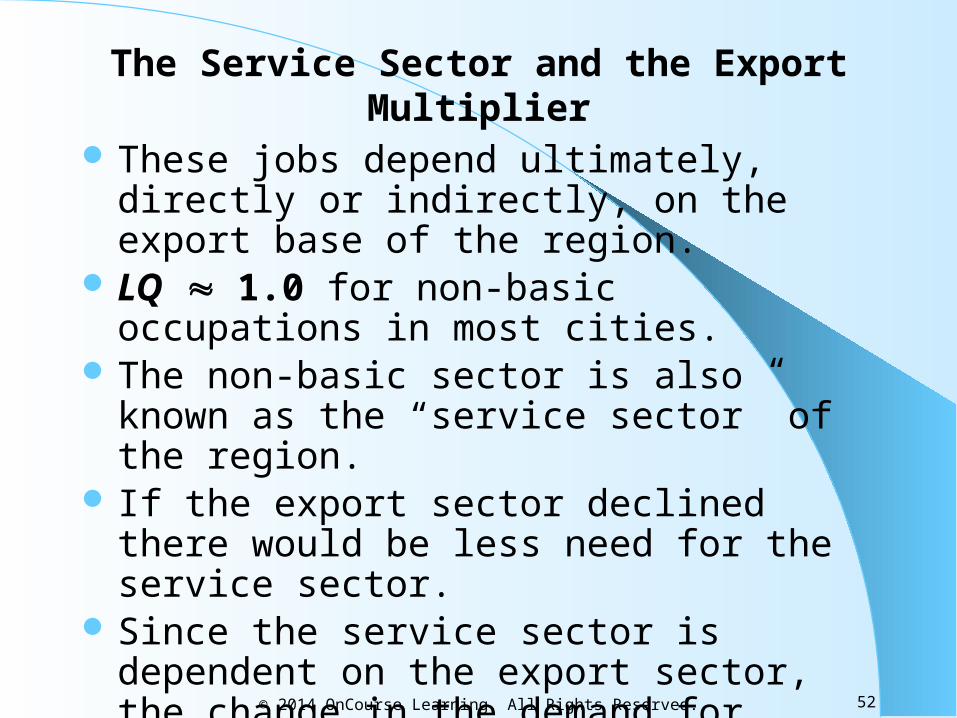
The Service Sector and the Export Multiplier
These jobs depend ultimately, directly or indirectly, on the export base of the region.
LQ 1.0 for non-basic occupations in most cities. The non-basic sector is also known as the “service
sector” of the region. If the export sector declined there would be less
need for the service sector. Since the service sector is dependent on the export
sector, the change in the demand for service sector jobs is a function of the change in the number of export sector jobs.
52© 2014 OnCourse Learning. All Rights Reserved.
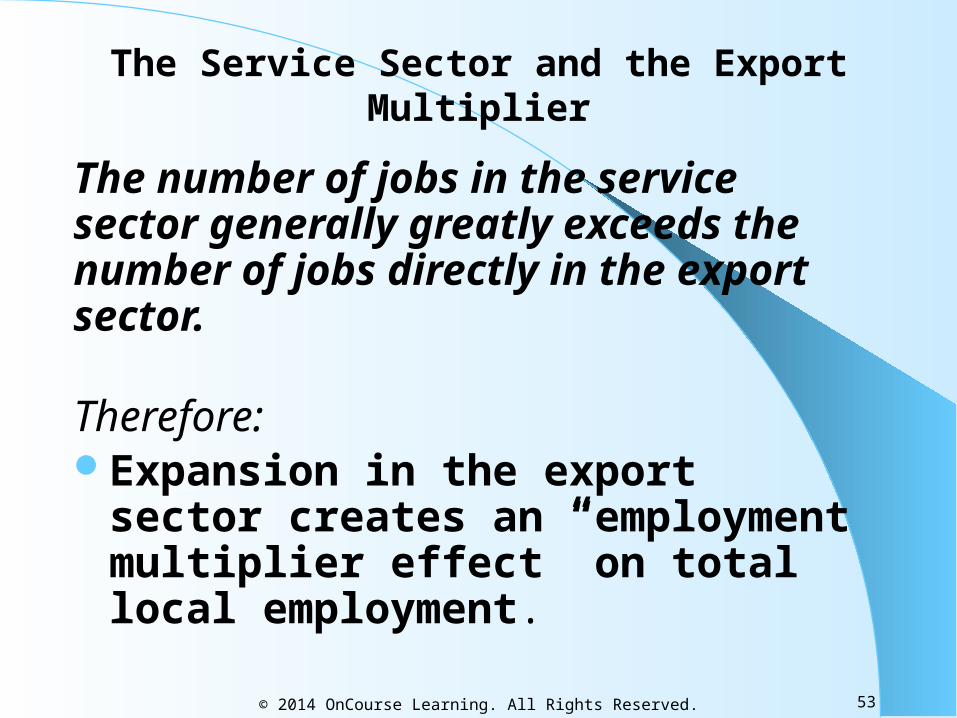
The number of jobs in the service sector generally greatly exceeds the number of jobs directly in the export sector. Therefore:Expansion in the export sector creates an
“employment multiplier effect” on total local employment.
The Service Sector and the Export Multiplier
53© 2014 OnCourse Learning. All Rights Reserved.

Example:
Toyota USA sets up national headquarters office in Cincinnati MSA (N.Ky), with 300 headquarters employees…
54© 2014 OnCourse Learning. All Rights Reserved.

Example (cont’d):
1. Including families, this brings, say, 600 people to Cincinnati MSA.
2. These 600 people spend much of their pay checks on local goods and services (housing, utilities, food, entertainment, schooling, etc.)
3. This expands the demand side of the local economy, adding jobs in the service sector.
4. Such net expansion of service sector jobs in the Cincinnati MSA must be filled (directly or indirectly) either by people previously unemployed in Cincinnati, or by new migrants moving to Cincinnati.
55© 2014 OnCourse Learning. All Rights Reserved.
Example (cont’d):
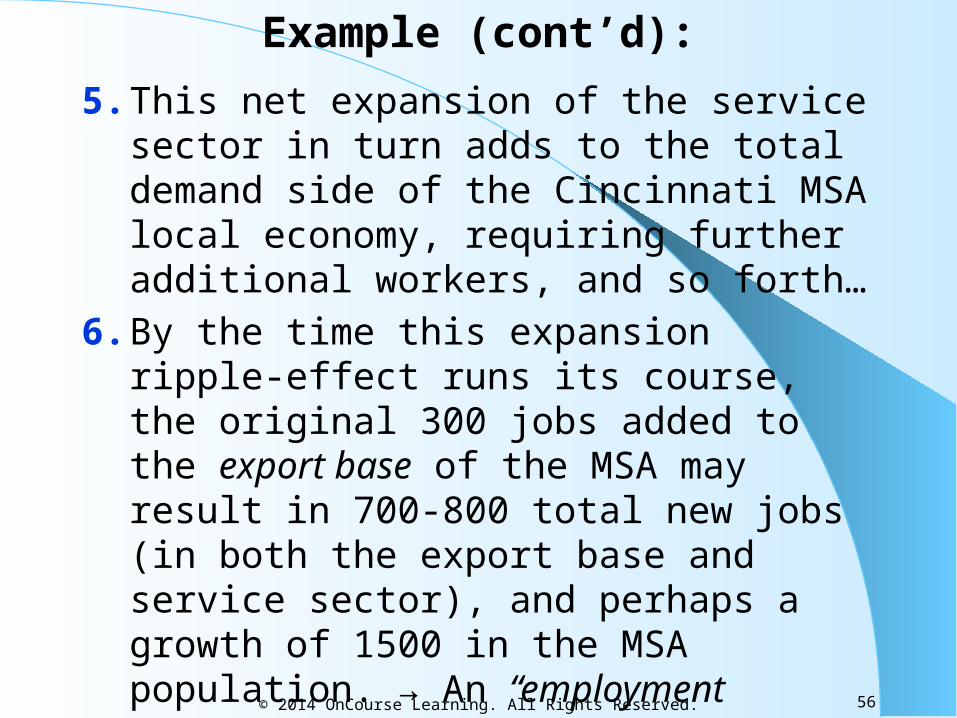
5. This net expansion of the service sector in turn adds to the total demand side of the Cincinnati MSA local economy, requiring further additional workers, and so forth…
6. By the time this expansion ripple-effect runs its course, the original 300 jobs added to the export base of the MSA may result in 700-800 total new jobs (in both the export base and service sector), and perhaps a growth of 1500 in the MSA population. → An “employment multiplier” of 2.5; a “population multiplier” of 5.0.
56© 2014 OnCourse Learning. All Rights Reserved.
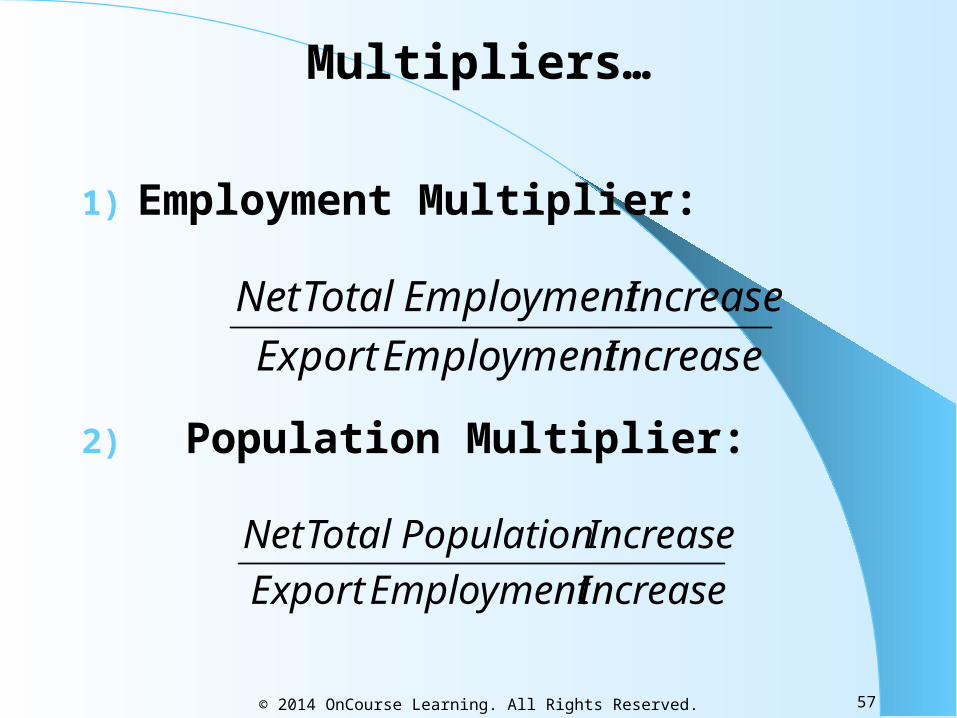
Multipliers…
Increase Employment Export
Increase Employment Total Net
Increase Employment Export
Increase Population Total Net
1) Employment Multiplier:
2) Population Multiplier:
57© 2014 OnCourse Learning. All Rights Reserved.
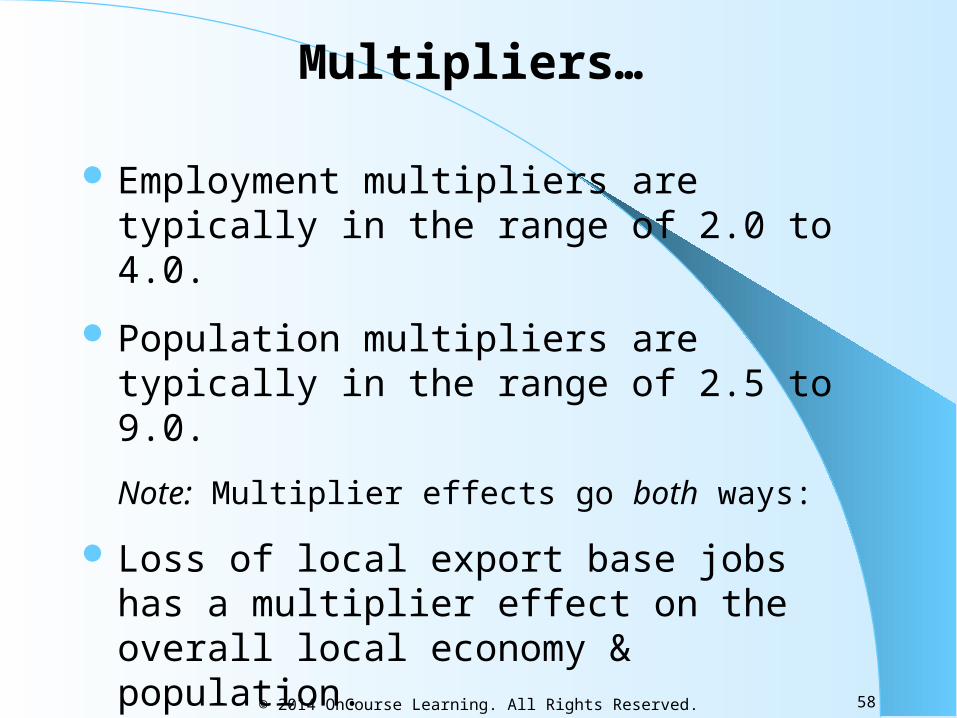
Employment multipliers are typically in the range of 2.0 to 4.0.
Population multipliers are typically in the range of 2.5 to 9.0.
Note: Multiplier effects go both ways:
Loss of local export base jobs has a multiplier effect on the overall local economy & population.
Note: Multiplier effects result only from changes in export base employment (rippling through the local service sector).
Multipliers…
58© 2014 OnCourse Learning. All Rights Reserved.
Concept check:
Why are real estate people interested in export base & multiplier theory?…
59© 2014 OnCourse Learning. All Rights Reserved.
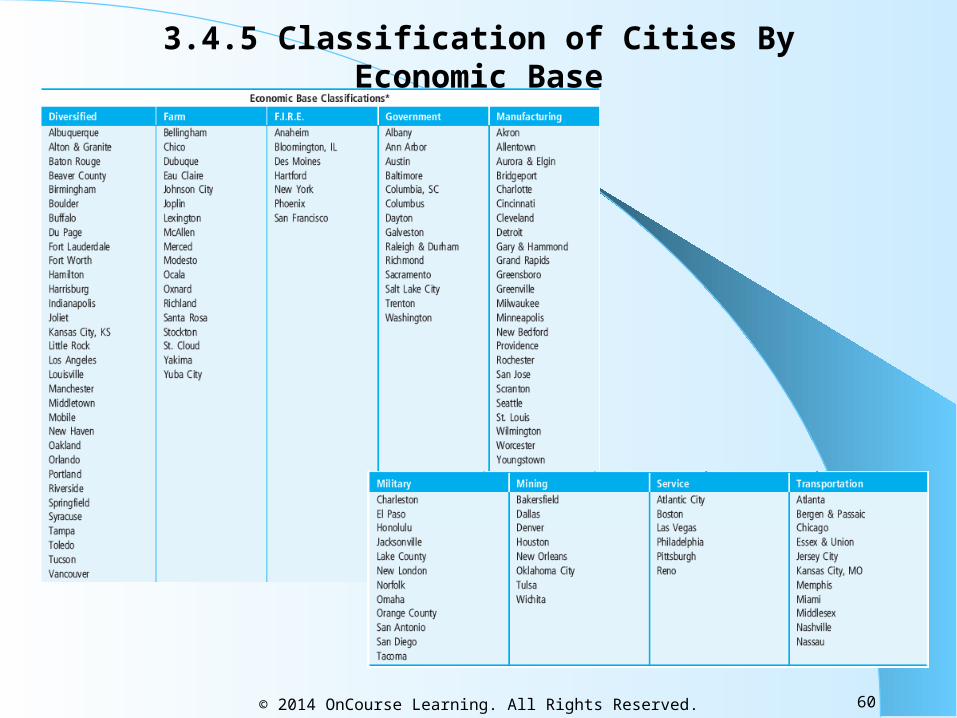
3.4.5 Classification of Cities By Economic Base
60© 2014 OnCourse Learning. All Rights Reserved.

3.5 Classification of cities for real estate investment analysis
Need to consider supply side as well as demand side of the space market. . .
61© 2014 OnCourse Learning. All Rights Reserved.
© 2014 OnCourse Learning. All Rights Reserved. 62
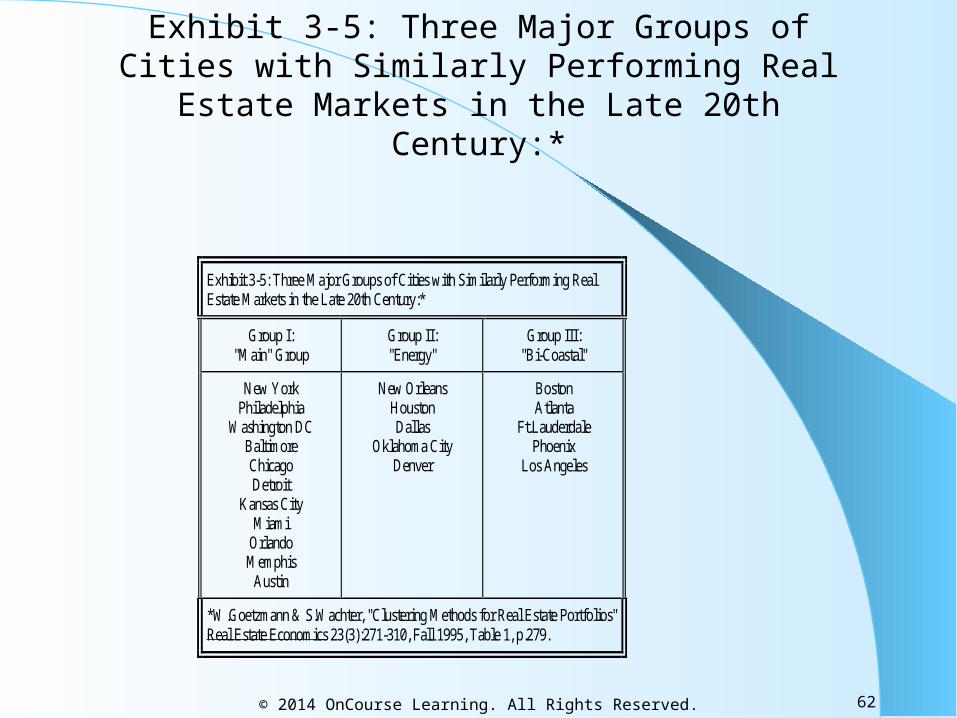
Exhibit 3-5: Three Major Groups of Cities with Similarly Performing Real Estate
Markets in the Late 20th Century:*
Exhibit 3-5: Three Major Groups of Cities with Similarly Performing Real Estate Markets in the Late 20th Century:*
Group I: "Main" Group
Group II: "Energy"
Group III: "Bi-Coastal"
New York Philadelphia
Washington DC Baltimore Chicago Detroit
Kansas City Miami
Orlando Memphis
Austin
New Orleans Houston Dallas
Oklahoma City Denver
Boston Atlanta
Ft.Lauderdale Phoenix
Los Angeles
*W.Goetzmann & S.Wachter, "Clustering Methods for Real Estate Portfolios" Real Estate Economics 23(3):271-310, Fall 1995, Table 1, p.279.
Note also:
Economic bases of cities evolve over time (sometimes rapidly)
Relations between economic sectors change over time (e.g., oil may be cyclical or counter-cyclical).
This makes it difficult to forecast correlations between cities regarding their economic growth rates. On the other hand: Centrality of location Availability of developable land Business climate
Tend to be more stable over time, facilitating general trend forecasting.
63© 2014 OnCourse Learning. All Rights Reserved.