Embed Size (px)
Citation preview

Chapter 6:
Real Estate Market Analysis
1© 2014 OnCourse Learning. All Rights Reserved.

2
R.E. “Market Analysis”
is a collection of practical analytical tools and procedures designed to help answer decision questions, such as:
Geltner MIT/CRE© 2014 OnCourse Learning. All Rights Reserved.
3
Decision Questions What size or type of building to develop on a specific site? What type of tenants to look for in marketing a particular
building? What the rent and expiration term should be on a given
lease? When to begin construction on a development project? How many units to build this year? Which cities and property types to invest in so as to
allocate capital where rents are more likely to grow? Where to locate new retail outlets and/or which stores
should be closed?
Geltner MIT/CRE© 2014 OnCourse Learning. All Rights Reserved.
4
Market Analysis usually requires quantitative or qualitative understanding
(& prediction) of:
Demand Side
Supply Side
of the Space Usage Market relevant to some R.E. decision.
Geltner MIT/CRE© 2014 OnCourse Learning. All Rights Reserved.
5
Two Major Types (levels) of Market Analysis:
Specific micro-level analysis Applies to single property, site, or user E.g., feasibility analysis or site analysis for a
development project “shoe leather…” (also mktg consultants like Claritas)
Broader, more general characterization of a space market Applies to an entire R.E. space market segment or
submarket E.g., forecast of supply & demand (&/or rents and
vacancy rates) in Chicago office market, or Class A office Mkt in downtown Chicago
“research shops” (or subscriptions)
Geltner MIT/CRE© 2014 OnCourse Learning. All Rights Reserved.
6
General market-level analyses focus onFive major market indicators:
1. Vacancy rate
2. Market Rent
3. Quantity of new construction starts
4. Quantity of new construction completions
5. Absorption of new space
Geltner MIT/CRE© 2014 OnCourse Learning. All Rights Reserved.
7
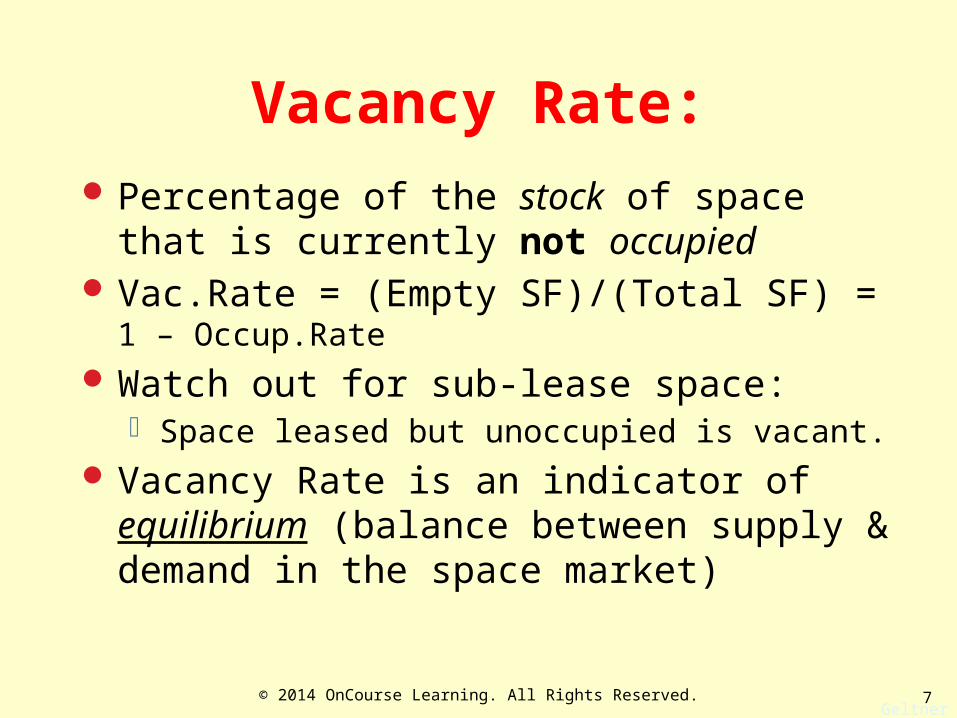
Vacancy Rate: Percentage of the stock of space that is currently not
occupied Vac.Rate = (Empty SF)/(Total SF) = 1 – Occup.Rate
Watch out for sub-lease space: Space leased but unoccupied is vacant.
Vacancy Rate is an indicator of equilibrium (balance between supply & demand in the space market)
Geltner MIT/CRE© 2014 OnCourse Learning. All Rights Reserved.
8
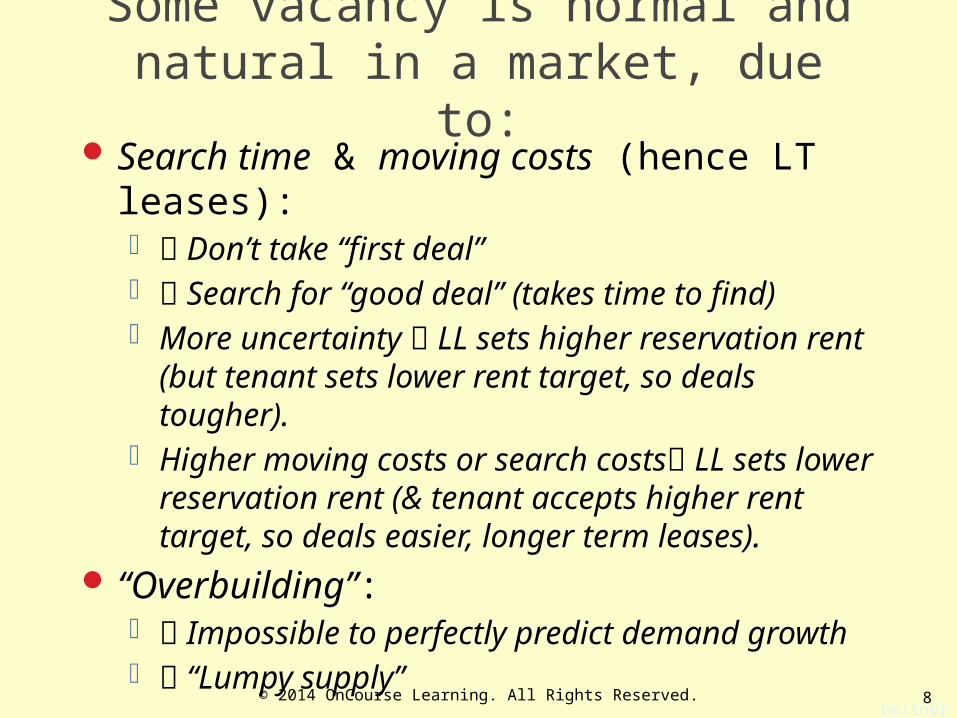
Some vacancy is normal and natural in a market, due to:
Search time & moving costs (hence LT leases): Don’t take “first deal” Search for “good deal” (takes time to find) More uncertainty LL sets higher reservation rent (but
tenant sets lower rent target, so deals tougher). Higher moving costs or search costs LL sets lower
reservation rent (& tenant accepts higher rent target, so deals easier, longer term leases).
“Overbuilding”: Impossible to perfectly predict demand growth “Lumpy supply”
Geltner MIT/CRE© 2014 OnCourse Learning. All Rights Reserved.
9
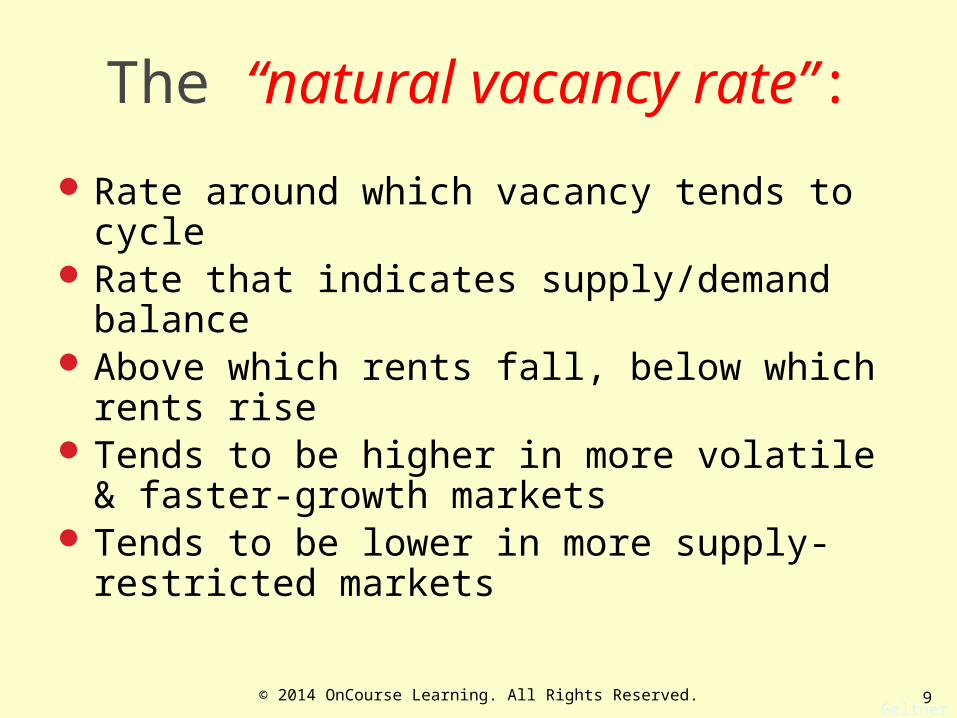
The “natural vacancy rate”:
Rate around which vacancy tends to cycle Rate that indicates supply/demand balance Above which rents fall, below which rents rise Tends to be higher in more volatile & faster-growth
markets Tends to be lower in more supply-restricted markets
Geltner MIT/CRE© 2014 OnCourse Learning. All Rights Reserved.
10
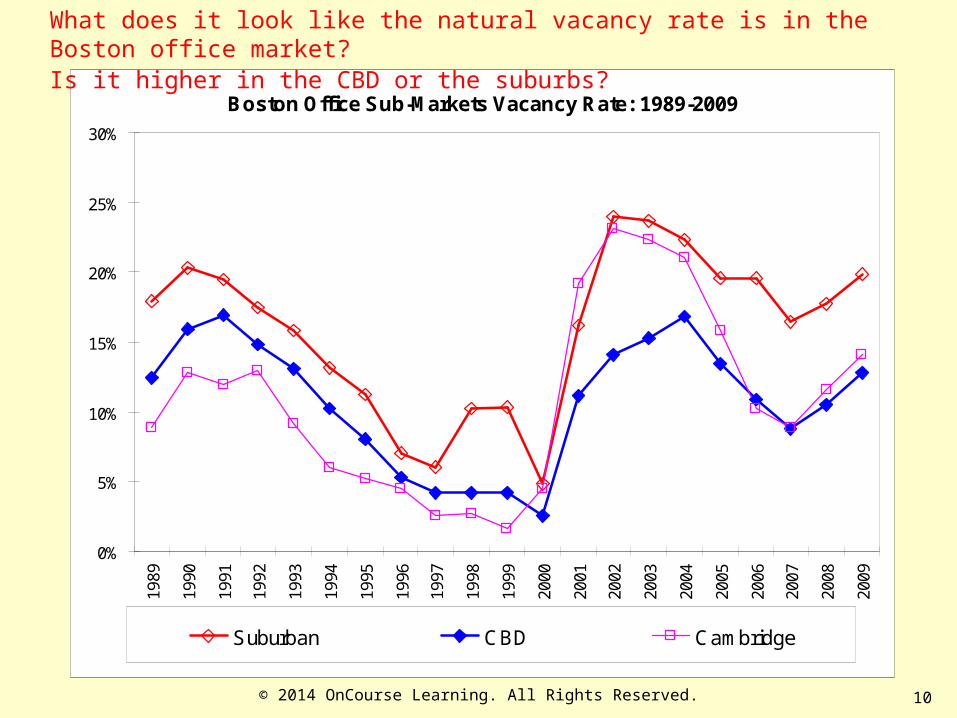
Boston Office Sub-Markets Vacancy Rate: 1989-2009
0%
5%
10%
15%
20%
25%
30%19
89
1990
1991
1992
1993
1994
1995
1996
1997
1998
1999
2000
2001
2002
2003
2004
2005
2006
2007
2008
2009
Suburban CBD Cambridge
What does it look like the natural vacancy rate is in the Boston office market?Is it higher in the CBD or the suburbs?
© 2014 OnCourse Learning. All Rights Reserved.
11
Rent:
Rent on new leases in the market Another equilibrium variable (along with vacancy
rate) Most important space market variable Tricky to accurately quantify (private info,“apples
vs oranges” problems) Watch out for “asking rent” vs. “effective rent”
Geltner MIT/CRE© 2014 OnCourse Learning. All Rights Reserved.
12
Example:
$10 rent but 1-yr abatement in 5-yr lease:
What would you say is the “effective rent”?
Geltner MIT/CRE© 2014 OnCourse Learning. All Rights Reserved.
13
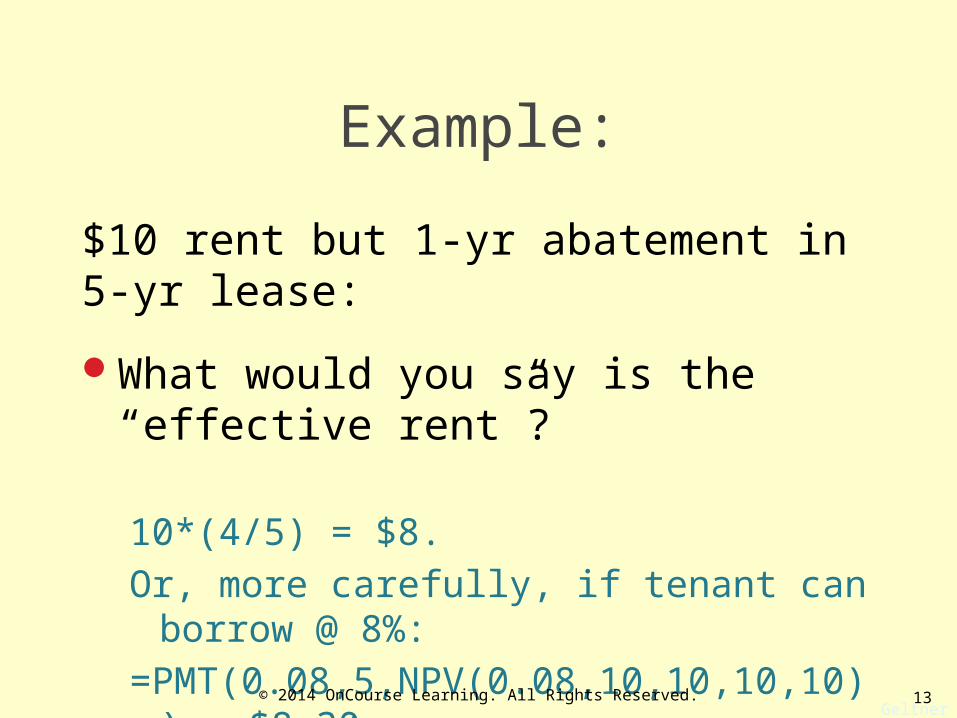
Example:
$10 rent but 1-yr abatement in 5-yr lease:
What would you say is the “effective rent”?
10*(4/5) = $8.
Or, more carefully, if tenant can borrow @ 8%:
=PMT(0.08,5,NPV(0.08,10,10,10,10)) = $8.30.
Geltner MIT/CRE© 2014 OnCourse Learning. All Rights Reserved.
14
Consider “real rent”
rent adjusted for general inflation (as better indicator of market trend)
Geltner MIT/CRE© 2014 OnCourse Learning. All Rights Reserved.
15
Construction: Supply side variable Starts & completions
Starts “Pipeline” Completions Additions to supply side of market
Don’t forget projects in permitting & planning stage too Consider net addition to supply:
Construction Completions minus Demolition & Conversion Out
Include re-habs & conversions in also
Geltner MIT/CRE© 2014 OnCourse Learning. All Rights Reserved.
16
Absorption: Change in occupied space Demand side variable “Gross absorption” = Total new lease signings
Includes moves within the market “Net absorption” = Net increase in occupied
space Net absorption more relevant for indicating
market demand: (Vacant SF)t = (Vacant SF)t-1
+ (Constr)t – (Net Absorption)t
Geltner MIT/CRE© 2014 OnCourse Learning. All Rights Reserved.
17
These market indicator variables:
Vacancy, Rent, Construction, Absorption
Can be used to help characterize & understand the current market, and forecast how it may change relevant to R.E. decisions.
Geltner MIT/CRE© 2014 OnCourse Learning. All Rights Reserved.
18
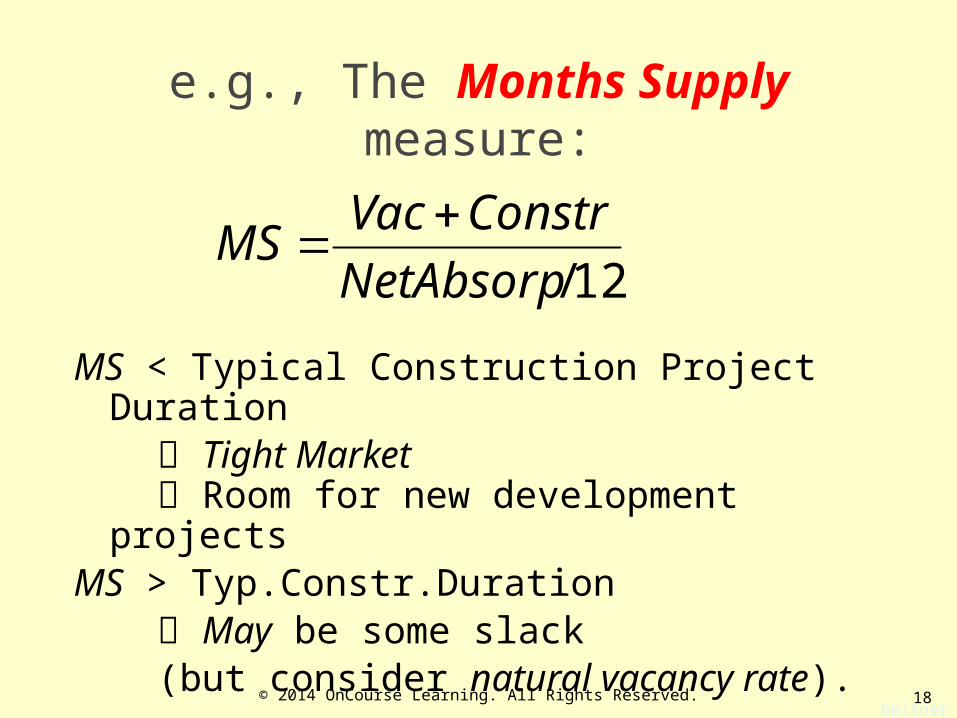
e.g., The Months Supply measure:
MS < Typical Construction Project Duration Tight Market Room for new development projects
MS > Typ.Constr.Duration May be some slack (but consider natural vacancy rate).
12/NetAbsorp
ConstrVacMS
Geltner MIT/CRE© 2014 OnCourse Learning. All Rights Reserved.
19
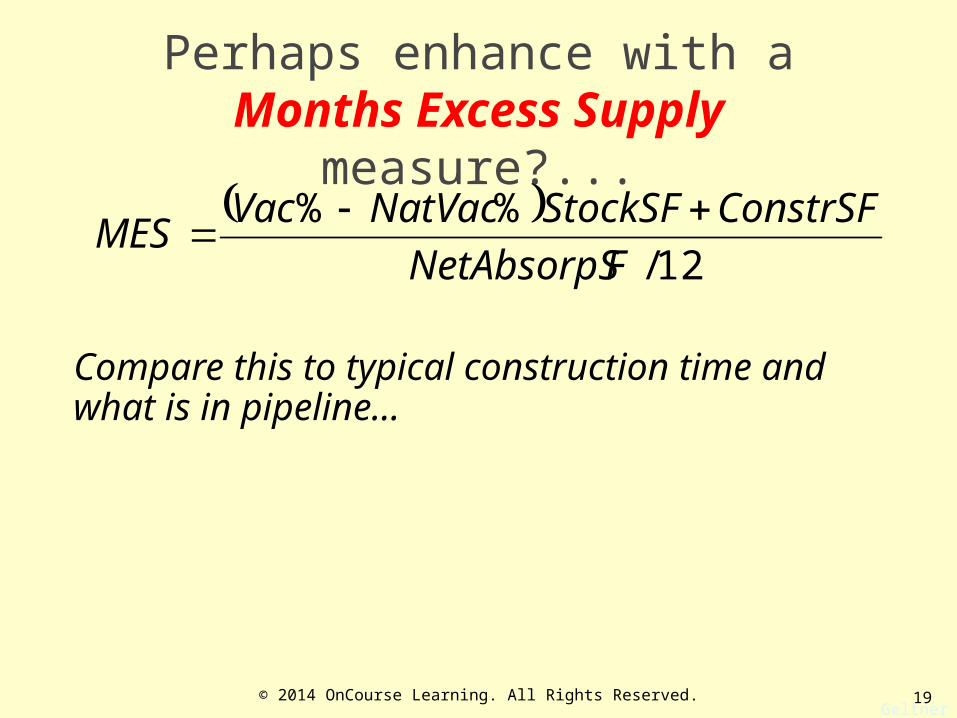
Perhaps enhance with aMonths Excess Supply measure?...
Compare this to typical construction time and what is in pipeline…
12/
%%
FNetAbsorpS
ConstrSFStockSFNatVacVacMES
Geltner MIT/CRE© 2014 OnCourse Learning. All Rights Reserved.
© 2014 OnCourse Learning. All Rights Reserved. 20
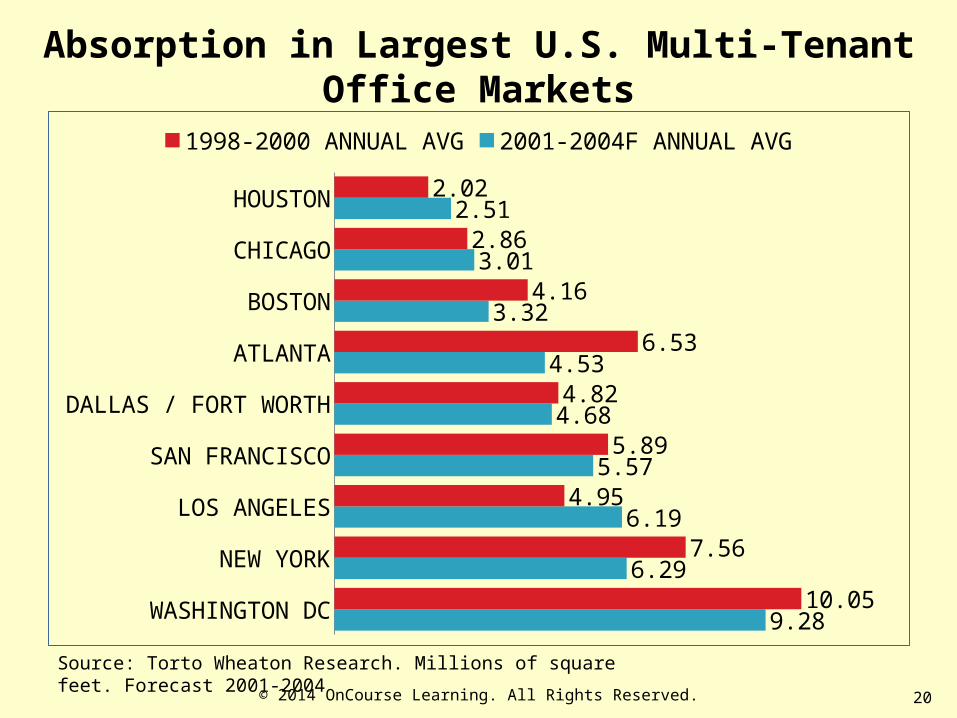
WASHINGTON DC
NEW YORK
LOS ANGELES
SAN FRANCISCO
DALLAS / FORT WORTH
ATLANTA
BOSTON
CHICAGO
HOUSTON
9.28
6.29
6.19
5.57
4.68
4.53
3.32
3.01
2.51
10.05
7.56
4.95
5.89
4.82
6.53
4.16
2.86
2.02
1998-2000 ANNUAL AVG 2001-2004F ANNUAL AVG
Absorption in Largest U.S. Multi-Tenant Office Markets
Source: Torto Wheaton Research. Millions of square feet. Forecast 2001-2004
21
Co
nst
ruct
ion
, Ab
sorp
tio
n, &
Vac
ancy
(sa
me
sc
ale
ac
ros
s 3
me
tro
s)
0%2%4%6%8%10%12%14%16%18%20%22%24%26%28%
0
10
20
30
40
50
60
70
80
90
1986Q3
1987Q3
1988Q3
1989Q3
1990Q3
1991Q3
1992Q3
1993Q3
1994Q3
1995Q3
1996Q3
1997Q3
1998Q3
1999Q3
2000Q3
2001Q3
2002Q3
2003Q3
2004Q3
2005Q3
2006Q3
2007Q3
2008Q3
2009Q3
2010Q3
Gro
ss A
skin
g Re
nt ($
/SF-
YR)
New York
Real Rent (constant 2011 dollars) Vacancy (Right Axis)
0%2%4%6%8%10%12%14%16%18%20%22%24%26%28%
0
10
20
30
40
50
60
70
80
90
1986Q3
1987Q3
1988Q3
1989Q3
1990Q3
1991Q3
1992Q3
1993Q3
1994Q3
1995Q3
1996Q3
1997Q3
1998Q3
1999Q3
2000Q3
2001Q3
2002Q3
2003Q3
2004Q3
2005Q3
2006Q3
2007Q3
2008Q3
2009Q3
2010Q3
Gro
ss A
skin
g Re
nt ($
/SF-
YR)
San Francisco
Real Rent (constant 2011 dollars) Vacancy (Right Axis)
0%2%4%6%8%10%12%14%16%18%20%22%24%26%28%
0
10
20
30
40
50
60
70
80
90
1986Q3
1987Q3
1988Q3
1989Q3
1990Q3
1991Q3
1992Q3
1993Q3
1994Q3
1995Q3
1996Q3
1997Q3
1998Q3
1999Q3
2000Q3
2001Q3
2002Q3
2003Q3
2004Q3
2005Q3
2006Q3
2007Q3
2008Q3
2009Q3
2010Q3
Gro
ss A
skin
g Re
nt ($
/SF-
YR)
Atlanta
Real Rent (constant 2011 dollars) Vacancy (Right Axis)
Vac
ancy
& R
ent
(sa
me
sc
ale
ac
ros
s 3
me
tro
s)
0%
2%
4%
6%
8%
10%
12%
14%
16%
18%
20%
22%
24%
26%
28%
-10%
-8%
-6%
-4%
-2%
0%
2%
4%
6%
8%
10%
12%
14%
16%
18%
1982Q1
1983Q1
1984Q1
1985Q1
1986Q1
1987Q1
1988Q1
1989Q1
1990Q1
1991Q1
1992Q1
1993Q1
1994Q1
1995Q1
1996Q1
1997Q1
1998Q1
1999Q1
2000Q1
2001Q1
2002Q1
2003Q1
2004Q1
2005Q1
2006Q1
2007Q1
2008Q1
2009Q1
2010Q1
2011Q1
Vaca
ncy
as P
erce
nt o
f Exi
sting
Sto
ck
Cons
truc
tion
& A
bsor
ption
As P
erce
nt o
f Exi
sting
Sto
ck a
t A
nnua
lized
Rat
e
New York
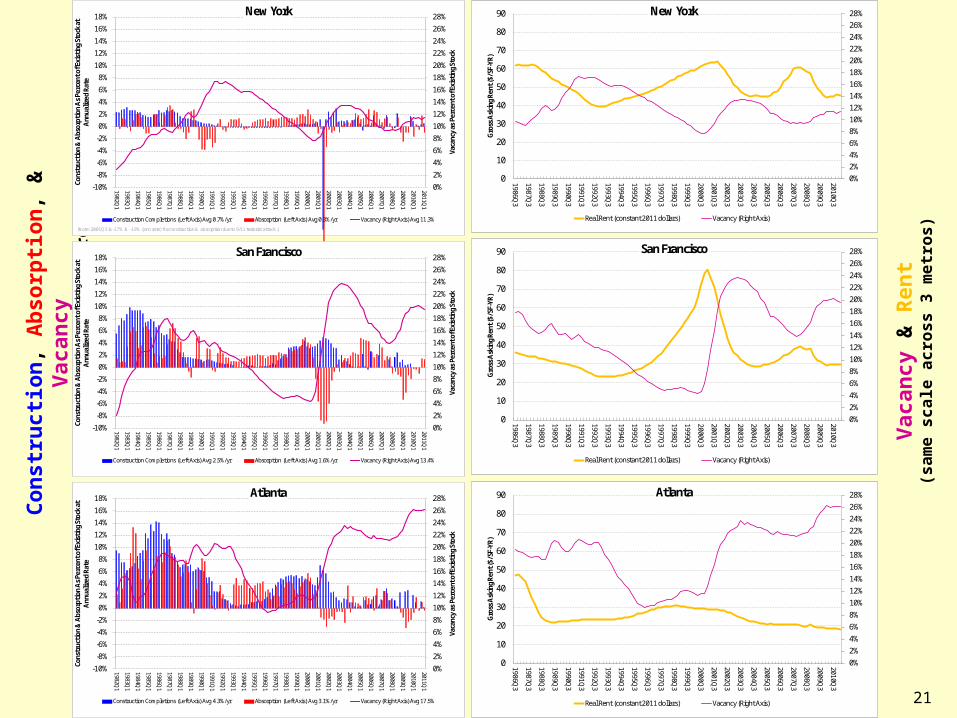
Construction Completions (Left Axis) Avg 0.7%/yr Absorption (Left Axis) Avg 0.3%/yr Vacancy (Right Axis) Avg 11.3%
(Note: 2001Q3 is -17% & -19% (ann ra te) for construction & absorption due to 9/11 terrorist a ttack.)
0%
2%
4%
6%
8%
10%
12%
14%
16%
18%
20%
22%
24%
26%
28%
-10%
-8%
-6%
-4%
-2%
0%
2%
4%
6%
8%
10%
12%
14%
16%
18%
1982Q1
1983Q1
1984Q1
1985Q1
1986Q1
1987Q1
1988Q1
1989Q1
1990Q1
1991Q1
1992Q1
1993Q1
1994Q1
1995Q1
1996Q1
1997Q1
1998Q1
1999Q1
2000Q1
2001Q1
2002Q1
2003Q1
2004Q1
2005Q1
2006Q1
2007Q1
2008Q1
2009Q1
2010Q1
2011Q1
Vaca
ncy
as P
erce
nt o
f Exi
sting
Sto
ck
Cons
truc
tion
& A
bsor
ption
As P
erce
nt o
f Exi
sting
Sto
ck a
t A
nnua
lized
Rat
e
San Francisco
Construction Completions (Left Axis) Avg 2.5%/yr Absorption (Left Axis) Avg 1.6%/yr Vacancy (Right Axis) Avg 13.4%
0%
2%
4%
6%
8%
10%
12%
14%
16%
18%
20%
22%
24%
26%
28%
-10%
-8%
-6%
-4%
-2%
0%
2%
4%
6%
8%
10%
12%
14%
16%
18%
1982Q1
1983Q1
1984Q1
1985Q1
1986Q1
1987Q1
1988Q1
1989Q1
1990Q1
1991Q1
1992Q1
1993Q1
1994Q1
1995Q1
1996Q1
1997Q1
1998Q1
1999Q1
2000Q1
2001Q1
2002Q1
2003Q1
2004Q1
2005Q1
2006Q1
2007Q1
2008Q1
2009Q1
2010Q1
2011Q1
Vaca
ncy
as P
erce
nt o
f Exi
sting
Sto
ck
Cons
truc
tion
& A
bsor
ption
As P
erce
nt o
f Exi
sting
Sto
ck a
t A
nnua
lized
Rat
e
Atlanta
Construction Completions (Left Axis) Avg 4.3%/yr Absorption (Left Axis) Avg 3.1%/yr Vacancy (Right Axis) Avg 17.5%
22
0
500
1,000
1,500
2,000
2,500
3,000
3,500
1986Q3
1987Q3
1988Q3
1989Q3
1990Q3
1991Q3
1992Q3
1993Q3
1994Q3
1995Q3
1996Q3
1997Q3
1998Q3
1999Q3
2000Q3
2001Q3
2002Q3
2003Q3
2004Q3
2005Q3
2006Q3
2007Q3
2008Q3
2009Q3
2010Q3
Gro
ss A
skin
g Re
nt ($
/mo/
unit
, Con
stan
t 201
0 $
)
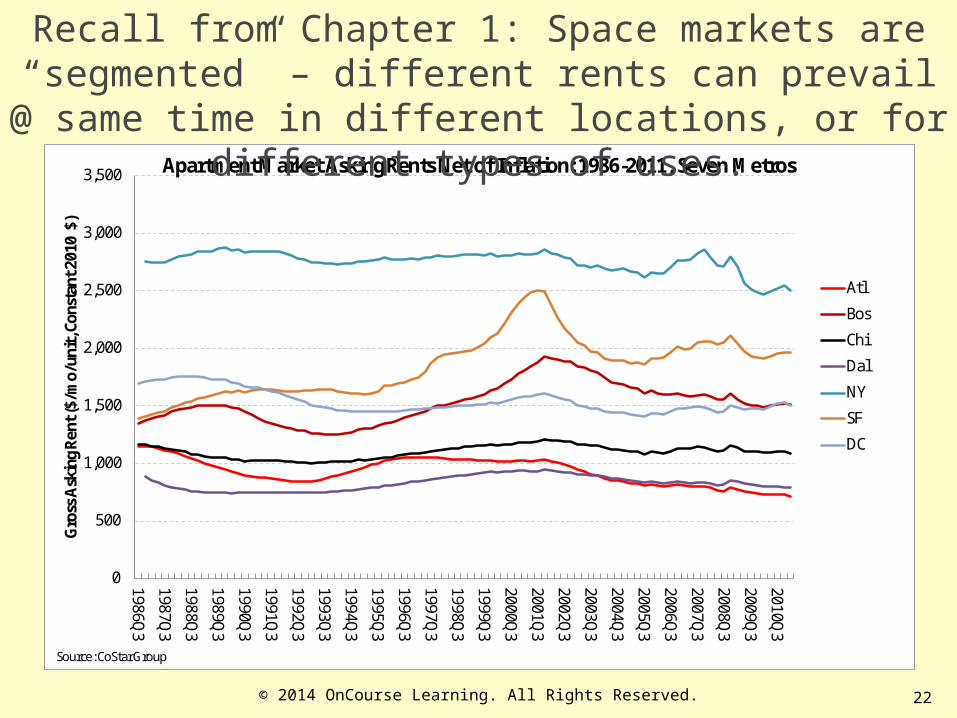
Apartment Market Asking Rents Net of Inflation: 1986-2011, Seven Metros
Atl
Bos
Chi
Dal
NY
SF
DC
Source: CoStar Group
Recall from Chapter 1: Space markets are “segmented” – different rents can prevail @ same time in different
locations, or for different types of uses.
© 2014 OnCourse Learning. All Rights Reserved.
23
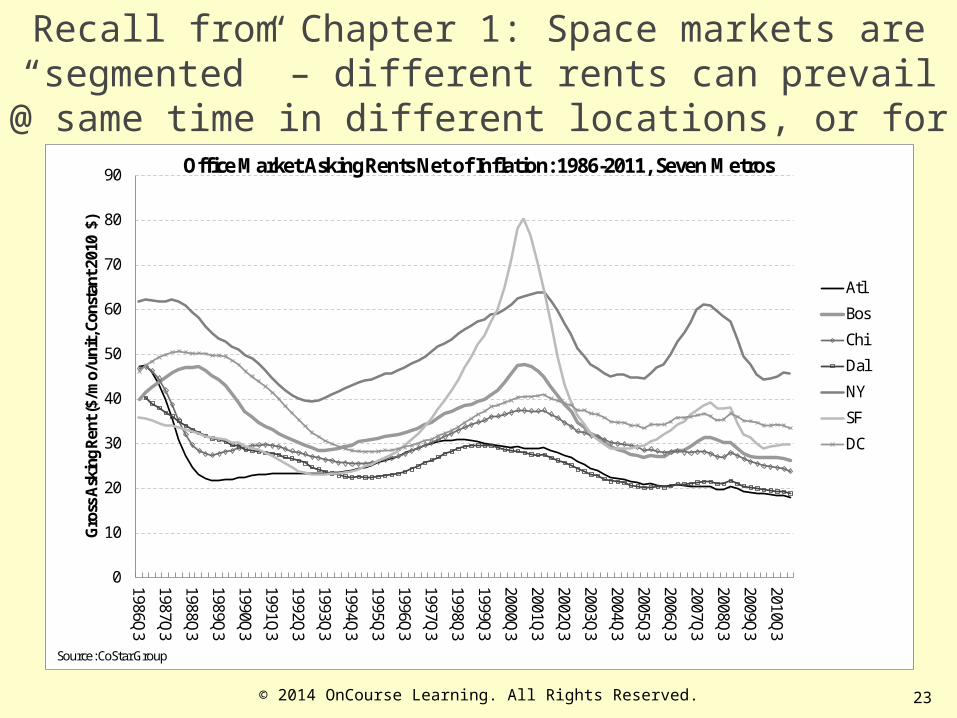
Recall from Chapter 1: Space markets are “segmented” – different rents can prevail @ same time in different
locations, or for different types of uses.
0
10
20
30
40
50
60
70
80
90
1986Q3
1987Q3
1988Q3
1989Q3
1990Q3
1991Q3
1992Q3
1993Q3
1994Q3
1995Q3
1996Q3
1997Q3
1998Q3
1999Q3
2000Q3
2001Q3
2002Q3
2003Q3
2004Q3
2005Q3
2006Q3
2007Q3
2008Q3
2009Q3
2010Q3
Gro
ss A
skin
g Re
nt ($
/mo/
unit
, Con
stan
t 201
0 $
)
Office Market Asking Rents Net of Inflation: 1986-2011, Seven Metros
Atl
Bos
Chi
Dal
NY
SF
DC
Source: CoStar Group
© 2014 OnCourse Learning. All Rights Reserved.

Defining the scope of the market analysis…
Geographic/Property type market segments (or sub-markets)
Time-frame of the study (historical, forecast to when?)
24© 2014 OnCourse Learning. All Rights Reserved.
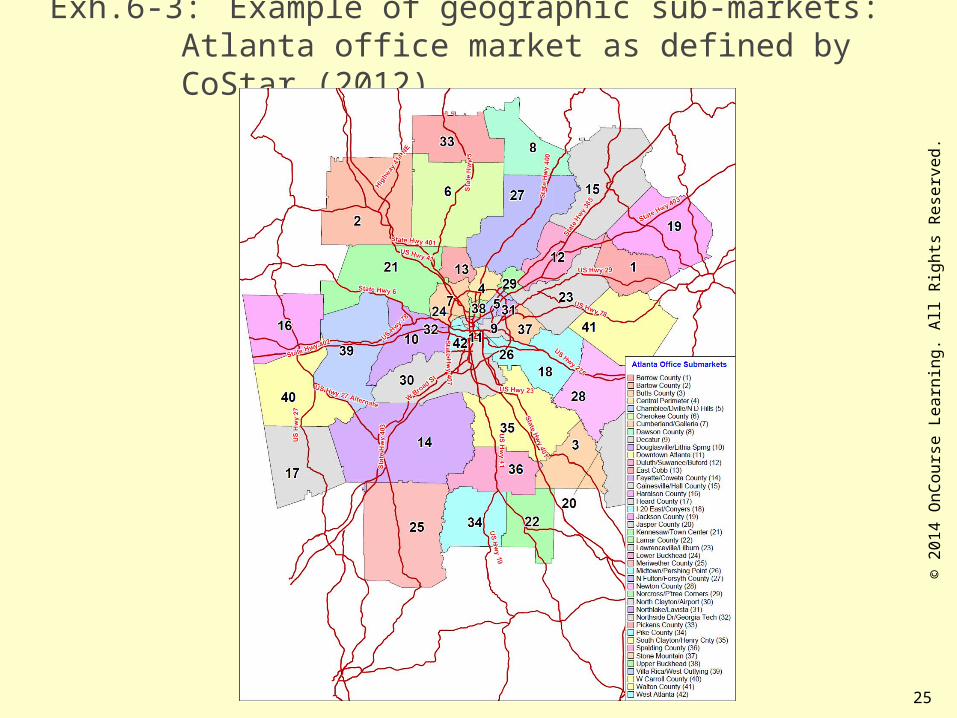
Exh.6-3: Example of geographic sub-markets: Atlanta office market as defined by CoStar (2012)…
25
© 2
014
OnC
ours
e Le
arni
ng. A
ll Ri
ghts
Res
erve
d.
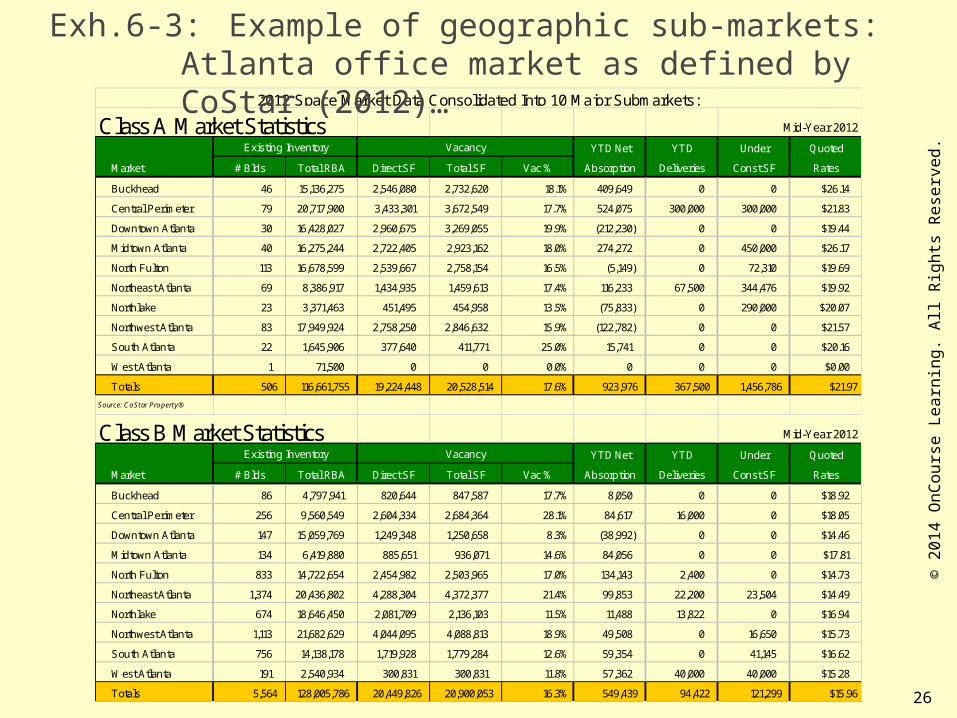
Class A Market Statistics Mid-Year 2012
YTD Net YTD Under Quoted
Market # Blds Total RBA Direct SF Total SF Vac % Absorption Deliveries Const SF Rates
Buckhead 46 15,136,275 2,546,080 2,732,620 18.1% 409,649 0 0 $26.14
Central Perimeter 79 20,717,900 3,433,301 3,672,549 17.7% 524,075 300,000 300,000 $21.83
Downtown Atlanta 30 16,428,027 2,960,675 3,269,055 19.9% (212,230) 0 0 $19.44
Midtown Atlanta 40 16,275,244 2,722,405 2,923,162 18.0% 274,272 0 450,000 $26.17
North Fulton 113 16,678,599 2,539,667 2,758,154 16.5% (5,149) 0 72,310 $19.69
Northeast Atlanta 69 8,386,917 1,434,935 1,459,613 17.4% 116,233 67,500 344,476 $19.92
Northlake 23 3,371,463 451,495 454,958 13.5% (75,833) 0 290,000 $20.07
Northwest Atlanta 83 17,949,924 2,758,250 2,846,632 15.9% (122,782) 0 0 $21.57
South Atlanta 22 1,645,906 377,640 411,771 25.0% 15,741 0 0 $20.16
West Atlanta 1 71,500 0 0 0.0% 0 0 0 $0.00
Totals 506 116,661,755 19,224,448 20,528,514 17.6% 923,976 367,500 1,456,786 $21.97
Source: CoStar Property®
Class B Market Statistics Mid-Year 2012
YTD Net YTD Under Quoted
Market # Blds Total RBA Direct SF Total SF Vac % Absorption Deliveries Const SF Rates
Buckhead 86 4,797,941 820,644 847,587 17.7% 8,050 0 0 $18.92
Central Perimeter 256 9,560,549 2,604,334 2,684,364 28.1% 84,617 16,000 0 $18.05
Downtown Atlanta 147 15,059,769 1,249,348 1,250,658 8.3% (38,992) 0 0 $14.46
Midtown Atlanta 134 6,419,880 885,651 936,071 14.6% 84,056 0 0 $17.81
North Fulton 833 14,722,654 2,454,982 2,503,965 17.0% 134,143 2,400 0 $14.73
Northeast Atlanta 1,374 20,436,802 4,288,304 4,372,377 21.4% 99,853 22,200 23,504 $14.49
Northlake 674 18,646,450 2,081,709 2,136,103 11.5% 11,488 13,822 0 $16.94
Northwest Atlanta 1,113 21,682,629 4,044,095 4,088,813 18.9% 49,508 0 16,650 $15.73
South Atlanta 756 14,138,178 1,719,928 1,779,284 12.6% 59,354 0 41,145 $16.62
West Atlanta 191 2,540,934 300,831 300,831 11.8% 57,362 40,000 40,000 $15.28
Totals 5,564 128,005,786 20,449,826 20,900,053 16.3% 549,439 94,422 121,299 $15.96
Existing Inventory Vacancy
Existing Inventory Vacancy
2012 Space Market Data Consolidated Into 10 Major Submarkets:
Exh.6-3: Example of geographic sub-markets: Atlanta office market as defined by CoStar (2012)…
26
© 2
014
OnC
ours
e Le
arni
ng. A
ll Ri
ghts
Res
erve
d.
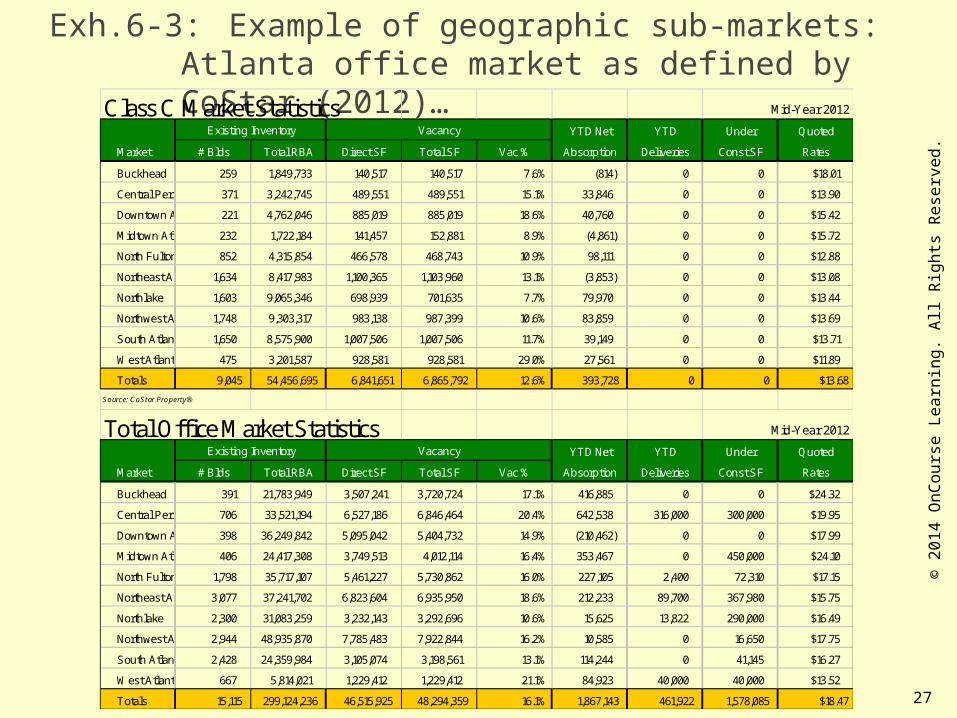
Exh.6-3: Example of geographic sub-markets: Atlanta office market as defined by CoStar (2012)…
Class C Market Statistics Mid-Year 2012
YTD Net YTD Under Quoted
Market # Blds Total RBA Direct SF Total SF Vac % Absorption Deliveries Const SF Rates
Buckhead 259 1,849,733 140,517 140,517 7.6% (814) 0 0 $18.01
Central Perimeter 371 3,242,745 489,551 489,551 15.1% 33,846 0 0 $13.90
Downtown Atlanta 221 4,762,046 885,019 885,019 18.6% 40,760 0 0 $15.42
Midtown Atlanta 232 1,722,184 141,457 152,881 8.9% (4,861) 0 0 $15.72
North Fulton 852 4,315,854 466,578 468,743 10.9% 98,111 0 0 $12.88
Northeast Atlanta 1,634 8,417,983 1,100,365 1,103,960 13.1% (3,853) 0 0 $13.08
Northlake 1,603 9,065,346 698,939 701,635 7.7% 79,970 0 0 $13.44
Northwest Atlanta 1,748 9,303,317 983,138 987,399 10.6% 83,859 0 0 $13.69
South Atlanta 1,650 8,575,900 1,007,506 1,007,506 11.7% 39,149 0 0 $13.71
West Atlanta 475 3,201,587 928,581 928,581 29.0% 27,561 0 0 $11.89
Totals 9,045 54,456,695 6,841,651 6,865,792 12.6% 393,728 0 0 $13.68
Source: CoStar Property®
Total Office Market Statistics Mid-Year 2012
YTD Net YTD Under Quoted
Market # Blds Total RBA Direct SF Total SF Vac % Absorption Deliveries Const SF Rates
Buckhead 391 21,783,949 3,507,241 3,720,724 17.1% 416,885 0 0 $24.32
Central Perimeter 706 33,521,194 6,527,186 6,846,464 20.4% 642,538 316,000 300,000 $19.95
Downtown Atlanta 398 36,249,842 5,095,042 5,404,732 14.9% (210,462) 0 0 $17.99
Midtown Atlanta 406 24,417,308 3,749,513 4,012,114 16.4% 353,467 0 450,000 $24.10
North Fulton 1,798 35,717,107 5,461,227 5,730,862 16.0% 227,105 2,400 72,310 $17.15
Northeast Atlanta 3,077 37,241,702 6,823,604 6,935,950 18.6% 212,233 89,700 367,980 $15.75
Northlake 2,300 31,083,259 3,232,143 3,292,696 10.6% 15,625 13,822 290,000 $16.49
Northwest Atlanta 2,944 48,935,870 7,785,483 7,922,844 16.2% 10,585 0 16,650 $17.75
South Atlanta 2,428 24,359,984 3,105,074 3,198,561 13.1% 114,244 0 41,145 $16.27
West Atlanta 667 5,814,021 1,229,412 1,229,412 21.1% 84,923 40,000 40,000 $13.52
Totals 15,115 299,124,236 46,515,925 48,294,359 16.1% 1,867,143 461,922 1,578,085 $18.47
Existing Inventory Vacancy
Existing Inventory Vacancy
27
© 2
014
OnC
ours
e Le
arni
ng. A
ll Ri
ghts
Res
erve
d.
Market analysis methodology:
Simple trend extrapolation vs Structural analysis
28© 2014 OnCourse Learning. All Rights Reserved.
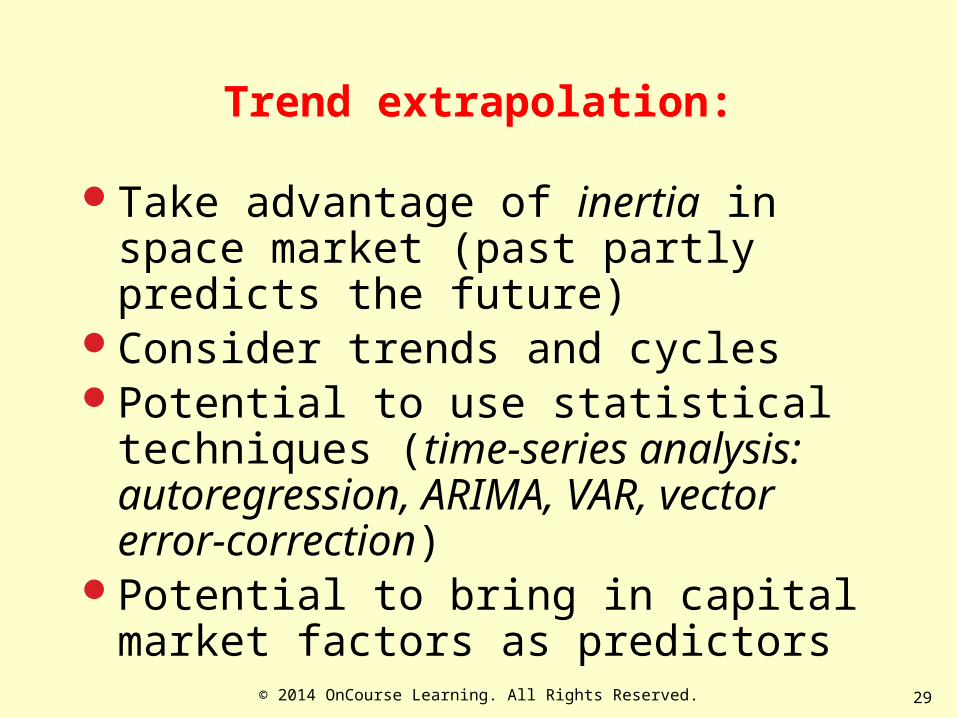
Trend extrapolation:
Take advantage of inertia in space market (past partly predicts the future)
Consider trends and cyclesPotential to use statistical techniques (time-
series analysis: autoregression, ARIMA, VAR, vector error-correction)
Potential to bring in capital market factors as predictors
29© 2014 OnCourse Learning. All Rights Reserved.
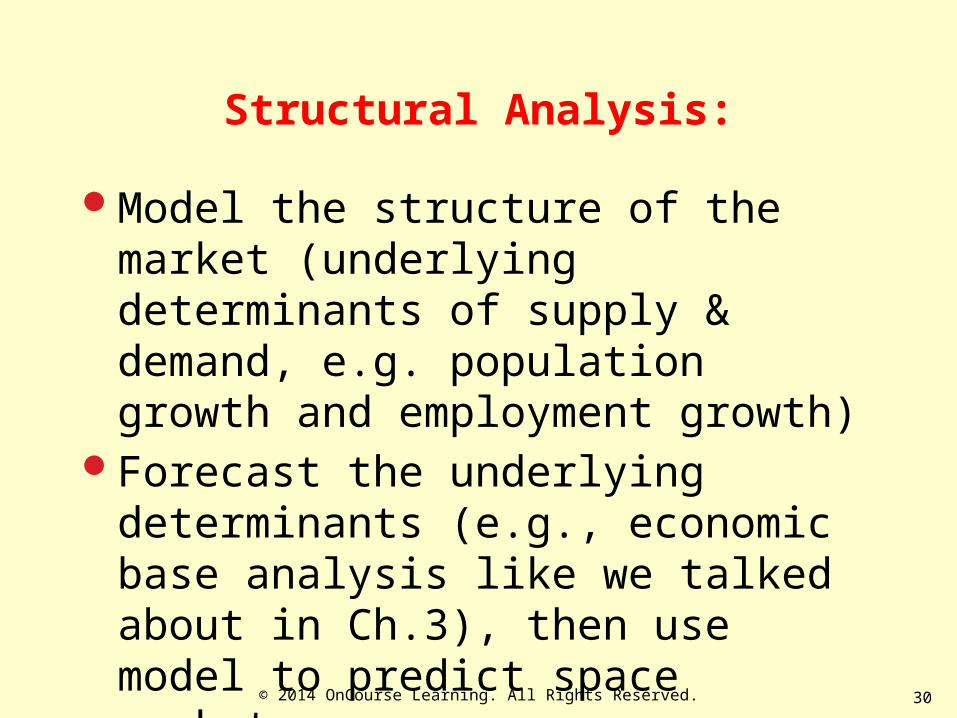
Structural Analysis:
Model the structure of the market (underlying determinants of supply & demand, e.g. population growth and employment growth)
Forecast the underlying determinants (e.g., economic base analysis like we talked about in Ch.3), then use model to predict space market.
30© 2014 OnCourse Learning. All Rights Reserved.
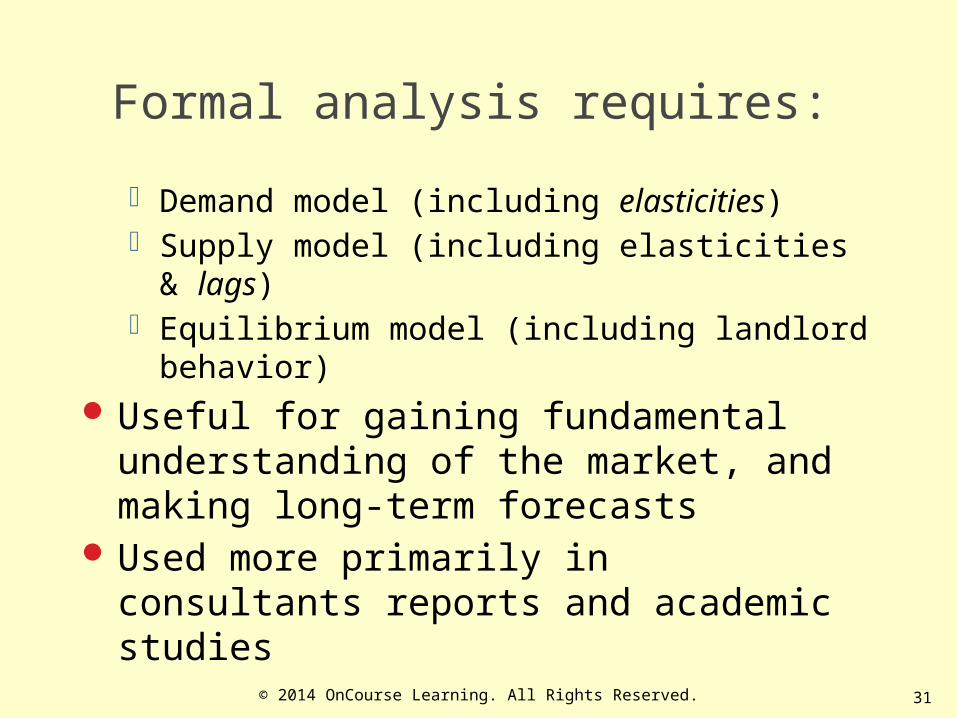
Formal analysis requires:
Demand model (including elasticities) Supply model (including elasticities & lags) Equilibrium model (including landlord behavior)
Useful for gaining fundamental understanding of the market, and making long-term forecasts
Used more primarily in consultants reports and academic studies
31© 2014 OnCourse Learning. All Rights Reserved.
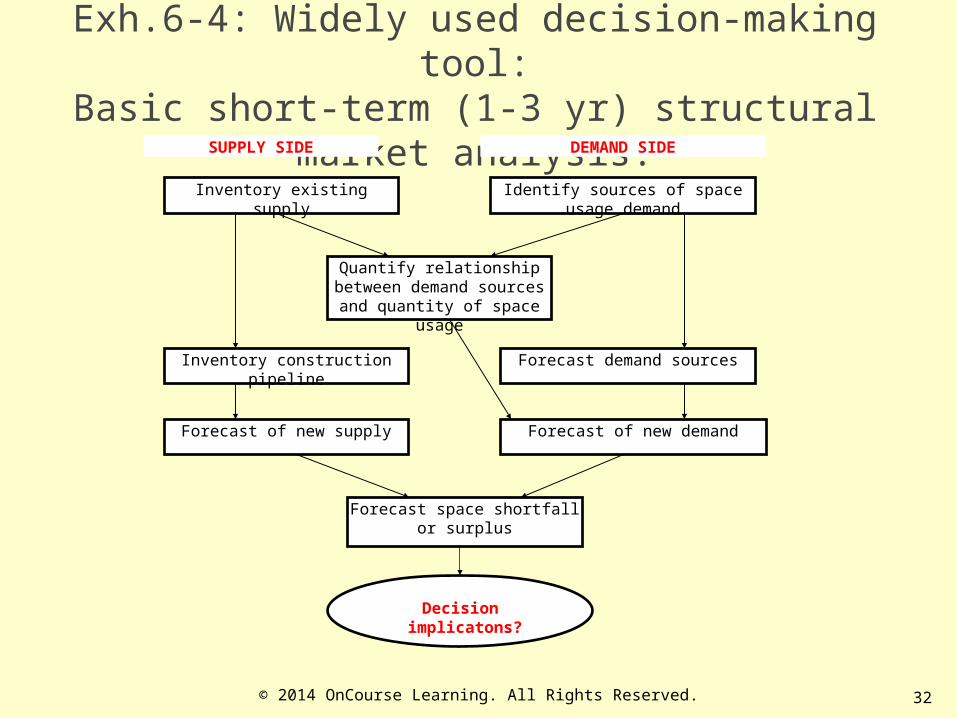
Exh.6-4: Widely used decision-making tool:Basic short-term (1-3 yr) structural market analysis:
Inventory existing supply Identify sources of space usage demand
Quantify relationship between demand sources and quantity of
space usage
Forecast demand sources
SUPPLY SIDE DEMAND SIDE
Inventory construction pipeline
Forecast of new demandForecast of new supply
Forecast space shortfall or surplus
Decision implicatons?
32© 2014 OnCourse Learning. All Rights Reserved.
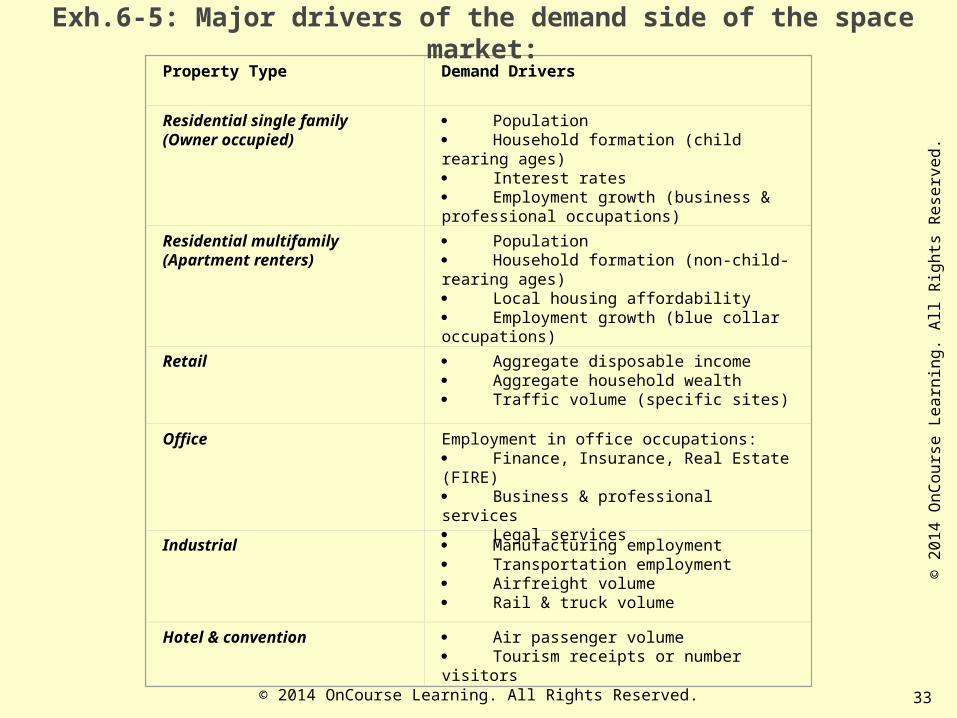
Property Type Demand Drivers
Residential single family(Owner occupied)
· Population· Household formation (child rearing ages)· Interest rates· Employment growth (business & professional occupations)
Residential multifamily(Apartment renters)
· Population· Household formation (non-child-rearing ages)· Local housing affordability· Employment growth (blue collar occupations)
Retail · Aggregate disposable income· Aggregate household wealth· Traffic volume (specific sites)
Office Employment in office occupations:· Finance, Insurance, Real Estate (FIRE)· Business & professional services· Legal services
Industrial · Manufacturing employment· Transportation employment· Airfreight volume· Rail & truck volume
Hotel & convention · Air passenger volume· Tourism receipts or number visitors
Exh.6-5: Major drivers of the demand side of the space market:
33© 2014 OnCourse Learning. All Rights Reserved.
© 2
014
OnC
ours
e Le
arni
ng. A
ll Ri
ghts
Res
erve
d.
34
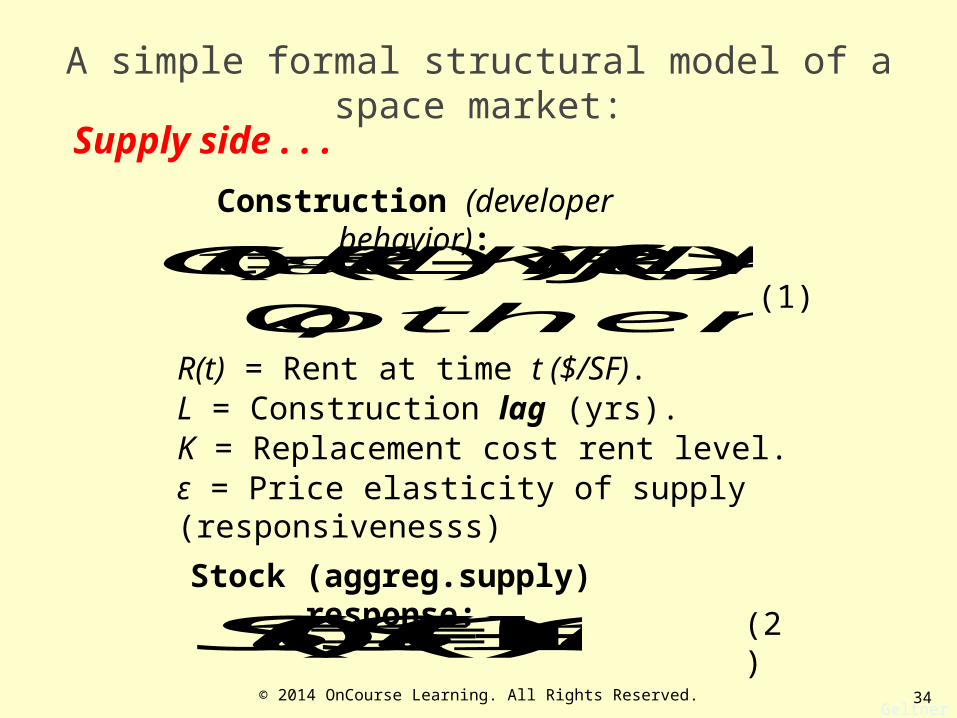
A simple formal structural model of a space market:
Supply side . . .
)()1()( tCtStS Stock (aggreg.supply) response:
(2)
otherwise
KLtRifKLtRtC
,0
,)(),)(()( Construction (developer behavior):
(1)
R(t) = Rent at time t ($/SF).L = Construction lag (yrs).K = Replacement cost rent level.ε = Price elasticity of supply (responsivenesss)
Geltner MIT/CRE© 2014 OnCourse Learning. All Rights Reserved.
35
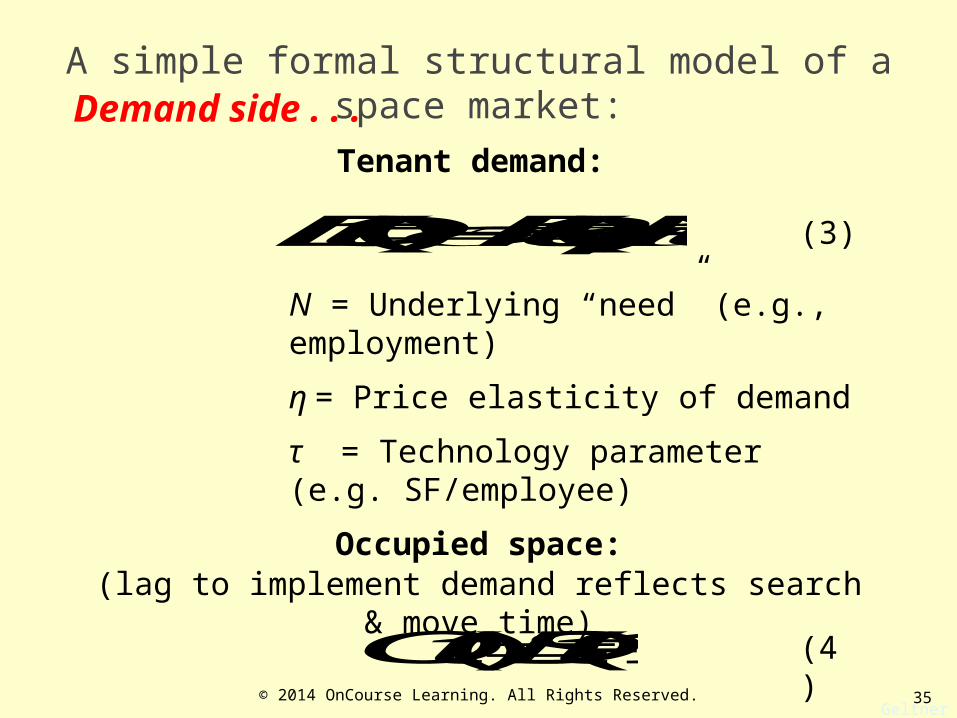
A simple formal structural model of a space market:Demand side . . .
)()()( tNtRtD
Tenant demand:
N = Underlying “need” (e.g., employment)
η = Price elasticity of demand
τ = Technology parameter (e.g. SF/employee)
(3)
)1()( tDtOS
Occupied space:(lag to implement demand reflects search & move time)
(4)
Geltner MIT/CRE© 2014 OnCourse Learning. All Rights Reserved.
36
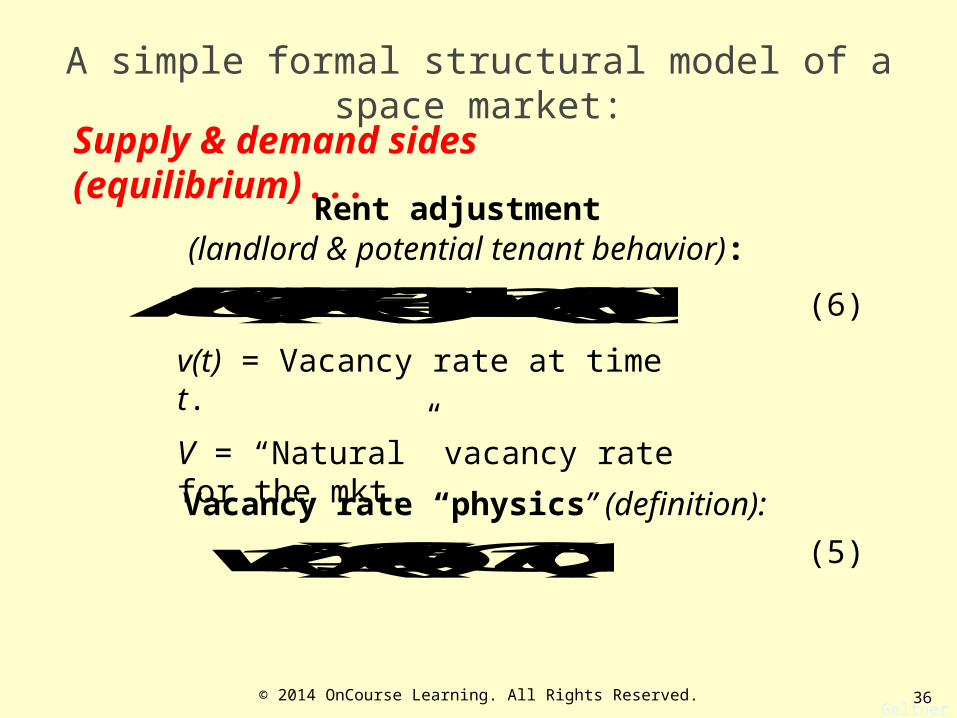
A simple formal structural model of a space market:
Supply & demand sides (equilibrium) . . .
))/))(((1)(1()( VVtvtRtR
Rent adjustment (landlord & potential tenant behavior):
(6)
v(t) = Vacancy rate at time t.
V = “Natural” vacancy rate for the mkt.
Vacancy rate “physics” (definition):
)(/))()(()( tStOStStv (5)
Geltner MIT/CRE© 2014 OnCourse Learning. All Rights Reserved.
37
Put these six equations together . . .
Numerical example typical parameters:· Supply sensitivity = 0.3· Demand sensitivity = 0.3· Technology = 200 SF/employee· Demand intercept = 10 million SF· Rent sensitivity = 0.3· Construction lag L = 3 years
Geltner MIT/CRE© 2014 OnCourse Learning. All Rights Reserved.
38
0.0
0.1
0.2
0.3
0.4
0.5
0.6
0.7
0
10
20
30
40
50
60
70
80
90
100
1 4 7 10 13 16 19 22 25 28 31 34 37 40
Co
nst
r. M
SF
Va
c, R
en
t, E
mp
l.
Year
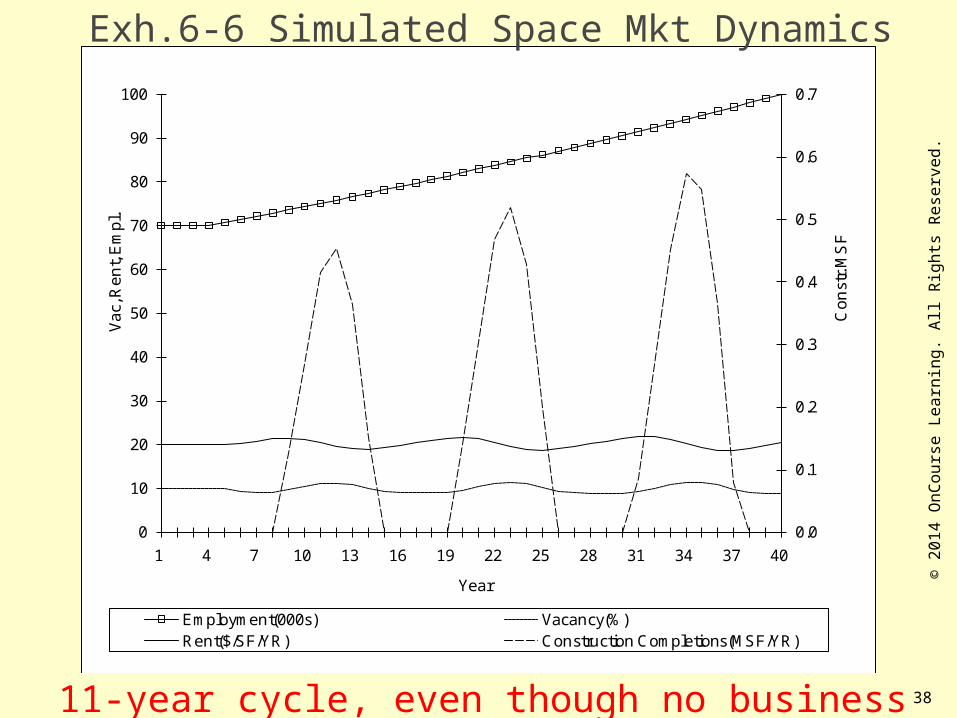
Employment(000s) Vacancy(%)Rent($/SF/YR) Construction Completions(MSF/YR)
Exh.6-6 Simulated Space Mkt Dynamics
11-year cycle, even though no business cycle!
© 2
014
OnC
ours
e Le
arni
ng. A
ll Ri
ghts
Res
erve
d.
39
0.0
5.0
10.0
15.0
20.0
25.0
Vac
, Ren
t
Year
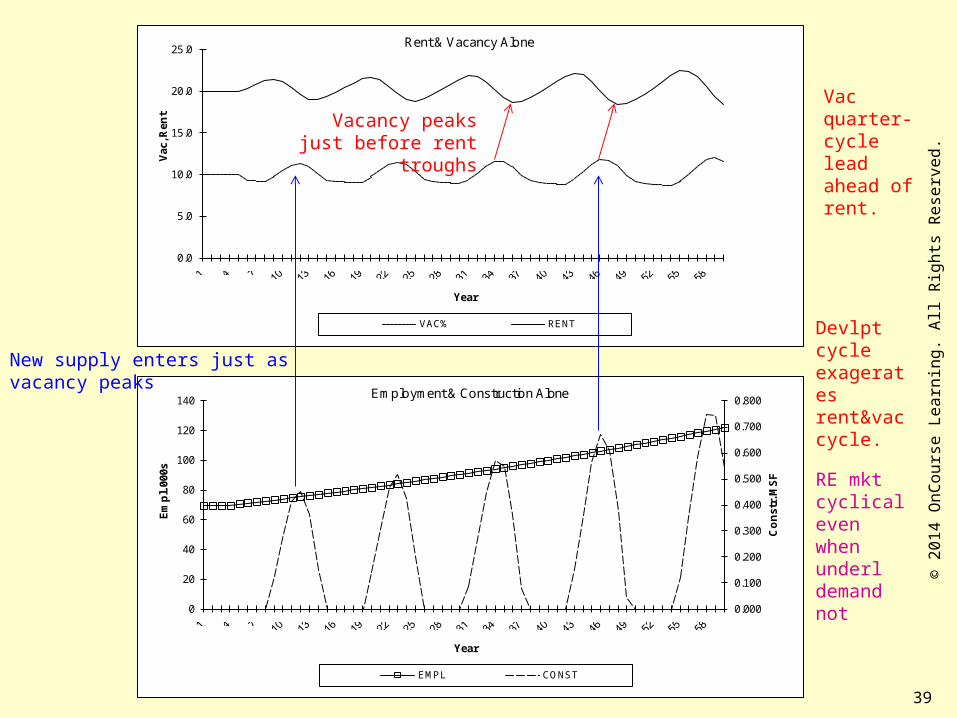
Rent & Vacancy Alone
VAC% RENT
Vacancy peaks just before rent troughs
RE mkt cyclical even when underl demand not
Devlpt cycle exagerates rent&vac cycle.
0.000
0.100
0.200
0.300
0.400
0.500
0.600
0.700
0.800
0
20
40
60
80
100
120
140
Co
nst
r. M
SF
Em
pl.
000s
Year
Employment & Construction Alone
EMPL CONST
New supply enters just as vacancy peaks
Vac quarter-cycle lead ahead of rent.
© 2
014
OnC
ours
e Le
arni
ng. A
ll Ri
ghts
Res
erve
d.
40
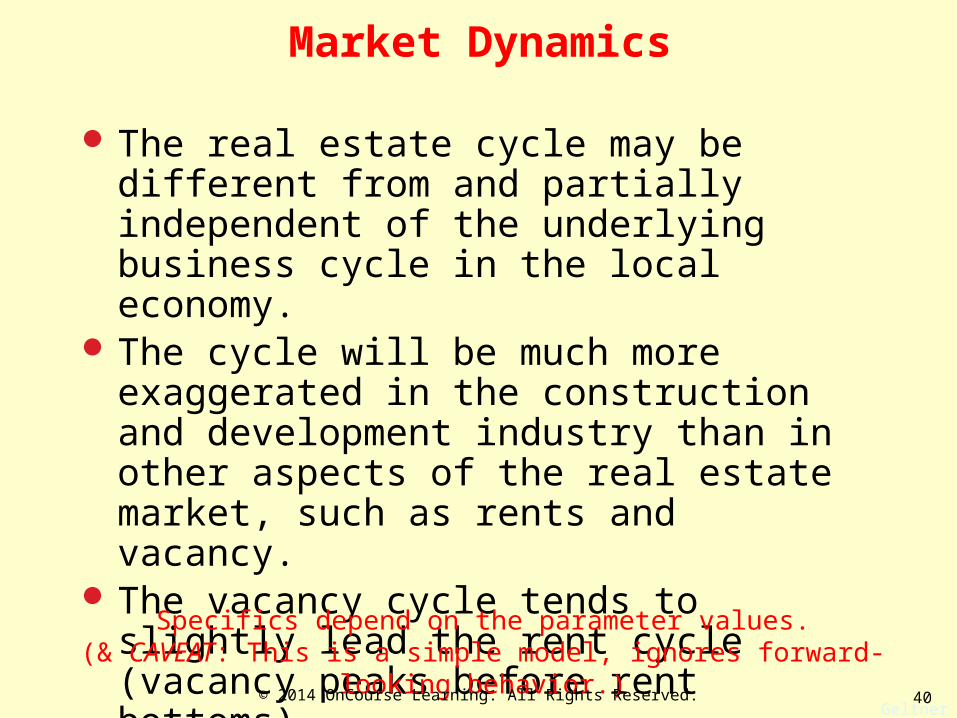
Market Dynamics
The real estate cycle may be different from and partially independent of the underlying business cycle in the local economy.
The cycle will be much more exaggerated in the construction and development industry than in other aspects of the real estate market, such as rents and vacancy.
The vacancy cycle tends to slightly lead the rent cycle (vacancy peaks before rent bottoms).
New construction completions tend to peak when vacancy peaks.
Geltner MIT/CRE
Specifics depend on the parameter values.(& CAVEAT: This is a simple model, ignores forward-looking behavior.)
© 2014 OnCourse Learning. All Rights Reserved.

41
Market Dynamics
In the preceding model, were any of the market participants forward-looking?
What features of the above results do you think are due to myopia or purely adaptive behavior on the part of the market participants?
In the real world, what factors or elements in the real estate system will tend to be forward-looking?
In the real world, will it be possible to perfectly forecast the future? Will some market participants likely be somewhat myopic or adaptive in their behavior?
Geltner MIT/CRE© 2014 OnCourse Learning. All Rights Reserved.
42
SPACE MARKET
SUPPLY (Landlords)
DEMAND (Tenants)
RENTS &
OCCUPANCY
LOCAL &
NATIONAL ECONOMY
FORECAST FUTURE
ASSET MARKET
SUPPLY
(Owners
Selling)
D EMAND
(Investors
Buying)
CASH
FLOW
MKT
REQ’D
CAP
RATE
PROPERTY
MARKET
VALUE
DEVELOPMENT INDUSTRY
IS DEVELPT
PROFITABLE ?
CONSTR
COST INCLU LAND
IF YES
ADDS NEW
CAPITAL MKTS
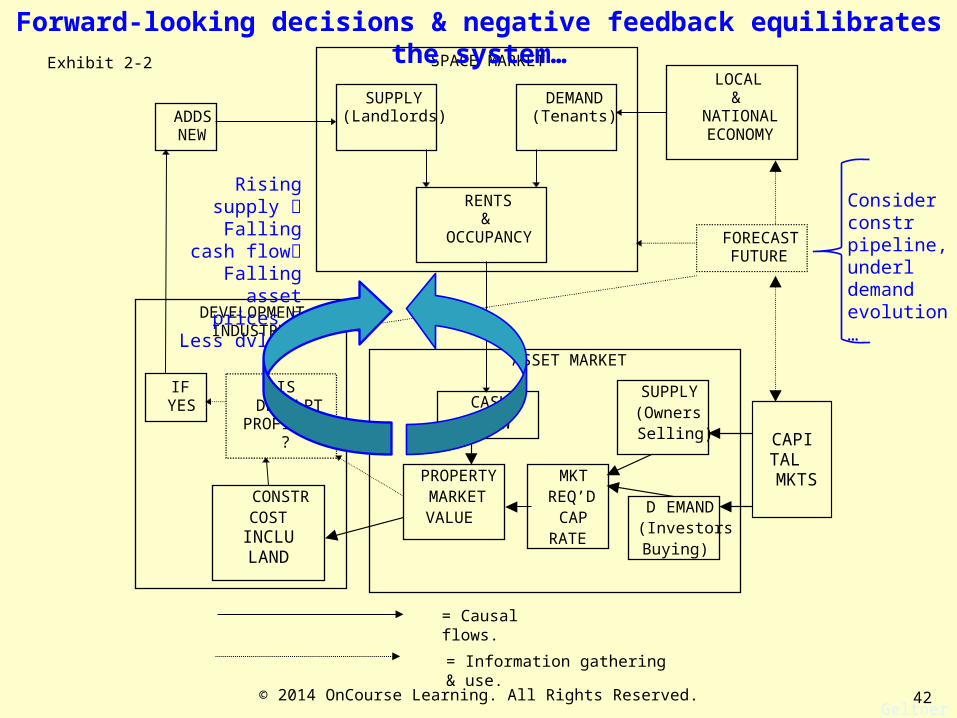
= Causal flows.
= Information gathering & use.
Geltner MIT/CRE
Rising supply Falling cash
flow Falling asset prices
Less dvlpt…
Forward-looking decisions & negative feedback equilibrates the system…
Consider constr pipeline, underl demand evolution…
Exhibit 2-2
© 2014 OnCourse Learning. All Rights Reserved.
43
SPACE MARKET
SUPPLY (Landlords)
DEMAND (Tenants)
RENTS &
OCCUPANCY
LOCAL &
NATIONAL ECONOMY
FORECAST FUTURE
ASSET MARKET
SUPPLY
(Owners
Selling)
D EMAND
(Investors
Buying)
CASH
FLOW
MKT
REQ’D
CAP
RATE
PROPERTY
MARKET
VALUE
DEVELOPMENT INDUSTRY
IS DEVELPT
PROFITABLE ?
CONSTR
COST INCLU LAND
IF YES
ADDS NEW
CAPITAL MKTS
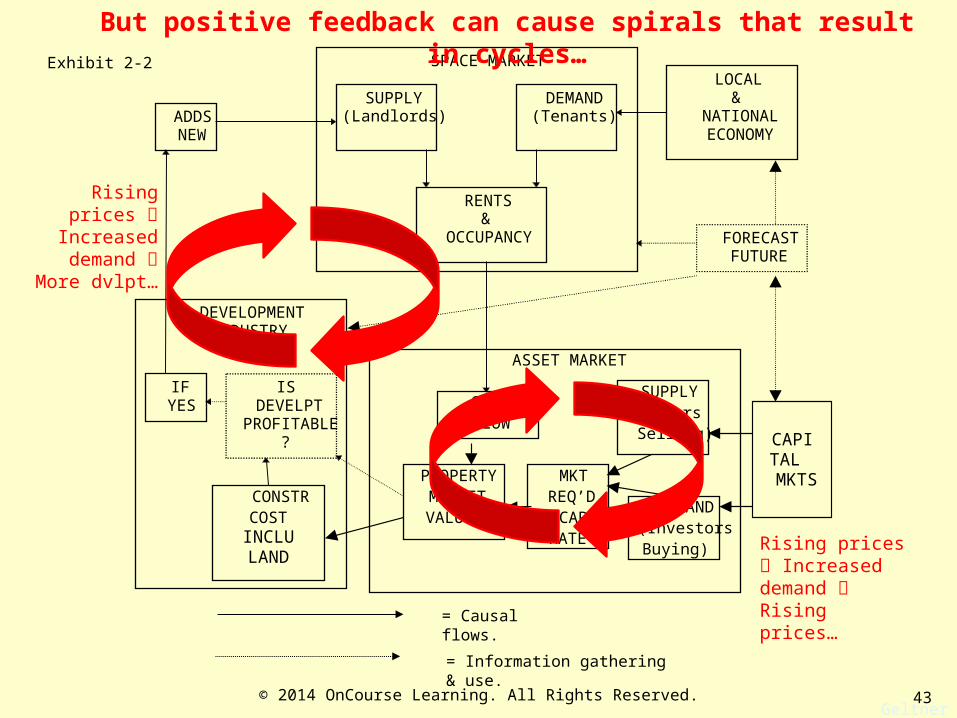
= Causal flows.
= Information gathering & use.
Geltner MIT/CRE
Rising prices Increased demand Rising prices…
But positive feedback can cause spirals that result in cycles…
Rising prices Increased demand
More dvlpt…
Exhibit 2-2
© 2014 OnCourse Learning. All Rights Reserved.
44Geltner MIT/CRE
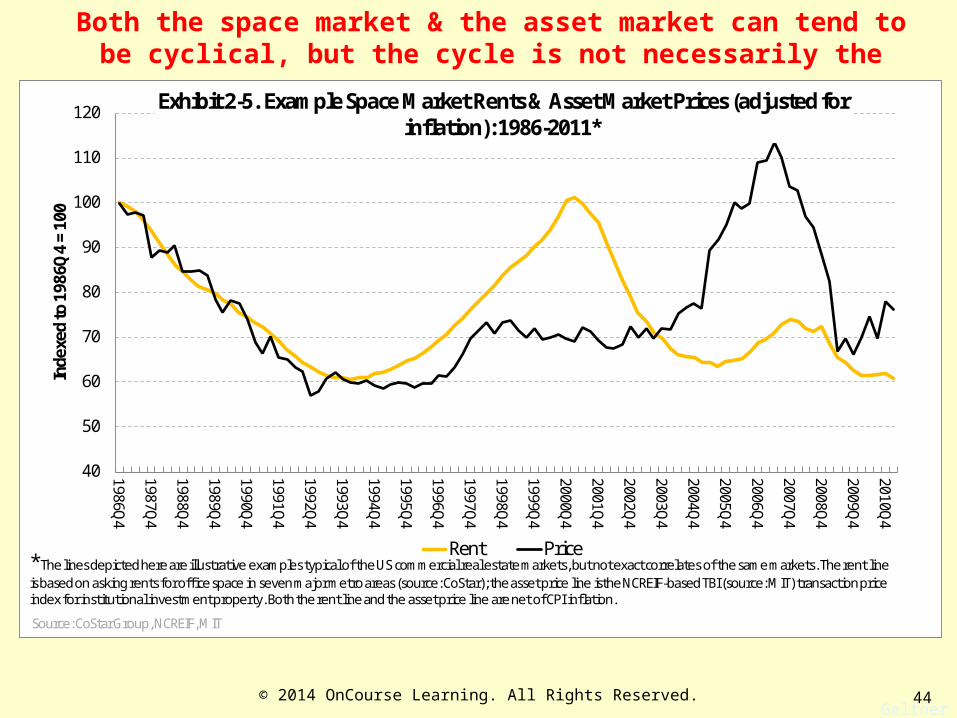
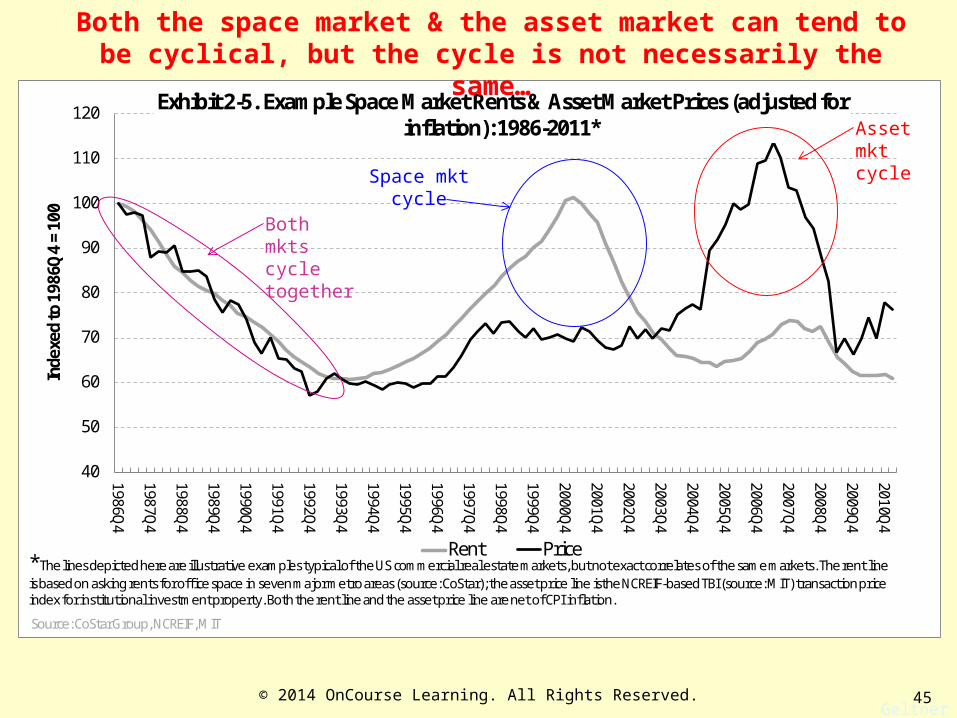
Both the space market & the asset market can tend to be cyclical, but the cycle is not necessarily the same…
40
50
60
70
80
90
100
110
120
1986Q4
1987Q4
1988Q4
1989Q4
1990Q4
1991Q4
1992Q4
1993Q4
1994Q4
1995Q4
1996Q4
1997Q4
1998Q4
1999Q4
2000Q4
2001Q4
2002Q4
2003Q4
2004Q4
2005Q4
2006Q4
2007Q4
2008Q4
2009Q4
2010Q4
Inde
xed
to 1
986Q
4 =
100
Exhibit 2-5. Example Space Market Rents & Asset Market Prices (adjusted for inflation): 1986-2011*
Rent Price
Source: CoStar Group, NCREIF, MIT
*The lines depicted here are illustrative examples typical of the US commercial real estate markets, but not exact correlates of the same markets. The rent line is based on asking rents for office space in seven major metro areas (source: CoStar); the asset price line isthe NCREIF-based TBI (source: MIT) transaction price index for institutional investment property. Both the rent line and the asset price line are net of CPI inflation.
© 2014 OnCourse Learning. All Rights Reserved.
45Geltner MIT/CRE
40
50
60
70
80
90
100
110
120
1986Q4
1987Q4
1988Q4
1989Q4
1990Q4
1991Q4
1992Q4
1993Q4
1994Q4
1995Q4
1996Q4
1997Q4
1998Q4
1999Q4
2000Q4
2001Q4
2002Q4
2003Q4
2004Q4
2005Q4
2006Q4
2007Q4
2008Q4
2009Q4
2010Q4
Inde
xed
to 1
986Q
4 =
100
Exhibit 2-5. Example Space Market Rents & Asset Market Prices (adjusted for inflation): 1986-2011*
Rent Price
Source: CoStar Group, NCREIF, MIT
*The lines depicted here are illustrative examples typical of the US commercial real estate markets, but not exact correlates of the same markets. The rent line is based on asking rents for office space in seven major metro areas (source: CoStar); the asset price line isthe NCREIF-based TBI (source: MIT) transaction price index for institutional investment property. Both the rent line and the asset price line are net of CPI inflation.
Both the space market & the asset market can tend to be cyclical, but the cycle is not necessarily the same…
Space mkt cycle
Asset mkt cycle
Both mkts cycle together
© 2014 OnCourse Learning. All Rights Reserved.