Embed Size (px)
Citation preview


S E C F O R M 1 7 - Q 1
3 4 2 1 8
A Y A L A C O R P O R A T I O N A N D S U B S I D I A
R I E S
3 2 F T O 3 5 F , T O W E R O N E A N D E X C H
A N G E P L A Z A , A Y A L A T R I A N G L E , A Y
A L A A V E N U E , M A K A T I C I T Y
1 2 3 1 1 7 - Q
C F D
Dept. Requiring this Doc.
6 6 2 8 P 4 0 B. bonds
Total No. Of Stockholders
Remarks = pls. Use black ink for scanning purposes
Document I.D.
Cashier
S T A M P S
Domestic Foreign
To be accomplished by SEC Personnel concerned
File Number LCU
Total Amount of Borrow ings
Contact Person Company Telephone Number
Month Day Month Day
Fiscal Year Annual Meeting
Secondary License Type, if Applicable
Amended Articles Number/Section
COVER SHEET
(Company's Full Name)
(Business Address: No. Street City / Tow n / Province)
Josephine G. De Asis 908-3000

S E C F O R M 1 7 - Q 2
SEC No. 34218 File No. _____
AYALA CORPORATION
(Company’s Full Name)
32F to 35F, Tower One and Exchange Plaza Ayala Triangle, Ayala Avenue
Makati City
(Company’s Address)
908-3000
(Telephone Number)
September 30, 2017
(Quarter Ending) (Month & Day)
SEC Form 17- Q Quarterly Report
(Form Type)

S E C F O R M 1 7 - Q 3
SECURITIES AND EXCHANGE COMMISSION (SEC)
SEC FORM 17-Q
QUARTERLY REPORT PURSUANT TO SECTION 17 OF THE SECURITIES REGULATION CODE (SRC) AND SRC RULE 17(2)(b) THEREUNDER
1. For the quarterly period ended: September 30, 2017 2. SEC Identification No.: 34218 3. BIR Tax Identification No. 000-153-610-000 4. Exact name of the registrant as specified in its charter: AYALA CORPORATION 5. Province, country or other jurisdiction of incorporation or organization: Makati City, Philippines 6. Industry Classification Code: _______ (SEC Use Only) 7. Address of principal office: 32F to 35F, Tower One and Exchange Plaza, Ayala Triangle,
Ayala Avenue, Makati City Postal Code: 1226
8. Registrant’s telephone number: (632) 908-3000 / 908-3357 9. Former name, former address, former fiscal year: Not applicable 10. Securities registered pursuant to Sections 8 and 12 of the SRC, or Sections 4 and 8 of the RSA:
Title of each class Number of shares issued & outstanding As of September 30, 2017
Preferred A Preferred B Series 1 Preferred B Series 2
12,000,000* 20,000,000** 27,000,000***
Voting Preferred Common
200,000,000 621,246,593
* All are in treasury shares ** Net of 8,000,000 treasury shares *** Net of 3,000,000 treasury shares
Amount of debt outstanding as of September 30, 2017: P40 billion in bonds**** ****amount represents only debt of Ayala Corporation registered with Philippine SEC. The debt of subsidiaries registered with SEC are reported in their respective SEC17Q report.
11. Are any or all of these securities listed in the Philippine Stock Exchange? Yes [x] No [ ]
As of September 30, 2017, a total of 616,784,515 common shares, 12,000,000 preferred A (“ACPA”) shares, 28,000,000 preferred B series 1 (“ACPB1”) shares, and 30,000,000 preferred B series 2 (“ACPB2”) shares are listed in the Philippine Stock Exchange (“PSE”). A total of 12,000,000 ACPA shares, 8,000,000 ACPB1 shares, and 3,000,000 ACPB2 shares are held in Treasury by the Company.
12. Check whether the registrant: (a) has filed all reports required to be filed by Section 17 of the Code and SRC Rule 17
thereunder or Section 11 of the RSA and RSA Rule 11 (a)-1 thereunder, and Sections 26 and 141 of the Corporation Code of the Philippines during the preceding 12 months (or for such shorter period that the registrant was required to file such reports):
Yes [x] No [ ] (b) has been subject to such filing requirements for the past 90 days: Yes [x] No [ ]

S E C F O R M 1 7 - Q 4
TABLE OF CONTENTS
The unaudited interim condensed consolidated financial statements and other parts of the entire SEC 17Q report as of September 30, 2017 make reference to certain financial information and disclosures in the December 31, 2016 annual audited consolidated financial statements. This SEC17Q report should be read in conjunction with the Group’s annual audited consolidated financial statements as of and for the year ended December 31, 2016*. This SEC17Q report also include financial and operating data with respect to Ayala’s material subsidiaries [Ayala Land, Inc. (ALI), Integrated Micro-Electronics, Inc. (IMI), and Manila Water Company, Inc. (MWC)], associate [Bank of the Philippine Islands (BPI)] and joint venture [Globe Telecom, Inc. (Globe)]. This SEC 17Q should be read in conjunction with the financial information and operating highlights of these subsidiaries, associate and joint venture as contained in their respective December 31, 2016 audited financial statements and SEC17A reports and SEC17Q report as of September 30, 2017.**
*The audited consolidated financial reports and SEC 17A report of Ayala Corporation and Subsidiaries as of December 31, 2016 are available at the Company's website www.ayala.com.ph. **The audited consolidated financial reports and SEC 17A reports as of December 31, 2016 as well as SEC 17Q report as of September 30, 2017 of the following listed companies under the Group are available in the following websites: ALI www.ayalaland.com.ph, IMI www.global-imi.com, MWC www.manilawater.com.ph, BPI www.bpiexpressonline.com, and Globe www.globe.com.ph
PART I FINANCIAL INFORMATION Item 1 Financial Statements
Unaudited Interim Condensed Consolidated Statement of Financial Position as at September 30, 2017 (With Comparative Audited Figures as at December 31, 2016) 6
Unaudited Interim Condensed Consolidated Statements of Income For the Three Months and Nine Months Ended September 30, 2017 and 2016 7 Unaudited Interim Condensed Consolidated Statements of Comprehensive Income For the Three Months and Nine Months Ended September 30, 2017 and 2016 8 Unaudited Interim Condensed Consolidated Statements of Changes in Equity
For the Periods Ended September 30, 2017 and 2016 (With Comparative Audited Figures for the Year Ended December 31, 2016) 9
Unaudited Interim Condensed Consolidated Statements of Cash Flows For the Periods Ended September 30, 2017 and 2016 11
Notes to Unaudited Interim Condensed Consolidated Financial Statements 13
Item 2 Management’s Discussion and Analysis of
Financial Condition and Results of Operations 63 PART II OTHER INFORMATION 74 SIGNATURES 78

S E C F O R M 1 7 - Q 5
PART I FINANCIAL INFORMATION Item 1 Financial Statements

S E C F O R M 1 7 - Q 6
AYALA CORPORATION AND SUBSIDIARIES
UNAUDITED INTERIM CONDENSED CONSOLIDATED STATEMENT OF FINANCIAL POSITION
As at September 30, 2017 (With Comparative Audited Figures as at December 31, 2016)
(Amounts in Thousands)
September 2017 December 2016
Unaudited Audited
Current Assets
Cash and cash equivalents (Note 4) 74,117,277₱ 60,223,324₱
Short-term investments (Note 5) 2,314,711 1,008,705
Accounts and notes receivable (Note 6) 124,687,688 116,841,963
Inventories (Note 7) 76,719,895 76,752,875
Other current assets (Note 8) 46,459,499 33,638,483
Total Current Assets 324,299,070 288,465,350 - -
Noncurrent Assets
Noncurrent accounts and notes receivable (Note 6) 33,091,746 36,484,347
Land and improvements (Note 9) 100,527,668 101,049,171
Investments in associates and joint ventures (Note 10) 201,425,466 180,313,743
Investment properties (Note 12) 127,339,078 110,916,644
Property, plant and equipment (Note 12) 81,633,137 64,074,471
Service concession assets (Note 13) 87,555,134 82,422,249
Intangible assets (Note 11) 14,713,868 9,716,403
Deferred tax assets - net (Note 11) 12,599,721 12,414,647
Pension and other noncurrent assets (Note 8) 29,190,385 25,847,478
Total Noncurrent Assets 688,076,203 623,239,153
Total Assets 1,012,375,273₱ 911,704,503₱
LIABILITIES AND EQUITY
Current Liabilities
Short-term debt (Note 16) 23,240,170₱ 30,858,137₱
Accounts payable and accrued expenses (Note 14) 171,638,761 164,600,578
Income tax payable 1,719,070 2,270,315
Current portion of:
Long-term debt (Note 16) 13,545,443 19,792,669
Service concession obligation 763,792 754,519
Other current liabilities (Note 15) 20,183,207 17,522,984
Total Current Liabilities 231,090,443 235,799,202
Noncurrent Liabilities
Long-term debt - net of current portion (Note 16) 314,590,803 245,203,145
Service concession obligation - net of current portion 6,757,855 6,822,862
Deferred tax liabilities - net 9,031,471 9,543,754
Pension liabilities 2,304,424 2,469,140
Other noncurrent liabilities (Note 15) 45,071,141 40,870,522
Total Noncurrent Liabilities 377,755,694 304,909,423
Total Liabilities 608,846,137 540,708,625 -
Equity
Equity attributable to owners of the parent
Paid-in capital (Note 17) 74,784,747 74,379,760
Share-based payments 280,078 495,759
Remeasurement losses on defined benefit plans (1,630,124) (1,548,192)
Net unrealized loss on available-for-sale financial assets (950,095) (466,676)
Cumulative translation adjustments 3,180,176 1,414,550
Equity reserve 11,362,115 12,211,275
Equity conversion option (Note 16) 1,113,745 1,113,745
Retained earnings (Note 17) 166,708,025 145,622,311
Treasury stock (2,300,000) (2,300,000)
252,548,667 230,922,532
Non-controlling interests 150,980,469 140,073,346
Total Equity 403,529,136 370,995,878
Total Liabilities and Equity 1,012,375,273₱ 911,704,503₱
See accompanying Notes to Unaudited Interim Condensed Consolidated Financial Statements.
ASSETS
S E C F O R M 1 7 - Q 7
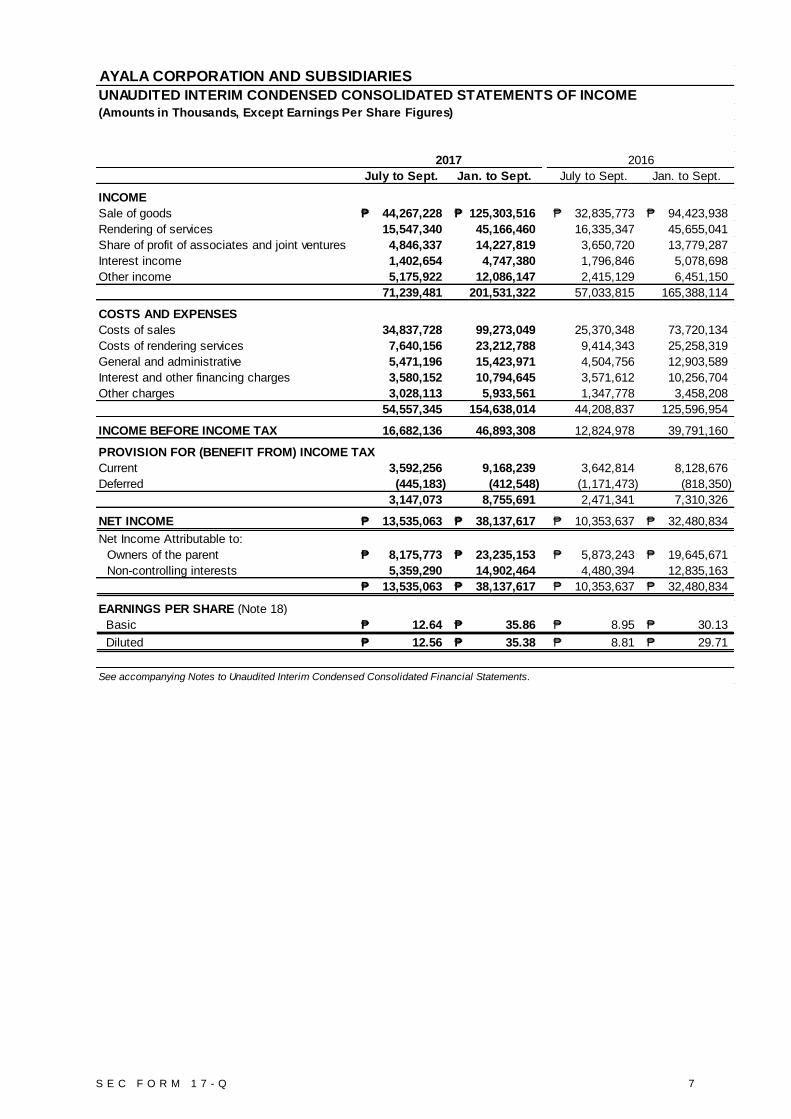
AYALA CORPORATION AND SUBSIDIARIES
UNAUDITED INTERIM CONDENSED CONSOLIDATED STATEMENTS OF INCOME
(Amounts in Thousands, Except Earnings Per Share Figures)
YTD Previous Qtr.
July to Sept. Jan. to Sept. July to Sept. Jan. to Sept.
INCOME
Sale of goods 44,267,228₱ 125,303,516₱ 32,835,773₱ 94,423,938₱
Rendering of services 15,547,340 45,166,460 16,335,347 45,655,041
Share of profit of associates and joint ventures 4,846,337 14,227,819 3,650,720 13,779,287
Interest income 1,402,654 4,747,380 1,796,846 5,078,698
Other income 5,175,922 12,086,147 2,415,129 6,451,150
71,239,481 201,531,322 57,033,815 165,388,114
COSTS AND EXPENSES
Costs of sales 34,837,728 99,273,049 25,370,348 73,720,134
Costs of rendering services 7,640,156 23,212,788 9,414,343 25,258,319
General and administrative 5,471,196 15,423,971 4,504,756 12,903,589
Interest and other financing charges 3,580,152 10,794,645 3,571,612 10,256,704
Other charges 3,028,113 5,933,561 1,347,778 3,458,208
54,557,345 154,638,014 44,208,837 125,596,954
INCOME BEFORE INCOME TAX 16,682,136 46,893,308 12,824,978 39,791,160
PROVISION FOR (BENEFIT FROM) INCOME TAX
Current 3,592,256 9,168,239 3,642,814 8,128,676
Deferred (445,183) (412,548) (1,171,473) (818,350)
3,147,073 8,755,691 2,471,341 7,310,326
NET INCOME 13,535,063₱ 38,137,617₱ 10,353,637₱ 32,480,834₱
Net Income Attributable to:
Owners of the parent 8,175,773₱ 23,235,153₱ 5,873,243₱ 19,645,671₱
Non-controlling interests 5,359,290 14,902,464 4,480,394 12,835,163
13,535,063₱ 38,137,617₱ 10,353,637₱ 32,480,834₱
EARNINGS PER SHARE (Note 18)
Basic 12.64₱ 35.86₱ 8.95₱ 30.13₱
Diluted 12.56₱ 35.38₱ 8.81₱ 29.71₱
See accompanying Notes to Unaudited Interim Condensed Consolidated Financial Statements.
2017 2016

S E C F O R M 1 7 - Q 8
AYALA CORPORATION AND SUBSIDIARIES
UNAUDITED INTERIM CONDENSED CONSOLIDATED STATEMENTS OF COMPREHENSIVE INCOME
(Amounts in Thousands)
YTD Previous Qtr.
2017 2016
July to Sept. Jan. to Sept. July to Sept. Jan. to Sept.
NET INCOME 13,535,063₱ 38,137,617₱ 10,353,637₱ 32,480,834₱
OTHER COMPREHENSIVE INCOME (LOSS)
Other comprehensive income (loss) that may be reclassified
to profit or loss in subsequent periods:
Exchange differences arising from translations of foreign investments 1,532,710 2,968,051 852,595 967,417
Changes in fair values of available-for-sale financial assets 2,699 (612,296) 21,907 (304,040)
Other comprehensive income not to be reclassified
to profit or loss in subsequent periods:
Remeasurement gains (losses) on defined benefit plans - net 42,572 (5,600) (30,812) (59,830)
1,577,981 2,350,155 843,690 603,547
SHARE OF OTHER COMPREHENSIVE INCOME (LOSS)
OF ASSOCIATES AND JOINT VENTURES
Other comprehensive income (loss) that may be reclassified
to profit or loss in subsequent periods:
Exchange differences arising from translations of foreign investments 3,310 60,880 (7,700) (79,987)
Changes in fair values of available-for-sale financial assets 148,304 133,767 5,734 699,161
Other comprehensive income (loss) not to be reclassified
to profit or loss in subsequent periods:
Remeasurement gains (losses) on defined benefit plans (104,066) (47,142) (5,098) (7,842)
47,548 147,505 (7,064) 611,332
TOTAL OTHER COMPREHENSIVE INCOME (LOSS), NET OF TAX 1,625,529 2,497,660 836,626 1,214,879
TOTAL COMPREHENSIVE INCOME 15,160,592₱ 40,635,277₱ 11,190,263₱ 33,695,713₱
Total Comprehensive Income Attributable to:
Owners of the parent 8,980,593₱ 24,435,428₱ 6,491,715₱ 20,628,560₱
Non-controlling interests 6,179,999 16,199,849 4,698,548 13,067,153
15,160,592₱ 40,635,277₱ 11,190,263₱ 33,695,713₱
See accompanying Notes to Unaudited Interim Condensed Consolidated Financial Statements.

S E C F O R M 1 7 - Q 9
AYALA CORPORATION AND SUBSIDIARIES
UNAUDITED INTERIM CONDENSED CONSOLIDATED STATEMENTS OF CHANGES IN EQUITY
(Amounts in Thousands)
Paid-in
Capital
Share-
based
Payments
Remeasurement
Gains/(Losses)
on Defined
Benefit Plans
Net Unrealized
Gain (Loss) on
Available-for-
Sale Financial
Assets
Cumulative
Translation
Adjustments
Equity
Reserve
Equity -
Conversion
Option
Retained
Earnings
Treasury
Stock Total
Non-
controlling
Interests Total Equity
At January 1, 2017 74,379,760₱ 495,759₱ (1,548,192)₱ (466,676)₱ 1,414,550₱ 12,211,275₱ 1,113,745₱ 145,622,311₱ (2,300,000)₱ 230,922,532₱ 140,073,346₱ 370,995,878₱
Net Income - - - - - - - 23,235,153 - 23,235,153 14,902,464 38,137,617
Other comprehensive income (loss) - - (34,790) (617,186) 1,704,746 - - - - 1,052,770 1,297,385 2,350,155
Share in other comprehensive income
(loss) of associates and joint ventures - - (47,142) 133,767 60,880 - - - - 147,505 - 147,505
Total comprehensive income (loss) - - (81,932) (483,419) 1,765,626 - - 23,235,153 - 24,435,428 16,199,849 40,635,277
Exercise of ESOP/ESOWN 404,987 - - - - - - - - 404,987 - 404,987
Cost of share-based payments - (215,681) - - - - - - - (215,681) - (215,681)
Cash Dividends - - - - - - - (2,149,439) - (2,149,439) (4,681,641) (6,831,080)
Change in non-controlling interests/Others - - - - - (849,160) - - - (849,160) (611,085) (1,460,245)
At September 30, 2017 (Unaudited) 74,784,747₱ 280,078₱ (1,630,124)₱ (950,095)₱ 3,180,176₱ 11,362,115₱ 1,113,745₱ 166,708,025₱ (2,300,000)₱ 252,548,667₱ 150,980,469₱ 403,529,136₱
Paid-in Capital
Share-
based
Payments
Remeasurement
Gains/(Losses) on
Defined Benefit
Plans
Net Unrealized
Gain (Loss) on
Available-for-Sale
Financial Assets
Cumulative
Translation
Adjustments Equity Reserve
Equity -
Conversion
Option
Retained
Earnings
Treasury
Stock Total
Non-controlling
Interests Total Equity
At January 1, 2016 73,919,322₱ 568,847₱ (1,249,716)₱ (554,297)₱ 288,683₱ 12,402,311₱ 1,113,745₱ 124,468,464₱ (2,300,000)₱ 208,657,359₱ 119,886,624₱ 328,543,983₱
Net Income - - - - - - - 19,645,671 - 19,645,671 12,835,163 32,480,834
Other comprehensive income (loss) - - (45,687) (305,319) 722,563 - - - - 371,557 231,990 603,547
Share in other comprehensive income
(loss) of associates and joint ventures - - (7,842) 699,161 (79,987) - - - - 611,332 - 611,332
Total comprehensive income (loss) - - (53,529) 393,842 642,576 - - 19,645,671 - 20,628,560 13,067,153 33,695,713
Exercise of ESOP/ESOWN 379,109 - - - - - - - - 379,109 - 379,109
Cost of share-based payments - (256,166) - - - - - - - (256,166) - (256,166)
Cash Dividends - - - - - - - (1,786,154) - (1,786,154) (4,634,255) (6,420,409)
Change in non-controlling interests/Others - - - - - 17,971 - - - 17,971 6,758,436 6,776,407
At September 30, 2016 (Unaudited) 74,298,431₱ 312,681₱ (1,303,245)₱ (160,455)₱ 931,259₱ 12,420,282₱ 1,113,745₱ 142,327,981₱ (2,300,000)₱ 227,640,679₱ 135,077,958₱ 362,718,637₱
EQUITY ATTRIBUTABLE TO OWNERS OF THE PARENT
EQUITY ATTRIBUTABLE TO OWNERS OF THE PARENT
Other Comprehensive Income
Other Comprehensive Income

S E C F O R M 1 7 - Q 10
Paid-in Capital
Share-
based
Payments
Remeasurement
Gains/(Losses) on
Defined Benefit
Plans
Net Unrealized
Gain (Loss) on
Available-for-Sale
Financial Assets
Cumulative
Translation
Adjustments Equity Reserve
Equity -
Conversion
Option
Retained
Earnings
Treasury
Stock Total
Non-controlling
Interests Total Equity
At January 1, 2016 73,919,322₱ 568,847₱ (1,249,716)₱ (554,297)₱ 288,683₱ 12,402,311₱ 1,113,745₱ 124,468,464₱ (2,300,000)₱ 208,657,359₱ 119,886,624₱ 328,543,983₱
Net Income - - - - - - - 26,011,263 - 26,011,263 17,421,346 43,432,609
Other comprehensive income (loss) - - (14,392) (113,809) 1,196,774 - - - - 1,068,573 624,140 1,692,713
Share in other comprehensive income
(loss) of associates and joint ventures - - (284,084) 201,430 (70,907) - - - - (153,561) - (153,561)
Total comprehensive income (loss) - - (298,476) 87,621 1,125,867 - - 26,011,263 - 26,926,275 18,045,486 44,971,761
Exercise of ESOP/ESOWN 460,438 (321,094) - - - - - - - 139,344 - 139,344
Cost of share-based payments - 248,006 - - - - - - - 248,006 - 248,006
Cash Dividends - - - - - - - (4,857,416) - (4,857,416) (5,335,772) (10,193,188)
Change in non-controlling interests - - - - - (191,036) - - - (191,036) 7,477,008 7,285,972
At December 31, 2016 (Audited) 74,379,760₱ 495,759₱ (1,548,192)₱ (466,676)₱ 1,414,550₱ 12,211,275₱ 1,113,745₱ 145,622,311₱ (2,300,000)₱ 230,922,532₱ 140,073,346₱ 370,995,878₱
See accompanying Notes to Unaudited Interim Condensed Consolidated Financial Statements.
Other Comprehensive Income
EQUITY ATTRIBUTABLE TO OWNERS OF THE PARENT

S E C F O R M 1 7 - Q 11
(Forward)
AYALA CORPORATION AND SUBSIDIARIES
UNAUDITED INTERIM CONDENSED CONSOLIDATED STATEMENTS OF CASH FLOWS
(Amounts in Thousands)
September 2017 September 2016
Unaudited Unaudited
CASH FLOWS FROM OPERATING ACTIVITIES
Income before income tax 46,893,309₱ 39,791,160₱
Adjustments for:
Interest and other financing charges - net of amount capitalized 10,794,645 10,256,704
Depreciation and amortization 9,212,031 8,627,310
Cost of share-based payments (10,640) (7,340)
Provision for doubtful accounts (Note 6) 120,026 45,499
Provision for (reversal of) inventory obsolescence 16,507 (71,415)
Provision for (reversal of) impairment/ Losses on investments
in associates and joint ventures (Note 10) (460,992) 282,388
Mark to market gain on financial assets at
fair value through profit or loss (FVPL) and derivatives (221,339) -
Dividend income and other investment income (453,816) (517,202)
Gain on sale of:
Investments (931,998) (122,051)
Other assets (61,938) (14,815)
Interest income (4,747,380) (5,078,698)
Share of profit of associates and joint ventures (14,227,819) (13,779,287)
Operating income before changes in operating assets and liabilities 45,920,596 39,412,253
Decrease (increase) in:
Accounts and notes receivable - trade (3,809,095) (11,104,294)
Inventories 1,486,972 (10,566,440)
Service concession asset (7,108,208) (4,598,723)
Other current assets (2,610,301) (4,918,118)
Increase (decrease) in:
Accounts payable and accrued expenses 8,634,518 19,297,487
Net pension liabilities (157,020) (565,672)
Other current liabilities 1,860,294 6,284,209
Net cash generated from operations 44,217,756 33,240,702
Interest received 4,694,020 5,300,602
Interest paid (10,556,475) (10,365,586)
Income tax paid (9,719,485) (7,800,866)
Net cash provided by operating activities 28,635,816₱ 20,374,852₱

S E C F O R M 1 7 - Q 12
September 2017 September 2016
Unaudited Unaudited
CASH FLOWS FROM INVESTING ACTIVITIES
Proceeds from:
Sale/maturities of investments in bonds and other securities 872,937₱ 23,453₱
Sale/redemptions of investments in associates and joint ventures 1,456,962 193,442
Disposals of:
Property, plant and equipment 2,356,060 985,943
Investment properties 90,093 236,461
Land and improvements 521,503 -
Maturities of (additions to) short-term investments (1,306,005) 1,690,973
Deductions/transfers (additions) to:
Service concession asset (19,410) (124,640)
Investments in associates and joint ventures (9,591,122) (11,520,745)
Property, plant and equipment (20,139,357) (16,405,037)
Investment properties (23,578,570) (25,612,565)
Land and improvements - (329,644)
Accounts and notes receivable - non-trade (1,098,561) (13,183,358)
Financial assets at FVPL (4,655,757) (2,175,000)
Investment in bonds and other securities (1,136,995) (287,279)
Intangible assets (1,404,935) (1,969,557)
Dividends received from associates, joint ventures
and investments in equity securities 6,549,467 6,703,722
Acquisitions through business combinations - net of cash acquired (4,118,815) -
Increase in other noncurrent assets (4,661,879) (3,044,052)
Net cash used in investing activities (59,864,384) (64,817,883)
CASH FLOWS FROM FINANCING ACTIVITIES
Proceeds from short-term and long-term debt 79,267,445 65,810,050
Payments of short-term and long-term debt (26,495,271) (31,008,708)
Dividends paid (9,595,077) (9,179,209)
Service concession obligation paid (387,488) (653,105)
Collections of subscriptions receivable 199,946 130,284
Increase (decrease) in:
Other noncurrent liabilities 2,635,567 5,280,613
Non-controlling interests in consolidated subsidiaries (502,601) 6,342,710
Net cash provided by financing activities 45,122,521 36,722,635
NET INCREASE (DECREASE) IN CASH AND CASH EQUIVALENTS 13,893,953 (7,720,396)
CASH AND CASH EQUIVALENTS AT BEGINNING OF YEAR 60,223,324 82,154,542
CASH AND CASH EQUIVALENTS AT END OF PERIOD 74,117,277₱ 74,434,146₱
See accompanying Notes to Unaudited Interim Condensed Consolidated Financial Statements.

S E C F O R M 1 7 - Q 13
AYALA CORPORATION AND SUBSIDIARIES NOTES TO UNAUDITED INTERIM CONDENSED CONSOLIDATED FINANCIAL STATEMENTS 1. Corporation Information and Basis of Financial Statement Preparation
Ayala Corporation (herein referred to as “the Company”, “the Parent Company” or “Ayala” is incorporated in the Republic of the Philippines on January 23, 1968. On April 15, 2016, during the annual meeting of its stockholders, the stockholders ratified the amendment of the Fourth Article of the Articles of Incorporation to extend the corporate term for 50 years from January 23, 2018. The Company’s registered office address and principal place of business is 32F-35F, Tower One and Exchange Plaza, Ayala Triangle, Ayala Avenue, Makati City. The Company is a publicly listed company which is 48.88% owned by Mermac, Inc., 10.15% owned by Mitsubishi Corporation and the rest by the public. The Company is the holding company of the Ayala Group of Companies (collectively referred to as “the Group”), with principal business interests in real estate and hotels, financial services and insurance, telecommunications, water infrastructure, electronics manufacturing, industrial technologies, automotive, power generation, transport infrastructure, international real estate, healthcare and education. The accompanying unaudited interim condensed consolidated financial statements have been prepared in accordance with Philippine Accounting Standard (PAS) 34, Interim Financial Reporting. Accordingly, the unaudited interim condensed consolidated financial statements do not include all of the information and disclosures required in the December 31, 2016 annual audited consolidated financial statements, and should be read in conjunction with the Group’s annual consolidated financial statements as at and for the year ended December 31, 2016. The preparation of the financial statements in compliance with Philippine Financial Reporting Standards (PFRS) requires management to make estimates and assumptions that affect the amounts reported in the financial statements and accompanying notes. The estimates and assumptions used in the accompanying unaudited interim condensed consolidated financial statements are based upon management’s evaluation of relevant facts and circumstances as of the date of the unaudited interim condensed consolidated financial statements. Actual results could differ from such estimates.
The unaudited interim condensed consolidated financial statements include the accounts of the Company and its subsidiaries. The unaudited interim condensed consolidated financial statements are presented in Philippine Peso (P=), and all values are rounded to the nearest thousand pesos (P=000) except when otherwise indicated. On November 9, 2017, the Company’s Audit Committee approved and authorized the release of the accompanying unaudited interim condensed consolidated financial statements of Ayala Corporation and Subsidiaries.
2. Significant Accounting Policies
Changes in Accounting Policies The accounting policies adopted are consistent with those of the previous financial year, except that the Group has adopted the following new accounting pronouncements starting January 1, 2017. Adoption of these pronouncements did not have any significant impact on the Group’s statements of financial position and statements of comprehensive income unless otherwise indicated:
• Amendment to PFRS 12, Clarification of the Scope of the Standard (Part of Annual Improvements to PFRSs 2014 - 2016 Cycle)
• Amendments to PAS 7, Statement of Cash Flows, Disclosure Initiative The amendments to PAS 7 require an entity to provide disclosures that enable users of financial statements to evaluate changes in liabilities arising from financing activities, including both changes arising from cash flows and non-cash changes (such as foreign exchange gains or losses). On initial application of the amendments, entities are not required to provide comparative information for preceding periods.
S E C F O R M 1 7 - Q 14
Additional disclosures are provided in Note 16 to the unaudited interim condensed consolidated financial statements.
• Amendments to PAS 12, Income Taxes, Recognition of Deferred Tax Assets for Unrealized Losses
Starting May 1, 2017, the Service Concession Assets (SCA) of Manila Water Company, Inc. and subsidiaries (the “MWC Group”) are amortized using the units of production (UOP) method over the expected total volume for the remaining concession period. Prior to this, the straight line amortization method over the remaining concession period was applied.
Standards and Interpretations Issued but not yet Effective The Group will adopt the following new and amended Standards and Philippine Interpretations of International Financial Reporting Interpretations Committee (IFRIC) enumerated below when these become effective. Except as otherwise indicated, the Group does not expect the adoption of these new and amended PFRS and Philippine Interpretations to have significant impact on the consolidated financial statements.
Effective January 1, 2018
• Amendments to PFRS 2, Share-based Payment, Classification and Measurement of Share-based Payment Transactions The amendments to PFRS 2 address three main areas: the effects of vesting conditions on the measurement of a cash-settled share-based payment transaction; the classification of a share-based payment transaction with net settlement features for withholding tax obligations; and the accounting where a modification to the terms and conditions of a share-based payment transaction changes its classification from cash settled to equity settled. On adoption, entities are required to apply the amendments without restating prior periods, but retrospective application is permitted if elected for all three amendments and if other criteria are met. Early application of the amendments is permitted. The Group is assessing the potential effect of the amendments on its consolidated financial statements.
• Amendments to PFRS 4, Insurance Contracts, Applying PFRS 9, Financial Instruments, with PFRS 4 The amendments address concerns arising from implementing PFRS 9, the new financial instruments standard before implementing the forthcoming insurance contracts standard. They allow entities to choose between the overlay approach and the deferral approach to deal with the transitional challenges. The overlay approach gives all entities that issue insurance contracts the option to recognize in other comprehensive income, rather than profit or loss, the volatility that could arise when PFRS 9 is applied before the new insurance contracts standard is issued. On the other hand, the deferral approach gives entities whose activities are predominantly connected with insurance an optional temporary exemption from applying PFRS 9 until the earlier of application of the forthcoming insurance contracts standard or January 1, 2021.
The overlay approach and the deferral approach will only be available to an entity if it has not previously applied PFRS 9. The Group is assessing the potential effect of the amendments on its consolidated financial statements.
• PFRS 15, Revenue from Contracts with Customers PFRS 15 establishes a new five-step model that will apply to revenue arising from contracts with customers. Under PFRS 15, revenue is recognized at an amount that reflects the consideration to which an entity expects to be entitled in exchange for transferring goods or services to a customer. The principles in PFRS 15 provide a more structured approach to measuring and recognizing revenue. The new revenue standard is applicable to all entities and will supersede all current revenue recognition requirements under PFRSs. Either a full or modified retrospective application is required for annual periods beginning on or after January 1, 2018.

S E C F O R M 1 7 - Q 15
The Group is currently assessing the impact of PFRS 15. Initial review of the scope of this standard indicates that certain part of service revenue streams of some subsidiaries will be affected. Specifically ongoing is the group’s identification of gaps and changes needed to bring the existing policies and procedures compliant with the provisions of the standard. The Group will adopt a modified retrospective approach to this new revenue standard.
• PFRS 9, Financial Instruments PFRS 9 reflects all phases of the financial instruments project and replaces PAS 39, Financial Instruments: Recognition and Measurement, and all previous versions of PFRS 9. The standard introduces new requirements for classification and measurement, impairment, and hedge accounting. PFRS 9 is effective for annual periods beginning on or after January 1, 2018, with early application permitted. Retrospective application is required, but providing comparative information is not compulsory. For hedge accounting, the requirements are generally applied prospectively, with some limited exceptions. The adoption of PFRS 9 will have an effect on the classification and measurement of the Group’s financial assets and impairment methodology for financial assets, but will have no impact on the classification and measurement of the Group’s financial liabilities. The adoption will also have an effect on the Group’s application of hedge accounting and on the amount of its credit losses. BPI, one of the significant associates of the Group, is currently engaged in documenting the business models for Classification and Measurement of Financial Assets and finalizing the credit models to estimate Expected Credit Losses as specified in PFRS 9. Full impact of PFRS 9 will be assessed once the developed models have been validated by an independent model validation team. The non-financial companies under the Group also continues to assess the impact of PFRS 9. Initial review of the scope of this standard indicates that certain part of receivables of some subsidiaries will be affected as regards expected credit losses. Specifically ongoing is the group’s identification of gaps and changes needed to bring the existing policies and procedures compliant with the provisions of the standard. The Group will adopt a modified retrospective approach to this new accounting standard.
• Amendments to PAS 28, Measuring an Associate or Joint Venture at Fair Value (Part of Annual Improvements to PFRSs 2014 - 2016 Cycle) The amendments clarify that an entity that is a venture capital organization, or other qualifying entity, may elect, at initial recognition on an investment-by-investment basis, to measure its investments in associates and joint ventures at fair value through profit or loss. They also clarify that if an entity that is not itself an investment entity has an interest in an associate or joint venture that is an investment entity, the entity may, when applying the equity method, elect to retain the fair value measurement applied by that investment entity associate or joint venture to the investment entity associate’s or joint venture’s interests in subsidiaries. This election is made separately for each investment entity associate or joint venture, at the later of the date on which (a) the investment entity associate or joint venture is initially recognized; (b) the associate or joint venture becomes an investment entity; and (c) the investment entity associate or joint venture first becomes a parent. The amendments should be applied retrospectively, with earlier application permitted. These amendments are not expected to have any material impact on the Group.
• Amendments to PAS 40, Investment Property, Transfers of Investment Property The amendments clarify when an entity should transfer property, including property under construction or development into, or out of investment property. The amendments state that a change in use occurs when the property meets, or ceases to meet, the definition of investment property and there is evidence of the change in use. A mere change in management’s intentions for the use of a property does not provide evidence of a change in use. The amendments should be applied prospectively to changes in use that occur on or after the beginning of the annual reporting period in which the entity first applies the amendments. Retrospective application is only permitted if this is possible without the use of hindsight. These amendments are not expected to have any material impact on the Group.
• Philippine Interpretation IFRIC-22, Foreign Currency Transactions and Advance Consideration The interpretation clarifies that in determining the spot exchange rate to use on initial recognition of the related asset, expense or income (or part of it) on the derecognition of a non-monetary asset or non-monetary liability relating to advance consideration, the date of the transaction is the date on which an entity initially recognizes the nonmonetary asset or non-
S E C F O R M 1 7 - Q 16
monetary liability arising from the advance consideration. If there are multiple payments or receipts in advance, then the entity must determine a date of the transactions for each payment or receipt of advance consideration. The interpretation may be applied on a fully retrospective basis. Entities may apply the interpretation prospectively to all assets, expenses and income in its scope that are initially recognized on or after the beginning of the reporting period in which the entity first applies the interpretation or the beginning of a prior reporting period presented as comparative information in the financial statements of the reporting period in which the entity first applies the interpretation. These amendments are not expected to have any material impact on the Group.
Effective January 1, 2019
• PFRS 16, Leases Under the new standard, lessees will no longer classify their leases as either operating or finance leases in accordance with PAS 17, Leases. Rather, lessees will apply the single-asset model. Under this model, lessees will recognize the assets and related liabilities for most leases on their balance sheets, and subsequently, will depreciate the lease assets and recognize interest on the lease liabilities in their profit or loss. Leases with a term of 12 months or less or for which the underlying asset is of low value are exempted from these requirements. The accounting by lessors is substantially unchanged as the new standard carries forward the principles of lessor accounting under PAS 17. Lessors, however, will be required to disclose more information in their financial statements, particularly on the risk exposure to residual value. Entities may early adopt PFRS 16 but only if they have also adopted PFRS 15. When adopting PFRS 16, an entity is permitted to use either a full retrospective or a modified retrospective approach, with options to use certain transition reliefs. The Group is currently assessing the impact of adopting PFRS 16.
Standards with Deferred effectivity
• Amendments to PFRS 10 and PAS 28, Sale or Contribution of Assets between an Investor and its Associate or Joint Venture The amendments address the conflict between PFRS 10 and PAS 28 in dealing with the loss of control of a subsidiary that is sold or contributed to an associate or joint venture. The amendments clarify that a full gain or loss is recognized when a transfer to an associate or joint venture involves a business as defined in PFRS 3, Business Combinations. Any gain or loss resulting from the sale or contribution of assets that does not constitute a business, however, is recognized only to the extent of unrelated investors’ interests in the associate or joint venture. On January 13, 2016, the Financial Reporting Standards Council postponed the original effective date of January 1, 2016 of the said amendments until the International Accounting Standards Board has completed its broader review of the research project on equity accounting that may result in the simplification of accounting for such transactions and of other aspects of accounting for associates and joint ventures.

S E C F O R M 1 7 - Q 17
3. Principles of Consolidation The unaudited interim condensed consolidated financial statements comprise the financial statements of the Company and the following subsidiaries of the Group:
Unless otherwise indicated, the principal place of business and country of incorporation of the Company’s investments in subsidiaries is the Philippines. Except as discussed below, the voting rights held by the Company in its investments in subsidiaries are in proportion to its percentage of economic ownership. The following are highlights of significant transactions of the subsidiaries, part of which affected the Company’s investments in its subsidiaries: ACEHI Group a) On various dates between January to September 2017, the Company infused a total of P=2.3
billion to ACEHI to fund its various investments.
b) On April 30, 2017, ACIFL and AC Energy SG approved the conversion of ACIFL’s advances in the amount of $132M into additional redeemable preferred shares in AC Energy SG. The proceeds of the infusion were used for the acquisition of Chevron’s geothermal assets and operations in Indonesia.
c) On January 21, 2017, ACEHI signed investment agreements with UPC Renewables Indonesia Ltd. for the development, construction, and operation of a wind farm project in Sidrap, South Sulawesi, Indonesia (the Sidrap Project). The project will be developed through ACEHI’s associate, PT UPC Sidrap Bayu Energi (UPC Sidrap), a special purpose company based in Indonesia. The Sidrap Project, with generating capacity of 75 MW, is targeted for completion by the end of 2017, and will be the first utility-scale wind farm project in Indonesia once completed. ACEHI, through its wholly-owned subsidiary AC Energy International Holdings PTE Ltd. (ACEHI SG), deposited US$30.0 million to UPC Renewables Asia Ltd, UPC Renewables Asia III Ltd. and Sidrap HK for the UPC Sidrap amounting to US$1.82 million, USD$21.86 million and USD$6.31 million, respectively (see Note 10).
% of Economic Ownership
Subsidiaries Nature of Business
AC Energy Holdings, Inc. (ACEHI) Power Generation 100.0 % 100.0 %
AC Infrastructure Holdings Corporation (AC Infra) Transport Infrastructure 100.0 100.0
AC International Finance Limited (ACIFL)* Investment Holding 100.0 100.0
AG Counselors Corporation (AGCC) Consulting Services 100.0 100.0
Industrial Technologies and
Automotive 100.0 100.0
Ayala Aviation Corporation (AAC) Air Charter 100.0 100.0
Education 100.0 100.0
Ayala Land, Inc. (ALI) Real Estate and Hotels 47.1 47.2
AYC Finance Limited (AYCFL)* Investment Holding 100.0 100.0
Azalea International Venture Partners Limited (AIVPL)** Business Process Outsourcing (BPO) 100.0 100.0
Ayala Healthcare Holdings, Inc. (AHHI) Healthcare 100.0 100.0
Bestfull Holdings Limited (BHL)*** Investment Holding - International 100.0 100.0
Darong Agricultural and Development Corporation (DADC) Agriculture 100.0 100.0
HCX Technology Partners Inc. (HCX) HR Technology Services 100.0 100.0
Integrated Microelectronics, Inc. (IMI) Electronics Manufacturing 50.7 50.7
Manila Water Company, Inc. (MWC) Water Infrastructure 51.6 51.6
Michigan Holdings, Inc. (MHI) Investment Holding 100.0 100.0
Philwater Holdings Company, Inc. (Philwater) Investment Holding 100.0 100.0
Purefoods International Limited (PFIL)** Investment Holding 100.0 100.0
Technopark Land, Inc. (TLI) Real Estate 78.8 78.8
Investment Holding 100.0 100.0
*Incorporated in Cayman Islands
**Incorporated in British Virgin Islands
***Incorporated in Hong Kong
AC Ventures Holding Corp. (AC Ventures) (formerly
Water Capital Works, Inc.)
December 2016
(Audited)
AC Industrial Technology Holdings Inc. (AC Industrial)
(formerly Ayala Automotive Holdings Corporation)
AC Education, Inc. (AEI) (formerly Ayala Education, Inc.)
September 2017
(Unaudited)

S E C F O R M 1 7 - Q 18
d) On February 20, 2017, ACEHI entered into a 10-year Term Loan Agreement with The Philippine American Life and General Insurance Company (PHILAM) amounting to P=1.0 billion at a fixed rate equivalent to 6.0% p.a. to finance investments in power, power-related projects and general corporate needs. On February 23, 2017, the full amount of the loan was drawn.
e) On March 16, 2017, ACEHI signed definitive documents to acquire 100% ownership of Bronzeoak Clean Energy (BCE) and San Carlos Clean Energy (SCCE). With the acquisition, SCCE and BCE have been renamed as AC Energy DevCo Inc. and Visayas Renewables Corp., respectively. The provisional values of the identifiable assets and liabilities acquired and goodwill arising as at the date of acquisition follows: AC Energy DevCo Inc. (In Thousands)
Visayas Renewables Corp. (in thousand pesos)
The purchase price allocation for the above acquisitions have been prepared on a preliminary basis due to unavailability of information to facilitate fair value computation. These include, among others, information based on appraisal reports for property, plant and equipment and information necessary for the valuation of identified intangible assets (processes, project development costs, etc.). Reasonable changes are expected as additional information
Assets
Cash and cash equivalents 2,655₱
Receivables 3,122
Prepayments and other current assets 14,305
Investments 2,127
Property, plant and equipment 1,299
23,509
Liabilities
Accounts payable and accrued expenses 6,412
6,412
Net Assets 17,097₱
Cost of acquisition 768,984₱
Provisional goodwill 751,887₱
Cash consideration 768,984₱
Less: Cash acquired from the subsidiary 2,655
Net cash flow (included in cash flows from investing activities) 766,329₱
Assets
Cash and cash equivalents 6,226₱
Prepayments and other current assets 10
Investments 797
Total Assets 7,033
Liabilities
Accounts payable and accrued expenses 73
73
Net Assets 6,960₱
Cost of acquisition 527,445₱
Provisional goodwill 520,485₱
Cash consideration 527,445₱
Less: Cash acquired from the subsidiary 6,226
Net cash flow (included in cash flows from investing activities) 521,219₱
S E C F O R M 1 7 - Q 19
becomes available. The accounts that are subject to provisional accounting are property, plant and equipment, intangible assets and goodwill. The provisional goodwill recognized on the acquisition can be attributed to the FIT contract. The provisional purchase price allocation will be finalized within one year from the dates of closure of the above acquisition transactions.
f) On March 31, 2017, ACEHI, as part of an Indonesian consortium, completed the purchase and acquisition of Chevron’s geothermal assets and operations in Indonesia. The Indonesia consortium consists of ACEHI (with significant influence as a result of its 19.8% economic stake), Star Energy Group Holdings Pte. Ltd., Star Energy Geothermal Pte. Ltd., and Electricity Generating Public Company Ltd. and the acquisition was made through their joint venture company, Star Energy Geothermal (Salak-Darajat) B.V. The Indonesia assets and operations include the Darajat and Salak geothermal fields in West Java, Indonesia, with a combined capacity of 637MW of steam and power.
g) In February 2016, the solar farm owned by Monte Solar Energy Inc. (Montesolar) began full commercial operations dispatching 18MW to the grid. The solar farm is located in Bais City, Negro Oriental and is the first phase of the total of 50MW of solar power to be completed by the AC Energy-Bronzeoak Clean Energy joint venture. On June 13, 2016, the Department of Energy (DOE), through its issuance of the Certificate of Endorsement, certified the Montesolar’s Solar Farm Project as an eligible project under the Feed-in-Tariff (FIT) system. On July 14, 2016, the Energy Regulatory Commission (ERC) issued a provisional authority to operate until January 31, 2017. On December 28, 2016, Montesolar received another provisional authority to operate by the ERC dated December 8, 2016 but this time, as a renewable energy generation company, which allows the Company to be entitled to a FIT rate of P=8.69/Kwh for a period of twenty (20) years from March 13, 2016. As of September 30, 2017, Montesolar recognized FIT differential totalling P=233.3 million covering the period March to August 2016 and January to September 2017. On August 8, 2017, Montesolar collected the first FIT differential payment from Transco.
h) On July 24, 2017, ACEHI together with Star Energy Geothermal Holdings Pte. Ltd., entered into definitive agreements for the transfer of 99% of their consortium interests in ACEHI-STAR Holdings, Inc. (ACEHI-STAR) to AllFirst Equity Hodings, Inc. (AllFirst). ACEHI-STAR is the special purpose company that signed a share sale and purchase agreement with Chevron in December 2016, to acquire Chevron’s Philippine geothermal assets subject to the satisfaction of certain conditions precedent, including approval of the Philippine Competition Commission. AllFirst is Chevron’s current partner, and directly holds a 60% ownership interest in Philippine Geothermal Production Company.
i) On July 24, 2017, AC Energy International Holdings Pte. Ltd. (AC Energy International), a subsidiary of ACEHI, has entered into a development funding arrangement with UPC Renewables Asia Pacific Holdings Ltd. And UPC Renewables Asia Limited (collectively UPC Renewables) for the development of small island power projects in Indonesia. Under the terms of agreement, AC Energy International agreed to provide funding for the development of power generation projects with sub-50MW capacities. ACEHI will also have accompanying rights to participate in further construction funding of other Indonesian renewable energy projects.
j) On September 15, 2017, the AC Energy SG signed an Amended and Restated Trust Agreement with BPI to revise the mechanics for the release of the fee as follows:
• When at least 15% of the loan amount under the financing documents of GNP Dinginin has been successfully drawn down, AC Energy Cayman shall be entitled to the release of up to 35% of the fee;
• When at least 18% of the loan amount under the financing documents of GNP Dinginin has been successfully drawn down, AC Energy Cayman shall be entitled to the release of up to 55% of the fee;
• When at least 30% of the loan amount under the financing documents of GNP Dinginin has been successfully drawn down, AC Energy Cayman shall be entitled to the release of up to 70% of the fee; and

S E C F O R M 1 7 - Q 20
• When at least 50% of the loan amount under the financing documents of GNP Dinginin has been successfully drawn down, AC Energy Cayman shall be entitled to the release of the balance of the fee. On September 19, 2017, BPI Asset Management Trust Corp (BPI-AMTC), as Trustee under the Trust Agreement, released $14.8M to AC Energy Cayman, a subsidiary of AC Energy, in consideration for the achievement of the GNP Dinginin loan drawdown milestone per the Trust Agreement. Consequently, AC Energy Cayman recognized income of the same amount.
In the future, depending on the progress of construction of the GNP Dinginin power plant and the level of loan drawdown for the project, additional fees will be paid and released to AC Energy Cayman.
ACIFL a) In March and April 2017, ACIFL repurchased its 115,000,000 shares and 39,968,660 shares,
respectively, which were issued and registered in the name of the Company, ACIFL’s sole shareholder. The repurchase price was at par of US$1.00 per share for a total amount of US$155.0 million. ACIFL remained a wholly-owned subsidiary of the Company after the transaction.
AC Industrial Group a) In June 2017, AC Industrial invested P=400.0 million for 100% ownership in AC Industrials
(Singapore) Pte Ltd. (ACI Singapore). ACI Singapore is an investment holding company based in Singapore.
b) Acquisition of MT Technologies GmbH, formerly MT Misslbeck Technologies GmbH (MT) On June 1, 2017, AC Industrials, through its subsidiary ACI Singapore, has entered into an agreement with the shareholders of MT for the acquisition by ACI Singapore of a 94.90% equity stake and various shareholder and other loans in MT, a supplier of models, tools and plastic parts based in Ingolstadt, Germany. The said agreement became effective on June 2, 2017. The closing of the transaction transpired on July 5, 2017 upon completion of pre-closing conditions and regulatory approval. The provisional values of the identifiable assets and liabilities acquired as at the date of acquisition follows (amounts in thousands): Assets Cash and cash equivalents EUR 2 Receivables 3,979 Inventories 11,236 Property, plant and equipment 21,880
37,097
Liabilities Trade accounts payable 10,714 Long-term debt 1,758 Other noncurrent liabilities 1,552
14,024
Net Assets EUR 23,073
Cost of acquisition EUR 21,897 Less: Share in the fair value of net assets acquired (94.90%) 21,897
Provisional goodwill EUR –
Non-controlling interest (5.10%) EUR 1,177
The purchase price allocation for the acquisition of MT has been prepared on a preliminary basis due to unavailability of information to facilitate fair value computation. This includes information necessary for the valuation of other intangible assets, if any. Reasonable changes are expected as additional information becomes available. The accounts that are subject to provisional accounting are property, plant and equipment, intangible assets and goodwill or bargain purchase gain. The provisional purchase price allocation will be finalized within one year from the date of closure of this acquisition transaction.

S E C F O R M 1 7 - Q 21
AC Industrial has elected to measure non-controlling interest in the acquiree at the proportionate share of the non-controlling interest in the recognized amounts of the acquiree’s identifiable net assets. The carrying amount of non-controlling interest changes due to allocation of profit or loss, changes in other comprehensive income and dividends declared for the reporting period.
Analysis of cash flows on acquisition follows (amounts in thousands):
Initial purchase consideration EUR 21,897
Cost of acquisition EUR 21,897
Cash consideration EUR 21,897 Less: Cash acquired from the subsidiary 2
Net cash flow (included in cash flows from investing activities) EUR 21,895
The initial purchase consideration of EUR21.90 million upon signing of the agreement was paid in cash and also involves the assumption of debt and other liabilities. The transaction also includes put and call option provisions for further assessment by management. Acquisition-related costs, which consist of professional and legal fees, transaction costs, taxes, representation and travel expenses amounting to EUR1.19 million were recognized as expense in 2017.
c) As of September 30, 2017, ACI, through its wholly-owned subsidiary ACI Solar Holdings NA (ACI Solar), provided a loan to Merlin Solar Technology, Inc. (Merlin) in the amount of US$1.0 million to support operating requirements. ACI Solar also owns a minority stake in Merlin equivalent to 8.2% of Merlin’s equity shares.
d) On various dates between January to September 2017, the Company infused P=6.8 billion to AC Industrial Group to fund its various investments.
AC Infra Group a) On various dates between January to September 2017, the Company infused P=243.8 million to
AC Infra to fund its business development and general and administrative expenses as well as additional investment in AF Payments, Inc.
b) On March 31, 2017, AC Infra and SM Investment Corporation submitted an unsolicited proposal to the Department of Public Works and Highways (DPWH) to design, finance, construct, operate and maintain for a period of 35 years an elevated toll road approximately 8.6-kilometer long that would link Sta. Mesa, Manila to the Mall of Asia Complex in Pasay City via the Central Business District. The estimated project cost is P=25 billion.
c) The Company clarified the following news articles:
i. News article entitled, “Ayala also keen on rehab of MRT3", August 11, 2017, Manila Standard.net. The Company confirmed that as a result of the Company’s successful partnership in the operations and maintenance of LRT-1, Metro Pacific Investments Corporation (MPIC) has invited the Company to join its unsolicited proposal to upgrade the MRT Line 3. The Company confirmed that they have expressed their interest in partnering with MPIC for this proposal.
ii. News article entitled, "MetroPac offers P=12-b MRT3 rehab", August 16, 2017 issue of Manila Standard.net. The Company confirmed that MPIC has extended an invitation to join them in the proposed rehabilitation of MRT-3. However, the Company clarified that the holding percentages are still under discussion, and are not yet final.
AC Ventures a) On August 22, 2017, the SEC approved the amended Articles of Incorporation and amended
By-laws of AC Ventures with the following changes: i. Change in name of Water Capital Works, Inc. to AC Ventures Holding Corp; ii. Increase of capital stock, from P=1.0 million divided into 1 million shares at P=1.00 par value
each to P=5.0 billion divided into 50 million shares at P=100.00 par value each; and

S E C F O R M 1 7 - Q 22
iii. Amendment in its primary purpose to include, among others, engaging in investment, loans and other transactions other than providing services for the capital works program of MWC.
With the foregoing corporate changes, AC Ventures completed investments in BF Jade E-Service Philippines, Inc. (BF Jade), the owner of Zalora Philippines (Zalora) and Globe Fintech Innovations, Inc. (GFI or Mynt) as discussed in Note 10 Investments in Associates and Joint Ventures.
b) On various dates between January to September 2017, the Company infused a total of P=1.3
billion to AC Ventures to fund its various investments. AEI Group a) On February 27, 2017, SEC approved the change of name of Ayala Education, Inc. to AC
Education, Inc as approved by the BOD on December 9, 2016.
b) On various dates between January to September 2017, the Company infused a total of P=211.6 million to AEI to fund its various investments and operating expenses.
AHHI Group a) On various dates between January to June 2017, the Company infused P=450.1 million to AHHI
Group to fund its various investments.
b) In February 2017, AHHI entered into a Shareholders’ Agreement to hold interest in the equity of Wellbridge Health, Inc., owner and operator of MedGrocer, an FDA-licensed ePharmacy and medicine benefits management service. AHHI purchased its 17% stake for P=13.2 million, of which P=6.6 million was paid in cash and P=6.6 million payable upon SEC approval of issuance of new class B shares.
ALI Group a) On February 20, 2017, the Board of Directors (BOD) of ALI approved the declaration of cash
dividends amounting to P=0.24 per outstanding common share. These were paid out on March 22, 2017 to shareholders on record as of March 6, 2017. Further, on the same date, the BOD of ALI also declared annual cash dividends of 4.74786% per year or P=0.00474786 per share to all shareholders of ALI’s unlisted voting preferred shares. These were paid out on June 29, 2017 to shareholders on record as of June 15, 2017.
b) On February 20, 2017, the BOD of ALI approved the raising of up to P=20.0 billion through (a) retail bonds, (b) corporate notes and/or (c) bilateral term loans, all with a term of up to 10 years, to partially finance general corporate requirements. The retail bonds will be issued under ALI’s P=50 Billion Debt Securities Program as approved by SEC in March 2016; and the raising of up to P10B through the issuance of short-dated notes with a tenor of up to 21 months to refinance ALI’s short-term loans. On May 2, 2017, ALI issued and listed in Philippine Dealing Exchange (PDEx) its P=7.0 Billion Fixed Rate Bonds (Bonds) due 2027. The Bonds has a term of ten (10 years) with a fixed interest rate of 5.2624% per annum. The Bonds have been rated PRS Aaa by PhilRatings, which is considered the highest quality with minimal credit risk.
c) On June 27, 2017, Prime Orion Philippines, Inc. (POPI) sold 512.4 million common shares to Orion Land Inc., a 100% subsidiary of POPI. The 512.4 million common shares acquired represent an 11.69% interest in POPI for a total consideration P=1,257.3 million. The transaction was accounted for as an equity transaction which resulted into negative equity reserve of
P=898.4 million.
d) On March 3, 2017, ALI purchased 50,000 common shares of Cebu Holdings, Inc. (CHI) from BPI Securities Corporation amounting to P=253 thousand. Subsequently, on September 18, 2017, ALI bought additional 95,678,800 common shares of CHI from BPI Securities Corporation amounting to P564.5 million which raised ALI’s interest from 66.98% to 71.96%. The transaction was accounted for as an equity transaction which resulted into negative equity reserves of P=179.3 million.
e) On August 18, 2017, ALI BOD approved the declaration of cash dividends of P=0.24 per outstanding common share. This brings full year dividends to P=0.48 per common share which
S E C F O R M 1 7 - Q 23
reflects a payout ratio of 34% of prior year’s earnings. The cash dividend was paid on September 15, 2017 to stockholders of common shares as of record date September 5, 2017.
f) On various dates in 2016, ALI acquired a 21.1% stake in OCLP Holdings, Inc. (OHI) consistent with its thrust of expanding its operations to other areas within and outside of Metro Manila through partnerships. The acquisition was made possible via the purchase of shares from existing OHI shareholders which amounted to P=7,320.7 million (see Note 10). For purposes of the provisional purchase price allocation, ALI Group assumed that the purchase price is equal to the proportionate share of the Group in the fair value of assets and liabilities of OHI. OHI owns 99.5% interest in Ortigas & Company Limited Partnership (OCLP), an entity engaged in real estate development and leasing businesses. As of September 30, 2017, the purchase price allocation of OHI has been prepared using the appraisal values of the OHI landbank as of May 2016. The negative goodwill amounting to P=148.0 million was included under “Other income” as follows:
(in million pesos) Total Net Assets acquired P=7,338 Acquisition Cost 7,190
Negative Goodwill P=148
g) On February 24, 2016, ALI purchased 2.5 billion common shares or 51% interest in POPI for a
total consideration P=5,625.0 million. On July 4, 2016, ALI obtained control over POPI. Accordingly, POPI financial statements were consolidated on a line-by-line basis with that of the Group as of December 31, 2016. The purchase price allocation has been prepared on a preliminary basis as the fair values of leasehold rights, investment property and property, plant and equipment are being finalized. In July 2017, ALI finalized the purchase price allocation and there were changes to fair market value of the assets acquired and liabilities assumed.
h) The voting rights held by the Group in ALI as of September 30, 2017 and December 31, 2016
is equal to 68.7%.
IMI Group a) On February 15, 2017, the BOD of IMI approved the proposed decrease of authorized capital
stock of IMI Philippines to reflect the retirement of the redeemed P=1.3 billion redeemable preferred shares and the corresponding amendment to the Articles of Incorporation.
b) On March 29, 2017, Ayala Corp. announced that AYC Holdings, Ltd. (AYCH), a wholly owned subsidiary of Ayala held through ACIFL, will transfer its 50.6% ownership in IMI to AC Industrial, through a special block sale of IMI shares. The sale of shares was approved by the PSE on March 29, 2017. This transaction was granted exemptive relief from the application of the mandatory tender offer rules by the SEC on March 21, 2017 on the ground that the change in the form of Ayala’s ownership of the IMI shares is by no means a takeover by a third party and will not affect the management and control of IMI. AC Industrial currently holds Ayala’s interests in automotive distributorship which include a 13% stake in Honda Cars Philippines, Inc. (HCPI), a 15% stake in Isuzu Philippines Corp. (IPC), a 100% stake in Honda Cars Makati, Inc. (HCMI), Isuzu Automotive Dealership, Inc. (IADI), Automobile Central Enterprise Inc. (ACEI), Iconic Dealership, Inc. (IDI) and Adventure Cycle Philippines Inc. (ACPI). HCMI and IADI, respectively, own and operate 11 full-service Honda dealerships and 8 full-service Isuzu dealerships nationwide. ACEI is the official Philippine importer and distributor while IDI operates dealerships of Volkswagen vehicles. AC Industrial also manufactures KTM motorcycles and, through ACPI, is the official distributor of KTM motorcycles in the Philippines. This transaction consolidates Ayala’s existing assets in manufacturing and vehicle distribution and dealership under AC Industrial, creating a platform to execute on Ayala’s vision to assemble a portfolio of businesses that own, develop, enable, manufacture, and commercialize automotive and other industrial technologies across various platforms to capture opportunities in the domestic and global markets. The transaction will have no impact to Ayala’s consolidated financial statements as this is just a transfer within the Group from one wholly owned subsidiary to another.
c) On April 4, 2017, the BOD of IMI approved the declaration of cash dividend of $0.004529 or

S E C F O R M 1 7 - Q 24
P=0.22739 per share to all outstanding common shares as of record date of April 20, 2017
payable on May 4, 2017.
d) Acquisition of Surface Technology International Enterprises Limited (STI)
On April 6, 2017, IMI has entered into an agreement with the shareholders of STI for the acquisition by IMI, through its subsidiary IMI UK, of an 80% stake in STI, an electronics manufacturing services (EMS) company based in the United Kingdom, with factories in Hook and Poynton in the United Kingdom and Cebu, Philippines. The closing of the transaction transpired on May 16, 2017 upon completion of pre-closing conditions and regulatory approval. IMI has elected to measure non-controlling interest in the acquiree at the proportionate share of the non-controlling interest in the recognized amounts of the acquiree’s identifiable net assets. The carrying amount of non-controlling interest changes due to allocation of profit or loss, changes in other comprehensive income and dividends declared for the reporting period.
The provisional values of the identifiable assets and liabilities acquired and goodwill arising as at the date of acquisition follows (in thousands): Assets Cash and cash equivalents US$4,046 Receivables 11,777 Inventories 15,676 Prepayments and other current assets 3,695 Property, plant and equipment 7,650
42,844
Liabilities Trade accounts payable 5,102 Accrued expenses 2,162 Other current liabilities 15,742 Short-term debt 14,206 Long-term debt 259 Other noncurrent liabilities 1,284
38,755
Net Assets US$4,089
Cost of acquisition US$54,726 Less: Share in the fair value of net assets acquired (80.00%) 3,271
Provisional goodwill US$51,455
Non-controlling interest (20.00%) US$818
The purchase price allocation for the acquisition of STI has been prepared on a preliminary basis due to unavailability of information to facilitate fair value computation. This includes information based on appraisal reports for property, plant and equipment and information necessary for the valuation of identified intangible assets (customer relationships). Reasonable changes are expected as additional information becomes available. The accounts that are subject to provisional accounting are property, plant and equipment, intangible assets and goodwill. The provisional goodwill recognized on the acquisition can be attributed to STI’s access to the UK market through two acquired factories. Further, the partnership allows the entry of IMI Group into the aerospace, security and defense sectors. The provisional purchase price allocation will be finalized within one year from date of closure of this acquisition transaction. Analysis of cash flows on acquisition (in thousands): Initial purchase consideration US$29,750 Contingent consideration 24,976
Cost of acquisition US$54,726
Cash consideration US$29,750 Less: Cash acquired from the subsidiary 4,046
Net cash flow (included in cash flows from investing activities) US$25,704

S E C F O R M 1 7 - Q 25
The initial purchase consideration of GBP23.00 million (US$29.75 million) upon signing of the agreement was paid in cash. The deferred consideration will depend on the actual normalized EBITDA performance less adjustments in 2018 and 2019. The contingent consideration was recognized at its fair value as part of the consideration transferred using the probability-weighted average of payouts associated with each possible outcome which resulted to an initial estimate amounting to GBP19.88 (US$25.72 million). The agreement also provided details regarding the sale of additional shares from the non-controlling interest through the grant of put and call options. IMI management assessed that it does not have present access to the returns associated with the non-controlling interest. The IMI Group takes the view that the non-controlling interest should be accounted for in accordance with PFRS 10, Consolidated Financial Statements, and must be presented within equity, separate from the equity of the owners of the Parent Company, until the put option is exercised. The IMI Group has elected to measure non-controlling interest in the acquiree at the proportionate share of the non-controlling interest in the recognized amounts of the acquiree’s identifiable net assets. The carrying amount of non-controlling interest changes due to allocation of profit or loss, changes in other comprehensive income and dividends declared for the reporting period.
The call option is accounted for under PAS 39, Financial Instruments: Recognition and Measurement, as a derivative asset carried at fair value through profit or loss. Given that the call option is exercisable at the fair value of the shares at the exercise date, the value of the derivative is nil. The financial liability for the put option is accounted for under PAS 39 like any other written put option on equity instruments. On initial recognition, the corresponding debit is made to a component of equity attributable to the parent, not to the non-controlling interest. All subsequent changes in the carrying amount of the financial liability that result from the remeasurement of the present value payable on exercise are recognized in profit or loss also attributable to the parent.
If the put option is exercised, the entity accounts for an increase in its ownership interest. At
the same time, the entity derecognizes the financial liability and reverses the component of
equity that was reduced on initial recognition. If the put option expires unexercised, the financial
liability is reclassified to the same component of equity that was reduced on initial recognition.
The IMI Group accounted for the put options as financial liabilities measured at the present value of the redemption amount, with a debit to “Additional paid-in capital” account, amounting to US$13.54 million on initial valuation. Mark-to-market loss from valuation date until September 30, 2017 amounting to US$0.11 million was recognized in the consolidated statements of income. Acquisition-related costs, which consist of professional and legal fees, financing and transaction costs, taxes, representation and travel expenses amounting to US$1.52 million were recognized as expense in 2017.
e) Acquisition of VIA On August 16, 2016, Cooperatief and the shareholders of VIA entered into a Sale and Purchase Agreement (SPA) under which Cooperatief will acquire a 76.01% stake in VIA for a total cash consideration of €47.79 million (US$53.46 million), while the remaining 23.99% to be retained by the company founder. In 2016, the purchase price allocation for the acquisition of VIA has been prepared on a preliminary basis due to unavailability of information to facilitate fair value computation. As of September 30, 2017, IMI finalized the purchase price allocation with the following changes in provisional values based on the additional information subsequently obtained:
Assets Fair Values Provisional
Values
Cash and cash equivalents $6,585 $6,585 Receivables 18,745 18,745 Inventories 5,448 5,448 Prepayments and other current assets 661 661 Property, plant and equipment 3,149 3,149 Intangible asset 8,341 493 Deferred tax asset 558 558 Other noncurrent assets 159 159

S E C F O R M 1 7 - Q 26
43,646 35,798
Liabilities Accounts payable and accrued expenses 18,241 18,241 Current portion of long-term debt 126 126 Loans payable 8,478 8,478 Other current liabilities 2,724 2,724 Long-term debt 209 209 Other noncurrent liabilities 152 152 Deferred tax liabilities 1,976 217
31,906 30,147
Net Assets $11,740 $5,651
Cost of acquisition 53,464 $53,463 Less: Share in the fair value of net assets acquired (76.01%) 8,924 4,295
Goodwill $44,540 $49,168
Non-controlling interest (23.99%) $2,816 $1,356
f) As of September 30, 2017, the Company and AC Industrial effectively own 50.7% of IMI. The
voting rights held by the Group in IMI as of September 30, 2017 and December 31, 2016 is equal to 50.7%.
MWC Group a) On January 15, 2016, Manila Water Philippine Ventures, Inc. (MWPVI) entered into a MOA with
ALI and its subsidiaries (the ALI Group), whereby MWPVI shall exclusively provide water and used water services and facilities to all property development projects of the ALI Group.
b) On December 8, 2016, MWPVI entered into a similar MOA with each of SM Prime Holdings Inc.’s and the latter’s affiliates and subsidiaries, SM Development Corporation and SM Residences Corp. (collectively, the SM Group). Pursuant to the MOA, MWPVI will provide the water and/or used water services and facilities to the property development projects of the SM Group identified in each of the MOA. As of December 31, 2016, MWPVI has five signed MOA with the SM Group.
c) On December 9, 2016, MWC received a Notice of Award from the Calasiao Water District (CWD) for the implementation of the joint venture project (the Project) for the design, construction, rehabilitation, maintenance, operation, financing, expansion and management of the water supply system of the CWD in Calasiao, Pangasinan. On June 19, 2017, MWC has signed a Joint Venture Agreement (JVA) with CWD which will govern the relationship of the two parties as joint venture partners in undertaking the Project. Under the JVA, MWC and CWD shall cause the incorporation of a joint venture company. MWC and CWD shall own 90.00% and 10.00%, respectively, of the joint venture company’s outstanding capital stock. The joint venture company will then enter into a concession agreement with CWD for the implementation of the Project for twenty-five (25) years from the commencement date, as defined in the concession agreement. On August 2, 2017, the SEC approved the incorporation of Calasiao Water Company, Inc. (Calasiao Water).
d) On January 4, 2017, MWPVI entered into an Asset Purchase Agreement (“APA”) with Asian Land Strategies Corporation (“Asian Land”) to acquire and operate the latter’s assets used in the water business operations in Asian Land’s developments in the province of Bulacan. The intention of MWPVI was to assign the rights under the APA to its wholly owned subsidiary upon its incorporation. On April 11, 2017, the SEC issued the incorporation documents of Bulacan MWPV Development Corporation (BMDC), the primary purpose of which is to design, construct, rehabilitate, maintain, operate, finance, expand, and manage water supply system and sanitation facilities. BMDC is also the ultimate entity that will own and operate the assets acquired from Asian Land.

S E C F O R M 1 7 - Q 27
On July 26, 2017, BMDC entered into an APA with Solar Resources, Inc. (“Solar”) to acquire and operate the latter’s assets used in the water business operations in Solar developments in the province of Bulacan. On July 31, 2017, MWPVI assigned all its rights and obligations on the APA to BMDC, a wholly-owned subsidiary of MWPVI, under a Deed of Assignment. On the same day, the Deed of Absolute Sale has also been executed between Asian Land and BMDC.
e) On January 24, 2017, the consortium of MWC and MWPVI received the Notice of Award from the Obando Water District (OWD) for the implementation of the joint venture project for the design, construction, rehabilitation, maintenance, operation, financing, expansion, and management of the water supply system and sanitation facilities of the OWD in Obando, Bulacan. On February 2, 2017, the SEC issued the Certificate of Registration of Obando Water Consortium Holdings Corp. (Obando Water Holdings). Obando Water Holdings is the Consortium between the MWC and MWPVI with an equity share of 49% and 51%, respectively. The primary purpose of Obando Water Holdings is to engage in the business of a holding company without acting as stockbroker or dealer in securities. On August 23, 2017, Obando Water Holdings signed and executed a JVA with OWD. The JVA governs the relationship of Obando Water Holdings and OWD as joint venture partners in the Obando Water Concession Project (the “Project”). Under the said JVA, Obando Water Holdings and the OWD shall cause the incorporation of a Joint Venture Company (“JVC”) which will implement the Project for the design, construction, rehabilitation, operation, maintenance, financing, expansion and management of water facilities and the provision of water and sanitation services in the Municipality of Obando. Obando Water Holdings will own 90.0% while OWD will own 10.0% of the JVC’s outstanding capital stock. For the implementation of the Project, OWD and the JVC shall execute a Concession Agreement.
f) On March 1, 2017, cash dividends of P=0.4244 and P=0.04244 per share of outstanding common shares and participating preferred shares, respectively, were declared and were paid on June 30, 2017 to stockholders of record as of March 15, 2017.
g) On June 7, 2017, Tourism Infrastructure and Enterprise Zone Authority (TIEZA) approved the first tranche of tariff increase of 30.14% of Boracay Island Water Company, Inc., a subsidiary of MWC, pertaining to rate rebasing adjustment to be implemented effective July 1, 2017.
h) On June 21, 2017, Manila Water South Asia Holdings Pte. Ltd (MWSAH), a subsidiary of MWC, subscribed to an additional 6.15 million primary shares of Saigon Water at a subscription price of VND16,900.00 per share for a total amount of VND103.87 billion (equivalent to P=229.16 million). As a result of this additional subscription, MWSAH now holds 38.0% of the outstanding capital stock of Saigon Water (see Note 10).
i) The voting rights held by the Group in MWC as of September 30, 2017 and December 31, 2016 is equal to 80.4%.

S E C F O R M 1 7 - Q 28
Material partly-owned subsidiaries The summarized financial information of subsidiaries that have material non-controlling interest is provided below. This information is based on amounts before intercompany eliminations.
As of September 30, 2017 (unaudited), the proportion of economic ownership held by material non-controlling interest of ALI, MWC and IMI are 52.9%, 48.4% and 49.3%, respectively.
September 2017 December 2016
(Unaudited) (Audited)
(In Millions)
Ayala Land, Inc. and Subsidiaries
Current assets 218,834₱ 211,012₱
Non-current assets 342,906 325,420
Current liabilities 180,322 188,203
Non-current liabilities 196,734 175,546
Equity
Attributable to owners of the parent 157,544 147,705
Attributable to non-controlling interest 27,140 24,978
Revenue 98,927 85,489 *
Net income
Attributable to owners of the parent 17,810 15,061 *
Attributable to non-controlling interest 2,880 2,343 *
Other comprehensive income 62₱ 28₱ *
Manila Water Co. Inc. and Subsidiaries
Current assets 17,796₱ 8,256₱
Non-current assets 87,324 77,223
Current liabilities 12,185 7,482
Non-current liabilities 43,430 33,616
Equity
Attributable to owners of the parent 48,401 43,384
Attributable to non-controlling interest 1,104 997
Revenue 13,785 13,347 *
Net income
Attributable to owners of the parent 4,892 4,872 *
Attributable to non-controlling interest 107 108 *
Other comprehensive income 1,144₱ 26₱ *
Integrated Microelectronics, Inc. and Subsidiaries
Current assets 526US$ 407US$
Non-current assets 326 229
Current liabilities 430 270
Non-current liabilities 162 128
Equity
Attributable to owners of the parent 256 237
Attributable to non-controlling interest 4 1
Revenue 795 616 *
Net income
Attributable to owners of the parent 24 21 *
Attributable to non-controlling interest - - *
Other comprehensive income 17US$ 2US$ *
* Based on unaudited September 30, 2016.

S E C F O R M 1 7 - Q 29
4. Cash and Cash Equivalents
This account consists of the following:
Cash in banks earns interest at the prevailing bank deposit rates. Cash equivalents are short-term, highly liquid investments that are made for varying periods of up to three months depending on the immediate cash requirements of the Group and earn interest at the prevailing short-term rates. The Group maintains cash and cash equivalents with Bank of the Philippine Islands (BPI), an associate of the Company and related party of the Group, amounting to P=45.5 billion and P=24.0 billion, as of September 30, 2017 (unaudited) and December 31, 2016 (audited), respectively (see Note 21).
5. Short-term Investments
This account consists of the following:
Short-term investments pertain to money market placements made for varying periods of more than three months but less than one year and earn interest at the respective short-term investment rates. The Group maintains short-term investments with BPI amounting to P=720.6 million and P=405.5 million, as of September 30, 2017 (unaudited) and December 31, 2016 (audited), respectively (see Note 21).
September 2017 December 2016
(Unaudited) (Audited)
(In Thousands)
Cash on hand and in banks 17,933,678₱ 23,721,591₱
Cash equivalents 56,183,599 36,501,733
74,117,277₱ 60,223,324₱
September 2017 December 2016
(Unaudited) (Audited)
(In Thousands)
Money market placements 2,314,711₱ 1,008,705₱

S E C F O R M 1 7 - Q 30
6. Accounts and Notes Receivable – net This account consists of the following:
The aging of the above receivables is summarized in the following table:
The Group’s Advances to other companies account mainly pertain to ALI’s advances to third party joint venture partners that have been made in consideration of project costs and purchases of land that are still subject to completion. ALI Group does not intend that these advances will be repaid, but will instead be recorded as part of the project costs upon development or as part of consideration for purchases of land. The documentation for these advances provides that these will be payable over a fixed term or on demand in order to allow for repayment of the advances when closing does not occur. This account also includes Receivables from MRT Development Corporation (MRTDC) shareholders which pertains to interest-bearing advances to MRTDC equivalent to the Pre-2006 Development Rights Payment (DRP) Payables and the Residual Depot DRP which is due more than one year, in relation to the funding and repayment agreement. Certain advances are interest bearing and subject to terms as agreed between the parties. Advances to contractors and supplier account are recouped every progress billing payment date depending on the percentage of accomplishment or delivery. Others account mainly include accrued interest receivable and other non-trade accounts from non-related entities which are non-interest bearing and are due and demandable. ALI entered into agreements with BPI Asset Management and Trust Corporation, a subsidiary of BPI, in 2017 and 2016 for the assignment of interest-bearing employee receivables amounting to ₱69.0 million and ₱99.6 million, respectively. The transactions were without recourse and did not result to any gain or loss. ALI sold real estate receivables on a without recourse basis to partner mortgage banks, which include BPI Family Savings Bank, a subsidiary of BPI, totaling to ₱4,597 million in 2017 and ₱2,008 million in 2016. These were sold at discount with total proceeds of ₱4,331 million and ₱1,894
September 2017 December 2016
(Unaudited) (Audited)
(In Thousands)
Trade:
Real estate and hotels 90,359,052₱ 90,043,604₱
Electronics manufacturing 12,842,827 9,784,345
Automotive 3,483,326 2,791,338
Water infrastructure 3,170,005 2,712,944
International and others 839,469 525,154
BPO 239,624 275,198
Advances to contractors and suppliers 26,735,923 27,609,966
Advances to other companies 18,105,956 17,041,090
Receivable from related parties (Note 21) 2,444,432 2,339,638
Receivable from officers and employees (Note 21) 1,817,175 1,090,801
Dividend receivable - 1,228,133
Receivable from Bonifacio Water Corporation (BWC) 529,501 529,501
Others 71,734 58,954
160,639,024 156,030,666
Less allowance for doubtful accounts 2,859,590 2,704,356
157,779,434 153,326,310
Less noncurrent portion 33,091,746 36,484,347
124,687,688₱ 116,841,963₱
Up to 6
months
Over 6 mos.
to one year
Over one
year Past due Total
(In Millions, Unaudited)
Trade Receivables 72,631₱ 12,417₱ 17,858₱ 8,028₱ 110,934₱
Non-Trade Receivables 28,947 10,692 7,093 113 46,845
Total 101,578₱ 23,109₱ 24,951₱ 8,141₱ 157,779₱
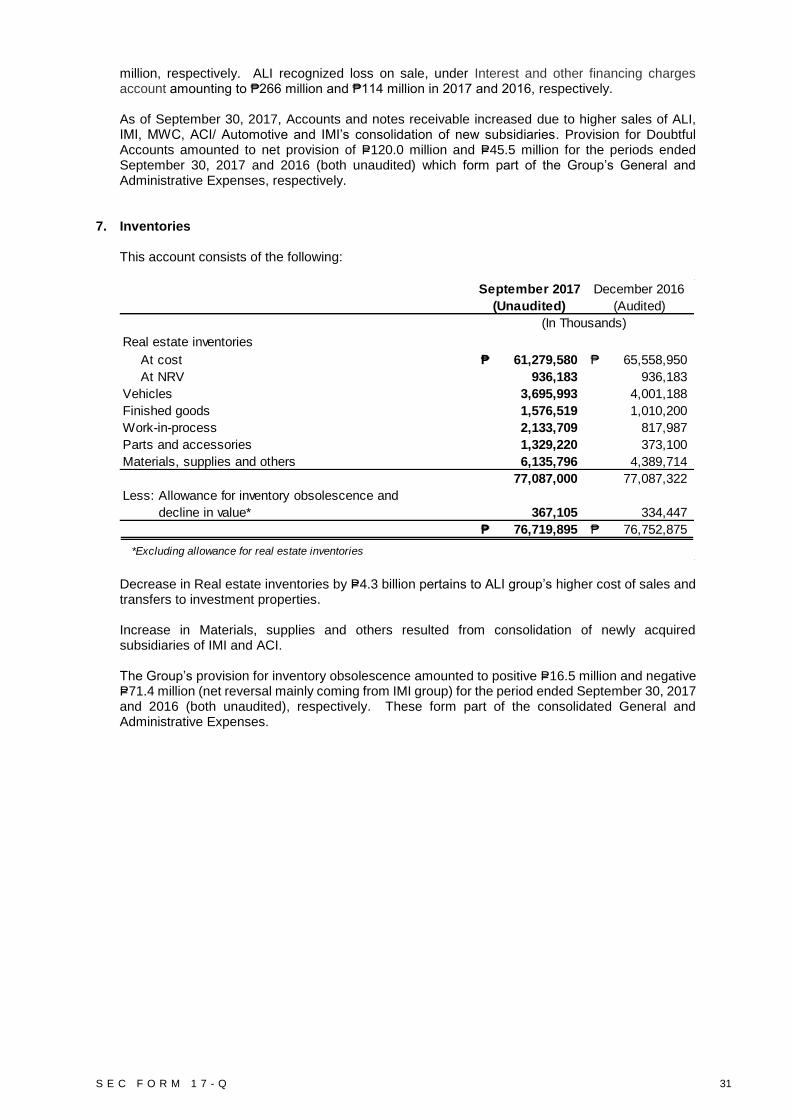
S E C F O R M 1 7 - Q 31
million, respectively. ALI recognized loss on sale, under Interest and other financing charges account amounting to ₱266 million and ₱114 million in 2017 and 2016, respectively. As of September 30, 2017, Accounts and notes receivable increased due to higher sales of ALI, IMI, MWC, ACI/ Automotive and IMI’s consolidation of new subsidiaries. Provision for Doubtful Accounts amounted to net provision of P=120.0 million and P=45.5 million for the periods ended September 30, 2017 and 2016 (both unaudited) which form part of the Group’s General and Administrative Expenses, respectively.
7. Inventories
This account consists of the following:
Decrease in Real estate inventories by P=4.3 billion pertains to ALI group’s higher cost of sales and transfers to investment properties. Increase in Materials, supplies and others resulted from consolidation of newly acquired subsidiaries of IMI and ACI. The Group’s provision for inventory obsolescence amounted to positive P=16.5 million and negative P=71.4 million (net reversal mainly coming from IMI group) for the period ended September 30, 2017 and 2016 (both unaudited), respectively. These form part of the consolidated General and Administrative Expenses.
September 2017 December 2016
(Unaudited) (Audited)
(In Thousands)
Real estate inventories
At cost 61,279,580₱ 65,558,950₱
At NRV 936,183 936,183
Vehicles 3,695,993 4,001,188
Finished goods 1,576,519 1,010,200
Work-in-process 2,133,709 817,987
Parts and accessories 1,329,220 373,100
Materials, supplies and others 6,135,796 4,389,714
77,087,000 77,087,322
Less: Allowance for inventory obsolescence and
decline in value* 367,105 334,447
76,719,895₱ 76,752,875₱
*Excluding allowance for real estate inventories

S E C F O R M 1 7 - Q 32
8. Other Current Assets and Pension and Other Noncurrent Assets
These accounts consist of the following:
Other noncurrent assets also includes noncurrent deposits (escrow and security deposits on land leases, electric and water meter deposits), deferred charges (mainly consist of prepayments for expenses that is amortized for more than one year), leasehold rights (right to use an island property which expires on December 31, 2029) and deferred Foreign Currency Differential Adjustment [FCDA] which refers to the net unrecovered amounts from (amounts for refund to) customers of MWC Group for realized losses (gains) from payments of foreign loans based on the difference between the drawdown or rebased rate versus the closing rate at payment date. Other noncurrent assets also include advances to joint venture (JV) partners that have been made in consideration of project costs and purchases of land that are still subject to completion, which upon completion, will subsequently form part of the project costs or purchased land. The significant increase in other current assets pertains to ALI group’s higher FVPL/money market placements/ UITF investments, input tax, prepayments for project costs; AC Industrial’s higher prepayments and input tax, plus IMI’s consolidation of new subsidiaries; AAC’s deposits for an aircraft acquisition; and BHL’s additional infusion in certain FVPL investments. The significant increase in the other non-current assets pertains to ALI’s additional prepaid costs for unlaunched projects and investment in bonds and other securities; MWC’s higher balance of deferred FCDA due to forex movements; and BHL’s additional investment in bonds and other securities (refer to discussion of key transactions related to this in the next paragraph); partially offset by ACEHI’s use of cash deposit to fund investment in an associate.
As of September 30, 2017, the following were key transaction as regards the Group’s Investment in Bonds and Other Securities: (a) disposal of investment in Red River Holdings (Red River), investment funds based in Vietnam, last February 2017 which resulted in gain of US$ 3.6 million; (b) conversion of Ho Chi Minh Infrastructure Investment Joint Stock Co. (CII) bonds into shares at a ratio of 1:90.9, with the closing share price of VND37,250 per share. This conversion resulted in gain of US$4.8 million representing the increase in value of related investment in CII shares; (c) gain on the realization of the valuation reserve recorded on the investment in shares of CII amounting to US$4.9 million.
9. Land and Improvements This account consists of properties for future development and improvement eventually for transfer to real estate inventories for sale. This account decreased from P=101,049 million as of December 31, 2016 (audited) to P=100,528 million as of September 30, 2017 (unaudited) arising from ALI’s deductions/transfers within the year.
September 2017 December 2016
(Unaudited) (Audited)
(In Thousands)
Input VAT 18,564,211₱ 11,822,618₱
Prepaid expenses 10,476,258 11,798,740
Financial assets at FVPL 11,876,565 6,664,015
Creditable withholding tax 3,772,652 2,234,594
Derivative assets 276,541 245,887
Concession financial receivable 309,219 200,253
Deposits in escrow 152,290 104,163
Others 1,031,763 568,213
Other current assets 46,459,499₱ 33,638,483₱
Other noncurrent assets 23,614,752₱ 21,045,520₱
Investments in bonds and other securities 5,381,148 4,565,079
Pension asset 194,485 236,879
Pension and other noncurrent assets 29,190,385₱ 25,847,478₱

S E C F O R M 1 7 - Q 33
10. Investments in Associates and Joint Ventures
Investments in associates and joint ventures are accounted for under the equity method of accounting. Major associates and joint ventures and the related percentages of economic ownership as of September 30, 2017 are as follows:
Unless otherwise indicated, the principal place of business and country of incorporation of the Group’s investments in associates and joint ventures is the Philippines. Except as discussed in subsequent notes, the voting rights held by the Group in its investments in associates and joint ventures are in proportion to its ownership interest. As of September 30, 2017, the Group has reversed impairment provisions amounting to P=586.0 million for certain investments as there was improvement in values. The following are financial highlights and significant transactions of associates and joint ventures, part of which affected the Company’s investments in its associate and joint venture:
% of Economic Ownership Carrying Amounts
September 2017 December 2016 September 2017 December 2016
(Unaudited) (Audited) (Unaudited) (Audited)
Domestic: (In Millions)
Bank of the Philippine Islands (BPI) 32.5 32.5 77,016₱ 72,532₱
Liontide Holdings Inc. (LHI)* 78.1 73.8 41,623 39,418
Globe Telecom, Inc. (Globe)* 31.0 31.0 21,374 20,143
GNPower Mariveles Coal Plant Ltd. Co (GNPower) 17.1 17.1 9,115 8,790
OCLP Holdings, Inc. (OHI) 21.0 21.0 7,643 7,321
Emerging City Holdings, Inc. (ECHI)* 50.0 50.0 3,847 4,159
South Luzon Thermal Energy Corp. (SLTEC)* 35.0 35.0 2,722 2,785
Berkshire Holdings, Inc. (BHI)* 50.0 50.0 1,880 1,834
Light Rail Manila Holdings, Inc. (LRMHI) 50.0 50.0 1,778 1,647
Cebu District Property Enterprise, Inc. (CDPEI)* 42.0 42.0 1,477 1,487
Bonifacio Land Corporation (BLC) 10.0 10.0 1,367 1,370
Asiacom Philippines, Inc. (Asiacom)* 60.0 60.0 1,267 1,253
GNPower Dinginin Ltd. Co. (GNP Dinginin) 50.0 50.0 1,110 1,158
Philippine Wind Holdings Corporation (PWHC)* 42.9 42.9 857 993
BF Jade E-Services Philippines, Inc. 44.2 - 785 -
Alveo Federal Land Community* 50.0 50.0 639 605
Rize-Ayalaland (Kingsway) GP Inc. (Rize-Ayalaland) 49.0 49.0 612 624
Globe Fintech Innovations, Inc. 10.0 - 506 -
Generika Group * 50.0 50.0 501 443
Foreign:
Star Energy Salak-Darajat B.V.
(incorporated in Netherlands) 19.8 - 8,997 -
Modular Construction Technology Bhd. (MCT)
(incorporated in Malaysia) 33.0 33.0 6,644 6,400
Thu Duc Water B.O.O. Corporation (TDW)
(incorporated in Vietnam) 49.0 49.0 2,790 2,586
Kenh Dong Water Supply Joint Stock Company
(KDW) (incorporated in Vietnam) 47.4 47.4 2,577 2,417
Saigon Water Infrastructure Joint Stock Company
(Saigon Water) (incorporated in Vietnam) 38.0 31.5 1,095 852
UPC Renewables Asia III Ltd (incorporated in Hong Kong) 51.0 - 1,051 -
Tianjin Eco-City Ayala Land Development Co., Ltd.
(incorporated in China) 40.0 40.0 420 342
Cu Chi Water 24.5 24.5 352 344
Others Various Various 1,380 811
201,425₱ 180,314₱
* Joint ventures
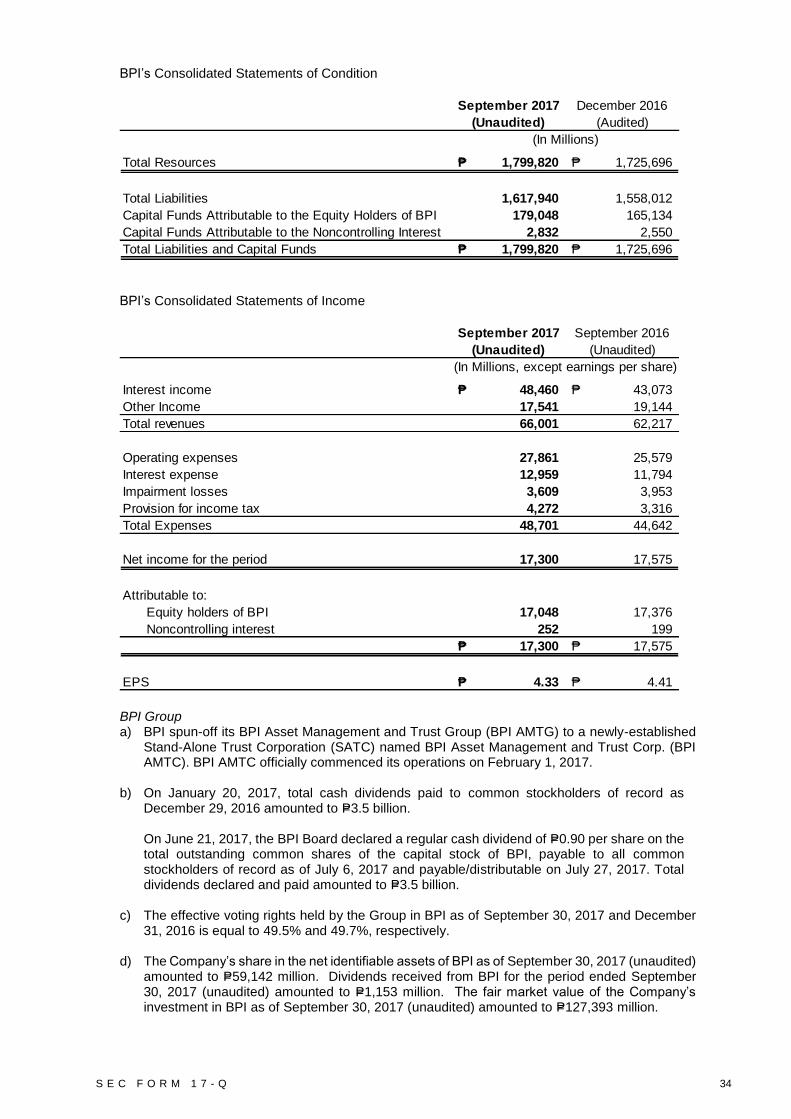
S E C F O R M 1 7 - Q 34
BPI’s Consolidated Statements of Condition
BPI’s Consolidated Statements of Income
BPI Group a) BPI spun-off its BPI Asset Management and Trust Group (BPI AMTG) to a newly-established
Stand-Alone Trust Corporation (SATC) named BPI Asset Management and Trust Corp. (BPI AMTC). BPI AMTC officially commenced its operations on February 1, 2017.
b) On January 20, 2017, total cash dividends paid to common stockholders of record as December 29, 2016 amounted to P=3.5 billion. On June 21, 2017, the BPI Board declared a regular cash dividend of P=0.90 per share on the total outstanding common shares of the capital stock of BPI, payable to all common stockholders of record as of July 6, 2017 and payable/distributable on July 27, 2017. Total dividends declared and paid amounted to P=3.5 billion.
c) The effective voting rights held by the Group in BPI as of September 30, 2017 and December 31, 2016 is equal to 49.5% and 49.7%, respectively.
d) The Company’s share in the net identifiable assets of BPI as of September 30, 2017 (unaudited) amounted to P=59,142 million. Dividends received from BPI for the period ended September 30, 2017 (unaudited) amounted to P=1,153 million. The fair market value of the Company’s investment in BPI as of September 30, 2017 (unaudited) amounted to P=127,393 million.
September 2017 December 2016
(Unaudited) (Audited)
(In Millions)
Total Resources 1,799,820₱ 1,725,696₱
Total Liabilities 1,617,940 1,558,012
Capital Funds Attributable to the Equity Holders of BPI 179,048 165,134
Capital Funds Attributable to the Noncontrolling Interest 2,832 2,550
Total Liabilities and Capital Funds 1,799,820₱ 1,725,696₱
September 2017 September 2016
(Unaudited) (Unaudited)
(In Millions, except earnings per share)
Interest income 48,460₱ 43,073₱
Other Income 17,541 19,144
Total revenues 66,001 62,217
Operating expenses 27,861 25,579
Interest expense 12,959 11,794
Impairment losses 3,609 3,953
Provision for income tax 4,272 3,316
Total Expenses 48,701 44,642
Net income for the period 17,300 17,575
Attributable to:
Equity holders of BPI 17,048 17,376
Noncontrolling interest 252 199
17,300₱ 17,575₱
EPS 4.33₱ 4.41₱

S E C F O R M 1 7 - Q 35
LHI a) In January 2017, the SEC approved the reclassification of 48,574,200 of LHI’s Common B
shares into redeemable preferred shares (RPS). In March 2017, Arran Investment Pte Ltd, the holder of these RPS, issued a notice to LHI for a redemption in-kind involving 10,913,830 RPS shares for 45,627,477 shares of BPI held by LHI. The redemption in-kind has a total consideration of US$90.9 million (P=4.6 billion) worth of BPI shares. The cross at the PSE was executed on May 5, 2017. Ayala Group’s effective ownership in BPI remains after this transaction but its ownership in LHI increased from 73.8% to 78.1% while LHI’s investment in BPI shares declined from 21.3% to 20.1%.
b) As of September 30, 2017, the Company’s direct ownership in LHI is equal to 78.1%, while LHI’s direct ownership in BPI is equal to 20.1%. The fair value of BPI shares held by LHI amounted to P=78,764.7 million as of September 30, 2017 (unaudited). The Company and Arran Investment Pte. Ltd., an entity managed and controlled by GIC Special Investments Pte. Ltd., as joint venture partners, agreed to vote its BPI shares based on the common position reached jointly by them as shareholders.
Globe’s Consolidated Statements of Financial Position
Globe’s Consolidated Statements of Income
September 2017 December 2016
(Unaudited) (Audited)
(In Millions)
Current Assets 51,446₱ 53,023₱
Noncurrent Assets 218,427 196,840
Total Assets 269,873 249,863
Current Liabilities 73,774 82,402
Noncurrent Liabilities 129,022 103,985
Equity Attributable to Equity Holders of the Parent 67,059 63,440
Equity Attributable to Noncontrolling Interest 18 36
Total Liabilities and Equity 269,873₱ 249,863₱
September 2017 September 2016
(Unaudited) (Unaudited)
(In Millions, except earnings per share)
Net Operating Revenues 100,454₱ 94,194₱
Other Income 2,121 87
Total Revenues 102,575 94,281
Costs and Expenses 84,312 77,191
Provision for Income Tax 5,282 5,374
Total Expenses 89,594 82,565
Net Income 12,981 11,716
Total net income attributable to:
Equity holders of the Parent 12,987 11,719
Noncontrolling interest (6) (3)
Net Income 12,981₱ 11,716₱
EPS:
Basic 94.58₱ 85.11₱
Diluted 94.40₱ 85.03₱

S E C F O R M 1 7 - Q 36
Globe Group a) On May 30, 2016, Globe Telecom’s BOD, through its Executive Committee, approved the
signing of a Sale and Purchase Agreement (SPA) and other related definitive agreements for the acquisition of 50% equity interest in the telecommunications business of San Miguel Corporation (SMC), Schutzengel Telecom, Inc. and Grace Patricia W. Vilchez-Custodio (the “Sellers”; SMC being the major seller) through their respective subsidiaries namely, Vega Telecom, Inc. (VTI), Bow Arken Holdings Company, Inc. (BAHC) and Brightside Holdings Corporation (BHC), respectively (the Acquirees). The preceeding sentence is hereinafter referred to as “the Transaction”.
VTI owns an equity stake in Liberty Telecom Holdings, Inc. (LIB). It also owns, directly and indirectly, equity stakes in various enfranchised companies, including Bell Telecommunication Philippines, Inc. (Bell Tel), Eastern Telecom Philippines, Inc. (Eastern Telecom), Colbalt point Telecommunication, Inc. (formerly Extelcom), and Tori Spectrum Telecom, Inc. (formerly Wi-Tribe), among others. The remaining 50% equity stake in VTI, BAHC and BHC was acquired by Philippine Long Distance Telephone Company (PLDT) under similar definitive agreements. Total consideration for the Transaction amounts to P=52,847.82 million for the purchase of the equity interest and advances of the Acquirees, which translated to an agreed consideration of P=26,423.91 million for Globe Telecom’s 50% equity stakes in the Acquirees. The SPA also provided for the assumption of total liabilities of P=17,151.18 million by Globe and PLDT from May 30, 2016 and a price adjustment mechanism based on the variance in the amount of assumed liabilities from April 30, 2016 to be agreed upon by Globe, PLDT and the Sellers at the end of the confirmatory due diligence period. Total price adjustment amounted to P=2,564.28 million resulting to adjusted total consideration of P=55,412.10 million. As of September 30, 2017 and December 31, 2016, the negotiated gross amount of the assumed liabilities was P=10,741.91 and P=10,782.50, respectively, which was already finalized with the network suppliers. Globe Telecom’s share in the negotiated assumed liabilities amounted to P=93.00 million and P=5,391.25 million as of September 30, 2017 and December 31, 2016, respectively. Acquisition-related cost amounting to P=306.48 million and P=298.53 million was carried as part of the investment cost also as of September 30, 2017 and December 31, 2016, respectively. The confirmatory due diligence was finalized as of June 30, 2017. The assumption of liabilities of VTI, BAHC and BHC by Globe Telecom and PLDT may give rise to claims that may not have been contemplated and agreed upon during the period set for confirmatory due diligence. The SPA provides for various indemnity claims expiring between 2 to 5 years from the end of the confirmatory due diligence period. The consideration for the equity interest and advances was settled on a deferred basis based on the following schedule: 50% on May 30, 2016, 25% on December 1, 2016 and 25% on May 30, 2017. The acquisition provided Globe Telecom an access to certain frequencies assigned to Bell Tel in the 700 Mhz, 900 Mhz, 1800 Mhz, 2300 Mhz and 2500 Mhz bands through a co-use arrangement approved by the NTC on May 27, 2016. NTC's approval is subject to the fulfillment of certain conditions including roll out of telecom infrastructure covering at least 90% of the cities and municipalities in three years to address the growing demand for broadband infrastructure and internet access. The memorandum of agreement between Globe and PLDT provides for both parties to pool resources and share in the profits and losses of the companies on a 50%-50% basis with a view to being financially self-sufficient and able to operate or borrow funds without recourse to the parties. Globe has extended advances to Vega group amounting to P=1,316.08 million for the period June 1, 2016 to December 31, 2016 which was carried as part of investment cost. Of the various companies within the group, only Eastern Telecom and its subsidiary have commercial operations generating P=2,093.60 million, P=955.70 million and P=670.50 million in revenues, EBITDA and net income, respectively, for the year ended December 31, 2016. Globe Telecom has adjusted its share in the net assets of the Acquirees to reflect losses on fair value of assets and onerous contracts. On June 21, 2016, Globe Telecom exercised its rights as holder of 50% equity interest of VTI to cause VTI to propose the conduct of a tender offer on the common shares of LIB held by minority shareholders as well as the voluntary delisting of LIB. At the completion of the tender offer and delisting of LIB, VTI‟s ownership on LIB is at 99.1%.

S E C F O R M 1 7 - Q 37
The net assets recognized in the December 31, 2016 consolidated financial statements were based on a provisional assessment of their fair values. The assessment of the final fair values was completed in June 2017. The management performed a review of VTI Group’s identifiable intangible assets and property and equipment and determined adjustments amounting to P=1,651.44 million increases on frequency, P=41.05 million decreases on trademark, P=363.40 million decreases on customer contracts and P=110.08 million increase on property and equipment appraisal. Adjustments related to tax amounted to P=407.12 million increase. Total net increase in identifiable net assets of VTI amounted to P=1,552.84 million resulting to goodwill from acquisition of P=18,012.26 million. On February 28, 2017, Globe and PLDT each subscribed to 2,760,000 new preferred shares to be issued out of the unissued portion of the existing authorized capital stock of VTI, at a subscription price of P=4,000 per subscribed shares (inclusive of a premium over par of P=3,000 per subscribed share) or a total subscription price of P=11,040 million (inclusive of a premium over par of P=8,280 million). Globe and PLDT’s assigned advances from SMC, which amounted to P=11,040 million, were treated as deposit on future stock subscription by VTI and applied subsequently as full payment of the subscription price. Also, on the same date, Globe and PLDT each subscribed to 800,000 new preferred shares to be issued out of the unissued portion of the existing authorized capital stock of VTI, at a subscription price of P=4,000 per subscribed share (inclusive of a premium over par of P=3,000 per subscribed share), or a total subscription price of P=3,200 million (inclusive of a premium over par of P=2,400 million). Globe and PLDT each paid P=148 million in cash for the subscribed shares. The remaining balance of the subscription price shall be paid by Globe and PLDT upon call of the VTI Board of Directors. The Globe Group’s share in total comprehensive loss from this investment amounted to ₱337.77 million and ₱540.00 million for the nine-month period ended September 30, 2017 and 2016, respectively.
b) On February 7, 2017, Globe’s BOD approved the declaration of first quarterly distributions of cash dividends of P=22.75 per common share paid last 8 March 2017. The first quarter dividend payment total was about P=3.0 billion.
c) On February 17, 2017, Globe’s BOD approved the signing of an Investment Agreement among Alipay Singapore Holdings PTE. LTD. (Alipay), Ayala, Globe, Globe Capital Venture Holdings Inc. (GCVHI, as subsidiary of Globe) and Globe Fintech Innovations, Inc. (GFI or Mynt), wherein GFI will issue to both Alipay and Ayala its currently unissued common shares upon its consummation not later than December 31, 2017, on which date all parties are given the right to terminate. The consummation of the Investment Agreement is subject to the fulfillment of certain conditions including the approval of relevant governmental authority such as the Philippine Competition Commission (PCC). Upon PCC’s approval and fulfillment of other conditions, the Investment Agreement is deemed consummated and will make Alipay, GCVHI, and Ayala legal holders of 45.0%, 45.0%, and 10.0%, respectively, of the issued and outstanding share capital of GFI on a fully-diluted basis.
Loss of control on investment in GFI/Mynt On September 27, 2017, following the approval from PCC, GFI/Mynt received the capital infusion from Alipay and Ayala amounting to ₱2,784.60 million in exchange for GFI/Mynt’s 513.00 million common shares. The issuance of shares to Alipay and Ayala diluted GCVHI’s ownership interest to 45%. The dilution of ownership interest resulted in GCVHI’s loss of control in GFI/Mynt. Thereafter, investment in GFI/Mynt was accounted for as a joint arrangement since no single party controls the arrangement and approvals of all parties are required before a decision can be passed. Gain on fair value of retained equity interest in GFI/Mynt amounted to ₱1,889.91 million, which was presented as “Gain on fair value of retained interest” in Globe’s consolidated statement of comprehensive income for the nine-month period ended September 30, 2017. Total net assets of GFI/Mynt as of the date of loss of control amounted to ₱388.40 million. The fair value of the retained interest in GFI/Mynt held by GCVHI amounted to ₱2,278.30 million as of September 27, 2017 (refer to related discussion of Investment in GFI./Mynt below).
d) On May 9, 2017, the Globe’s BOD approved the declaration of the second quarterly cash dividend of P=22.75 per common share, payable to common stockholders of record as of May 23, 2017. Total dividends amounting to P=3.0 billion will be payable on June 7, 2017.

S E C F O R M 1 7 - Q 38
On the same date, the BOD approved the declaration of the first semi-annual cash dividend for holders of its non-voting preferred shares on record as of August 10, 2017. The amount of the cash dividend shall be at a fixed rate of 5.2006% per annum calculated in respect of each share by reference to the offer price of P=500.00 per share on a 30/360 day basis for the six-month dividend period. Total amount of the cash dividend was paid on August 22, 2017. On August 7, 2017, the Globe’s BOD approved the declaration of the third quarterly cash dividend of P=22.75 per common share, payable to common stockholders of record as of August 22, 2017. Total dividends amounting to P=3.0 billion was paid on September 6, 2017.
e) The effective voting rights held by the Group in Globe as of September 30, 2017 and December 31, 2016 is equal to 46.8%.
f) The Company’s share in the net identifiable assets of Globe as of September 30, 2017 (unaudited) amounted to P=20,770 million. Dividends received from Globe for the period ended September 30, 2017 (unaudited) amounted to P=2,809 million. The fair value of the Company’s investment in Globe as of September 30, 2017 (unaudited) amounted to P=84,372 million.
Investment in GNPower Mariveles Coal Plant Ltd. Co. (GMCP or GNPower) a) On August 29, 2017, GMCP, of which ACEHI is one of the project sponsors and owners, signed
a Notes Facility Agreement with certain lenders for an aggregate principal amount of US$800 million (the NFA). Financial Closing under the NFA was successfully achieved in September 29, 2017 with the proceeds of the loan being used to refinance the existing loan obligations of GMCP in relation to its 2x345MW (gross) power plant project, return of capital to the project sponsors and owners, and for other general corporate purposes. GMCP recognized loan breakage costs and accounting mark-to-market losses amounting to US$45.8 million due to refinancing, which in turn reduced the equity earnings of ACEHI by P396M as of September 30, 2017. Following the return of capital to the project sponsors and owners last October 12, 2017, the sharing percentage of ACEHI (through its limited partnership interest) increased from 17.0246% to 20.3372%, pursuant to the terms of the Second Amended and Restated Limited Partnership Agreement for GMCP.
Investment in BF Jade E- Services Philippines, Inc. (BF Jade) a) On February 23, 2017, the Company, ALI, BPI Capital Corporation (BPI Capital), and Kickstart
Ventures Inc. (Kickstart) signed an investment agreement to acquire ownership stakes in BF Jade, subject to the fulfillment of certain closing conditions, including the approval of the acquisition by the PCC. BF Jade is the owner and operator of online fashion platform Zalora Philippines (Zalora). BPI Capital and Kickstart are wholly owned subsidiaries of BPI and Globe, respectively. Through this transaction, the Company will own 43.3% of Zalora. As of August 14, 2017, certain conditions precedent to closing the transaction has been complied with, including the approval (or deemed approval) from the PCC. As of August 31, 2017, the parties completed the closing of the transaction. AC Ventures, AMSI, Inc. (wholly owned subsidiary of ALI), BPI Capital and Kickstart subscribed to the shares in BF Jade, all closing conditions having been complied with. The Company and ALI assigned their rights to subscribe to BF Jade shares to AC Ventures and AMSI, Inc., respectively. Through this transaction, the Group owns 44.2% of the equity stake in BF Jade. The valuation of BF Jade was based on a multiple of its last twelve months sales. The multiple was derived by taking the average Enterprise Value / Sales multiples of similar e-commerce fashion companies. The purchase price allocation for the above acquisition has been prepared on a preliminary basis due to unavailability of information to facilitate fair value computation. These include, among others, information based on appraisal reports for property, plant and equipment (including the system that supports the on-line customer transactions) and information necessary for the valuation of identified intangible assets (processes, customer relationships, etc.). Reasonable changes are expected as additional information becomes available. The accounts that are subject to provisional accounting are property, plant and equipment, intangible assets and goodwill. The provisional purchase price allocation will be finalized within one year from the closure date of this acquisition transaction.

S E C F O R M 1 7 - Q 39
AC Ventures’ investment amounted to P=785 million. The provisional values of the identifiable assets and liabilities acquired and goodwill arising from the transaction follows: BF Jade’s assets and liabilities valued at P=1,295 million and P=1,172 million, respectively. AC Ventures’ corresponding goodwill on this investment amounted to P=727 million which forms part of the balance of its Investment in Associates and Joint Ventures as of September 30, 2017.
Investment in Globe Fintech Innovations, Inc. (GFI/Mynt) a) On February 17, 2017, the Company and Ant Financial Services Group (Ant Financial) signed
the definitive documents, with closing conditions, to subscribe to new shares of Mynt. Through this transaction, Ayala will own 10% of Mynt. Mynt is a holding company for financial technology businesses operating under Globe Capital Venture Holdings, Inc. (GCVHI), a wholly owned subsidiary of Globe.
The PCC approved the transaction in August 23, 2017 paving the way for the deal closing where AC (through AC Ventures) and Ant Financial to subscribe to new shares of Mynt. On September 27, 2017, parties completed the closing of this transaction. Standard valuation methodologies such as the use of comparable company multiples and discounted cash flows were used to determine fair values computation and in preparing the purchase price allocation. The purchase price allocation for the above acquisition has been prepared on a preliminary basis due to unavailability of information to facilitate fair value computation. These include, among others, information based on appraisal reports for property, plant and equipment (including the system that supports the on-line customer transactions) and information necessary for the valuation of identified intangible assets (processes, customer relationships, etc.). Reasonable changes are expected as additional information becomes available. The accounts that are subject to provisional accounting are property, plant and equipment, intangible assets and goodwill. The provisional purchase price allocation will be finalized within one year from the date of closure of this acquisition transaction. AC Ventures’ investment amounted to P=506 million. With Mynt’s assets and liabilities valued at P=4,976 million and P=1,805 million, respectively AC Ventures corresponding notional goodwill on this investment amounted to P=189 million which forms part of the balance of its Investment in Associates and Joint Ventures as of September 30, 2017.
11. Intangible Assets and Deferred Tax Assets
Increase in Intangible assets was attributable to ACEHI’s goodwill arising from investment acquisitions in clean energy and sun power companies (see Note 3, ACEHI Group portion) plus IMI’s goodwill on acquisition of STI (see Note 3, IMI Group portion) and capitalization of project development costs.
12. Investment Properties and Property, Plant and Equipment
This comprises completed and under construction properties or re-development that are held to earn rentals, and are not occupied by the companies in the Group. These properties include parcels of land, buildings and other real estate properties. The account includes Investment in
September 2017 December 2016
(Unaudited) (Audited)
(In Thousands)
Intangible assets 14,713,868₱ 9,716,403₱
Deferred tax assets - net 12,599,721₱ 12,414,647₱
September 2017 December 2016
(Unaudited) (Audited)
(In Thousands)
Investment Properties 127,339,078₱ 110,916,644₱
Property, plant and equipment - net 81,633,137₱ 64,074,471₱
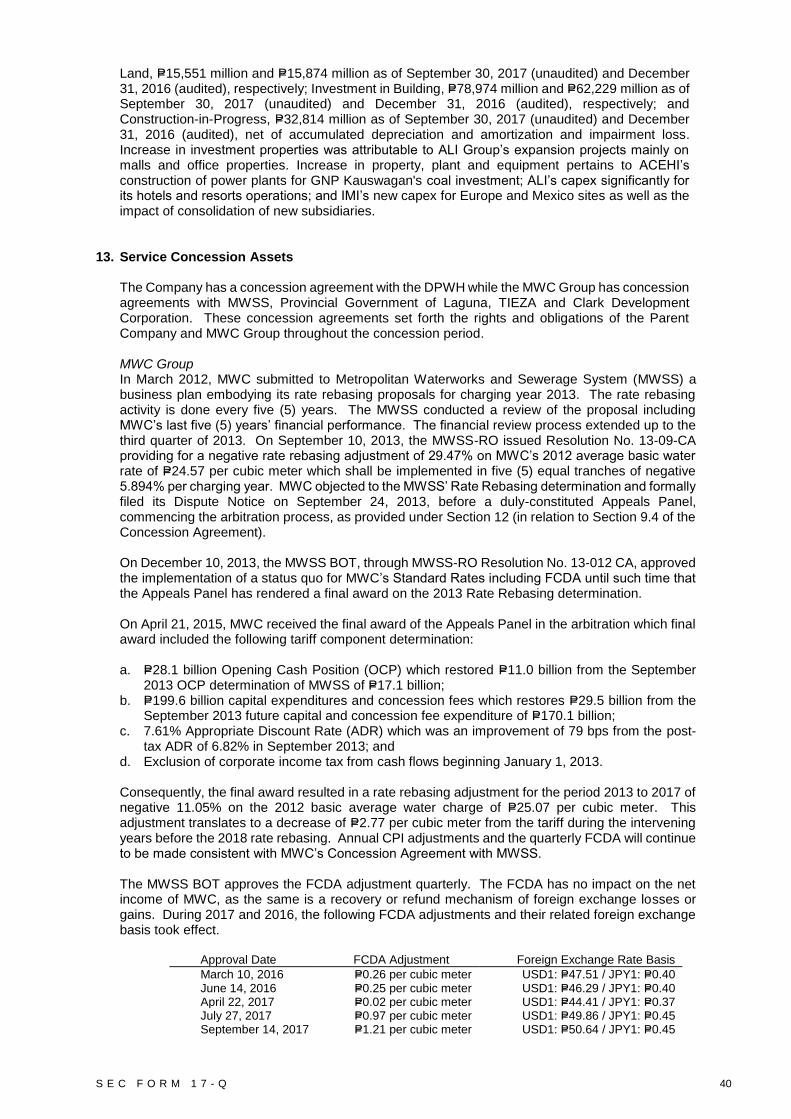
S E C F O R M 1 7 - Q 40
Land, P=15,551 million and P=15,874 million as of September 30, 2017 (unaudited) and December 31, 2016 (audited), respectively; Investment in Building, P=78,974 million and P=62,229 million as of September 30, 2017 (unaudited) and December 31, 2016 (audited), respectively; and Construction-in-Progress, P=32,814 million as of September 30, 2017 (unaudited) and December 31, 2016 (audited), net of accumulated depreciation and amortization and impairment loss. Increase in investment properties was attributable to ALI Group’s expansion projects mainly on malls and office properties. Increase in property, plant and equipment pertains to ACEHI’s construction of power plants for GNP Kauswagan's coal investment; ALI’s capex significantly for its hotels and resorts operations; and IMI’s new capex for Europe and Mexico sites as well as the impact of consolidation of new subsidiaries.
13. Service Concession Assets The Company has a concession agreement with the DPWH while the MWC Group has concession agreements with MWSS, Provincial Government of Laguna, TIEZA and Clark Development Corporation. These concession agreements set forth the rights and obligations of the Parent Company and MWC Group throughout the concession period. MWC Group In March 2012, MWC submitted to Metropolitan Waterworks and Sewerage System (MWSS) a business plan embodying its rate rebasing proposals for charging year 2013. The rate rebasing activity is done every five (5) years. The MWSS conducted a review of the proposal including MWC’s last five (5) years’ financial performance. The financial review process extended up to the third quarter of 2013. On September 10, 2013, the MWSS-RO issued Resolution No. 13-09-CA providing for a negative rate rebasing adjustment of 29.47% on MWC’s 2012 average basic water rate of P=24.57 per cubic meter which shall be implemented in five (5) equal tranches of negative 5.894% per charging year. MWC objected to the MWSS’ Rate Rebasing determination and formally filed its Dispute Notice on September 24, 2013, before a duly-constituted Appeals Panel, commencing the arbitration process, as provided under Section 12 (in relation to Section 9.4 of the Concession Agreement). On December 10, 2013, the MWSS BOT, through MWSS-RO Resolution No. 13-012 CA, approved the implementation of a status quo for MWC’s Standard Rates including FCDA until such time that the Appeals Panel has rendered a final award on the 2013 Rate Rebasing determination. On April 21, 2015, MWC received the final award of the Appeals Panel in the arbitration which final award included the following tariff component determination:
a. P=28.1 billion Opening Cash Position (OCP) which restored P=11.0 billion from the September
2013 OCP determination of MWSS of P=17.1 billion; b. P=199.6 billion capital expenditures and concession fees which restores P=29.5 billion from the
September 2013 future capital and concession fee expenditure of P=170.1 billion; c. 7.61% Appropriate Discount Rate (ADR) which was an improvement of 79 bps from the post-
tax ADR of 6.82% in September 2013; and d. Exclusion of corporate income tax from cash flows beginning January 1, 2013.
Consequently, the final award resulted in a rate rebasing adjustment for the period 2013 to 2017 of negative 11.05% on the 2012 basic average water charge of P=25.07 per cubic meter. This adjustment translates to a decrease of P=2.77 per cubic meter from the tariff during the intervening years before the 2018 rate rebasing. Annual CPI adjustments and the quarterly FCDA will continue to be made consistent with MWC’s Concession Agreement with MWSS. The MWSS BOT approves the FCDA adjustment quarterly. The FCDA has no impact on the net income of MWC, as the same is a recovery or refund mechanism of foreign exchange losses or gains. During 2017 and 2016, the following FCDA adjustments and their related foreign exchange basis took effect.
Approval Date FCDA Adjustment Foreign Exchange Rate Basis
March 10, 2016 P=0.26 per cubic meter USD1: P=47.51 / JPY1: P=0.40 June 14, 2016 P=0.25 per cubic meter USD1: P=46.29 / JPY1: P=0.40 April 22, 2017 P=0.02 per cubic meter USD1: P=44.41 / JPY1: P=0.37 July 27, 2017 P=0.97 per cubic meter USD1: P=49.86 / JPY1: P=0.45 September 14, 2017 P=1.21 per cubic meter USD1: P=50.64 / JPY1: P=0.45

S E C F O R M 1 7 - Q 41
There were no updated FCDA for the third and fourth quarters of 2016 and the first quarter of 2017 because the MWSS BOT who should approve the MWSS RO resolution was vacant. On August 13, 2017, water rates for the customers of MWC had FCDA adjustments of 3.92% of the basic charge or P=0.97 per cubic meter. On October 1, 2017, water rates for the customers of MWC had FCDA adjustments of 4.86% of the basic charge or P=1.21 per cubic meter. Arbitration of MWC’s Claim against the Republic On December 10, 2015, MWC filed a Notice of Arbitration with the Permanent Court of Arbitration against the Republic of the Philippines (the “Republic”). The Notice of Arbitration was filed with respect to Notice of Claim made on the Republic on April 23, 2015 and reiterated on August 13, 2015 and October 20, 2015. The Notice of Claim was made under the Letter of Undertaking of the Republic, issued through the DOF and dated July 31, 1997, as reiterated in the DOF Letter dated October 19, 2009 (the “Sovereign Undertaking”), to guarantee the obligations of the MWSS under its Concession Agreement with MWC executed on February 21, 1997. In the Sovereign Undertaking, the Republic, through the DOF, undertook to indemnify MWC against any loss caused by any action on the part of the Republic and/or the MWSS resulting in the reduction of the standard rates “below the level that would otherwise be applicable in accordance with the Concession Agreement”, thereby denying MWC the rate of return “allowed from time to time to operators of long term infrastructure concession agreement in other countries having a credit standing similar to the Philippines” pursuant to Section 9.4 of the Concession Agreement. As a result of certain actions by the MWSS and the Republic, which are covered by the provisions of the Sovereign Undertaking, MWC demanded indemnification from the Republic by reimbursing its losses in operating revenues to be realized for each remaining year of the Concession as such losses are realized. On January 5, 2017, the two (2) Arbitrators nominated by MWC and by the Republic, agreed to the appointment of the Presiding Arbitrator of the Arbitral Tribunal. On January 14, 2017, the Arbitral Tribunal was formally constituted. The arbitration is currently proceeding in accordance with the applicable rules. Amortization of Service Concession Agreement (SCA)
Beginning May 1, 2017, MWCI, Boracay Water, Clark Water, and Laguna Water shifted from a
straight-line method of amortization of its SCA to a UOP method to better reflect the usage of the
SCA which is directly related to its expected total volume and is aligned with industry practice.
This change in method resulted in a P=263.4 million difference in consolidated amortization
expense for the period ended September 30, 2017. No current financial estimate of the impact of
the change in future periods can be made since it is impracticable to reliably estimate the difference
between future UOP amortization expenses due to the variability of the factors such as future
capital expenditures and estimates of future total volume, among others.
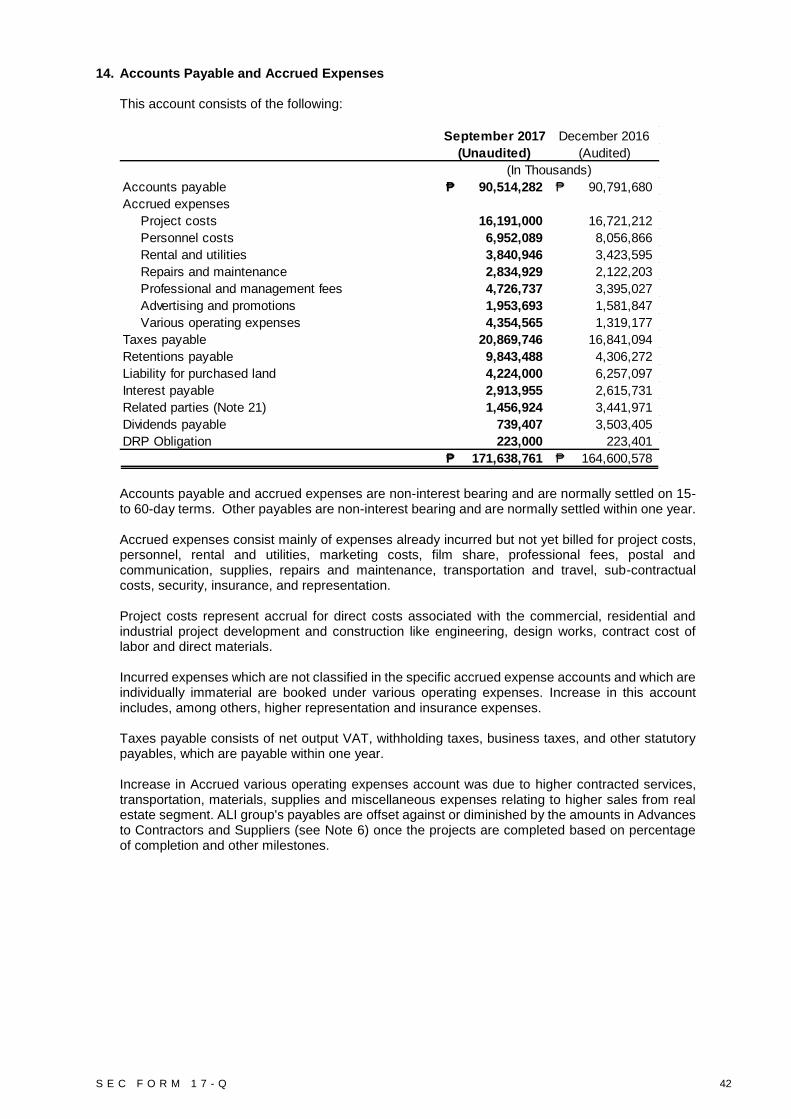
S E C F O R M 1 7 - Q 42
14. Accounts Payable and Accrued Expenses This account consists of the following:
Accounts payable and accrued expenses are non-interest bearing and are normally settled on 15-to 60-day terms. Other payables are non-interest bearing and are normally settled within one year. Accrued expenses consist mainly of expenses already incurred but not yet billed for project costs, personnel, rental and utilities, marketing costs, film share, professional fees, postal and communication, supplies, repairs and maintenance, transportation and travel, sub-contractual costs, security, insurance, and representation.
Project costs represent accrual for direct costs associated with the commercial, residential and industrial project development and construction like engineering, design works, contract cost of labor and direct materials. Incurred expenses which are not classified in the specific accrued expense accounts and which are individually immaterial are booked under various operating expenses. Increase in this account includes, among others, higher representation and insurance expenses. Taxes payable consists of net output VAT, withholding taxes, business taxes, and other statutory payables, which are payable within one year. Increase in Accrued various operating expenses account was due to higher contracted services, transportation, materials, supplies and miscellaneous expenses relating to higher sales from real estate segment. ALI group's payables are offset against or diminished by the amounts in Advances to Contractors and Suppliers (see Note 6) once the projects are completed based on percentage of completion and other milestones.
September 2017 December 2016
(Unaudited) (Audited)
(In Thousands)
Accounts payable 90,514,282₱ 90,791,680₱
Accrued expenses
Project costs 16,191,000 16,721,212
Personnel costs 6,952,089 8,056,866
Rental and utilities 3,840,946 3,423,595
Repairs and maintenance 2,834,929 2,122,203
Professional and management fees 4,726,737 3,395,027
Advertising and promotions 1,953,693 1,581,847
Various operating expenses 4,354,565 1,319,177
Taxes payable 20,869,746 16,841,094
Retentions payable 9,843,488 4,306,272
Liability for purchased land 4,224,000 6,257,097
Interest payable 2,913,955 2,615,731
Related parties (Note 21) 1,456,924 3,441,971
Dividends payable 739,407 3,503,405
DRP Obligation 223,000 223,401
171,638,761₱ 164,600,578₱

S E C F O R M 1 7 - Q 43
15. Other Current and Noncurrent Liabilities
Other current liabilities include the following:
a. Customers’ deposits consist of collections from real estate customers which have not reached the 10% threshold to qualify for revenue recognition and excess of collections over the recognized receivables based on percentage of completion. These also include security deposits equivalent to one (1) to three (3) months’ rent of tenants with cancellable lease contracts and whose lease term will end in the succeeding year. This will be refunded to the lessees at the end of the lease term or be applied to the last months' rentals on the related contracts.
b. Nontrade payables pertain mainly to non-interest bearing real estate-related payables to contractors and various non-trade suppliers which are due within one year.
Other noncurrent liabilities include the following:
a. Deposits and deferred credits
Deposits include security deposits from tenants of retail and office spaces and deferred credits arising from sale of real estate properties. Security deposits are equivalent to one (1) to three (3) months’ rent of long-term tenants with noncancellable leases. This will be refunded to the lessees at the end of the lease term or be applied to the last months' rentals on the related contracts. Deferred credits account pertains to advances from buyers of real estate properties to cover various processing fees including, but not limited to, fees related to transfer of title such as registration fees, documentary taxes and transfer taxes. Payments made by ALI Group for the processing of title are charged to this account.
b. Contractors payable are estimates for additional project cost to be incurred for project
development.
c. Retentions payable pertains to amount withheld by the Group from the contractors’ progress billings which will be later released after the guarantee period, usually one year after the completion of the project. The retention serves as a security from the contractor should there be defects in the project.
d. Liability for purchased land pertains to the portion of unpaid unsubdivided land acquired during
the year. These are normally payable in quarterly or annual installment payments within three (3) or five (5) years.
e. DRP obligation pertains to the liability arising from the assignment agreement between NTDCC and MRT Development Corporation (MRTDC) of the latter’s development rights. In consideration of the lease, NTDCC will be charged an annual rent related to the original DRP obligation on the MRTDC and 5% of the rental income from the NTDCC’s commercial center business.
f. Provisions relate to pending unresolved claims and assessments. The information usually
required by PAS 37, Provisions, Contingent Liabilities and Contingent Assets, is not disclosed on the grounds that it can be expected to prejudice the outcome of these claims and assessments.
g. Subscription payable mainly pertains to POPI’s investment in Cyber Bay.
h. Other nontrade payables which are not classified elsewhere in the financial statements.
Increase in other current and noncurrent liabilities was due to ALI’s and ACI/ Automotive’s higher customer deposits and IMI’s increase due to impact of consolidation of new subsidiaries.
September 2017 December 2016
(Unaudited) (Audited)
(In Thousands)
Other current liabilities 20,183,207₱ 17,522,984₱
Other noncurrent liabilities 45,071,141₱ 40,870,522₱

S E C F O R M 1 7 - Q 44
16. Short-term and Long-term Debt These accounts consist of the following:
The loan agreements on long-term debt of the Company and certain subsidiaries provide for certain restrictions and requirements with respect to, among others, payment of dividends, incurrence of additional liabilities, investment and guaranties, mergers or consolidations or other material changes in their ownership, corporate set-up or management, acquisition of treasury stock, disposition and mortgage of assets and maintenance of financial ratios at certain levels. These restrictions and requirements were complied with by the Group as of September 30, 2017 and December 31, 2016. The Company aims to maintain for its debt to equity ratio not to exceed 3:1 in compliance with loan covenants of AYC Finance. As of September 30, 2017 (unaudited), total proceeds from availment of short-term and long-term debt amounted to P=80.1 billion which consists mainly of proceeds from bonds and loans of AYC (P=20.3 billion), ALI (P=19.5 billion), MWC (P=14.5 billion), ACEHI (P=10.3 billion), Ayala (P=10.0 billion), and IMI (P=5.2 billion), while payments of short-term and long-term debt amounted to P=26.5 billion which pertains to loan payment of ALI (P=12.0 billion), Ayala (P=10.0 billion), MWC (P=2.9 billion), IMI (P=1.2 billion), and ACEHI (P=0.2 billion). The Group has short-term and long-term debt payable to BPI amounting to P=30.2 billion and P=33.4 billion as of September 30, 2017 (unaudited) and December 31, 2016 (audited), respectively (see Note 21). Interest expense incurred from these debts for the period ending September 30, 2017 and 2016 (both unaudited) amounted to P=325.9 million and P=308.1 million, respectively (see Note 21). Loans availed during September 2017 have varying interest rates and maturity dates. Proceeds of loans were used for operating requirements, capital expenditures and certain investment acquisitions (see Note 3).
September 2017 December 2016
(Unaudited) (Audited)
(In Thousands)
Short-term debt - Subsidiaries:
Philippine peso with various interest rates 16,507,300₱ 28,137,450₱
Foreign currency with various interest rates 6,732,870 2,720,687
23,240,170₱ 30,858,137₱
Long-term debt:
The Parent Company:
Bank loans with various interest rates 10,818,888₱ 10,835,726₱
Bonds 39,710,251 39,780,649
50,529,139 50,616,375
Subsidiaries:
Loans from banks & other institutions:
Foreign currency with various interest rates 66,865,615 47,693,785
Philippine Peso with various interest rates 67,101,492 54,689,899
Bonds 82,478,456 75,419,046
Exchangeable bonds 14,732,602 14,198,775
Fixed for life bonds 20,191,806 -
Fixed Rate Corporate Notes (FXCNs) 26,237,136 22,377,934
277,607,107 214,379,439
328,136,246 264,995,814
Less current portion 13,545,443 19,792,669
Non-current portion 314,590,803₱ 245,203,145₱

S E C F O R M 1 7 - Q 45
The loan availments for the year include, among others, the following: Parent Company The following summarizes the Company’s parent level outstanding bonds payable.
On July 7, 2016, the Company issued P=10.0 billion 3.920% fixed-rate bonds due 2023. The issuance is the first tranche of the Company’s P=20.0 billion fixed rate bonds program approved on June 24, 2016 in a shelf registration with SEC. The bond was rated PRS Aaa by the PhilRatings and was listed in the Philippine Dealing Exchange (PDEx). Proceeds of the issuance will be used to refinance Ayala’s debt obligations. The infusion of new debt capital gives the Company flexibility to undertake investments that is consistent with its 2020 targets. On February 10, 2017, the Company issued the second and final tranche of its P=20.0 billion fixed rate bonds program under its 3-year shelf registration with the SEC. The bonds, amounting to P=10.0 billion, was issued with a coupon rate of 4.82% for eight years to mature in 2025 and was rated the highest rating of PRS Aaa by the Philratings. Proceeds of the issuance will be used to pay the maturing bonds in April 2017. On April 30, 2017, its maturity date, the Company fully redeemed its P=10.0 billion, 7.20% Fixed Rate Puttable Bonds issued last April 30, 2010. ALI Group In March 2017, ALI executed a P=10.0 billion long-term facility and had an initial drawdown of P=5.0 billion. The loan has a fixed interest rate of 4.949% for 10 years inclusive of Gross Receipt Tax (GRT). The balance of P=5.0 billion was drawn in April 2017. In May 2017, ALI issued a total of P=7.0 billion bonds due 2027 at a fixed rate equivalent to 5.2624% p.a. The Bonds have been rated PRS Aaa by PhilRatings, which is considered the highest quality with minimal credit risk. The bond issue is the fourth tranche of the Fixed Rate Bond series registered under ALI’s P=50 Billion Debt Securities Program as approved by the SEC in March 2016.
On July 17, 2017, ALI issued and listed on the PDEx Short Dated Notes amounting to P=4.3 billion due in 2019 carrying a fixed coupon of 2.75% to be distributed to Qualified Institutional Buyers.
IMI Group On June 1, 2017, IMI CZ obtained a term loan facility from Citibank amounting to €1.50 million that was used to investment financing. The principal shall be paid in 60 regular monthly installments and bears interest of 3-month EURIBOR plus 0.90% but is not to exceed 15% per annum. As of September 30, 2017 and December 31, 2016, IMI Group has short-term loans aggregating to US$114.9 million (P=5,801.0 million) and US$51.3 million (P=2,557.8 million), respectively. These short-term loans have maturities ranging from 30-180 days and bear fixed interest rates ranging from 1.67% to 2.15% in June 2017 and 1.23% to 3.16% in December 2016.
Principal
Year Interest Amount September 2017 December 2016
Issued Term Rate (In Thousands) (Unaudited) (Audited) Features
2010 7 years 7.200% 10,000,000₱ -₱ 9,994,372₱
Puttable on the 20th coupon
payment date
2011 10 years 6.800% 10,000,000 9,956,735 9,948,974
20% balance puttable on the 5th
anniversary of the issue date;
balance puttable on the 8th
anniversary issue date
2012 15 years 6.875% 10,000,000 9,938,170 9,933,361
Callable from the 10th anniversary
issue until every year thereafter until
the 14th anniversary issue date
2016 7 years 3.920% 10,000,000 9,911,263 9,903,942
Callable from the 5.5th anniversary
of the issue date
2017 8 years 4.820% 10,000,000 9,904,083 -
Callable from the 6.5th anniversary of
the issue date
50,000,000₱ 39,710,251₱ 39,780,649₱
Carrying Value
(In Thousands)

S E C F O R M 1 7 - Q 46
STI VIA has a long-term debt from Lloyds Bank Plc amounting to US$0.26 million. The debt bears annual interest of 3.10% and matures on August 31, 2018. MWC Group On May 25, 2017, Boracay Water, made second drawdown in the amount of P=250.0 million from the Third Omnibus Loan and Security Agreement with Security Bank Corp (SBC). The loan will be used to fund the capital expenditures which in turn will be used to provide water and sewerage services in the concession area of Boracay Water.
On April 3, 2017, and July 26, 2017, MWC made its second, and third drawdowns amounting to JPY7.00 billion, and JPY19.60 billion, respectively, from its 7-year JPY40.00 billion term loan facility, payable semi-annually, with three (3) international banks: The Bank of Tokyo-Mitsubishi UFJ, Ltd., Mizuho Bank, Ltd. and Sumitomo Mitsui Banking Corporation. The proceeds of the loan will be used to finance the MWC’s parent company’s capital expenditures.
Lugana Water made drawdown in three tranches from its loan agreement with SBC: the first in March 2017 amounting to P=100.0 million bearing an effective interest rate of 6.21%; and the second and third both in April 2017 amounting to P=50.0 million and P=350.0 million bearing an effective interest rate of 6.37% and 6.40%, respectively. The loan will be used to finance the modernization and expansion of its water network system and water supply facilities throughout the province of Laguna. Under the loan agreement, the lender agreed to provide a loan to the borrower in the aggregate principal amount of up to P=2.50 billion for an applicable fixed interest rate, as determined in respect of each drawdown.
On February 24, 2017, MWPVI had a short-term bridge loan drawdown amounting P=300.0 million from a 15-year fixed rate term loan facility amounting to P=4.0 billion with SBC and Metropolitan Bank and Trust Company. The terms of the loan include an option to increase the size of the facility to a maximum of P=7.0 billion. The proceeds of the loan will be used to finance the MWPVI’s capital expenditures, future acquisitions and other general corporate requirements. ACEHI Group On February 23, 2017, ACEHI fully drawn a 10-year Term Loan Agreement with The Philippine American Life and General Insurance Company (PHILAM) amounting to P=1.0 billion at a fixed rate of 6.0% per annum to finance investments in power, power-related projects and general corporate needs. On April 27, 2017, ACEHI availed P=250.0 million from its 7-year term loan facility with Philippine National Bank aggregating to P=7.0 billion at a fixed rate of 5.75% per annum for all drawdowns until May 5, 2017. Beyond this date, the relevant PDST-R2 benchmark rate will apply +1% per annum spread, with a floor of 5.25% per annum. On June 22, 2017, ACEHI availed P=100.0 million from its 7-year term loan facility with Security Bank Corporation aggregating to P=5.0 billion at a fixed rate of 5.75% per annum for all drawdowns from June 2017 to June 2018. Beyond this date, the relevant Peso Benchmark Rate PDST-R2 rate plus Credit Spread. The fixed interest shall have a floor of 5.00%. The Peso Benchmark rate shall be equal to the 3-day Business Day moving average of the applicable Treasury securities, i.e. 7 years as indicated by interpolating 5 year and 10 year PDST-R2 displayed on the PDEX page of Bloomberg. AYCFL US$400.0 Million Senior Unsecured and Guaranteed Fixed For Life Perpetual Notes (“Notes”) On September 7, 2017, the Company announced that it had successfully set the terms of a US dollar-denominated fixed-for-life (non-deferrable) senior perpetual issuance at an aggregate principal amount of US$400 million with an annual coupon of 5.125% for life with no step-up. The issuance is the first corporate fixed-for-life with no coupon step-up in Southeast Asia and the first fixed-for-life with no step-up (and reset) deal in the Philippines. The issuer, AYCFL, may redeem the Notes in whole but not in part on September 13, 2022 (first redemption date) or any interest payment date falling after the first redemption date at 100% of the principal amount of the Notes plus any accrued but unpaid interest. The proceeds of the issuance will be used to refinance the issuer’s US Dollar maturing obligations and to fund investments of the Guarantor (the Company) or its offshore subsidiaries. The pricing of the Notes reflected a 50-basis point compression from initial price guidance. The offering was more than five times oversubscribed, with investors’ confidence reflecting the high

S E C F O R M 1 7 - Q 47
quality of the Ayala signature. 19% of the order book for the Notes was allocated to investors from the Philippines, 10% from Europe with the remaining 71% from rest of Asia. By investor type, the split was 67% to fund/asset managers, 12% to banks, 7% to insurance and pension funds, and the remaining 14% to private banks and other investors. The Notes was settled on September 13, 2017 and was listed in the Singapore Exchange Securities Trading Limited on September 14, 2017. The Group will account for this as liability, and, thus shown forming part of long-term debt as of September 30, 2017. The cost of issuance is at US$2.7 million resulting in net proceeds of US$397.3 million. US$300.0 Million Exchangeable Bonds (“Bonds”) On May 2, 2014, AYCFL issued at face US$300.0 million Exchangeable Bonds (Bonds) due on May 2, 2019 with a fixed coupon rate of 0.50% per annum, payable semi-annually. The Bonds are guaranteed by the Company and constitute direct, unsubordinated, unconditional and unsecured obligations of AYCFL, ranking pari passu and without any preference or priority among themselves. The Bonds were listed in the Singapore Stock Exchange and include features such as exchange option, put option and early redemption options. The exchange option entitles the bondholders to exchange the Bonds for ALI’s common shares at any time on or after June 11, 2014 up to the close of business on the 10th day prior to maturity date, or if such bonds shall have been called for redemption by AYCFL before the maturity date, then up to the close of business on a date no later than 10 days prior to the date fixed for redemption. The exchange price per principal amount to be exchanged, translated into P= at the fixed exchange rate of P=44.31/US$1.00, is equal to P=36.48, subject to anti-dilutive adjustments contingent on certain events. The exchange option was assessed to be an equity component of the Bonds at the consolidated financial statements as the Bonds are denominated in the functional currency of AYCFL and to be settled by the Group through issuance of a fixed number of ALI’s common shares. The put option entitles the bondholders to require AYCFL to redeem, in whole or in part, the Bonds on May 2, 2017 (put option date) at 100% of the principal amount together with accrued and unpaid interest. Moreover, if a change of control event occurs (the change of control put) or in the event that the common shares of ALI are delisted or suspended from trading for a period of more than 20 consecutive trading days (the delisting put), the bondholders may require AYCFL to redeem the Bonds, in whole but not in part, at 100% of the principal amount together with accrued and unpaid interest. The early redemption option gives the right to AYCFL to redeem the Bonds, in whole but not in part, at any time after May 2, 2017 at 100% of the principal amount on the date fixed for such redemption, provided, however, that no such redemption may be made unless the closing price of the common shares of ALI (translated into US$ at the prevailing average P= to US$ exchange rate as published by BSP) for any 30 consecutive trading days was at least 130% of the exchange price then in effect (translated into US$ at the fixed exchange rate of P=44.31/US$1.00). In addition, if at any time the aggregate principal amount of the Bonds outstanding is less than 10% of the aggregate principal amount originally issued or if a tax event occurs, AYCFL may redeem the Bonds, in whole but not in part, at 100% of principal amount together with accrued and unpaid interest. The put and early redemption options were assessed to be embedded derivatives that are clearly and closely related to the host contract, therefore, not required to be bifurcated. As the Bonds were determined to be a compound instrument at the consolidated level, (i.e., it has liability component and an equity component which pertains to the exchange option), the Group applied split accounting. The value allocated to the equity component at issue date amounted P=1.114 billion, being the residual amount after deducting the fair value of the liability component amounting to P=11.98 billion from the issue proceeds of the Bonds. As of September 30, 2017 (unaudited) and December 31, 2016 (audited), the unamortized discount of the Bonds amounted to P=501.7 million and P=717.2 million, respectively. Interest expense recognized in the statement of income amounted to P=288.8 million and P=171.5 million for the period ended September 30, 2017 and 2016, respectively (both unaudited).

S E C F O R M 1 7 - Q 48
17. Equity
Details of the Company's paid-up capital
On April 21, 2017, the Board of Directors approved the Company’s 2017 stock option program pursuant to its Employee Stock Ownership Plan (the “Plan”). The program authorizes the grant to 42 executives, in accordance with the terms of the Plan, stock options covering up to a total of 818,083 common shares at a subscription price of P837.53 per share, which is the volume-weighted average prices of its common shares at the Philippine Stock Exchange over the last 30-day trading from March 3 to April 17, 2017.
On May 9, 2017, additional shares were subscribed under the Employee Stock Ownership Plan of ALI totaling 1,840,371 common shares which will bring the total number of common shares of ALI to 14,714,522,959.
The reconciliation of Retained Earnings available for dividend declaration shows the following as of September 30, 2017 and December 31, 2016:
Dividends consist of the following:
On June 22, 2017, the Board of Directors, at its regular meeting, approved the declaration of regular dividend of P3.46 per common share, a 20% increase from previous rate of P2.88/ common share. The record date is July 7, 2017, and payment date is July 22, 2017. This cash dividend is for the first semester ended June 30, 2017.
Preferred
Stock - A
Preferred
Stock - B
Preferred
Stock -
Voting
Common
Stock Subscribed
Additional
Paid-in
Capital
Subscriptions
Receivable
Total Paid-in
Capital
(In Thousands)
At January 1, 2017 (Audited) 1,200,000₱ 5,800,000₱ 200,000₱ 30,812,863₱ 198,367₱ 36,928,326₱ (759,796)₱ 74,379,760₱
Exercise/cancellation of ESOP/ESOWN - - - 69,752 (19,733) 933,469 (578,501) 404,987
At September 30, 2017 (Unaudited) 1,200,000₱ 5,800,000₱ 200,000₱ 30,882,615₱ 178,634₱ 37,861,795₱ (1,338,297)₱ 74,784,747₱
At January 1, 2016 (Audited) 1,200,000₱ 5,800,000₱ 200,000₱ 30,808,747₱ 171,810₱ 36,316,709₱ (577,944)₱ 73,919,322₱
Exercise/cancellation of ESOP/ESOWN - - - 4,116 26,557 611,617 (321,196) 321,094
Collection of subscription receivables - - - - - - 139,344 139,344
At December 31, 2016 (Audited) 1,200,000₱ 5,800,000₱ 200,000₱ 30,812,863₱ 198,367₱ 36,928,326₱ (759,796)₱ 74,379,760₱
September 2017 December 2016
(Unaudited) (Audited)
(In Thousands)
Consolidated retained earnings balance 166,708,025₱ 145,622,311₱
Accumulated equity in net earnings of subsidiaries,
associates and joint ventures (130,435,221) (112,620,058)
Deferred tax - (184,218)
Treasury shares balance (2,300,000) (2,300,000)
Retained Earnings available for dividends 33,972,804₱ 30,518,035₱
September 2017 December 2016
(Unaudited) (Audited)
(In Thousands, except dividends per share)
Dividends to common shares:
Cash dividends declared during the year 2,149,438₱ 3,572,400₱
Cash dividends per share 3.46 5.76
Dividends to equity preferred shares declared
during the year
Cash dividends to Preferred B shares - 1,277,625
Cash dividends to Voting Preferred shares - 7,390

S E C F O R M 1 7 - Q 49
18. Earnings Per Share
The following table presents information necessary to calculate earnings per share (EPS) on net income attributable to owners of the Parent Company:
19. Segment Information
Business segment information is reported on the basis that is used internally for evaluating segment performance and deciding how to allocate resources among operating segments. Accordingly, the primary segment reporting format is by business segment. For management purposes, the Group is organized into the following business units:
• Parent Company - represents operations of the Parent Company including its financing entities such as ACIFL, AYCFL, PFIL and MHI.
• Real estate and hotels - planning and development of large-scale fully integrated mixed-used communities that become thriving economic centers in their respective regions. This include development and sale of residential, leisure and commercial lots and the development and leasing of retail and office space and land in these communities; construction and sale of residential condominiums and office buildings; development of industrial and business parks; development and sale of high-end, upper middle-income and affordable and economic housing; strategic land bank management; hotel, cinema and theater operations; and construction and property management.
• Financial services and insurance - commercial banking operations with expanded banking license. These include diverse services such as deposit taking and cash management (savings and time deposits in local and foreign currencies, payment services, card products, fund transfers, international trade settlement and remittances from overseas workers); lending (corporate, consumer, mortgage, leasing and agri-business loans); asset management (portfolio management, unit funds, trust administration and estate planning); securities brokerage (on-line stock trading); foreign exchange and capital markets investments (securities dealing); corporate services (corporate finance, consulting services); investment banking (trust and investment services); a fully integrated bancassurance operations (life, non-life, pre-need and reinsurance services); and other services (internet banking, foreign exchange and safety deposit facilities).
• Telecommunications (Telecoms) - provider of digital wireless communications services using a fully digital network; domestic and international long distance communication services or carrier services; broadband internet and wireline voice and data communication services; also licensed to establish, install, operate and maintain a nationwide local exchange carrier (LEC) service, particularly integrated local telephone service with public payphone facilities and public calling stations, and to render and provide international and domestic carrier and leased line
September 2017 September 2016
(Unaudited) (Unaudited)
(In Thousands, except EPS figures)
Net income attributable to the owners of the
Parent Company 23,235,153₱ 19,645,671₱
Less dividends on preferred stock (965,609) (961,969)
22,269,544 18,683,702
Less profit impact of assumed conversions
of potential ordinary shares of investees (223,159) (190,128)
22,046,385₱ 18,493,574₱
Weighted average number of common shares 620,928 620,010
Dilutive shares arising from stock options 2,230 2,414
Adjusted weighted average number of
common shares for diluted EPS 623,158 622,424
Basic EPS 35.86₱ 30.13₱
Diluted EPS 35.38₱ 29.71₱

S E C F O R M 1 7 - Q 50
services. In recent years, operations include developing, designing, administering, managing and operating software applications and systems, including systems designed for the operations of bill payment and money remittance, payment facilities through various telecommunications systems operated by telecommunications carriers in the Philippines and throughout the world and to supply software and hardware facilities for such purposes.
• Water infrastructure - contractor to manage, operate, repair, decommission, and refurbish all fixed and movable assets (except certain retained assets) required to provide water delivery, sewerage and sanitation, distribution services, pipeworks, used water management and management services. In 2016, a new business initiative was undertaken where the group will exclusively provide water and used water services and facilities to all property development projects of major real estate companies.
• Power generation - unit that will build a portfolio of power generation assets using renewable and conventional technologies which in turn will operate business of generating, transmission of electricity, distribution of electricity and supply of electricity, including the provision of related services. This unit has recently secured its Retail Electricity Supplier license, allowing it to become active participant in the retail electricity.
• Industrial Technologies - this segment houses its existing and future assets in industrial technology. It plans to capitalize on automotive and industrial opportunities by entering new businesses, fostering synergies within the Group, and building on the strengths of its existing business units – IMI and AC Industrial/Automotive. The combined abilities of the manufacturing and distribution units will allow this segment to scale its presence in the automotive value chain while also offering more comprehensive partnership opportunities for global brands. a. Electronics manufacturing - global provider of automotive and industrial electronics
manufacturing services (EMS) and power semiconductor assembly and test services with manufacturing facilities in Asia, Europe, and North America. It serves diversified markets that include those in the automotive, industrial, medical, telecommunications infrastructure, storage device, and consumer electronics industries. Committed to cost-effective and innovative customized solutions (from design and product development to manufacturing and order fulfillment), the company's comprehensive capabilities and global manufacturing presence allow it to take on specific outsourcing needs.
b. Automotive - Through this unit, the Group engages in the automotive space with the following: minority investments in assembly companies Honda Cars Philippines, Inc. and Isuzu Philippines Corporation; ownership in network of Honda and Isuzu dealerships; ownership over Philippine distributorship for Volkswagen (VW) vehicles and its network of VW dealerships; and strategic partnership with KTM Europe for a motorcycle manufacturing (for local and export demand); and appointment, thus, ownership of the exclusive distributorship of KTM motorcycle models in the country.
• Transport Infrastructure, Social Infrastructure (Health & Education) and Others - This segment includes the transport infrastructure unit (development arm for its transport infrastructure investments) and investments in social infrastructure space with the healthcare, education and human capital units established in recent years. This segment also includes the remaining Information Technology and BPO services unit; International unit (investments in overseas property companies and projects); Aviation (air-chartered services); consultancy, agri-business and other operating companies.
Management monitors the operating results of its business units separately for the purpose of making decisions about resource allocation and performance assessment. Segment performance is evaluated based on operating profit or loss and is measured consistently with operating profit or loss in the consolidated financial statements.
Intersegment transfers or transactions are entered into under the normal commercial terms and conditions that would also be available to unrelated third parties. Segment revenue, segment expense and segment results include transfers between operating segments. Those transfers are eliminated in consolidation. The following tables regarding operating segments present revenue and income information for the periods ended September 30, 2017 and 2016 (both unaudited) and assets and liabilities as of September 30, 2017 (unaudited) and December 31, 2016 (audited).

S E C F O R M 1 7 - Q 51
September 2017 (Unaudited)
(In Millions)
Parent
Company
Real Estate
and Hotels
Financial
Services
and
Insurance Telecoms
Water
Infrastructure Electronics
Power
Generation
Automotive
and Others
Intersegment
Eliminations Consolidated
INCOME
Sales to external customers 167₱ 93,217₱ -₱ -₱ 12,444₱ 40,008₱ 1,230₱ 23,404₱ -₱ 170,470₱
Intersegment 175 (23) - - 424 - 204 544 (1,324) -
Share of profit of associates
and joint ventures - 757 8,259 3,956 254 - 838 164 - 14,228
Interest income 350 4,193 - - 221 7 40 36 (100) 4,747
Other income 5,882 782 - - 7,337 174 1,611 2,124 (5,824) 12,086
Total income 6,574 98,926 8,259 3,956 20,680 40,189 3,923 26,272 (7,248) 201,531
Operating Expenses 2,097 64,747 - - 7,520 38,443 1,684 24,684 (1,265) 137,910
Operating profit (loss) 4,477 34,179 8,259 3,956 13,160 1,746 2,239 1,588 (5,983) 63,621
Interest expense and other f inancing charges
and Other charges 2,195 6,371 - - 7,466 244 291 265 (104) 16,728
Provision for (benefit from) income tax 151 7,119 - - 1,185 266 (88) 180 (58) 8,755
Net income (loss) 2,131₱ 20,689₱ 8,259₱ 3,956₱ 4,509₱ 1,236₱ 2,036₱ 1,143₱ (5,821)₱ 38,138₱
OTHER INFORMATION
Segment Assets 59,861₱ 526,026₱ -₱ -₱ 112,993₱ 43,037₱ 51,516₱ 28,909₱ (23,992)₱ 798,350₱
Investments in associates
and joint ventures 139,227 25,256 - - 8,073 - 24,760 4,109 - 201,425
Deferred tax assets 98 10,457 - - 1,259 62 127 170 427 12,600
Total Assets 199,186₱ 561,739₱ -₱ -₱ 122,325₱ 43,099₱ 76,403₱ 33,188₱ (23,565)₱ 1,012,375₱
Segment liabilities 119,288₱ 372,626₱ -₱ -₱ 55,141₱ 29,863₱ 35,275₱ 10,156₱ (22,534)₱ 599,815₱
Deferred tax liabilities 98 4,430 - - 4,106 74 189 125 9 9,031
Total Liabilities 119,386₱ 377,056₱ -₱ -₱ 59,247₱ 29,937₱ 35,464₱ 10,281₱ (22,525)₱ 608,846₱
Depreciation & amortization 245₱ 4,662₱ -₱ -₱ 2,621₱ 1,142₱ 193₱ 344₱ 5₱ 9,212₱
Non-cash expenses other than depreciation &
amortization (586)₱ 27₱ -₱ -₱ 78₱ 29₱ -₱ 128₱ -₱ (324)₱
Segment additions to property, plant and
equipment and investment properties 85₱ 24,971₱ -₱ -₱ 1,074₱ 2,352₱ 11,327₱ 1,803₱ 2,106₱ 43,718₱
Cash flow s provided by (used in):
Operating activities (5,190)₱ 35,340₱ -₱ -₱ 1,647₱ (141)₱ (3,087)₱ (560)₱ 627₱ 28,636₱
Investing activities 4,566₱ (39,559)₱ -₱ -₱ (3,949)₱ (3,873)₱ (21,303)₱ (7,688)₱ 11,942₱ (59,864)₱
Financing activities 13,000₱ 2,731₱ -₱ -₱ 10,367₱ 2,890₱ 20,635₱ 8,067₱ (12,567)₱ 45,123₱

S E C F O R M 1 7 - Q 52
September 2016 (Unaudited)
(In Millions)
Parent
Company
Real Estate
and Hotels
Financial
Services
and
Insurance Telecoms
Water
Infrastructure Electronics
Pow er
Generation
Automotive
and Others
Intersegment
Eliminations Consolidated
INCOME
Sales to external customers 136₱ 80,470₱ -₱ -₱ 12,257₱ 28,916₱ 52₱ 18,248₱ -₱ 140,079₱
Intersegment 116 30 - - 151 - - 372 (669) -
Share of profit (loss) of associates
and joint ventures - 345 8,383 3,518 276 - 1,050 208 - 13,780
Interest income 496 4,278 - - 200 10 51 44 (1) 5,078
Other income (loss) 930 366 - - 4,044 (42) 250 1,545 (642) 6,451
Total income 1,678 85,489 8,383 3,518 16,928 28,884 1,403 20,417 (1,312) 165,388
Operating Expenses 1,918 56,226 - - 7,180 27,518 435 19,294 (689) 111,882
Operating profit (loss) (240) 29,263 8,383 3,518 9,748 1,366 968 1,123 (623) 53,506
Interest expense and other f inancing charges 3,080 5,984 - - 956 110 15 112 - 10,257
Other charges - - - - 3,080 1 1 375 - 3,457
Provision for (benefit from) income tax (19) 5,876 - - 1,197 237 (146) 173 (7) 7,311
Net income (loss) (3,301)₱ 17,403₱ 8,383₱ 3,518₱ 4,515₱ 1,018₱ 1,098₱ 463₱ (616)₱ 32,481₱
Depreciation & amortization 249₱ 4,385₱ -₱ -₱ 2,763₱ 918₱ 44₱ 266₱ 2₱ 8,627₱
Non-cash expenses other than depreciation &
amortization -₱ -₱ -₱ -₱ 33₱ (67)₱ 1₱ 297₱ 89₱ 353₱
December 2016 (Audited)
(In Millions)
Parent
Company
Real Estate
and Hotels
Financial
Services
and
Insurance Telecoms
Water
Infrastructure Electronics
Pow er
Generation
Automotive
and Others
Intersegment
Eliminations Consolidated
Assets and Liabilities
Segment Assets 49,110₱ 501,579₱ -₱ -₱ 95,040₱ 31,540₱ 43,067₱ 26,245₱ (27,605)₱ 718,976₱
Investments in associates
and joint ventures 130,954 24,985 - - 6,200 - 13,743 4,432 - 180,314
Deferred tax assets 280 9,869 - - 1,656 77 1 137 395 12,415
Total Assets 180,344₱ 536,433₱ -₱ -₱ 102,896₱ 31,617₱ 56,811₱ 30,814₱ (27,210)₱ 911,705₱
Segment liabilities 101,980₱ 359,393₱ -₱ -₱ 40,993₱ 19,727₱ 27,903₱ 8,772₱ (27,603)₱ 531,165₱
Deferred tax liabilities 97 4,357 - - 4,728 63 203 96 - 9,544
Total Liabilities 102,077₱ 363,750₱ -₱ -₱ 45,721₱ 19,790₱ 28,106₱ 8,868₱ (27,603)₱ 540,709₱
Segment additions to property, plant and
equipment and investment properties 105₱ 33,649₱ -₱ -₱ 944₱ 2,404₱ 21,703₱ 734₱ (6,746)₱ 52,793₱
Depreciation & amortization 333₱ 5,873₱ -₱ -₱ 3,734₱ 1,158₱ 86₱ 371₱ 5₱ 11,560₱
Non-cash expenses other than depreciation &
amortization 388₱ 434₱ -₱ -₱ 46₱ (121)₱ 488₱ 971₱ -₱ 2,206₱
Cash f low s provided by (used in):
Operating activities (5,244)₱ 12,807₱ -₱ -₱ 1,256₱ 2,441₱ 7,166₱ (131)₱ 16,922₱ 35,217₱
Investing activities (2,406)₱ (39,648)₱ -₱ -₱ (598)₱ (5,136)₱ (21,268)₱ 626₱ (7,753)₱ (76,183)₱
Financing activities (22,387)₱ 28,683₱ -₱ -₱ (3,239)₱ 2,220₱ 22,757₱ 170₱ (9,169)₱ 19,035₱

S E C F O R M 1 7 - Q 53
20. Financial Instruments
Fair Value of Financial and Nonfinancial Instruments The carrying amounts approximate fair values for the Group’s financial assets and liabilities due to its short-term maturities except for the following financial instruments as of September 30, 2017 and December 31, 2016 (amounts in thousands):
September 2017
(Unaudited) December 2016
(Audited)
Carrying Value Fair Value Carrying Value Fair Value
FINANCIAL ASSETS AT FVPL Held for trading P=5,599,598 P=5,599,598 P=6,664,015 P=6,664,015
Derivative assets Embedded 273,443 273,443 241,787 241,787 Freestanding 8,858 8,858 4,100 4,100
Total financial assets at FVPL 5,881,899 5,881,899 6,909,902 6,909,902
LOANS AND RECEIVABLES Accounts and notes receivables Trade receivables Real estate 86,521,000 87,528,000 79,286,123 79,618,899 Nontrade receivables
Receivable from officers and employees 1,767,759 1,767,759 1,090,801 1,087,369
Investment in bonds classified as loans and receivables – –
Concession financial receivable 1,291,120 2,146,660 1,205,814 2,080,736
Total loans and receivables 89,579,879 91,442,419 81,582,738 82,787,004
AFS FINANCIAL ASSETS Quoted equity investments 3,137,082 3,137,082 2,579,137 2,579,137 Unquoted equity investments 2,104,620 2,104,620 1,870,321 1,870,321 Quoted debt investments – – 115,621 115,621
Total AFS financial assets 5,241,702 5,241,702 4,565,079 4,565,079
Total financial assets P=100,703,479 P=102,566,019 P=93,057,719 P=94,261,985
FINANCIAL LIABILITIES AT FVPL Derivative liabilities Financial liabilities on put option 2,293 2,293 P=563,541 P=563,541 Embedded 3,267 3,267 3,357 3,357 Freestanding 1,353,813 1,353,813 2,452 2,452
1,359,373 1,359,373 569,350 569,350
OTHER FINANCIAL LIABILITIES Noncurrent other financial liabilities Service concession obligation 7,658,012 8,8566,829 7,577,381 9,590,173 Other noncurrent liabilities 32,768,080 31,194,364 19,838,137 20,113,198 Long-term debt 320,926,756 322,064,756 245,203,145 244,111,869
Total other financial liabilities 361,352,848 364,421,009 272,618,663 273,815,240
Total financial liabilities P=362,712,221 P=365,780,382 P=273,188,013 P=274,384,590
The following methods and assumptions were used to estimate the fair value of each class of financial instrument for which it is practicable to estimate such value: Financial assets at FVPL - Fair values of investment securities are based on quoted prices as of the reporting date. For other investment securities with no reliable measure of fair value, these are carried at its last transaction price. The fair value of the investment in UITF is based on net asset values as of reporting dates. The fair value of the investment in ARCH Capital Fund is determined using the discounted cash flow (DCF) method. Under the DCF method in fund fair valuation, it is estimated using assumptions regarding the benefits and liabilities of ownership over the underlying asset’s life including an exit or terminal value. This method involves the projection of a series of cash flows on a real property interest. To this projected cash flow series, a market-derived discount rate is applied to establish the present value of the income stream, associated with the underlying asset. The exit yield is normally separately determined and differs from the discount rate. Significant inputs considered were rental, growth and discount rates. The higher the rental and growth rates, the higher the fair value. The higher the discount rates, the lower the fair value.

S E C F O R M 1 7 - Q 54
The fair value of other unquoted financial assets at FVPL is determined using Weighted Average Cost of Capital using market comparable. The rate used ranged from 5% to 10% in 2017 and 2016. Derivative instruments - The fair value of the freestanding currency forwards is based on counterparty valuation. Derivative asset - The fair value is estimated using a modified stock price binomial tree model for convertible callable bonds. Financial liabilities on put options - These pertain to the liabilities of IMI arising from the written put options over the non-controlling interest of VIA. The fair value of the financial liabilities is estimated using the discounted, probability-weighted cash flow method. The future cash flows were projected using the equity forward pricing formula with reference to the current equity value of the acquiree and the forecasted interest rate which is the risk-free rate in Germany. The risk-free rate used range from 0.02% to 0.15%. Management applied weights on the estimated future cash flows, based on management’s judgment on the chance that the trigger events for the put option will occur. The current equity value of the acquiree is determined using the discounted cash flow approach. The future cash flows are projected using the projected revenue growth rate of VIA. The discount rate represents the current market assessment of the risk specific to the acquiree, taking into consideration the time value of money and individual risks of the underlying assets that have not been incorporated in the cash flow estimates. The discount rate calculation is based on the specific circumstances of the acquiree and is derived from its weighted average cost of capital. Noncurrent trade and nontrade receivables - The fair values are based on the discounted value of future cash flows using the applicable rates for similar types of instruments. AFS quoted debt and equity investments - Fair values are based on the quoted prices published in markets. AFS unquoted equity investments - Fair value of equity funds are based on the net asset value per share. For other unquoted equity shares where the fair value is not reasonably determinable due to the unpredictable nature of future cash flows and the lack of suitable method of arriving at a reliable fair value, these are carried at cost less impairment, if any. AFS unquoted debt investments - Fair values are based on the discounted value of future cash flows using the applicable rates for similar types of instruments. Accounts payable and accrued expenses, customers’ deposits, short-term debt and current portion of long-term debt and service concession obligation - The fair values of accounts payable and accrued expenses and short-term debt approximate the carrying amounts due to the short-term nature of these transactions. Other financial liabilities - non-current - The fair values are estimated using the discounted cash flow methodology using the Group’s current incremental borrowing rates for similar borrowings with maturities consistent with those remaining for the liability being valued. These also include the contingent consideration related to the acquisition of STI determined based on probability-weighted payout discounted at 12% at the date of acquisition to determine its fair value. Customers’ deposits - non-current - The fair values are estimated using the discounted cash flow methodology using the Group’s current incremental borrowing rates for similar borrowings with maturities consistent with those remaining for the liability being valued. The fair value of noncurrent other financial liabilities (fixed rate and variable rate loans repriced on a semi-annual/annual basis and deposits) are estimated using the discounted cash flow methodology using the current incremental borrowing rates for similar borrowings with maturities consistent with those remaining for the liability being valued. For variable rate loans that reprice every three months, the carrying value approximates the fair value because of recent and regular repricing based on current market rates. Fair Value Hierarchy The Group uses valuation techniques that are appropriate in the circumstances and for which sufficient data are available to measure fair value, maximizing the use of relevant observable inputs and minimizing the use of unobservable inputs.

S E C F O R M 1 7 - Q 55
All assets and liabilities for which fair value is measured or disclosed in the consolidated financial statements are categorized within the fair value hierarchy, described as follows, based on the lowest level input that is significant to the fair value measurement as a whole:
• Level 1 - Quoted (unadjusted) market prices in active markets for identical assets and liabilities.
• Level 2 - Valuation techniques for which the lowest level input that is significant to the fair value measurement is directly or indirectly observable.
• Level 3 - Valuation techniques for which the lowest level input that is significant to the fair value measurement is unobservable.
There have been no reclassifications from Level 1 to Level 2 categories in September 30, 2017 and December 31, 2016. The following table shows the fair value hierarchy of the Group’s assets and liabilities as at September 30, 2017 and December 31, 2016 (amounts in thousands):
September 2017 (Unaudited)
Quoted Prices
in Active
Markets
Significant
Observable
Inputs
Significant
Unobservable
Inputs
(Level 1) (Level 2) (Level 3)
Recurring financial assets measured at fair value
Financial assets at FVPL -₱ 76,000₱ 5,181,665₱ 5,257,665₱
Derivative assets
Embedded - - 295,180 295,180
Freestanding 3,100 - 5,813 8,913
AFS financial assets
Quoted equity investments 3,068,841 - - 3,068,841
Unquoted equity investments - 925,756 1,271,393 2,197,149
Quoted debt investments - - 115,157 115,157
3,071,941₱ 1,001,756₱ 6,869,208₱ 10,942,905₱
Recurring financial assets for which fair values are disclosed:
Loans and receivables -₱ -₱ 68,250,066₱ 68,250,066₱
Concession financial receivable - - 1,251,934 1,251,934
-₱ -₱ 69,502,000₱ 69,502,000₱
Recurring financial liabilities measured at fair value
Derivative liabilities
Financial liabilities on put option -₱ -₱ 1,353,813₱ 1,353,813₱
Embedded - - 837 837
Freestanding 2,337 - - 2,337
2,337₱ -₱ 1,354,650₱ 1,356,988₱
Recurring financial liabilities for which fair values are disclosed:
Noncurrent other financial liabilities
Service concession obligation -₱ -₱ 9,241,701₱ 9,241,701₱
Other noncurrent liabilities - - 31,265,821 31,265,821
Long-term debt - - 310,655,667 310,655,667
-₱ -₱ 351,163,189₱ 351,163,189₱
Nonfinancial assets for which fair values are disclosed:
Investments in associates and joint ventures* 211,765,426₱ -₱ -₱ 211,765,426₱
Investment properties - - 311,931,074 311,931,074
211,765,426₱ -₱ 311,931,074₱ 523,696,500₱
*Fair value of investments in listed associates and joint ventures for which there are published price quotations
Total

S E C F O R M 1 7 - Q 56
December 2016 (audited)
Quoted Prices in Active
Markets (Level 1)
Significant Observable
Inputs (Level 2)
Significant Unobservable
Inputs (Level 3) Total
Recurring financial assets measured at fair value
Financial assets at FVPL P=– P=1,736,759 P=4,927,256 P=6,664,015 Derivative assets
Embedded – – 241,787 241,787 Freestanding 3,335 – 765 4,100
AFS financial assets Quoted equity investments 2,579,137 – – 2,579,137 Unquoted equity investments – 638,334 1,231,987 1,870,321 Quoted debt investments – – 115,621 115,621
P=2,582,472 P= 2,375,093 P=6,517,416 P=11,474,981
Recurring financial assets for which fair values are disclosed:
Loans and receivables P=– P=– P=80,706,268 P=80,706,268 Concession financial receivable – – 2,080,736 2,080,736
P=– P=– P=82,787,004 P=82,787,004
Recurring financial liabilities measured at fair value
Derivative liabilities Financial liabilities on put option P=– P=– P=563,541 P=563,541 Embedded – – 3,357 3,357 Freestanding 525 – 1,927 2,452
P=525 P=– P= 568,825 P=569,350
Recurring financial liabilities for which fair values are disclosed:
Noncurrent other financial liabilities Service concession obligation P=– P=– P=9,590,173 P=9,590,173 Other noncurrent liabilities – – 20,113,198 20,113,198 Long-term debt – – 244,111,869 244,111,869
P=– P=– P=273,815,240 P=273,815,240
Nonfinancial assets for which fair values are disclosed:
Investments in associates and joint ventures*
P=168,647,494 P=– P=– P=168,647,494
Investment properties – – 295,508,639 295,508,639
P=168,647,494 P=– P=295,508,639 P=464,156,133
*Fair value of investments in listed associates and joint ventures for which there are published price quotations There was no change in the valuation techniques used by the Group in determining the fair market value of the assets and liabilities. The following table presents the valuation techniques and unobservable key inputs used to value the Group’s financial liabilities categorized as Level 3:
Valuation Technique
Unobservable inputs
Range of unobservable
inputs Sensitivity of the input to the fair value
Financial assets at FVPL
Market comparable
Weighted average cost of capital (WACC)
5% to 10% 5% increase / (decrease) in WACC would result in increase / (decrease) in
fair value by US$4,287,100 / (US$4,287,100)
10% increase / (decrease) in WACC would result in increase / (decrease) in
fair value by US$8,574,200 / (US$8,574,200)
Unquoted equity investments
Market comparable
WACC 5% to 10% 5% increase / (decrease) in WACC would result in increase / (decrease) in
fair value by US$ 40,350 / (US$140,350)
10% increase / (decrease) in WACC would result in increase / (decrease) in
fair value by US$280,700 / (US$280,700)
Quoted debt investments
Binomial tree method
Dividend yield 10% to 15% 10% increase / (decrease) in WACC would result in increase / (decrease) in
fair value by US$504,408 / (US$504,408)
15% increase / (decrease) in WACC would result in increase / (decrease) in
fair value by US$756,612 / (US$756,612)
Financial liabilities on put options
Discounted, probability-weighted cash flow method
Growth rate 1%-3% (2%) 1% increase in growth rate would result in an increase in fair value by $0.91
million. Decrease in growth rate by 1%

S E C F O R M 1 7 - Q 57
Valuation Technique
Unobservable inputs
Range of unobservable
inputs Sensitivity of the input to the fair value
would result in a fair value decrease of $0.65 million.
Discount rate 10%-13% (12%) 1% increase in discount rate would result in a decrease in fair value by
$0.78 million. Decrease in discount rate by 1% would result in a fair value
increase of $1.44 million.
Probability of trigger events occurring
1% – 10% (5%) Increase in the probability to 10% would result in an increase in fair value by
$2.31 million. Decrease in the probability to 1% would result in a
decrease in fair value by $5.60 million. Other noncurrent liabilities (contingent consideration)
Discounted, probability-weighted payout
Discount rate
10%-13% (12%)
1% increase in discount rate would result in a decrease in fair value by
$0.47 million. Decrease in discount rate by 1% would result in a fair value
increase of $0.48 million.
Probability of pay-out
GBP0 to GBP34.1 million ($0 to
$44.11 million)
GBP0 to GBP28.2 million ($0 to $32.47 million)
ALI Group categorizes trade receivable, investment in bonds classified as loans and receivables, receivable from employees, long-term debt and deposits and other noncurrent liabilities under Level 3. The fair value of these financial instruments is determined by discounting future cash flows using the applicable rates of similar types of instruments plus a certain spread. This spread is the unobservable input and the effect of changes to this is that the higher the spread, the lower the fair value.
For assets and liabilities that are recognized in the consolidated financial statements on a recurring basis, the Group determines whether transfers have occurred between Levels in the hierarchy by reassessing categorization (based on the lowest level input that is significant to the fair value measurement as a whole) at the end of each reporting period. As of September 30, 2017, there were no transfers made by the Group. A reconciliation of the beginning and closing balances of Level 3 financial assets at FVPL as of September 30, 2017 and December 31, 2016 are summarized below:
Derivatives
September 2017 December 2016
(Unaudited) (Audited)
At January 1 4,927,256₱ 4,784,228₱
Additions 596,462 685,824
Disposals/redemptions (563,393) (846,328)
Recognized in statement of income 221,339 303,532
Balance ending 5,181,665₱ 4,927,256₱
September 2017 December 2016
(Unaudited) (Audited)
Derivative Assets
Conversion option of BHL 134,628₱ 135,170₱
Prepayment option of ACEHI 273,443 106,617
Currency forward of IMI 3,098 3,335
Foreign exchange forward contract of AIVPL - 765
411,169₱ 245,887₱
Derivative Liabilities
Conversion option of AIVPL 2,293₱ 3,357₱
Currency forwards of IMI 1,356,163 564,066
Currency-linked notes 917 1,927
1,359,373₱ 569,350₱

S E C F O R M 1 7 - Q 58
Fair Value Changes on Derivatives The net movements in fair values of the Group’s derivative instruments as of September 30, 2017 and December 31, 2016 follow (amounts in thousands):
Derivative Assets
Derivative Liabilities
No other financial assets or liabilities are carried at fair value as of September 30, 2017 and December 31, 2016. Financial Risk Management General Like any other risks, financial risks are inherent in its business activities and are typical of any large holding company. The financial risk management of the Parent Company seeks to effectively contribute to better decision making, enhance performance, and satisfy compliance demands.
The Parent Company defines financial risks as risk that relates to the Parent Company’s ability to meet financial obligations and mitigate funding risk, credit risk and exposure to broad market risks, including volatility in foreign currency exchange rates and interest rates. Funding risk refers to the potential inability to meet contractual or contingent financial obligations as they arise and could potentially impact the Parent Company’s financial condition or overall financial position. Credit risk is the risk of financial loss arising from a counterparty’s failure to meet its contractual obligations or non-payment of an investment. These exposures may result in unexpected losses and volatilities in the Parent Company’s profit and loss accounts.
The Parent Company maintains a strong focus on its funding strategy to help provide access to sufficient funding to meet its business needs and financial obligations throughout business cycles. The Parent Company’s plans are established within the context of our annual strategic and financial planning processes. The Parent Company also take into account capital allocations and growth objectives, including dividend pay-out. As a holding company, the Parent Company generates cash primarily on dividend payments of its subsidiaries, associates and joint ventures and other sources of funding.
The Parent Company also establishes credit policies setting up limits for counterparties that are reviewed quarterly and monitoring of any changes in credit standing of counterparties.
In 2014, the Parent Company formalized the foreign exchange and interest rate risk management policy. The Parent Company actively monitors foreign exchange exposure and interest rate changes. And in
September 2017 December 2016
(Unaudited) (Audited)
Balance at beginning of year 245,887₱ 241,263₱
Balance upon bifurcation - -
Fair value of currency forwards (694) 5,777
Fair value of convertible bonds - -
Net changes in fair value of derivatives 166,826 76,527
412,018 323,567
Fair value of settled instruments (849) (77,681)
Balance at end of period 411,169₱ 245,887₱
September 2017 December 2016
(Unaudited) (Audited)
Balance at beginning of year 569,350₱ 3,771₱
Fair value of currency forwards 11,050 12,580
Fair value of put options 792,097 563,541
Net changes in fair value of derivatives (1,010) 112
1,371,487 580,004
Fair value of settled instruments (12,114) (10,653)
Balance at end of period 1,359,373₱ 569,350₱

S E C F O R M 1 7 - Q 59
addition, the Parent Company ensures that all loan covenants and regulatory requirements are complied with. The Ayala Group continues to monitor and manage its financial risk exposures in accordance with Board approved policies. The succeeding discussion focuses on Ayala Group’s financial risk management. Financial Risk Management Objectives and Policies The Group’s principal financial instruments comprise financial assets at FVPL, AFS financial assets, bank loans, corporate notes and bonds. The financial debt instruments were issued primarily to raise financing for the Group’s operations. The Group has various financial assets such as cash and cash equivalents, short-term investments, accounts and notes receivables and accounts payable and accrued expenses which arise directly from its operations.
The Group’s main risks arising from the use of financial instruments are interest rate risk, foreign exchange risk, price risk, liquidity risk, and credit risk. The Group also uses hedging instruments, the purpose of which is to manage the currency and interest rate risks arising from its financial instruments. The Group’s risk management policies relevant to financial risks are summarized below: Interest Rate Risk The Group’s exposure to market risk for changes in Interest rates relates primarily to the Parent Company’s and its subsidiaries’ obligations. The policy is to keep a certain level of the total obligations as fixed to minimize earnings volatility due to fluctuation in interest rates. Foreign Exchange Risk The Group’s foreign exchange risk results primarily from movements of the Philippine Peso (PHP) against other currencies. The Group’s consolidated statements of income can be affected significantly by movements in the USD and other currencies versus the PHP. The Group may enter into currency forward contracts to hedge its risks associated with foreign currency fluctuations. The second and third columns of the table below summarize the Group’s exposure to foreign exchange risk as of September 30, 2017. The fourth and fifth columns of the table demonstrates the sensitivity to a reasonably possible change in the peso exchange rate, with all variables held constant, of the Group’s profit before tax (due to changes in the fair value of monetary assets and liabilities) and the Group’s equity (in thousands, unaudited).
There is no other impact on the Group’s equity other than those already affecting the net income.
Equity price risk AFS financial assets are acquired at certain prices in the market. Such investment securities are subject to price risk due to changes in market values of instruments arising either from factors specific to individual instruments or their issuers, or factors affecting all instruments traded in the market. Depending on several factors such as interest rate movements, the country’s economic performance, political stability, and domestic inflation rates, these prices change, reflecting how market participants
Foreign currency
Net asset
(liabilities)
PHP
equivalent
Increase
(decrease) in
Peso per foreign
currency
Increase
(decrease) in
profit before
tax
United States Dollar (USD) USD (17,686) (898,691)₱ ₱1.00 (17,686)₱
(1.00) 17,686
Japanese Yen (JPY) JPY (21,335,827) (9,602,035)₱ 1.00 (21,335,827)
(1.00) 21,335,827
Chinese RMB (RMB) RMB 197,759 1,514,128₱ 1.00 197,759
(1.00) (197,759)
Euro (EUR) EUR 39,399 2,363,835₱ 1.00 39,399
(1.00) (39,399)
Vietnam Dong (VND) 33,201,756VND 73,842₱ 1.00 33,201,756
(1.00) (33,201,756)

S E C F O R M 1 7 - Q 60
view the developments. The Group’s investment policy requires it to manage such risks by setting and monitoring objectives and constraints on investments; diversification plan; and limits on investment in each sector and market. Liquidity Risk Liquidity risk is defined by the Group as the risk of losses arising from funding difficulties due to deterioration in market conditions and/or the financial position of the Group that make it difficult to raise the necessary funds or that forces the Group to raise funds at significantly higher interest rates than usual. This is also the possibility of experiencing losses due to the inability to sell or convert marketable securities into cash immediately or in instances where conversion to cash is possible but at loss due to wider than normal bid-offer spreads. The Group seeks to manage its liquidity profile to be able to service its maturing debts and to finance capital requirements. The Group maintains a level of cash and cash equivalents deemed sufficient to finance operations. As part of its liquidity risk management, the Group regularly evaluates its projected and actual cash flows. It also continuously assesses conditions in the financial markets for opportunities to pursue fund-raising activities. Fund-raising activities may include bank loans and capital market issues, both on-shore and off-shore. Credit Risk Credit risk is the risk that the Group’s counterparties to its financial assets will fail to discharge their contractual obligations. The Group’s holding of cash and short-term investments and receivables from customers and other third parties exposes the Group to credit risk of the counterparty. Credit risk management involves dealing with institutions for which credit limits have been established. The Group’s Treasury Policy sets credit limits for each counterparty. The Group trades only with recognized, creditworthy third parties. The Group has a well-defined credit policy and established credit procedures.
21. Related Party Transactions
Parties are considered to be related if one party has the ability, directly or indirectly, to control the other party or exercise significant influence over the other party in making financial and operating decisions. Parties are also considered to be related if they are subject to common control or common significant influence which include affiliates. Related parties may be individuals or corporate entities. The Group, in its regular conduct of business, has entered into transactions with associates, joint ventures and other related parties principally consisting of advances, loans and reimbursement of expenses, purchase and sale of real estate properties, various guarantees, construction contracts, and development, management, underwriting, marketing and administrative service agreements. Sales and purchases of goods and services as well as other income and expense to and from related parties are made at normal commercial prices and terms. There has not been any material transaction during the last two years, or proposed transaction, to which the Group was or is to be a party, in which any of its directors or executive officers, any nominee for election as a director or any security holder identified in this interim condensed financial information had or is to have a direct or indirect material interest. In 2014, Company adopted a Related Party Transactions (RPT) policy which provides that related party transactions between the Company and related parties shall be subject to review and approval to ensure that they are at “arm’s length”, the terms are fair, and they will inure to the best interest of the Company and its shareholders. Highlights of related party transactions follow: Transactions with BPI The Group maintains current and savings account, money market placements and other short-term investments with BPI amounting to P=46,196.0 million and P=24,384.9 million, as of September 30, 2017 (unaudited) and December 31, 2016 (audited), respectively (see Notes 4 and 5). The Other Current Assets account as of September 30, 2017 (unaudited) and December 31, 2016 (audited) includes P=1,710.0 million and P=977.6 million Financial Assets at FVPL of ALI with BPI, respectively (see Note 8). The Group also has short-term and long-term debt payable to BPI amounting to P=30,165.0 million and P=33,381.9 million as of September 30, 2017 (unaudited) and December 31, 2016 (audited), respectively.

S E C F O R M 1 7 - Q 61
These short-term and long-term debts are interest bearing with varying rates, have various maturities starting 2017 and varying schedules of payments for interest (see Note 16). Receivables from Related Parties The Group has P=2,444.4 million and P=2,339.6 million receivables from related parties as of September 30, 2017 (unaudited) and December 31, 2016 (audited) respectively. The balances pertain mostly to interest and non-interest bearing advances with various maturities from 30 days to 2 years. Advances include certain residential development projects which become due as soon as the projects are completed. The receivables also include certain trade receivables arising from automotive and other sales. This account also includes other receivables relating to reimbursement of operating expenses like management fees, among others. The trade and other receivables are unsecured, interest free, will be settled in cash and are due and demandable (see Note 6).
Receivables from Officers and Employees The Group has P=1,817.2 million and P=1,090.8 million receivables from officers and employees as of September 30, 2017 (unaudited) and December 31, 2016 (audited), respectively. These pertain to housing, car, salary and other loans granted to the Group’s officers and employees, which are collectible through salary deduction, are interest bearing ranging from 5.0% to 10.0% per annum and have various maturity dates ranging from 2017 to 2027 (see Note 6). Payables to Related Parties The Group has payables to various related parties amounting to P=1,456.9 million and P=3,442.0 million as of September 30, 2017 (unaudited) and December 31, 2016 (audited), respectively. These payables include: a) cost of lots for joint development projects; b) purchased parts and accessories and vehicles; and c) advances and reimbursements for operating costs. These are all interest-free, unsecured, will be settled in cash. Maturities of these payables range from 15 days to one year, with some accounts due and demandable (see Note 14). Income and Expenses The Group realized total income of P=786.1 million and P=818.2 million from related parties and incurred total expenses of P=616.5 million and P=539.8 million for the periods ended September 30, 2017 and 2016, respectively (both unaudited). These 2017 amounts represent 0.4% of the Group's total income and expenses. These consist of, among others, income from real estate, automotive sales, professional services and interest/financing as well as expenses on interest, water utilities, communications and professional fees (see Note 16).
22. Events after the Reporting Period
AC Infra Group a) On October 2, 2017, the Company clarified the news article entitled, “MPIC offers P=20B to run
MRT3" published in the manilastandard.net on October 1, 2017. The Company clarified that MPIC had earlier submitted an unsolicited proposal to take over the rehabilitation and operations and maintenance of MRT3. Discussions are still ongoing with respect to the Company's participation in the MRT3 project.
ALI Group a) SIAL CVS Retailers, Inc., FamilyMart Co., Ltd., and ITOCHU Corporation have entered into a
Memorandum of Agreement (MOA) to sell 100% of the outstanding shares of Philippine FamilyMart CVS, Inc. (PFM) to P-H-O-E-N-I-X Petroleum Philippines, Inc. (PNX). PFM is the official Area Franchisee of the Family Mart brand of convenience stores in the Philippines, with a current network of 67 company-owned and franchised stores all over the country. PNX is the leading independent and fastest-growing oil company in the Philippines, with a wide network of retail stations and commercial and industrial clients all over the Philippines. SIAL CVS Retailers, Inc., a 50-50 joint venture company between ALI Capital Corp. (a 100% subsidiary of ALI) and SSI Group, Inc. (SSI), currently owns 60% of PFM, while Japanese companies, FamilyMart Co., Ltd. and ITOCHU Corporation, own 37.6% and 2.4% respectively. The sale transaction will be subject to the approval of the Philippine Competition Commission.
MWC Group a) On October 3, 2017, the MWC BOD approved the following:
i. declaration of cash dividends for the second semester of 2017, amounting to ₱0.4244 and
₱0.04244 per share on the outstanding common shares and participating preferred shares,
respectively, payable on November 2, 2017 to stockholders of record as of October 17, 2017;

S E C F O R M 1 7 - Q 62
ii. sale of all the shareholdings of MWC in MWIS to MWPVI valued at ₱12.3 thousand based on
cash balance net of accrued expenses as of August 30, 2017;
iii. the assignment of receivables of MWC from MWIS at the face value of ₱34.4 million as of
August 30, 2017, both in exchange for additional subscriptions in MWPVI; and
iv. the conversion of the MWC’s shareholder advances to MWTS amounting to ₱195.00 million
into subscription to redeemable preferred shares of MWTS.
b) On October 12, 2017, Obando Water and OWD have signed and executed a Concession Agreement
for the design, construction, rehabilitation, operation, maintenance, financing, expansion and management of water facilities and the provision of water and sanitation services in the Municipality of Obando for a period of twenty-five (25) years from the commencement date.
c) On October 23, 2017, Calasiao Water and CWD signed and executed a Concession Agreement for the design, construction, rehabilitation, operation, maintenance, financing, expansion and management of the water supply system for a period of twenty-five (25) years from the commencement date.
IMI Group a) On November 12, 2017, the Executive Committee of IMI passed a resolution approving the rights
offering of common shares to all eligible shareholders of IMI (“Rights Issue”). IMI expects to raise proceeds of up to US$ 100 Million from the Rights Issue.
Determination of the final terms and conditions of the Rights Issue, including but not limited the final issue size, entitlement ratio, offer price, record date, and the final parties, has been delegated to IMI’s management, for final approval by the Executive Committee. IMI expects to launch the Rights Issue after receiving the required regulatory approvals. IMI is conducting the Rights Issue in order to support the growth and strategic initiatives of IMI. This includes business expansions and strategic investments. The Rights Issue will ensure the financial flexibility to consider these opportunities if and when they arise. AC Industrial Technology Holdings, Inc. and Resins Inc., among IMI’s shareholders, have indicated their support of the Rights Issue. IMI has appointed BPI Capital Corporation as Global Coordinator, Bookrunner and Domestic Underwriter for the Rights Issue.
Globe Group a) On November 3, 2017, the Globe’s BOD approved the declaration of the fourth quarter cash dividend
of ₱22.75 per common share, payable to common stockholders of record as of November 17, 2017. Total dividends amounting to ₱3.0 billion will be payable on December 1, 2017. On the same date, the Globe’s BOD approved the declaration of the cash dividend for holders of voting preferred shares on record as of November 17, 2017. The amount of the cash dividend will be based on the average 30-day PDST-R2, as computed by the PDEX plus 2%. The aggregate dividend payment for the voting preferred shares is about ₱33.7 million payable on December 1, 2017.

S E C F O R M 1 7 - Q 63
Item 2 - MANAGEMENT’S DISCUSSION AND ANALYSIS OF FINANCIAL CONDITION AND RESULTS OF OPERATIONS
Ayala Corporation sustained its earnings momentum in the first nine months of the year, with net income reaching ₱23.2 billion, an 18 percent-growth from its year-ago level. This was bolstered by the strong performance of its real estate unit, and boosted by the continued ramp-up of its power business. Consolidated Sale of Goods and Services Sales of goods and services rose 22 percent to ₱170 billion, lifted by higher sales in all housing, residential, and condominium segments of Ayala Land; improved vehicle sales across all brands of AC Industrials‘ automotive retail business; and stronger sales performance of Integrated Micro-Electronics, following the consolidation of its new subsidiary. Higher revenues from AC Energy’s rendering of services, as well as from its various businesses, also contributed to this. This account comprised 85 percent of Ayala’s total income as of end-September 2017. Real Estate The sustained performance of the residential segment, office-for-sale, and commercial leasing businesses drove the 18 percent growth in Ayala Land’s nine-month net income to ₱17.8 billion. In property development, residential revenues jumped 30 percent from its year-ago level to ₱57.3 billion driven by new bookings and project completions led by the Alveo and Avida brands. Reservation sales in the first nine months amounted to ₱94.2 billion, 12 percent higher year-on-year, with average monthly sales amounting to ₱10.5 billion. Unbooked revenues from reservation sales reached its highest level to date at ₱141 billion from ₱127 billion in end-2016, while net booked sales for the period climbed 16 percent to ₱66.9 billion. Office-for-sale revenues surged 50 percent year-on-year to ₱6.3 billion bolstered by sales from the High Street South Corporate Plaza 2 project. In the commercial and industrial lots segment, Ayala Land posted ₱4.8 billion revenues in the first nine months, up 8 percent from a year ago, fueled by strong lot sales in Arca South, Vermosa, and Naic, Cavite. During the period, Ayala Land launched ₱53.9 billion worth of residential and office-for-sale projects. In commercial leasing, shopping center revenues reached ₱11.8 billion, 11 percent higher than the previous year backed by contributions from new malls. Office leasing revenues grew 11 percent to ₱4.5 billion, lifted by stabilized occupancy of UP Town Center, Ebloc 4, and Alabang Town Center BPO offices. Moreover, hotel and resorts revenues were steady at ₱4.8 billion, up six percent year-on-year, driven by higher occupancy and average room rates of El Nido Resorts. Property management revenues climbed 51 percent to ₱1.6 billion supported by increase in managed properties. These recurring income businesses contributed 35 percent of Ayala Land’s net income during the period. Water Manila Water’s nine-month net earnings ended flat from a year ago at ₱4.9 billion, as higher operating costs and expenses from expansion initiatives weighed down its topline growth. Manila Water’s revenues rose three percent to ₱13.8 billion, in step with a three percent expansion of total billed volume to 554.4 million cubic meters. In the first nine months of the year, the Manila Concession registered ₱4.5 billion in net income, three percent higher than the previous year, supported by a steady growth in billed volume and lower depreciation expenses. Billed volume stood at 366.6 million cubic meters, two percent higher than its year ago level, on the back of higher demand from domestic and semi-commercial clients. Operating efficiencies remain at a comfortable level with non-revenue water at 13.1 percent, while collection efficiency stood at 99 percent in the first nine months. Revenues from Manila Water’s domestic subsidiaries, Manila Water Philippine Ventures, jumped 26 percent to ₱2.3 billion bolstered by strong growth across all its subsidiaries. This was led by Estate Water and Laguna Water, which posted revenue growth of 42 percent and 32 percent, respectively. All in all, Manila Water’s non-Manila Concession businesses contributed ₱770 million accounting for 16 percent of total consolidated net income. Operating costs and expenses in the first nine months rose 11 percent to ₱4.9 billion, due to higher direct and personnel costs.

S E C F O R M 1 7 - Q 64
Manila Water remains aggressive in its business-building efforts, with business development costs more than doubling to ₱162 million. In addition, Manila Water continued to invest in service improvements with capital expenditure up 66 percent to ₱8.2 billion, with a bulk allocated to the Manila Concession. Power Generation AC Energy sustained its earnings momentum with net income surging 73 percent to ₱2 billion in the first nine months, primarily driven by the fresh contribution of its geothermal asset in Indonesia, boosted by services income derived from the financial close of a new power plant. Equity earnings from AC Energy’s operating assets expanded 20 percent year-on-year to ₱1.6 billion, bolstered by the robust performance of its renewable energy assets and the contribution of SD Geothermal (formerly Chevron Indonesia). During the period, its renewable platforms contributed 52 percent to AC Energy’s equity earnings from operating assets. AC Energy’s first greenfield offshore project, the 75-megawatt Sidrap Wind Farm located in South Sulawesi, Indonesia, is expected to be operational by the first quarter of 2018. Industrial Technologies AC Industrials registered a net income of ₱1 billion in the first nine months of the year, a five percent increase from a year ago, as the solid performance of its electronics manufacturing business offset weaker contributions from its vehicle retail segment. In electronics manufacturing, Integrated Micro-Electronics, recorded a 16 percent increase in net earnings to US$24.1 million (₱1.2 billion), driven by its automotive and industrial segments. Revenues surged 29 percent year-on-year to US$795.2 million (₱40.4 billion), lifted by its Europe and Mexico operations, which contributed US$263.4 million (₱13.4 billion) in revenues on increased demand for automotive lighting. VIA Optronics and Surface Technology International registered a combined US$136.2 million (₱6.9 billion) in revenues, contributing 17 percent of total revenues. VIA and STI supported the 25 percent improvement in gross profit of US$89.2 million (₱4.5 billion) during the period. Meanwhile, revenues from AC Industrials’ vehicle retail segment expanded 30 percent to ₱21.2 billion, supported primarily by strong sales of its Honda BR-V, Honda Civic and Isuzu truck models. Despite higher sales during the period, net income declined 10 percent to ₱445 million as a result of lower dividend income from Isuzu Philippines Corporation and lower equity earnings from Honda Cars Philippines Inc. In motorcycle manufacturing, KTM Philippines has assembled 1,148 units as of September since it began operations in June this year. Share of Profit of Associates and Joint Ventures Share of profit of associates and joint ventures posted a slight three percent increase to ₱14.2 billion from the same period last year. Banking In banking, the sustained momentum of Bank of the Philippine Islands’ core banking and fee-based businesses cushioned the absence of significant gains from a capital exercise in the previous year. The bank posted ₱17 billion in net income in the first nine months, 1.9 percent lower year-on-year. The bank’s total revenues rose five percent to ₱53 billion as net interest income rose 13.5 percent to ₱35.5 billion driven by higher asset yields and expansion of its average asset base. Non-interest income fell to ₱17.5 billion, down 8.4 percent from a year ago, due to the absence of significant one-off securities trading gains similar to those realized in June 2016. The lower trading gains was partially offset by the bank’s fee-based income, which rose 20.1 percent during the period backed by credit card, investment banking, and trust fees. BPI’s cost-to-income ratio increased to 52.5 percent as the bank continues to invest in new technology to improve operating efficiencies. BPI’s loan book expanded 21 percent as of end-September 2017 to ₱1.1 trillion compared to the same period a year ago, supported by a 24 percent-growth in corporate loans. The corporate segment accounted for 80 percent, while the consumer segment comprised 20 percent of the bank’s loan portfolio. BPI maintained its asset quality with a 90-day non-performing loans ratio of 1.5 percent and a 126 percent
S E C F O R M 1 7 - Q 65
reserve cover. Total deposits in the first nine months of the year stood at ₱1.5 trillion, 14 percent higher than a year ago, with its current and savings account ratio at 71 percent. Telecom Continued demand for data-related services, lifted by a ₱1.9 billion gain from the strategic partnership forged by Mynt, drove Globe Telecom’s net income to ₱13 billion, 11 percent higher than a year ago. This one-time gain pared Globe’s share in equity losses and amortization charges related to the acquisition of San Miguel’s telco assets, higher interest expenses, and depreciation. Globe’s gross service revenues improved six percent to ₱95.1 billion led by a broad-based growth across its mobile, home broadband and corporate data segments. Mobile revenues grew seven percent to ₱73.1 billion, driven by sustained high demand for mobile data. Mobile data revenues increased 20 percent to ₱31.3 billion as mobile data traffic soared 73 percent to 430 petabytes in the first nine months of the year. Home broadband revenues rose eight percent from its year-ago level to ₱11.7 billion, tracking a nine percent growth in broadband subscribers to 1.3 million. Meanwhile, corporate data revenues ended the period four percent higher to ₱7.6 billion. On a combined basis, Globe’s revenues from data-related services amounted to ₱50.6 billion, up 14 percent year-on-year. Data services accounted for 53 percent of Globe’s gross service revenues in the first nine months compared to 49 percent in the previous year. Globe posted an earnings before interest, taxes, depreciation and amortization (EBITDA) of ₱40.6 billion, up eight percent from the previous year, backed by strong revenues despite higher operating expenses. Moreover, EBITDA margin improved to 43 percent from its year-ago level of 42 percent. Without the impact of the gains from the increase in fair value of its retained equity interest in Mynt and the costs related to the acquisition of San Miguel’s telecom assets, Globe’s net earnings dropped two percent year-on-year owing to higher depreciation expense and interest and financing charges. As part of its commitment to improve internet services in the country, Globe is deploying US$100 million in additional capital expenditures for the year to fund the expansion of its mobile data network, bringing Globe’s total capital spending plan to US$850 million for 2017. The additional investment will be used to deploy new cell sites that utilize the 700 and 2600 megahertz frequencies aimed at expanding internet capacity and mobile coverage. In October, with partners Ant Financial and Ayala, Globe launched its digital payment platform through GCash, which utilizes Quick Response (QR) codes for retail merchants. The system allows customers to pay for goods and services using their smartphones. The system was first launched with Ayala Malls and is targeted to expand to other retail outlets. Other Income Other income soared 87 percent to ₱12.1 billion, on the back of Manila Water’s increased rehabilitation works, AC Energy’s services income derived from the financial close of a new power plant. In addition, Ayala Land’s higher management and marketing fees, and IMI’s foreign exchange gains, as well as investment gains of Ayala Land and Bestfull contributed to the growth. Costs and Expenses Consolidated cost of sales reached ₱122.5 billion, a 24 percent increase resulting from higher sales from Ayala Land, AC Industrials‘ automotive retail segment and contribution from newly acquired subsidiaries of IMI, and stronger revenues from AC Energy. Consolidated general and administrative expenses rose 20 percent to ₱15.4 billion. Growth was a result of combined increments in the group’s expenses: Ayala Land’s contracted services, communication, retirement, and trainings; Ayala parent, AC Energy, and Manila Water’s manpower, insurance costs, and depreciation expenses; AC Industrials‘ marketing and promotional expenses for its automotive retail business and professional and management fees for IMI. This includes the impact of consolidation of IMI and AC Energy’s new subsidiaries. Interest Expenses and Other Financing Charges Interest expenses and other financing charges increased five percent to ₱10.8 billion, due to higher loans of Ayala Land and AC Energy to fund their expansion projects.

S E C F O R M 1 7 - Q 66
Balance Sheet Highlights Ayala’s balance sheet continues to be healthy to support its investments as well as meet debt and dividend obligations. Moreover, Ayala’s consolidated assets breached the 1-trillion-peso level as of end-September 2017. Investments in associates and joint ventures grew 12 percent to ₱201 billion, on the back of new investments of AC Energy and AC Ventures, and higher shares in net earnings from BPI, Globe, and Ayala Land’s investees. This was partially tempered by Bestfull’s disposal of investments. Investments in property climbed 15 percent to ₱127 billion from Ayala Land’s expansion projects. Meanwhile, investments in property and equipment rose 27 percent to ₱82 billion, driven by AC Energy’s construction of power plants for GNP Kauswagan, Ayala Land’s capital expenditure program to expand its hotels and resports operations, and IMI’s new capital expenditures. The consolidation of AC Energy and IMI’s new subsidiaries also contributed to the increase. As of end-September 2017, total debt at the consolidated level reached ₱351.4 billion, a 12 percent increase from the previous quarter. This also represents a 19 percent increase from the December 2016 level of ₱295.9 billion, in part owing to capital-raising exercises by the parent, AYC, and Ayala Land, as well as long-term borrowings for expansion projects of Ayala Land, AC Energy, and Manila Water. Consolidated cash and short-term investments expanded to ₱76.4 billion, a 25 percent increase owing to issuance of bonds by the parent and the real estate business. Cash at the parent level stood at ₱29.7 billion, while net debt stood at ₱67.2 billion. Net debt-to-equity ratio during the period was 0.68 at the consolidated level and 0.61 at the parent level. Ayala’s loan-to-value ratio or the ratio of its parent net debt to the total value of its investments was 10 percent as of end-September 2017. In September, Ayala successfully issued US$400 million senior Perpetual bonds with an annual coupon rate of 5.125 percent with no reset nor step-up, a first in the Philippines. The issuance of this fixed-for-life Perpetual was more than five times oversubscribed with 81 percent allocated to foreign institutional investors. The issuance allows Ayala to optimize its average cost of funding and extend its debt maturity profile and diversify its funding source.

S E C F O R M 1 7 - Q 67
Key Performance indicators: The Group maintains healthy financial ratios driven by strong operating performance of major subsidiaries and investees.
The key performance indicators (consolidated figures) that the Group monitors are the following:
2.1 Any known trends or any known demands, commitments, events or uncertainties that will result in or
that are reasonably likely to result in the registrant’s liquidity increasing or decreasing in any material way. The following conditions shall be indicated: whether or not the registrant is having or anticipates having within the next twelve (12) months any cash flow or liquidity problems; whether or not the registrant is in default or breach of any note, loan, lease or other indebtedness or financing arrangement requiring it to make payments; whether or not a significant amount of the registrant’s trade payables have not been paid within the stated trade terms.
The Group does not expect any liquidity problems and is not in default of any financial obligations. The Group complied with the existing loan covenants and restrictions as of September 30, 2017.
2.2 Any events that will trigger direct or contingent financial obligation that is material to the Company,
including any default or acceleration of an obligation:
None 2.3 Any material off-balance sheet transactions, arrangements, obligations (including contingent
obligations), and other relationships of the company with unconsolidated entities or other persons created during the reporting period:
None
September 2017 December 2016
Ratio Formula (Unaudited) (Audited)
Liquidity Ratio
Cash/ Cash equivalents + Short-term cash
investments 0.33 0.26
Current Liabilities
Current ratio Current assets 1.40 1.22
Current liabilities
Solvency Ratio
After-Tax Net Profit + (Depreciation +
Amortization)+ Provision for Bad Debts 0.05 0.05
Total Liabilities
Debt-to-Equity Ratio Long-term Loans + Short Term Loans 1.39 1.28
Equity Attributable to Owners of the Parent
Assets- to-Equity Ratio Total Assets 4.01 3.95
Equity Attributable to Owners of the Parent
Interest Expense Coverage Ratio EBITDA 6.20 5.72
Interest Expense
Return on Equity Net Income to Owners of the Parent 9.6% 9.0%
Equity Attributable to Owners of the Parent
(Average)
Return on Common Equity
Net Income to Owners of the Parent Less
Dividends on Preferred Shares 10.2% 9.6%
Common Equity Attributable to Owners of the
Parent (Average)
Return on Assets Net Income 3.8% 3.7%
Total Assets
* Based on Unaudited September 30, 2016.
*
*
*
*
*

S E C F O R M 1 7 - Q 68
2.4 Any material commitments for capital expenditures, the general purpose of such commitments, and the expected sources of funds for such expenditures. At the group level, a total of P=185 billion was earmarked primarily to support the growth strategies of its real estate, telecommunications and water units and ramp up its emerging businesses in power, industrial technologies, healthcare, and education. Ayala For 2017, Ayala have set aside P=21 billion in capital spending at the parent level with significant allocation for the expansion plans of its power unit, ACEHI and AC Industrial's Automotive group. As of the nine-month period, P=14.4 billion has been spent with a bulk going to Energy. The Company continues to strategically deploy capital across its businesses to explore new avenues of growth. ALI ALI’s consolidated budget for project and capital expenditures amount to P=87.6 billion of which P=63.2 billion has been disbursed as of September 30, 2017. This will be financed through a combination of internally-generated funds, borrowings and operations. ALI will use the capital expenditure for land acquisition as well as the construction completion of investment properties and launched residential projects. Of the total capital expenditure of P=63.2 billion in the past nine months of 2017, 49% was spent on the completion of residential projects, and 28% was spent on commercial leasing projects. 17% was spent on land acquisition, new businesses, services and other investments while 6% was spent on the development of its estates. MWC MWC targets to spend around P=57.0 billion capital expenditures from 2017 to 2020 for the rehabilitation and construction of facilities to improve water and sewer services in the Manila Concession Area, based on the 2013 rate rebasing arbitration decision and government approvals. Capital expenditures will be funded from the current cash reserves, internal funds generation and proceeds from available loan facilities.
The MWC’s Manila Concession spent a total of P=6.63 billion (inclusive of concession fee payments) for capital expenditures in the past nine months of 2017, 86% more than the P=3.56 billion spent in the same period the previous year. Of the total amount, 93% was spent on wastewater expansion, network reliability and water supply projects, while the balance of 7% was accounted for by concession fees paid to MWSS. Capital expenditures for the balance of 2017 is expected to further strengthen to meet the committed capital expenditures target in the approved business plan for the 2013-2017 rate rebasing period . Meanwhile, total capital expenditures of the domestic subsidiaries grew by 14% to P=1.59 billion from the P=1.39 billion spent in the first nine months of 2017. Of the total amount, P=672 million was used by Laguna Water for its development of new water sources and network expansion, while Boracay Water and Clark Water disbursed P=170 million and P=156 million, respectively. Estate Water spent P=342 million for its greenfield and brownfield projects. The balance was spent by MWTS, Tagum Water and Zamboanga Water.
IMI IMI expects to spend US$60.0M for capital expenditures for existing operations and new expansion projects.
IMI’s capital investments in the past nine months of 2017 totaled US$49.0 million, in line with its expansion programs and newly-acquired company in UK. ACEHI As a group, Ayala projected a P=15.5 billion amount of capital investments on Power for 2017, including P=10.1 billion to be funded directly by ACEHI. These investments are geared towards completion of project development in the country, investment tie-ups for offshore energy projects and the recent retail electricity supply area. As of the nine-month period , ACEHI has actualized P=14.5 billion in capital expenditures. These capital expenditures were partly funded through internally generated funds and long-term borrowings.

S E C F O R M 1 7 - Q 69
2.5 Any known trends, events or uncertainties that have had or that are reasonably expected to have a material favorable or unfavorable impact on net sales or revenues or income from continuing operations should be described.
The Company’s and its subsidiaries’ performance will continue to hinge on the overall economic performance of the Philippines and other countries where its subsidiaries operate. Key economic indicators, interest rate and foreign exchange rate movements will continue to impact the performance of the real estate, banking, telecom, water infrastructure, power generation, electronics manufacturing and automotive groups, including the parent Company.
2.6 Any significant elements of income or loss that did not arise from the registrant's continuing operations
None 2.7 There were no material changes in estimates of amounts reported in prior interim period of the current
financial year and interim period of the prior financial year, respectively.
None
2.8 Causes for any material changes (Increase or decrease of 5% or more in the financial statements)
The unaudited interim consolidated financial statements show several significant increases in Balance Sheet accounts (vs. December 31, 2016 balances) and Income Statement accounts (vs. September 30 2016 levels) relating to the following acquisitions of certain subsidiaries: 1. ACEHI’s acquisition of 100% ownership of Bronzeoak Clean Energy (“BCE”) and San Carlos Clean
Energy (“SCCE”); 2. IMI’s acquisition of 80% stake in Surface Technology International Enterprises Limited (STI; and 3. AC Industrial’s acquisition of 94.9% ownership of MT Misslbeck Technologies Gmbh. Balance Sheet Items As of September 30, 2017 (Unaudited) vs. December 31, 2016 (Audited) Cash and cash equivalents – 23% increase from P=60,223 million to P=74,117 million Increase arising from issuance of bonds: AYC’s USD 400M fixed for life (FFL) bonds; AC’s P=10.0B and ALI P=7.0B bonds; plus loan availments of ALI, MWC, IMI and ACEHI. Uses of cash includes AC’s pre-termination of more expensive loans, ALI and MWCI’s expansion projects; ACEHI and IMI’s new investments and capital expenditures. This account is at 7% of the total assets as of September 30, 2017 and December 31, 2016. Short-term investments – 129% increase from P=1,009 million to P=2,315 million Increase due to additional short-term investments mainly from AC. This account is at less than 1% of the total assets as of September 30, 2017 and December 31, 2016. Accounts and notes receivable (current) – 7% increase from P=116,842 million to P=124,688 million Increase resulting from higher sales of ALI and reclassification from noncurrent receivables, higher sales of IMI, MWC, ACI/ Automotive and IMI’s consolidation of new subsidiaries partially offset by AC’s collection of dividends. This account is at 12% and 13% of the total assets as of September 30, 2017 and December 31, 2016, respectively. Other Current Assets – 38% increase from P=33,638 million to P=46,459 million Increase pertains to ALI group’s higher long-term money market placements (FVPL investments), prepayments and project costs; ACEHI’s, ACI’s higher prepayments for loan transaction costs and insurance; creditable withholding and input taxes; and BHL’s additional infusion in certain FVPL investments. This account is at 5% and 4% of the total assets as of September 30, 2017 and December 31, 2016, respectively. Accounts and notes receivable (non-current) – 9% decrease from P=36,484 million to P=33,092 million Decrease attributable to ALI’s partial sale of receivables to banks and reclassification of trade receivables to current accounts. This account is at 3% and 4% of the total assets as of September 30, 2017 and December 31, 2016, respectively.

S E C F O R M 1 7 - Q 70
Investments in associates & joint ventures – 12% increase from P=180,314 million to P=201,425 million Growth was attributable to new investments of ACEHI and AC Ventures; plus share in net earnings from BPI, Globe, and from existing investees of ALI; partially offset by BHL’s disposal of investments. This account is at 20% of the total assets as of September 30, 2017 and December 31, 2016. Investment Properties – 15% increase from P=110,917 million to P=127,339 million Increase related to ALI group’s expansion projects mainly on malls and office properties. This account is at 13% and 12% of the total assets as of September 30, 2017 and December 31, 2016, respectively. Property, plant and equipment – 27% increase from P=64,074 million to P=81,633 million Increase coming from ACEHI’s construction of power plants for GNP Kauswagan's coal investment; ALI’s capital expenditures (capex) for its hotels and resorts operations; and IMI’s new capex for Europe and Mexico sites; plus impact of consolidation of new subsidiaries of both ACEHI and IMI. This account is at 8% and 7% of the total assets as of September 30, 2017 and December 31, 2016, respectively. Service concession assets – 6% increase from P=82,422 million to P=87,555 million Increase attributable to MWC’s additional service concession assets. This account is at 9% of the total assets as of September 30, 2017 and December 31, 2016. Intangible assets – 51% increase from P=9,716 million to P=14,714 million Higher balance pertains to goodwill arising from IMI’s (P=2.9B on Surface Technology International Enterprises Limited) and ACEHI’s (P=1.6B for Visayas Renewable Corp., AC Energy DevCo Inc., Manapla Sun Power Development Corp.) new investment acquisitions during the period. This account is at 1% of the total assets as of September 30, 2017 and December 31, 2016. Pension and other noncurrent assets - 13% increase from P=25,847 million to P=29,190 million Increase due to ALI’s advances and project development costs; MWC’s higher balance of foreign currency adjustment and deposit for land acquisition; and BHL’s additional investment in AFS accounts; partially offset by ACEHI’s use of cash deposit to fund investment in an associate. The account also includes the Group’s pension asset amounting to P=194 million which has no significant movement for the period.1 This account is at 3% of the total assets as of September 30, 2017 and December 31, 2016. Short-term debt – 25% decrease from P=30,858 million to P=23,240 million Decrease was caused by net settlements of ALI group; partially offset by additional borrowings of the following subsidiaries: IMI (consolidation of new subsidiaries) and MWC (for bridge financing). This account is at 4% and 6% of the total liabilities as of September 30, 2017 and December 31, 2016, respectively. Income tax payable – 24% decrease from P=2,270 million to P=1,719 million Decline mainly arising from lower tax payable of ALI group for 3rd quarter of 2017 vs. last quarter of 2016. This account is less than 1% of the total liabilities as of September 30, 2017 and December 31, 2016. Long-term debt (current) – 32% decrease from P=19,793 million to P=13,545 million Decrease on account of AC’s settlement of bonds due 2017; partially offset by increase in loans due to additional borrowings of ALI, MWC and ACEHI including impact of revaluation of certain foreign currency denominated loans. This account is at 2% and 4% of the total liabilities as of September 30, 2017 and December 31, 2016, respectively. Other current liabilities – 15% increase from P=17,523 million to P=20,183 million Increase due to ALI’s and ACI/ Automotive’s higher customer deposits and IMI’s increase due to impact of consolidation of new subsidiaries. This account is at 3% of the total liabilities as of September 30, 2017 and December 31, 2016.
1 The Company's pension fund is known as the AC Employees Welfare and Retirement Fund (ACEWRF). ACEWRF is a legal entity separate and distinct from the Company, governed by a board of trustees appointed under a Trust Agreement between the Company and the initial trustees. It holds common and preferred shares of the Company in its portfolio. All such shares have voting rights under certain conditions, pursuant to law. ACEWRF's portfolio is managed by a committee appointed by the fund's trustees for that purpose. The members of the committee, all of whom are Managing Directors of the Company, are Jose Teodoro K. Limcaoco. (the Company's Chief Finance Officer, Chief Risk Officer & Finance Group Head), Solomon M. Hermosura (the Company's Group Head of Corporate Governance, General Counsel, Corporate Secretary & Compliance Officer), John Philip S. Orbeta (the Company’s Head for Strategic Human Resources), Ma. Cecilia T. Cruzabra (the Company’s Treasurer), and Josephine G. de Asis (the Company’s Comptroller). ACEWRF has not exercised voting rights over any shares of the Company that it owns.

S E C F O R M 1 7 - Q 71
Long-term debt (noncurrent) – 28% increase from P=245,203 million to P=314,591 million Increase contributed by bond issuance of AC, AYC and ALI; and long-term borrowings for expansion projects of ALI, ACEHI and MWC. This account is at 52% and 45% of the total liabilities as of September 30, 2017 and December 31, 2016, respectively. Deferred tax liabilities – 5% decrease from P=9,544 million to P=9,031 million Decrease attributable to MWC group decrease in DTL. This account is at 2% of the total liabilities as of September 30, 2017 and December 31, 2016. Pension liabilities1 – 7% decrease from P=2,469 million to P=2,304 million Decline primarily due to AC parent’s adjustment in its deferred tax assets, net of deferred tax liabilities. This account is at less than 1% of the total liabilities as of September 30, 2017 and December 31, 2016. Other noncurrent liabilities – 10% increase from P=40,870 million to P=45,071 million Increase primarily due to ALI’s higher real estate deposits; plus IMI’s higher balances arising from consolidation of new subsidiaries. This account is at 7% and 8% of the total liabilities as of September 30, 2017 and December 31, 2016, respectively. Cost of share based payments – 44% decrease from P=496 million to P=280 million Decrease pertains to exercise of stock ownership plans granted during the period. This account is at less than 1% of the total equity as of September 30, 2017 and December 31, 2016. Net unrealized gains (losses) on available-for-sale financial assets – 104% decline from negative P=467 million to negative P=950 million Decline pertains mainly to realized gain recognized in P&L by BHL upon disposal of certain AFS investments; partially offset by increase in the market value of securities held by BPI group as AFS financial assets. This account is at less than 1% of the total equity as of September 30, 2017 and December 31, 2016. Cumulative translation adjustments - 125% increase from P=1,415 million to P=3,180 million Increase due to upward impact of net foreign assets, significantly coming from ACEHI, MWC and IMI groups. Forex of PhP= vs US$ increased causing higher CTA figure (P50.815 in September 2017 vs. P49.72 in December 2016). This account is at less than 1% of the total equity as of September 30, 2017 and December 31, 2016. Equity Reserve - 7% decrease from P=12,211 million to P=11,362 million Decrease related to equity investments of ALI (POPI and CHI) and IMI (STI). This account is at 3% of the total equity as of September 30, 2017 and December 31, 2016. Retained earnings – 14% increase from P=145,622 million to P=166,708 million Increase represents share in Q3 2017 group net income net of dividends declared. This account is at 41% and 39% of the total equity as of September 30, 2017 and December 31, 2016, respectively. Non-controlling interests – 8% increase from P=140,073 million to P=150,980 million Higher amount represents share in Q3 2017 group net income and OCI net of dividends declared by subsidiaries to its non-controlling interests. This account is at 37% and 38% of the total equity as of September 30, 2017 and December 31, 2016, respectively. Income Statement items
For the Period Ended September 30, 2017 (Unaudited) vs. September 30, 2016 (Unaudited) Sale of goods and rendering services – 22% increase from a total of P=140,079 million to P=170,470 million Growth in sale of goods came primarily from higher sales of ALI group coming from higher lot sales, all segment of housing, residential and condo units; higher sales of IMI group primarily coming from the consolidation of its new subsidiary and its automotive electronics and industrial segment; higher sales of ACI/ Automotive group attributable to higher vehicle sales across brands. Higher revenues from rendering of services of ACEHI group primarily coming from consolidation of new subsidiary and higher revenues of existing and new businesses. As a percentage to total income, this account is at 85% in September 30, 2017 and 2016. Interest income – 7% decrease from P=5,079 million to P=4,747 million Decrease related to decline in investible funds by ALI and AC/AYC groups. This account is at 2% and 3% of the total income in September 30, 2017 and 2016, respectively.
S E C F O R M 1 7 - Q 72
Other income – 87% increase from P=6,451 million to P=12,086 million Increase due to MWC’s higher rehabilitation works (P=3.3B increase year on year); ACEHI’s fee from services rendered that marked the financial closing and construction of power project (P=756M) and higher dividend income; ALI’s higher management and marketing fees and investment gain; BHL’s investments gain (P=665M), and IMI’s forex gain (P=215M). This account is at 6% and 4% of the total income in September 30, 2017 and 2016, respectively. Cost of sales and rendering services – 24% increase from P=98,978 million to P=122,486 million Increase resulting from higher sales of ALI arising from lot sales and residential units, and higher sales of ACI and higher service revenues of ACEHI. As a percentage to total costs and expenses, this account is at 79% in September 30, 2017 and 2016. General and administrative expenses – 20% increase from P=12,904 million to P=15,424 million Increase mainly on combined increments in the group’s expenses specifically from: ALI (contracted services, communication, retirement and trainings), AC, ACEHI and MWC (manpower and insurance costs plus depreciation expenses), ACI/ Automotive (marketing and promo expenses) and IMI (manpower costs, professional/ management fees) including impact of consolidation of new subsidiaries of IMI and ACEHI. As a percentage to total costs and expenses, this account is at 10% in both September 30, 2017 and 2016. Interest expense and other financing charge – 5% increase from P=10,257 million to P=10,795 million Increase attributable to higher loans of ALI and ACEHI groups to fund new and expansion projects. As a percentage to total costs and expenses, this account is at 7% and 8% in September 30, 2017 and 2016, respectively. Other charges – 72% increase from P=3,458 million to P=5,934 million Increase mainly on higher rehabilitation works costs of MWC (P=3.3B increase year on year); partially offset AC’s by reversal of impairment provisions for certain investments as there was improvement in its value. As a percentage to total costs and expenses, this account is at 4% and 3% both in September 30, 2017 and 2016, respectively. Provision for income tax (current and deferred) – 20% increase from P=7,310 million to P=8,756million Increase primarily due to higher taxable income of several subsidiaries significant portion is attributable to ALI group on account of better sales and other operating results. Income attributable to Owners of the parent – 18% increase from P=19,646 million to P=23,235 million Increase resulting from better performance of most subsidiaries of the Group. Income attributable to Non-controlling interests – 16% increase from P=12,835 million to P=14,902 million Increase resulting from better operating results of most of the subsidiaries of the Group.
2.9 Any seasonal aspects that had a material effect on the financial condition or results of operations.
Ayala Corporation being a holding company has no seasonal aspects that will have any material effect on its financial condition or operational results. ALI’s leasing portfolio generates a fairly stable stream of revenues throughout the year, with higher sales experienced in the fourth quarter from shopping centers due to holiday spending. ALI's development operations do not show any seasonality. Projects are launched anytime of the year depending on several factors such as completion of plans and permits and appropriate timing in terms of market conditions and strategy. Development and construction work follow target completion dates committed at the time of project launch. MWC group does not have any significant seasonality or cyclicality in the interim operation, except for the usually higher demand during the months of April and May and in the months of November to December in the case of Globe group. BPI, IMI and other subsidiaries of the Group do not have seasonal aspects that will have any material effect to their financials or operations.

S E C F O R M 1 7 - Q 73
3.0 Any material events subsequent to the end of the interim period that have not been reflected in the financial statements for the interim period. Refer to Note 22 of the Notes to Unaudited Interim Condensed Consolidated Financial Statements.
3.1 Other material events or transactions during the interim period. Refer to Notes 3 and 10 of the Notes to Unaudited Interim Condensed Consolidated Financial Statements.

S E C F O R M 1 7 - Q 74
PART II – OTHER INFORMATION
The other major information about the Group are disclosed in the appropriate notes in the previously filed Audited Consolidated Financial Statements for December 31, 2016 or in the SEC 17A / SEC 17Q and SEC 17-C reports for 2017. In addition, the Group has the following other major information: 1. On January 5, 2017, the Company, in compliance with SEC Memoranda 1 and 12, Series of 2014,
advised the changes made in the 2016 Annual Corporate Governance Report (ACGR). The updated ACGR may be accessed from the Company’s website through the following link: http://www.ayala.com.ph/governance/page/annual-corporate-governance-report. On May 9, 2017, the Company, in compliance with the SEC Memorandum Circular No. 20, series of 2016, submitted the ACGR for the year 2016. On May 31, 2017, the Company, in compliance with SEC Memorandum Circular No. 19, Series of 2016, submitted the revised and updated Corporate Governance Manual which was approved by the Executive Committee on May 23, 2017.
2. On February 23, 2017, the Company issued a press statement about the Group’s increasing the capital expenditures in 2017 by 13% to P185 billion, primarily to support the growth strategies of its real estate, telecommunications and water units and ramp up its emerging businesses in power, industrial technologies, healthcare, and education. A large portion of this amount was from ALI, which has set aside ₱88 billion mainly to bankroll the completion of its residential, office for sale and leasing projects.
Furthermore, a significant driver of the conglomerate’s capital spending plan this year was Globe, which has allocated ₱37.5 billion to drive its data network infrastructure upgrades, including expenditures for deployments of LTE mobile and home broadband, expansion of network capacities and coverage, and enhancement of corporate data services. At the parent level, Ayala will deploy ₱21 billion in capital spending, mainly to support the expansion plans of its power unit, ACEHI. Meanwhile, MWC has budgeted ₱20 billion to support its initiatives in the Manila Concession as well as its expansion plans outside Metro Manila. The rest of the Ayala group’s capital expenditures will be deployed across AC Industrials, BPI, AC Health, and AC Education.
3. On March 13, 2017, in a press statement, the Company reported a net income of ₱26 billion in full year 2016, 17% higher than the previous year, on the back of double-digit growth contributions from its real estate and banking units, boosted by its emerging businesses in power and industrial technologies.
On May 11, 2017, in a press statement, the Company reported that its net income expanded 20% in Q1 2017 to ₱6.9 billion driven by the robust results of its banking and real estate businesses, as well as the solid earnings of its emerging businesses in power and industrial technologies. On August 11, 2017, in a press statement, the Company reported that its net income expanded 9% in the first half of the year to ₱15.1 billion year-on-year, primarily driven by the solid contributions of its real estate and power generation businesses.
4. On April 3, 2017, the Company clarified the news article entitled, “Ayala also looking at logistics business” published in Manila Standard (Internet Edition) on April 2, 2017. The Company confirmed that it is studying the logistics needs of its business units and have evaluated the spaces which the Company is interested to participate in. However, the Company clarified that these are all exploratory and no deal is imminent at this time.
5. On April 5, 2017, the SEC approved the Company's application for extending the term of the corporate existence of the Company to another fifty (50) years from January 22, 2018.
6. On April 20, 2017, the Company, in compliance with the SEC Memorandum Circular No. 5, Series of 2017, submitted the Definitive Information Statement and Certifications of the following nominees for independent directors for the Annual Stockholders’ Meeting scheduled for April 21, 2017.
a. Xavier P. Loinaz

S E C F O R M 1 7 - Q 75
b. Antonio Jose U. Periquet; and c. Ramon R. Del Rosario, Jr.
7. On April 21, 2017, at the annual meeting of the Company’s stockholders, the following are the major
items approved: a. Approval of minutes of the annual stockholders’ meeting held on April 15, 2016. b. Approval of Corporation’s Annual Report, which consists of the Chairman’s Message, President’s
Report, and the audio-visual presentation to the stockholders, and to approve the consolidated audited financial statements of the Corporation and its subsidiaries as of December 31, 2016, as audited by the Corporation’s external auditor SyCip Gorres Velayo & Co.
c. Election of the following as directors effective immediately and until their successors are elected and qualified:
Jaime Augusto Zobel de Ayala Fernando Zobel de Ayala Ramon R. Del Rosario, Jr. Delfin L. Lazaro Xavier P. Loinaz Antonio Jose U. Periquet Keiichi Matsunaga Messrs. del Rosario, Jr., Loinaz and Periquet were elected as independent directors in accordance with the rules of the Securities and Exchange Commission on the requirements for nomination and election of independent directors.
d. Election of SyCip, Gorres, Velayo & Co. as the external auditors of our Company for the year 2017.
At its organizational meeting held immediately after the stockholders’ meeting, the Company’s BOD elected the following: a. Board Committees and Memberships:
Executive Committee Jaime Augusto Zobel de Ayala Chairman Fernando Zobel de Ayala Vice Chairman Keiichi Matsunaga Member Audit Committee Xavier P. Loinaz (independent director) Chairman Ramon R. del Rosario, Jr. (independent director) Member Keiichi Matsunaga Member Risk Management and Related Party Transactions Committee Antonio Jose U. Periquet (independent director) Chairman Ramon R. del Rosario, Jr. (independent director) Member Keiichi Matsunaga Member Corporate Governance and Nomination Committee* Ramon R. del Rosario, Jr. (independent director) Chairman Xavier P. Loinaz (independent director) Member Antonio Jose U. Periquet (independent director) Member (*Reconstituted from previous Nomination Committee per 2017 revised and updated Corporate Governance Manual)
Personnel and Compensation Committee Ramon R. del Rosario, Jr. (independent director) Chairman Delfin L. Lazaro Member Keiichi Matsunaga Member Finance Committee Delfin L. Lazaro Chairman Antonio Jose U. Periquet (independent director) Member Jaime Augusto Zobel de Ayala Member Fernando Zobel de Ayala Member

S E C F O R M 1 7 - Q 76
Committee of Inspectors of Proxies and Ballots Solomon M. Hermosura Chairman Catherine H. Ang Member Josephine G. De Asis Member
b. Mr. Xavier P. Loinaz as lead independent director.
c. Officers: Jaime Augusto Zobel de Ayala - Chairman & Chief Executive Officer Fernando Zobel de Ayala - Vice Chairman, President and Chief Operating Officer Gerardo C. Ablaza, Jr. - Senior Managing Director Cezar P. Consing - Senior Managing Director Bernard Vincent O. Dy - Senior Managing Director Arthur R. Tan - Senior Managing Director Jose Rene Gregory D. Almendras - Managing Director and Public Affairs Group Head Alfredo I. Ayala - Managing Director Paolo Maximo F. Borromeo - Managing Director & Corporate Strategy and Development Group Head John Eric T. Francia - Managing Director Solomon M. Hermosura - Managing Director, General Counsel, Corporate Secretary, Compliance Officer, Data Protection Officer & Corporate Governance Group Head Jose Teodoro K. Limcaoco - Managing Director, Chief Finance Officer, Chief Risk Officer, Chief Sustainability Officer, and Finance Group Head Ruel T. Maranan - Managing Director John Philip S. Orbeta - Managing Director, Chief Human Resources Officer, and Corporate Resources Group Head Catherine H. Ang - Executive Director and Chief Audit Executive Ma. Cecilia T. Cruzabra - Executive Director and Treasurer Josephine G. De Asis - Executive Director and Controller Dodjie D. Lagazo - Assistant Corporate Secretary Joanne M. Lim - Assistant Corporate Secretary
d. Ayala Group of Companies Management Committee Jaime Augusto Zobel de Ayala - Chairman and Chief Executive Officer, Ayala Corporation Fernando Zobel de Ayala - Vice Chairman, President and Chief Operating Officer, Ayala Corporation Jose Rene Gregory D. Almendras - President, AC Infrastructure Holdings Corporation Alfredo I. Ayala - President, AC Education, Inc. Paolo Maximo F. Borromeo - Corporate Strategy and Development Group Head, Ayala Corporation Cezar P. Consing - President, Bank of the Philippine Islands Ernest Lawrence L. Cu - President, Globe Telecom, Inc. Ferdinand M. Dela Cruz - President, Manila Water Company, Inc. Bernard Vincent O. Dy - President, Ayala Land, Inc. John Eric T. Francia - President, AC Energy Holdings, Inc. Solomon M. Hermosura - General Counsel, Corporate Secretary, Compliance Officer,
Data Protection Officer & Corporate Governance Group Head, Ayala Corporation
Jose Teodoro K. Limcaoco - Chief Finance Officer, Chief Risk Officer, Chief Sustainability Officer & Finance Group Head, Ayala Corporation Ruel T. Maranan - President, Ayala Foundation, Inc. John Philip S. Orbeta - Chief Human Resources Officer & Corporate Resources Group Head, Ayala Corporation Arthur R. Tan - President, AC Industrial Technology Holdings, Inc.
e. Ayala Corporation Management Committee Jaime Augusto Zobel de Ayala Fernando Zobel de Ayala Jose Rene Gregory D. Almendras Paolo Maximo F. Borromeo

S E C F O R M 1 7 - Q 77
John Eric T. Francia Solomon M. Hermosura Jose Teodoro K. Limcaoco John Philip S. Orbeta
8. On April 21, 2017, the BOD approved the Company’s 2017 stock option program pursuant to its
Employee Stock Ownership Plan (the “Plan”). The program authorizes the grant to 42 executives, in accordance with the terms of the Plan, stock options covering up to a total of 818,083 common shares at a subscription price of P837.53 per share, which is the volume-weighted average prices of its common shares at the Philippine Stock Exchange over the last 30-day trading from March 3 to April 17, 2017.
On May 22, 2017, 32 grantees subscribed to 456,286 common shares at P837.53 per share. As a result of the subscription, the number of outstanding common shares is now 621,190,284.
9. On April 30, 2017, the Company fully redeemed its P10.0 B, 7.20% Fixed Rate Puttable Bonds
issued last April 30, 2010.
10. On May 31, 2017, the Company advised of the retirement of Mr. Gerardo C. Ablaza, Jr. as Senior Managing Director effective on the same date. He will continue to serve the Company as consultant and as a member of the BOD of certain companies in the group, such as Manila Water Company Inc., Bank of the Philippine Islands, AC Energy Holdings Inc., and AC Infrastructure Holdings Corporation.
11. On June 22, 2017, the BOD, at its regular meeting, approved the declaration of regular dividend of P3.46 per common share. The record date is July 7, 2017, and payment date is July 22, 2017. This cash dividend is for the first semester ending June 30, 2017.
12. On June 22, 2017, the BOD at its regular meeting, approved the Company’s filing of a three-year shelf registration with the SEC of up to P30.0 billion in principal amount of debt securities in one or more tranches and under such terms as may be determined by the Company within such period and in accordance with the SEC rules. The securities will be sold through general public offerings. Relevant documents and information will be filed with the pertinent regulatory agencies in due course.
13. On October 23, 2017, Mermac Inc. (Mermac), the holding company of the Zobel family, sold a portion of its holdings in the Company equivalent to 7,063,490 common shares or 0.86% of the Company's total outstanding voting shares to a foreign institutional investor.
The shares were sold through a block sale that arose from a reverse inquiry from that single foreign institutional investor. After the transaction, Mermac will hold 47.75% of the Company's common shares and 55.56% of voting shares, remaining as the Company's largest shareholder. The transaction was executed by BPI Securities Corporation and UBS Securities Philippines Inc.