Embed Size (px)
Citation preview
UNITED STATES
SECURITIES AND EXCHANGE COMMISSION
Washington, D.C. 20549
FORM 10-K ANNUAL REPORT PURSUANT TO SECTION 13 OR 15(D) OF THE SECURITIES EXCHANGE ACT OF 1934
FOR THE FISCAL YEAR ENDED MAY 31, 2011 OR
TRANSITION REPORT PURSUANT TO SECTION 13 OR 15(D) OF THE SECURITIES EXCHANGE ACT OF 1934 FOR THE TRANSITION PERIOD FROM ______________ TO ______________
Commission File No. 1-10635
NIKE, INC. (Exact name of Registrant as specifi ed in its charter)
OREGON 93-0584541(State or other jurisdiction of incorporation) (IRS Employer Identifi cation No.)
One Bowerman Drive Beaverton, Oregon 97005-6453(Address of principal executive offi ces) (Zip Code)
(503) 671-6453(Registrant’s Telephone Number, Including Area Code)
SECURITIES REGISTERED PURSUANT TO SECTION 12(B) OF THE ACT:
Class B Common Stock New York Stock Exchange(Title of Each Class) (Name of Each Exchange on Which Registered)
SECURITIES REGISTERED PURSUANT TO SECTION 12(G) OF THE ACT:
NONE
Indicate by check mark YES NO
• if the registrant is a well-known seasoned issuer, as defi ned in Rule 405 of the Securities Act.
• if the registrant is not required to fi le reports pursuant to Section 13 or Section 15(d) of the Act.
• whether the Registrant (1) has fi led all reports required to be fi led by Section 13 or 15(d) of the Securities
Exchange Act of 1934 during the preceding 12 months (or for such shorter period that the Registrant was
required to fi le such reports), and (2) has been subject to such fi ling requirements for the past 90 days.
• whether the registrant has submitted electronically and posted on its corporate Website, if any, every Interactive Data
File required to be submitted and posted pursuant to Rule 405 of Regulation S-T (§229.405 of this chapter) during
the preceding 12 months (or for such shorter period that the registrant was required to submit and post such fi les).
• if disclosure of delinquent fi lers pursuant to Item 405 of Regulation S-K (§229.405 of this chapter) is not contained
herein, and will not be contained, to the best of Registrant’s knowledge, in defi nitive proxy or information
statements incorporated by reference in Part III of this Form 10-K or any amendment to this Form 10-K.
• whether the Registrant is a large accelerated fi ler, an accelerated fi ler, a non-accelerated fi ler, or a smaller reporting company. See the defi nitions
of “large accelerated fi ler,” “accelerated fi ler” and “smaller reporting company” in Rule 12b-2 of the Exchange Act.
Large accelerated fi ler Accelerated fi ler Non-accelerated fi ler Smaller reporting company
• whether the registrant is a shell company (as defi ned in Rule 12b-2 of the Act).
As of November 30, 2010, the aggregate market value of the Registrant’s Class A Common Stock held by non-affi liates of the Registrant
was $2,005,831,959 and the aggregate market value of the Registrant’s Class B Common Stock held by non-affi liates of the Registrant was
$33,459,424,185.
As of July 18, 2011, the number of shares of the Registrant’s Class A Common Stock outstanding was 89,989,447 and the number of shares
of the Registrant’s Class B Common Stock outstanding was 384,840,843.
DOCUMENTS INCORPORATED BY REFERENCE:
Parts of Registrant’s Proxy Statement for the Annual Meeting of Shareholders to be held on September 19, 2011 are incorporated by
reference into Part III of this Report.
Table of contents
PART I 3
ITEM 1 Business ..................................................................................................................................................................................................................................................................................................3
ITEM 1A Risk Factors ......................................................................................................................................................................................................................................................................................8
ITEM 1B Unresolved Staff Comments ..........................................................................................................................................................................................................................13
ITEM 2 Properties ..........................................................................................................................................................................................................................................................................................13
ITEM 3 Legal Proceedings ............................................................................................................................................................................................................................................................13
ITEM 4 Reserved ............................................................................................................................................................................................................................................................................................13
PART II 14
ITEM 5 Market for Registrant’s Common Equity, Related Stockholder Matters
and Issuer Purchases of Equity Securities ...........................................................................................................................................................................14
ITEM 6 Selected Financial Data ..........................................................................................................................................................................................................................................16
ITEM 7 Management’s Discussion and Analysis of Financial Condition and Results of Operations .....17
ITEM 7A Quantitative and Qualitative Disclosures about Market Risk ............................................................................................................32
ITEM 8 Financial Statements and Supplemental Data ............................................................................................................................................................33
ITEM 9 Changes in and Disagreements with Accountants on Accounting and Financial Disclosure .....58
ITEM 9A Controls and Procedures ......................................................................................................................................................................................................................................58
ITEM 9B Other Information ................................................................................................................................................................................................................................................................58
PART III 59
ITEM 10 Directors, Executive Offi cers and Corporate Governance .....................................................................................................................59
ITEM 11 Executive Compensation ...................................................................................................................................................................................................................................59
ITEM 12 Security Ownership of Certain Benefi cial Owners and Management
and Related Stockholder Matters .......................................................................................................................................................................................................59
ITEM 13 Certain Relationships and Related Transactions, and Director Independence ................................................59
ITEM 14 Principal Accountant Fees and Services ...............................................................................................................................................................................59
PART IV 60
ITEM 15 Exhibits and Financial Statement Schedules ...................................................................................................................................................................60
SIGNATURES ..........................................................................................................................................................................................................................................................................................................................63
3NIKE, INC. - Form 10-K
PART I ITEM 1 Business
PART I
ITEM 1 Business
General
NIKE, Inc. was incorporated in 1968 under the laws of the state of Oregon.
As used in this report, the terms “we”, “us”, “NIKE” and the “Company” refer
to NIKE, Inc. and its predecessors, subsidiaries and affi liates, unless the
context indicates otherwise. Our Internet address is www.nike.com. On our
NIKE Corporate web site, located at www.nikebiz.com, we post the following
fi lings as soon as reasonably practicable after they are electronically fi led with
or furnished to the Securities and Exchange Commission: our annual report
on Form 10-K, our quarterly reports on Form 10-Q, our current reports on
Form 8-K and any amendments to those reports fi led or furnished pursuant
to Section 13(a) or 15(d) of the Securities and Exchange Act of 1934, as
amended. All such fi lings on our NIKE Corporate web site are available free
of charge. Also available on the NIKE Corporate web site are the charters of
the committees of our board of directors, as well as our corporate governance
guidelines and code of ethics; copies of any of these documents will be
provided in print to any shareholder who submits a request in writing to NIKE
Investor Relations, One Bowerman Drive, Beaverton, Oregon 97005-6453.
Our principal business activity is the design, development and worldwide
marketing and selling of high quality footwear, apparel, equipment, and
accessory products. NIKE is the largest seller of athletic footwear and athletic
apparel in the world. We sell our products to retail accounts, through NIKE-
owned retail stores and internet sales, which we refer to as our “Direct to
Consumer” operations, and through a mix of independent distributors and
licensees, in over 170 countries around the world. Virtually all of our products
are manufactured by independent contractors. Virtually all footwear and apparel
products are produced outside the United States, while equipment products
are produced both in the United States and abroad.
Products
NIKE’s athletic footwear products are designed primarily for specifi c athletic
use, although a large percentage of the products are worn for casual or leisure
purposes. We place considerable emphasis on high quality construction and
innovation in products designed for men, women and children. Running,
training, basketball, soccer, sport-inspired casual shoes, and kids’ shoes
are currently our top-selling footwear categories and we expect them to
continue to lead in product sales in the near future. We also market footwear
designed for baseball, cheerleading, football, golf, lacrosse, outdoor activities,
skateboarding, tennis, volleyball, walking, wrestling, and other athletic and
recreational uses.
We sell sports apparel and accessories covering most of the above categories,
sports-inspired lifestyle apparel, as well as athletic bags and accessory
items. NIKE apparel and accessories feature the same trademarks and
are sold through the same marketing and distribution channels. We often
market footwear, apparel and accessories in “collections” of similar design
or for specifi c purposes. We also market apparel with licensed college and
professional team and league logos.
We sell a line of performance equipment under the NIKE Brand name,
including bags, socks, sport balls, eyewear, timepieces, electronic devices,
bats, gloves, protective equipment, golf clubs, and other equipment designed
for sports activities. We also sell small amounts of various plastic products
to other manufacturers through our wholly-owned subsidiary, NIKE IHM, Inc.
In addition to the products we sell directly to customers through our Direct to
Consumer operations, we have entered into license agreements that permit
unaffi liated parties to manufacture and sell certain apparel, electronic devices
and other equipment designed for sports activities.
Our wholly-owned subsidiary, Cole Haan (“Cole Haan”), headquartered in New
York, New York, designs and distributes dress and casual footwear, apparel
and accessories for men and women under the Cole Haan® trademark.
Our wholly-owned subsidiary, Converse Inc. (“Converse”), headquartered in
North Andover, Massachusetts, designs, distributes and licenses athletic and
casual footwear, apparel and accessories under the Converse®, Chuck Taylor®,
All Star®, One Star®, Star Chevron and Jack Purcell® trademarks.
Our wholly-owned subsidiary, Hurley International LLC (“Hurley”), headquartered
in Costa Mesa, California, designs and distributes a line of action sports
and youth lifestyle apparel and accessories under the Hurley® trademark.
Our wholly-owned subsidiary, Umbro International Limited (“Umbro”),
headquartered in Cheadle, United Kingdom, designs, distributes and licenses
athletic and casual footwear, apparel and equipment, primarily for the sport
of football (soccer), under the Umbro® trademark.
Sales and Marketing
Financial information about geographic and segment operations appears
in Note 18 of the accompanying Notes to the Consolidated Financial Statements
on page 55.
We experience moderate fl uctuations in aggregate sales volume during
the year. Historically, revenues in the fi rst and fourth fi scal quarters have
slightly exceeded those in the second and third quarters. However, the mix of
product sales may vary considerably as a result of changes in seasonal and
geographic demand for particular types of footwear, apparel and equipment.
4 NIKE, INC. - Form 10-K
PART I ITEM 1 Business
Because NIKE is a consumer products company, the relative popularity
of various sports and fi tness activities and changing design trends affect
the demand for our products. We must therefore respond to trends and shifts
in consumer preferences by adjusting the mix of existing product offerings,
developing new products, styles and categories, and infl uencing sports and
fi tness preferences through aggressive marketing. Failure to respond in a timely
and adequate manner could have a material adverse effect on our sales and
profi tability. This is a continuing risk.
We report our NIKE Brand operations based on our internal geographic
organization. Each NIKE Brand geography operates predominantly in one
industry: the design, development, marketing and selling of athletic footwear,
apparel, and equipment. Effective June 1, 2009, we began operating under
our new organizational structure for the NIKE Brand, which consists of the
following six geographies: North America, Western Europe, Central & Eastern
Europe, Greater China, Japan, and Emerging Markets. Previously, NIKE
Brand operations were organized into the following four geographic regions:
U.S., Europe, Middle East and Africa (collectively, “EMEA”), Asia Pacifi c, and
Americas. Our NIKE Brand Direct to Consumer operations are managed within
each geographic segment.
United States Market
In fi scal 2011, sales in the United States including U.S. sales of our Other
Businesses accounted for approximately 43% of total revenues, compared to
42% in fi scal 2010 and 2009. Our Other Businesses were primarily comprised
of our affi liate brands; Cole Haan, Converse, Hurley and Umbro (which was
acquired on March 3, 2008); and NIKE Golf. We estimate that we sell to more
than 20,000 retail accounts in the United States. The NIKE Brand domestic
retail account base includes a mix of footwear stores, sporting goods stores,
athletic specialty stores, department stores, skate, tennis and golf shops,
and other retail accounts. During fi scal 2011, our three largest customers
accounted for approximately 23% of sales in the United States.
We make substantial use of our “futures” ordering program, which allows
retailers to order fi ve to six months in advance of delivery with the commitment
that their orders will be delivered within a set time period at a fi xed price.
In fi scal 2011, 87% of our U.S. wholesale footwear shipments (excluding our
Other Businesses) were made under the futures program, compared to 89%
in fi scal 2010 and 2009. In fi scal 2011, 60% of our U.S. wholesale apparel
shipments (excluding our Other Businesses) were made under the futures
program, compared to 62% in fi scal 2010 and 60% in fi scal 2009.
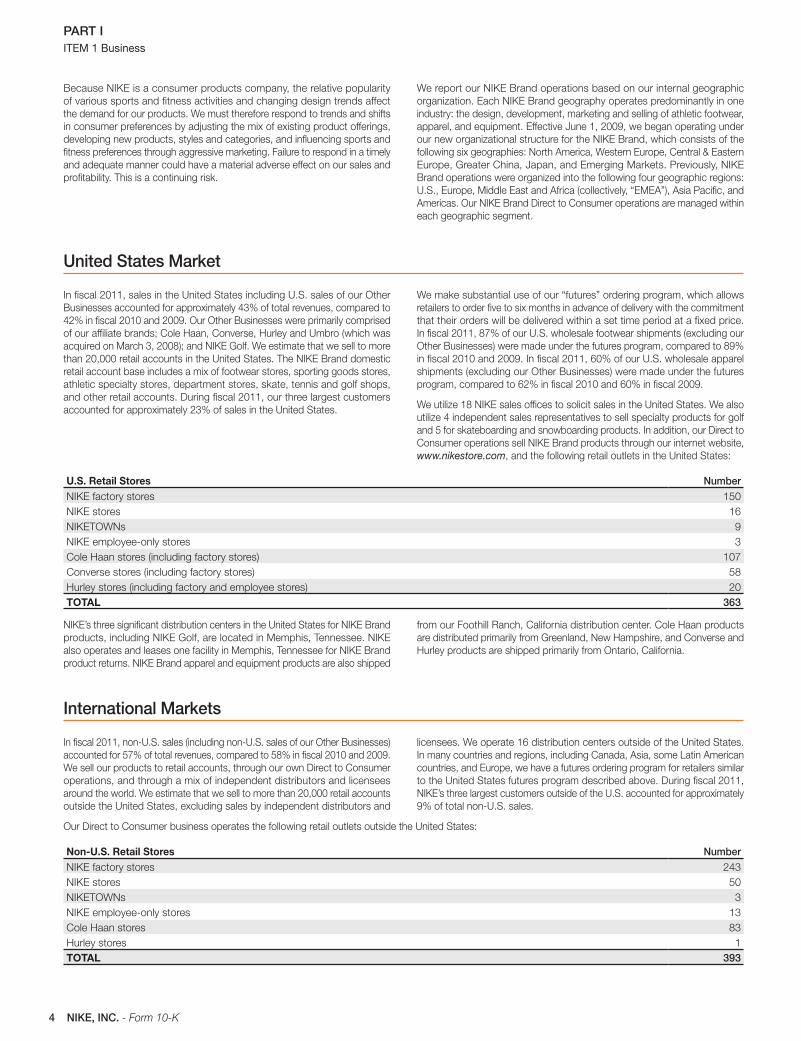
We utilize 18 NIKE sales offi ces to solicit sales in the United States. We also
utilize 4 independent sales representatives to sell specialty products for golf
and 5 for skateboarding and snowboarding products. In addition, our Direct to
Consumer operations sell NIKE Brand products through our internet website,
www.nikestore.com, and the following retail outlets in the United States:
U.S. Retail Stores NumberNIKE factory stores 150
NIKE stores 16
NIKETOWNs 9
NIKE employee-only stores 3
Cole Haan stores (including factory stores) 107
Converse stores (including factory stores) 58
Hurley stores (including factory and employee stores) 20
TOTAL 363
NIKE’s three signifi cant distribution centers in the United States for NIKE Brand
products, including NIKE Golf, are located in Memphis, Tennessee. NIKE
also operates and leases one facility in Memphis, Tennessee for NIKE Brand
product returns. NIKE Brand apparel and equipment products are also shipped
from our Foothill Ranch, California distribution center. Cole Haan products
are distributed primarily from Greenland, New Hampshire, and Converse and
Hurley products are shipped primarily from Ontario, California.
International Markets
In fi scal 2011, non-U.S. sales (including non-U.S. sales of our Other Businesses)
accounted for 57% of total revenues, compared to 58% in fi scal 2010 and 2009.
We sell our products to retail accounts, through our own Direct to Consumer
operations, and through a mix of independent distributors and licensees
around the world. We estimate that we sell to more than 20,000 retail accounts
outside the United States, excluding sales by independent distributors and
licensees. We operate 16 distribution centers outside of the United States.
In many countries and regions, including Canada, Asia, some Latin American
countries, and Europe, we have a futures ordering program for retailers similar
to the United States futures program described above. During fi scal 2011,
NIKE’s three largest customers outside of the U.S. accounted for approximately
9% of total non-U.S. sales.
Our Direct to Consumer business operates the following retail outlets outside the United States:
Non-U.S. Retail Stores NumberNIKE factory stores 243
NIKE stores 50
NIKETOWNs 3
NIKE employee-only stores 13
Cole Haan stores 83
Hurley stores 1
TOTAL 393
5NIKE, INC. - Form 10-K
PART I ITEM 1 Business
International branch offi ces and subsidiaries of NIKE are located in Argentina,
Australia, Austria, Belgium, Bermuda, Brazil, Canada, Chile, China, Croatia,
Cyprus, the Czech Republic, Denmark, Finland, France, Germany, Greece,
Hong Kong, Hungary, Indonesia, India, Ireland, Israel, Italy, Japan, Korea,
Lebanon, Macau, Malaysia, Mexico, New Zealand, the Netherlands, Norway,
the Philippines, Poland, Portugal, Russia, Singapore, Slovakia, Slovenia, South
Africa, Spain, Sri Lanka, Sweden, Switzerland, Taiwan, Thailand, Turkey,
the United Arab Emirates, the United Kingdom, Uruguay and Vietnam.
Signifi cant Customer
No customer accounted for 10% or more of our net sales during fi scal 2011.
Orders
Worldwide futures and advance orders for NIKE Brand athletic footwear and
apparel, scheduled for delivery from June through November 2011, were
$10.3 billion compared to $8.8 billion for the same period last year. This futures
and advance order amount is calculated based upon our forecast of the actual
exchange rates under which our revenues will be translated during this period,
which approximate current spot rates. Reported futures and advance orders are
not necessarily indicative of our expectation of revenues for this period. This is
because the mix of orders can shift between futures/advance and at-once
orders and the fulfi llment of certain of these futures/advance orders may fall
outside of the scheduled time period noted above. In addition, foreign currency
exchange rate fl uctuations as well as differing levels of order cancellations
and discounts can cause differences in the comparisons between futures and
advance orders and actual revenues. Moreover, a signifi cant portion of our
revenue is not derived from futures and advance orders, including at-once
and close-out sales of NIKE Brand footwear and apparel, sales of NIKE Brand
equipment, sales from our Direct to Consumer operations, and sales from
our Other Businesses.
Product Research and Development
We believe our research and development efforts are a key factor in our
past and future success. Technical innovation in the design of footwear,
apparel, and athletic equipment receive continued emphasis as NIKE strives
to produce products that help to reduce injury, enhance athletic performance
and maximize comfort.
In addition to NIKE’s own staff of specialists in the areas of biomechanics,
chemistry, exercise physiology, engineering, industrial design, and related
fi elds, we also utilize research committees and advisory boards made up of
athletes, coaches, trainers, equipment managers, orthopedists, podiatrists,
and other experts who consult with us and review designs, materials, concepts
for product improvements and compliance with product safety regulations
around the world. Employee athletes, athletes engaged under sports marketing
contracts and other athletes wear-test and evaluate products during the design
and development process.
Manufacturing
Virtually all of our footwear is produced by factories we contract with outside of
the United States. In fi scal 2011, contract factories in Vietnam, China, Indonesia,
and India manufactured approximately 39%, 33%, 24% and 2% of total NIKE
Brand footwear, respectively. We also have manufacturing agreements with
independent factories in Argentina, Brazil, India, and Mexico to manufacture
footwear for sale primarily within those countries. The largest single footwear
factory that we have contracted with accounted for approximately 6% of
total fi scal 2011 NIKE Brand footwear production. Almost all of NIKE Brand
apparel is manufactured outside of the United States by independent contract
manufacturers located in 33 countries. Most of this apparel production
occurred in China, Thailand, Vietnam, Malaysia, Sri Lanka, Indonesia, Turkey,
Cambodia, El Salvador, and Mexico. The largest single apparel factory that
we have contracted with accounted for approximately 7% of total fi scal 2011
apparel production.
The principal materials used in our footwear products are natural and synthetic
rubber, plastic compounds, foam cushioning materials, nylon, leather, canvas,
and polyurethane fi lms used to make Air-Sole cushioning components. During
fi scal 2011, NIKE IHM, Inc., a wholly-owned subsidiary of NIKE, as well as
independent contractors in China and Taiwan, were our largest suppliers of the
Air-Sole cushioning components used in footwear. The principal materials used
in our apparel products are natural and synthetic fabrics and threads, plastic
and metal hardware, and specialized performance fabrics designed to repel
rain, retain heat, or effi ciently transport body moisture. NIKE’s independent
contractors and suppliers buy raw materials in bulk for the manufacturing
of our footwear, apparel and equipment products. Most raw materials are
available and purchased by those independent contractors and suppliers in
the countries where manufacturing takes place. We have thus far experienced
little diffi culty in satisfying our raw material requirements.
Since 1972, Sojitz Corporation of America (“Sojitz America”), a large Japanese
trading company and the sole owner of our redeemable preferred stock, has
performed signifi cant import-export fi nancing services for us. During fi scal 2011,
Sojitz America provided fi nancing and purchasing services for NIKE Brand
products sold in Argentina, Uruguay, Canada, Brazil, India, Indonesia, the
Philippines, Malaysia, South Africa, China, Korea, and Thailand, excluding
products produced and sold in the same country. Approximately 19% of
NIKE Brand sales occurred in those countries. Any failure of Sojitz America
to provide these services or any failure of Sojitz America’s banks could disrupt
our ability to acquire products from our suppliers and to deliver products to our
customers in those jurisdictions. Such a disruption could result in cancelled
orders that would adversely affect sales and profi tability. However, we believe
that any such disruption would be short-term in duration due to the ready
availability of alternative sources of fi nancing at competitive rates. Our current
agreements with Sojitz America expire on May 31, 2014.
6 NIKE, INC. - Form 10-K
PART I ITEM 1 Business
International Operations and Trade
Our international operations and sources of supply are subject to the usual
risks of doing business abroad, such as possible revaluation of currencies,
export and import duties, anti-dumping measures, quotas, safeguard measures,
trade restrictions, restrictions on the transfer of funds and, in certain parts
of the world, political instability and terrorism. We have not, to date, been
materially affected by any such risk, but cannot predict the likelihood of such
developments occurring.
The global economic recession resulted in a signifi cant slow-down in international
trade and a sharp rise in protectionist actions around the world. These trends
are affecting many global manufacturing and service sectors, and the footwear
and apparel industries, as a whole, are not immune. Companies in our industry
are facing trade protectionist challenges in many different regions, and in nearly
all cases we are working together to address trade issues to reduce the impact
to the industry, while observing applicable competition laws. Notwithstanding
our efforts, such actions, if implemented, could result in increases in the cost
of our products, which could adversely affect our sales or profi tability and the
imported footwear and apparel industry as a whole. Accordingly, we are actively
monitoring the developments described below.
Footwear Imports into the European Union
In 2005, at the request of the European domestic footwear industry, the European
Commission (“EC”) initiated investigations into leather footwear imported from
China and Vietnam. Together with other companies in our industry, we took the
position that Special Technology Athletic Footwear (STAF) (i) should not be within
the scope of the investigation, and (ii) does not meet the legal requirements
of injury and price in an anti-dumping investigation. Our arguments were
successful and the EU agreed in October 2006 on defi nitive duties of 16.5%
for China and 10% for Vietnam for non-STAF leather footwear, but excluded
STAF from the fi nal measures. Prior to the scheduled expiration in October 2008
of the measures imposed on the non-STAF footwear, the domestic industry
requested and the EC agreed to review a petition to extend these restrictions
on non-STAF leather footwear. In December 2009, following a review of the
ongoing restrictions, EU member states voted to extend the measures for an
additional 15 months, until March 31, 2011. In early 2011, the EC declined to
further extend the measures and since April 1, 2011 these restrictions have
been terminated. The EC noted that it will be monitoring leather footwear
imports from Vietnam and China over the next 12 months and it is hoped
that any increases will not result in renewed trade defense actions by the EC.
On February 3, 2010, the Chinese government announced it would seek to
refer the EU decision (both on the original measures and subsequent review
decision) to the World Trade Organization (“WTO”) for its further review and
decision. On May 18, 2010, the Dispute Settlement Body of the WTO agreed
to establish a panel to rule on China’s claims against the EU with respect to
the above anti-dumping measures. The ruling from the WTO panel is expected
in late July or August 2011, after which either party may accept or appeal
the fi ndings.
Footwear, Apparel and Equipment Imports into Brazil and Argentina
At the request of certain domestic footwear industry participants, both Brazil
and Argentina have initiated independent anti-dumping investigations against
footwear made in China. Over the last two years, we have been working with
a broad coalition of other companies in our industry to challenge these cases
on the basis that the athletic footwear being imported from China (i) should
not be within the scope of the investigation, and (ii) does not meet the legal
requirements of injury and price in an anti-dumping investigation. In the case of
Argentina, in 2010, the fi nal determination made by the administering authorities
was favorable to us. In the case of Brazil, the administering authorities agreed
to impose an anti-dumping duty against nearly all footwear from China, which
we believe will impact all brands in the footwear industry. Although we do not
currently expect that this decision will materially affect us, we are working with
the same broad coalition of footwear companies to challenge this decision in
domestic Brazilian courts as well as international forums such as the WTO.
Many products, including footwear, apparel and equipment products, that we
and others in our industry import into Argentina and Brazil are subject to the
WTO non-automatic licensing requirements, which means that it may take up to
60 days for those products to clear customs and enter into those jurisdictions.
From time to time, in addition to these WTO licensing requirements, these
jurisdictions impose further importation restrictions or limitations. As a result,
we have experienced delays in our ability to import our products or it has taken
longer than the time allowed under the WTO for us to import our products.
To date, our business has not been materially affected by these restrictions or
delays. In the future, however, if we are unable to import our products into these
jurisdictions due to these or other restrictions or if we experience increasing
or more frequent delays beyond the WTO-permitted 60 days to import our
products, our business could be materially affected.
Footwear, Apparel and Equipment Imports into Turkey
In 2006, Turkey introduced safeguard measures in the form of additional
duties on all imported footwear into Turkey with the goal of protecting its
local shoe manufacturing industry until August 2009. In June 2009, Turkish
shoe-manufacturers submitted, and the Turkish Government agreed to
review, a request for extension of the safeguard measures claiming that the
rehabilitation process of the local Turkish industry was interrupted due to the
continuing increase of footwear imports. Despite the importers opposition to
the continuation of the safeguard measures, the Turkish authorities extended
these safeguard measures until August 2012, but reduced the duty from $3 per
pair of footwear to $1.60 per pair of footwear.
In 2011, two new safeguard measures and reviews were initiated by the Turkish
Undersecretariat of Foreign Trade (“UFT”) on apparel and equipment imports.
In January 2011, the UFT began an investigation on apparel imports that
could result in a 20-30% increase in import duties applied to imported apparel
products, regardless of country of origin and with only a few exceptions for
countries that currently have a Free Trade Agreement with Turkey. A decision is
expected in late July 2011 and if approved, these higher import duties will be in
place through July 2014. Together with other companies in our industry, we are
advocating for exclusion of certain apparel products used for sporting activities
that cannot be manufactured in Turkey and therefore should not be subject
to a higher import duty. In February 2011, the UFT began a review of existing
safeguard measure on travel goods, handbags and similar accessories and
containers listed under applicable regulations. One Turkish bag manufacturers
association has requested the continuation of the safeguard measures through
April 2014, with the application of an additional import duty of 2.70 USD/kg
(max. 4.25 USD/unit), regardless of country of origin. Together with other
companies in our industry, we are advocating for the exclusion of non-leather
bags from the scope of the continued safeguards.
7NIKE, INC. - Form 10-K
PART I ITEM 1 Business
Trade Relations with China
China represents an important sourcing country and consumer marketing
country for us. Many governments around the world are concerned about
China’s growing and fast-paced economy, compliance with WTO rules, currency
valuation, and high trade surpluses. As a result, a wide range of legislative
proposals have been introduced to address these concerns. While some of
these concerns may be justifi ed, we are working with broad coalitions of global
businesses and trade associations representing a wide variety of sectors (e.g.,
services, manufacturing, and agriculture) to help ensure any legislation enacted
and implemented (i) addresses legitimate and core concerns, (ii) is consistent
with international trade rules, and (iii) refl ects and considers China’s domestic
economy and the important role it has in the global economic community.
We believe other companies in our industry as well as most other multi-national
companies are in a similar position regarding these trade measures.
In the event any of these trade protection measures are implemented, we
believe that we have the ability to develop, over a period of time, adequate
alternative sources of supply for the products obtained from our present
suppliers. If events prevented us from acquiring products from our suppliers
in a particular country, our operations could be temporarily disrupted and
we could experience an adverse fi nancial impact. However, we believe we
could abate any such disruption, and that much of the adverse impact on
supply would, therefore, be of a short-term nature. We believe our principal
competitors are subject to similar risks.
Competition
The athletic footwear, apparel, and equipment industry is keenly competitive
in the United States and on a worldwide basis. We compete internationally
with a signifi cant number of athletic and leisure shoe companies, athletic and
leisure apparel companies, sports equipment companies, and large companies
having diversifi ed lines of athletic and leisure shoes, apparel, and equipment,
including Adidas, Puma, and others. The intense competition and the rapid
changes in technology and consumer preferences in the markets for athletic
and leisure footwear and apparel, and athletic equipment, constitute signifi cant
risk factors in our operations.
NIKE is the largest seller of athletic footwear and athletic apparel in the world.
Performance and reliability of shoes, apparel, and equipment, new product
development, price, product identity through marketing and promotion,
and customer support and service are important aspects of competition in
the athletic footwear, apparel, and equipment industry. To help market our
products, we contract with prominent and infl uential athletes, coaches, teams,
colleges and sports leagues to endorse our brands and use our products,
and we actively sponsor sporting events and clinics. We believe that we are
competitive in all of these areas.
Trademarks and Patents
We utilize trademarks on nearly all of our products and believe having distinctive
marks that are readily identifi able is an important factor in creating a market for
our goods, in identifying our brands and the Company, and in distinguishing
our goods from the goods of others. We consider our NIKE® and Swoosh
Design® trademarks to be among our most valuable assets and we have
registered these trademarks in over 150 countries. In addition, we own many
other trademarks that we utilize in marketing our products. We continue to
vigorously protect our trademarks against infringement.
NIKE has an exclusive, worldwide license to make and sell footwear using
patented “Air” technology. The process utilizes pressurized gas encapsulated
in polyurethane. Some of the early NIKE AIR® patents have expired, which may
enable competitors to use certain types of similar technology. Subsequent
NIKE AIR® patents will not expire for several years. We also have hundreds
of U.S. and foreign utility patents, and thousands of U.S. and foreign design
patents covering components and features used in various athletic and leisure
shoes, apparel, and equipment. These patents expire at various times, and
patents issued for applications fi led this year will last from now to 2025 for
design patents, and from now to 2031 for utility patents. We believe our
success depends primarily upon skills in design, research and development,
production, and marketing rather than upon our patent position. However,
we have followed a policy of fi ling applications for United States and foreign
patents on inventions, designs, and improvements that we deem valuable.
Employees
As of May 31, 2011, we had approximately 38,000 employees worldwide, which
includes retail and part-time employees. Management considers its relationship
with employees to be excellent. None of our employees is represented by a
union, except for certain employees in the Emerging Markets geography, where
local law requires those employees to be represented by a trade union, and
in the United States, where certain employees of Cole Haan are represented
by a union. Also, in some countries outside of the United States, local laws
require representation for employees by works councils (such as in certain
countries in the European Union, in which they are entitled to information and
consultation on certain Company decisions) or other employee representation
by an organization similar to a union, and in certain European countries,
we are required by local law to enter into and/or comply with (industry wide
or national) collective bargaining agreements. There has never been a material
interruption of operations due to labor disagreements.
Executive Offi cers of the Registrant
The executive offi cers of NIKE as of July 14, 2011 are as follows:
• Philip H. Knight, Chairman of the Board — Mr. Knight, 73, a director since
1968, is a co-founder of NIKE and, except for the period from June 1983
through September 1984, served as its President from 1968 to 1990 and
from June 2000 to December 2004. Prior to 1968, Mr. Knight was a certifi ed
public accountant with Price Waterhouse and Coopers & Lybrand and was
an Assistant Professor of Business Administration at Portland State University.
• Mark G. Parker, Chief Executive Offi cer and President — Mr. Parker, 55,
was appointed CEO and President in January 2006. He has been employed
by NIKE since 1979 with primary responsibilities in product research,
design and development, marketing, and brand management. Mr. Parker
was appointed divisional Vice President in charge of development in 1987,
corporate Vice President in 1989, General Manager in 1993, Vice President
of Global Footwear in 1998, and President of the NIKE Brand in 2001.
8 NIKE, INC. - Form 10-K
PART I ITEM 1A Risk Factors
• David J. Ayre, Vice President, Global Human Resources — Mr. Ayre, 51, joined
NIKE as Vice President, Global Human Resources in 2007. Prior to joining
NIKE, he held a number of senior human resource positions with PepsiCo, Inc.
since 1990, most recently as head of Talent and Performance Rewards.
• Donald W. Blair, Vice President and Chief Financial Offi cer — Mr. Blair, 53,
joined NIKE in November 1999. Prior to joining NIKE, he held a number of
fi nancial management positions with PepsiCo, Inc., including Vice President,
Finance of Pepsi-Cola Asia, Vice President, Planning of PepsiCo’s Pizza Hut
Division, and Senior Vice President, Finance of The Pepsi Bottling Group, Inc.
Prior to joining PepsiCo, Mr. Blair was a certifi ed public accountant with
Deloitte, Haskins, and Sells.
• Charles D. Denson, President of the NIKE Brand — Mr. Denson, 55, has
been employed by NIKE since 1979. Mr. Denson held several management
positions within the Company, including his appointments as Director of
USA Apparel Sales in 1994, divisional Vice President, U.S. Sales in 1994,
divisional Vice President European Sales in 1997, divisional Vice President
and General Manager, NIKE Europe in 1998, Vice President and General
Manager of NIKE USA in 2000, and President of the NIKE Brand in 2001.
• Gary M. DeStefano, President, Global Operations — Mr. DeStefano, 54, has
been employed by NIKE since 1982, with primary responsibilities in sales and
regional administration. Mr. DeStefano was appointed Director of Domestic
Sales in 1990, divisional Vice President in charge of domestic sales in 1992,
Vice President of Global Sales in 1996, Vice President and General Manager
of Asia Pacifi c in 1997, President of USA Operations in 2001, and President
of Global Operations in 2006.
• Trevor Edwards, Vice President, Global Brand and Category Management —
Mr. Edwards, 48, joined NIKE in 1992. He was appointed Marketing Manager,
Strategic Accounts, Foot Locker in 1993, Director of Marketing, the Americas
in 1995, Director of Marketing, Europe in 1997, Vice President, Marketing
for Europe, Middle East and Africa in 1999, and Vice President, U.S. Brand
Marketing in 2000. Mr. Edwards was appointed corporate Vice President,
Global Brand Management in 2002 and Vice President, Global Brand and
Category Management in 2006. Prior to NIKE, Mr. Edwards was with the
Colgate-Palmolive Company.
• Jeanne P. Jackson, President, Direct to Consumer — Ms. Jackson, 59, served
as a member of the NIKE, Inc. Board of Directors from 2001 through 2009,
when she resigned from our Board and was appointed President, Direct to
Consumer. She is founder and CEO of MSP Capital, a private investment
company. Ms. Jackson was CEO of Walmart.com from March 2000 to
January 2002. She was with Gap, Inc., as President and CEO of Banana
Republic from 1995 to 2000, also serving as CEO of Gap, Inc. Direct from 1998
to 2000. Since 1978, she has held various retail management positions with
Victoria’s Secret, The Walt Disney Company, Saks Fifth Avenue, and Federated
Department Stores. Ms. Jackson is the past President of the United States
Ski and Snowboard Foundation Board of Trustees, and is a director of
McDonald’s Corporation. She is a former director of Nordstrom, Inc., and
Harrah’s Entertainment, Inc.
• Hilary K. Krane, Vice President and General Counsel — Ms. Krane, 47,
joined NIKE as Vice President and General Counsel in April 2010. Prior to
joining NIKE, Ms. Krane was General Counsel and Senior Vice President
for Corporate Affairs at Levi Strauss & Co. where she was responsible for
legal affairs and overseeing the global brand protection department from
2006 to 2010. From 1996 to 2006, she was a partner and assistant general
counsel at PricewaterhouseCoopers LLP.
• Bernard F. Pliska, Vice President, Corporate Controller — Mr. Pliska, 49,
joined NIKE as Corporate Controller in 1995. He was appointed Vice President,
Corporate Controller in 2003. Prior to NIKE, Mr. Pliska was with Price
Waterhouse from 1984 to 1995. Mr. Pliska is a certifi ed public accountant.
• John F. Slusher, Vice President, Global Sports Marketing — Mr. Slusher,
42, has been employed by NIKE since 1998 with primary responsibilities
in global sports marketing. Mr. Slusher was appointed Director of Sports
Marketing for the Asia Pacifi c and Americas Regions in 2006, divisional Vice
President, Asia Pacifi c & Americas Sports Marketing in September 2007
and Vice President, Global Sports Marketing in November 2007. Prior to
joining NIKE, Mr. Slusher was an attorney at the law fi rm of O’Melveny &
Myers from 1995 to 1998.
• Eric D. Sprunk, Vice President, Merchandising and Product — Mr. Sprunk, 47,
joined NIKE in 1993. He was appointed Finance Director and General Manager
of the Americas in 1994, Finance Director, NIKE Europe in 1995, Regional
General Manager, NIKE Europe Footwear in 1998, and Vice President &
General Manager of the Americas in 2000. Mr. Sprunk was appointed
corporate Vice President, Global Footwear in 2001 and Vice President,
Merchandising and Product in 2009. Prior to joining NIKE, Mr. Sprunk was
a certifi ed public accountant with Price Waterhouse from 1987 to 1993.
• Hans van Alebeek, Vice President, Global Operations and Technology —
Mr. van Alebeek, 45, joined NIKE as Director of Operations of Europe in
1999, and was appointed Vice President, Operations & Administration in
EMEA in 2001, Vice President, Global Operations in 2003, Vice President,
Global Operations & Technology in 2004, and Corporate Vice President
in November 2005. Prior to joining NIKE, Mr. van Alebeek worked for
McKinsey & Company as a management consultant and at N.V. Indivers in
business development.
• Roger S. Wyett, President, Affi liates — Mr. Wyett, 54, joined NIKE in
April 2005 as President and Chief Operating Offi cer of the Company’s
Hurley brand and was appointed Vice President, Global Apparel in 2006.
In October 2007, Mr. Wyett returned to the Company’s Hurley brand as
President and Chief Executive Offi cer, and then in February 2011 was
appointed President of Affi liates. Mr. Wyett fi rst joined NIKE in 1994, holding
a number of management positions in soccer and NIKE Team Sports. From
2000 to 2005, Mr. Wyett was employed by The Walt Disney Company
where he was Senior Vice President for Global Apparel, Accessories and
Footwear, and later promoted to Executive Vice President for Global Sales
and Marketing for Consumer Products.
ITEM 1A Risk FactorsSpecial Note Regarding Forward-Looking Statements and Analyst Reports
Certain written and oral statements, other than purely historical information,
including estimates, projections, statements relating to NIKE’s business plans,
objectives and expected operating results, and the assumptions upon which
those statements are based, made or incorporated by reference from time
to time by NIKE or its representatives in this report, other reports, fi lings with
the Securities and Exchange Commission, press releases, conferences, or
otherwise, are “forward-looking statements” within the meaning of the Private
Securities Litigation Reform Act of 1995 and Section 21E of the Securities
Exchange Act of 1934, as amended. Forward-looking statements include,
without limitation, any statement that may predict, forecast, indicate, or
imply future results, performance, or achievements, and may contain the
words “believe”, “anticipate”, “expect”, “estimate”, “project”, “will be”, “will
continue”, “will likely result”, or words or phrases of similar meaning. Forward-
looking statements involve risks and uncertainties which may cause actual
results to differ materially from the forward-looking statements. The risks and
uncertainties are detailed from time to time in reports fi led by NIKE with the
Securities and Exchange Commission, including Forms 8-K, 10-Q, and 10-
K, and include, among others, the following: international, national and local
general economic and market conditions; the size and growth of the overall
athletic footwear, apparel, and equipment markets; intense competition among
designers, marketers, distributors and sellers of athletic footwear, apparel, and
equipment for consumers and endorsers; demographic changes; changes in
consumer preferences; popularity of particular designs, categories of products,
9NIKE, INC. - Form 10-K
PART I ITEM 1A Risk Factors
and sports; seasonal and geographic demand for NIKE products; diffi culties
in anticipating or forecasting changes in consumer preferences, consumer
demand for NIKE products, and the various market factors described above;
diffi culties in implementing, operating, and maintaining NIKE’s increasingly
complex information systems and controls, including, without limitation,
the systems related to demand and supply planning, and inventory control;
interruptions in data and communications systems; fl uctuations and diffi culty
in forecasting operating results, including, without limitation, the fact that
advance “futures” orders may not be indicative of future revenues due to
changes in shipment timing, and the changing mix of futures and at-once orders
and order cancellations; the ability of NIKE to sustain, manage or forecast
its growth and inventories; the size, timing and mix of purchases of NIKE’s
products; increases in the cost of materials and energy used to manufacture
products, new product development and introduction; the ability to secure
and protect trademarks, patents, and other intellectual property; performance
and reliability of products; customer service; adverse publicity; the loss of
signifi cant customers or suppliers; dependence on distributors and licensees;
business disruptions; increased costs of freight and transportation to meet
delivery deadlines; increases in borrowing costs due to any decline in our debt
ratings; changes in business strategy or development plans; general risks
associated with doing business outside the United States, including, without
limitation, exchange rate fl uctuations, import duties, tariffs, quotas, political
and economic instability, and terrorism; changes in government regulations;
the impact of, including business and legal developments relating to, climate
change; liability and other claims asserted against NIKE; the ability to attract
and retain qualifi ed personnel; and other factors referenced or incorporated
by reference in this report and other reports.
The risks included here are not exhaustive. Other sections of this report may
include additional factors which could adversely affect NIKE’s business and
fi nancial performance. Moreover, NIKE operates in a very competitive and
rapidly changing environment. New risk factors emerge from time to time
and it is not possible for management to predict all such risk factors, nor can
it assess the impact of all such risk factors on NIKE’s business or the extent
to which any factor, or combination of factors, may cause actual results to
differ materially from those contained in any forward-looking statements. Given
these risks and uncertainties, investors should not place undue reliance on
forward-looking statements as a prediction of actual results.
Investors should also be aware that while NIKE does, from time to time,
communicate with securities analysts, it is against NIKE’s policy to disclose
to them any material non-public information or other confi dential commercial
information. Accordingly, shareholders should not assume that NIKE agrees
with any statement or report issued by any analyst irrespective of the content
of the statement or report. Furthermore, NIKE has a policy against issuing
or confi rming fi nancial forecasts or projections issued by others. Thus, to
the extent that reports issued by securities analysts contain any projections,
forecasts or opinions, such reports are not the responsibility of NIKE.
Our products face intense competition.
NIKE is a consumer products company and the relative popularity of various
sports and fi tness activities and changing design trends affect the demand
for our products. The athletic footwear, apparel, and equipment industry is
keenly competitive in the United States and on a worldwide basis. We compete
internationally with a signifi cant number of athletic and leisure shoe companies,
athletic and leisure apparel companies, sports equipment companies, and
large companies having diversifi ed lines of athletic and leisure shoes, apparel,
and equipment. We also compete with other companies for the production
capacity of independent manufacturers that produce our products and for
import quota capacity.
Our competitors’ product offerings, technologies, marketing expenditures
(including expenditures for advertising and endorsements), pricing, costs of
production, and customer service are areas of intense competition. This, in
addition to rapid changes in technology and consumer preferences in the
markets for athletic and leisure footwear and apparel, and athletic equipment,
constitute signifi cant risk factors in our operations. If we do not adequately and
timely anticipate and respond to our competitors, our costs may increase or
the consumer demand for our products may decline signifi cantly.
If we are unable to anticipate consumer preferences and develop new products, we may not be able to maintain or increase our net revenues and profi ts.
Our success depends on our ability to identify, originate and defi ne product
trends as well as to anticipate, gauge and react to changing consumer demands
in a timely manner. All of our products are subject to changing consumer
preferences that cannot be predicted with certainty. Our new products may not
receive consumer acceptance as consumer preferences could shift rapidly to
different types of performance or other sports apparel or away from these types
of products altogether, and our future success depends in part on our ability
to anticipate and respond to these changes. If we fail to anticipate accurately
and respond to trends and shifts in consumer preferences by adjusting the mix
of existing product offerings, developing new products, designs, styles and
categories, and infl uencing sports and fi tness preferences through aggressive
marketing, we could experience lower sales, excess inventories and lower
profi t margins, any of which could have an adverse effect on our results of
operations and fi nancial condition.
We rely on technical innovation and high quality products to compete in the market for our products.
Although design and aesthetics of our products appear to be the most important
factor for consumer acceptance of our products, technical innovation and
quality control in the design of footwear, apparel, and athletic equipment is
also essential to the commercial success of our products. Research and
development plays a key role in technical innovation. We rely upon specialists
in the fi elds of biomechanics, exercise physiology, engineering, industrial
design and related fi elds, as well as research committees and advisory boards
made up of athletes, coaches, trainers, equipment managers, orthopedists,
podiatrists, and other experts to develop and test cutting edge performance
products. While we strive to produce products that help to reduce injury,
enhance athletic performance and maximize comfort, if we fail to introduce
technical innovation in our products consumer demand for our products could
decline, and if we experience problems with the quality of our products, we
may incur substantial expense to remedy the problems.
Failure to continue to obtain high quality endorsers of our products could harm our business.
We establish relationships with professional athletes, sports teams and leagues to
evaluate, promote, and establish product authenticity with consumers. If certain
endorsers were to stop using our products contrary to their endorsement
agreements, our business could be adversely affected. In addition, actions
taken by athletes, teams or leagues associated with our products that harm
the reputations of those athletes, teams or leagues could also harm our brand
image with consumers and, as a result, could have an adverse effect on our
sales and fi nancial condition. In addition, poor performance by our endorsers,
a failure to continue to correctly identify promising athletes to use and endorse
our products, or a failure to enter into cost effective endorsement arrangements
with prominent athletes and sports organizations could adversely affect our
brand and result in decreased sales of our products.
Failure of our contractors or our licensees’ contractors to comply with our code of conduct, local laws, and other standards could harm our business.
We contract with hundreds of contractors outside of the United States to
manufacture our products, and we also have license agreements that permit
unaffi liated parties to manufacture or contract to manufacture products using
our trademarks. We impose, and require our licensees to impose, on those
contractors a code of conduct and other environmental, health, and safety
standards for the benefi t of workers. We also require these contractors to
comply with applicable standards for product safety. However, from time to
time contractors may not comply with such standards or applicable local
law or our licensees may not require their contractors to comply with such
standards or applicable local law. Signifi cant or continuing noncompliance
with such standards and laws by one or more contractors could harm our
reputation or result in a product recall and, as a result, could have an adverse
effect on our sales and fi nancial condition.
10 NIKE, INC. - Form 10-K
PART I ITEM 1A Risk Factors
Global capital and credit market conditions, and resulting declines in consumer confi dence and spending, could have a material adverse effect on our business, operating results, and fi nancial condition.
Continuing volatility and disruption in the global capital and credit markets have
led to a tightening of business credit and liquidity, a contraction of consumer
credit, business failures, higher unemployment, and declines in consumer
confi dence and spending in the United States and internationally. If global
economic and fi nancial market conditions deteriorate or remain weak for an
extended period of time, the following factors could have a material adverse
effect on our business, operating results, and fi nancial condition:
• Slower consumer spending may result in reduced demand for our products,
reduced orders from retailers for our products, order cancellations, lower
revenues, increased inventories, and lower gross margins.
• We may be unable to fi nd suitable investments that are safe, liquid, and
provide a reasonable return. This could result in lower interest income or
longer investment horizons. Disruptions to capital markets or the banking
system may also impair the value of investments or bank deposits we
currently consider safe or liquid.
• We may be unable to access fi nancing in the credit and capital markets at
reasonable rates in the event we fi nd it desirable to do so.
• The failure of fi nancial institution counterparties to honor their obligations to us
under credit and derivative instruments could jeopardize our ability to rely on
and benefi t from those instruments. Our ability to replace those instruments
on the same or similar terms may be limited under poor market conditions.
• We conduct transactions in various currencies, which increase our exposure
to fl uctuations in foreign currency exchange rates relative to the U.S.
dollar. Continued volatility in the markets and exchange rates for foreign
currencies and contracts in foreign currencies could have a signifi cant impact
on our reported fi nancial results and condition.
• Continued volatility in the markets and prices for commodities and raw materials
we use in our products and in our supply chain (such as petroleum) could
have a material adverse effect on our costs, gross margins, and profi tability.
• If retailers of our products experience declining revenues, or retailers experience
diffi culty obtaining fi nancing in the capital and credit markets to purchase
our products, this could result in reduced orders for our products, order
cancellations, inability of retailers to timely meet their payment obligations
to us, extended payment terms, higher accounts receivable, reduced cash
fl ows, greater expense associated with collection efforts, and increased
bad debt expense.
• If retailers of our products experience severe fi nancial diffi culty, some may
become insolvent and cease business operations, which could reduce the
availability of our products to consumers.
• If contract manufacturers of our products or other participants in our supply
chain experience diffi culty obtaining fi nancing in the capital and credit markets
to purchase raw materials or to fi nance general working capital needs, it may
result in delays or non-delivery of shipments of our products.
Our business is affected by seasonality, which could result in fl uctuations in our operating results and stock price.
We experience moderate fl uctuations in aggregate sales volume during
the year. Historically, revenues in the fi rst and fourth fi scal quarters have
slightly exceeded those in the second and third fi scal quarters. However, the
mix of product sales may vary considerably from time to time as a result of
changes in seasonal and geographic demand for particular types of footwear,
apparel and equipment. In addition, our customers may cancel orders, change
delivery schedules or change the mix of products ordered with minimal notice.
As a result, we may not be able to accurately predict our quarterly sales.
Accordingly, our results of operations are likely to fl uctuate signifi cantly from
period to period. This seasonality, along with other factors that are beyond
our control, including general economic conditions, changes in consumer
preferences, weather conditions, availability of import quotas and currency
exchange rate fl uctuations, could adversely affect our business and cause
our results of operations to fl uctuate. Our operating margins are also sensitive
to a number of factors that are beyond our control, including manufacturing
and transportation costs, shifts in product sales mix, geographic sales trends,
and currency exchange rate fl uctuations, all of which we expect to continue.
Results of operations in any period should not be considered indicative of the
results to be expected for any future period.
“Futures” orders may not be an accurate indication of our future revenues.
We make substantial use of our “futures” ordering program, which allows
retailers to order fi ve to six months in advance of delivery with the commitment
that their orders will be delivered within a set period of time at a fi xed price.
Our futures ordering program allows us to minimize the amount of products
we hold in inventory, purchasing costs, the time necessary to fi ll customer
orders, and the risk of non-delivery. We report changes in futures orders in our
periodic fi nancial reports. Although we believe futures orders are an important
indicator of our future revenues, reported futures orders are not necessarily
indicative of our expectation of changes in revenues for any future period.
This is because the mix of orders can shift between advance/futures and at-
once orders. In addition, foreign currency exchange rate fl uctuations, order
cancellations, returns, and discounts can cause differences in the comparisons
between futures orders and actual revenues. Moreover, a signifi cant portion
of our revenue is not derived from futures and advance orders, including at-
once and close-out sales of NIKE Brand footwear and apparel, sales of NIKE
brand equipment, sales from our Direct to Consumer operations, and sales
from our Other Businesses.
Our “futures” ordering program does not prevent excess inventories or inventory shortages, which could result in decreased operating margins and harm to our business.
We purchase products from manufacturers outside of our futures ordering
program and in advance of customer orders, which we hold in inventory and
resell to customers. There is a risk we may be unable to sell excess products
ordered from manufacturers. Inventory levels in excess of customer demand
may result in inventory write-downs, and the sale of excess inventory at
discounted prices could signifi cantly impair our brand image and have an
adverse effect on our operating results and fi nancial condition. Conversely, if we
underestimate consumer demand for our products or if our manufacturers fail
to supply products we require at the time we need them, we may experience
inventory shortages. Inventory shortages might delay shipments to customers,
negatively impact retailer and distributor relationships, and diminish brand loyalty.
The diffi culty in forecasting demand also makes it diffi cult to estimate our future
results of operations and fi nancial condition from period to period. A failure
to accurately predict the level of demand for our products could adversely
affect our net revenues and net income, and we are unlikely to forecast such
effects with any certainty in advance.
We may be adversely affected by the fi nancial health of our retailers.
We extend credit to our customers based on an assessment of a customer’s
fi nancial condition, generally without requiring collateral. To assist in the
scheduling of production and the shipping of seasonal products, we offer
customers the ability to place orders fi ve to six months ahead of delivery under
our “futures” ordering program. These advance orders may be cancelled,
and the risk of cancellation may increase when dealing with fi nancially ailing
retailers or retailers struggling with economic uncertainty. In the past, some
customers have experienced fi nancial diffi culties, which have had an adverse
effect on our business. As a result, retailers may be more cautious than usual
with orders as a result of weakness in the retail economy. A slowing economy
in our key markets could have an adverse effect on the fi nancial health of
our customers, which in turn could have an adverse effect on our results of
operations and fi nancial condition. In addition, product sales are dependent
in part on high quality merchandising and an appealing store environment to
attract consumers, which requires continuing investments by retailers. Retailers
who experience fi nancial diffi culties may fail to make such investments or delay
them, resulting in lower sales and orders for our products.
11NIKE, INC. - Form 10-K
PART I ITEM 1A Risk Factors
Consolidation of retailers or concentration of retail market share among a few retailers may increase and concentrate our credit risk, and impair our ability to sell our products.
The athletic footwear, apparel, and equipment retail markets in some countries
are dominated by a few large athletic footwear, apparel, and equipment retailers
with many stores. These retailers have in the past increased their market share
and may continue to do so in the future by expanding through acquisitions
and construction of additional stores. These situations concentrate our credit
risk with a relatively small number of retailers, and, if any of these retailers
were to experience a shortage of liquidity, it would increase the risk that their
outstanding payables to us may not be paid. In addition, increasing market
share concentration among one or a few retailers in a particular country or
region increases the risk that if any one of them substantially reduces their
purchases of our products, we may be unable to fi nd a suffi cient number of other
retail outlets for our products to sustain the same level of sales and revenues.
Failure to adequately protect our intellectual property rights could adversely affect our business.
We utilize trademarks on nearly all of our products and believe that having
distinctive marks that are readily identifi able is an important factor in creating a
market for our goods, in identifying us, and in distinguishing our goods from the
goods of others. We consider our NIKE® and Swoosh Design® trademarks to
be among our most valuable assets and we have registered these trademarks
in over 150 countries. In addition, we own many other trademarks that we
utilize in marketing our products. We believe that our trademarks, patents, and
other intellectual property rights are important to our brand, our success, and
our competitive position. We periodically discover products that are counterfeit
reproductions of our products or that otherwise infringe on our intellectual
property rights. If we are unsuccessful in challenging a party’s products on
the basis of trademark or design or utility patent infringement, continued sales
of these products could adversely affect our sales and our brand and result
in the shift of consumer preference away from our products. The actions
we take to establish and protect trademarks, patents, and other intellectual
property rights may not be adequate to prevent imitation of our products by
others or to prevent others from seeking to block sales of our products as
violations of proprietary rights.
In addition, the laws of certain foreign countries may not protect intellectual
property rights to the same extent as the laws of the United States. We may
face signifi cant expenses and liability in connection with the protection of our
intellectual property rights outside the United States, and if we are unable to
successfully protect our rights or resolve intellectual property confl icts with
others, our business or fi nancial condition may be adversely affected.
We are subject to periodic litigation and other regulatory proceedings, which could result in unexpected expense of time and resources.
From time to time we are called upon to defend ourselves against lawsuits and
regulatory actions relating to our business. Due to the inherent uncertainties
of litigation and regulatory proceedings, we cannot accurately predict the
ultimate outcome of any such proceedings. An unfavorable outcome could
have an adverse impact on our business, fi nancial condition and results of
operations. In addition, any signifi cant litigation in the future, regardless of its
merits, could divert management’s attention from our operations and result
in substantial legal fees.
Our international operations involve inherent risks which could result in harm to our business.
Virtually all of our athletic footwear and apparel is manufactured outside of
the United States, and the majority of our products are sold outside of the
United States. Accordingly, we are subject to the risks generally associated
with global trade and doing business abroad, which include foreign laws and
regulations, varying consumer preferences across geographic regions, political
unrest, disruptions or delays in cross-border shipments, and changes in
economic conditions in countries in which we manufacture or sell products. In
addition, disease outbreaks, terrorist acts and military confl ict have increased
the risks of doing business abroad. These factors, among others, could
affect our ability to manufacture products or procure materials, our ability to
import products, our ability to sell products in international markets, and our
cost of doing business. If any of these or other factors make the conduct of
business in a particular country undesirable or impractical, our business could
be adversely affected. In addition, many of our imported products are subject
to duties, tariffs, or quotas that affect the cost and quantity of various types
of goods imported into the United States and other countries. Any country
in which our products are produced or sold may eliminate, adjust or impose
new quotas, duties, tariffs, safeguard measures, anti-dumping duties, cargo
restrictions to prevent terrorism, restrictions on the transfer of currency, climate
change legislation, product safety regulations or other charges or restrictions,
any of which could have an adverse effect on our results of operations and
fi nancial condition.
Changes in tax laws and unanticipated tax liabilities could adversely affect our effective income tax rate and profi tability.
We are subject to income taxes in the United States and numerous foreign
jurisdictions. Our effective income tax rate in the future could be adversely
affected by a number of factors, including: changes in the mix of earnings
in countries with differing statutory tax rates, changes in the valuation of
deferred tax assets and liabilities, changes in tax laws, the outcome of income
tax audits in various jurisdictions around the world, and any repatriation of
non-US earnings for which we have not previously provided for U.S. taxes.
We regularly assess all of these matters to determine the adequacy of our
tax provision, which is subject to signifi cant discretion.
Currency exchange rate fl uctuations could result in higher costs and decreased margins and earnings.
A majority of our products are sold outside of the United States. As a result,
we conduct transactions in various currencies, which increase our exposure
to fl uctuations in foreign currency exchange rates relative to the U.S. dollar.
Our international revenues and expenses generally are derived from sales
and operations in foreign currencies, and these revenues and expenses
could be affected by currency fl uctuations, including amounts recorded in
foreign currencies and translated into U.S. dollars for consolidated fi nancial
reporting. Currency exchange rate fl uctuations could also disrupt the business
of the independent manufacturers that produce our products by making their
purchases of raw materials more expensive and more diffi cult to fi nance.
Foreign currency fl uctuations could have an adverse effect on our results of
operations and fi nancial condition.
Our hedging activities (see Note 17 — Risk Management and Derivatives in
the accompanying Notes to the Consolidated Financial Statements), which are
designed to minimize and delay, but not to completely eliminate, the effects of
foreign currency fl uctuations may not suffi ciently mitigate the impact of foreign
currencies on our fi nancial results. Factors that could affect the effectiveness of
our hedging activities include accuracy of sales forecasts, volatility of currency
markets, and the availability of hedging instruments. Since the hedging activities
are designed to minimize volatility, they not only reduce the negative impact
of a stronger U.S. dollar, but they also reduce the positive impact of a weaker
U.S. dollar. Our future fi nancial results could be signifi cantly affected by the
value of the U.S. dollar in relation to the foreign currencies in which we conduct
business. The degree to which our fi nancial results are affected for any given
time period will depend in part upon our hedging activities.
Our products are subject to risks associated with overseas sourcing, manufacturing, and fi nancing.
The principal materials used in our apparel products — natural and synthetic
fabrics and threads, plastic and metal hardware, and specialized performance
fabrics designed to repel rain, retain heat, or effi ciently transport body moisture —
are available in countries where our manufacturing takes place. The principal
materials used in our footwear products — natural and synthetic rubber, plastic
compounds, foam cushioning materials, nylon, leather, canvas and polyurethane
fi lms — are also locally available to manufacturers. NIKE contractors and
suppliers buy raw materials in bulk.
There could be a signifi cant disruption in the supply of fabrics or raw materials
from current sources or, in the event of a disruption, we might not be able to
locate alternative suppliers of materials of comparable quality at an acceptable
price, or at all. In addition, we cannot be certain that our unaffi liated manufacturers
will be able to fi ll our orders in a timely manner. If we experience signifi cant
12 NIKE, INC. - Form 10-K
PART I ITEM 1A Risk Factors
increases in demand, or need to replace an existing manufacturer, there
can be no assurance that additional supplies of fabrics or raw materials or
additional manufacturing capacity will be available when required on terms
that are acceptable to us, or at all, or that any supplier or manufacturer
would allocate suffi cient capacity to us in order to meet our requirements. In
addition, even if we are able to expand existing or fi nd new manufacturing
or sources of materials, we may encounter delays in production and added
costs as a result of the time it takes to train suppliers and manufacturers
in our methods, products, quality control standards, and labor, health and
safety standards. Any delays, interruption or increased costs in the supply
of materials or manufacture of our products could have an adverse effect on
our ability to meet retail customer and consumer demand for our products
and result in lower revenues and net income both in the short and long-term.
Because independent manufacturers manufacture a majority of our products
outside of our principal sales markets, our products must be transported by
third parties over large geographic distances. Delays in the shipment or delivery
of our products due to the availability of transportation, work stoppages, port
strikes, infrastructure congestion, or other factors, and costs and delays
associated with consolidating or transitioning between manufacturers, could
adversely impact our fi nancial performance. In addition, manufacturing delays
or unexpected demand for our products may require us to use faster, but more
expensive, transportation methods such as aircraft, which could adversely affect
our profi t margins. The cost of fuel is a signifi cant component in manufacturing
and transportation costs, so increases in the price of petroleum products can
adversely affect our profi t margins.
In addition, Sojitz America performs signifi cant import-export fi nancing services
for most of the NIKE Brand products sold outside of the United States, Europe,
Middle East, Africa, and Japan, excluding products produced and sold in the
same country. Any failure of Sojitz America to provide these services or any
failure of Sojitz America’s banks could disrupt our ability to acquire products
from our suppliers and to deliver products to our customers outside of the
United States, Europe, Middle East, Africa, and Japan. Such a disruption could
result in cancelled orders that would adversely affect sales and profi tability.
Natural disasters could negatively impact our operating results and fi nancial condition. The March 11, 2011 Japanese earthquake and resulting tsunami negatively affected our Japanese revenue and profi ts for the fourth quarter ended May 31, 2011, and we expect those events to continue to adversely affect us during fi scal year 2012.
Natural disasters such as earthquakes, hurricanes, tsunamis or other adverse
weather and climate conditions, whether occurring in the U.S. or abroad, and
the consequences and effects thereof, including energy shortages and public
health issues, could disrupt our operations, or the operations of our vendors
and other suppliers, or result in economic instability that may negatively impact
our operating results and fi nancial condition.
On March 11, 2011, Japan experienced a signifi cant earthquake and resulting
tsunami. The implications from ongoing events and widespread damage to
the nation’s infrastructure, consumer confi dence and overall economy remain
unclear. Our revenues and profi ts for our Japan businesses were negatively
impacted during the fourth quarter of fi scal year 2011, and although we
cannot fully assess the future fi nancial impact of these ongoing events, we
do expect our Japanese businesses to continue to be adversely impacted
throughout fi scal 2012.
Our success depends on our global distribution facilities.
We distribute our products to customers directly from the factory and through
distribution centers located throughout the world. Our ability to meet customer
expectations, manage inventory, complete sales and achieve objectives for
operating effi ciencies depends on the proper operation of our distribution
facilities, the development or expansion of additional distribution capabilities, and
the timely performance of services by third parties (including those involved in
shipping product to and from our distribution facilities). Our distribution facilities
could be interrupted by information technology problems and disasters such
as earthquakes or fi res. Any signifi cant failure in our distribution facilities could
result in an adverse affect on our business. We maintain business interruption
insurance, but it may not adequately protect us from adverse effects that could
be caused by signifi cant disruptions in our distribution facilities.
We rely signifi cantly on information technology to operate our business, including our supply chain and retail operations, and any failure, inadequacy, interruption or security failure of that technology could harm our reputation or our ability to effectively operate our business.
We are heavily dependent on information technology systems across our
supply chain, including product design, production, forecasting, ordering,
manufacturing, transportation, sales, and distribution. Our ability to effectively
manage and maintain our inventory and to ship products to customers on
a timely basis depends signifi cantly on the reliability of these supply chain
systems. Over the last several years, as part of the ongoing initiative to upgrade
our worldwide supply chain, we have implemented new systems in all of our
geographical regions in which we operate. Over the next few years, we will
work to continue to enhance the systems and related processes in our global
operations. The failure of these systems to operate effectively, problems with
transitioning to upgraded or replacement systems, or a breach in security of
these systems could cause delays in product fulfi llment and reduced effi ciency
of our operations, could require signifi cant capital investments to remediate
the problem, and may have an adverse effect on our results of operations
and fi nancial condition.
Hackers and data thieves are increasingly sophisticated and operate large
scale and complex automated attacks. Any breach of our network may result
in the loss of valuable business data, our customers’ or employees’ personal
information or a disruption of our business, which could give rise to unwanted
media attention, damage our customer relationships and reputation and result
in lost sales, fi nes or lawsuits. In addition, we must comply with increasingly
complex regulatory standards enacted to protect this business and personal
data. An inability to maintain compliance with these regulatory standards
could subject us to legal risks.
Our fi nancial results may be adversely affected if substantial investments in businesses and operations fail to produce expected returns.
From time to time, we may invest in business infrastructure, acquisitions of
new businesses, and expansion of existing businesses, such as our retail
operations, which require substantial cash investments and management
attention. We believe cost effective investments are essential to business growth
and profi tability. However, signifi cant investments are subject to typical risks
and uncertainties inherent in acquiring or expanding a business. The failure of
any signifi cant investment to provide the returns or profi tability we expect could
have a material adverse effect on our fi nancial results and divert management
attention from more profi table business operations.
We depend on key personnel, the loss of whom would harm our business.
Our future success will depend in part on the continued service of key executive
offi cers and personnel. The loss of the services of any key individual could
harm us. Our future success also depends on our ability to identify, attract
and retain additional qualifi ed personnel. Competition for employees in our
industry is intense and we may not be successful in attracting and retaining
such personnel.
The sale of a large number of shares held by our Chairman could depress the market price of our common stock.
Philip H. Knight, Co-founder and Chairman of our Board of Directors, benefi cially
owns over 74.6% of our Class A Common Stock. If all of his Class A Common
Stock were converted into Class B Common Stock, Mr. Knight would own
over 17.8% of our Class B Common Stock. These shares are available for
resale, subject to the requirements of the U.S. securities laws. The sale or
prospect of the sale of a substantial number of these shares could have an
adverse effect on the market price of our common stock.
13NIKE, INC. - Form 10-K
PART I ITEM 4 Reserved
Anti-takeover provisions may impair an acquisition of the Company or reduce the price of our common stock.
There are provisions of our articles of incorporation and Oregon law that are
intended to protect shareholder interests by providing the Board of Directors
a means to attempt to deny coercive takeover attempts or to negotiate with
a potential acquirer in order to obtain more favorable terms. Such provisions
include a control share acquisition statute, a freezeout statute, two classes
of stock that vote separately on certain issues, and the fact that holders of
Class A Common Stock elect three-fourths of the Board of Directors rounded
down to the next whole number. However, such provisions could discourage,
delay or prevent an unsolicited merger, acquisition or other change in control
of our company that some shareholders might believe to be in their best
interests or in which shareholders might receive a premium for their common
stock over the prevailing market price. These provisions could also discourage
proxy contests for control of the Company.
We may fail to meet analyst expectations, which could cause the price of our stock to decline.
Our Class B Common Stock is traded publicly, and at any given time various
securities analysts follow our fi nancial results and issue reports on us.
These reports include information about our historical fi nancial results as
well as the analysts’ estimates of our future performance. The analysts’
estimates are based upon their own opinions and are often different from our
estimates or expectations. If our operating results are below the estimates
or expectations of public market analysts and investors, our stock price
could decline. In the past, securities class action litigation has been brought
against NIKE and other companies following a decline in the market price of
their securities. If our stock price is volatile, we may become involved in this
type of litigation in the future. Any litigation could result in substantial costs
and a diversion of management’s attention and resources that are needed to
successfully run our business.
ITEM 1B Unresolved Staff CommentsNot applicable.
ITEM 2 PropertiesThe following is a summary of principal properties owned or leased by NIKE.
The NIKE World Campus, owned by NIKE and located in Beaverton, Oregon,
USA, is a 176 acre facility of 18 buildings which functions as our world
headquarters and is occupied by approximately 6,000 employees engaged in
management, research, design, development, marketing, fi nance, and other
administrative functions from nearly all of our divisions. We also lease various
offi ce facilities in the surrounding metropolitan area. We lease a similar, but
smaller, administrative facility in Hilversum, the Netherlands, which serves
as the headquarters for the Western Europe and Central & Eastern Europe
geographies. There are three signifi cant distribution and customer service
facilities for NIKE Brand products, including NIKE Golf, in the United States.
All three of them are located in Memphis, Tennessee, two of which are owned
and one of which is leased. NIKE also operates and leases one facility in
Memphis, Tennessee for NIKE Brand product returns. NIKE Brand apparel
and equipment are also shipped from our Foothill Ranch, California distribution
center, which we lease. Cole Haan also operates a distribution facility in
Greenland, New Hampshire, which we lease. Smaller leased distribution
facilities for other brands and non-NIKE Brand businesses are located in various
parts of the United States. We also own or lease distribution and customer
service facilities in many parts of the world, the most signifi cant of which are
the distribution facilities located in Tomisatomachi, Japan, Laakdal, Belgium,
and Taicang, China, all of which we own.
We manufacture Air-Sole cushioning materials and components at NIKE IHM, Inc.
manufacturing facilities located in Beaverton, Oregon and St. Charles, Missouri,
which we own. We also manufacture and sell small amounts of various plastic
products to other manufacturers through NIKE IHM, Inc.
Aside from the principal properties described above, we lease three production
offi ces outside the United States, over 100 sales offi ces and showrooms
worldwide, and approximately 65 administrative offi ces worldwide. We lease
more than 700 retail stores worldwide, which consist primarily of factory outlet
stores. See “United States Market” and “International Markets” starting on
page 4 of this Report, respectively. Our leases expire at various dates through
the year 2035.
ITEM 3 Legal ProceedingsThere are no material pending legal proceedings, other than ordinary routine litigation incidental to our business, to which we are a party or of which any of our
property is the subject.
ITEM 4 Reserved
14 NIKE, INC. - Form 10-K
PART II ITEM 5 Market for Registrant’s Common Equity, Related Stockholder Matters and Issuer Purchases of Equity Securities
PART II
ITEM 5 Market for Registrant’s Common Equity, Related Stockholder Matters and Issuer Purchases of Equity Securities
NIKE’s Class B Common Stock is listed on the New York Stock Exchange and
trades under the symbol NKE. At July 18, 2011, there were 16,400 holders
of record of our Class B Common Stock and 19 holders of record of our
Class A Common Stock. These fi gures do not include benefi cial owners who
hold shares in nominee name. The Class A Common Stock is not publicly
traded but each share is convertible upon request of the holder into one
share of Class B Common Stock. The following tables set forth, for each of
the quarterly periods indicated, the high and low sales prices for the Class B
Common Stock as reported on the New York Stock Exchange Composite
Tape and dividends declared on the Class A and Class B Common Stock.
Fiscal 2011 (June 1, 2010 — May 31, 2011) High Low Dividends Declared
First Quarter $ 74.94 $ 67.21 $ 0.27
Second Quarter 86.53 72.13 0.31
Third Quarter 92.30 81.46 0.31
Fourth Quarter 89.88 75.45 0.31
Fiscal 2010 (June 1, 2009 — May 31, 2010) High Low Dividends Declared
First Quarter $ 59.95 $ 50.16 $ 0.25
Second Quarter 66.35 53.22 0.27
Third Quarter 67.85 60.89 0.27
Fourth Quarter 78.55 66.99 0.27
The following table presents a summary of share repurchases made by NIKE during the quarter ended May 31, 2011 under the four-year, $5 billion share
repurchase program approved by our Board of Directors in September 2008.
Period Total Number of
Shares Purchased Average Price
Paid per Share
Total Number of Shares Purchased as Part of Publicly
Announced Plans or Programs
Maximum Dollar Value of Shares that May Yet Be Purchased
Under the Plans or Programs (In millions)
March 1 — March 31, 2011 2,800,000 $ 81.76 2,800,000 $ 3,052
April 1 — April 30, 2011 2,650,000 $ 78.92 2,650,000 $ 2,843
May 1 — May 31, 2011 2,011,100 $ 83.77 2,011,100 $ 2,675
7,461,100 $ 81.29 7,461,100
Performance Graph
The following graph demonstrates a fi ve-year comparison of cumulative total
returns for NIKE’s Class B Common Stock, the Standard & Poor’s 500 Stock
Index, the Standard & Poor’s Apparel, Accessories & Luxury Goods Index,
and the Dow Jones U.S. Footwear Index. The graph assumes an investment
of $100 on May 31, 2006 in each of our Class B Common Stock, and the
stocks comprising the Standard & Poor’s 500 Stock Index, the Standard &
Poor’s Apparel, Accessories & Luxury Goods Index, and the Dow Jones U.S.
Footwear Index. Each of the indices assumes that all dividends were reinvested.
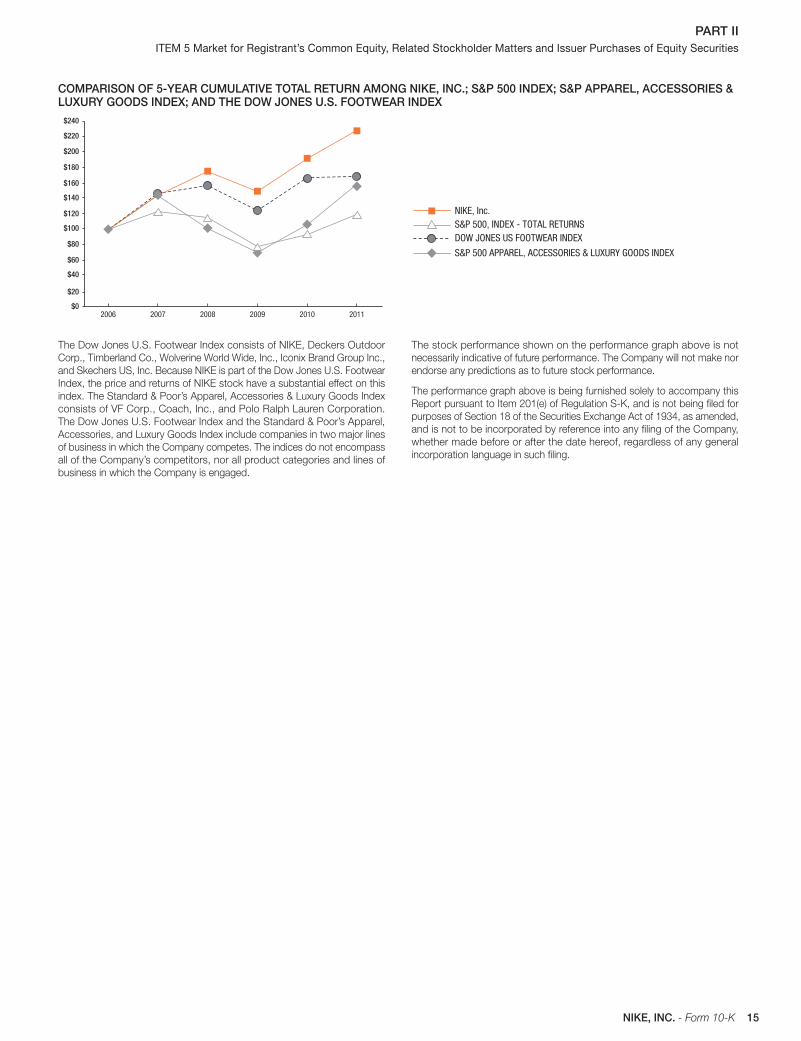
15NIKE, INC. - Form 10-K
PART II ITEM 5 Market for Registrant’s Common Equity, Related Stockholder Matters and Issuer Purchases of Equity Securities
COMPARISON OF 5-YEAR CUMULATIVE TOTAL RETURN AMONG NIKE, INC.; S&P 500 INDEX; S&P APPAREL, ACCESSORIES & LUXURY GOODS INDEX; AND THE DOW JONES U.S. FOOTWEAR INDEX
2006 20112010200920082007
$200
$220
$240
$180
$160
$140
$120
$100
$80
$60
$40
$20
$0
NIKE, Inc.
S&P 500 APPAREL, ACCESSORIES & LUXURY GOODS INDEX
DOW JONES US FOOTWEAR INDEXS&P 500, INDEX - TOTAL RETURNS
The Dow Jones U.S. Footwear Index consists of NIKE, Deckers Outdoor
Corp., Timberland Co., Wolverine World Wide, Inc., Iconix Brand Group Inc.,
and Skechers US, Inc. Because NIKE is part of the Dow Jones U.S. Footwear
Index, the price and returns of NIKE stock have a substantial effect on this
index. The Standard & Poor’s Apparel, Accessories & Luxury Goods Index
consists of VF Corp., Coach, Inc., and Polo Ralph Lauren Corporation.
The Dow Jones U.S. Footwear Index and the Standard & Poor’s Apparel,
Accessories, and Luxury Goods Index include companies in two major lines
of business in which the Company competes. The indices do not encompass
all of the Company’s competitors, nor all product categories and lines of
business in which the Company is engaged.
The stock performance shown on the performance graph above is not
necessarily indicative of future performance. The Company will not make nor
endorse any predictions as to future stock performance.
The performance graph above is being furnished solely to accompany this
Report pursuant to Item 201(e) of Regulation S-K, and is not being fi led for
purposes of Section 18 of the Securities Exchange Act of 1934, as amended,
and is not to be incorporated by reference into any fi ling of the Company,
whether made before or after the date hereof, regardless of any general
incorporation language in such fi ling.
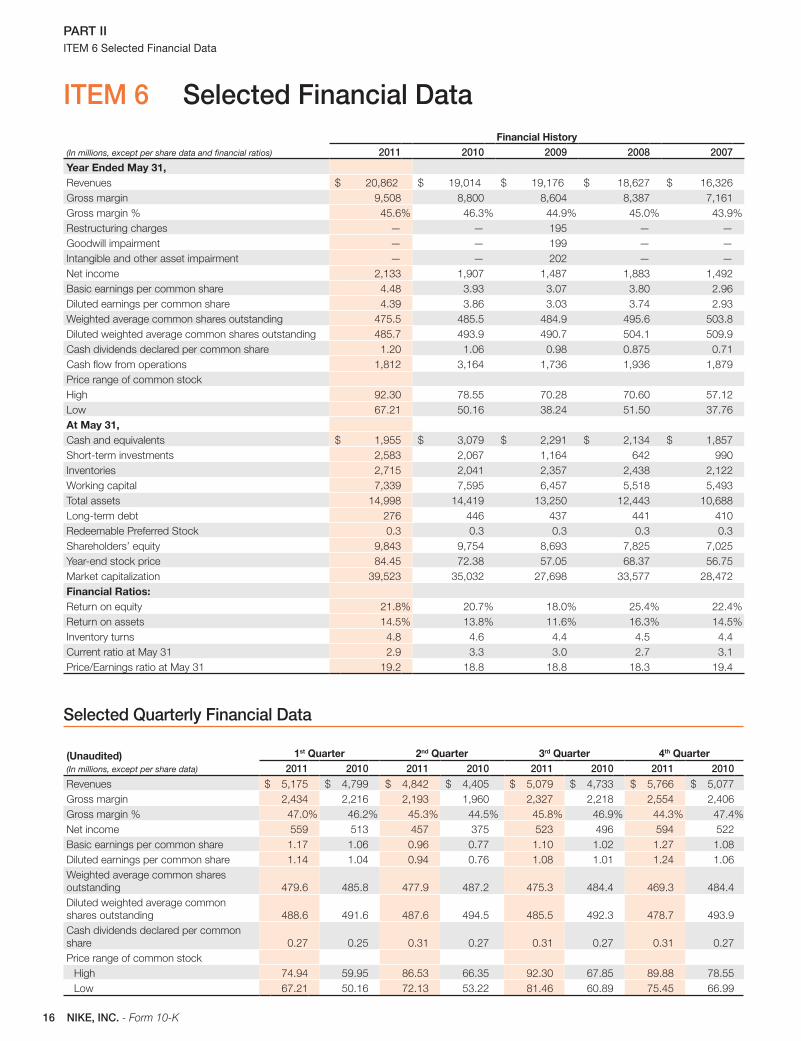
16 NIKE, INC. - Form 10-K
PART II ITEM 6 Selected Financial Data
ITEM 6 Selected Financial Data
(In millions, except per share data and fi nancial ratios)
Financial History 2011 2010 2009 2008 2007
Year Ended May 31,
Revenues $ 20,862 $ 19,014 $ 19,176 $ 18,627 $ 16,326
Gross margin 9,508 8,800 8,604 8,387 7,161
Gross margin % 45.6 % 46.3 % 44.9 % 45.0 % 43.9 %
Restructuring charges — — 195 — —
Goodwill impairment — — 199 — —
Intangible and other asset impairment — — 202 — —
Net income 2,133 1,907 1,487 1,883 1,492
Basic earnings per common share 4.48 3.93 3.07 3.80 2.96
Diluted earnings per common share 4.39 3.86 3.03 3.74 2.93
Weighted average common shares outstanding 475.5 485.5 484.9 495.6 503.8
Diluted weighted average common shares outstanding 485.7 493.9 490.7 504.1 509.9
Cash dividends declared per common share 1.20 1.06 0.98 0.875 0.71
Cash fl ow from operations 1,812 3,164 1,736 1,936 1,879
Price range of common stock
High 92.30 78.55 70.28 70.60 57.12
Low 67.21 50.16 38.24 51.50 37.76
At May 31,
Cash and equivalents $ 1,955 $ 3,079 $ 2,291 $ 2,134 $ 1,857
Short-term investments 2,583 2,067 1,164 642 990
Inventories 2,715 2,041 2,357 2,438 2,122
Working capital 7,339 7,595 6,457 5,518 5,493
Total assets 14,998 14,419 13,250 12,443 10,688
Long-term debt 276 446 437 441 410
Redeemable Preferred Stock 0.3 0.3 0.3 0.3 0.3
Shareholders’ equity 9,843 9,754 8,693 7,825 7,025
Year-end stock price 84.45 72.38 57.05 68.37 56.75
Market capitalization 39,523 35,032 27,698 33,577 28,472
Financial Ratios:
Return on equity 21.8 % 20.7 % 18.0 % 25.4 % 22.4 %
Return on assets 14.5 % 13.8 % 11.6 % 16.3 % 14.5 %
Inventory turns 4.8 4.6 4.4 4.5 4.4
Current ratio at May 31 2.9 3.3 3.0 2.7 3.1
Price/Earnings ratio at May 31 19.2 18.8 18.8 18.3 19.4
Selected Quarterly Financial Data
(Unaudited) (In millions, except per share data)
1st Quarter 2nd Quarter 3rd Quarter 4th Quarter 2011 2010 2011 2010 2011 2010 2011 2010
Revenues $ 5,175 $ 4,799 $ 4,842 $ 4,405 $ 5,079 $ 4,733 $ 5,766 $ 5,077
Gross margin 2,434 2,216 2,193 1,960 2,327 2,218 2,554 2,406
Gross margin % 47.0 % 46.2 % 45.3 % 44.5 % 45.8 % 46.9 % 44.3 % 47.4 %
Net income 559 513 457 375 523 496 594 522
Basic earnings per common share 1.17 1.06 0.96 0.77 1.10 1.02 1.27 1.08
Diluted earnings per common share 1.14 1.04 0.94 0.76 1.08 1.01 1.24 1.06
Weighted average common shares
outstanding 479.6 485.8 477.9 487.2 475.3 484.4 469.3 484.4
Diluted weighted average common
shares outstanding 488.6 491.6 487.6 494.5 485.5 492.3 478.7 493.9
Cash dividends declared per common
share 0.27 0.25 0.31 0.27 0.31 0.27 0.31 0.27
Price range of common stock
High 74.94 59.95 86.53 66.35 92.30 67.85 89.88 78.55
Low 67.21 50.16 72.13 53.22 81.46 60.89 75.45 66.99
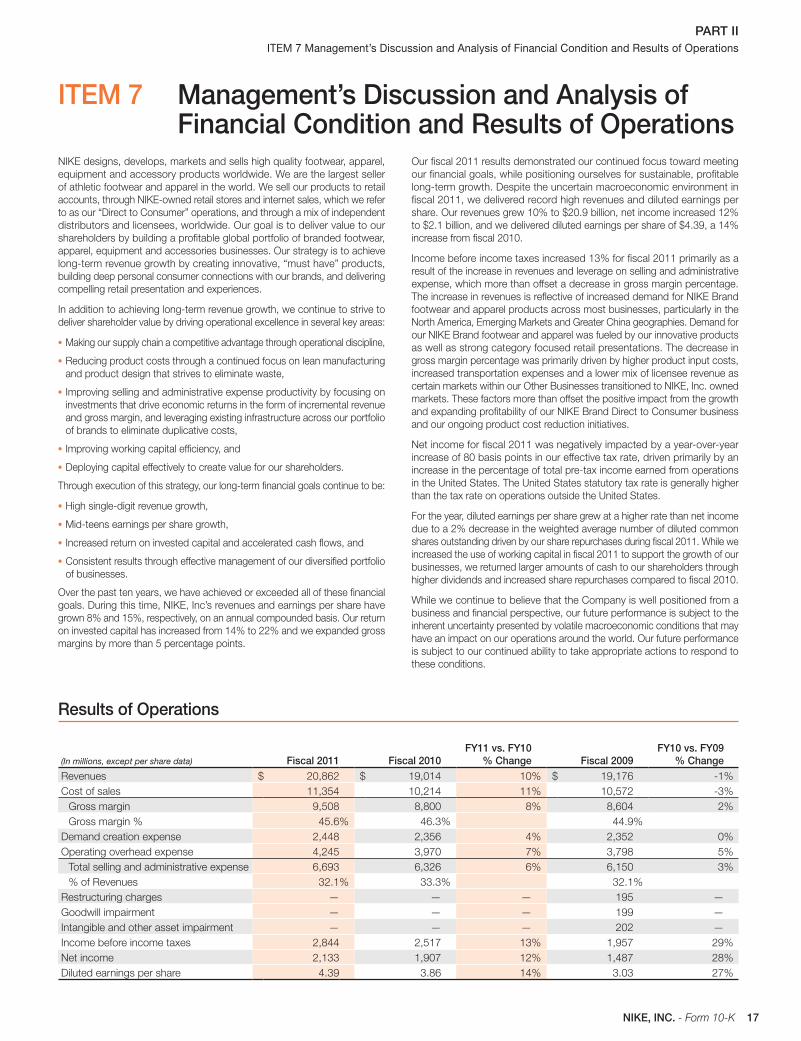
17NIKE, INC. - Form 10-K
PART II ITEM 7 Management’s Discussion and Analysis of Financial Condition and Results of Operations
ITEM 7 Management’s Discussion and Analysis of Financial Condition and Results of Operations
NIKE designs, develops, markets and sells high quality footwear, apparel,
equipment and accessory products worldwide. We are the largest seller
of athletic footwear and apparel in the world. We sell our products to retail
accounts, through NIKE-owned retail stores and internet sales, which we refer
to as our “Direct to Consumer” operations, and through a mix of independent
distributors and licensees, worldwide. Our goal is to deliver value to our
shareholders by building a profi table global portfolio of branded footwear,
apparel, equipment and accessories businesses. Our strategy is to achieve
long-term revenue growth by creating innovative, “must have” products,
building deep personal consumer connections with our brands, and delivering
compelling retail presentation and experiences.
In addition to achieving long-term revenue growth, we continue to strive to
deliver shareholder value by driving operational excellence in several key areas:
• Making our supply chain a competitive advantage through operational discipline,
• Reducing product costs through a continued focus on lean manufacturing
and product design that strives to eliminate waste,
• Improving selling and administrative expense productivity by focusing on
investments that drive economic returns in the form of incremental revenue
and gross margin, and leveraging existing infrastructure across our portfolio
of brands to eliminate duplicative costs,
• Improving working capital effi ciency, and
• Deploying capital effectively to create value for our shareholders.
Through execution of this strategy, our long-term fi nancial goals continue to be:
• High single-digit revenue growth,
• Mid-teens earnings per share growth,
• Increased return on invested capital and accelerated cash fl ows, and
• Consistent results through effective management of our diversifi ed portfolio
of businesses.
Over the past ten years, we have achieved or exceeded all of these fi nancial
goals. During this time, NIKE, Inc’s revenues and earnings per share have
grown 8% and 15%, respectively, on an annual compounded basis. Our return
on invested capital has increased from 14% to 22% and we expanded gross
margins by more than 5 percentage points.
Our fi scal 2011 results demonstrated our continued focus toward meeting
our fi nancial goals, while positioning ourselves for sustainable, profi table
long-term growth. Despite the uncertain macroeconomic environment in
fi scal 2011, we delivered record high revenues and diluted earnings per
share. Our revenues grew 10% to $20.9 billion, net income increased 12%
to $2.1 billion, and we delivered diluted earnings per share of $4.39, a 14%
increase from fi scal 2010.
Income before income taxes increased 13% for fi scal 2011 primarily as a
result of the increase in revenues and leverage on selling and administrative
expense, which more than offset a decrease in gross margin percentage.
The increase in revenues is refl ective of increased demand for NIKE Brand
footwear and apparel products across most businesses, particularly in the
North America, Emerging Markets and Greater China geographies. Demand for
our NIKE Brand footwear and apparel was fueled by our innovative products
as well as strong category focused retail presentations. The decrease in
gross margin percentage was primarily driven by higher product input costs,
increased transportation expenses and a lower mix of licensee revenue as
certain markets within our Other Businesses transitioned to NIKE, Inc. owned
markets. These factors more than offset the positive impact from the growth
and expanding profi tability of our NIKE Brand Direct to Consumer business
and our ongoing product cost reduction initiatives.
Net income for fi scal 2011 was negatively impacted by a year-over-year
increase of 80 basis points in our effective tax rate, driven primarily by an
increase in the percentage of total pre-tax income earned from operations
in the United States. The United States statutory tax rate is generally higher
than the tax rate on operations outside the United States.
For the year, diluted earnings per share grew at a higher rate than net income
due to a 2% decrease in the weighted average number of diluted common
shares outstanding driven by our share repurchases during fi scal 2011. While we
increased the use of working capital in fi scal 2011 to support the growth of our
businesses, we returned larger amounts of cash to our shareholders through
higher dividends and increased share repurchases compared to fi scal 2010.
While we continue to believe that the Company is well positioned from a
business and fi nancial perspective, our future performance is subject to the
inherent uncertainty presented by volatile macroeconomic conditions that may
have an impact on our operations around the world. Our future performance
is subject to our continued ability to take appropriate actions to respond to
these conditions.
Results of Operations
(In millions, except per share data) Fiscal 2011 Fiscal 2010 FY11 vs. FY10
% Change Fiscal 2009 FY10 vs. FY09
% Change Revenues $ 20,862 $ 19,014 10 % $ 19,176 -1 %
Cost of sales 11,354 10,214 11 % 10,572 -3 %
Gross margin 9,508 8,800 8 % 8,604 2 %
Gross margin % 45.6 % 46.3 % 44.9 %
Demand creation expense 2,448 2,356 4 % 2,352 0 %
Operating overhead expense 4,245 3,970 7 % 3,798 5 %
Total selling and administrative expense 6,693 6,326 6 % 6,150 3 %
% of Revenues 32.1 % 33.3 % 32.1 %
Restructuring charges — — — 195 —
Goodwill impairment — — — 199 —
Intangible and other asset impairment — — — 202 —
Income before income taxes 2,844 2,517 13 % 1,957 29 %
Net income 2,133 1,907 12 % 1,487 28 %
Diluted earnings per share 4.39 3.86 14 % 3.03 27 %
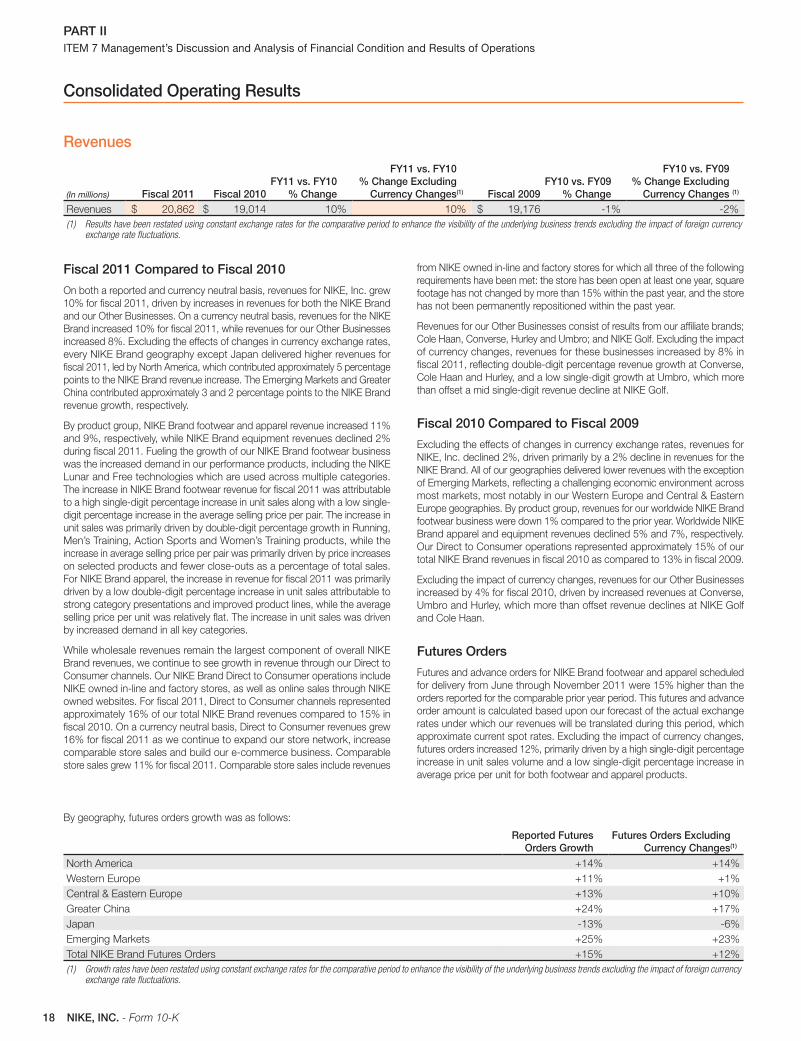
18 NIKE, INC. - Form 10-K
PART II ITEM 7 Management’s Discussion and Analysis of Financial Condition and Results of Operations
Consolidated Operating Results
Revenues
(In millions) Fiscal 2011 Fiscal 2010 FY11 vs. FY10
% Change
FY11 vs. FY10 % Change Excluding
Currency Changes (1) Fiscal 2009 FY10 vs. FY09
% Change
FY10 vs. FY09 % Change Excluding
Currency Changes (1)
Revenues $ 20,862 $ 19,014 10 % 10 % $ 19,176 -1 % -2 %
(1) Results have been restated using constant exchange rates for the comparative period to enhance the visibility of the underlying business trends excluding the impact of foreign currency exchange rate fluctuations.
Fiscal 2011 Compared to Fiscal 2010
On both a reported and currency neutral basis, revenues for NIKE, Inc. grew
10% for fi scal 2011, driven by increases in revenues for both the NIKE Brand
and our Other Businesses. On a currency neutral basis, revenues for the NIKE
Brand increased 10% for fi scal 2011, while revenues for our Other Businesses
increased 8%. Excluding the effects of changes in currency exchange rates,
every NIKE Brand geography except Japan delivered higher revenues for
fi scal 2011, led by North America, which contributed approximately 5 percentage
points to the NIKE Brand revenue increase. The Emerging Markets and Greater
China contributed approximately 3 and 2 percentage points to the NIKE Brand
revenue growth, respectively.
By product group, NIKE Brand footwear and apparel revenue increased 11%
and 9%, respectively, while NIKE Brand equipment revenues declined 2%
during fi scal 2011. Fueling the growth of our NIKE Brand footwear business
was the increased demand in our performance products, including the NIKE
Lunar and Free technologies which are used across multiple categories.
The increase in NIKE Brand footwear revenue for fi scal 2011 was attributable
to a high single-digit percentage increase in unit sales along with a low single-
digit percentage increase in the average selling price per pair. The increase in
unit sales was primarily driven by double-digit percentage growth in Running,
Men’s Training, Action Sports and Women’s Training products, while the
increase in average selling price per pair was primarily driven by price increases
on selected products and fewer close-outs as a percentage of total sales.
For NIKE Brand apparel, the increase in revenue for fi scal 2011 was primarily
driven by a low double-digit percentage increase in unit sales attributable to
strong category presentations and improved product lines, while the average
selling price per unit was relatively fl at. The increase in unit sales was driven
by increased demand in all key categories.
While wholesale revenues remain the largest component of overall NIKE
Brand revenues, we continue to see growth in revenue through our Direct to
Consumer channels. Our NIKE Brand Direct to Consumer operations include
NIKE owned in-line and factory stores, as well as online sales through NIKE
owned websites. For fi scal 2011, Direct to Consumer channels represented
approximately 16% of our total NIKE Brand revenues compared to 15% in
fi scal 2010. On a currency neutral basis, Direct to Consumer revenues grew
16% for fi scal 2011 as we continue to expand our store network, increase
comparable store sales and build our e-commerce business. Comparable
store sales grew 11% for fi scal 2011. Comparable store sales include revenues
from NIKE owned in-line and factory stores for which all three of the following
requirements have been met: the store has been open at least one year, square
footage has not changed by more than 15% within the past year, and the store
has not been permanently repositioned within the past year.
Revenues for our Other Businesses consist of results from our affi liate brands;
Cole Haan, Converse, Hurley and Umbro; and NIKE Golf. Excluding the impact
of currency changes, revenues for these businesses increased by 8% in
fi scal 2011, refl ecting double-digit percentage revenue growth at Converse,
Cole Haan and Hurley, and a low single-digit growth at Umbro, which more
than offset a mid single-digit revenue decline at NIKE Golf.
Fiscal 2010 Compared to Fiscal 2009
Excluding the effects of changes in currency exchange rates, revenues for
NIKE, Inc. declined 2%, driven primarily by a 2% decline in revenues for the
NIKE Brand. All of our geographies delivered lower revenues with the exception
of Emerging Markets, refl ecting a challenging economic environment across
most markets, most notably in our Western Europe and Central & Eastern
Europe geographies. By product group, revenues for our worldwide NIKE Brand
footwear business were down 1% compared to the prior year. Worldwide NIKE
Brand apparel and equipment revenues declined 5% and 7%, respectively.
Our Direct to Consumer operations represented approximately 15% of our
total NIKE Brand revenues in fi scal 2010 as compared to 13% in fi scal 2009.
Excluding the impact of currency changes, revenues for our Other Businesses
increased by 4% for fi scal 2010, driven by increased revenues at Converse,
Umbro and Hurley, which more than offset revenue declines at NIKE Golf
and Cole Haan.
Futures Orders
Futures and advance orders for NIKE Brand footwear and apparel scheduled
for delivery from June through November 2011 were 15% higher than the
orders reported for the comparable prior year period. This futures and advance
order amount is calculated based upon our forecast of the actual exchange
rates under which our revenues will be translated during this period, which
approximate current spot rates. Excluding the impact of currency changes,
futures orders increased 12%, primarily driven by a high single-digit percentage
increase in unit sales volume and a low single-digit percentage increase in
average price per unit for both footwear and apparel products.
By geography, futures orders growth was as follows:
Reported Futures Orders Growth
Futures Orders Excluding Currency Changes (1)
North America +14 % +14 %
Western Europe +11 % +1 %
Central & Eastern Europe +13 % +10 %
Greater China +24 % +17 %
Japan -13 % -6 %
Emerging Markets +25 % +23 %
Total NIKE Brand Futures Orders +15 % +12 %
(1) Growth rates have been restated using constant exchange rates for the comparative period to enhance the visibility of the underlying business trends excluding the impact of foreign currency exchange rate fluctuations.
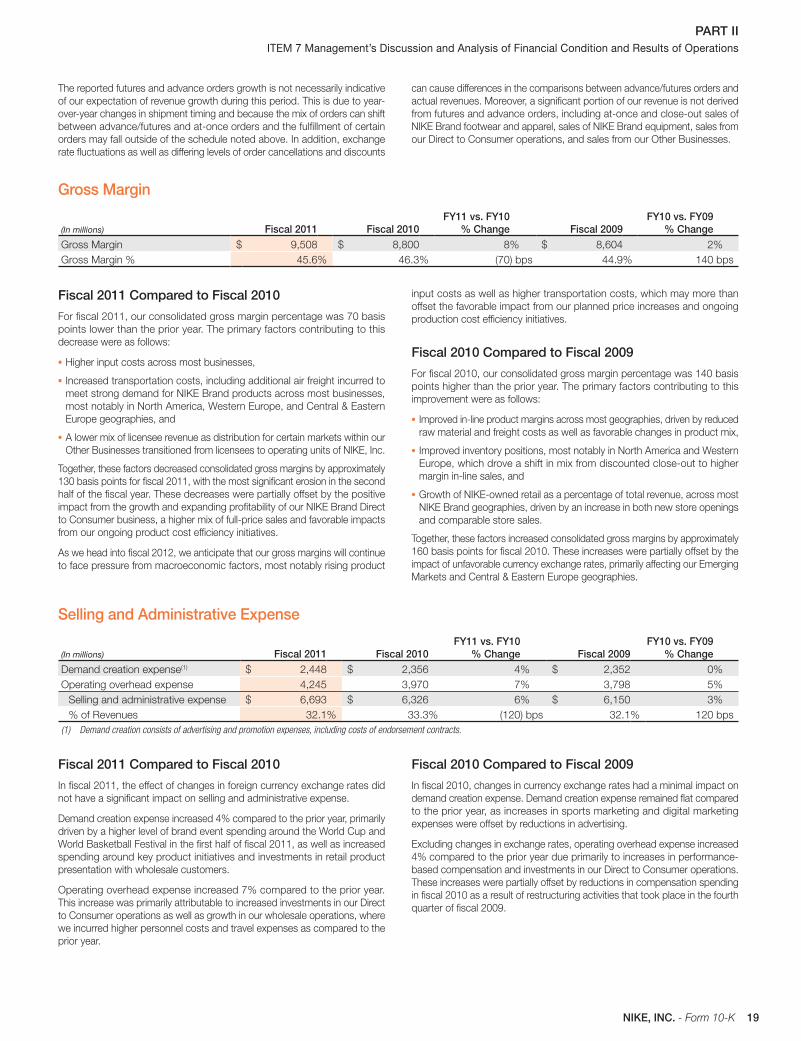
19NIKE, INC. - Form 10-K
PART II ITEM 7 Management’s Discussion and Analysis of Financial Condition and Results of Operations
The reported futures and advance orders growth is not necessarily indicative
of our expectation of revenue growth during this period. This is due to year-
over-year changes in shipment timing and because the mix of orders can shift
between advance/futures and at-once orders and the fulfi llment of certain
orders may fall outside of the schedule noted above. In addition, exchange
rate fl uctuations as well as differing levels of order cancellations and discounts
can cause differences in the comparisons between advance/futures orders and
actual revenues. Moreover, a signifi cant portion of our revenue is not derived
from futures and advance orders, including at-once and close-out sales of
NIKE Brand footwear and apparel, sales of NIKE Brand equipment, sales from
our Direct to Consumer operations, and sales from our Other Businesses.
Gross Margin
(In millions) Fiscal 2011 Fiscal 2010 FY11 vs. FY10
% Change Fiscal 2009 FY10 vs. FY09
% Change Gross Margin $ 9,508 $ 8,800 8 % $ 8,604 2 %
Gross Margin % 45.6 % 46.3 % (70 ) bps 44.9 % 140 bps
Fiscal 2011 Compared to Fiscal 2010
For fi scal 2011, our consolidated gross margin percentage was 70 basis
points lower than the prior year. The primary factors contributing to this
decrease were as follows:
• Higher input costs across most businesses,
• Increased transportation costs, including additional air freight incurred to
meet strong demand for NIKE Brand products across most businesses,
most notably in North America, Western Europe, and Central & Eastern
Europe geographies, and
• A lower mix of licensee revenue as distribution for certain markets within our
Other Businesses transitioned from licensees to operating units of NIKE, Inc.
Together, these factors decreased consolidated gross margins by approximately
130 basis points for fi scal 2011, with the most signifi cant erosion in the second
half of the fi scal year. These decreases were partially offset by the positive
impact from the growth and expanding profi tability of our NIKE Brand Direct
to Consumer business, a higher mix of full-price sales and favorable impacts
from our ongoing product cost effi ciency initiatives.
As we head into fi scal 2012, we anticipate that our gross margins will continue
to face pressure from macroeconomic factors, most notably rising product
input costs as well as higher transportation costs, which may more than
offset the favorable impact from our planned price increases and ongoing
production cost effi ciency initiatives.
Fiscal 2010 Compared to Fiscal 2009
For fi scal 2010, our consolidated gross margin percentage was 140 basis
points higher than the prior year. The primary factors contributing to this
improvement were as follows:
• Improved in-line product margins across most geographies, driven by reduced
raw material and freight costs as well as favorable changes in product mix,
• Improved inventory positions, most notably in North America and Western
Europe, which drove a shift in mix from discounted close-out to higher
margin in-line sales, and
• Growth of NIKE-owned retail as a percentage of total revenue, across most
NIKE Brand geographies, driven by an increase in both new store openings
and comparable store sales.
Together, these factors increased consolidated gross margins by approximately
160 basis points for fi scal 2010. These increases were partially offset by the
impact of unfavorable currency exchange rates, primarily affecting our Emerging
Markets and Central & Eastern Europe geographies.
Selling and Administrative Expense
(In millions) Fiscal 2011 Fiscal 2010 FY11 vs. FY10
% Change Fiscal 2009 FY10 vs. FY09
% Change Demand creation expense (1) $ 2,448 $ 2,356 4 % $ 2,352 0 %
Operating overhead expense 4,245 3,970 7 % 3,798 5 %
Selling and administrative expense $ 6,693 $ 6,326 6 % $ 6,150 3 %
% of Revenues 32.1 % 33.3 % (120 ) bps 32.1 % 120 bps
(1) Demand creation consists of advertising and promotion expenses, including costs of endorsement contracts.
Fiscal 2011 Compared to Fiscal 2010
In fi scal 2011, the effect of changes in foreign currency exchange rates did
not have a signifi cant impact on selling and administrative expense.
Demand creation expense increased 4% compared to the prior year, primarily
driven by a higher level of brand event spending around the World Cup and
World Basketball Festival in the fi rst half of fi scal 2011, as well as increased
spending around key product initiatives and investments in retail product
presentation with wholesale customers.
Operating overhead expense increased 7% compared to the prior year.
This increase was primarily attributable to increased investments in our Direct
to Consumer operations as well as growth in our wholesale operations, where
we incurred higher personnel costs and travel expenses as compared to the
prior year.
Fiscal 2010 Compared to Fiscal 2009
In fi scal 2010, changes in currency exchange rates had a minimal impact on
demand creation expense. Demand creation expense remained fl at compared
to the prior year, as increases in sports marketing and digital marketing
expenses were offset by reductions in advertising.
Excluding changes in exchange rates, operating overhead expense increased
4% compared to the prior year due primarily to increases in performance-
based compensation and investments in our Direct to Consumer operations.
These increases were partially offset by reductions in compensation spending
in fi scal 2010 as a result of restructuring activities that took place in the fourth
quarter of fi scal 2009.
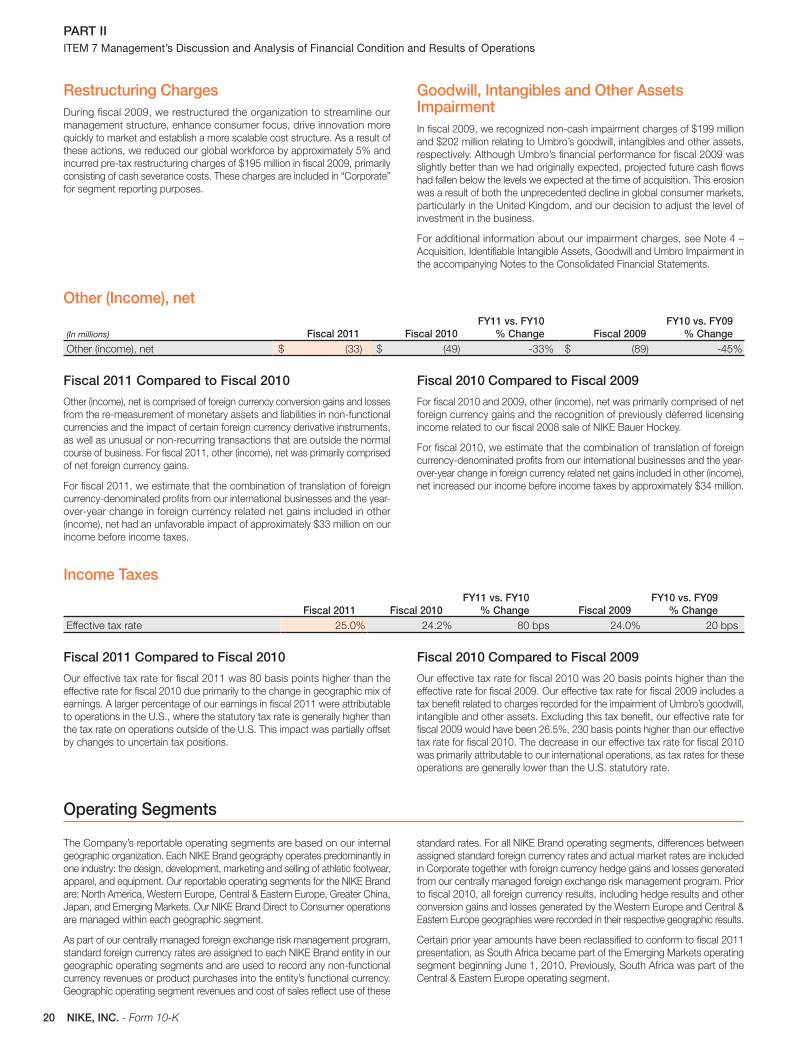
20 NIKE, INC. - Form 10-K
PART II ITEM 7 Management’s Discussion and Analysis of Financial Condition and Results of Operations
Restructuring Charges During fi scal 2009, we restructured the organization to streamline our
management structure, enhance consumer focus, drive innovation more
quickly to market and establish a more scalable cost structure. As a result of
these actions, we reduced our global workforce by approximately 5% and
incurred pre-tax restructuring charges of $195 million in fi scal 2009, primarily
consisting of cash severance costs. These charges are included in “Corporate”
for segment reporting purposes.
Goodwill, Intangibles and Other Assets Impairment In fi scal 2009, we recognized non-cash impairment charges of $199 million
and $202 million relating to Umbro’s goodwill, intangibles and other assets,
respectively. Although Umbro’s fi nancial performance for fi scal 2009 was
slightly better than we had originally expected, projected future cash fl ows
had fallen below the levels we expected at the time of acquisition. This erosion
was a result of both the unprecedented decline in global consumer markets,
particularly in the United Kingdom, and our decision to adjust the level of
investment in the business.
For additional information about our impairment charges, see Note 4 –
Acquisition, Identifi able Intangible Assets, Goodwill and Umbro Impairment in
the accompanying Notes to the Consolidated Financial Statements.
Other (Income), net
(In millions) Fiscal 2011 Fiscal 2010 FY11 vs. FY10
% Change Fiscal 2009 FY10 vs. FY09
% Change Other (income), net $ (33 ) $ (49 ) -33 % $ (89 ) -45 %
Fiscal 2011 Compared to Fiscal 2010
Other (income), net is comprised of foreign currency conversion gains and losses
from the re-measurement of monetary assets and liabilities in non-functional
currencies and the impact of certain foreign currency derivative instruments,
as well as unusual or non-recurring transactions that are outside the normal
course of business. For fi scal 2011, other (income), net was primarily comprised
of net foreign currency gains.
For fi scal 2011, we estimate that the combination of translation of foreign
currency-denominated profi ts from our international businesses and the year-
over-year change in foreign currency related net gains included in other
(income), net had an unfavorable impact of approximately $33 million on our
income before income taxes.
Fiscal 2010 Compared to Fiscal 2009
For fi scal 2010 and 2009, other (income), net was primarily comprised of net
foreign currency gains and the recognition of previously deferred licensing
income related to our fi scal 2008 sale of NIKE Bauer Hockey.
For fi scal 2010, we estimate that the combination of translation of foreign
currency-denominated profi ts from our international businesses and the year-
over-year change in foreign currency related net gains included in other (income),
net increased our income before income taxes by approximately $34 million.
Income Taxes
Fiscal 2011 Fiscal 2010 FY11 vs. FY10
% Change Fiscal 2009 FY10 vs. FY09
% Change Effective tax rate 25.0 % 24.2 % 80 bps 24.0 % 20 bps
Fiscal 2011 Compared to Fiscal 2010
Our effective tax rate for fi scal 2011 was 80 basis points higher than the
effective rate for fi scal 2010 due primarily to the change in geographic mix of
earnings. A larger percentage of our earnings in fi scal 2011 were attributable
to operations in the U.S., where the statutory tax rate is generally higher than
the tax rate on operations outside of the U.S. This impact was partially offset
by changes to uncertain tax positions.
Fiscal 2010 Compared to Fiscal 2009
Our effective tax rate for fi scal 2010 was 20 basis points higher than the
effective rate for fi scal 2009. Our effective tax rate for fi scal 2009 includes a
tax benefi t related to charges recorded for the impairment of Umbro’s goodwill,
intangible and other assets. Excluding this tax benefi t, our effective rate for
fi scal 2009 would have been 26.5%, 230 basis points higher than our effective
tax rate for fi scal 2010. The decrease in our effective tax rate for fi scal 2010
was primarily attributable to our international operations, as tax rates for these
operations are generally lower than the U.S. statutory rate.
Operating Segments
The Company’s reportable operating segments are based on our internal
geographic organization. Each NIKE Brand geography operates predominantly in
one industry: the design, development, marketing and selling of athletic footwear,
apparel, and equipment. Our reportable operating segments for the NIKE Brand
are: North America, Western Europe, Central & Eastern Europe, Greater China,
Japan, and Emerging Markets. Our NIKE Brand Direct to Consumer operations
are managed within each geographic segment.
As part of our centrally managed foreign exchange risk management program,
standard foreign currency rates are assigned to each NIKE Brand entity in our
geographic operating segments and are used to record any non-functional
currency revenues or product purchases into the entity’s functional currency.
Geographic operating segment revenues and cost of sales refl ect use of these
standard rates. For all NIKE Brand operating segments, differences between
assigned standard foreign currency rates and actual market rates are included
in Corporate together with foreign currency hedge gains and losses generated
from our centrally managed foreign exchange risk management program. Prior
to fi scal 2010, all foreign currency results, including hedge results and other
conversion gains and losses generated by the Western Europe and Central &
Eastern Europe geographies were recorded in their respective geographic results.
Certain prior year amounts have been reclassifi ed to conform to fi scal 2011
presentation, as South Africa became part of the Emerging Markets operating
segment beginning June 1, 2010. Previously, South Africa was part of the
Central & Eastern Europe operating segment.
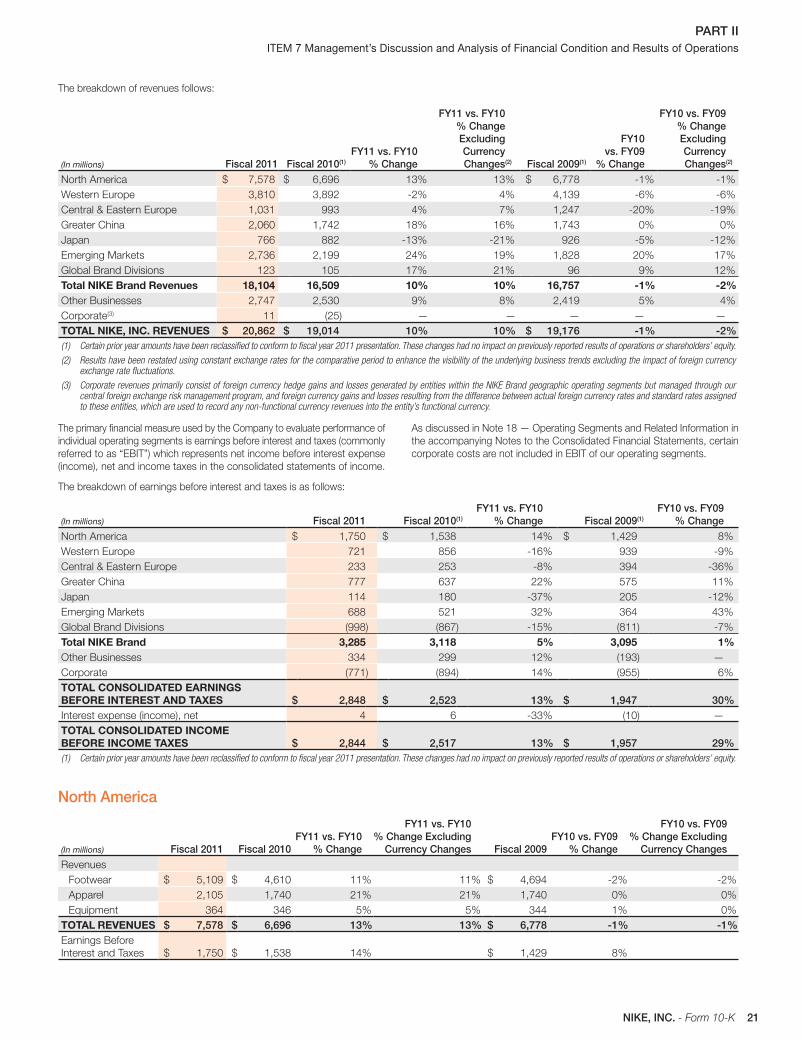
21NIKE, INC. - Form 10-K
PART II ITEM 7 Management’s Discussion and Analysis of Financial Condition and Results of Operations
The breakdown of revenues follows:
(In millions) Fiscal 2011 Fiscal 2010 (1)
FY11 vs. FY10 % Change
FY11 vs. FY10 % Change Excluding Currency Changes (2) Fiscal 2009 (1)
FY10 vs. FY09
% Change
FY10 vs. FY09 % Change Excluding Currency Changes (2)
North America $ 7,578 $ 6,696 13 % 13 % $ 6,778 -1 % -1 %
Western Europe 3,810 3,892 -2 % 4 % 4,139 -6 % -6 %
Central & Eastern Europe 1,031 993 4 % 7 % 1,247 -20 % -19 %
Greater China 2,060 1,742 18 % 16 % 1,743 0 % 0 %
Japan 766 882 -13 % -21 % 926 -5 % -12 %
Emerging Markets 2,736 2,199 24 % 19 % 1,828 20 % 17 %
Global Brand Divisions 123 105 17 % 21 % 96 9 % 12 %
Total NIKE Brand Revenues 18,104 16,509 10 % 10 % 16,757 -1 % -2 % Other Businesses 2,747 2,530 9 % 8 % 2,419 5 % 4 %
Corporate (3) 11 (25 ) — — — — —
TOTAL NIKE, INC. REVENUES $ 20,862 $ 19,014 10 % 10 % $ 19,176 -1 % -2 % (1) Certain prior year amounts have been reclassified to conform to fiscal year 2011 presentation. These changes had no impact on previously reported results of operations or shareholders’ equity.
(2) Results have been restated using constant exchange rates for the comparative period to enhance the visibility of the underlying business trends excluding the impact of foreign currency exchange rate fluctuations.
(3) Corporate revenues primarily consist of foreign currency hedge gains and losses generated by entities within the NIKE Brand geographic operating segments but managed through our central foreign exchange risk management program, and foreign currency gains and losses resulting from the difference between actual foreign currency rates and standard rates assigned to these entities, which are used to record any non-functional currency revenues into the entity’s functional currency.
The primary fi nancial measure used by the Company to evaluate performance of
individual operating segments is earnings before interest and taxes (commonly
referred to as “EBIT”) which represents net income before interest expense
(income), net and income taxes in the consolidated statements of income.
As discussed in Note 18 — Operating Segments and Related Information in
the accompanying Notes to the Consolidated Financial Statements, certain
corporate costs are not included in EBIT of our operating segments.
The breakdown of earnings before interest and taxes is as follows:
(In millions) Fiscal 2011 Fiscal 2010 (1)
FY11 vs. FY10 % Change Fiscal 2009 (1)
FY10 vs. FY09 % Change
North America $ 1,750 $ 1,538 14 % $ 1,429 8 %
Western Europe 721 856 -16 % 939 -9 %
Central & Eastern Europe 233 253 -8 % 394 -36 %
Greater China 777 637 22 % 575 11 %
Japan 114 180 -37 % 205 -12 %
Emerging Markets 688 521 32 % 364 43 %
Global Brand Divisions (998 ) (867 ) -15 % (811 ) -7 %
Total NIKE Brand 3,285 3,118 5 % 3,095 1 % Other Businesses 334 299 12 % (193 ) —
Corporate (771 ) (894 ) 14 % (955 ) 6 %
TOTAL CONSOLIDATED EARNINGS BEFORE INTEREST AND TAXES $ 2,848 $ 2,523 13 % $ 1,947 30 % Interest expense (income), net 4 6 -33 % (10 ) —
TOTAL CONSOLIDATED INCOME BEFORE INCOME TAXES $ 2,844 $ 2,517 13 % $ 1,957 29 % (1) Certain prior year amounts have been reclassified to conform to fiscal year 2011 presentation. These changes had no impact on previously reported results of operations or shareholders’ equity.
North America
(In millions) Fiscal 2011 Fiscal 2010 FY11 vs. FY10
% Change
FY11 vs. FY10 % Change Excluding
Currency Changes Fiscal 2009 FY10 vs. FY09
% Change
FY10 vs. FY09 % Change Excluding
Currency Changes Revenues
Footwear $ 5,109 $ 4,610 11 % 11 % $ 4,694 -2 % -2 %
Apparel 2,105 1,740 21 % 21 % 1,740 0 % 0 %
Equipment 364 346 5 % 5 % 344 1 % 0 %
TOTAL REVENUES $ 7,578 $ 6,696 13 % 13 % $ 6,778 -1 % -1 % Earnings Before
Interest and Taxes $ 1,750 $ 1,538 14 % $ 1,429 8 %
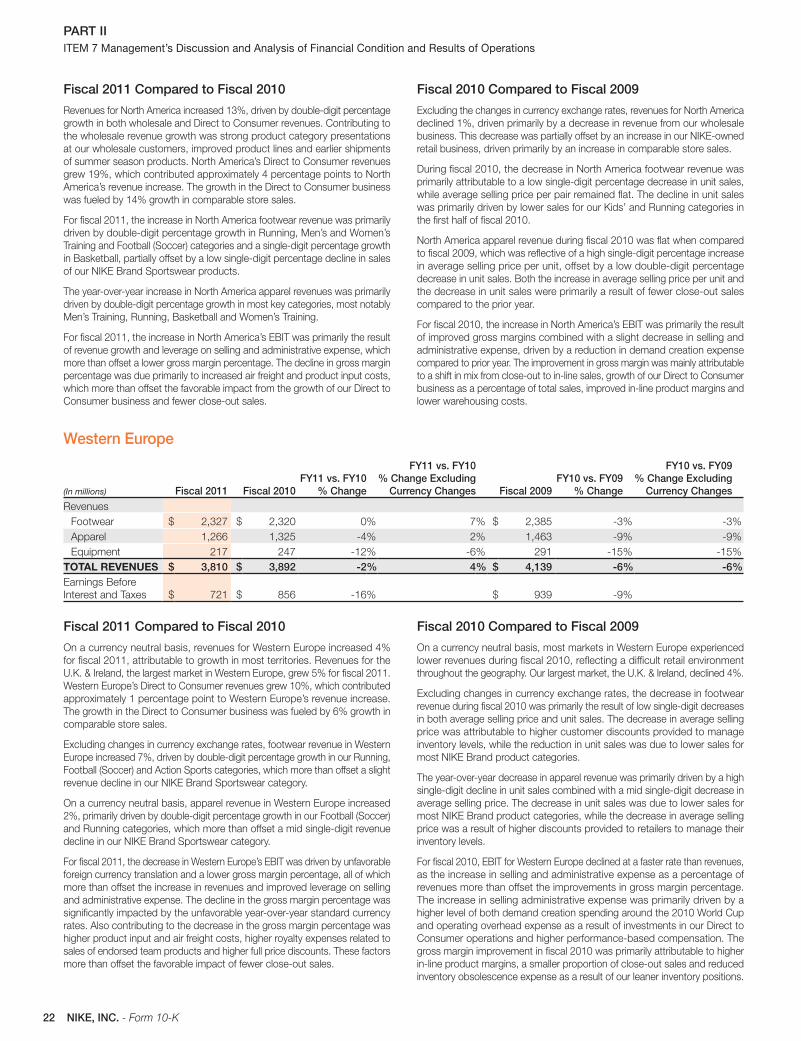
22 NIKE, INC. - Form 10-K
PART II ITEM 7 Management’s Discussion and Analysis of Financial Condition and Results of Operations
Fiscal 2011 Compared to Fiscal 2010
Revenues for North America increased 13%, driven by double-digit percentage
growth in both wholesale and Direct to Consumer revenues. Contributing to
the wholesale revenue growth was strong product category presentations
at our wholesale customers, improved product lines and earlier shipments
of summer season products. North America’s Direct to Consumer revenues
grew 19%, which contributed approximately 4 percentage points to North
America’s revenue increase. The growth in the Direct to Consumer business
was fueled by 14% growth in comparable store sales.
For fi scal 2011, the increase in North America footwear revenue was primarily
driven by double-digit percentage growth in Running, Men’s and Women’s
Training and Football (Soccer) categories and a single-digit percentage growth
in Basketball, partially offset by a low single-digit percentage decline in sales
of our NIKE Brand Sportswear products.
The year-over-year increase in North America apparel revenues was primarily
driven by double-digit percentage growth in most key categories, most notably
Men’s Training, Running, Basketball and Women’s Training.
For fi scal 2011, the increase in North America’s EBIT was primarily the result
of revenue growth and leverage on selling and administrative expense, which
more than offset a lower gross margin percentage. The decline in gross margin
percentage was due primarily to increased air freight and product input costs,
which more than offset the favorable impact from the growth of our Direct to
Consumer business and fewer close-out sales.
Fiscal 2010 Compared to Fiscal 2009
Excluding the changes in currency exchange rates, revenues for North America
declined 1%, driven primarily by a decrease in revenue from our wholesale
business. This decrease was partially offset by an increase in our NIKE-owned
retail business, driven primarily by an increase in comparable store sales.
During fi scal 2010, the decrease in North America footwear revenue was
primarily attributable to a low single-digit percentage decrease in unit sales,
while average selling price per pair remained fl at. The decline in unit sales
was primarily driven by lower sales for our Kids’ and Running categories in
the fi rst half of fi scal 2010.
North America apparel revenue during fi scal 2010 was fl at when compared
to fi scal 2009, which was refl ective of a high single-digit percentage increase
in average selling price per unit, offset by a low double-digit percentage
decrease in unit sales. Both the increase in average selling price per unit and
the decrease in unit sales were primarily a result of fewer close-out sales
compared to the prior year.
For fi scal 2010, the increase in North America’s EBIT was primarily the result
of improved gross margins combined with a slight decrease in selling and
administrative expense, driven by a reduction in demand creation expense
compared to prior year. The improvement in gross margin was mainly attributable
to a shift in mix from close-out to in-line sales, growth of our Direct to Consumer
business as a percentage of total sales, improved in-line product margins and
lower warehousing costs.
Western Europe
(In millions) Fiscal 2011 Fiscal 2010 FY11 vs. FY10
% Change
FY11 vs. FY10 % Change Excluding
Currency Changes Fiscal 2009 FY10 vs. FY09
% Change
FY10 vs. FY09 % Change Excluding
Currency Changes Revenues
Footwear $ 2,327 $ 2,320 0 % 7 % $ 2,385 -3 % -3 %
Apparel 1,266 1,325 -4 % 2 % 1,463 -9 % -9 %
Equipment 217 247 -12 % -6 % 291 -15 % -15 %
TOTAL REVENUES $ 3,810 $ 3,892 -2 % 4 % $ 4,139 -6 % -6 % Earnings Before
Interest and Taxes $ 721 $ 856 -16 % $ 939 -9 %
Fiscal 2011 Compared to Fiscal 2010
On a currency neutral basis, revenues for Western Europe increased 4%
for fi scal 2011, attributable to growth in most territories. Revenues for the
U.K. & Ireland, the largest market in Western Europe, grew 5% for fi scal 2011.
Western Europe’s Direct to Consumer revenues grew 10%, which contributed
approximately 1 percentage point to Western Europe’s revenue increase.
The growth in the Direct to Consumer business was fueled by 6% growth in
comparable store sales.
Excluding changes in currency exchange rates, footwear revenue in Western
Europe increased 7%, driven by double-digit percentage growth in our Running,
Football (Soccer) and Action Sports categories, which more than offset a slight
revenue decline in our NIKE Brand Sportswear category.
On a currency neutral basis, apparel revenue in Western Europe increased
2%, primarily driven by double-digit percentage growth in our Football (Soccer)
and Running categories, which more than offset a mid single-digit revenue
decline in our NIKE Brand Sportswear category.
For fi scal 2011, the decrease in Western Europe’s EBIT was driven by unfavorable
foreign currency translation and a lower gross margin percentage, all of which
more than offset the increase in revenues and improved leverage on selling
and administrative expense. The decline in the gross margin percentage was
signifi cantly impacted by the unfavorable year-over-year standard currency
rates. Also contributing to the decrease in the gross margin percentage was
higher product input and air freight costs, higher royalty expenses related to
sales of endorsed team products and higher full price discounts. These factors
more than offset the favorable impact of fewer close-out sales.
Fiscal 2010 Compared to Fiscal 2009
On a currency neutral basis, most markets in Western Europe experienced
lower revenues during fi scal 2010, refl ecting a diffi cult retail environment
throughout the geography. Our largest market, the U.K. & Ireland, declined 4%.
Excluding changes in currency exchange rates, the decrease in footwear
revenue during fi scal 2010 was primarily the result of low single-digit decreases
in both average selling price and unit sales. The decrease in average selling
price was attributable to higher customer discounts provided to manage
inventory levels, while the reduction in unit sales was due to lower sales for
most NIKE Brand product categories.
The year-over-year decrease in apparel revenue was primarily driven by a high
single-digit decline in unit sales combined with a mid single-digit decrease in
average selling price. The decrease in unit sales was due to lower sales for
most NIKE Brand product categories, while the decrease in average selling
price was a result of higher discounts provided to retailers to manage their
inventory levels.
For fi scal 2010, EBIT for Western Europe declined at a faster rate than revenues,
as the increase in selling and administrative expense as a percentage of
revenues more than offset the improvements in gross margin percentage.
The increase in selling administrative expense was primarily driven by a
higher level of both demand creation spending around the 2010 World Cup
and operating overhead expense as a result of investments in our Direct to
Consumer operations and higher performance-based compensation. The
gross margin improvement in fi scal 2010 was primarily attributable to higher
in-line product margins, a smaller proportion of close-out sales and reduced
inventory obsolescence expense as a result of our leaner inventory positions.
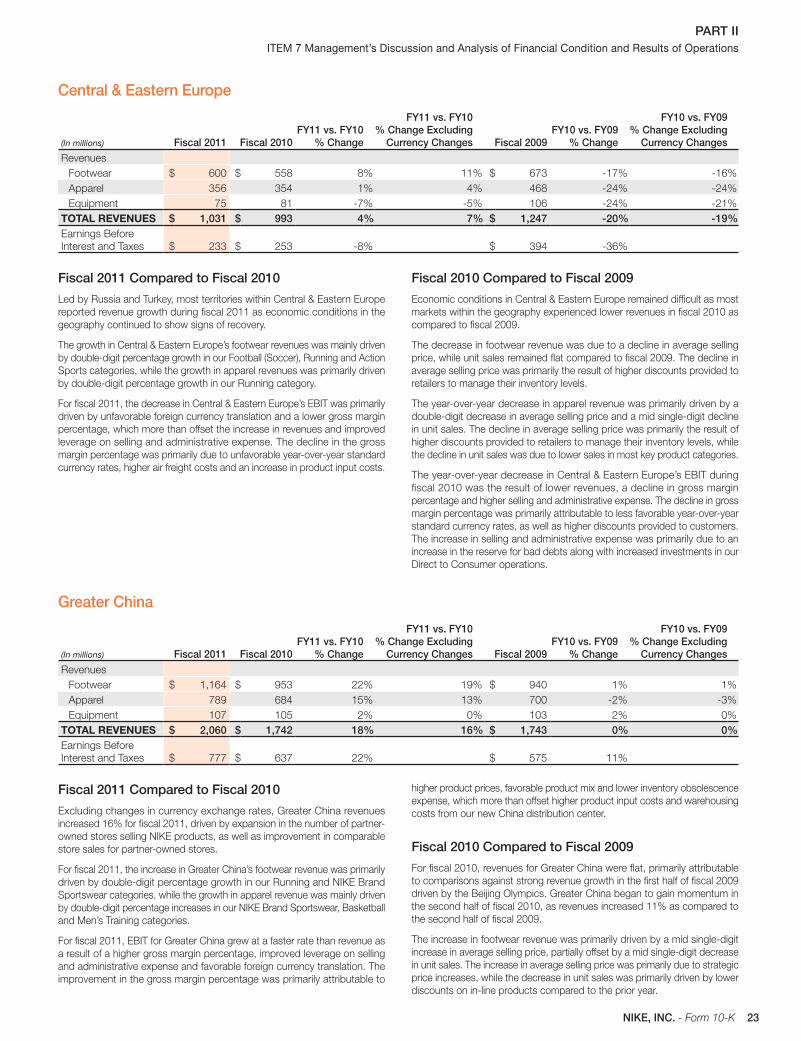
23NIKE, INC. - Form 10-K
PART II ITEM 7 Management’s Discussion and Analysis of Financial Condition and Results of Operations
Central & Eastern Europe
(In millions) Fiscal 2011 Fiscal 2010 FY11 vs. FY10
% Change
FY11 vs. FY10 % Change Excluding
Currency Changes Fiscal 2009 FY10 vs. FY09
% Change
FY10 vs. FY09 % Change Excluding
Currency Changes Revenues
Footwear $ 600 $ 558 8 % 11 % $ 673 -17 % -16 %
Apparel 356 354 1 % 4 % 468 -24 % -24 %
Equipment 75 81 -7 % -5 % 106 -24 % -21 %
TOTAL REVENUES $ 1,031 $ 993 4 % 7 % $ 1,247 -20 % -19 % Earnings Before
Interest and Taxes $ 233 $ 253 -8 % $ 394 -36 %
Fiscal 2011 Compared to Fiscal 2010
Led by Russia and Turkey, most territories within Central & Eastern Europe
reported revenue growth during fi scal 2011 as economic conditions in the
geography continued to show signs of recovery.
The growth in Central & Eastern Europe’s footwear revenues was mainly driven
by double-digit percentage growth in our Football (Soccer), Running and Action
Sports categories, while the growth in apparel revenues was primarily driven
by double-digit percentage growth in our Running category.
For fi scal 2011, the decrease in Central & Eastern Europe’s EBIT was primarily
driven by unfavorable foreign currency translation and a lower gross margin
percentage, which more than offset the increase in revenues and improved
leverage on selling and administrative expense. The decline in the gross
margin percentage was primarily due to unfavorable year-over-year standard
currency rates, higher air freight costs and an increase in product input costs.
Fiscal 2010 Compared to Fiscal 2009
Economic conditions in Central & Eastern Europe remained diffi cult as most
markets within the geography experienced lower revenues in fi scal 2010 as
compared to fi scal 2009.
The decrease in footwear revenue was due to a decline in average selling
price, while unit sales remained fl at compared to fi scal 2009. The decline in
average selling price was primarily the result of higher discounts provided to
retailers to manage their inventory levels.
The year-over-year decrease in apparel revenue was primarily driven by a
double-digit decrease in average selling price and a mid single-digit decline
in unit sales. The decline in average selling price was primarily the result of
higher discounts provided to retailers to manage their inventory levels, while
the decline in unit sales was due to lower sales in most key product categories.
The year-over-year decrease in Central & Eastern Europe’s EBIT during
fi scal 2010 was the result of lower revenues, a decline in gross margin
percentage and higher selling and administrative expense. The decline in gross
margin percentage was primarily attributable to less favorable year-over-year
standard currency rates, as well as higher discounts provided to customers.
The increase in selling and administrative expense was primarily due to an
increase in the reserve for bad debts along with increased investments in our
Direct to Consumer operations.
Greater China
(In millions) Fiscal 2011 Fiscal 2010 FY11 vs. FY10
% Change
FY11 vs. FY10 % Change Excluding
Currency Changes Fiscal 2009 FY10 vs. FY09
% Change
FY10 vs. FY09 % Change Excluding
Currency Changes Revenues
Footwear $ 1,164 $ 953 22 % 19 % $ 940 1 % 1 %
Apparel 789 684 15 % 13 % 700 -2 % -3 %
Equipment 107 105 2 % 0 % 103 2 % 0 %
TOTAL REVENUES $ 2,060 $ 1,742 18 % 16 % $ 1,743 0 % 0 % Earnings Before
Interest and Taxes $ 777 $ 637 22 % $ 575 11 %
Fiscal 2011 Compared to Fiscal 2010
Excluding changes in currency exchange rates, Greater China revenues
increased 16% for fi scal 2011, driven by expansion in the number of partner-
owned stores selling NIKE products, as well as improvement in comparable
store sales for partner-owned stores.
For fi scal 2011, the increase in Greater China’s footwear revenue was primarily
driven by double-digit percentage growth in our Running and NIKE Brand
Sportswear categories, while the growth in apparel revenue was mainly driven
by double-digit percentage increases in our NIKE Brand Sportswear, Basketball
and Men’s Training categories.
For fi scal 2011, EBIT for Greater China grew at a faster rate than revenue as
a result of a higher gross margin percentage, improved leverage on selling
and administrative expense and favorable foreign currency translation. The
improvement in the gross margin percentage was primarily attributable to
higher product prices, favorable product mix and lower inventory obsolescence
expense, which more than offset higher product input costs and warehousing
costs from our new China distribution center.
Fiscal 2010 Compared to Fiscal 2009
For fi scal 2010, revenues for Greater China were fl at, primarily attributable
to comparisons against strong revenue growth in the fi rst half of fi scal 2009
driven by the Beijing Olympics. Greater China began to gain momentum in
the second half of fi scal 2010, as revenues increased 11% as compared to
the second half of fi scal 2009.
The increase in footwear revenue was primarily driven by a mid single-digit
increase in average selling price, partially offset by a mid single-digit decrease
in unit sales. The increase in average selling price was primarily due to strategic
price increases, while the decrease in unit sales was primarily driven by lower
discounts on in-line products compared to the prior year.
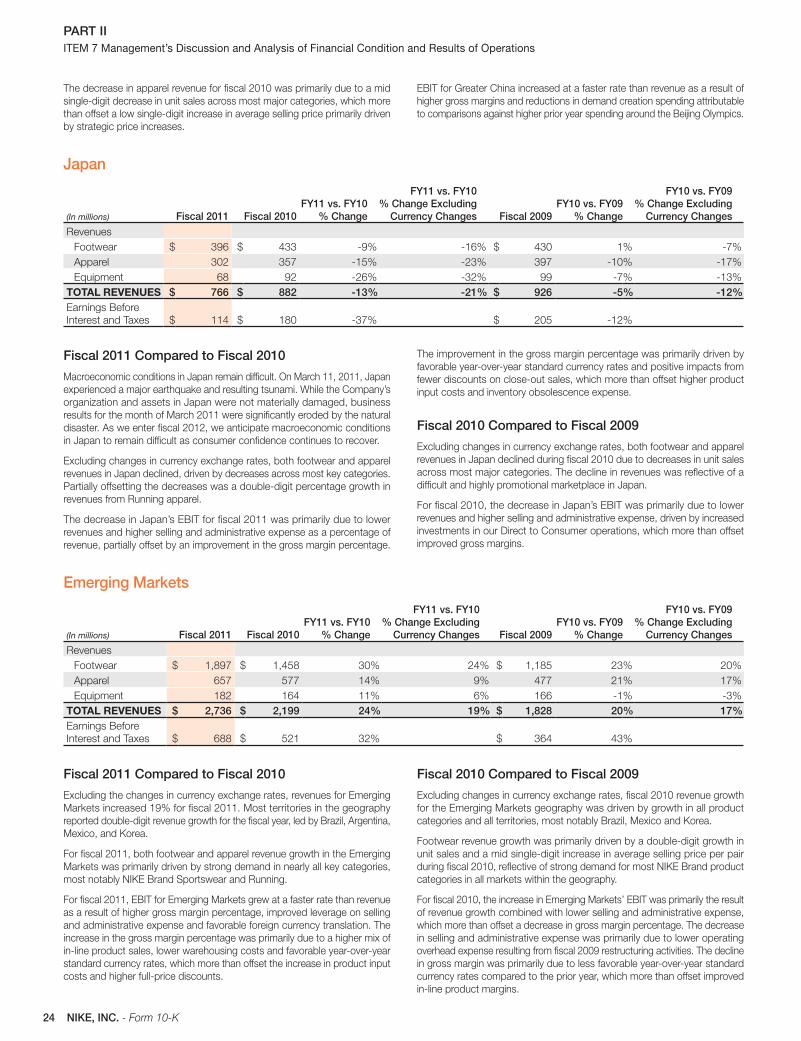
24 NIKE, INC. - Form 10-K
PART II ITEM 7 Management’s Discussion and Analysis of Financial Condition and Results of Operations
The decrease in apparel revenue for fi scal 2010 was primarily due to a mid
single-digit decrease in unit sales across most major categories, which more
than offset a low single-digit increase in average selling price primarily driven
by strategic price increases.
EBIT for Greater China increased at a faster rate than revenue as a result of
higher gross margins and reductions in demand creation spending attributable
to comparisons against higher prior year spending around the Beijing Olympics.
Japan
(In millions) Fiscal 2011 Fiscal 2010 FY11 vs. FY10
% Change
FY11 vs. FY10 % Change Excluding
Currency Changes Fiscal 2009 FY10 vs. FY09
% Change
FY10 vs. FY09 % Change Excluding
Currency Changes Revenues
Footwear $ 396 $ 433 -9 % -16 % $ 430 1 % -7 %
Apparel 302 357 -15 % -23 % 397 -10 % -17 %
Equipment 68 92 -26 % -32 % 99 -7 % -13 %
TOTAL REVENUES $ 766 $ 882 -13 % -21 % $ 926 -5 % -12 % Earnings Before
Interest and Taxes $ 114 $ 180 -37 % $ 205 -12 %
Fiscal 2011 Compared to Fiscal 2010
Macroeconomic conditions in Japan remain diffi cult. On March 11, 2011, Japan
experienced a major earthquake and resulting tsunami. While the Company’s
organization and assets in Japan were not materially damaged, business
results for the month of March 2011 were signifi cantly eroded by the natural
disaster. As we enter fi scal 2012, we anticipate macroeconomic conditions
in Japan to remain diffi cult as consumer confi dence continues to recover.
Excluding changes in currency exchange rates, both footwear and apparel
revenues in Japan declined, driven by decreases across most key categories.
Partially offsetting the decreases was a double-digit percentage growth in
revenues from Running apparel.
The decrease in Japan’s EBIT for fi scal 2011 was primarily due to lower
revenues and higher selling and administrative expense as a percentage of
revenue, partially offset by an improvement in the gross margin percentage.
The improvement in the gross margin percentage was primarily driven by
favorable year-over-year standard currency rates and positive impacts from
fewer discounts on close-out sales, which more than offset higher product
input costs and inventory obsolescence expense.
Fiscal 2010 Compared to Fiscal 2009
Excluding changes in currency exchange rates, both footwear and apparel
revenues in Japan declined during fi scal 2010 due to decreases in unit sales
across most major categories. The decline in revenues was refl ective of a
diffi cult and highly promotional marketplace in Japan.
For fi scal 2010, the decrease in Japan’s EBIT was primarily due to lower
revenues and higher selling and administrative expense, driven by increased
investments in our Direct to Consumer operations, which more than offset
improved gross margins.
Emerging Markets
(In millions) Fiscal 2011 Fiscal 2010 FY11 vs. FY10
% Change
FY11 vs. FY10 % Change Excluding
Currency Changes Fiscal 2009 FY10 vs. FY09
% Change
FY10 vs. FY09 % Change Excluding
Currency Changes Revenues
Footwear $ 1,897 $ 1,458 30 % 24 % $ 1,185 23 % 20 %
Apparel 657 577 14 % 9 % 477 21 % 17 %
Equipment 182 164 11 % 6 % 166 -1 % -3 %
TOTAL REVENUES $ 2,736 $ 2,199 24 % 19 % $ 1,828 20 % 17 % Earnings Before
Interest and Taxes $ 688 $ 521 32 % $ 364 43 %
Fiscal 2011 Compared to Fiscal 2010
Excluding the changes in currency exchange rates, revenues for Emerging
Markets increased 19% for fi scal 2011. Most territories in the geography
reported double-digit revenue growth for the fi scal year, led by Brazil, Argentina,
Mexico, and Korea.
For fi scal 2011, both footwear and apparel revenue growth in the Emerging
Markets was primarily driven by strong demand in nearly all key categories,
most notably NIKE Brand Sportswear and Running.
For fi scal 2011, EBIT for Emerging Markets grew at a faster rate than revenue
as a result of higher gross margin percentage, improved leverage on selling
and administrative expense and favorable foreign currency translation. The
increase in the gross margin percentage was primarily due to a higher mix of
in-line product sales, lower warehousing costs and favorable year-over-year
standard currency rates, which more than offset the increase in product input
costs and higher full-price discounts.
Fiscal 2010 Compared to Fiscal 2009
Excluding changes in currency exchange rates, fi scal 2010 revenue growth
for the Emerging Markets geography was driven by growth in all product
categories and all territories, most notably Brazil, Mexico and Korea.
Footwear revenue growth was primarily driven by a double-digit growth in
unit sales and a mid single-digit increase in average selling price per pair
during fi scal 2010, refl ective of strong demand for most NIKE Brand product
categories in all markets within the geography.
For fi scal 2010, the increase in Emerging Markets’ EBIT was primarily the result
of revenue growth combined with lower selling and administrative expense,
which more than offset a decrease in gross margin percentage. The decrease
in selling and administrative expense was primarily due to lower operating
overhead expense resulting from fi scal 2009 restructuring activities. The decline
in gross margin was primarily due to less favorable year-over-year standard
currency rates compared to the prior year, which more than offset improved
in-line product margins.
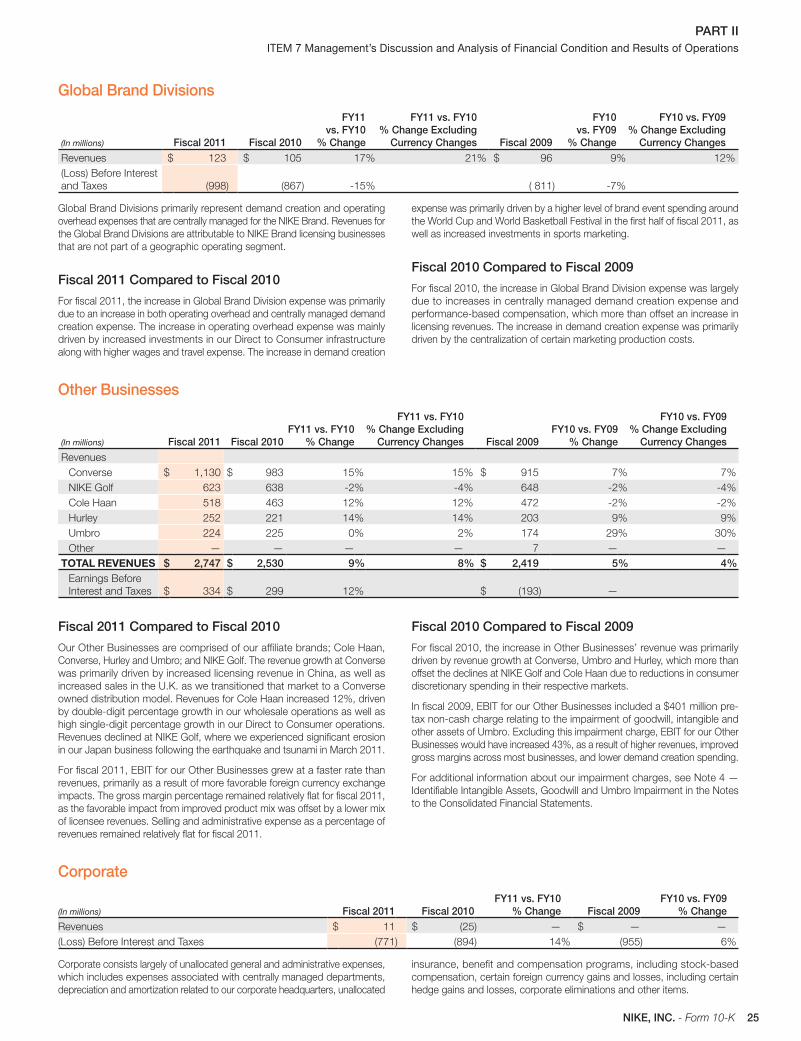
25NIKE, INC. - Form 10-K
PART II ITEM 7 Management’s Discussion and Analysis of Financial Condition and Results of Operations
Global Brand Divisions
(In millions) Fiscal 2011 Fiscal 2010
FY11vs. FY10
% Change
FY11 vs. FY10 % Change Excluding
Currency Changes Fiscal 2009
FY10vs. FY09
% Change
FY10 vs. FY09 % Change Excluding
Currency Changes Revenues $ 123 $ 105 17 % 21 % $ 96 9 % 12 %
(Loss) Before Interest
and Taxes (998 ) (867 ) -15 % ( 811 ) -7 %
Global Brand Divisions primarily represent demand creation and operating
overhead expenses that are centrally managed for the NIKE Brand. Revenues for
the Global Brand Divisions are attributable to NIKE Brand licensing businesses
that are not part of a geographic operating segment.
Fiscal 2011 Compared to Fiscal 2010
For fi scal 2011, the increase in Global Brand Division expense was primarily
due to an increase in both operating overhead and centrally managed demand
creation expense. The increase in operating overhead expense was mainly
driven by increased investments in our Direct to Consumer infrastructure
along with higher wages and travel expense. The increase in demand creation
expense was primarily driven by a higher level of brand event spending around
the World Cup and World Basketball Festival in the fi rst half of fi scal 2011, as
well as increased investments in sports marketing.
Fiscal 2010 Compared to Fiscal 2009
For fi scal 2010, the increase in Global Brand Division expense was largely
due to increases in centrally managed demand creation expense and
performance-based compensation, which more than offset an increase in
licensing revenues. The increase in demand creation expense was primarily
driven by the centralization of certain marketing production costs.
Other Businesses
(In millions) Fiscal 2011 Fiscal 2010 FY11 vs. FY10
% Change
FY11 vs. FY10 % Change Excluding
Currency Changes Fiscal 2009 FY10 vs. FY09
% Change
FY10 vs. FY09 % Change Excluding
Currency Changes Revenues
Converse $ 1,130 $ 983 15 % 15 % $ 915 7 % 7 %
NIKE Golf 623 638 -2 % -4 % 648 -2 % -4 %
Cole Haan 518 463 12 % 12 % 472 -2 % -2 %
Hurley 252 221 14 % 14 % 203 9 % 9 %
Umbro 224 225 0 % 2 % 174 29 % 30 %
Other — — — — 7 — —
TOTAL REVENUES $ 2,747 $ 2,530 9 % 8 % $ 2,419 5 % 4 % Earnings Before
Interest and Taxes $ 334 $ 299 12 % $ (193 ) —
Fiscal 2011 Compared to Fiscal 2010
Our Other Businesses are comprised of our affi liate brands; Cole Haan,
Converse, Hurley and Umbro; and NIKE Golf. The revenue growth at Converse
was primarily driven by increased licensing revenue in China, as well as
increased sales in the U.K. as we transitioned that market to a Converse
owned distribution model. Revenues for Cole Haan increased 12%, driven
by double-digit percentage growth in our wholesale operations as well as
high single-digit percentage growth in our Direct to Consumer operations.
Revenues declined at NIKE Golf, where we experienced signifi cant erosion
in our Japan business following the earthquake and tsunami in March 2011.
For fi scal 2011, EBIT for our Other Businesses grew at a faster rate than
revenues, primarily as a result of more favorable foreign currency exchange
impacts. The gross margin percentage remained relatively fl at for fi scal 2011,
as the favorable impact from improved product mix was offset by a lower mix
of licensee revenues. Selling and administrative expense as a percentage of
revenues remained relatively fl at for fi scal 2011.
Fiscal 2010 Compared to Fiscal 2009
For fi scal 2010, the increase in Other Businesses’ revenue was primarily
driven by revenue growth at Converse, Umbro and Hurley, which more than
offset the declines at NIKE Golf and Cole Haan due to reductions in consumer
discretionary spending in their respective markets.
In fi scal 2009, EBIT for our Other Businesses included a $401 million pre-
tax non-cash charge relating to the impairment of goodwill, intangible and
other assets of Umbro. Excluding this impairment charge, EBIT for our Other
Businesses would have increased 43%, as a result of higher revenues, improved
gross margins across most businesses, and lower demand creation spending.
For additional information about our impairment charges, see Note 4 —
Identifi able Intangible Assets, Goodwill and Umbro Impairment in the Notes
to the Consolidated Financial Statements.
Corporate
(In millions) Fiscal 2011 Fiscal 2010 FY11 vs. FY10
% Change Fiscal 2009 FY10 vs. FY09
% Change Revenues $ 11 $ (25 ) — $ — —
(Loss) Before Interest and Taxes (771 ) (894 ) 14 % (955 ) 6 %
Corporate consists largely of unallocated general and administrative expenses,
which includes expenses associated with centrally managed departments,
depreciation and amortization related to our corporate headquarters, unallocated
insurance, benefi t and compensation programs, including stock-based
compensation, certain foreign currency gains and losses, including certain
hedge gains and losses, corporate eliminations and other items.
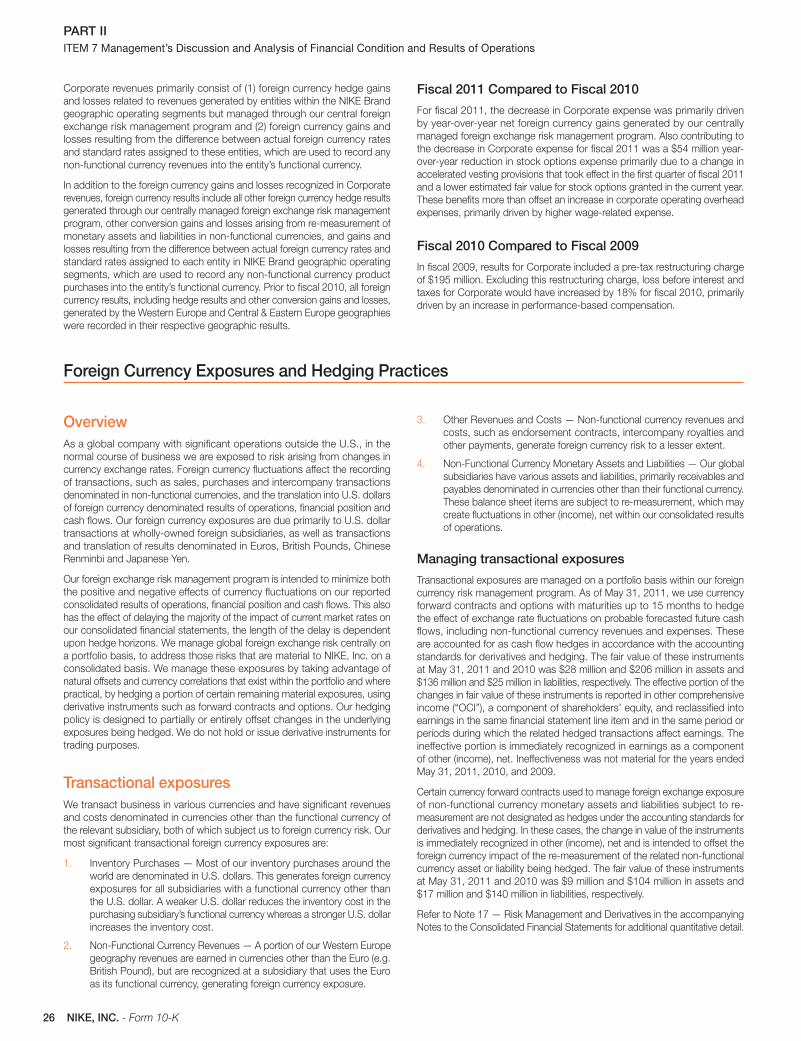
26 NIKE, INC. - Form 10-K
PART II ITEM 7 Management’s Discussion and Analysis of Financial Condition and Results of Operations
Corporate revenues primarily consist of (1) foreign currency hedge gains
and losses related to revenues generated by entities within the NIKE Brand
geographic operating segments but managed through our central foreign
exchange risk management program and (2) foreign currency gains and
losses resulting from the difference between actual foreign currency rates
and standard rates assigned to these entities, which are used to record any
non-functional currency revenues into the entity’s functional currency.
In addition to the foreign currency gains and losses recognized in Corporate
revenues, foreign currency results include all other foreign currency hedge results
generated through our centrally managed foreign exchange risk management
program, other conversion gains and losses arising from re-measurement of
monetary assets and liabilities in non-functional currencies, and gains and
losses resulting from the difference between actual foreign currency rates and
standard rates assigned to each entity in NIKE Brand geographic operating
segments, which are used to record any non-functional currency product
purchases into the entity’s functional currency. Prior to fi scal 2010, all foreign
currency results, including hedge results and other conversion gains and losses,
generated by the Western Europe and Central & Eastern Europe geographies
were recorded in their respective geographic results.
Fiscal 2011 Compared to Fiscal 2010
For fi scal 2011, the decrease in Corporate expense was primarily driven
by year-over-year net foreign currency gains generated by our centrally
managed foreign exchange risk management program. Also contributing to
the decrease in Corporate expense for fi scal 2011 was a $54 million year-
over-year reduction in stock options expense primarily due to a change in
accelerated vesting provisions that took effect in the fi rst quarter of fi scal 2011
and a lower estimated fair value for stock options granted in the current year.
These benefi ts more than offset an increase in corporate operating overhead
expenses, primarily driven by higher wage-related expense.
Fiscal 2010 Compared to Fiscal 2009
In fi scal 2009, results for Corporate included a pre-tax restructuring charge
of $195 million. Excluding this restructuring charge, loss before interest and
taxes for Corporate would have increased by 18% for fi scal 2010, primarily
driven by an increase in performance-based compensation.
Foreign Currency Exposures and Hedging Practices
Overview As a global company with signifi cant operations outside the U.S., in the
normal course of business we are exposed to risk arising from changes in
currency exchange rates. Foreign currency fl uctuations affect the recording
of transactions, such as sales, purchases and intercompany transactions
denominated in non-functional currencies, and the translation into U.S. dollars
of foreign currency denominated results of operations, fi nancial position and
cash fl ows. Our foreign currency exposures are due primarily to U.S. dollar
transactions at wholly-owned foreign subsidiaries, as well as transactions
and translation of results denominated in Euros, British Pounds, Chinese
Renminbi and Japanese Yen.
Our foreign exchange risk management program is intended to minimize both
the positive and negative effects of currency fl uctuations on our reported
consolidated results of operations, fi nancial position and cash fl ows. This also
has the effect of delaying the majority of the impact of current market rates on
our consolidated fi nancial statements, the length of the delay is dependent
upon hedge horizons. We manage global foreign exchange risk centrally on
a portfolio basis, to address those risks that are material to NIKE, Inc. on a
consolidated basis. We manage these exposures by taking advantage of
natural offsets and currency correlations that exist within the portfolio and where
practical, by hedging a portion of certain remaining material exposures, using
derivative instruments such as forward contracts and options. Our hedging
policy is designed to partially or entirely offset changes in the underlying
exposures being hedged. We do not hold or issue derivative instruments for
trading purposes.
Transactional exposures We transact business in various currencies and have signifi cant revenues
and costs denominated in currencies other than the functional currency of
the relevant subsidiary, both of which subject us to foreign currency risk. Our
most signifi cant transactional foreign currency exposures are:
1. Inventory Purchases — Most of our inventory purchases around the
world are denominated in U.S. dollars. This generates foreign currency
exposures for all subsidiaries with a functional currency other than
the U.S. dollar. A weaker U.S. dollar reduces the inventory cost in the
purchasing subsidiary’s functional currency whereas a stronger U.S. dollar
increases the inventory cost.
2. Non-Functional Currency Revenues — A portion of our Western Europe
geography revenues are earned in currencies other than the Euro (e.g.
British Pound), but are recognized at a subsidiary that uses the Euro
as its functional currency, generating foreign currency exposure.
3. Other Revenues and Costs — Non-functional currency revenues and
costs, such as endorsement contracts, intercompany royalties and
other payments, generate foreign currency risk to a lesser extent.
4. Non-Functional Currency Monetary Assets and Liabilities — Our global
subsidiaries have various assets and liabilities, primarily receivables and
payables denominated in currencies other than their functional currency.
These balance sheet items are subject to re-measurement, which may
create fl uctuations in other (income), net within our consolidated results
of operations.
Managing transactional exposures
Transactional exposures are managed on a portfolio basis within our foreign
currency risk management program. As of May 31, 2011, we use currency
forward contracts and options with maturities up to 15 months to hedge
the effect of exchange rate fl uctuations on probable forecasted future cash
fl ows, including non-functional currency revenues and expenses. These
are accounted for as cash fl ow hedges in accordance with the accounting
standards for derivatives and hedging. The fair value of these instruments
at May 31, 2011 and 2010 was $28 million and $206 million in assets and
$136 million and $25 million in liabilities, respectively. The effective portion of the
changes in fair value of these instruments is reported in other comprehensive
income (“OCI”), a component of shareholders’ equity, and reclassifi ed into
earnings in the same fi nancial statement line item and in the same period or
periods during which the related hedged transactions affect earnings. The
ineffective portion is immediately recognized in earnings as a component
of other (income), net. Ineffectiveness was not material for the years ended
May 31, 2011, 2010, and 2009.
Certain currency forward contracts used to manage foreign exchange exposure
of non-functional currency monetary assets and liabilities subject to re-
measurement are not designated as hedges under the accounting standards for
derivatives and hedging. In these cases, the change in value of the instruments
is immediately recognized in other (income), net and is intended to offset the
foreign currency impact of the re-measurement of the related non-functional
currency asset or liability being hedged. The fair value of these instruments
at May 31, 2011 and 2010 was $9 million and $104 million in assets and
$17 million and $140 million in liabilities, respectively.
Refer to Note 17 — Risk Management and Derivatives in the accompanying
Notes to the Consolidated Financial Statements for additional quantitative detail.
27NIKE, INC. - Form 10-K
PART II ITEM 7 Management’s Discussion and Analysis of Financial Condition and Results of Operations
Translational exposures Substantially all of our foreign subsidiaries operate in functional currencies other
than the U.S. dollar. Fluctuations in currency exchange rates create volatility
in our reported results as we are required to translate the balance sheets and
operational results of these foreign currency denominated subsidiaries into
U.S. dollars for consolidated reporting. The translation of foreign subsidiaries
non-U.S. dollar balance sheets into U.S. dollars for consolidated reporting
results in a cumulative translation adjustment to OCI within shareholders’
equity. In preparing our consolidated statements of income, foreign exchange
rate fl uctuations impact our operating results as the revenues and expenses
of our foreign operations are translated into U.S. dollars. In translation, a
weaker U.S. dollar in relation to foreign functional currencies benefi ts our
consolidated earnings whereas a stronger U.S. dollar reduces our consolidated
earnings. The impact of foreign exchange rate fl uctuations on the translation
of our consolidated revenues and income before income taxes was a net
translation benefi t (detriment) of approximately ($28) million and ($16) million,
respectively, for the year ended May 31, 2011 and approximately $147 million
and $33 million, respectively, for the year ended May 31, 2010.
Managing translational exposures
To minimize the impact of translating foreign currency denominated revenues
and expenses into U.S. dollars for consolidated reporting, certain foreign
subsidiaries use excess cash to purchase U.S. dollar denominated available-for-
sale investments. The variable future cash fl ows associated with the purchase
and subsequent sale of these U.S. dollar denominated securities at non-U.S.
dollar functional currency subsidiaries creates a foreign currency exposure that
qualifi es for hedge accounting under the accounting standards for derivatives
and hedging. We utilize forward contracts and options to partially, or entirely,
hedge the variability of the forecasted future purchases and sales of these U.S.
dollar investments. This has the effect of partially offsetting the year-over-year
foreign currency translation impact on net earnings in the period the investments
are sold. Hedges of available-for-sale investments are accounted for as cash
fl ow hedges. The fair value of instruments used in this manner at May 31, 2011
was $1 million in assets and $21 million in liabilities. At May 31, 2010, the fair
value was $78 million in assets. The effective portion of the changes in fair
value of these instruments is reported in OCI and reclassifi ed into earnings in
other (income), net in the period during which the hedged available-for-sale
investment is sold and affects earnings. Any ineffective portion, which was
not material for any period presented, is immediately recognized in earnings
as a component of other (income), net.
We estimate that the combination of translation of foreign currency-denominated
profi ts from our international businesses and the year-over-year change in foreign
currency related net gains included in other (income), net had net (detriment)
benefi t on our income before income taxes of approximately $(33) million and
$34 million for the years ended May 31, 2011 and 2010.
Refer to Note 17 — Risk Management and Derivatives in the accompanying
Notes to the Consolidated Financial Statements for additional quantitative detail.
Net investments in foreign subsidiaries
We are also exposed to the impact of foreign exchange fl uctuations on our
investments in wholly-owned foreign subsidiaries denominated in a currency
other than the U.S. dollar, which could adversely impact the U.S. dollar value
of these investments and therefore the value of future repatriated earnings.
We hedge certain net investment positions in Euro-functional currency foreign
subsidiaries to mitigate the effects of foreign exchange fl uctuations on net
investments with the effect of preserving the value of future repatriated earnings.
In accordance with the accounting standards for derivatives and hedging, the
effective portion of the change in fair value of the forward contracts designated
as net investment hedges is recorded in the cumulative translation adjustment
component of accumulated other comprehensive income. Any ineffective
portion, which was not material for any period presented, is immediately
recognized in earnings as a component of other (income), net. To minimize
credit risk, we have structured these net investment hedges to be generally
less than six months in duration. Upon maturity, the hedges are settled
based on the current fair value of the forward contracts with the realized
gain or loss remaining in OCI; concurrent with settlement, we enter into new
forward contracts at the current market rate. The fair value of outstanding
net investment hedges at May 31, 2011 was $23 million in liabilities. At
May 31, 2010, the fair value was $32 million in assets. Cash fl ows from net
investment hedge settlements totaled ($23) million and $5 million in the years
ended May 31, 2011 and 2010, respectively.
Liquidity and Capital Resources
Cash Flow Activity Cash provided by operations was $1.8 billion for fi scal 2011 compared to
$3.2 billion for fi scal 2010. Our primary source of operating cash fl ow for
fi scal 2011 was net income of $2.1 billion. Our working capital was a net cash
outfl ow of $708 million for fi scal 2011 as compared to a positive net cash infl ow
of $694 million for fi scal 2010. Our investments in working capital increased
primarily due to an increase in inventory and higher accounts receivable.
Inventory at the end of fi scal 2011 increased 33% compared to fi scal 2010,
primarily driven by a 15% increase in futures orders, growth in replenishment
programs for high-turnover styles, early purchases of key seasonal items with
longer production lead times as well as the growth of Direct to Consumer
operations. Changes in currency exchange rates and higher product costs
also contributed to the increase in dollar inventory. The increase in accounts
receivable was mainly attributable to the increase in revenues during fi scal 2011.
Cash used by investing activities was $1.0 billion during fi scal 2011, compared
to $1.3 billion for fi scal 2010. The year-over-year decrease was primarily due
to lower net purchases of short-term investments. Net purchases of short-
term investments were $537 million (net of sales and maturities) in fi scal 2011
compared to $937 million during fi scal 2010.
Cash used by fi nancing activities was $2.0 billion for fi scal 2011 compared
to $1.1 billion used in fi scal 2010. The increase in cash used by fi nancing
activities was primarily due to an increase in share repurchases and dividends
paid, partially offset by an increase in notes payable.
In fi scal 2011, we purchased 23.8 million shares of NIKE’s class B common
stock for $1.9 billion. These repurchases were made under the four-year,
$5 billion program approved by our Board of Directors which commenced
in December 2009 and as of the end of fi scal 2011, we have repurchased
30.4 million shares for $2.3 billion under this program. We continue to expect
funding of share repurchases will come from operating cash fl ow, excess cash,
and/or debt. The timing and the amount of shares purchased will be dictated
by our capital needs and stock market conditions.
Off-Balance Sheet Arrangements In connection with various contracts and agreements, we provide routine
indemnifi cations relating to the enforceability of intellectual property rights,
coverage for legal issues that arise and other items where we are acting as
the guarantor. Currently, we have several such agreements in place. However,
based on our historical experience and the estimated probability of future loss,
we have determined that the fair value of such indemnifi cations is not material
to our fi nancial position or results of operations.
28 NIKE, INC. - Form 10-K
PART II ITEM 7 Management’s Discussion and Analysis of Financial Condition and Results of Operations
Contractual Obligations Our signifi cant long-term contractual obligations as of May 31, 2011, and signifi cant endorsement contracts entered into through the date of this report are as follows:
Description of Commitment (In millions)
Cash Payments Due During the Year Ending May 31, 2012 2013 2014 2015 2016 Thereafter Total
Operating Leases $ 374 $ 310 $ 253 $ 198 $ 174 $ 535 $ 1,844
Long-term Debt 200 48 58 8 109 37 460
Endorsement Contracts (1) 800 806 742 615 463 1,018 4,444
Product Purchase Obligations (2) 3,175 — — — — — 3,175
Other (3) 277 137 22 4 1 — 441
TOTAL $ 4,826 $ 1,301 $ 1,075 $ 825 $ 747 $ 1,590 $ 10,364 (1) The amounts listed for endorsement contracts represent approximate amounts of base compensation and minimum guaranteed royalty fees we are obligated to pay athlete and sport
team endorsers of our products. Actual payments under some contracts may be higher than the amounts listed as these contracts provide for bonuses to be paid to the endorsers based upon athletic achievements and/or royalties on product sales in future periods. Actual payments under some contracts may also be lower as these contracts include provisions for reduced payments if athletic performance declines in future periods.
In addition to the cash payments, we are obligated to furnish our endorsers with NIKE product for their use. It is not possible to determine how much we will spend on this product on an annual basis as the contracts generally do not stipulate a specific amount of cash to be spent on the product. The amount of product provided to the endorsers will depend on many factors including general playing conditions, the number of sporting events in which they participate, and our own decisions regarding product and marketing initiatives. In addition, the costs to design, develop, source, and purchase the products furnished to the endorsers are incurred over a period of time and are not necessarily tracked separately from similar costs incurred for products sold to customers.
(2) We generally order product at least 4 to 5 months in advance of sale based primarily on advanced futures orders received from customers. The amounts listed for product purchase obligations represent agreements (including open purchase orders) to purchase products in the ordinary course of business, that are enforceable and legally binding and that specify all significant terms. In some cases, prices are subject to change throughout the production process. The reported amounts exclude product purchase liabilities included in accounts payable on the consolidated balance sheet as of May 31, 2011.
(3) Other amounts primarily include service and marketing commitments made in the ordinary course of business. The amounts represent the minimum payments required by legally binding contracts and agreements that specify all significant terms, including open purchase orders for non-product purchases. The reported amounts exclude those liabilities included in accounts payable or accrued liabilities on the consolidated balance sheet as of May 31, 2011.
The total liability for uncertain tax positions was $212 million, excluding related interest and penalties, at May 31, 2011. We are not able to reasonably estimate
when or if cash payments of the long-term liability for uncertain tax positions will occur.
We also have the following outstanding short-term debt obligations as of May 31, 2011. Please refer to the accompanying Notes to the Consolidated Financial
Statements (Note 7 — Short-Term Borrowings and Credit Lines) for further description and interest rates related to the short-term debt obligations listed below.
(In millions)
Outstanding as of May 31, 2011
Notes payable, due at mutually agreed-upon dates within one year of issuance or on demand $ 187
Payable to Sojitz America for the purchase of inventories, generally due 60 days after shipment of goods from a foreign port $ 111
As of May 31, 2011, letters of credit of $99 million were outstanding, generally for the purchase of inventory.
Capital Resources In December 2008, we fi led a shelf registration statement with the Securities
and Exchange Commission under which $760 million in debt securities may
be issued. As of May 31, 2011, no debt securities had been issued under
this shelf registration.
As of and for the year ended May 31, 2011, we had no amounts outstanding
under our multi-year, $1 billion revolving credit facility in place with a group of
banks. The facility matures in December 2012. Based on our current long-
term senior unsecured debt ratings of A+ and A1 from Standard and Poor’s
Corporation and Moody’s Investor Services, respectively, the interest rate charged
on any outstanding borrowings would be the prevailing London Interbank Offer
Rate (“LIBOR”) plus 0.15%. The facility fee is 0.05% of the total commitment.
If our long-term debt rating were to decline, the facility fee and interest rate
under our committed credit facility would increase. Conversely, if our long-term
debt rating were to improve, the facility fee and interest rate would decrease.
Changes in our long-term debt rating would not trigger acceleration of maturity
of any then outstanding borrowings or any future borrowings under the
committed credit facility. Under this committed credit facility, we have agreed
to various covenants. These covenants include limits on our disposal of fi xed
assets and the amount of debt secured by liens we may incur as well as a
minimum capitalization ratio. In the event we were to have any borrowings
outstanding under this facility, failed to meet any covenant, and were unable
to obtain a waiver from a majority of the banks, any borrowings would become
immediately due and payable. As of May 31, 2011, we were in full compliance
with each of these covenants and believe it is unlikely we will fail to meet any
of these covenants in the foreseeable future.
Liquidity is also provided by our $1 billion commercial paper program. As of
and for the year ended May 31, 2011, no amounts were outstanding under
this program. We currently have short-term debt ratings of A1 and P1 from
Standard and Poor’s Corporation and Moody’s Investor Services, respectively.
As of May 31, 2011, we had cash, cash equivalents and short term investments
totaling $4.5 billion, including amounts held in the U.S. and foreign jurisdictions.
Cash equivalents and short term investments consist primarily of deposits
held at major banks, money market funds, Tier-1 commercial paper, corporate
notes, U.S. Treasury obligations, U.S. government agency obligations and
government sponsored enterprise obligations, and other investment grade
fi xed income securities. Our fi xed income investments are exposed to both
credit and interest rate risk. All of our investments are investment grade to
minimize our credit risk. While individual securities have varying durations,
the average duration of our entire cash equivalents and short term investment
portfolio is less than 120 days as of May 31, 2011.
Despite recent uncertainties in the fi nancial markets, to date we have not
experienced diffi culty accessing the credit markets or incurred higher interest
costs. Future volatility in the capital markets, however, may increase costs
associated with issuing commercial paper or other debt instruments or affect
our ability to access those markets. We utilize a variety of tax planning and
fi nancing strategies in an effort to manage our worldwide cash and deploy
funds to locations where it is needed. We believe that existing cash, cash
equivalents, short-term investments and cash generated by operations, together
with access to external sources of funds as described above, will be suffi cient
to meet our domestic and foreign capital needs in the foreseeable future.
29NIKE, INC. - Form 10-K
PART II ITEM 7 Management’s Discussion and Analysis of Financial Condition and Results of Operations
Recently Adopted Accounting Standards
In January 2010, the Financial Accounting Standards Board (“FASB”) issued
guidance to amend the disclosure requirements related to recurring and
nonrecurring fair value measurements. The guidance requires additional
disclosures about the different classes of assets and liabilities measured at
fair value, the valuation techniques and inputs used, the activity in Level 3 fair
value measurements, and the transfers between Levels 1, 2, and 3 of the fair
value measurement hierarchy. This guidance became effective for us beginning
March 1, 2010, except for disclosures relating to purchases, sales, issuances
and settlements of Level 3 assets and liabilities, which will be effective for us
beginning June 1, 2011. As this guidance only requires expanded disclosures,
the adoption did not and will not impact our consolidated fi nancial position
or results of operations.
In June 2009, the FASB issued a new accounting standard that revised the
guidance for the consolidation of variable interest entities (“VIE”). This new
guidance requires a qualitative approach to identifying a controlling fi nancial
interest in a VIE, and requires an ongoing assessment of whether an entity is a
VIE and whether an interest in a VIE makes the holder the primary benefi ciary
of the VIE. This guidance became effective for us beginning June 1, 2010.
The adoption of this guidance did not have an impact on our consolidated
fi nancial position or results of operations.
Recently Issued Accounting Standards
In June 2011, the FASB issued new guidance on the presentation of
comprehensive income. This new guidance requires the components of
net income and other comprehensive income to be either presented in
one continuous statement, referred to as the statement of comprehensive
income, or in two separate, but consecutive statements. This new guidance
eliminates the current option to report other comprehensive income and its
components in the statement of shareholders’ equity. While the new guidance
changes the presentation of comprehensive income, there are no changes to
the components that are recognized in net income or other comprehensive
income under current accounting guidance. This new guidance is effective for
us beginning June 1, 2012. As this guidance only amends the presentation
of the components of comprehensive income, the adoption will not have an
impact on our consolidated fi nancial positions or results of operations.
In April 2011, the FASB issued new guidance to achieve common fair value
measurement and disclosure requirements between U.S. GAAP and International
Financial Reporting Standards. This new guidance, which is effective for us
beginning June 1, 2012, amends current U.S. GAAP fair value measurement
and disclosure guidance to include increased transparency around valuation
inputs and investment categorization. We do not expect the adoption will have
a material impact on our consolidated fi nancial position or results of operations.
In October 2009, the FASB issued new standards that revised the guidance
for revenue recognition with multiple deliverables. These new standards
impact the determination of when the individual deliverables included in a
multiple-element arrangement may be treated as separate units of accounting.
Additionally, these new standards modify the manner in which the transaction
consideration is allocated across the separately identifi ed deliverables by no
longer permitting the residual method of allocating arrangement consideration.
These new standards are effective for us beginning June 1, 2011. We do not
expect the adoption will have a material impact on our consolidated fi nancial
position or results of operations.
Critical Accounting Policies
Our previous discussion and analysis of our fi nancial condition and results
of operations are based upon our consolidated fi nancial statements, which
have been prepared in accordance with accounting principles generally
accepted in the United States of America. The preparation of these fi nancial
statements requires us to make estimates and judgments that affect the
reported amounts of assets, liabilities, revenues and expenses, and related
disclosure of contingent assets and liabilities.
We believe that the estimates, assumptions and judgments involved in the
accounting policies described below have the greatest potential impact on our
fi nancial statements, so we consider these to be our critical accounting policies.
Because of the uncertainty inherent in these matters, actual results could differ
from the estimates we use in applying the critical accounting policies. Certain
of these critical accounting policies affect working capital account balances,
including the policies for revenue recognition, the allowance for uncollectible
accounts receivable, inventory reserves, and contingent payments under
endorsement contracts. These policies require that we make estimates in the
preparation of our fi nancial statements as of a given date. However, since our
business cycle is relatively short, actual results related to these estimates are
generally known within the six-month period following the fi nancial statement
date. Thus, these policies generally affect only the timing of reported amounts
across two to three fi scal quarters.
Within the context of these critical accounting policies, we are not currently
aware of any reasonably likely events or circumstances that would result in
materially different amounts being reported.
Revenue Recognition We record wholesale revenues when title passes and the risks and rewards
of ownership have passed to the customer, based on the terms of sale. Title
passes generally upon shipment or upon receipt by the customer depending
on the country of the sale and the agreement with the customer. Retail store
revenues are recorded at the time of sale.
In some instances, we ship product directly from our supplier to the customer
and recognize revenue when the product is delivered to and accepted by the
customer. Our revenues may fl uctuate in cases when our customers delay
accepting shipment of product for periods up to several weeks.
In certain countries outside of the U.S., precise information regarding the date
of receipt by the customer is not readily available. In these cases, we estimate
the date of receipt by the customer based upon historical delivery times by
geographic location. On the basis of our tests of actual transactions, we have
no indication that these estimates have been materially inaccurate historically.
As part of our revenue recognition policy, we record estimated sales returns,
discounts and miscellaneous claims from customers as reductions to revenues
at the time revenues are recorded. We base our estimates on historical rates of
product returns, discounts and claims, and specifi c identifi cation of outstanding
claims and outstanding returns not yet received from customers. Actual
returns, discounts and claims in any future period are inherently uncertain
and thus may differ from our estimates. If actual or expected future returns,
discounts and claims were signifi cantly greater or lower than the reserves we
had established, we would record a reduction or increase to net revenues in
the period in which we made such determination.
30 NIKE, INC. - Form 10-K
PART II ITEM 7 Management’s Discussion and Analysis of Financial Condition and Results of Operations
Allowance for Uncollectible Accounts Receivable We make ongoing estimates relating to the ability to collect our accounts
receivable and maintain an allowance for estimated losses resulting from the
inability of our customers to make required payments. In determining the
amount of the allowance, we consider our historical level of credit losses and
make judgments about the creditworthiness of signifi cant customers based
on ongoing credit evaluations. Since we cannot predict future changes in
the fi nancial stability of our customers, actual future losses from uncollectible
accounts may differ from our estimates. If the fi nancial condition of our customers
were to deteriorate, resulting in their inability to make payments, a larger
allowance might be required. In the event we determine that a smaller or larger
allowance is appropriate, we would record a credit or a charge to selling and
administrative expense in the period in which such a determination is made.
Inventory Reserves We also make ongoing estimates relating to the net realizable value of inventories,
based upon our assumptions about future demand and market conditions.
If we estimate that the net realizable value of our inventory is less than the
cost of the inventory recorded on our books, we record a reserve equal to the
difference between the cost of the inventory and the estimated net realizable
value. This reserve is recorded as a charge to cost of sales. If changes in
market conditions result in reductions in the estimated net realizable value
of our inventory below our previous estimate, we would increase our reserve
in the period in which we made such a determination and record a charge
to cost of sales.
Contingent Payments under Endorsement Contracts A signifi cant portion of our demand creation expense relates to payments under
endorsement contracts. In general, endorsement payments are expensed
uniformly over the term of the contract. However, certain contract elements
may be accounted for differently, based upon the facts and circumstances
of each individual contract.
Some of the contracts provide for contingent payments to endorsers based
upon specifi c achievements in their sports (e.g., winning a championship).
We record selling and administrative expense for these amounts when the
endorser achieves the specifi c goal.
Some of the contracts provide for payments based upon endorsers maintaining
a level of performance in their sport over an extended period of time (e.g.,
maintaining a top ranking in a sport for a year). These amounts are reported in
selling and administrative expense when we determine that it is probable that
the specifi ed level of performance will be maintained throughout the period.
In these instances, to the extent that actual payments to the endorser differ
from our estimate due to changes in the endorser’s athletic performance,
increased or decreased selling and administrative expense may be reported
in a future period.
Some of the contracts provide for royalty payments to endorsers based upon
a predetermined percentage of sales of particular products. We expense these
payments in cost of sales as the related sales occur. In certain contracts, we offer
minimum guaranteed royalty payments. For contractual obligations for which
we estimate we will not meet the minimum guaranteed amount of royalty fees
through sales of product, we record the amount of the guaranteed payment
in excess of that earned through sales of product in selling and administrative
expense uniformly over the remaining guarantee period.
Property, Plant and Equipment and Defi nite-Lived Assets Property, plant and equipment, including buildings, equipment, and computer
hardware and software are recorded at cost (including, in some cases, the
cost of internal labor) and are depreciated over the estimated useful life.
Changes in circumstances (such as technological advances or changes to
our business operations) can result in differences between the actual and
estimated useful lives. In those cases where we determine that the useful life
of a long-lived asset should be shortened, we increase depreciation expense
over the remaining useful life to depreciate the asset’s net book value to its
salvage value.
We review the carrying value of long-lived assets or asset groups to be used
in operations whenever events or changes in circumstances indicate that the
carrying amount of the assets might not be recoverable. Factors that would
necessitate an impairment assessment include a signifi cant adverse change in
the extent or manner in which an asset is used, a signifi cant adverse change
in legal factors or the business climate that could affect the value of the asset,
or a signifi cant decline in the observable market value of an asset, among
others. If such facts indicate a potential impairment, we would assess the
recoverability of an asset group by determining if the carrying value of the asset
group exceeds the sum of the projected undiscounted cash fl ows expected to
result from the use and eventual disposition of the assets over the remaining
economic life of the primary asset in the asset group. If the recoverability
test indicates that the carrying value of the asset group is not recoverable,
we will estimate the fair value of the asset group using appropriate valuation
methodologies which would typically include an estimate of discounted cash
fl ows. Any impairment would be measured as the difference between the
asset groups carrying amount and its estimated fair value.
Goodwill and Indefi nite-Lived Intangible Assets We perform annual impairment tests on goodwill and intangible assets with
indefi nite lives in the fourth quarter of each fi scal year, or when events occur
or circumstances change that would, more likely than not, reduce the fair
value of a reporting unit or an intangible asset with an indefi nite life below its
carrying value. Events or changes in circumstances that may trigger interim
impairment reviews include signifi cant changes in business climate, operating
results, planned investments in the reporting unit, or an expectation that the
carrying amount may not be recoverable, among other factors. The impairment
test requires us to estimate the fair value of our reporting units. If the carrying
value of a reporting unit exceeds its fair value, the goodwill of that reporting
unit is potentially impaired and we proceed to step two of the impairment
analysis. In step two of the analysis, we measure and record an impairment
loss equal to the excess of the carrying value of the reporting unit’s goodwill
over its implied fair value should such a circumstance arise.
We generally base our measurement of the fair value of a reporting unit on a
blended analysis of the present value of future discounted cash fl ows and the
market valuation approach. The discounted cash fl ows model indicates the
fair value of the reporting unit based on the present value of the cash fl ows we
expect the reporting unit to generate in the future. Our signifi cant estimates in
the discounted cash fl ows model include: our weighted average cost of capital;
long-term rate of growth and profi tability of the reporting unit’s business; and
working capital effects. The market valuation approach indicates the fair value
of the business based on a comparison of the reporting unit to comparable
publicly traded fi rms in similar lines of business. Signifi cant estimates in the
market valuation approach model include identifying similar companies with
comparable business factors such as size, growth, profi tability, risk and return
on investment and assessing comparable revenue and operating income
multiples in estimating the fair value of the reporting unit.
We believe the weighted use of discounted cash fl ows and the market valuation
approach is the best method for determining the fair value of our reporting
units because these are the most common valuation methodologies used
within our industry, and the blended use of both models compensates for the
inherent risks associated with either model if used on a stand-alone basis.
Indefi nite-lived intangible assets primarily consist of acquired trade names and
trademarks. In measuring the fair value for these intangible assets, we utilize
the relief-from-royalty method. This method assumes that trade names and
trademarks have value to the extent that their owner is relieved of the obligation
to pay royalties for the benefi ts received from them. This method requires us
to estimate the future revenue for the related brands, the appropriate royalty
rate and the weighted average cost of capital.
31NIKE, INC. - Form 10-K
PART II ITEM 7 Management’s Discussion and Analysis of Financial Condition and Results of Operations
Hedge Accounting for Derivatives We use forward and option contracts to hedge certain anticipated foreign
currency exchange transactions as well as certain non-functional monetary
assets and liabilities. When the specifi c criteria to qualify for hedge accounting
has been met, changes in the fair value of contracts hedge probable forecasted
future cash fl ows are recorded in other comprehensive income, rather than net
income, until the underlying hedged transaction affects net income. In most
cases, this results in gains and losses on hedge derivatives being released
from other comprehensive income into net income some time after the maturity
of the derivative. One of the criteria for this accounting treatment is that the
forward and option contracts amount should not be in excess of specifi cally
identifi ed anticipated transactions. By their very nature, our estimates of
anticipated transactions may fl uctuate over time and may ultimately vary
from actual transactions. When anticipated transaction estimates or actual
transaction amounts decline below hedged levels, or if it is no longer probable
that a forecasted transaction will occur by the end of the originally specifi ed
time period or within an additional two-month period of time thereafter, we
are required to reclassify the ineffective portion of the cumulative changes in
fair values of the related hedge contracts from other comprehensive income
to other (income), net during the quarter in which such changes occur.
We use forward contracts to hedge our investment in the net assets of certain
international subsidiaries to offset foreign currency translation related to our
net investment in those subsidiaries. The change in fair value of the forward
contracts hedging our net investments is reported in the cumulative translation
adjustment component of accumulated other comprehensive income within
stockholders’ equity, to the extent effective, to offset the foreign currency
translation adjustments on those investments. As the value of our underlying
net investments in wholly-owned international subsidiaries is known at the time
a hedge is placed, the designated hedge is matched to the portion of our net
investment at risk. Accordingly, the variability involved in net investment hedges
is substantially less than that of other types of hedge transactions and we do
not expect any material ineffectiveness. We consider, on a quarterly basis,
the need to redesignate existing hedge relationships based on changes in the
underlying net investment. Should the level of our net investment decrease
below hedged levels, any resulting ineffectiveness would be reported directly
to earnings in the period incurred.
Stock-based Compensation We account for stock-based compensation by estimating the fair value of
stock-based compensation on the date of grant using the Black-Scholes option
pricing model. The Black-Scholes option pricing model requires the input of
highly subjective assumptions including volatility. Expected volatility is estimated
based on implied volatility in market traded options on our common stock with
a term greater than one year, along with other factors. Our decision to use
implied volatility was based on the availability of actively traded options on our
common stock and our assessment that implied volatility is more representative
of future stock price trends than historical volatility. If factors change and we
use different assumptions for estimating stock-based compensation expense
in future periods, stock-based compensation expense may differ materially in
the future from that recorded in the current period.
Taxes We record valuation allowances against our deferred tax assets, when
necessary. Realization of deferred tax assets (such as net operating loss
carry-forwards) is dependent on future taxable earnings and is therefore
uncertain. At least quarterly, we assess the likelihood that our deferred tax
asset balance will be recovered from future taxable income. To the extent we
believe that recovery is not likely, we establish a valuation allowance against
our deferred tax asset, which increases our income tax expense in the period
when such determination is made.
In addition, we have not recorded U.S. income tax expense for foreign earnings
that we have determined to be indefi nitely reinvested offshore, thus reducing our
overall income tax expense. The amount of earnings designated as indefi nitely
reinvested offshore is based upon the actual deployment of such earnings in our
offshore assets and our expectations of the future cash needs of our U.S. and
foreign entities. Income tax considerations are also a factor in determining the
amount of foreign earnings to be indefi nitely reinvested offshore.
We carefully review all factors that drive the ultimate disposition of foreign
earnings determined to be reinvested offshore, and apply stringent standards
to overcoming the presumption of repatriation. Despite this approach, because
the determination involves our future plans and expectations of future events,
the possibility exists that amounts declared as indefi nitely reinvested offshore
may ultimately be repatriated. For instance, the actual cash needs of our U.S.
entities may exceed our current expectations, or the actual cash needs of our
foreign entities may be less than our current expectations. This would result
in additional income tax expense in the year we determined that amounts
were no longer indefi nitely reinvested offshore. Conversely, our approach
may also result in a determination that accumulated foreign earnings (for
which U.S. income taxes have been provided) will be indefi nitely reinvested
offshore. In this case, our income tax expense would be reduced in the year
of such determination.
On an interim basis, we estimate what our effective tax rate will be for the
full fi scal year. The estimated annual effective tax rate is then applied to
the year-to-date pre-tax income excluding infrequently occurring or unusual
items, to determine the year-to-date tax expense. The income tax effects of
infrequent or unusual items are recognized in the interim period in which they
occur. As the fi scal year progresses, we continually refi ne our estimate based
upon actual events and earnings by jurisdiction during the year. This continual
estimation process periodically results in a change to our expected effective tax
rate for the fi scal year. When this occurs, we adjust the income tax provision
during the quarter in which the change in estimate occurs.
On a quarterly basis, we reevaluate the probability that a tax position will
be effectively sustained and the appropriateness of the amount recognized
for uncertain tax positions based on factors including changes in facts or
circumstances, changes in tax law, settled audit issues and new audit activity.
Changes in our assessment may result in the recognition of a tax benefi t
or an additional charge to the tax provision in the period our assessment
changes. We recognize interest and penalties related to income tax matters
in income tax expense.
Other Contingencies In the ordinary course of business, we are involved in legal proceedings
regarding contractual and employment relationships, product liability claims,
trademark rights, and a variety of other matters. We record contingent liabilities
resulting from claims against us, including related legal costs, when a loss is
assessed to be probable and the amount of the loss is reasonably estimable.
Assessing probability of loss and estimating probable losses requires analysis
of multiple factors, including in some cases judgments about the potential
actions of third party claimants and courts. Recorded contingent liabilities
are based on the best information available and actual losses in any future
period are inherently uncertain. If future adjustments to estimated probable
future losses or actual losses exceed our recorded liability for such claims,
we would record additional charges as other (income), net during the period in
which the actual loss or change in estimate occurred. In addition to contingent
liabilities recorded for probable losses, we disclose contingent liabilities when
there is a reasonable possibility that the ultimate loss will materially exceed the
recorded liability. Currently, we do not believe that any of our pending legal
proceedings or claims will have a material impact on our fi nancial position or
results of operations.
32 NIKE, INC. - Form 10-K
PART II ITEM 7A Quantitative and Qualitative Disclosures about Market Risk
ITEM 7A Quantitative and Qualitative Disclosures about Market Risk
In the normal course of business and consistent with established policies
and procedures, we employ a variety of fi nancial instruments to manage
exposure to fl uctuations in the value of foreign currencies and interest rates.
It is our policy to utilize these fi nancial instruments only where necessary to
fi nance our business and manage such exposures; we do not enter into these
transactions for speculative purposes.
We are exposed to foreign currency fl uctuations, primarily as a result of
our international sales, product sourcing and funding activities. Our foreign
exchange risk management program is intended to minimize both the positive
or negative effects of currency fl uctuations on our consolidated results of
operations, fi nancial position and cash fl ows. This also has the effect of delaying
the impact of current market rates on our consolidated fi nancial statements
dependent upon hedge horizons. We use forward exchange contracts and
options to hedge certain anticipated but not yet fi rmly committed transactions
as well as certain fi rm commitments and the related receivables and payables,
including third party and intercompany transactions. We also use forward
contracts to hedge our investment in the net assets of certain international
subsidiaries to offset foreign currency translation adjustments related to our
net investment in those subsidiaries.
When we begin hedging exposures, the type and duration of each hedge
depends on the nature of the exposure and market conditions. Generally,
all anticipated and fi rmly committed transactions that are hedged are to be
recognized within 12 to 18 months. The majority of the contracts expiring
in more than 12 months relate to the anticipated purchase of inventory.
When intercompany loans are hedged, it is typically for their expected duration.
Hedged transactions are principally denominated in Euros, Japanese Yen
and British Pounds. See Section “Foreign Currency Exposures and Hedging
Practices” under Item 7 for additional detail.
Our earnings are also exposed to movements in short and long-term market
interest rates. Our objective in managing this interest rate exposure is to limit
the impact of interest rate changes on earnings and cash fl ows and to reduce
overall borrowing costs. To achieve these objectives, we maintain a mix of
commercial paper, bank loans and fi xed rate debt of varying maturities and
have entered into receive-fi xed, pay-variable interest rate swaps.
Market Risk Measurement
We monitor foreign exchange risk, interest rate risk and related derivatives
using a variety of techniques including a review of market value, sensitivity
analysis, and Value-at-Risk (“VaR”). Our market-sensitive derivative and other
fi nancial instruments are foreign currency forward contracts, foreign currency
option contracts, interest rate swaps, intercompany loans denominated in
non-functional currencies, fi xed interest rate U.S. dollar denominated debt,
and fi xed interest rate Japanese Yen denominated debt.
We use VaR to monitor the foreign exchange risk of our foreign currency forward
and foreign currency option derivative instruments only. The VaR determines
the maximum potential one-day loss in the fair value of these foreign exchange
rate-sensitive fi nancial instruments. The VaR model estimates assume normal
market conditions and a 95% confi dence level. There are various modeling
techniques that can be used in the VaR computation. Our computations are
based on interrelationships between currencies and interest rates (a “variance/
co-variance” technique). These interrelationships are a function of foreign
exchange currency market changes and interest rate changes over the preceding
one year period. The value of foreign currency options does not change on a
one-to-one basis with changes in the underlying currency rate. We adjusted
the potential loss in option value for the estimated sensitivity (the “delta” and
“gamma”) to changes in the underlying currency rate. This calculation refl ects
the impact of foreign currency rate fl uctuations on the derivative instruments
only and does not include the impact of such rate fl uctuations on non-functional
currency transactions (such as anticipated transactions, fi rm commitments,
cash balances, and accounts and loans receivable and payable), including
those which are hedged by these instruments.
The VaR model is a risk analysis tool and does not purport to represent
actual losses in fair value that we will incur, nor does it consider the potential
effect of favorable changes in market rates. It also does not represent the
full extent of the possible loss that may occur. Actual future gains and losses
will differ from those estimated because of changes or differences in market
rates and interrelationships, hedging instruments and hedge percentages,
timing and other factors.
The estimated maximum one-day loss in fair value on our foreign currency
sensitive derivative fi nancial instruments, derived using the VaR model, was
$33 million and $17 million at May 31, 2011 and 2010, respectively. The VaR
increased year-over-year primarily as a result of increased foreign currency
volatilities at May 31, 2011. Such a hypothetical loss in fair value of our derivatives
would be offset by increases in the value of the underlying transactions being
hedged. The average monthly change in the fair values of foreign currency
forward and foreign currency option derivative instruments was $79 million
and $52 million during fi scal 2011 and fi scal 2010, respectively.
The instruments not included in the VaR are intercompany loans denominated
in non-functional currencies, fi xed interest rate Japanese Yen denominated
debt, fi xed interest rate U.S. dollar denominated debt and interest rate swaps.
Intercompany loans and related interest amounts are eliminated in consolidation.
Furthermore, our non-functional currency intercompany loans are substantially
hedged against foreign exchange risk through the use of forward contracts,
which are included in the VaR calculation above. We, therefore, consider
the interest rate and foreign currency market risks associated with our non-
functional currency intercompany loans to be immaterial to our consolidated
fi nancial position, results from operations and cash fl ows.
Details of third party debt and interest rate swaps are provided in the table
below. The table presents principal cash fl ows and related weighted average
interest rates by expected maturity dates. Weighted average interest rates
for the fi xed rate swapped to fl oating rate debt refl ect the effective interest
rates as of May 31, 2011.
33NIKE, INC. - Form 10-K
PART II ITEM 8 Financial Statements and Supplemental Data
(In millions, except interest rates)
Expected Maturity Date Year Ending May 31,
2012 2013 2014 2015 2016 Thereafter Total Fair Value Foreign Exchange Risk
Japanese Yen Functional Currency
Japanese Yen debt — Fixed rate
Principal payments $ 200 $ 8 $ 8 $ 8 $ 8 $ 37 $ 269 $ 275
Average interest rate 3.4 % 2.4 % 2.4 % 2.4 % 2.4 % 2.4 % 3.0 %
Interest Rate Risk
Japanese Yen Functional Currency
Long-term Japanese Yen debt — Fixed rate
Principal payments $ 200 $ 8 $ 8 $ 8 $ 8 $ 37 $ 269 $ 275
Average interest rate 3.4 % 2.4 % 2.4 % 2.4 % 2.4 % 2.4 % 2.0 %
U.S. Dollar Functional Currency
Long-term U.S. Dollar debt — Fixed rate
swapped to Floating rate
Principal payments $ — $ 40 $ — $ — $ 101 $ — $ 141 $ 153
Average interest rate 0.0 % 0.9 % 0.0 % 0.0 % 0.4 % 0.0 % 0.5 %
Long-term U.S. Dollar debt — Fixed rate
Principal payments $ — $ — $ 50 $ — $ — $ — $ 50 $ 54
Average interest rate 0.0 % 0.0 % 4.7 % 0.0 % 0.0 % 0.0 % 4.7 %
The fi xed interest rate Japanese Yen denominated debt instruments were issued by and are accounted for by one of our Japanese subsidiaries. Accordingly,
the monthly translation of these instruments, which varies due to changes in foreign exchange rates, is recognized in accumulated other comprehensive income
upon the consolidation of this subsidiary.
ITEM 8 Financial Statements and Supplemental Data Management of NIKE, Inc. is responsible for the information and representations
contained in this report. The fi nancial statements have been prepared in
conformity with the generally accepted accounting principles we considered
appropriate in the circumstances and include some amounts based on our
best estimates and judgments. Other fi nancial information in this report is
consistent with these fi nancial statements.
Our accounting systems include controls designed to reasonably assure
assets are safeguarded from unauthorized use or disposition and provide for
the preparation of fi nancial statements in conformity with generally accepted
accounting principles. These systems are supplemented by the selection
and training of qualifi ed fi nancial personnel and an organizational structure
providing for appropriate segregation of duties.
An Internal Audit department reviews the results of its work with the Audit
Committee of the Board of Directors, presently consisting of three outside
directors. The Audit Committee is responsible for the appointment of the
independent registered public accounting fi rm and reviews with the independent
registered public accounting fi rm, management and the internal audit staff,
the scope and the results of the annual examination, the effectiveness of the
accounting control system and other matters relating to the fi nancial affairs of
NIKE as they deem appropriate. The independent registered public accounting
fi rm and the internal auditors have full access to the Committee, with and
without the presence of management, to discuss any appropriate matters.
34 NIKE, INC. - Form 10-K
PART II ITEM 8 Financial Statements and Supplemental Data
Management’s Annual Report on Internal Control Over Financial Reporting
Management is responsible for establishing and maintaining adequate internal
control over fi nancial reporting, as such term is defi ned in Rule 13a-15(f) and
Rule 15d-15(f) of the Securities Exchange Act of 1934, as amended. Internal
control over fi nancial reporting is a process designed to provide reasonable
assurance regarding the reliability of fi nancial reporting and the preparation
of the fi nancial statements for external purposes in accordance with generally
accepted accounting principles in the United States of America. Internal control
over fi nancial reporting includes those policies and procedures that: (i) pertain
to the maintenance of records that, in reasonable detail, accurately and fairly
refl ect the transactions and dispositions of assets of the company; (ii) provide
reasonable assurance that transactions are recorded as necessary to permit
preparation of fi nancial statements in accordance with generally accepted
accounting principles, and that receipts and expenditures of the company
are being made only in accordance with authorizations of our management
and directors; and (iii) provide reasonable assurance regarding prevention or
timely detection of unauthorized acquisition, use or disposition of assets of
the company that could have a material effect on the fi nancial statements.
While “reasonable assurance” is a high level of assurance, it does not mean
absolute assurance. Because of its inherent limitations, internal control over
fi nancial reporting may not prevent or detect every misstatement and instance
of fraud. Controls are susceptible to manipulation, especially in instances of
fraud caused by the collusion of two or more people, including our senior
management. Also, projections of any evaluation of effectiveness to future
periods are subject to the risk that controls may become inadequate because
of changes in conditions, or that the degree of compliance with the policies
or procedures may deteriorate.
Under the supervision and with the participation of our Chief Executive Offi cer
and Chief Financial Offi cer, our management conducted an evaluation of the
effectiveness of our internal control over fi nancial reporting based upon the
framework in Internal Control — Integrated Framework issued by the Committee
of Sponsoring Organizations of the Treadway Commission (COSO). Based
on the results of our evaluation, our management concluded that our internal
control over fi nancial reporting was effective as of May 31, 2011.
PricewaterhouseCoopers LLP, an independent registered public accounting fi rm,
has audited (1) the consolidated fi nancial statements and (2) the effectiveness
of our internal control over fi nancial reporting as of May 31, 2011, as stated
in their report herein.
Mark G. Parker Donald W. Blair Chief Executive Offi cer and President Chief Financial Offi cer
Report of Independent Registered Public Accounting Firm
To the Board of Directors and Shareholders of NIKE, Inc.:
In our opinion, the consolidated fi nancial statements listed in the index
appearing under Item 15(a)(1) present fairly, in all material respects, the fi nancial
position of NIKE, Inc. and its subsidiaries at May 31, 2011 and 2010, and
the results of their operations and their cash fl ows for each of the three years
in the period ended May 31, 2011 in conformity with accounting principles
generally accepted in the United States of America. In addition, in our opinion,
the fi nancial statement schedule listed in the appendix appearing under
Item 15(a)(2) presents fairly, in all material respects, the information set forth
therein when read in conjunction with the related consolidated fi nancial
statements. Also in our opinion, the Company maintained, in all material
respects, effective internal control over fi nancial reporting as of May 31, 2011,
based on criteria established in Internal Control — Integrated Framework issued
by the Committee of Sponsoring Organizations of the Treadway Commission
(COSO). The Company’s management is responsible for these fi nancial
statements and fi nancial statement schedule, for maintaining effective internal
control over fi nancial reporting and for its assessment of the effectiveness of
internal control over fi nancial reporting, included in Management’s Annual
Report on Internal Control Over Financial Reporting appearing under Item 8.
Our responsibility is to express opinions on these fi nancial statements, on
the fi nancial statement schedule, and on the Company’s internal control over
fi nancial reporting based on our integrated audits. We conducted our audits in
accordance with the standards of the Public Company Accounting Oversight
Board (United States). Those standards require that we plan and perform the
audits to obtain reasonable assurance about whether the fi nancial statements
are free of material misstatement and whether effective internal control over
fi nancial reporting was maintained in all material respects. Our audits of the
fi nancial statements included examining, on a test basis, evidence supporting the
amounts and disclosures in the fi nancial statements, assessing the accounting
principles used and signifi cant estimates made by management, and evaluating
the overall fi nancial statement presentation. Our audit of internal control over
fi nancial reporting included obtaining an understanding of internal control over
fi nancial reporting, assessing the risk that a material weakness exists, and
testing and evaluating the design and operating effectiveness of internal control
based on the assessed risk. Our audits also included performing such other
procedures as we considered necessary in the circumstances. We believe
that our audits provide a reasonable basis for our opinions.
A company’s internal control over fi nancial reporting is a process designed to
provide reasonable assurance regarding the reliability of fi nancial reporting and
the preparation of fi nancial statements for external purposes in accordance with
generally accepted accounting principles. A company’s internal control over
fi nancial reporting includes those policies and procedures that (i) pertain to the
maintenance of records that, in reasonable detail, accurately and fairly refl ect
the transactions and dispositions of the assets of the company; (ii) provide
reasonable assurance that transactions are recorded as necessary to permit
preparation of fi nancial statements in accordance with generally accepted
accounting principles, and that receipts and expenditures of the company are
being made only in accordance with authorizations of management and directors
of the company; and (iii) provide reasonable assurance regarding prevention or
timely detection of unauthorized acquisition, use, or disposition of the company’s
assets that could have a material effect on the fi nancial statements.
Because of its inherent limitations, internal control over fi nancial reporting
may not prevent or detect misstatements. Also, projections of any evaluation
of effectiveness to future periods are subject to the risk that controls may
become inadequate because of changes in conditions, or that the degree of
compliance with the policies or procedures may deteriorate.
/s/ PRICEWATERHOUSECOOPERS LLP
Portland, Oregon
July 22, 2011
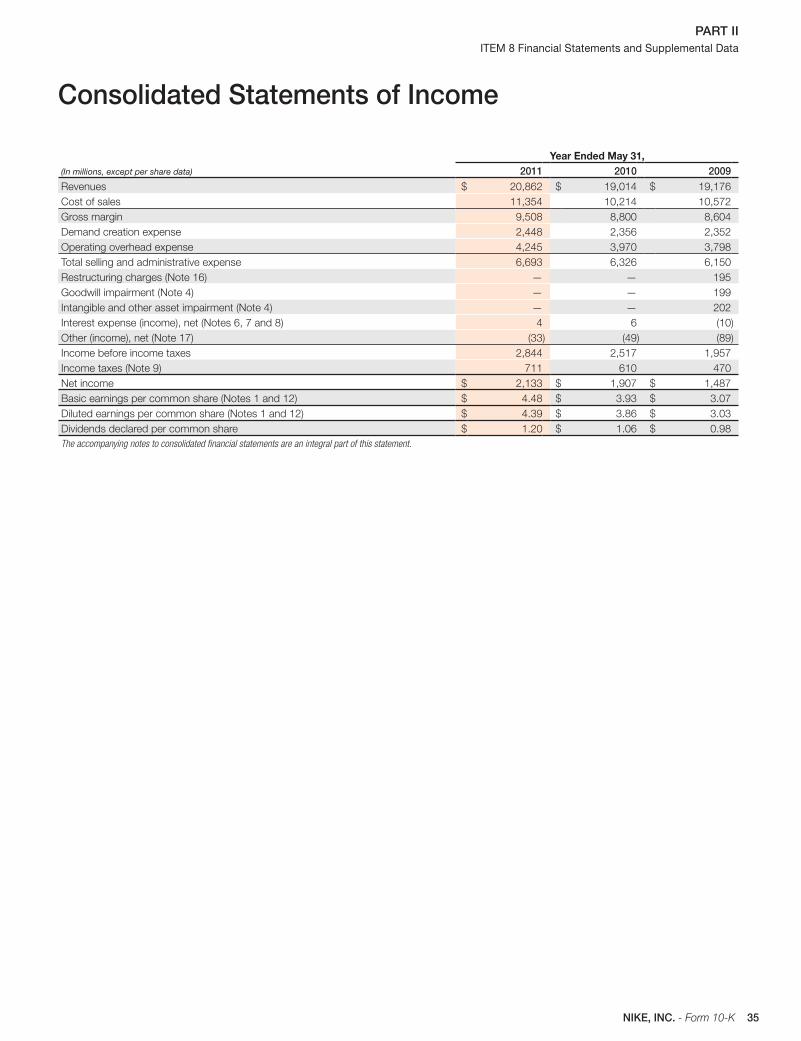
35NIKE, INC. - Form 10-K
PART II ITEM 8 Financial Statements and Supplemental Data
Consolidated Statements of Income
(In millions, except per share data)
Year Ended May 31,2011 2010 2009
Revenues $ 20,862 $ 19,014 $ 19,176
Cost of sales 11,354 10,214 10,572
Gross margin 9,508 8,800 8,604
Demand creation expense 2,448 2,356 2,352
Operating overhead expense 4,245 3,970 3,798
Total selling and administrative expense 6,693 6,326 6,150
Restructuring charges (Note 16) — — 195
Goodwill impairment (Note 4) — — 199
Intangible and other asset impairment (Note 4) — — 202
Interest expense (income), net (Notes 6, 7 and 8) 4 6 (10)
Other (income), net (Note 17) (33) (49) (89)
Income before income taxes 2,844 2,517 1,957
Income taxes (Note 9) 711 610 470
Net income $ 2,133 $ 1,907 $ 1,487
Basic earnings per common share (Notes 1 and 12) $ 4.48 $ 3.93 $ 3.07
Diluted earnings per common share (Notes 1 and 12) $ 4.39 $ 3.86 $ 3.03
Dividends declared per common share $ 1.20 $ 1.06 $ 0.98
The accompanying notes to consolidated financial statements are an integral part of this statement.
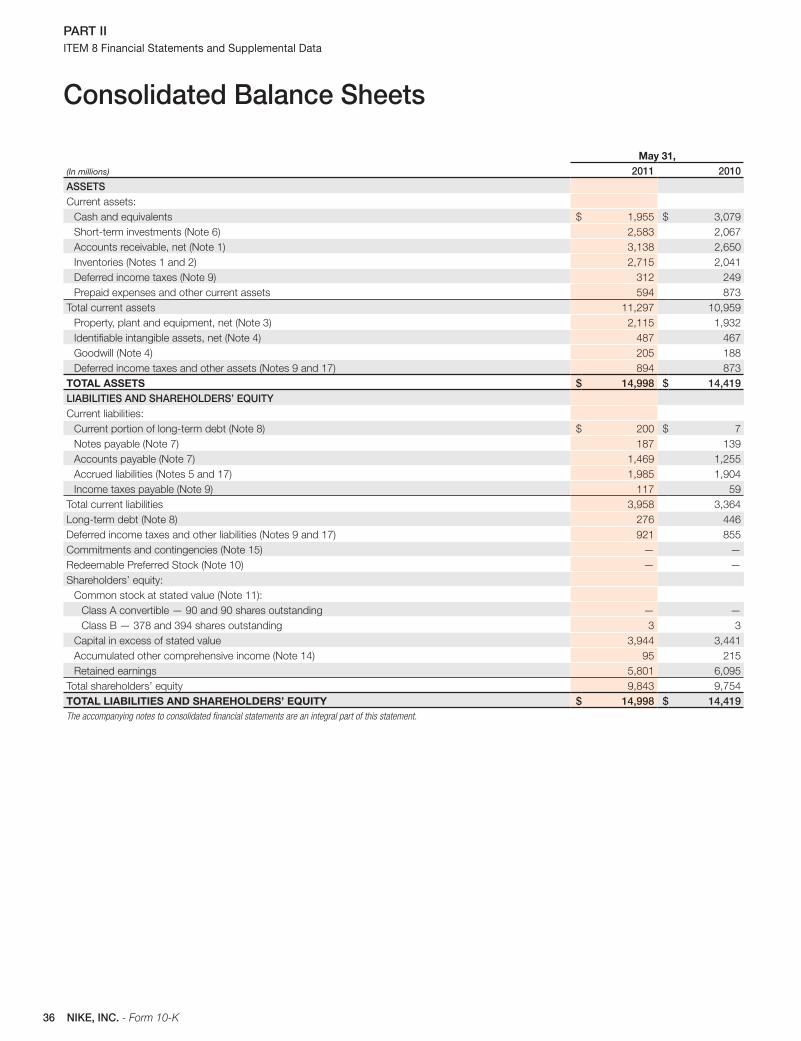
36 NIKE, INC. - Form 10-K
PART II ITEM 8 Financial Statements and Supplemental Data
Consolidated Balance Sheets
(In millions)
May 31,2011 2010
ASSETS
Current assets:
Cash and equivalents $ 1,955 $ 3,079
Short-term investments (Note 6) 2,583 2,067
Accounts receivable, net (Note 1) 3,138 2,650
Inventories (Notes 1 and 2) 2,715 2,041
Deferred income taxes (Note 9) 312 249
Prepaid expenses and other current assets 594 873
Total current assets 11,297 10,959
Property, plant and equipment, net (Note 3) 2,115 1,932
Identifi able intangible assets, net (Note 4) 487 467
Goodwill (Note 4) 205 188
Deferred income taxes and other assets (Notes 9 and 17) 894 873
TOTAL ASSETS $ 14,998 $ 14,419LIABILITIES AND SHAREHOLDERS’ EQUITY
Current liabilities:
Current portion of long-term debt (Note 8) $ 200 $ 7
Notes payable (Note 7) 187 139
Accounts payable (Note 7) 1,469 1,255
Accrued liabilities (Notes 5 and 17) 1,985 1,904
Income taxes payable (Note 9) 117 59
Total current liabilities 3,958 3,364
Long-term debt (Note 8) 276 446
Deferred income taxes and other liabilities (Notes 9 and 17) 921 855
Commitments and contingencies (Note 15) — —
Redeemable Preferred Stock (Note 10) — —
Shareholders’ equity:
Common stock at stated value (Note 11):
Class A convertible — 90 and 90 shares outstanding — —
Class B — 378 and 394 shares outstanding 3 3
Capital in excess of stated value 3,944 3,441
Accumulated other comprehensive income (Note 14) 95 215
Retained earnings 5,801 6,095
Total shareholders’ equity 9,843 9,754
TOTAL LIABILITIES AND SHAREHOLDERS’ EQUITY $ 14,998 $ 14,419The accompanying notes to consolidated financial statements are an integral part of this statement.
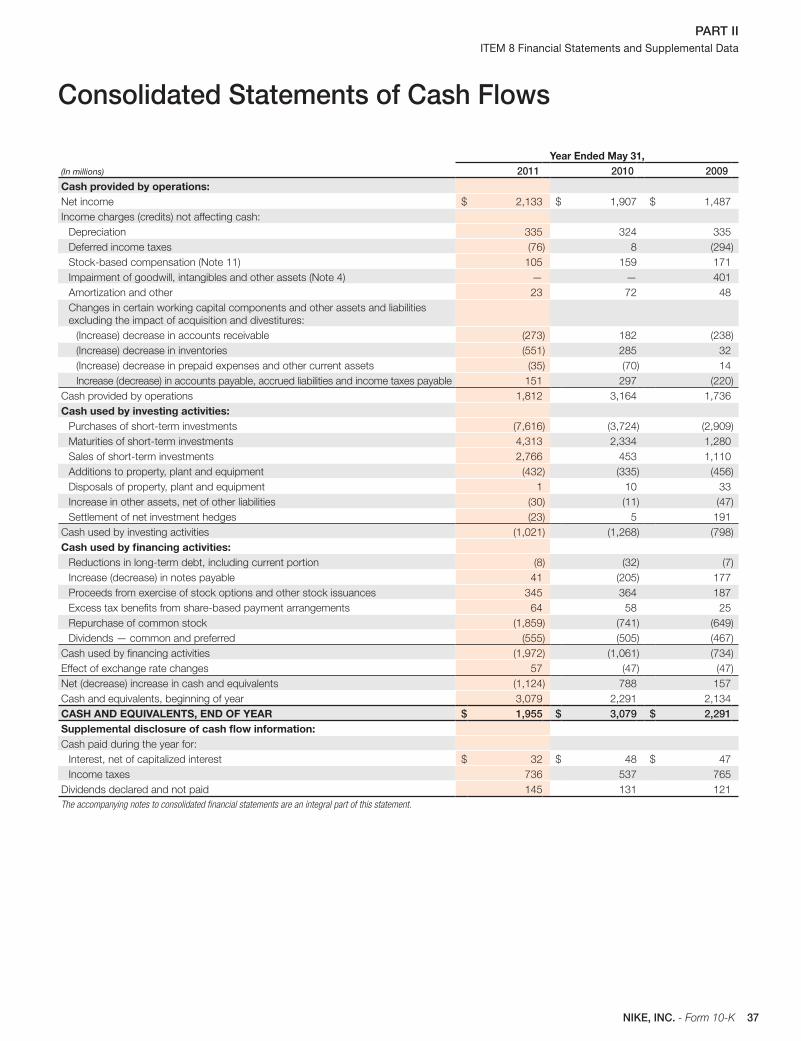
37NIKE, INC. - Form 10-K
PART II ITEM 8 Financial Statements and Supplemental Data
Consolidated Statements of Cash Flows
(In millions)
Year Ended May 31,2011 2010 2009
Cash provided by operations:
Net income $ 2,133 $ 1,907 $ 1,487
Income charges (credits) not affecting cash:
Depreciation 335 324 335
Deferred income taxes (76) 8 (294)
Stock-based compensation (Note 11) 105 159 171
Impairment of goodwill, intangibles and other assets (Note 4) — — 401
Amortization and other 23 72 48
Changes in certain working capital components and other assets and liabilities
excluding the impact of acquisition and divestitures:
(Increase) decrease in accounts receivable (273) 182 (238)
(Increase) decrease in inventories (551) 285 32
(Increase) decrease in prepaid expenses and other current assets (35) (70) 14
Increase (decrease) in accounts payable, accrued liabilities and income taxes payable 151 297 (220)
Cash provided by operations 1,812 3,164 1,736
Cash used by investing activities:
Purchases of short-term investments (7,616) (3,724) (2,909)
Maturities of short-term investments 4,313 2,334 1,280
Sales of short-term investments 2,766 453 1,110
Additions to property, plant and equipment (432) (335) (456)
Disposals of property, plant and equipment 1 10 33
Increase in other assets, net of other liabilities (30) (11) (47)
Settlement of net investment hedges (23) 5 191
Cash used by investing activities (1,021) (1,268) (798)
Cash used by fi nancing activities:
Reductions in long-term debt, including current portion (8) (32) (7)
Increase (decrease) in notes payable 41 (205) 177
Proceeds from exercise of stock options and other stock issuances 345 364 187
Excess tax benefi ts from share-based payment arrangements 64 58 25
Repurchase of common stock (1,859) (741) (649)
Dividends — common and preferred (555) (505) (467)
Cash used by fi nancing activities (1,972) (1,061) (734)
Effect of exchange rate changes 57 (47) (47)
Net (decrease) increase in cash and equivalents (1,124) 788 157
Cash and equivalents, beginning of year 3,079 2,291 2,134
CASH AND EQUIVALENTS, END OF YEAR $ 1,955 $ 3,079 $ 2,291Supplemental disclosure of cash fl ow information:
Cash paid during the year for:
Interest, net of capitalized interest $ 32 $ 48 $ 47
Income taxes 736 537 765
Dividends declared and not paid 145 131 121
The accompanying notes to consolidated financial statements are an integral part of this statement.
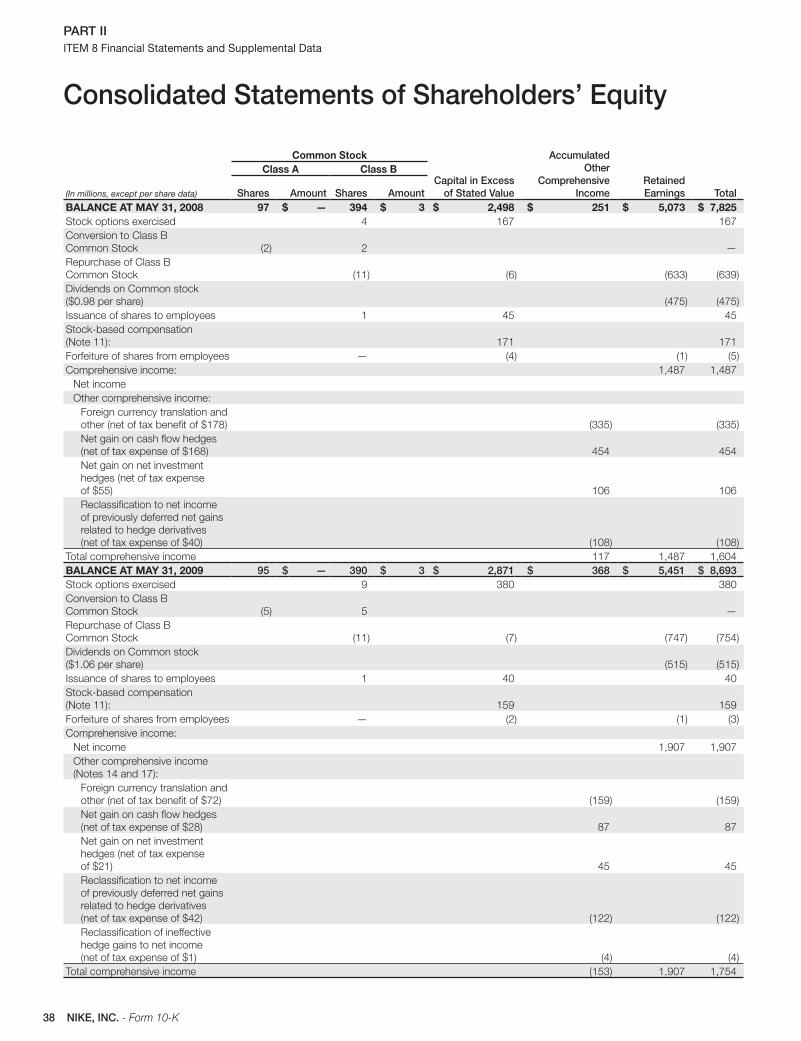
38 NIKE, INC. - Form 10-K
PART II ITEM 8 Financial Statements and Supplemental Data
Consolidated Statements of Shareholders’ Equity
(In millions, except per share data)
Common Stock
Capital in Excess of Stated Value
Accumulated Other
Comprehensive Income
RetainedEarnings Total
Class A Class B
Shares Amount Shares AmountBALANCE AT MAY 31, 2008 97 $ — 394 $ 3 $ 2,498 $ 251 $ 5,073 $ 7,825Stock options exercised 4 167 167
Conversion to Class B
Common Stock (2) 2 —
Repurchase of Class B
Common Stock (11) (6) (633) (639)
Dividends on Common stock
($0.98 per share) (475) (475)
Issuance of shares to employees 1 45 45
Stock-based compensation
(Note 11): 171 171
Forfeiture of shares from employees — (4) (1) (5)
Comprehensive income: 1,487 1,487
Net income
Other comprehensive income:
Foreign currency translation and
other (net of tax benefi t of $178) (335) (335)
Net gain on cash fl ow hedges
(net of tax expense of $168) 454 454
Net gain on net investment
hedges (net of tax expense
of $55) 106 106
Reclassifi cation to net income
of previously deferred net gains
related to hedge derivatives
(net of tax expense of $40) (108) (108)
Total comprehensive income 117 1,487 1,604
BALANCE AT MAY 31, 2009 95 $ — 390 $ 3 $ 2,871 $ 368 $ 5,451 $ 8,693Stock options exercised 9 380 380
Conversion to Class B
Common Stock (5) 5 —
Repurchase of Class B
Common Stock (11) (7) (747) (754)
Dividends on Common stock
($1.06 per share) (515) (515)
Issuance of shares to employees 1 40 40
Stock-based compensation
(Note 11): 159 159
Forfeiture of shares from employees — (2) (1) (3)
Comprehensive income:
Net income 1,907 1,907
Other comprehensive income
(Notes 14 and 17):
Foreign currency translation and
other (net of tax benefi t of $72) (159) (159)
Net gain on cash fl ow hedges
(net of tax expense of $28) 87 87
Net gain on net investment
hedges (net of tax expense
of $21) 45 45
Reclassifi cation to net income
of previously deferred net gains
related to hedge derivatives
(net of tax expense of $42) (122) (122)
Reclassifi cation of ineffective
hedge gains to net income
(net of tax expense of $1) (4) (4)
Total comprehensive income (153) 1,907 1,754
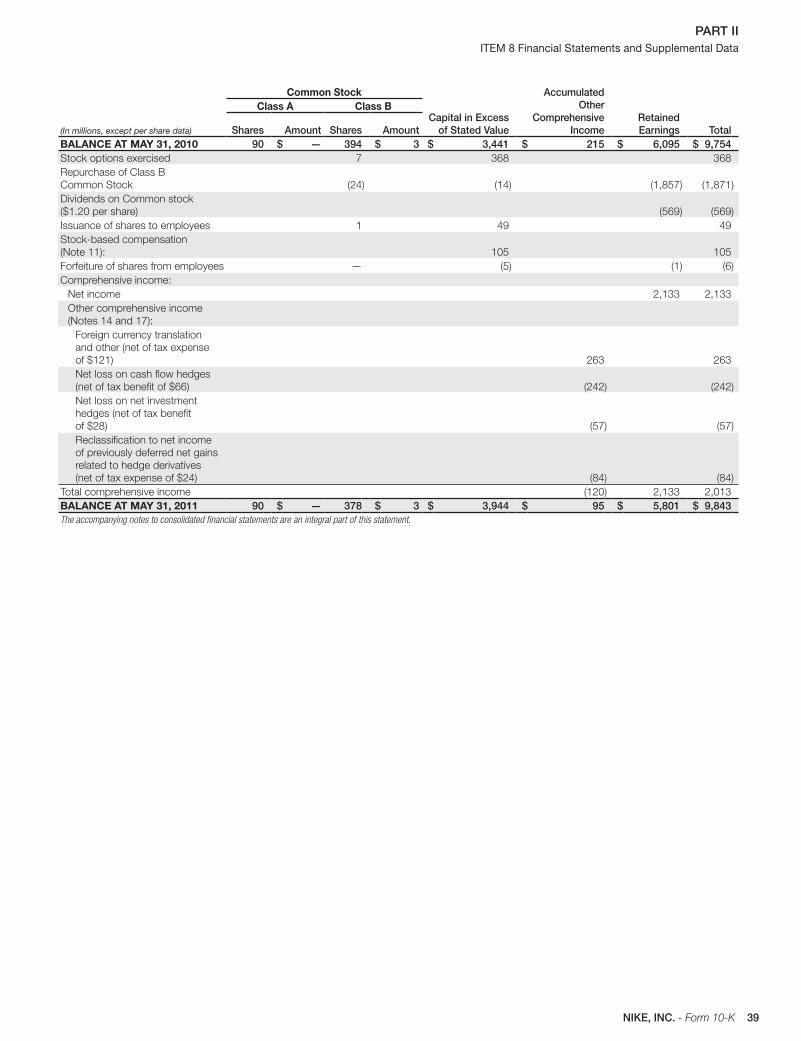
39NIKE, INC. - Form 10-K
PART II ITEM 8 Financial Statements and Supplemental Data
(In millions, except per share data)
Common Stock
Capital in Excess of Stated Value
Accumulated Other
Comprehensive Income
RetainedEarnings Total
Class A Class B
Shares Amount Shares AmountBALANCE AT MAY 31, 2010 90 $ — 394 $ 3 $ 3,441 $ 215 $ 6,095 $ 9,754Stock options exercised 7 368 368
Repurchase of Class B
Common Stock (24) (14) (1,857) (1,871)
Dividends on Common stock
($1.20 per share) (569) (569)
Issuance of shares to employees 1 49 49
Stock-based compensation
(Note 11): 105 105
Forfeiture of shares from employees — (5) (1) (6)
Comprehensive income:
Net income 2,133 2,133
Other comprehensive income
(Notes 14 and 17):
Foreign currency translation
and other (net of tax expense
of $121) 263 263
Net loss on cash fl ow hedges
(net of tax benefi t of $66) (242) (242)
Net loss on net investment
hedges (net of tax benefi t
of $28) (57) (57)
Reclassifi cation to net income
of previously deferred net gains
related to hedge derivatives
(net of tax expense of $24) (84) (84)
Total comprehensive income (120) 2,133 2,013
BALANCE AT MAY 31, 2011 90 $ — 378 $ 3 $ 3,944 $ 95 $ 5,801 $ 9,843The accompanying notes to consolidated financial statements are an integral part of this statement.
40 NIKE, INC. - Form 10-K
PART II ITEM 8 Financial Statements and Supplemental Data
Notes to Consolidated Financial Statements
Note 1 Summary of Signifi cant Accounting Policies .......................................................................................................................................................................................41
Note 2 Inventories ..............................................................................................................................................................................................................................................................................................43
Note 3 Property, Plant and Equipment ................................................................................................................................................................................................................................43
Note 4 Identifi able Intangible Assets, Goodwill and Umbro Impairment ...........................................................................................................................44
Note 5 Accrued Liabilities .......................................................................................................................................................................................................................................................................45
Note 6 Fair Value Measurements .................................................................................................................................................................................................................................................45
Note 7 Short-Term Borrowings and Credit Lines ..................................................................................................................................................................................................47
Note 8 Long-Term Debt ..............................................................................................................................................................................................................................................................................47
Note 9 Income Taxes .....................................................................................................................................................................................................................................................................................48
Note 10 Redeemable Preferred Stock ......................................................................................................................................................................................................................................50
Note 11 Common Stock and Stock-Based Compensation .......................................................................................................................................................................50
Note 12 Earnings Per Share ....................................................................................................................................................................................................................................................................51
Note 13 Benefi t Plans .......................................................................................................................................................................................................................................................................................51
Note 14 Accumulated Other Comprehensive Income .......................................................................................................................................................................................52
Note 15 Commitments and Contingencies .......................................................................................................................................................................................................................52
Note 16 Restructuring Charges..........................................................................................................................................................................................................................................................52
Note 17 Risk Management and Derivatives .....................................................................................................................................................................................................................52
Note 18 Operating Segments and Related Information ..................................................................................................................................................................................55
41NIKE, INC. - Form 10-K
PART II Note 1 Summary of Signifi cant Accounting Policies
NOTE 1 Summary of Signifi cant Accounting Policies
Description of BusinessNIKE, Inc. is a worldwide leader in the design, marketing and distribution of
athletic and sports-inspired footwear, apparel, equipment and accessories.
Wholly-owned NIKE subsidiaries include Cole Haan, which designs, markets
and distributes dress and casual shoes, handbags, accessories and coats;
Converse Inc., which designs, markets and distributes athletic and casual
footwear, apparel and accessories; Hurley International LLC, which designs,
markets and distributes action sports and youth lifestyle footwear, apparel
and accessories; and Umbro International Limited, which designs, distributes
and licenses athletic and casual footwear, apparel and equipment, primarily
for the sport of soccer.
Basis of ConsolidationThe consolidated fi nancial statements include the accounts of NIKE, Inc. and
its subsidiaries (the “Company”). All signifi cant intercompany transactions and
balances have been eliminated.
Recognition of RevenuesWholesale revenues are recognized when title passes and the risks and
rewards of ownership have passed to the customer, based on the terms of
sale. This occurs upon shipment or upon receipt by the customer depending
on the country of the sale and the agreement with the customer. Retail store
revenues are recorded at the time of sale. Provisions for sales discounts, returns
and miscellaneous claims from customers are made at the time of sale. As of
May 31, 2011 and 2010, the Company’s reserve balances for sales discounts,
returns and miscellaneous claims were $423 million and $371 million, respectively.
Shipping and Handling CostsShipping and handling costs are expensed as incurred and included in cost
of sales.
Demand Creation ExpenseDemand creation expense consists of advertising and promotion costs,
including costs of endorsement contracts, television, digital and print advertising,
brand events, and retail brand presentation. Advertising production costs are
expensed the fi rst time an advertisement is run. Advertising placement costs
are expensed in the month the advertising appears, while costs related to
brand events are expensed when the event occurs. Costs related to retail
brand presentation are expensed when the presentation is completed and
delivered. A signifi cant amount of the Company’s promotional expenses result
from payments under endorsement contracts. Accounting for endorsement
payments is based upon specifi c contract provisions. Generally, endorsement
payments are expensed on a straight-line basis over the term of the contract
after giving recognition to periodic performance compliance provisions of the
contracts. Prepayments made under contracts are included in prepaid expenses
or other assets depending on the period to which the prepayment applies.
Through cooperative advertising programs, the Company reimburses retail
customers for certain costs of advertising the Company’s products. The Company
records these costs in selling and administrative expense at the point in
time when it is obligated to its customers for the costs, which is when the
related revenues are recognized. This obligation may arise prior to the related
advertisement being run.
Total advertising and promotion expenses were $2,448 million, $2,356 million, and
$2,352 million for the years ended May 31, 2011, 2010 and 2009, respectively.
Prepaid advertising and promotion expenses recorded in prepaid expenses
and other assets totaled $291 million and $261 million at May 31, 2011
and 2010, respectively.
Cash and EquivalentsCash and equivalents represent cash and short-term, highly liquid investments
with maturities of three months or less at date of purchase. The carrying
amounts refl ected in the consolidated balance sheet for cash and equivalents
approximate fair value.
Short-Term InvestmentsShort-term investments consist of highly liquid investments, including commercial
paper, U.S. treasury, U.S. agency, and corporate debt securities, with maturities
over three months from the date of purchase. Debt securities that the Company
has the ability and positive intent to hold to maturity are carried at amortized
cost. At May 31, 2011 and 2010, the Company did not hold any short-term
investments that were classifi ed as trading or held-to-maturity.
At May 31, 2011 and 2010, short-term investments consisted of available-
for-sale securities. Available-for-sale securities are recorded at fair value with
unrealized gains and losses reported, net of tax, in other comprehensive
income, unless unrealized losses are determined to be other than temporary.
The Company considers all available-for-sale securities, including those with
maturity dates beyond 12 months, as available to support current operational
liquidity needs and therefore classifi es all securities with maturity dates beyond
three months at the date of purchase as current assets within short-term
investments on the consolidated balance sheet.
See Note 6 — Fair Value Measurements for more information on the Company’s
short term investments.
Allowance for Uncollectible Accounts ReceivableAccounts receivable consists primarily of amounts receivable from customers.
We make ongoing estimates relating to the collectability of our accounts
receivable and maintain an allowance for estimated losses resulting from
the inability of our customers to make required payments. In determining
the amount of the allowance, we consider our historical level of credit losses
and make judgments about the creditworthiness of signifi cant customers
based on ongoing credit evaluations. Accounts receivable with anticipated
collection dates greater than 12 months from the balance sheet date and
related allowances are considered non-current and recorded in other assets.
The allowance for uncollectible accounts receivable was $124 million and
$117 million at May 31, 2011 and 2010, respectively, of which $50 million
and $43 million was classifi ed as long-term and recorded in other assets.
Inventory ValuationInventories are stated at lower of cost or market and valued on a fi rst-in,
fi rst-out (“FIFO”) or moving average cost basis.
Property, Plant and Equipment and DepreciationProperty, plant and equipment are recorded at cost. Depreciation for fi nancial
reporting purposes is determined on a straight-line basis for buildings and
leasehold improvements over 2 to 40 years and for machinery and equipment
over 2 to 15 years. Computer software (including, in some cases, the cost
of internal labor) is depreciated on a straight-line basis over 3 to 10 years.
Impairment of Long-Lived AssetsThe Company reviews the carrying value of long-lived assets or asset groups to
be used in operations whenever events or changes in circumstances indicate
that the carrying amount of the assets might not be recoverable. Factors that
would necessitate an impairment assessment include a signifi cant adverse
42 NIKE, INC. - Form 10-K
PART II Note 1 Summary of Signifi cant Accounting Policies
change in the extent or manner in which an asset is used, a signifi cant adverse
change in legal factors or the business climate that could affect the value of
the asset, or a signifi cant decline in the observable market value of an asset,
among others. If such facts indicate a potential impairment, the Company
would assess the recoverability of an asset group by determining if the carrying
value of the asset group exceeds the sum of the projected undiscounted cash
fl ows expected to result from the use and eventual disposition of the assets
over the remaining economic life of the primary asset in the asset group.
If the recoverability test indicates that the carrying value of the asset group is
not recoverable, the Company will estimate the fair value of the asset group
using appropriate valuation methodologies which would typically include an
estimate of discounted cash fl ows. Any impairment would be measured as
the difference between the asset groups carrying amount and its estimated
fair value.
Identifi able Intangible Assets and GoodwillThe Company performs annual impairment tests on goodwill and intangible
assets with indefi nite lives in the fourth quarter of each fi scal year, or when
events occur or circumstances change that would, more likely than not, reduce
the fair value of a reporting unit or an intangible asset with an indefi nite life
below its carrying value. Events or changes in circumstances that may trigger
interim impairment reviews include signifi cant changes in business climate,
operating results, planned investments in the reporting unit, or an expectation
that the carrying amount may not be recoverable, among other factors.
The impairment test requires the Company to estimate the fair value of its
reporting units. If the carrying value of a reporting unit exceeds its fair value,
the goodwill of that reporting unit is potentially impaired and the Company
proceeds to step two of the impairment analysis. In step two of the analysis,
the Company measures and records an impairment loss equal to the excess
of the carrying value of the reporting unit’s goodwill over its implied fair value
should such a circumstance arise.
The Company generally bases its measurement of fair value of a reporting
unit on a blended analysis of the present value of future discounted cash
fl ows and the market valuation approach. The discounted cash fl ows model
indicates the fair value of the reporting unit based on the present value of
the cash fl ows that the Company expects the reporting unit to generate in
the future. The Company’s signifi cant estimates in the discounted cash fl ows
model include: its weighted average cost of capital; long-term rate of growth
and profi tability of the reporting unit’s business; and working capital effects.
The market valuation approach indicates the fair value of the business based on
a comparison of the reporting unit to comparable publicly traded companies in
similar lines of business. Signifi cant estimates in the market valuation approach
model include identifying similar companies with comparable business factors
such as size, growth, profi tability, risk and return on investment, and assessing
comparable revenue and operating income multiples in estimating the fair
value of the reporting unit.
The Company believes the weighted use of discounted cash fl ows and the
market valuation approach is the best method for determining the fair value of
its reporting units because these are the most common valuation methodologies
used within its industry; and the blended use of both models compensates for
the inherent risks associated with either model if used on a stand-alone basis.
Indefi nite-lived intangible assets primarily consist of acquired trade names and
trademarks. In measuring the fair value for these intangible assets, the Company
utilizes the relief-from-royalty method. This method assumes that trade names
and trademarks have value to the extent that their owner is relieved of the
obligation to pay royalties for the benefi ts received from them. This method
requires the Company to estimate the future revenue for the related brands,
the appropriate royalty rate and the weighted average cost of capital.
Foreign Currency Translation and Foreign Currency TransactionsAdjustments resulting from translating foreign functional currency fi nancial
statements into U.S. dollars are included in the foreign currency translation
adjustment, a component of accumulated other comprehensive income in
shareholders’ equity.
The Company’s global subsidiaries have various assets and liabilities, primarily
receivables and payables, that are denominated in currencies other than their
functional currency. These balance sheet items are subject to remeasurement,
the impact of which is recorded in other (income), net, within our consolidated
statement of income.
Accounting for Derivatives and Hedging ActivitiesThe Company uses derivative fi nancial instruments to limit exposure to
changes in foreign currency exchange rates and interest rates. All derivatives
are recorded at fair value on the balance sheet and changes in the fair value of
derivative fi nancial instruments are either recognized in other comprehensive
income (a component of shareholders’ equity), debt or net income depending
on the nature of the underlying exposure, whether the derivative is formally
designated as a hedge, and, if designated, the extent to which the hedge is
effective. The Company classifi es the cash fl ows at settlement from derivatives
in the same category as the cash fl ows from the related hedged items.
For undesignated hedges and designated cash fl ow hedges, this is within
the cash provided by operations component of the consolidated statements
of cash fl ows. For designated net investment hedges, this is generally within
the cash used by investing activities component of the cash fl ow statement.
As our fair value hedges are receive-fi xed, pay-variable interest rate swaps,
the cash fl ows associated with these derivative instruments are periodic interest
payments while the swaps are outstanding, which are refl ected in net income
within the cash provided by operations component of the cash fl ow statement.
See Note 17 — Risk Management and Derivatives for more information on
the Company’s risk management program and derivatives.
Stock-Based CompensationThe Company estimates the fair value of options and stock appreciation rights
granted under the NIKE, Inc. 1990 Stock Incentive Plan (the “1990 Plan”) and
employees’ purchase rights under the Employee Stock Purchase Plans (“ESPPs”)
using the Black-Scholes option pricing model. The Company recognizes this
fair value, net of estimated forfeitures, as selling and administrative expense
in the consolidated statements of income over the vesting period using the
straight-line method.
See Note 11 — Common Stock and Stock-Based Compensation for more
information on the Company’s stock programs.
Income TaxesThe Company accounts for income taxes using the asset and liability method.
This approach requires the recognition of deferred tax assets and liabilities
for the expected future tax consequences of temporary differences between
the carrying amounts and the tax basis of assets and liabilities. United States
income taxes are provided currently on fi nancial statement earnings of non-U.S.
subsidiaries that are expected to be repatriated. The Company determines
annually the amount of undistributed non-U.S. earnings to invest indefi nitely
in its non-U.S. operations. The Company recognizes interest and penalties
related to income tax matters in income tax expense.
See Note 9 — Income Taxes for further discussion.
Earnings Per ShareBasic earnings per common share is calculated by dividing net income by
the weighted average number of common shares outstanding during the
year. Diluted earnings per common share is calculated by adjusting weighted
average outstanding shares, assuming conversion of all potentially dilutive
stock options and awards.
See Note 12 — Earnings Per Share for further discussion.
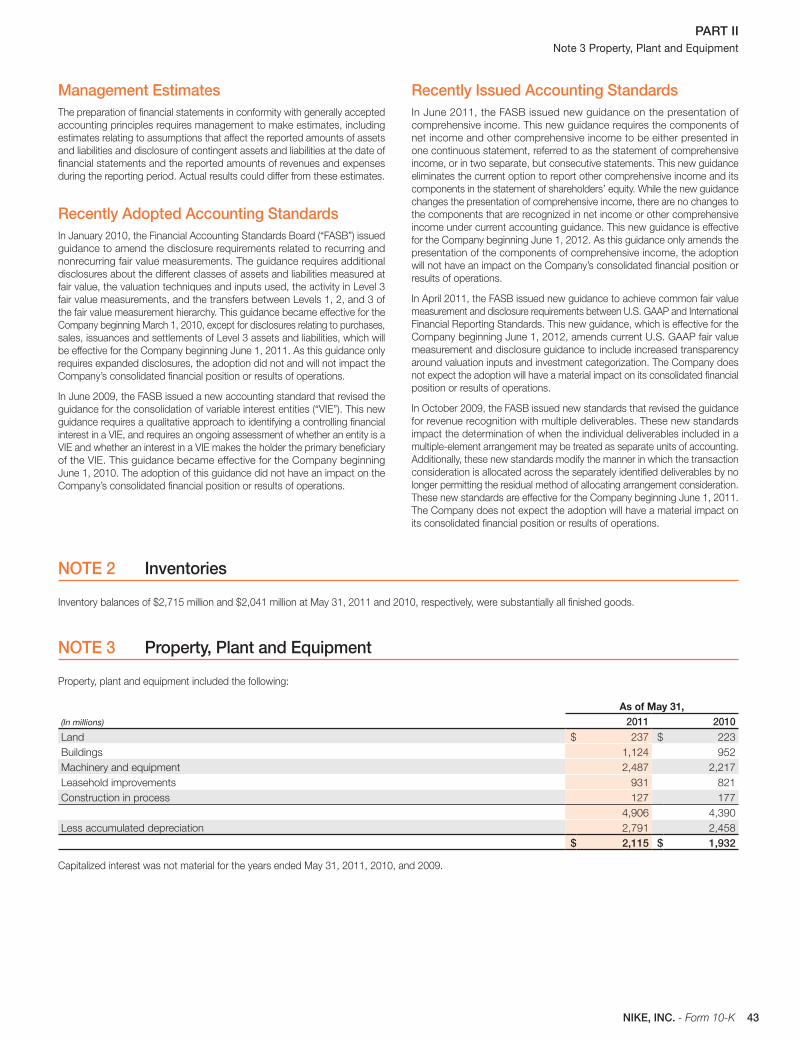
43NIKE, INC. - Form 10-K
PART II Note 3 Property, Plant and Equipment
Management EstimatesThe preparation of fi nancial statements in conformity with generally accepted
accounting principles requires management to make estimates, including
estimates relating to assumptions that affect the reported amounts of assets
and liabilities and disclosure of contingent assets and liabilities at the date of
fi nancial statements and the reported amounts of revenues and expenses
during the reporting period. Actual results could differ from these estimates.
Recently Adopted Accounting StandardsIn January 2010, the Financial Accounting Standards Board (“FASB”) issued
guidance to amend the disclosure requirements related to recurring and
nonrecurring fair value measurements. The guidance requires additional
disclosures about the different classes of assets and liabilities measured at
fair value, the valuation techniques and inputs used, the activity in Level 3
fair value measurements, and the transfers between Levels 1, 2, and 3 of
the fair value measurement hierarchy. This guidance became effective for the
Company beginning March 1, 2010, except for disclosures relating to purchases,
sales, issuances and settlements of Level 3 assets and liabilities, which will
be effective for the Company beginning June 1, 2011. As this guidance only
requires expanded disclosures, the adoption did not and will not impact the
Company’s consolidated fi nancial position or results of operations.
In June 2009, the FASB issued a new accounting standard that revised the
guidance for the consolidation of variable interest entities (“VIE”). This new
guidance requires a qualitative approach to identifying a controlling fi nancial
interest in a VIE, and requires an ongoing assessment of whether an entity is a
VIE and whether an interest in a VIE makes the holder the primary benefi ciary
of the VIE. This guidance became effective for the Company beginning
June 1, 2010. The adoption of this guidance did not have an impact on the
Company’s consolidated fi nancial position or results of operations.
Recently Issued Accounting StandardsIn June 2011, the FASB issued new guidance on the presentation of
comprehensive income. This new guidance requires the components of
net income and other comprehensive income to be either presented in
one continuous statement, referred to as the statement of comprehensive
income, or in two separate, but consecutive statements. This new guidance
eliminates the current option to report other comprehensive income and its
components in the statement of shareholders’ equity. While the new guidance
changes the presentation of comprehensive income, there are no changes to
the components that are recognized in net income or other comprehensive
income under current accounting guidance. This new guidance is effective
for the Company beginning June 1, 2012. As this guidance only amends the
presentation of the components of comprehensive income, the adoption
will not have an impact on the Company’s consolidated fi nancial position or
results of operations.
In April 2011, the FASB issued new guidance to achieve common fair value
measurement and disclosure requirements between U.S. GAAP and International
Financial Reporting Standards. This new guidance, which is effective for the
Company beginning June 1, 2012, amends current U.S. GAAP fair value
measurement and disclosure guidance to include increased transparency
around valuation inputs and investment categorization. The Company does
not expect the adoption will have a material impact on its consolidated fi nancial
position or results of operations.
In October 2009, the FASB issued new standards that revised the guidance
for revenue recognition with multiple deliverables. These new standards
impact the determination of when the individual deliverables included in a
multiple-element arrangement may be treated as separate units of accounting.
Additionally, these new standards modify the manner in which the transaction
consideration is allocated across the separately identifi ed deliverables by no
longer permitting the residual method of allocating arrangement consideration.
These new standards are effective for the Company beginning June 1, 2011.
The Company does not expect the adoption will have a material impact on
its consolidated fi nancial position or results of operations.
NOTE 2 Inventories
Inventory balances of $2,715 million and $2,041 million at May 31, 2011 and 2010, respectively, were substantially all fi nished goods.
NOTE 3 Property, Plant and Equipment
Property, plant and equipment included the following:
(In millions)
As of May 31,2011 2010
Land $ 237 $ 223
Buildings 1,124 952
Machinery and equipment 2,487 2,217
Leasehold improvements 931 821
Construction in process 127 177
4,906 4,390
Less accumulated depreciation 2,791 2,458
$ 2,115 $ 1,932
Capitalized interest was not material for the years ended May 31, 2011, 2010, and 2009.
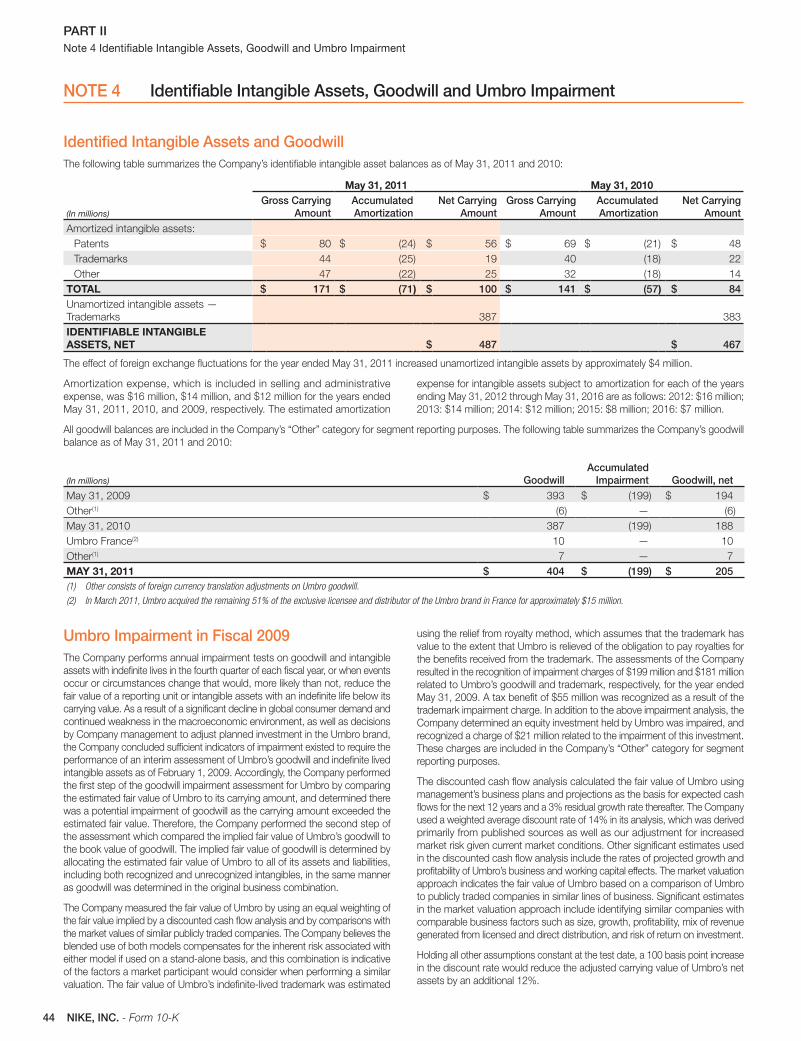
44 NIKE, INC. - Form 10-K
PART II Note 4 Identifi able Intangible Assets, Goodwill and Umbro Impairment
NOTE 4 Identifi able Intangible Assets, Goodwill and Umbro Impairment
Identifi ed Intangible Assets and GoodwillThe following table summarizes the Company’s identifi able intangible asset balances as of May 31, 2011 and 2010:
(In millions)
May 31, 2011 May 31, 2010Gross Carrying
AmountAccumulated Amortization
Net Carrying Amount
Gross Carrying Amount
Accumulated Amortization
Net Carrying Amount
Amortized intangible assets:
Patents $ 80 $ (24) $ 56 $ 69 $ (21) $ 48
Trademarks 44 (25) 19 40 (18) 22
Other 47 (22) 25 32 (18) 14
TOTAL $ 171 $ (71) $ 100 $ 141 $ (57) $ 84Unamortized intangible assets —
Trademarks 387 383
IDENTIFIABLE INTANGIBLE ASSETS, NET $ 487 $ 467
The effect of foreign exchange fl uctuations for the year ended May 31, 2011 increased unamortized intangible assets by approximately $4 million.
Amortization expense, which is included in selling and administrative
expense, was $16 million, $14 million, and $12 million for the years ended
May 31, 2011, 2010, and 2009, respectively. The estimated amortization
expense for intangible assets subject to amortization for each of the years
ending May 31, 2012 through May 31, 2016 are as follows: 2012: $16 million;
2013: $14 million; 2014: $12 million; 2015: $8 million; 2016: $7 million.
All goodwill balances are included in the Company’s “Other” category for segment reporting purposes. The following table summarizes the Company’s goodwill
balance as of May 31, 2011 and 2010:
(In millions) GoodwillAccumulated
Impairment Goodwill, netMay 31, 2009 $ 393 $ (199) $ 194
Other(1) (6) — (6)
May 31, 2010 387 (199) 188
Umbro France(2) 10 — 10
Other(1) 7 — 7
MAY 31, 2011 $ 404 $ (199) $ 205(1) Other consists of foreign currency translation adjustments on Umbro goodwill.
(2) In March 2011, Umbro acquired the remaining 51% of the exclusive licensee and distributor of the Umbro brand in France for approximately $15 million.
Umbro Impairment in Fiscal 2009The Company performs annual impairment tests on goodwill and intangible
assets with indefi nite lives in the fourth quarter of each fi scal year, or when events
occur or circumstances change that would, more likely than not, reduce the
fair value of a reporting unit or intangible assets with an indefi nite life below its
carrying value. As a result of a signifi cant decline in global consumer demand and
continued weakness in the macroeconomic environment, as well as decisions
by Company management to adjust planned investment in the Umbro brand,
the Company concluded suffi cient indicators of impairment existed to require the
performance of an interim assessment of Umbro’s goodwill and indefi nite lived
intangible assets as of February 1, 2009. Accordingly, the Company performed
the fi rst step of the goodwill impairment assessment for Umbro by comparing
the estimated fair value of Umbro to its carrying amount, and determined there
was a potential impairment of goodwill as the carrying amount exceeded the
estimated fair value. Therefore, the Company performed the second step of
the assessment which compared the implied fair value of Umbro’s goodwill to
the book value of goodwill. The implied fair value of goodwill is determined by
allocating the estimated fair value of Umbro to all of its assets and liabilities,
including both recognized and unrecognized intangibles, in the same manner
as goodwill was determined in the original business combination.
The Company measured the fair value of Umbro by using an equal weighting of
the fair value implied by a discounted cash fl ow analysis and by comparisons with
the market values of similar publicly traded companies. The Company believes the
blended use of both models compensates for the inherent risk associated with
either model if used on a stand-alone basis, and this combination is indicative
of the factors a market participant would consider when performing a similar
valuation. The fair value of Umbro’s indefi nite-lived trademark was estimated
using the relief from royalty method, which assumes that the trademark has
value to the extent that Umbro is relieved of the obligation to pay royalties for
the benefi ts received from the trademark. The assessments of the Company
resulted in the recognition of impairment charges of $199 million and $181 million
related to Umbro’s goodwill and trademark, respectively, for the year ended
May 31, 2009. A tax benefi t of $55 million was recognized as a result of the
trademark impairment charge. In addition to the above impairment analysis, the
Company determined an equity investment held by Umbro was impaired, and
recognized a charge of $21 million related to the impairment of this investment.
These charges are included in the Company’s “Other” category for segment
reporting purposes.
The discounted cash fl ow analysis calculated the fair value of Umbro using
management’s business plans and projections as the basis for expected cash
fl ows for the next 12 years and a 3% residual growth rate thereafter. The Company
used a weighted average discount rate of 14% in its analysis, which was derived
primarily from published sources as well as our adjustment for increased
market risk given current market conditions. Other signifi cant estimates used
in the discounted cash fl ow analysis include the rates of projected growth and
profi tability of Umbro’s business and working capital effects. The market valuation
approach indicates the fair value of Umbro based on a comparison of Umbro
to publicly traded companies in similar lines of business. Signifi cant estimates
in the market valuation approach include identifying similar companies with
comparable business factors such as size, growth, profi tability, mix of revenue
generated from licensed and direct distribution, and risk of return on investment.
Holding all other assumptions constant at the test date, a 100 basis point increase
in the discount rate would reduce the adjusted carrying value of Umbro’s net
assets by an additional 12%.
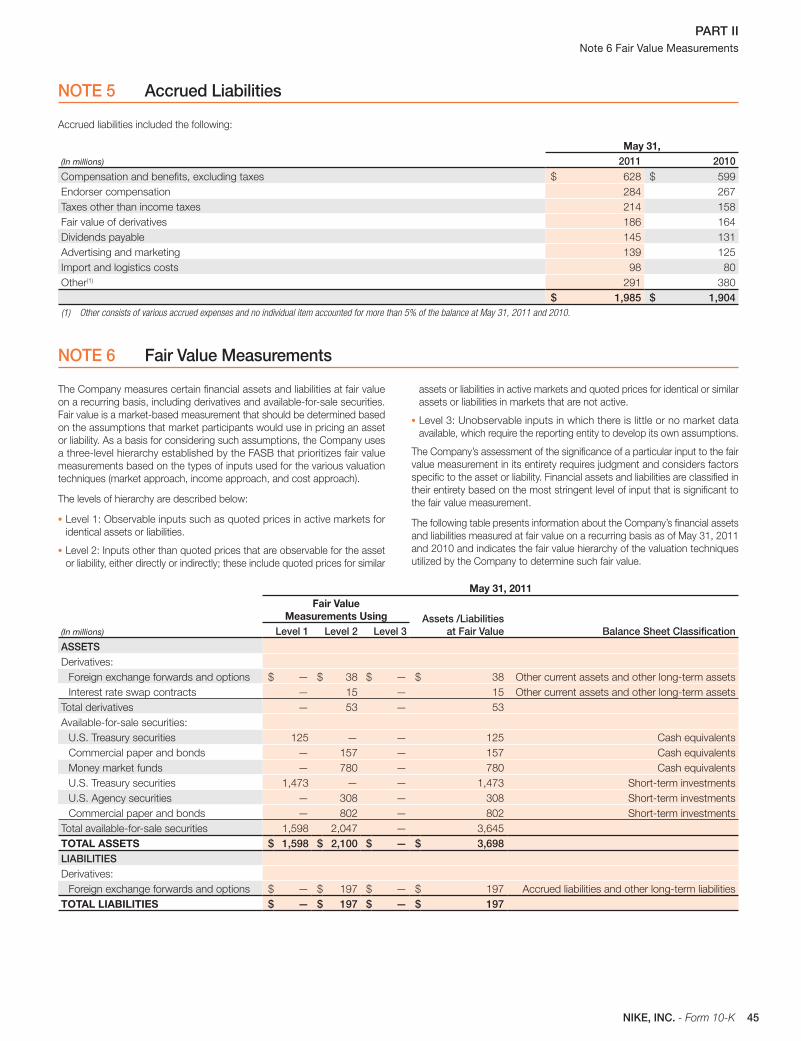
45NIKE, INC. - Form 10-K
PART II Note 6 Fair Value Measurements
NOTE 5 Accrued Liabilities
Accrued liabilities included the following:
(In millions)
May 31,2011 2010
Compensation and benefi ts, excluding taxes $ 628 $ 599
Endorser compensation 284 267
Taxes other than income taxes 214 158
Fair value of derivatives 186 164
Dividends payable 145 131
Advertising and marketing 139 125
Import and logistics costs 98 80
Other(1) 291 380
$ 1,985 $ 1,904(1) Other consists of various accrued expenses and no individual item accounted for more than 5% of the balance at May 31, 2011 and 2010.
NOTE 6 Fair Value Measurements
The Company measures certain fi nancial assets and liabilities at fair value
on a recurring basis, including derivatives and available-for-sale securities.
Fair value is a market-based measurement that should be determined based
on the assumptions that market participants would use in pricing an asset
or liability. As a basis for considering such assumptions, the Company uses
a three-level hierarchy established by the FASB that prioritizes fair value
measurements based on the types of inputs used for the various valuation
techniques (market approach, income approach, and cost approach).
The levels of hierarchy are described below:
• Level 1: Observable inputs such as quoted prices in active markets for
identical assets or liabilities.
• Level 2: Inputs other than quoted prices that are observable for the asset
or liability, either directly or indirectly; these include quoted prices for similar
assets or liabilities in active markets and quoted prices for identical or similar
assets or liabilities in markets that are not active.
• Level 3: Unobservable inputs in which there is little or no market data
available, which require the reporting entity to develop its own assumptions.
The Company’s assessment of the signifi cance of a particular input to the fair
value measurement in its entirety requires judgment and considers factors
specifi c to the asset or liability. Financial assets and liabilities are classifi ed in
their entirety based on the most stringent level of input that is signifi cant to
the fair value measurement.
The following table presents information about the Company’s fi nancial assets
and liabilities measured at fair value on a recurring basis as of May 31, 2011
and 2010 and indicates the fair value hierarchy of the valuation techniques
utilized by the Company to determine such fair value.
(In millions)
May 31, 2011Fair Value
Measurements Using Assets /Liabilitiesat Fair Value Balance Sheet Classifi cationLevel 1 Level 2 Level 3
ASSETS
Derivatives:
Foreign exchange forwards and options $ — $ 38 $ — $ 38 Other current assets and other long-term assets
Interest rate swap contracts — 15 — 15 Other current assets and other long-term assets
Total derivatives — 53 — 53
Available-for-sale securities:
U.S. Treasury securities 125 — — 125 Cash equivalents
Commercial paper and bonds — 157 — 157 Cash equivalents
Money market funds — 780 — 780 Cash equivalents
U.S. Treasury securities 1,473 — — 1,473 Short-term investments
U.S. Agency securities — 308 — 308 Short-term investments
Commercial paper and bonds — 802 — 802 Short-term investments
Total available-for-sale securities 1,598 2,047 — 3,645
TOTAL ASSETS $ 1,598 $ 2,100 $ — $ 3,698LIABILITIES
Derivatives:
Foreign exchange forwards and options $ — $ 197 $ — $ 197 Accrued liabilities and other long-term liabilities
TOTAL LIABILITIES $ — $ 197 $ — $ 197
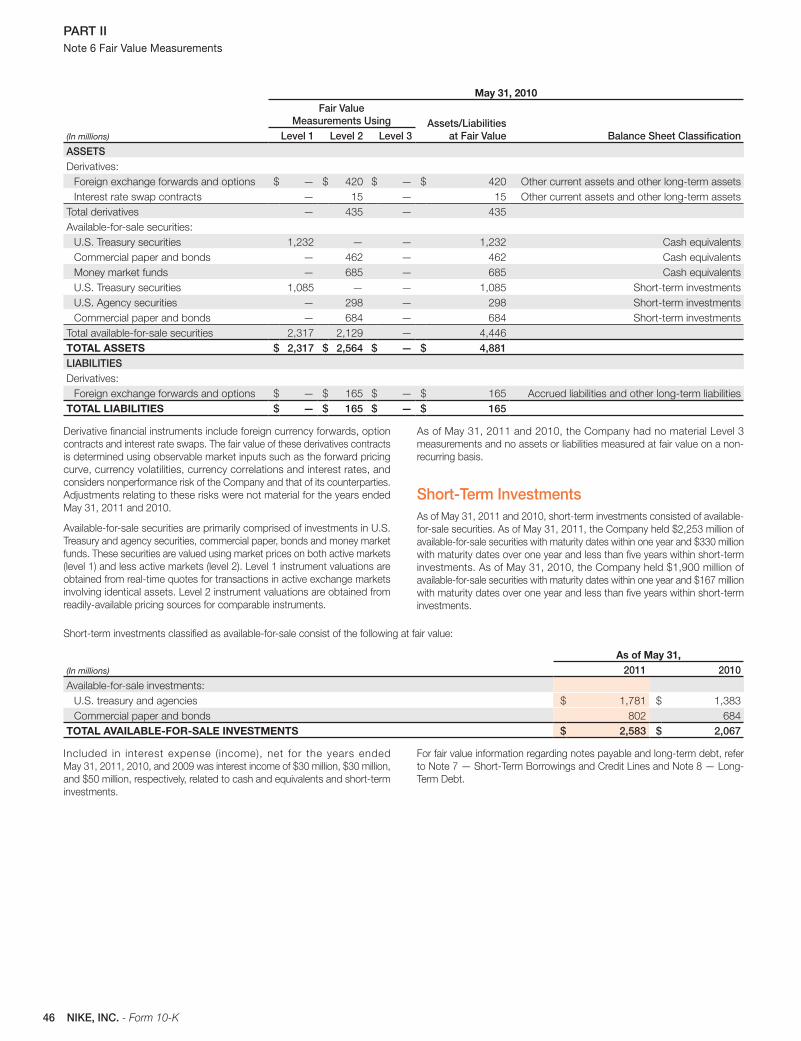
46 NIKE, INC. - Form 10-K
PART II Note 6 Fair Value Measurements
(In millions)
May 31, 2010Fair Value
Measurements Using Assets/Liabilities at Fair Value Balance Sheet Classifi cationLevel 1 Level 2 Level 3
ASSETS
Derivatives:
Foreign exchange forwards and options $ — $ 420 $ — $ 420 Other current assets and other long-term assets
Interest rate swap contracts — 15 — 15 Other current assets and other long-term assets
Total derivatives — 435 — 435
Available-for-sale securities:
U.S. Treasury securities 1,232 — — 1,232 Cash equivalents
Commercial paper and bonds — 462 — 462 Cash equivalents
Money market funds — 685 — 685 Cash equivalents
U.S. Treasury securities 1,085 — — 1,085 Short-term investments
U.S. Agency securities — 298 — 298 Short-term investments
Commercial paper and bonds — 684 — 684 Short-term investments
Total available-for-sale securities 2,317 2,129 — 4,446
TOTAL ASSETS $ 2,317 $ 2,564 $ — $ 4,881LIABILITIES
Derivatives:
Foreign exchange forwards and options $ — $ 165 $ — $ 165 Accrued liabilities and other long-term liabilities
TOTAL LIABILITIES $ — $ 165 $ — $ 165
Derivative fi nancial instruments include foreign currency forwards, option
contracts and interest rate swaps. The fair value of these derivatives contracts
is determined using observable market inputs such as the forward pricing
curve, currency volatilities, currency correlations and interest rates, and
considers nonperformance risk of the Company and that of its counterparties.
Adjustments relating to these risks were not material for the years ended
May 31, 2011 and 2010.
Available-for-sale securities are primarily comprised of investments in U.S.
Treasury and agency securities, commercial paper, bonds and money market
funds. These securities are valued using market prices on both active markets
(level 1) and less active markets (level 2). Level 1 instrument valuations are
obtained from real-time quotes for transactions in active exchange markets
involving identical assets. Level 2 instrument valuations are obtained from
readily-available pricing sources for comparable instruments.
As of May 31, 2011 and 2010, the Company had no material Level 3
measurements and no assets or liabilities measured at fair value on a non-
recurring basis.
Short-Term InvestmentsAs of May 31, 2011 and 2010, short-term investments consisted of available-
for-sale securities. As of May 31, 2011, the Company held $2,253 million of
available-for-sale securities with maturity dates within one year and $330 million
with maturity dates over one year and less than fi ve years within short-term
investments. As of May 31, 2010, the Company held $1,900 million of
available-for-sale securities with maturity dates within one year and $167 million
with maturity dates over one year and less than fi ve years within short-term
investments.
Short-term investments classifi ed as available-for-sale consist of the following at fair value:
(In millions)
As of May 31,2011 2010
Available-for-sale investments:
U.S. treasury and agencies $ 1,781 $ 1,383
Commercial paper and bonds 802 684
TOTAL AVAILABLE-FOR-SALE INVESTMENTS $ 2,583 $ 2,067
Included in interest expense (income), net for the years ended
May 31, 2011, 2010, and 2009 was interest income of $30 million, $30 million,
and $50 million, respectively, related to cash and equivalents and short-term
investments.
For fair value information regarding notes payable and long-term debt, refer
to Note 7 — Short-Term Borrowings and Credit Lines and Note 8 — Long-
Term Debt.
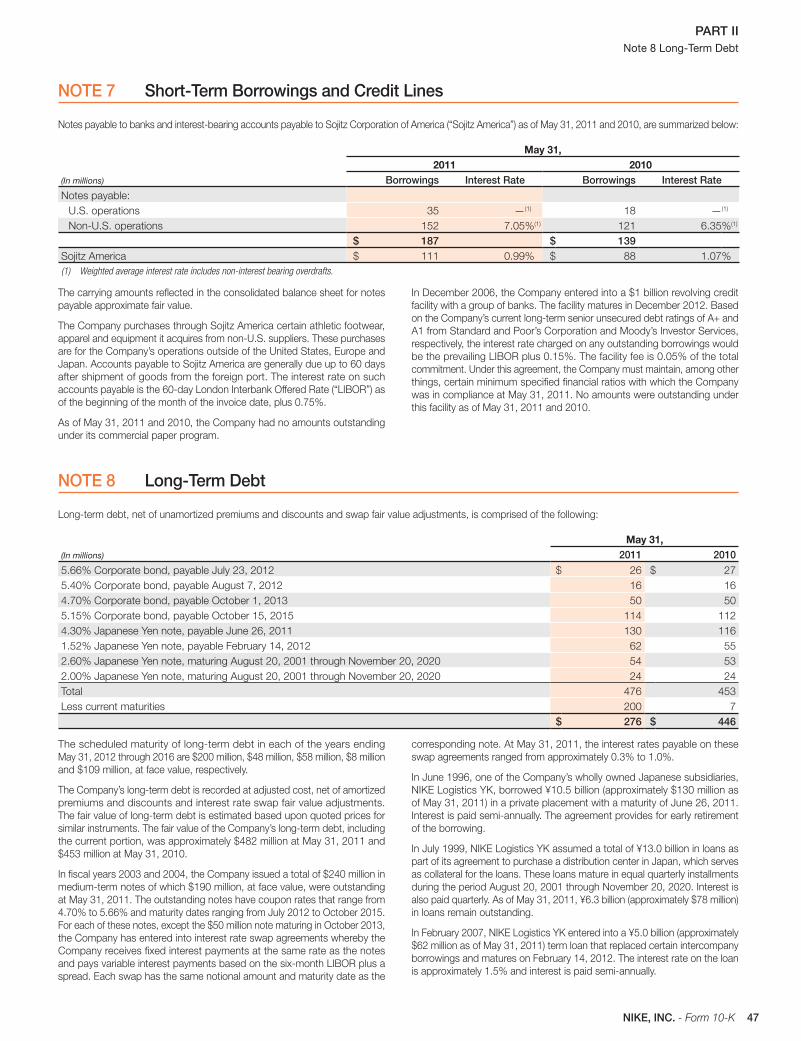
47NIKE, INC. - Form 10-K
PART II Note 8 Long-Term Debt
NOTE 7 Short-Term Borrowings and Credit Lines
Notes payable to banks and interest-bearing accounts payable to Sojitz Corporation of America (“Sojitz America”) as of May 31, 2011 and 2010, are summarized below:
(In millions)
May 31,2011 2010
Borrowings Interest Rate Borrowings Interest RateNotes payable:
U.S. operations 35 —(1) 18 —(1)
Non-U.S. operations 152 7.05%(1) 121 6.35%(1)
$ 187 $ 139Sojitz America $ 111 0.99% $ 88 1.07%
(1) Weighted average interest rate includes non-interest bearing overdrafts.
The carrying amounts refl ected in the consolidated balance sheet for notes
payable approximate fair value.
The Company purchases through Sojitz America certain athletic footwear,
apparel and equipment it acquires from non-U.S. suppliers. These purchases
are for the Company’s operations outside of the United States, Europe and
Japan. Accounts payable to Sojitz America are generally due up to 60 days
after shipment of goods from the foreign port. The interest rate on such
accounts payable is the 60-day London Interbank Offered Rate (“LIBOR”) as
of the beginning of the month of the invoice date, plus 0.75%.
As of May 31, 2011 and 2010, the Company had no amounts outstanding
under its commercial paper program.
In December 2006, the Company entered into a $1 billion revolving credit
facility with a group of banks. The facility matures in December 2012. Based
on the Company’s current long-term senior unsecured debt ratings of A+ and
A1 from Standard and Poor’s Corporation and Moody’s Investor Services,
respectively, the interest rate charged on any outstanding borrowings would
be the prevailing LIBOR plus 0.15%. The facility fee is 0.05% of the total
commitment. Under this agreement, the Company must maintain, among other
things, certain minimum specifi ed fi nancial ratios with which the Company
was in compliance at May 31, 2011. No amounts were outstanding under
this facility as of May 31, 2011 and 2010.
NOTE 8 Long-Term Debt
Long-term debt, net of unamortized premiums and discounts and swap fair value adjustments, is comprised of the following:
(In millions)
May 31,2011 2010
5.66% Corporate bond, payable July 23, 2012 $ 26 $ 27
5.40% Corporate bond, payable August 7, 2012 16 16
4.70% Corporate bond, payable October 1, 2013 50 50
5.15% Corporate bond, payable October 15, 2015 114 112
4.30% Japanese Yen note, payable June 26, 2011 130 116
1.52% Japanese Yen note, payable February 14, 2012 62 55
2.60% Japanese Yen note, maturing August 20, 2001 through November 20, 2020 54 53
2.00% Japanese Yen note, maturing August 20, 2001 through November 20, 2020 24 24
Total 476 453
Less current maturities 200 7
$ 276 $ 446
The scheduled maturity of long-term debt in each of the years ending
May 31, 2012 through 2016 are $200 million, $48 million, $58 million, $8 million
and $109 million, at face value, respectively.
The Company’s long-term debt is recorded at adjusted cost, net of amortized
premiums and discounts and interest rate swap fair value adjustments.
The fair value of long-term debt is estimated based upon quoted prices for
similar instruments. The fair value of the Company’s long-term debt, including
the current portion, was approximately $482 million at May 31, 2011 and
$453 million at May 31, 2010.
In fi scal years 2003 and 2004, the Company issued a total of $240 million in
medium-term notes of which $190 million, at face value, were outstanding
at May 31, 2011. The outstanding notes have coupon rates that range from
4.70% to 5.66% and maturity dates ranging from July 2012 to October 2015.
For each of these notes, except the $50 million note maturing in October 2013,
the Company has entered into interest rate swap agreements whereby the
Company receives fi xed interest payments at the same rate as the notes
and pays variable interest payments based on the six-month LIBOR plus a
spread. Each swap has the same notional amount and maturity date as the
corresponding note. At May 31, 2011, the interest rates payable on these
swap agreements ranged from approximately 0.3% to 1.0%.
In June 1996, one of the Company’s wholly owned Japanese subsidiaries,
NIKE Logistics YK, borrowed ¥10.5 billion (approximately $130 million as
of May 31, 2011) in a private placement with a maturity of June 26, 2011.
Interest is paid semi-annually. The agreement provides for early retirement
of the borrowing.
In July 1999, NIKE Logistics YK assumed a total of ¥13.0 billion in loans as
part of its agreement to purchase a distribution center in Japan, which serves
as collateral for the loans. These loans mature in equal quarterly installments
during the period August 20, 2001 through November 20, 2020. Interest is
also paid quarterly. As of May 31, 2011, ¥6.3 billion (approximately $78 million)
in loans remain outstanding.
In February 2007, NIKE Logistics YK entered into a ¥5.0 billion (approximately
$62 million as of May 31, 2011) term loan that replaced certain intercompany
borrowings and matures on February 14, 2012. The interest rate on the loan
is approximately 1.5% and interest is paid semi-annually.
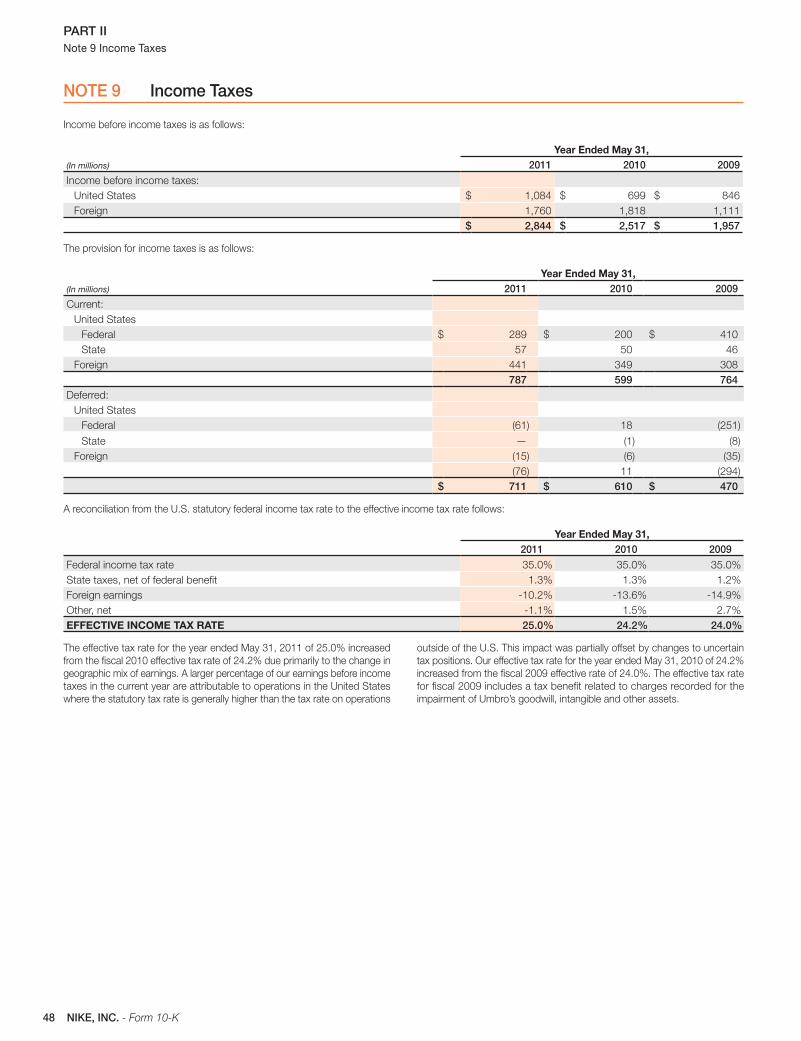
48 NIKE, INC. - Form 10-K
PART II Note 9 Income Taxes
NOTE 9 Income Taxes
Income before income taxes is as follows:
(In millions)
Year Ended May 31,2011 2010 2009
Income before income taxes:
United States $ 1,084 $ 699 $ 846
Foreign 1,760 1,818 1,111
$ 2,844 $ 2,517 $ 1,957
The provision for income taxes is as follows:
(In millions)
Year Ended May 31,2011 2010 2009
Current:
United States
Federal $ 289 $ 200 $ 410
State 57 50 46
Foreign 441 349 308
787 599 764 Deferred:
United States
Federal (61) 18 (251)
State — (1) (8)
Foreign (15) (6) (35)
(76) 11 (294)
$ 711 $ 610 $ 470
A reconciliation from the U.S. statutory federal income tax rate to the effective income tax rate follows:
Year Ended May 31,2011 2010 2009
Federal income tax rate 35.0% 35.0% 35.0%
State taxes, net of federal benefi t 1.3% 1.3% 1.2%
Foreign earnings -10.2% -13.6% -14.9%
Other, net -1.1% 1.5% 2.7%
EFFECTIVE INCOME TAX RATE 25.0% 24.2% 24.0%
The effective tax rate for the year ended May 31, 2011 of 25.0% increased
from the fi scal 2010 effective tax rate of 24.2% due primarily to the change in
geographic mix of earnings. A larger percentage of our earnings before income
taxes in the current year are attributable to operations in the United States
where the statutory tax rate is generally higher than the tax rate on operations
outside of the U.S. This impact was partially offset by changes to uncertain
tax positions. Our effective tax rate for the year ended May 31, 2010 of 24.2%
increased from the fi scal 2009 effective rate of 24.0%. The effective tax rate
for fi scal 2009 includes a tax benefi t related to charges recorded for the
impairment of Umbro’s goodwill, intangible and other assets.
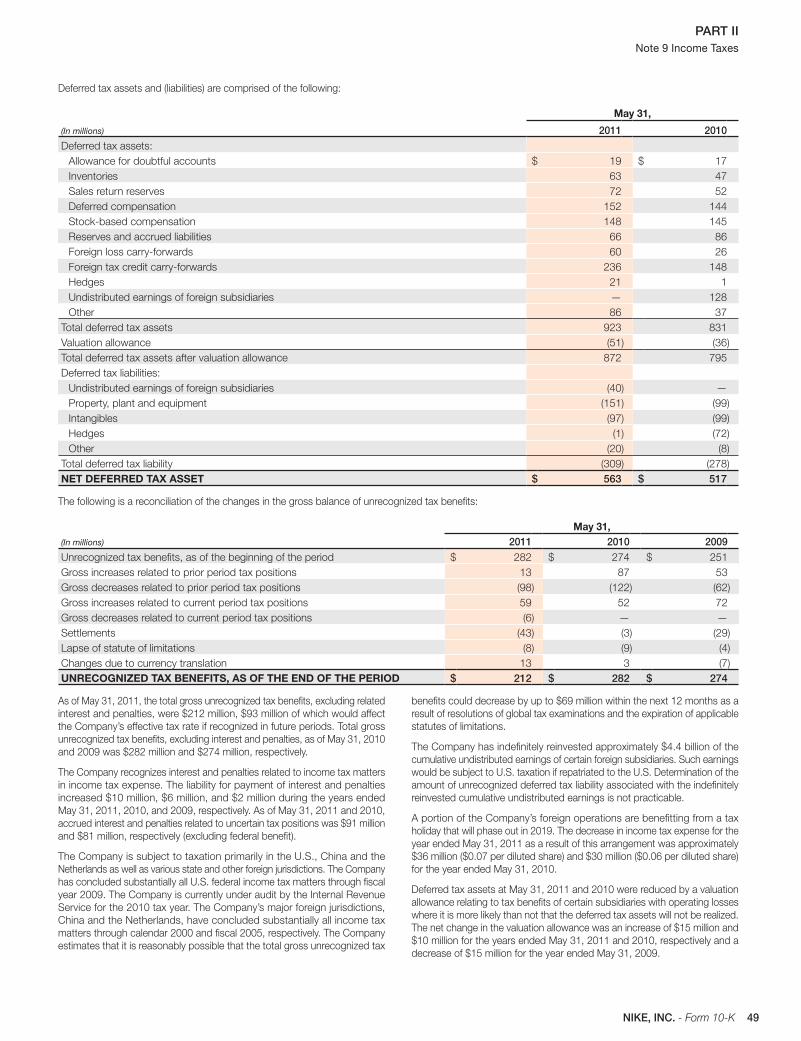
49NIKE, INC. - Form 10-K
PART II Note 9 Income Taxes
Deferred tax assets and (liabilities) are comprised of the following:
(In millions)
May 31,
2011 2010Deferred tax assets:
Allowance for doubtful accounts $ 19 $ 17
Inventories 63 47
Sales return reserves 72 52
Deferred compensation 152 144
Stock-based compensation 148 145
Reserves and accrued liabilities 66 86
Foreign loss carry-forwards 60 26
Foreign tax credit carry-forwards 236 148
Hedges 21 1
Undistributed earnings of foreign subsidiaries — 128
Other 86 37
Total deferred tax assets 923 831
Valuation allowance (51) (36)
Total deferred tax assets after valuation allowance 872 795
Deferred tax liabilities:
Undistributed earnings of foreign subsidiaries (40) —
Property, plant and equipment (151) (99)
Intangibles (97) (99)
Hedges (1) (72)
Other (20) (8)
Total deferred tax liability (309) (278)
NET DEFERRED TAX ASSET $ 563 $ 517
The following is a reconciliation of the changes in the gross balance of unrecognized tax benefi ts:
(In millions)
May 31,2011 2010 2009
Unrecognized tax benefi ts, as of the beginning of the period $ 282 $ 274 $ 251
Gross increases related to prior period tax positions 13 87 53
Gross decreases related to prior period tax positions (98) (122) (62)
Gross increases related to current period tax positions 59 52 72
Gross decreases related to current period tax positions (6) — —
Settlements (43) (3) (29)
Lapse of statute of limitations (8) (9) (4)
Changes due to currency translation 13 3 (7)
UNRECOGNIZED TAX BENEFITS, AS OF THE END OF THE PERIOD $ 212 $ 282 $ 274
As of May 31, 2011, the total gross unrecognized tax benefi ts, excluding related
interest and penalties, were $212 million, $93 million of which would affect
the Company’s effective tax rate if recognized in future periods. Total gross
unrecognized tax benefi ts, excluding interest and penalties, as of May 31, 2010
and 2009 was $282 million and $274 million, respectively.
The Company recognizes interest and penalties related to income tax matters
in income tax expense. The liability for payment of interest and penalties
increased $10 million, $6 million, and $2 million during the years ended
May 31, 2011, 2010, and 2009, respectively. As of May 31, 2011 and 2010,
accrued interest and penalties related to uncertain tax positions was $91 million
and $81 million, respectively (excluding federal benefi t).
The Company is subject to taxation primarily in the U.S., China and the
Netherlands as well as various state and other foreign jurisdictions. The Company
has concluded substantially all U.S. federal income tax matters through fi scal
year 2009. The Company is currently under audit by the Internal Revenue
Service for the 2010 tax year. The Company’s major foreign jurisdictions,
China and the Netherlands, have concluded substantially all income tax
matters through calendar 2000 and fi scal 2005, respectively. The Company
estimates that it is reasonably possible that the total gross unrecognized tax
benefi ts could decrease by up to $69 million within the next 12 months as a
result of resolutions of global tax examinations and the expiration of applicable
statutes of limitations.
The Company has indefi nitely reinvested approximately $4.4 billion of the
cumulative undistributed earnings of certain foreign subsidiaries. Such earnings
would be subject to U.S. taxation if repatriated to the U.S. Determination of the
amount of unrecognized deferred tax liability associated with the indefi nitely
reinvested cumulative undistributed earnings is not practicable.
A portion of the Company’s foreign operations are benefi tting from a tax
holiday that will phase out in 2019. The decrease in income tax expense for the
year ended May 31, 2011 as a result of this arrangement was approximately
$36 million ($0.07 per diluted share) and $30 million ($0.06 per diluted share)
for the year ended May 31, 2010.
Deferred tax assets at May 31, 2011 and 2010 were reduced by a valuation
allowance relating to tax benefi ts of certain subsidiaries with operating losses
where it is more likely than not that the deferred tax assets will not be realized.
The net change in the valuation allowance was an increase of $15 million and
$10 million for the years ended May 31, 2011 and 2010, respectively and a
decrease of $15 million for the year ended May 31, 2009.
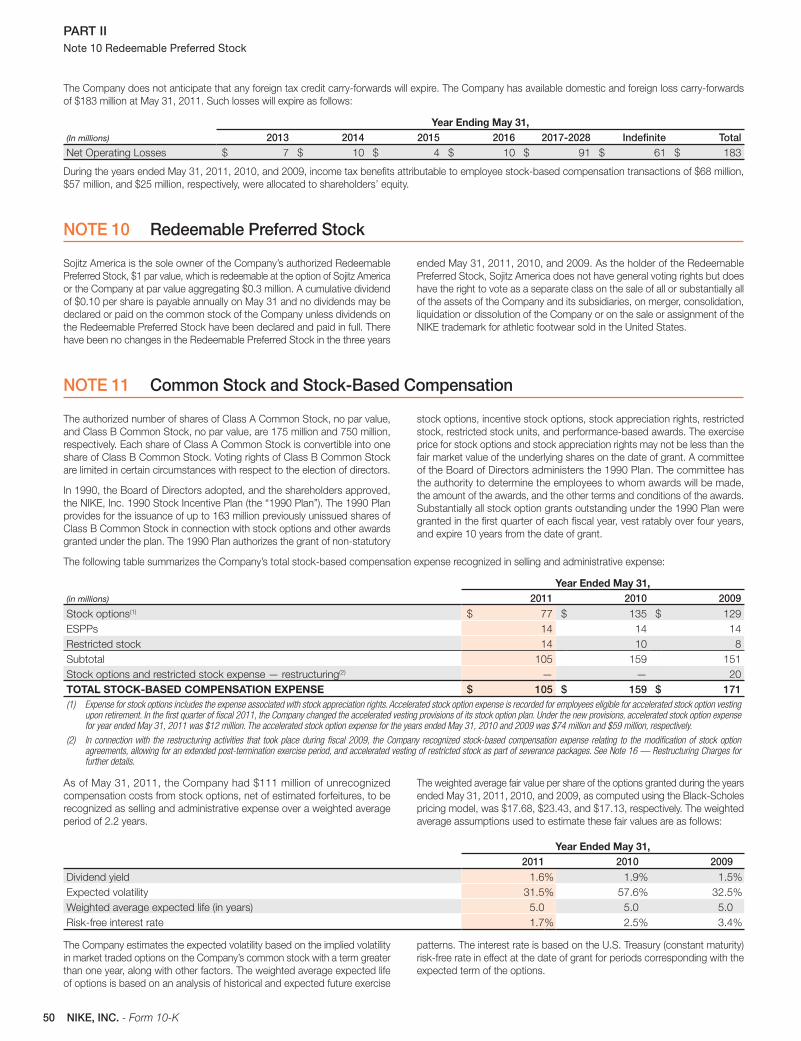
50 NIKE, INC. - Form 10-K
PART II Note 10 Redeemable Preferred Stock
The Company does not anticipate that any foreign tax credit carry-forwards will expire. The Company has available domestic and foreign loss carry-forwards
of $183 million at May 31, 2011. Such losses will expire as follows:
(In millions)
Year Ending May 31,2013 2014 2015 2016 2017-2028 Indefi nite Total
Net Operating Losses $ 7 $ 10 $ 4 $ 10 $ 91 $ 61 $ 183
During the years ended May 31, 2011, 2010, and 2009, income tax benefi ts attributable to employee stock-based compensation transactions of $68 million,
$57 million, and $25 million, respectively, were allocated to shareholders’ equity.
NOTE 10 Redeemable Preferred Stock
Sojitz America is the sole owner of the Company’s authorized Redeemable
Preferred Stock, $1 par value, which is redeemable at the option of Sojitz America
or the Company at par value aggregating $0.3 million. A cumulative dividend
of $0.10 per share is payable annually on May 31 and no dividends may be
declared or paid on the common stock of the Company unless dividends on
the Redeemable Preferred Stock have been declared and paid in full. There
have been no changes in the Redeemable Preferred Stock in the three years
ended May 31, 2011, 2010, and 2009. As the holder of the Redeemable
Preferred Stock, Sojitz America does not have general voting rights but does
have the right to vote as a separate class on the sale of all or substantially all
of the assets of the Company and its subsidiaries, on merger, consolidation,
liquidation or dissolution of the Company or on the sale or assignment of the
NIKE trademark for athletic footwear sold in the United States.
NOTE 11 Common Stock and Stock-Based Compensation
The authorized number of shares of Class A Common Stock, no par value,
and Class B Common Stock, no par value, are 175 million and 750 million,
respectively. Each share of Class A Common Stock is convertible into one
share of Class B Common Stock. Voting rights of Class B Common Stock
are limited in certain circumstances with respect to the election of directors.
In 1990, the Board of Directors adopted, and the shareholders approved,
the NIKE, Inc. 1990 Stock Incentive Plan (the “1990 Plan”). The 1990 Plan
provides for the issuance of up to 163 million previously unissued shares of
Class B Common Stock in connection with stock options and other awards
granted under the plan. The 1990 Plan authorizes the grant of non-statutory
stock options, incentive stock options, stock appreciation rights, restricted
stock, restricted stock units, and performance-based awards. The exercise
price for stock options and stock appreciation rights may not be less than the
fair market value of the underlying shares on the date of grant. A committee
of the Board of Directors administers the 1990 Plan. The committee has
the authority to determine the employees to whom awards will be made,
the amount of the awards, and the other terms and conditions of the awards.
Substantially all stock option grants outstanding under the 1990 Plan were
granted in the fi rst quarter of each fi scal year, vest ratably over four years,
and expire 10 years from the date of grant.
The following table summarizes the Company’s total stock-based compensation expense recognized in selling and administrative expense:
(in millions)
Year Ended May 31,2011 2010 2009
Stock options(1) $ 77 $ 135 $ 129
ESPPs 14 14 14
Restricted stock 14 10 8
Subtotal 105 159 151
Stock options and restricted stock expense — restructuring(2) — — 20
TOTAL STOCK-BASED COMPENSATION EXPENSE $ 105 $ 159 $ 171(1) Expense for stock options includes the expense associated with stock appreciation rights. Accelerated stock option expense is recorded for employees eligible for accelerated stock option vesting
upon retirement. In the first quarter of fiscal 2011, the Company changed the accelerated vesting provisions of its stock option plan. Under the new provisions, accelerated stock option expense for year ended May 31, 2011 was $12 million. The accelerated stock option expense for the years ended May 31, 2010 and 2009 was $74 million and $59 million, respectively.
(2) In connection with the restructuring activities that took place during fiscal 2009, the Company recognized stock-based compensation expense relating to the modification of stock option agreements, allowing for an extended post-termination exercise period, and accelerated vesting of restricted stock as part of severance packages. See Note 16 — Restructuring Charges for further details.
As of May 31, 2011, the Company had $111 million of unrecognized
compensation costs from stock options, net of estimated forfeitures, to be
recognized as selling and administrative expense over a weighted average
period of 2.2 years.
The weighted average fair value per share of the options granted during the years
ended May 31, 2011, 2010, and 2009, as computed using the Black-Scholes
pricing model, was $17.68, $23.43, and $17.13, respectively. The weighted
average assumptions used to estimate these fair values are as follows:
Year Ended May 31,2011 2010 2009
Dividend yield 1.6% 1.9% 1.5%
Expected volatility 31.5% 57.6% 32.5%
Weighted average expected life (in years) 5.0 5.0 5.0
Risk-free interest rate 1.7% 2.5% 3.4%
The Company estimates the expected volatility based on the implied volatility
in market traded options on the Company’s common stock with a term greater
than one year, along with other factors. The weighted average expected life
of options is based on an analysis of historical and expected future exercise
patterns. The interest rate is based on the U.S. Treasury (constant maturity)
risk-free rate in effect at the date of grant for periods corresponding with the
expected term of the options.
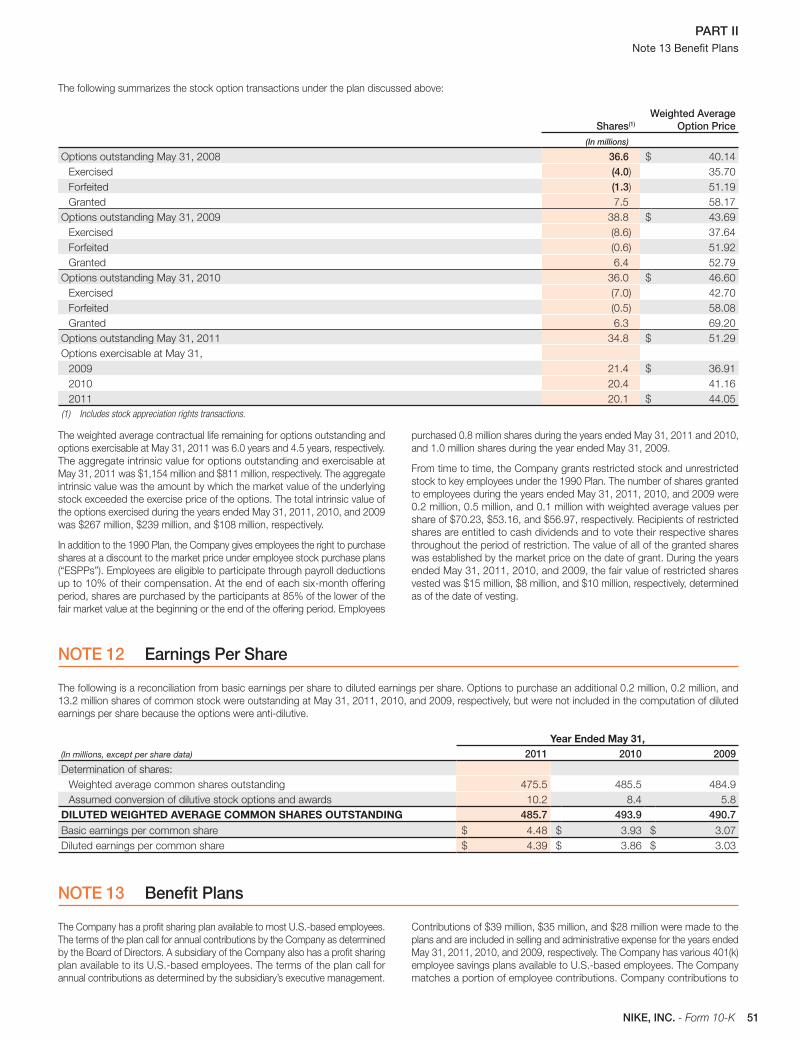
51NIKE, INC. - Form 10-K
PART II Note 13 Benefi t Plans
The following summarizes the stock option transactions under the plan discussed above:
Shares(1)
Weighted Average Option Price
(In millions)
Options outstanding May 31, 2008 36.6 $ 40.14
Exercised (4.0) 35.70
Forfeited (1.3) 51.19
Granted 7.5 58.17
Options outstanding May 31, 2009 38.8 $ 43.69
Exercised (8.6) 37.64
Forfeited (0.6) 51.92
Granted 6.4 52.79
Options outstanding May 31, 2010 36.0 $ 46.60
Exercised (7.0) 42.70
Forfeited (0.5) 58.08
Granted 6.3 69.20
Options outstanding May 31, 2011 34.8 $ 51.29
Options exercisable at May 31,
2009 21.4 $ 36.91
2010 20.4 41.16
2011 20.1 $ 44.05
(1) Includes stock appreciation rights transactions.
The weighted average contractual life remaining for options outstanding and
options exercisable at May 31, 2011 was 6.0 years and 4.5 years, respectively.
The aggregate intrinsic value for options outstanding and exercisable at
May 31, 2011 was $1,154 million and $811 million, respectively. The aggregate
intrinsic value was the amount by which the market value of the underlying
stock exceeded the exercise price of the options. The total intrinsic value of
the options exercised during the years ended May 31, 2011, 2010, and 2009
was $267 million, $239 million, and $108 million, respectively.
In addition to the 1990 Plan, the Company gives employees the right to purchase
shares at a discount to the market price under employee stock purchase plans
(“ESPPs”). Employees are eligible to participate through payroll deductions
up to 10% of their compensation. At the end of each six-month offering
period, shares are purchased by the participants at 85% of the lower of the
fair market value at the beginning or the end of the offering period. Employees
purchased 0.8 million shares during the years ended May 31, 2011 and 2010,
and 1.0 million shares during the year ended May 31, 2009.
From time to time, the Company grants restricted stock and unrestricted
stock to key employees under the 1990 Plan. The number of shares granted
to employees during the years ended May 31, 2011, 2010, and 2009 were
0.2 million, 0.5 million, and 0.1 million with weighted average values per
share of $70.23, $53.16, and $56.97, respectively. Recipients of restricted
shares are entitled to cash dividends and to vote their respective shares
throughout the period of restriction. The value of all of the granted shares
was established by the market price on the date of grant. During the years
ended May 31, 2011, 2010, and 2009, the fair value of restricted shares
vested was $15 million, $8 million, and $10 million, respectively, determined
as of the date of vesting.
NOTE 12 Earnings Per Share
The following is a reconciliation from basic earnings per share to diluted earnings per share. Options to purchase an additional 0.2 million, 0.2 million, and
13.2 million shares of common stock were outstanding at May 31, 2011, 2010, and 2009, respectively, but were not included in the computation of diluted
earnings per share because the options were anti-dilutive.
(In millions, except per share data)
Year Ended May 31,2011 2010 2009
Determination of shares:
Weighted average common shares outstanding 475.5 485.5 484.9
Assumed conversion of dilutive stock options and awards 10.2 8.4 5.8
DILUTED WEIGHTED AVERAGE COMMON SHARES OUTSTANDING 485.7 493.9 490.7
Basic earnings per common share $ 4.48 $ 3.93 $ 3.07
Diluted earnings per common share $ 4.39 $ 3.86 $ 3.03
NOTE 13 Benefi t Plans
The Company has a profi t sharing plan available to most U.S.-based employees.
The terms of the plan call for annual contributions by the Company as determined
by the Board of Directors. A subsidiary of the Company also has a profi t sharing
plan available to its U.S.-based employees. The terms of the plan call for
annual contributions as determined by the subsidiary’s executive management.
Contributions of $39 million, $35 million, and $28 million were made to the
plans and are included in selling and administrative expense for the years ended
May 31, 2011, 2010, and 2009, respectively. The Company has various 401(k)
employee savings plans available to U.S.-based employees. The Company
matches a portion of employee contributions. Company contributions to
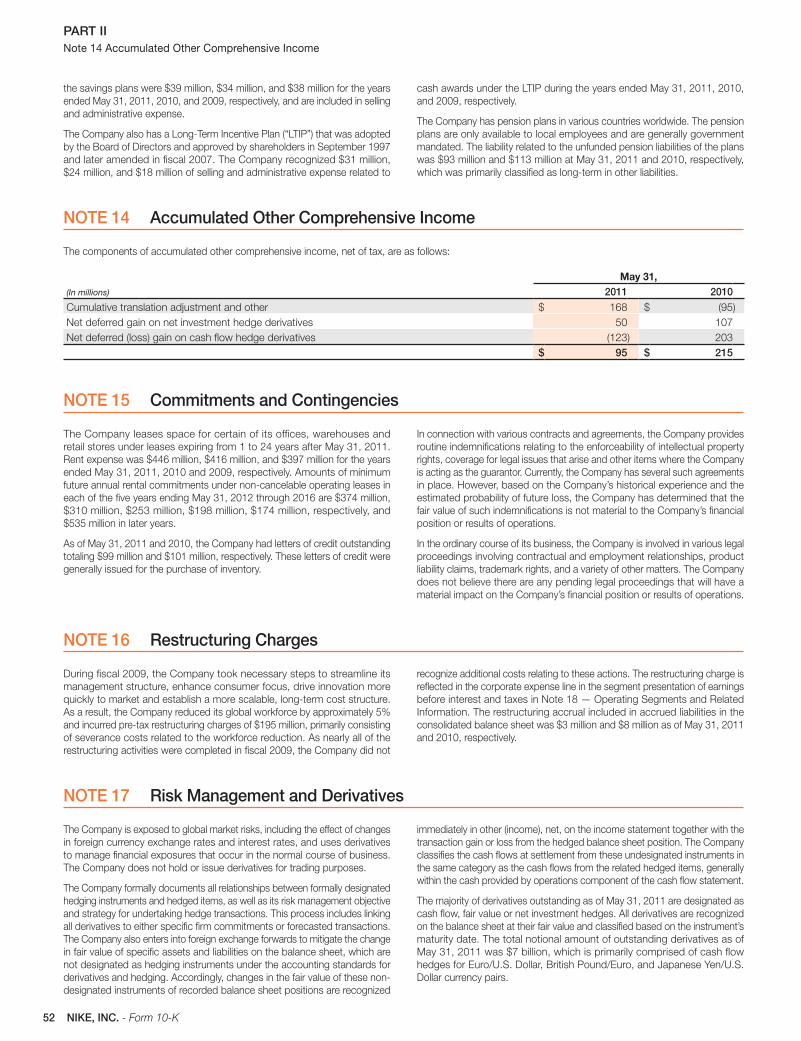
52 NIKE, INC. - Form 10-K
PART II Note 14 Accumulated Other Comprehensive Income
the savings plans were $39 million, $34 million, and $38 million for the years
ended May 31, 2011, 2010, and 2009, respectively, and are included in selling
and administrative expense.
The Company also has a Long-Term Incentive Plan (“LTIP”) that was adopted
by the Board of Directors and approved by shareholders in September 1997
and later amended in fi scal 2007. The Company recognized $31 million,
$24 million, and $18 million of selling and administrative expense related to
cash awards under the LTIP during the years ended May 31, 2011, 2010,
and 2009, respectively.
The Company has pension plans in various countries worldwide. The pension
plans are only available to local employees and are generally government
mandated. The liability related to the unfunded pension liabilities of the plans
was $93 million and $113 million at May 31, 2011 and 2010, respectively,
which was primarily classifi ed as long-term in other liabilities.
NOTE 14 Accumulated Other Comprehensive Income
The components of accumulated other comprehensive income, net of tax, are as follows:
(In millions)
May 31,2011 2010
Cumulative translation adjustment and other $ 168 $ (95)
Net deferred gain on net investment hedge derivatives 50 107
Net deferred (loss) gain on cash fl ow hedge derivatives (123) 203
$ 95 $ 215
NOTE 15 Commitments and Contingencies
The Company leases space for certain of its offi ces, warehouses and
retail stores under leases expiring from 1 to 24 years after May 31, 2011.
Rent expense was $446 million, $416 million, and $397 million for the years
ended May 31, 2011, 2010 and 2009, respectively. Amounts of minimum
future annual rental commitments under non-cancelable operating leases in
each of the fi ve years ending May 31, 2012 through 2016 are $374 million,
$310 million, $253 million, $198 million, $174 million, respectively, and
$535 million in later years.
As of May 31, 2011 and 2010, the Company had letters of credit outstanding
totaling $99 million and $101 million, respectively. These letters of credit were
generally issued for the purchase of inventory.
In connection with various contracts and agreements, the Company provides
routine indemnifi cations relating to the enforceability of intellectual property
rights, coverage for legal issues that arise and other items where the Company
is acting as the guarantor. Currently, the Company has several such agreements
in place. However, based on the Company’s historical experience and the
estimated probability of future loss, the Company has determined that the
fair value of such indemnifi cations is not material to the Company’s fi nancial
position or results of operations.
In the ordinary course of its business, the Company is involved in various legal
proceedings involving contractual and employment relationships, product
liability claims, trademark rights, and a variety of other matters. The Company
does not believe there are any pending legal proceedings that will have a
material impact on the Company’s fi nancial position or results of operations.
NOTE 16 Restructuring Charges
During fi scal 2009, the Company took necessary steps to streamline its
management structure, enhance consumer focus, drive innovation more
quickly to market and establish a more scalable, long-term cost structure.
As a result, the Company reduced its global workforce by approximately 5%
and incurred pre-tax restructuring charges of $195 million, primarily consisting
of severance costs related to the workforce reduction. As nearly all of the
restructuring activities were completed in fi scal 2009, the Company did not
recognize additional costs relating to these actions. The restructuring charge is
refl ected in the corporate expense line in the segment presentation of earnings
before interest and taxes in Note 18 — Operating Segments and Related
Information. The restructuring accrual included in accrued liabilities in the
consolidated balance sheet was $3 million and $8 million as of May 31, 2011
and 2010, respectively.
NOTE 17 Risk Management and Derivatives
The Company is exposed to global market risks, including the effect of changes
in foreign currency exchange rates and interest rates, and uses derivatives
to manage fi nancial exposures that occur in the normal course of business.
The Company does not hold or issue derivatives for trading purposes.
The Company formally documents all relationships between formally designated
hedging instruments and hedged items, as well as its risk management objective
and strategy for undertaking hedge transactions. This process includes linking
all derivatives to either specifi c fi rm commitments or forecasted transactions.
The Company also enters into foreign exchange forwards to mitigate the change
in fair value of specifi c assets and liabilities on the balance sheet, which are
not designated as hedging instruments under the accounting standards for
derivatives and hedging. Accordingly, changes in the fair value of these non-
designated instruments of recorded balance sheet positions are recognized
immediately in other (income), net, on the income statement together with the
transaction gain or loss from the hedged balance sheet position. The Company
classifi es the cash fl ows at settlement from these undesignated instruments in
the same category as the cash fl ows from the related hedged items, generally
within the cash provided by operations component of the cash fl ow statement.
The majority of derivatives outstanding as of May 31, 2011 are designated as
cash fl ow, fair value or net investment hedges. All derivatives are recognized
on the balance sheet at their fair value and classifi ed based on the instrument’s
maturity date. The total notional amount of outstanding derivatives as of
May 31, 2011 was $7 billion, which is primarily comprised of cash fl ow
hedges for Euro/U.S. Dollar, British Pound/Euro, and Japanese Yen/U.S.
Dollar currency pairs.
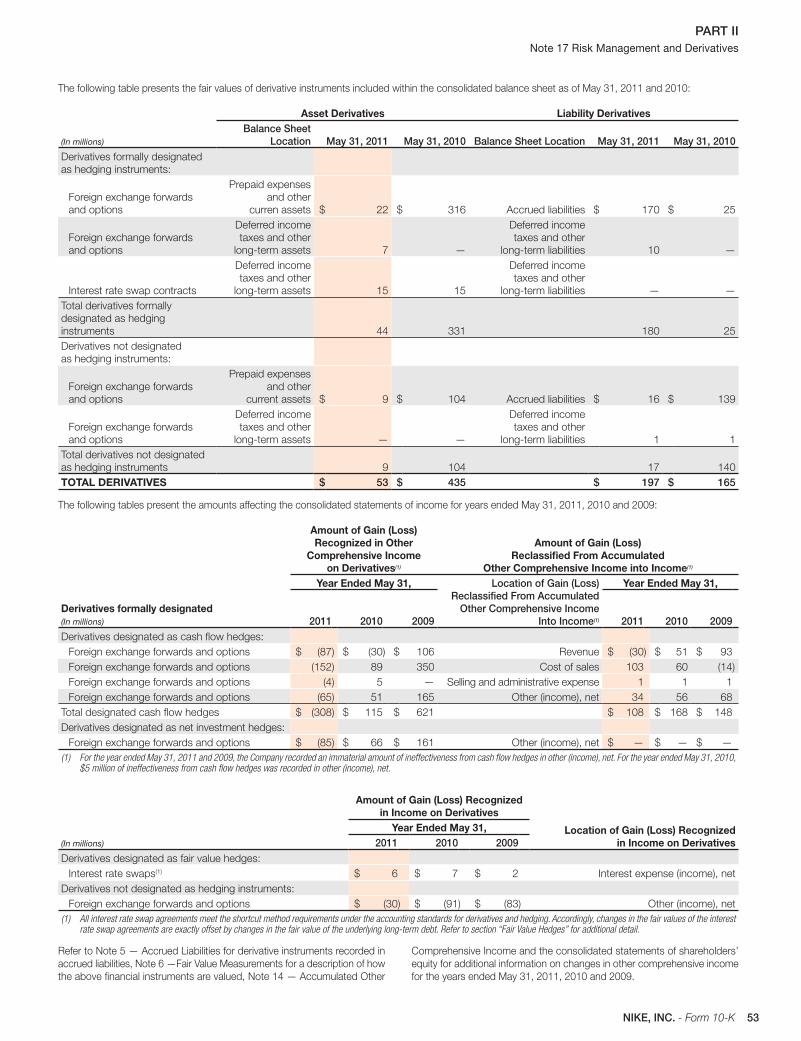
53NIKE, INC. - Form 10-K
PART II Note 17 Risk Management and Derivatives
The following table presents the fair values of derivative instruments included within the consolidated balance sheet as of May 31, 2011 and 2010:
(In millions)
Asset Derivatives Liability DerivativesBalance Sheet
Location May 31, 2011 May 31, 2010 Balance Sheet Location May 31, 2011 May 31, 2010Derivatives formally designated
as hedging instruments:
Foreign exchange forwards
and options
Prepaid expenses
and other
curren assets $ 22 $ 316 Accrued liabilities $ 170 $ 25
Foreign exchange forwards
and options
Deferred income
taxes and other
long-term assets 7 —
Deferred income
taxes and other
long-term liabilities 10 —
Interest rate swap contracts
Deferred income
taxes and other
long-term assets 15 15
Deferred income
taxes and other
long-term liabilities — —
Total derivatives formally
designated as hedging
instruments 44 331 180 25
Derivatives not designated
as hedging instruments:
Foreign exchange forwards
and options
Prepaid expenses
and other
current assets $ 9 $ 104 Accrued liabilities $ 16 $ 139
Foreign exchange forwards
and options
Deferred income
taxes and other
long-term assets — —
Deferred income
taxes and other
long-term liabilities 1 1
Total derivatives not designated
as hedging instruments 9 104 17 140
TOTAL DERIVATIVES $ 53 $ 435 $ 197 $ 165
The following tables present the amounts affecting the consolidated statements of income for years ended May 31, 2011, 2010 and 2009:
Derivatives formally designated(In millions)
Amount of Gain (Loss) Recognized in Other
Comprehensive Income on Derivatives(1)
Amount of Gain (Loss)Reclassifi ed From Accumulated
Other Comprehensive Income into Income(1)
Year Ended May 31, Location of Gain (Loss) Reclassifi ed From Accumulated
Other Comprehensive Income Into Income(1)
Year Ended May 31,
2011 2010 2009 2011 2010 2009Derivatives designated as cash fl ow hedges:
Foreign exchange forwards and options $ (87) $ (30) $ 106 Revenue $ (30) $ 51 $ 93
Foreign exchange forwards and options (152) 89 350 Cost of sales 103 60 (14)
Foreign exchange forwards and options (4) 5 — Selling and administrative expense 1 1 1
Foreign exchange forwards and options (65) 51 165 Other (income), net 34 56 68
Total designated cash fl ow hedges $ (308) $ 115 $ 621 $ 108 $ 168 $ 148
Derivatives designated as net investment hedges:
Foreign exchange forwards and options $ (85) $ 66 $ 161 Other (income), net $ — $ — $ —
(1) For the year ended May 31, 2011 and 2009, the Company recorded an immaterial amount of ineffectiveness from cash flow hedges in other (income), net. For the year ended May 31, 2010, $5 million of ineffectiveness from cash flow hedges was recorded in other (income), net.
(In millions)
Amount of Gain (Loss) Recognized in Income on Derivatives
Location of Gain (Loss) Recognized in Income on Derivatives
Year Ended May 31,2011 2010 2009
Derivatives designated as fair value hedges:
Interest rate swaps(1) $ 6 $ 7 $ 2 Interest expense (income), net
Derivatives not designated as hedging instruments:
Foreign exchange forwards and options $ (30) $ (91) $ (83) Other (income), net
(1) All interest rate swap agreements meet the shortcut method requirements under the accounting standards for derivatives and hedging. Accordingly, changes in the fair values of the interest rate swap agreements are exactly offset by changes in the fair value of the underlying long-term debt. Refer to section “Fair Value Hedges” for additional detail.
Refer to Note 5 — Accrued Liabilities for derivative instruments recorded in
accrued liabilities, Note 6 —Fair Value Measurements for a description of how
the above fi nancial instruments are valued, Note 14 — Accumulated Other
Comprehensive Income and the consolidated statements of shareholders’
equity for additional information on changes in other comprehensive income
for the years ended May 31, 2011, 2010 and 2009.
54 NIKE, INC. - Form 10-K
PART II Note 17 Risk Management and Derivatives
Cash Flow HedgesThe purpose of the Company’s foreign currency hedging activities is to
protect the Company from the risk that the eventual cash fl ows resulting
from transactions in foreign currencies, including revenues, product costs,
selling and administrative expense, investments in U.S. dollar-denominated
available-for-sale debt securities and intercompany transactions, including
intercompany borrowings, will be adversely affected by changes in exchange
rates. It is the Company’s policy to utilize derivatives to reduce foreign exchange
risks where internal netting strategies cannot be effectively employed. Hedged
transactions are denominated primarily in Euros, British Pounds and Japanese
Yen. The Company hedges up to 100% of anticipated exposures typically
12 months in advance, but has hedged as much as 34 months in advance.
All changes in fair values of outstanding cash fl ow hedge derivatives, except
the ineffective portion, are recorded in other comprehensive income until net
income is affected by the variability of cash fl ows of the hedged transaction.
In most cases, amounts recorded in other comprehensive income will be
released to net income some time after the maturity of the related derivative.
The consolidated statement of income classifi cation of effective hedge results
is the same as that of the underlying exposure. Results of hedges of revenue
and product costs are recorded in revenue and cost of sales, respectively, when
the underlying hedged transaction affects net income. Results of hedges of
selling and administrative expense are recorded together with those costs when
the related expense is recorded. Results of hedges of forecasted purchases
of U.S. dollar-denominated available-for-sale securities are recorded in other
(income), net when the securities are sold. Results of hedges of forecasted
intercompany transactions are recorded in other (income), net when the
transaction occurs. The Company classifi es the cash fl ows at settlement from
these designated cash fl ow hedge derivatives in the same category as the
cash fl ows from the related hedged items, generally within the cash provided
by operations component of the cash fl ow statement.
Premiums paid on options are initially recorded as deferred charges.
The Company assesses the effectiveness of options based on the total cash
fl ows method and records total changes in the options’ fair value to other
comprehensive income to the degree they are effective.
As of May 31, 2011, $120 million of deferred net losses (net of tax) on both
outstanding and matured derivatives accumulated in other comprehensive
income are expected to be reclassifi ed to net income during the next 12 months
as a result of underlying hedged transactions also being recorded in net
income. Actual amounts ultimately reclassifi ed to net income are dependent
on the exchange rates in effect when derivative contracts that are currently
outstanding mature. As of May 31, 2011, the maximum term over which the
Company is hedging exposures to the variability of cash fl ows for its forecasted
and recorded transactions is 15 months.
The Company formally assesses both at a hedge’s inception and on an ongoing
basis, whether the derivatives that are used in the hedging transaction have
been highly effective in offsetting changes in the cash fl ows of hedged items
and whether those derivatives may be expected to remain highly effective
in future periods. Effectiveness for cash fl ow hedges is assessed based on
forward rates. When it is determined that a derivative is not, or has ceased to
be, highly effective as a hedge, the Company discontinues hedge accounting.
The Company discontinues hedge accounting prospectively when (1) it
determines that the derivative is no longer highly effective in offsetting changes
in the cash fl ows of a hedged item (including hedged items such as fi rm
commitments or forecasted transactions); (2) the derivative expires or is
sold, terminated, or exercised; (3) it is no longer probable that the forecasted
transaction will occur; or (4) management determines that designating
the derivative as a hedging instrument is no longer appropriate.
When the Company discontinues hedge accounting because it is no longer
probable that the forecasted transaction will occur in the originally expected
period, but is expected to occur within an additional two-month period of
time thereafter, the gain or loss on the derivative remains in accumulated other
comprehensive income and is reclassifi ed to net income when the forecasted
transaction affects net income. However, if it is probable that a forecasted
transaction will not occur by the end of the originally specifi ed time period or
within an additional two-month period of time thereafter, the gains and losses
that were accumulated in other comprehensive income will be recognized
immediately in net income. In all situations in which hedge accounting is
discontinued and the derivative remains outstanding, the Company will carry
the derivative at its fair value on the balance sheet, recognizing future changes
in the fair value in other (income), net. For the year ended May 31, 2011 an
immaterial amount of ineffectiveness was recorded to other (income), net.
For the years ended May 31, 2010 and 2009, the Company recorded in other
(income), net $5 million gain and an immaterial amount of ineffectiveness from
cash fl ow hedges, respectively.
Fair Value HedgesThe Company is also exposed to the risk of changes in the fair value of certain
fi xed-rate debt attributable to changes in interest rates. Derivatives currently
used by the Company to hedge this risk are receive-fi xed, pay-variable
interest rate swaps. As of May 31, 2011, all interest rate swap agreements are
designated as fair value hedges of the related long-term debt and meet the
shortcut method requirements under the accounting standards for derivatives
and hedging. Accordingly, changes in the fair values of the interest rate swap
agreements are exactly offset by changes in the fair value of the underlying
long-term debt. The cash fl ows associated with the Company’s fair value hedges
are periodic interest payments while the swaps are outstanding, which are
refl ected in net income within the cash provided by operations component of
the cash fl ow statement. No ineffectiveness has been recorded to net income
related to interest rate swaps designated as fair value hedges for the years
ended May 31, 2011, 2010, and 2009.
In fi scal 2003, the Company entered into a receive-fl oating, pay-fi xed interest
rate swap agreement related to a Japanese Yen denominated intercompany
loan with one of the Company’s Japanese subsidiaries. This interest rate
swap was not designated as a hedge under the accounting standards for
derivatives and hedging.
Accordingly, changes in the fair value of the swap were recorded to net income
each period through maturity as a component of interest expense (income),
net. Both the intercompany loan and the related interest rate swap matured
during the year ended May 31, 2009.
Net Investment HedgesThe Company also hedges the risk of variability in foreign-currency-denominated
net investments in wholly-owned international operations. All changes in
fair value of the derivatives designated as net investment hedges, except
ineffective portions, are reported in the cumulative translation adjustment
component of other comprehensive income along with the foreign currency
translation adjustments on those investments. The Company classifi es the
cash fl ows at settlement of its net investment hedges within the cash used
by investing component of the cash fl ow statement. The Company assesses
hedge effectiveness based on changes in forward rates. The Company
recorded no ineffectiveness from its net investment hedges for the years
ended May 31, 2011, 2010, and 2009.
Credit RiskThe Company is exposed to credit-related losses in the event of non-performance
by counterparties to hedging instruments. The counterparties to all derivative
transactions are major fi nancial institutions with investment grade credit ratings.
However, this does not eliminate the Company’s exposure to credit risk with
these institutions. This credit risk is limited to the unrealized gains in such
contracts should any of these counterparties fail to perform as contracted.
To manage this risk, the Company has established strict counterparty credit
guidelines that are continually monitored and reported to senior management
according to prescribed guidelines. The Company also utilizes a portfolio of
fi nancial institutions either headquartered or operating in the same countries
the Company conducts its business.
The Company’s derivative contracts contain credit risk related contingent
features aiming to protect against signifi cant deterioration in counterparties’
creditworthiness and their ultimate ability to settle outstanding derivative
contracts in the normal course of business. The Company’s bilateral credit related
contingent features require the owing entity, either the Company or the derivative
55NIKE, INC. - Form 10-K
PART II Note 18 Operating Segments and Related Information
counterparty, to post collateral should the fair value of outstanding derivatives
per counterparty be greater than $50 million. Additionally, a certain level of
decline in credit rating of either the Company or the counterparty could trigger
collateral requirements. As of May 31, 2011, the Company was in compliance
with all such credit risk related contingent features. The aggregate fair value
of derivative instruments with credit risk related contingent features that are
in a net liability position at May 31, 2011 was $160 million. The Company, or
any counterparty, were not required to post any collateral as a result of these
contingent features. As a result of the above considerations, the Company
considers the impact of the risk of counterparty default to be immaterial.
NOTE 18 Operating Segments and Related Information
Operating SegmentsThe Company’s operating segments are evidence of the structure of the
Company’s internal organization. The major segments are defi ned by geographic
regions for operations participating in NIKE Brand sales activity excluding
NIKE Golf. Each NIKE Brand geographic segment operates predominantly in one
industry: the design, development, marketing and selling of athletic footwear,
apparel, and equipment. In fi scal 2009, the Company initiated a reorganization
of the NIKE Brand into a new model consisting of six geographies. Effective
June 1, 2009, the Company’s new reportable operating segments for the
NIKE Brand are: North America, Western Europe, Central and Eastern Europe,
Greater China, Japan, and Emerging Markets. Previously, NIKE Brand operations
were organized into the following four geographic regions: U.S., Europe,
Middle East and Africa (collectively, “EMEA”), Asia Pacifi c, and Americas.
The Company’s NIKE Brand Direct to Consumer operations are managed
within each geographic segment.
The Company’s “Other” category is broken into two components for presentation
purposes to align with the way management views the Company. The “Global
Brand Divisions” category primarily represents NIKE Brand licensing businesses
that are not part of a geographic operating segment, selling, general and
administrative expenses that are centrally managed for the NIKE Brand and
costs associated with product development and supply chain operations.
The “Other Businesses” category primarily consists of the activities of our
affi liate brands; Cole Haan, Converse Inc., Hurley International LLC and Umbro
International Limited; and NIKE Golf. Activities represented in the “Other”
category are immaterial for individual disclosure.
Revenues as shown below represent sales to external customers for each
segment. Intercompany revenues have been eliminated and are immaterial
for separate disclosure.
Corporate consists of unallocated general and administrative expenses, which
includes expenses associated with centrally managed departments, depreciation
and amortization related to the Company’s headquarters, unallocated insurance
and benefi t programs, including stock-based compensation, certain foreign
currency gains and losses, including hedge gains and losses, certain corporate
eliminations and other items.
Effective June 1, 2009, the primary fi nancial measure used by the Company
to evaluate performance of individual operating segments is Earnings Before
Interest and Taxes (commonly referred to as “EBIT”) which represents net income
before interest expense (income), net and income taxes in the consolidated
statements of income. Reconciling items for EBIT represent corporate expense
items that are not allocated to the operating segments for management
reporting. Previously, the Company evaluated performance of individual
operating segments based on pre-tax income or income before income taxes.
As part of the Company’s centrally managed foreign exchange risk management
program, standard foreign currency rates are assigned to each NIKE Brand
entity in our geographic operating segments and are used to record any non-
functional currency revenues or product purchases into the entity’s functional
currency. Geographic operating segment revenues and cost of sales refl ect use
of these standard rates. For all NIKE Brand operating segments, differences
between assigned standard foreign currency rates and actual market rates are
included in Corporate together with foreign currency hedge gains and losses
generated from the centrally managed foreign exchange risk management
program and other conversion gains and losses. Prior to June 1, 2010, foreign
currency results, including hedge results and other conversion gains and losses
generated by the Western Europe and Central & Eastern Europe geographies
were recorded in their respective geographic results.
Additions to long-lived assets as presented in the following table represent
capital expenditures.
Accounts receivable, inventories and property, plant and equipment for
operating segments are regularly reviewed by management and are therefore
provided below.
Certain prior year amounts have been reclassifi ed to conform to fi scal 2011
presentation, as South Africa became part of the Emerging Markets operating
segment beginning June 1, 2010. Previously, South Africa was part of the
Central & Eastern Europe operating segment.
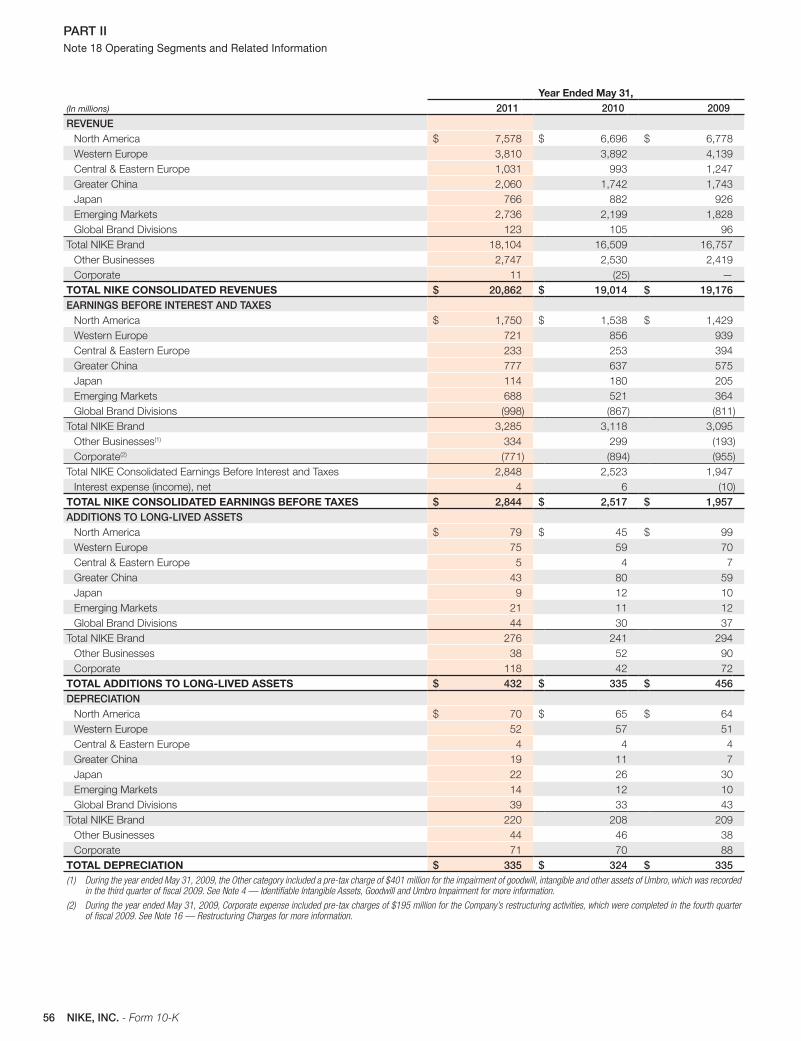
56 NIKE, INC. - Form 10-K
PART II Note 18 Operating Segments and Related Information
(In millions)
Year Ended May 31,2011 2010 2009
REVENUE
North America $ 7,578 $ 6,696 $ 6,778
Western Europe 3,810 3,892 4,139
Central & Eastern Europe 1,031 993 1,247
Greater China 2,060 1,742 1,743
Japan 766 882 926
Emerging Markets 2,736 2,199 1,828
Global Brand Divisions 123 105 96
Total NIKE Brand 18,104 16,509 16,757
Other Businesses 2,747 2,530 2,419
Corporate 11 (25) —
TOTAL NIKE CONSOLIDATED REVENUES $ 20,862 $ 19,014 $ 19,176EARNINGS BEFORE INTEREST AND TAXES
North America $ 1,750 $ 1,538 $ 1,429
Western Europe 721 856 939
Central & Eastern Europe 233 253 394
Greater China 777 637 575
Japan 114 180 205
Emerging Markets 688 521 364
Global Brand Divisions (998) (867) (811)
Total NIKE Brand 3,285 3,118 3,095
Other Businesses(1) 334 299 (193)
Corporate(2) (771) (894) (955)
Total NIKE Consolidated Earnings Before Interest and Taxes 2,848 2,523 1,947
Interest expense (income), net 4 6 (10)
TOTAL NIKE CONSOLIDATED EARNINGS BEFORE TAXES $ 2,844 $ 2,517 $ 1,957ADDITIONS TO LONG-LIVED ASSETS
North America $ 79 $ 45 $ 99
Western Europe 75 59 70
Central & Eastern Europe 5 4 7
Greater China 43 80 59
Japan 9 12 10
Emerging Markets 21 11 12
Global Brand Divisions 44 30 37
Total NIKE Brand 276 241 294
Other Businesses 38 52 90
Corporate 118 42 72
TOTAL ADDITIONS TO LONG-LIVED ASSETS $ 432 $ 335 $ 456DEPRECIATION
North America $ 70 $ 65 $ 64
Western Europe 52 57 51
Central & Eastern Europe 4 4 4
Greater China 19 11 7
Japan 22 26 30
Emerging Markets 14 12 10
Global Brand Divisions 39 33 43
Total NIKE Brand 220 208 209
Other Businesses 44 46 38
Corporate 71 70 88
TOTAL DEPRECIATION $ 335 $ 324 $ 335(1) During the year ended May 31, 2009, the Other category included a pre-tax charge of $401 million for the impairment of goodwill, intangible and other assets of Umbro, which was recorded
in the third quarter of fiscal 2009. See Note 4 — Identifiable Intangible Assets, Goodwill and Umbro Impairment for more information.
(2) During the year ended May 31, 2009, Corporate expense included pre-tax charges of $195 million for the Company’s restructuring activities, which were completed in the fourth quarter of fiscal 2009. See Note 16 — Restructuring Charges for more information.
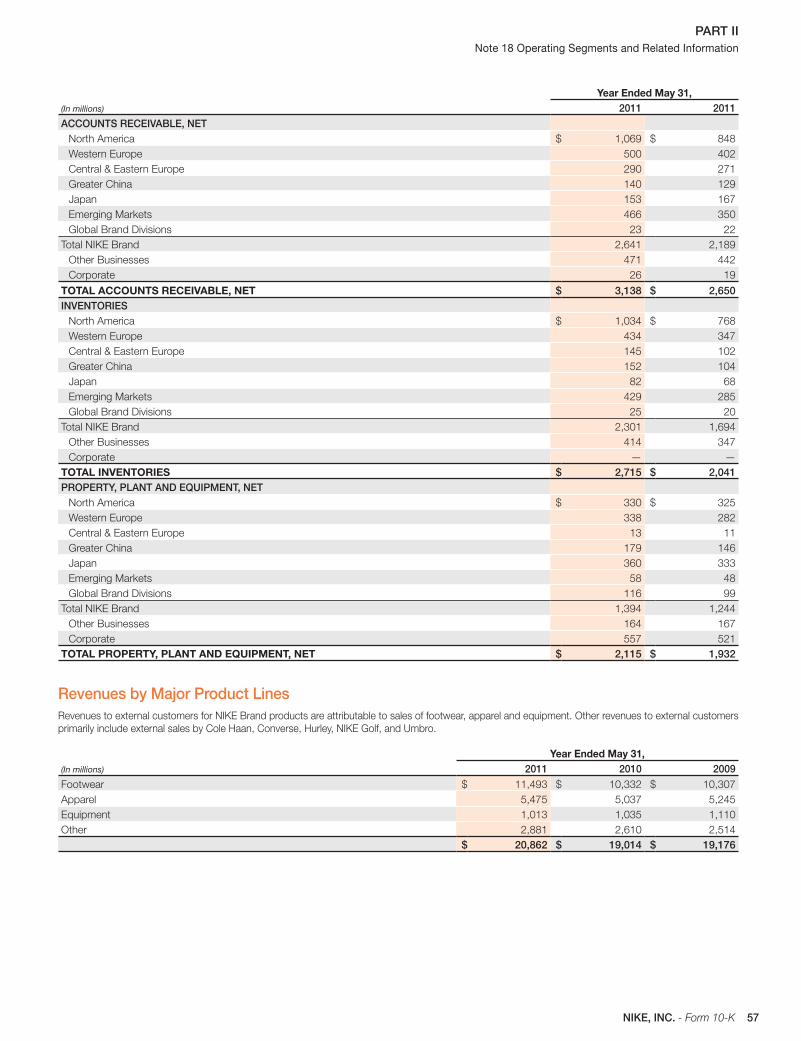
57NIKE, INC. - Form 10-K
PART II Note 18 Operating Segments and Related Information
(In millions)
Year Ended May 31,2011 2011
ACCOUNTS RECEIVABLE, NET
North America $ 1,069 $ 848
Western Europe 500 402
Central & Eastern Europe 290 271
Greater China 140 129
Japan 153 167
Emerging Markets 466 350
Global Brand Divisions 23 22
Total NIKE Brand 2,641 2,189
Other Businesses 471 442
Corporate 26 19
TOTAL ACCOUNTS RECEIVABLE, NET $ 3,138 $ 2,650INVENTORIES
North America $ 1,034 $ 768
Western Europe 434 347
Central & Eastern Europe 145 102
Greater China 152 104
Japan 82 68
Emerging Markets 429 285
Global Brand Divisions 25 20
Total NIKE Brand 2,301 1,694
Other Businesses 414 347
Corporate — —
TOTAL INVENTORIES $ 2,715 $ 2,041PROPERTY, PLANT AND EQUIPMENT, NET
North America $ 330 $ 325
Western Europe 338 282
Central & Eastern Europe 13 11
Greater China 179 146
Japan 360 333
Emerging Markets 58 48
Global Brand Divisions 116 99
Total NIKE Brand 1,394 1,244
Other Businesses 164 167
Corporate 557 521
TOTAL PROPERTY, PLANT AND EQUIPMENT, NET $ 2,115 $ 1,932
Revenues by Major Product LinesRevenues to external customers for NIKE Brand products are attributable to sales of footwear, apparel and equipment. Other revenues to external customers
primarily include external sales by Cole Haan, Converse, Hurley, NIKE Golf, and Umbro.
(In millions)
Year Ended May 31,2011 2010 2009
Footwear $ 11,493 $ 10,332 $ 10,307
Apparel 5,475 5,037 5,245
Equipment 1,013 1,035 1,110
Other 2,881 2,610 2,514
$ 20,862 $ 19,014 $ 19,176
58 NIKE, INC. - Form 10-K
PART II ITEM 9 Changes in and Disagreements with Accountants on Accounting and Financial Disclosure
Revenues and Long-Lived Assets by Geographic AreaGeographical area information is similar to what was shown previously under
operating segments with the exception of the Other activity, which has been
allocated to the geographical areas based on the location where the sales
originated. Revenues derived in the United States were $8,956 million,
$7,914 million, and $8,020 million for the years ended May 31, 2011, 2010, and
2009, respectively. The Company’s largest concentrations of long-lived assets
primarily consist of the Company’s world headquarters and distribution facilities
in the United States and distribution facilities in Japan, Belgium and China.
Long-lived assets attributable to operations in the United States, which are
comprised of net property, plant & equipment, were $1,115 million, $1,070 million,
and $1,143 million at May 31, 2011, 2010, and 2009, respectively. Long-lived
assets attributable to operations in Japan were $363 million, $336 million,
and $322 million at May 31, 2011, 2010 and 2009, respectively. Long-lived
assets attributable to operations in Belgium were $182 million, $164 million,
and $191 million at May 31, 2011, 2010, and 2009, respectively. Long-lived
assets attributable to operations in China were $175 million, $144 million,
and $76 million at May 31, 2011, 2010, and 2009, respectively.
Major CustomersNo customer accounted for 10% or more of the Company’s net sales during
the years ended May 31, 2011, 2010, and 2009.
ITEM 9 Changes in and Disagreements with Accountants on Accounting and Financial Disclosure
There has been no change of accountants nor any disagreements with accountants on any matter of accounting principles or practices or fi nancial statement
disclosure required to be reported under this Item.
ITEM 9A Controls and ProceduresWe maintain disclosure controls and procedures that are designed to ensure
information required to be disclosed in our Exchange Act reports is recorded,
processed, summarized and reported within the time periods specifi ed in
the Securities and Exchange Commission’s rules and forms and that such
information is accumulated and communicated to our management, including
our Chief Executive Offi cer and Chief Financial Offi cer, as appropriate, to allow for
timely decisions regarding required disclosure. In designing and evaluating the
disclosure controls and procedures, management recognizes that any controls
and procedures, no matter how well designed and operated, can provide
only reasonable assurance of achieving the desired control objectives, and
management is required to apply its judgment in evaluating the cost-benefi t
relationship of possible controls and procedures.
We carry out a variety of on-going procedures, under the supervision and with
the participation of our management, including our Chief Executive Offi cer
and Chief Financial Offi cer, to evaluate the effectiveness of the design and
operation of our disclosure controls and procedures. Based on the foregoing,
our Chief Executive Offi cer and Chief Financial Offi cer concluded that our
disclosure controls and procedures were effective at the reasonable assurance
level as of May 31, 2011.
“Management’s Annual Report on Internal Control Over Financial Reporting”
is included in Item 8 on page 34 of this Report.
There has been no change in our internal control over fi nancial reporting during
our most recent fi scal quarter that has materially affected, or is reasonable
likely to materially affect, our internal control over fi nancial reporting.
ITEM 9B Other InformationNo disclosure is required under this Item.
59NIKE, INC. - Form 10-K
PART III Item 14 Principal Accountant Fees and Services
PART III
ITEM 10 Directors, Executive Offi cers and Corporate Governance
The information required by Item 401 of Regulation S-K regarding directors is
included under “Election of Directors” in the defi nitive Proxy Statement for our
2011 Annual Meeting of Shareholders and is incorporated herein by reference.
The information required by Item 401 of Regulation S-K regarding executive
offi cers is included under “Executive Offi cers of the Registrant” in Item 1 of this
Report. The information required by Item 405 of Regulation S-K is included
under “Election of Directors — Section 16(a) Benefi cial Ownership Reporting
Compliance” in the defi nitive Proxy Statement for our 2011 Annual Meeting of
Shareholders and is incorporated herein by reference. The information required by
Item 406 of Regulation S-K is included under “Corporate Governance — Code
of Business Conduct and Ethics” in the defi nitive Proxy Statement for our 2011
Annual Meeting of Shareholders and is incorporated herein by reference. The
information required by Items 407(d)(4) and (d)(5) of Regulation S-K regarding
the Audit Committee of the Board of Directors is included under “Corporate
Governance — Board Committees” in the defi nitive Proxy Statement for our
2011 Annual Meeting of Shareholders and is incorporated herein by reference.
ITEM 11 Executive Compensation The information required by Items 402, 407(e)(4) and 407(e)(5) of Regulation S-K
regarding executive compensation is included under “Election of Directors —
Director Compensation for Fiscal 2011,” “Compensation Discussion and
Analysis,” “Executive Compensation,” “Election of Directors — Compensation
Committee Interlocks and Insider Participation” and “Compensation Committee
Report” in the defi nitive Proxy Statement for our 2011 Annual Meeting of
Shareholders and is incorporated herein by reference.
ITEM 12 Security Ownership of Certain Benefi cial Owners and Management and Related Stockholder Matters
The information required by Item 201(d) of Regulation S-K is included under
“Executive Compensation — Equity Compensation Plans” in the defi nitive Proxy
Statement for our 2011 Annual Meeting of Shareholders and is incorporated
herein by reference. The information required by Item 403 of Regulation S-K is
included under “Election of Directors — Stock Holdings of Certain Owners and
Management” in the defi nitive Proxy Statement for our 2011 Annual Meeting
of Shareholders and is incorporated herein by reference.
ITEM 13 Certain Relationships and Related Transactions, and Director Independence
The information required by Items 404 and 407(a) of Regulation S-K is included under “Election of Directors — Transactions with Related Persons” and “Corporate
Governance — Director Independence” in the defi nitive Proxy Statement for our 2011 Annual Meeting of Shareholders and is incorporated herein by reference.
ITEM 14 Principal Accountant Fees and Services The information required by Item 9(e) of Schedule 14A is included under “Ratifi cation Of Independent Registered Public Accounting Firm” in the defi nitive Proxy
Statement for our 2011 Annual Meeting of Shareholders and is incorporated herein by reference.
60 NIKE, INC. - Form 10-K
PART IV ITEM 15 Exhibits and Financial Statement Schedules
PART IV
ITEM 15 Exhibits and Financial Statement Schedules
(a) The following documents are fi led as part of this report:
1. Financial Statements
Report of Independent Registered Public Accounting Firm
Consolidated Statements of Income for each of the three years ended May 31, 2011, May 31, 2010 and May 31, 2009
Consolidated Balance Sheets at May 31, 2011 and May 31, 2010
Consolidated Statements of Cash Flows for each of the three years ended May 31, 2011, May 31, 2010 and May 31, 2009
Consolidated Statements of Shareholders’ Equity for each of the three years ended May 31, 2011, May 31, 2010 and May 31, 2009
Notes to Consolidated Financial Statements
2. Financial Statement Schedule
Schedule II — Valuation and Qualifying Accounts
All other schedules are omitted because they are not applicable or the required information is shown in the fi nancial statements or notes thereto.
3. Exhibits
61NIKE, INC. - Form 10-K
PART IV ITEM 15 Exhibits and Financial Statement Schedules
Number Title
3.1
Restated Articles of Incorporation, as amended (incorporated by reference to Exhibit 3.1 to the Company’s Quarterly Report
on Form 10-Q for the fi scal quarter ended August 31, 2005).
3.2
Third Restated Bylaws, as amended (incorporated by reference to Exhibit 3.2 to the Company’s Current Report on Form 8-K
fi led February 20, 2007).
4.1 Restated Articles of Incorporation, as amended (see Exhibit 3.1).
4.2 Third Restated Bylaws, as amended (see Exhibit 3.2).
4.3
Indenture dated as of December 13, 1996 between the Company and Bank One Trust Company, National Association
(successor in interest to The First National Bank of Chicago), as Trustee (incorporated by reference to Exhibit 4.01 to Amendment
No. 1 to Registration Statement No. 333-15953 fi led by the Company on November 26, 1996).
4.4
Form of Offi cers’ Certifi cate relating to the Company’s Fixed Rate Medium-Term Notes and the Company’s Floating Rate
Medium-Term Notes, form of Fixed Rate Note and form of Floating Rate Note (incorporated by reference to Exhibits 4.2, 4.3 and 4.4
of the Company’s Current Report on Form 8-K fi led May 29, 2002).
4.5
Credit Agreement dated as of December 1, 2006 among NIKE, Inc., Bank of America, N.A., individually and as Agent, and the other
banks party thereto (incorporated by reference to Exhibit 4.01 to the Company’s Current Report on Form 8-K fi led December 6, 2006).
4.6
First Amendment to the Credit Agreement, dated August 24, 2007, among NIKE, Inc., Bank of America, N.A., as Administrative
Agent, Citicorp USA, Inc., as Syndication Agent, and HSBC Bank USA, N.A., The Bank of Tokyo Mitsubishi UFG, Ltd. and Deutsche
Bank Securities Inc., as Co-Documentation Agents, and the other Banks named therein (incorporated by reference to Exhibit 10.1
to the Company’s Quarterly Report on Form 10-Q for the fi scal quarter ended February 29, 2008).
4.7
Extension and Second Amendment to the Credit Agreement, dated November 1, 2007, among NIKE, Inc., Bank of America, N.A.,
as Administrative Agent, Citicorp USA, Inc., as Syndication Agent, and HSBC Bank USA, N.A., The Bank of Tokyo Mitsubishi
UFG, Ltd. and Deutsche Bank Securities Inc., as Co-Documentation Agents, and the other Banks named therein. (incorporated
by reference to Exhibit 10.2 to the Company’s Quarterly Report on Form 10-Q for the fi scal quarter ended February 29, 2008).
10.1
Form of Non-Statutory Stock Option Agreement for options granted to non-employee directors prior to May 31, 2010
under the 1990 Stock Incentive Plan (incorporated by reference to Exhibit 10.3 to the Company’s Current Report on Form 8-K
fi led June 21, 2005).*
10.2
Form of Non-Statutory Stock Option Agreement for options granted to non-employee directors after May 31, 2010 under the 1990
Stock Incentive Plan (incorporated by reference to Exhibit 10.2 to the Company’s Annual Report on Form 10-K for the fi scal year
ended May 31, 2010).*
10.3
Form of Non-Statutory Stock Option Agreement for options granted to executives prior to May 31, 2010 under the 1990 Stock
Incentive Plan (incorporated by reference to Exhibit 10.1 to the Company’s Annual Report on Form 10-K for the fi scal year
ended May 31, 2009).*
10.4
Form of Non-Statutory Stock Option Agreement for options granted to executives after May 31, 2010 under the 1990 Stock
Incentive Plan (incorporated by reference to Exhibit 10.1 to the Company’s Current Report on Form 8-K fi led July 20, 2010).*
10.5
Form of Indemnity Agreement entered into between the Company and each of its offi cers and directors (incorporated by reference
to Exhibit 10.2 to the Company’s Annual Report on Form 10-K for the fi scal year ended May 31, 2008).*
10.6
NIKE, Inc. 1990 Stock Incentive Plan (incorporated by reference to Exhibit 10.2 to the Company’s Current Report on Form 8-K
fi led on September 24, 2010).*
10.7
NIKE, Inc. Executive Performance Sharing Plan (incorporated by reference to Exhibit 10.1 to the Company’s Current Report
on Form 8-K fi led on September 24, 2010).*
10.8
NIKE, Inc. Long-Term Incentive Plan (incorporated by reference to Exhibit 10.5 to the Company’s Annual Report on Form 10-K
for the fi scal year ended May 31, 2008).*
10.9
NIKE, Inc. Deferred Compensation Plan (Amended and Restated effective January 1, 2009) (incorporated by reference to Exhibit
10.8 to the Company’s Annual Report on Form 10-K for the fi scal year ended May 31, 2009).*
10.10
NIKE, Inc. Deferred Compensation Plan (Amended and Restated effective June 1, 2004) (applicable to amounts deferred before
January 1, 2005) (incorporated by reference to Exhibit 10.6 to the Company’s Annual Report on Form 10-K for the fi scal year
ended May 31, 2004).*
10.11
Amendment No. 1 effective January 1, 2008 to the NIKE, Inc. Deferred Compensation Plan (June 1, 2004 Restatement)
(incorporated by reference to Exhibit 10.9 to the Company’s Annual Report on Form 10-K for the fi scal year ended May 31, 2009).*
10.12
NIKE, Inc. Foreign Subsidiary Employee Stock Purchase Plan (incorporated by reference to Exhibit 10.1 to the Company’s Quarterly
Report on Form 10-Q for the fi scal quarter ended November 30, 2008).*
10.13
Amended and Restated Covenant Not To Compete and Non-Disclosure Agreement between NIKE, Inc. and Mark G. Parker
dated July 24, 2008 (incorporated by reference to Exhibit 10.1 to the Company’s Current Report on Form 8-K fi led July 24, 2008).*
10.14
Amended and Restated Covenant Not to Compete and Non-Disclosure Agreement between NIKE, Inc. and Charles D. Denson
dated July 24, 2008 (incorporated by reference to Exhibit 10.2 to the Company’s Current Report on Form 8-K fi led July 24, 2008).*
10.15
Form of Long-Term Incentive Award Agreement under the Long-Term Incentive Plan (incorporated by reference to Exhibit 10.15
to the Company’s Annual Report on Form 10-K for the fi scal year ended May 31, 2010).*
10.16
Form of Restricted Stock Bonus Agreement under the 1990 Stock Incentive Plan for awards prior to May 31, 2010
(incorporated by reference to Exhibit 10.2 to the Company’s Current Report on Form 8-K fi led June 21, 2005).*
10.17
Form of Restricted Stock Agreement under the 1990 Stock Incentive Plan for awards after May 31, 2010 (incorporated by reference
to Exhibit 10.2 to the Company’s Current Report on Form 8-K fi led July 20, 2010).*
10.18
Covenant Not to Compete and Non-Disclosure Agreement between NIKE, Inc. and Donald W. Blair dated November 10, 1999
(incorporated by reference to Exhibit 10.15 to the Company’s Annual Report on Form 10-K for the fi scal year ended May 31, 2006).*
10.19
Covenant Not to Compete and Non-Disclosure Agreement between NIKE, Inc. and Gary DeStefano (incorporated by reference
to Exhibit 10.1 to the Company’s Current Report on Form 8-K fi led August 11, 2006).*
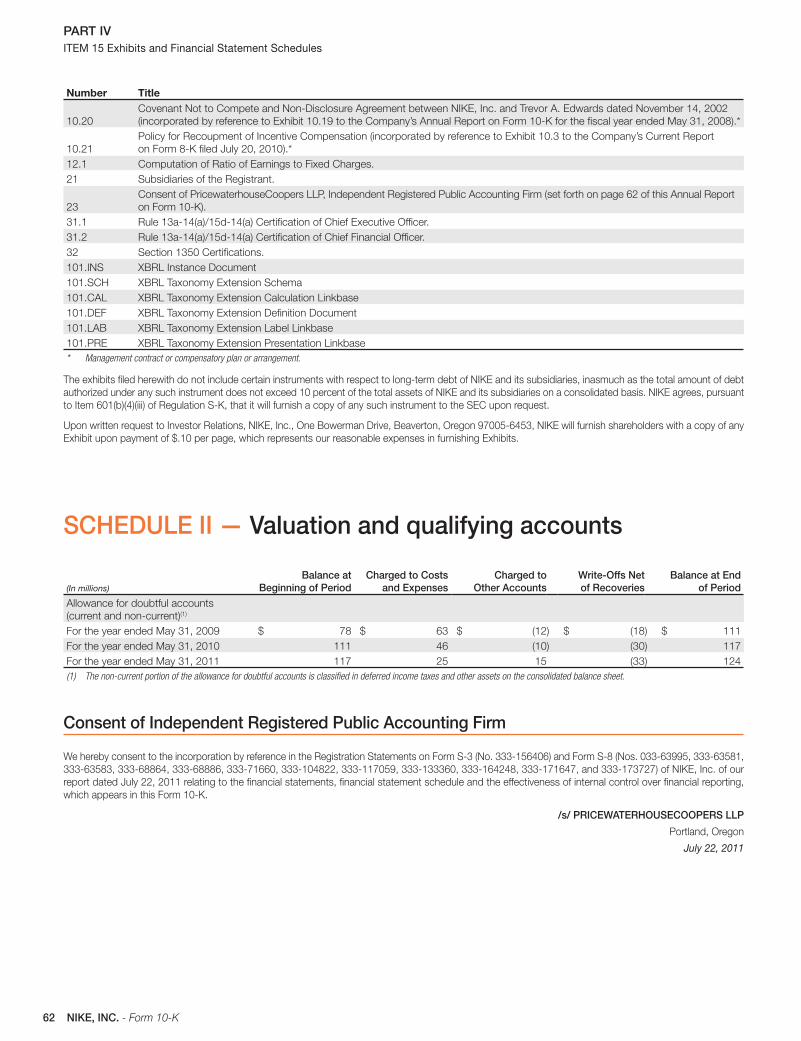
62 NIKE, INC. - Form 10-K
PART IV ITEM 15 Exhibits and Financial Statement Schedules
Number Title
10.20
Covenant Not to Compete and Non-Disclosure Agreement between NIKE, Inc. and Trevor A. Edwards dated November 14, 2002
(incorporated by reference to Exhibit 10.19 to the Company’s Annual Report on Form 10-K for the fi scal year ended May 31, 2008).*
10.21
Policy for Recoupment of Incentive Compensation (incorporated by reference to Exhibit 10.3 to the Company’s Current Report
on Form 8-K fi led July 20, 2010).*
12.1 Computation of Ratio of Earnings to Fixed Charges.
21 Subsidiaries of the Registrant.
23
Consent of PricewaterhouseCoopers LLP, Independent Registered Public Accounting Firm (set forth on page 62 of this Annual Report
on Form 10-K).
31.1 Rule 13a-14(a)/15d-14(a) Certifi cation of Chief Executive Offi cer.
31.2 Rule 13a-14(a)/15d-14(a) Certifi cation of Chief Financial Offi cer.
32 Section 1350 Certifi cations.
101.INS XBRL Instance Document
101.SCH XBRL Taxonomy Extension Schema
101.CAL XBRL Taxonomy Extension Calculation Linkbase
101.DEF XBRL Taxonomy Extension Defi nition Document
101.LAB XBRL Taxonomy Extension Label Linkbase
101.PRE XBRL Taxonomy Extension Presentation Linkbase
* Management contract or compensatory plan or arrangement.
The exhibits fi led herewith do not include certain instruments with respect to long-term debt of NIKE and its subsidiaries, inasmuch as the total amount of debt
authorized under any such instrument does not exceed 10 percent of the total assets of NIKE and its subsidiaries on a consolidated basis. NIKE agrees, pursuant
to Item 601(b)(4)(iii) of Regulation S-K, that it will furnish a copy of any such instrument to the SEC upon request.
Upon written request to Investor Relations, NIKE, Inc., One Bowerman Drive, Beaverton, Oregon 97005-6453, NIKE will furnish shareholders with a copy of any
Exhibit upon payment of $.10 per page, which represents our reasonable expenses in furnishing Exhibits.
SCHEDULE II — Valuation and qualifying accounts
(In millions)
Balance at Beginning of Period
Charged to Costs and Expenses
Charged toOther Accounts
Write-Offs Net of Recoveries
Balance at End of Period
Allowance for doubtful accounts
(current and non-current)(1)
For the year ended May 31, 2009 $ 78 $ 63 $ (12) $ (18) $ 111
For the year ended May 31, 2010 111 46 (10) (30) 117
For the year ended May 31, 2011 117 25 15 (33) 124
(1) The non-current portion of the allowance for doubtful accounts is classified in deferred income taxes and other assets on the consolidated balance sheet.
Consent of Independent Registered Public Accounting Firm
We hereby consent to the incorporation by reference in the Registration Statements on Form S-3 (No. 333-156406) and Form S-8 (Nos. 033-63995, 333-63581,
333-63583, 333-68864, 333-68886, 333-71660, 333-104822, 333-117059, 333-133360, 333-164248, 333-171647, and 333-173727) of NIKE, Inc. of our
report dated July 22, 2011 relating to the fi nancial statements, fi nancial statement schedule and the effectiveness of internal control over fi nancial reporting,
which appears in this Form 10-K.
/s/ PRICEWATERHOUSECOOPERS LLP
Portland, Oregon
July 22, 2011
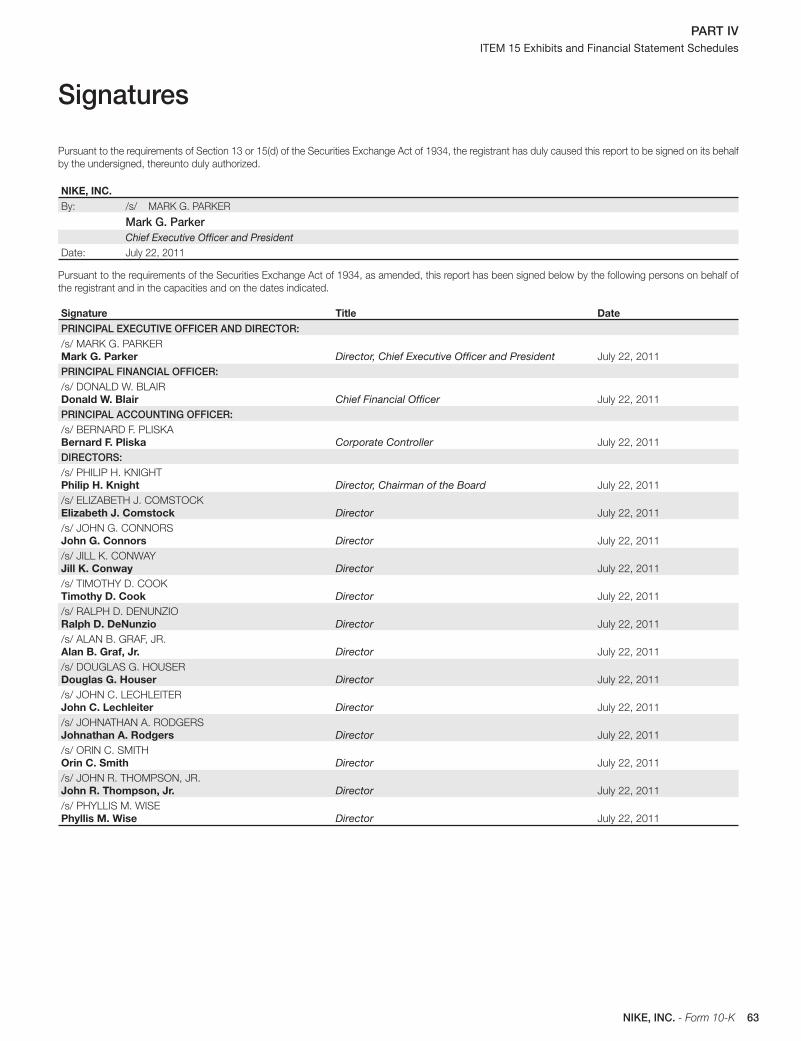
63NIKE, INC. - Form 10-K
PART IV ITEM 15 Exhibits and Financial Statement Schedules
Signatures
Pursuant to the requirements of Section 13 or 15(d) of the Securities Exchange Act of 1934, the registrant has duly caused this report to be signed on its behalf
by the undersigned, thereunto duly authorized.
NIKE, INC.By: /s/ MARK G. PARKER
Mark G. ParkerChief Executive Offi cer and President
Date: July 22, 2011
Pursuant to the requirements of the Securities Exchange Act of 1934, as amended, this report has been signed below by the following persons on behalf of
the registrant and in the capacities and on the dates indicated.
Signature Title DatePRINCIPAL EXECUTIVE OFFICER AND DIRECTOR:
/s/ MARK G. PARKER
Mark G. Parker Director, Chief Executive Offi cer and President July 22, 2011
PRINCIPAL FINANCIAL OFFICER:
/s/ DONALD W. BLAIR
Donald W. Blair Chief Financial Offi cer July 22, 2011
PRINCIPAL ACCOUNTING OFFICER:
/s/ BERNARD F. PLISKA
Bernard F. Pliska Corporate Controller July 22, 2011
DIRECTORS:
/s/ PHILIP H. KNIGHT
Philip H. Knight Director, Chairman of the Board July 22, 2011
/s/ ELIZABETH J. COMSTOCK
Elizabeth J. Comstock Director July 22, 2011
/s/ JOHN G. CONNORS
John G. Connors Director July 22, 2011
/s/ JILL K. CONWAY
Jill K. Conway Director July 22, 2011
/s/ TIMOTHY D. COOK
Timothy D. Cook Director July 22, 2011
/s/ RALPH D. DENUNZIO
Ralph D. DeNunzio Director July 22, 2011
/s/ ALAN B. GRAF, JR.
Alan B. Graf, Jr. Director July 22, 2011
/s/ DOUGLAS G. HOUSER
Douglas G. Houser Director July 22, 2011
/s/ JOHN C. LECHLEITER
John C. Lechleiter Director July 22, 2011
/s/ JOHNATHAN A. RODGERS
Johnathan A. Rodgers Director July 22, 2011
/s/ ORIN C. SMITH
Orin C. Smith Director July 22, 2011
/s/ JOHN R. THOMPSON, JR.
John R. Thompson, Jr. Director July 22, 2011
/s/ PHYLLIS M. WISE
Phyllis M. Wise Director July 22, 2011
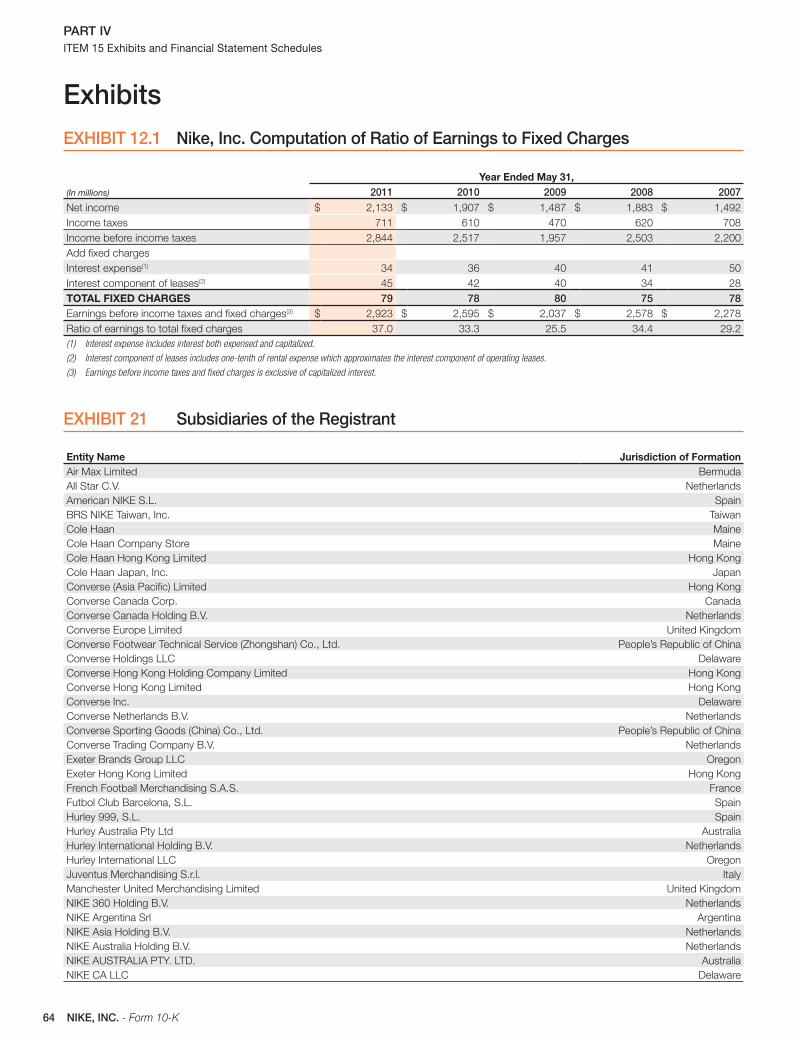
64 NIKE, INC. - Form 10-K
PART IV ITEM 15 Exhibits and Financial Statement Schedules
ExhibitsEXHIBIT 12.1 Nike, Inc. Computation of Ratio of Earnings to Fixed Charges
(In millions)
Year Ended May 31,2011 2010 2009 2008 2007
Net income $ 2,133 $ 1,907 $ 1,487 $ 1,883 $ 1,492
Income taxes 711 610 470 620 708
Income before income taxes 2,844 2,517 1,957 2,503 2,200
Add fi xed charges
Interest expense(1) 34 36 40 41 50
Interest component of leases(2) 45 42 40 34 28
TOTAL FIXED CHARGES 79 78 80 75 78Earnings before income taxes and fi xed charges(3) $ 2,923 $ 2,595 $ 2,037 $ 2,578 $ 2,278
Ratio of earnings to total fi xed charges 37.0 33.3 25.5 34.4 29.2
(1) Interest expense includes interest both expensed and capitalized.
(2) Interest component of leases includes one-tenth of rental expense which approximates the interest component of operating leases.
(3) Earnings before income taxes and fixed charges is exclusive of capitalized interest.
EXHIBIT 21 Subsidiaries of the Registrant
Entity Name Jurisdiction of FormationAir Max Limited Bermuda
All Star C.V. Netherlands
American NIKE S.L. Spain
BRS NIKE Taiwan, Inc. Taiwan
Cole Haan Maine
Cole Haan Company Store Maine
Cole Haan Hong Kong Limited Hong Kong
Cole Haan Japan, Inc. Japan
Converse (Asia Pacifi c) Limited Hong Kong
Converse Canada Corp. Canada
Converse Canada Holding B.V. Netherlands
Converse Europe Limited United Kingdom
Converse Footwear Technical Service (Zhongshan) Co., Ltd. People’s Republic of China
Converse Holdings LLC Delaware
Converse Hong Kong Holding Company Limited Hong Kong
Converse Hong Kong Limited Hong Kong
Converse Inc. Delaware
Converse Netherlands B.V. Netherlands
Converse Sporting Goods (China) Co., Ltd. People’s Republic of China
Converse Trading Company B.V. Netherlands
Exeter Brands Group LLC Oregon
Exeter Hong Kong Limited Hong Kong
French Football Merchandising S.A.S. France
Futbol Club Barcelona, S.L. Spain
Hurley 999, S.L. Spain
Hurley Australia Pty Ltd Australia
Hurley International Holding B.V. Netherlands
Hurley International LLC Oregon
Juventus Merchandising S.r.l. Italy
Manchester United Merchandising Limited United Kingdom
NIKE 360 Holding B.V. Netherlands
NIKE Argentina Srl Argentina
NIKE Asia Holding B.V. Netherlands
NIKE Australia Holding B.V. Netherlands
NIKE AUSTRALIA PTY. LTD. Australia
NIKE CA LLC Delaware
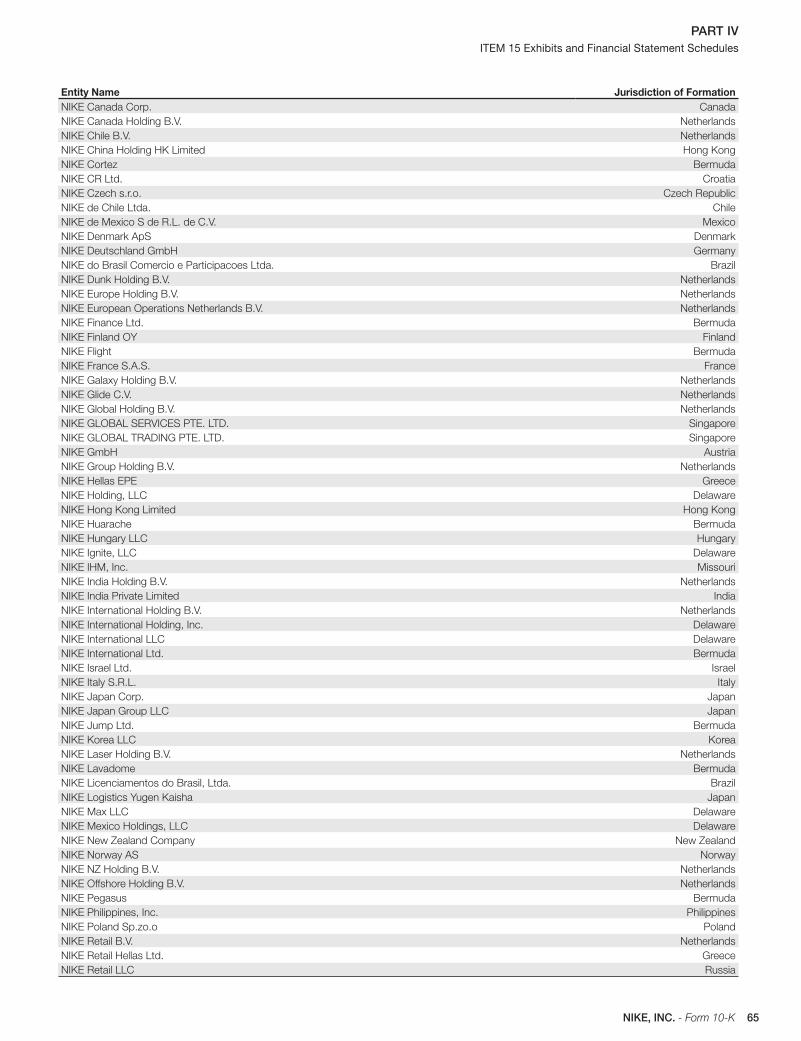
65NIKE, INC. - Form 10-K
PART IV ITEM 15 Exhibits and Financial Statement Schedules
Entity Name Jurisdiction of FormationNIKE Canada Corp. Canada
NIKE Canada Holding B.V. Netherlands
NIKE Chile B.V. Netherlands
NIKE China Holding HK Limited Hong Kong
NIKE Cortez Bermuda
NIKE CR Ltd. Croatia
NIKE Czech s.r.o. Czech Republic
NIKE de Chile Ltda. Chile
NIKE de Mexico S de R.L. de C.V. Mexico
NIKE Denmark ApS Denmark
NIKE Deutschland GmbH Germany
NIKE do Brasil Comercio e Participacoes Ltda. Brazil
NIKE Dunk Holding B.V. Netherlands
NIKE Europe Holding B.V. Netherlands
NIKE European Operations Netherlands B.V. Netherlands
NIKE Finance Ltd. Bermuda
NIKE Finland OY Finland
NIKE Flight Bermuda
NIKE France S.A.S. France
NIKE Galaxy Holding B.V. Netherlands
NIKE Glide C.V. Netherlands
NIKE Global Holding B.V. Netherlands
NIKE GLOBAL SERVICES PTE. LTD. Singapore
NIKE GLOBAL TRADING PTE. LTD. Singapore
NIKE GmbH Austria
NIKE Group Holding B.V. Netherlands
NIKE Hellas EPE Greece
NIKE Holding, LLC Delaware
NIKE Hong Kong Limited Hong Kong
NIKE Huarache Bermuda
NIKE Hungary LLC Hungary
NIKE Ignite, LLC Delaware
NIKE IHM, Inc. Missouri
NIKE India Holding B.V. Netherlands
NIKE India Private Limited India
NIKE International Holding B.V. Netherlands
NIKE International Holding, Inc. Delaware
NIKE International LLC Delaware
NIKE International Ltd. Bermuda
NIKE Israel Ltd. Israel
NIKE Italy S.R.L. Italy
NIKE Japan Corp. Japan
NIKE Japan Group LLC Japan
NIKE Jump Ltd. Bermuda
NIKE Korea LLC Korea
NIKE Laser Holding B.V. Netherlands
NIKE Lavadome Bermuda
NIKE Licenciamentos do Brasil, Ltda. Brazil
NIKE Logistics Yugen Kaisha Japan
NIKE Max LLC Delaware
NIKE Mexico Holdings, LLC Delaware
NIKE New Zealand Company New Zealand
NIKE Norway AS Norway
NIKE NZ Holding B.V. Netherlands
NIKE Offshore Holding B.V. Netherlands
NIKE Pegasus Bermuda
NIKE Philippines, Inc. Philippines
NIKE Poland Sp.zo.o Poland
NIKE Retail B.V. Netherlands
NIKE Retail Hellas Ltd. Greece
NIKE Retail LLC Russia
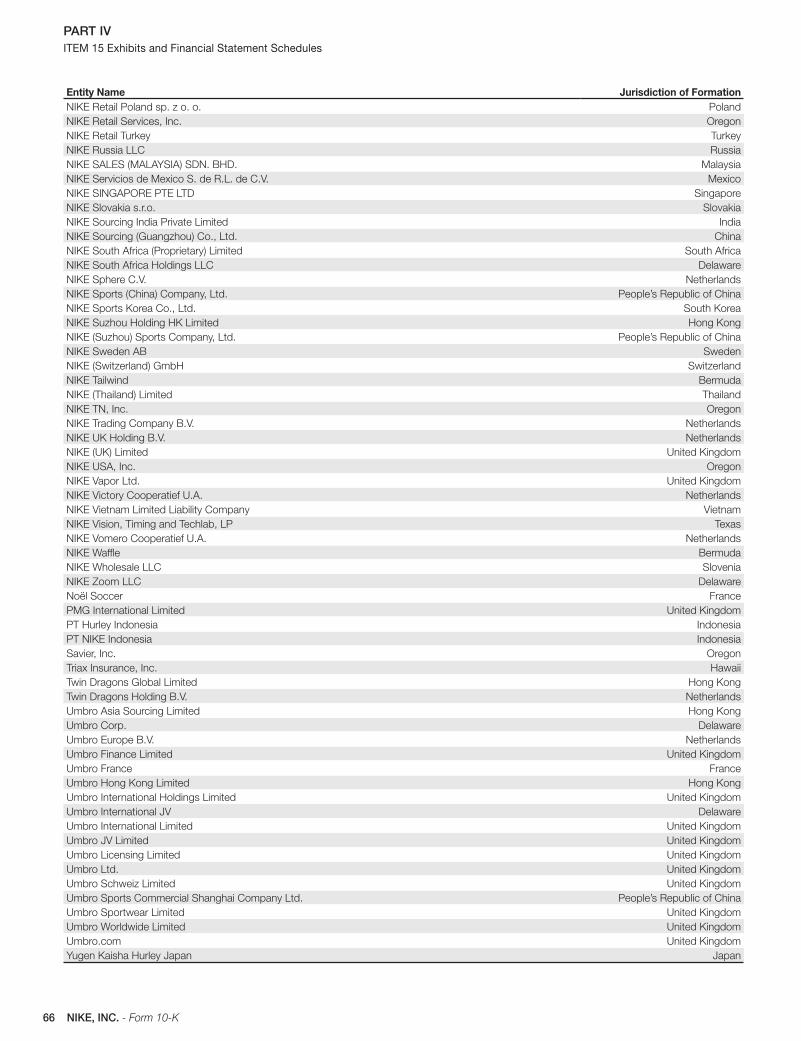
66 NIKE, INC. - Form 10-K
PART IV ITEM 15 Exhibits and Financial Statement Schedules
Entity Name Jurisdiction of FormationNIKE Retail Poland sp. z o. o. Poland
NIKE Retail Services, Inc. Oregon
NIKE Retail Turkey Turkey
NIKE Russia LLC Russia
NIKE SALES (MALAYSIA) SDN. BHD. Malaysia
NIKE Servicios de Mexico S. de R.L. de C.V. Mexico
NIKE SINGAPORE PTE LTD Singapore
NIKE Slovakia s.r.o. Slovakia
NIKE Sourcing India Private Limited India
NIKE Sourcing (Guangzhou) Co., Ltd. China
NIKE South Africa (Proprietary) Limited South Africa
NIKE South Africa Holdings LLC Delaware
NIKE Sphere C.V. Netherlands
NIKE Sports (China) Company, Ltd. People’s Republic of China
NIKE Sports Korea Co., Ltd. South Korea
NIKE Suzhou Holding HK Limited Hong Kong
NIKE (Suzhou) Sports Company, Ltd. People’s Republic of China
NIKE Sweden AB Sweden
NIKE (Switzerland) GmbH Switzerland
NIKE Tailwind Bermuda
NIKE (Thailand) Limited Thailand
NIKE TN, Inc. Oregon
NIKE Trading Company B.V. Netherlands
NIKE UK Holding B.V. Netherlands
NIKE (UK) Limited United Kingdom
NIKE USA, Inc. Oregon
NIKE Vapor Ltd. United Kingdom
NIKE Victory Cooperatief U.A. Netherlands
NIKE Vietnam Limited Liability Company Vietnam
NIKE Vision, Timing and Techlab, LP Texas
NIKE Vomero Cooperatief U.A. Netherlands
NIKE Waffl e Bermuda
NIKE Wholesale LLC Slovenia
NIKE Zoom LLC Delaware
Noël Soccer France
PMG International Limited United Kingdom
PT Hurley Indonesia Indonesia
PT NIKE Indonesia Indonesia
Savier, Inc. Oregon
Triax Insurance, Inc. Hawaii
Twin Dragons Global Limited Hong Kong
Twin Dragons Holding B.V. Netherlands
Umbro Asia Sourcing Limited Hong Kong
Umbro Corp. Delaware
Umbro Europe B.V. Netherlands
Umbro Finance Limited United Kingdom
Umbro France France
Umbro Hong Kong Limited Hong Kong
Umbro International Holdings Limited United Kingdom
Umbro International JV Delaware
Umbro International Limited United Kingdom
Umbro JV Limited United Kingdom
Umbro Licensing Limited United Kingdom
Umbro Ltd. United Kingdom
Umbro Schweiz Limited United Kingdom
Umbro Sports Commercial Shanghai Company Ltd. People’s Republic of China
Umbro Sportwear Limited United Kingdom
Umbro Worldwide Limited United Kingdom
Umbro.com United Kingdom
Yugen Kaisha Hurley Japan Japan
D I R E C T O R S
Elizabeth J. ComstockSenior Vice President & Chief Marketing Offi cer
General Electric Company
Fairfi eld, Connecticut
John G. Connors(2)(3)
Partner — Ignition Partners LLC
Bellevue, Washington
Jill K. Conway(5)(6)
Visiting Scholar
Massachusetts Institute of Technology
Boston, Massachusetts
Timothy D. Cook(4)(6)
Chief Operating Offi cer
Apple Inc.
Cupertino, California
Ralph D. DeNunzio(3)(4)(6)
President, Harbor Point Associates, Inc.,
private investment and consulting fi rm
Rye Brook, New York
Alan B. Graf, Jr.(2)
Executive Vice President & Chief Financial Offi cer
FedEx Corporation
Memphis, Tennessee
Douglas G. Houser(1)(5)(6)
Partner — Bullivant, Houser, Bailey, P.C., Attorneys
Portland, Oregon
Philip H. Knight(1)
Chairman of the Board,
NIKE, Inc.
Beaverton, Oregon
John C. Lechleiter(4)(5)
President & Chief Executive Offi cer
Eli Lilly and Company
Indianapolis, Indiana
Mark G. Parker(1)
Chief Executive Offi cer & President,
NIKE, Inc.
Beaverton, Oregon
Johnathan A. Rodgers(4)(5)
President & CEO,
TV One, LLC
Silver Springs, Maryland
Orin C. Smith(2)(3)
Chief Executive Offi cer (Retired)
Starbucks Corporation
Seattle, Washington
John R. Thompson, Jr.(5)
Former Head Basketball Coach
Georgetown University
Washington, D.C.
Phyllis M. Wise(5)
Provost & Executive Vice President
University of Washington
Seattle, Washington
C O R P O R A T E O F F I C E R S
Philip H. KnightChairman of the Board of Directors
Mark G. ParkerPresident & Chief Executive Offi cer
David J. AyreVice President, Global Human Resources
Donald W. BlairVice President & Chief Financial Offi cer
Charles D. DensonPresident, NIKE Brand
Gary M. DeStefanoPresident, Global Operations
Trevor A. EdwardsVice President, Global Brand & Category Management
Jeanne P. JacksonPresident, Direct to Consumer
Hilary K. KraneVice President, General Counsel & Corporate Affairs
John F. SlusherVice President, Global Sports Marketing
Eric D. SprunkVice President, Merchandising & Product
Hans van AlebeekVice President, Global Operations & Technology
Roger S. WyettPresident, Affi liates and President
& Chief Executive Offi cer of Hurley International LLC
Robert W. WoodruffVice President & Treasurer and
Chief Financial Offi cer, Affi liates
John F. Coburn IIISecretary
Peter H. Koehler, Jr.Assistant Secretary
Margo FowlerAssistant Secretary
(1) Member — Executive Committee(2) Member — Audit Committee(3) Member — Finance Committee(4) Member — Compensation Committee(5) Member — Corporate Responsibility Committee(6) Member — Nominating and Corporate Governance Committee
V I C E P R E S I D E N T S
Mark K. AllenVice President, Global Footwear ProductCreation & OperationsBeaverton, Oregon
Kris D. AmanVice President, Global Category Athletic Training & Field SportsBeaverton, Oregon
Nicholas C. AthanasokosVice President, Global Sourcing & ManufacturingBeaverton, Oregon
Jonathan A. BanksVice President, Emerging Markets,Greater China and JapanSports MarketingBeaverton, Oregon
Reenie BenzigerVice President, Apparel Sports CategoryBeaverton, Oregon
Alexander W. BodeckerVice President, NIKE GlobalDesign & Action SportsBeaverton, Oregon
Michael D. BrewerVice President, North America SupplyChain OpsBeaverton, Oregon
Gregory W. BrinkChief Financial Offi cer, EMEAHilversum, The Netherlands
Martin BrokVice President, Western Europe RetailHilversum, The Netherlands
James A. Calhoun Jr.Vice President & Chief Executive Offi cerConverse Inc.North Andover, Massachusetts
Andrew CampionVice President & Chief Financial Offi cerNIKE BrandBeaverton, Oregon
Oscar E. CardonaVice President, Global Human Resources,Infrastructure & Shared ServicesBeaverton, Oregon
Pamela M. CatlettVice President, North AmericaWomen’s TrainingBeaverton, Oregon
Michener ChandleeVice President & Chief Financial Offi cer, North AmericaBeaverton, Oregon
Craig R. CheekVice President & General ManagerGreater ChinaShanghai, China
Simon ClarkVice President, Western Europe SalesHilversum, The Netherlands
Thomas E. ClarkePresident, New Business DevelopmentBeaverton, Oregon
Dermott V. ClearyVice President, Global Category NSWBeaverton, Oregon
Christopher L. ClipperVice President,Global Planning & DevelopmentBeaverton, Oregon
Riccardo ColombiniVice President, Global Football & WesternEurope Sports MarketingBeaverton, Oregon
Bruce E. ConnellyVice President,Footwear Sport PerformanceBeaverton, Oregon
Steve ConroyVice President,Brand Human ResourcesBeaverton, Oregon
Andrea CorreaniVice President, Global FootwearBeaverton, Oregon
Diana J. CristVice President, Apparel Product CreationBeaverton, Oregon
Cynthia L. DavisVice President, President NIKE GolfBeaverton, Oregon
Shelley K. DeweyVice President, Category Project LeaderBeaverton, Oregon
Kenneth E. Dice IIIVice President, North America MarketingBeaverton, Oregon
Maria S. EitelPresident, NIKE FoundationBeaverton, Oregon
Davide GrassoVice President, Global Brand MarketingBeaverton, Oregon
Carl GrebertVice President & General Manager,NIKE JapanShinagawa, Tokyo
Clare HamillVice President, Commerce Affi liatesBeaverton, Oregon
Tinker L. Hatfi eldVice President, Creative DesignBeaverton, Oregon
Timothy J. HersheyVice President, North America RetailBeaverton, Oregon
Joaquin D. HidalgoVice President & General Manager,Emerging MarketsBeaverton, Oregon
Elliot J. HillVice President & General Manager,North AmericaBeaverton, Oregon
Gregory J. HoffmanVice President & Creative Director,Brand & CommunicationBeaverton, Oregon
John R. Hoke IIIVice President, Global DesignBeaverton, Oregon
Keith J. HoulemardPresident, Brand JordanBeaverton, Oregon
Hubertus HoytVice President, Global Category FootballBeaverton, Oregon
Peter A. HudsonVice President, Footwear DesignBeaverton, Oregon
Robert M. HurleyChairman, Hurley International LLCCosta Mesa, California
Jamie R. JeffriesVice President, North America NSWBeaverton, Oregon
Brad W. JohnsonVice President, North America MerchandisingBeaverton, Oregon
Daniel W. JonesVice President, North America BasketballBeaverton, Oregon
Hannah JonesVice President,Sustainable Business & InnovationBeaverton, Oregon
Tommy J. KainVice President, North AmericaSports MarketingBeaverton, Oregon
Chris KypriotisVice President & General ManagerNIKE BrazilBeaverton, Oregon
Jayme V. MartinVice President, Global Category RunningBeaverton, Oregon
Monique S. MathesonVice President, North America HRBeaverton, Oregon
David R. McTagueVice President & Chief Executive Offi cerCole HaanNew York, New York
Lynn A. MerrittVice President, Global Basketball SportsMarketingBeaverton, Oregon
John NotarVice President, Apparel Sports CategoriesBeaverton, Oregon
Stefan OlanderVice President, Digital SportBeaverton, Oregon
Heidi L. O’NeillVice President, Global Category Women’s TrainingBeaverton, Oregon
Roland H.M. PaanakkerVice President, Lean Business SolutionsBeaverton, Oregon
Thomas M. PeddieVice President, North America SalesBeaverton, Oregon
Bernard F. PliskaVice President, Corporate ControllerBeaverton, Oregon
Nigel A. PowellVice President, Global CommunicationsBeaverton, Oregon
Fiona ReekieVice President, Western EuropeMerchandisingHilversum, The Netherlands
Mark T. RileyVice President, North America Athletic TrainingBeaverton, Oregon
Gerry G. RogersVice President,Logistics & Geography OperationsHilversum, The Netherlands
Ernie A. RoseVice President,Manufacturing & SourcingBeaverton, Oregon
Brent J. ScrimshawVice President & General Manager,Western EuropeHilversum, The Netherlands
Joseph F. SerinoVice President, Apparel SportswearBeaverton, Oregon
Christiana S. ShiVice President, Chief Operating Offi cer Direct to ConsumerBeaverton, Oregon
Chris L. ShimojimaVice President, E-CommerceBeaverton, Oregon
Jan E. SingerVice President, Global ApparelBeaverton, Oregon
Michael SpillanePresident & Chief Executive Offi cerUmbro International LimitedCheadle, United Kingdom
Bert StevensVice President Operations, EuropeHilversum, The Netherlands
Michaela StitzVice President & General Manager,Central & Eastern EuropeHilversum, The Netherlands
Greg ThompsonVice President, Footwear SportswearBeaverton, Oregon
Dirk-Jean van HamerenVice President,Western Europe MarketingHilversum, The Netherlands
Dennis van OossanenVice President, Global MerchandisingHilversum, The Netherlands
Marc van PappelendamVice President & General Manager,UK & IrelandHilversum, The Netherlands
Gina A. WarrenVice President, Global Diversity & InclusionBeaverton, Oregon
Carol L. WelchVice President, Corporate AuditBeaverton, Oregon
Amy C. WhiteVice President, North America RunningBeaverton, Oregon
Howard L. WhiteVice President, Sports MarketingBrand JordanBeaverton, Oregon
Roland P. WolframVice President, Global SalesBeaverton, Oregon
Michael D. YonkerVice President, InnovationBeaverton, Oregon
Craig G. ZanonVice President, Global Category BasketballBeaverton, Oregon
Brian K. ZappitelloVice President, Global Merchandising SportswearBeaverton, Oregon
Patricia L. ZeedickVice President & General Manager,Young AthletesBeaverton, Oregon