Embed Size (px)
Citation preview

ANNUAL REPORT FOR 2013/14 FINANCIAL YEAR - VOTE 25: DEPARTMENT OF POLICE
SOUTH AFRICAN POLICE SERVICE 249
PART D:HUMAN RESOURCE MANAGEMENT
ANNUAL REPORT FOR 2013/14 FINANCIAL YEAR - VOTE 25: DEPARTMENT OF POLICE
SOUTH AFRICAN POLICE SERVICE250
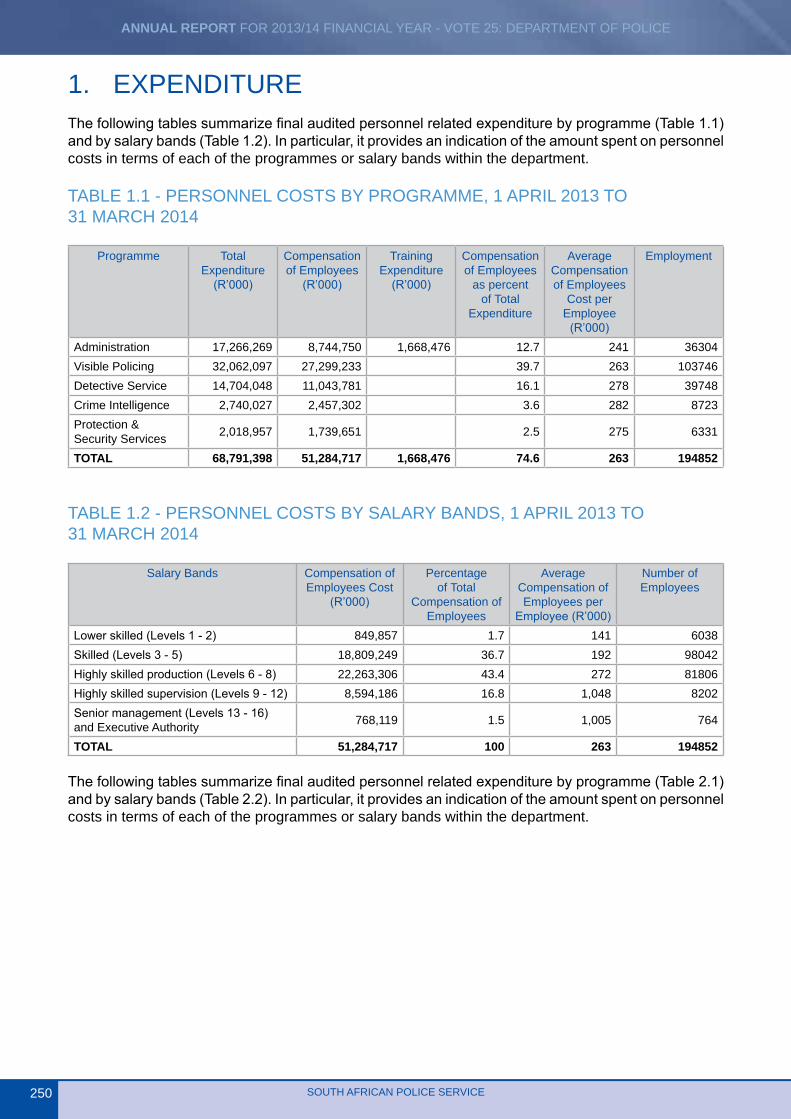
1. EXPENDITUREThe following tables summarize final audited personnel related expenditure by programme (Table 1.1) and by salary bands (Table 1.2). In particular, it provides an indication of the amount spent on personnel costs in terms of each of the programmes or salary bands within the department.
TABLE 1.1 - PERSONNEL COSTS BY PROGRAMME, 1 APRIL 2013 TO 31 MARCH 2014
Programme Total Expenditure
(R’000)
Compensation of Employees
(R’000)
Training Expenditure
(R’000)
Compensation of Employees
as percent of Total
Expenditure
Average Compensation of Employees
Cost per Employee
(R’000)
Employment
Administration 17,266,269 8,744,750 1,668,476 12.7 241 36304Visible Policing 32,062,097 27,299,233 39.7 263 103746Detective Service 14,704,048 11,043,781 16.1 278 39748Crime Intelligence 2,740,027 2,457,302 3.6 282 8723Protection & Security Services 2,018,957 1,739,651 2.5 275 6331
TOTAL 68,791,398 51,284,717 1,668,476 74.6 263 194852
TABLE 1.2 - PERSONNEL COSTS BY SALARY BANDS, 1 APRIL 2013 TO 31 MARCH 2014
Salary Bands Compensation of Employees Cost
(R’000)
Percentage of Total
Compensation of Employees
Average Compensation of Employees per
Employee (R’000)
Number of Employees
Lower skilled (Levels 1 - 2) 849,857 1.7 141 6038Skilled (Levels 3 - 5) 18,809,249 36.7 192 98042Highly skilled production (Levels 6 - 8) 22,263,306 43.4 272 81806Highly skilled supervision (Levels 9 - 12) 8,594,186 16.8 1,048 8202Senior management (Levels 13 - 16) and Executive Authority 768,119 1.5 1,005 764
TOTAL 51,284,717 100 263 194852
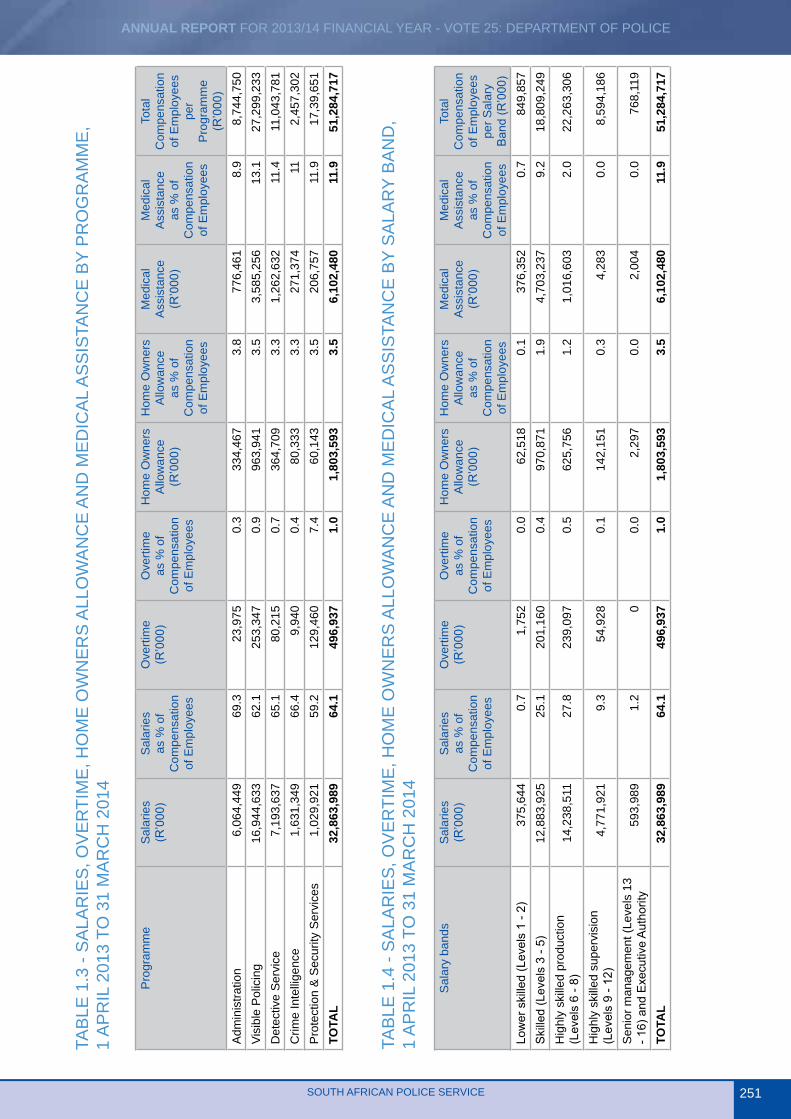
The following tables summarize final audited personnel related expenditure by programme (Table 2.1) and by salary bands (Table 2.2). In particular, it provides an indication of the amount spent on personnel costs in terms of each of the programmes or salary bands within the department.
ANNUAL REPORT FOR 2013/14 FINANCIAL YEAR - VOTE 25: DEPARTMENT OF POLICE
SOUTH AFRICAN POLICE SERVICE 251
TAB
LE 1
.3 -
SA
LAR
IES
, OV
ER
TIM
E, H
OM
E O
WN
ER
S A
LLO
WA
NC
E A
ND
ME
DIC
AL
AS
SIS
TAN
CE
BY
PR
OG
RA
MM
E,
1 A
PR
IL 2
013
TO 3
1 M
AR
CH
201
4
Pro
gram
me
Sal
arie
s (R
’000
)S
alar
ies
as %
of
Com
pens
atio
n of
Em
ploy
ees
Ove
rtim
e (R
’000
)O
verti
me
as %
of
Com
pens
atio
n of
Em
ploy
ees
Hom
e O
wne
rs
Allo
wan
ce
(R’0
00)
Hom
e O
wne
rs
Allo
wan
ce
as %
of
Com
pens
atio
n of
Em
ploy
ees
Med
ical
A
ssis
tanc
e (R
’000
)
Med
ical
A
ssis
tanc
e as
% o
f C
ompe
nsat
ion
of E
mpl
oyee
s
Tota
l C
ompe
nsat
ion
of E
mpl
oyee
s pe
r P
rogr
amm
e (R
’000
)A
dmin
istra
tion
6,0
64,4
49
69.3
23,
975
0.3
334
,467
3.
8 7
76,4
61
8.9
8,74
4,75
0Vi
sibl
e P
olic
ing
16,
944,
633
62.1
253
,347
0.
9 9
63,9
41
3.5
3,5
85,2
56
13.1
27,2
99,2
33D
etec
tive
Ser
vice
7
,193
,637
65
.1 8
0,21
5 0.
7 3
64,7
09
3.3
1,2
62,6
32
11.4
11,0
43,7
81C
rime
Inte
llige
nce
1,6
31,3
49
66.4
9,9
40
0.4
80,
333
3.3
271
,374
11
2,45
7,30
2P
rote
ctio
n &
Sec
urity
Ser
vice
s 1
,029
,921
59
.2 1
29,4
60
7.4
60,
143
3.5
206
,757
11
.917
,39,
651
TOTA
L32
,863
,989
64.1
496,
937
1.0
1,80
3,59
33.
56,
102,
480
11.9
51,2
84,7
17
TAB
LE 1
.4 -
SA
LAR
IES
, OV
ER
TIM
E, H
OM
E O
WN
ER
S A
LLO
WA
NC
E A
ND
ME
DIC
AL
AS
SIS
TAN
CE
BY
SA
LAR
Y B
AN
D,
1 A
PR
IL 2
013
TO 3
1 M
AR
CH
201
4
Sal
ary
band
sS
alar
ies
(R’0
00)
Sal
arie
s as
% o
f C
ompe
nsat
ion
of E
mpl
oyee
s
Ove
rtim
e (R
’000
)O
verti
me
as %
of
Com
pens
atio
n of
Em
ploy
ees
Hom
e O
wne
rs
Allo
wan
ce
(R’0
00)
Hom
e O
wne
rs
Allo
wan
ce
as %
of
Com
pens
atio
n of
Em
ploy
ees
Med
ical
A
ssis
tanc
e (R
’000
)
Med
ical
A
ssis
tanc
e as
% o
f C
ompe
nsat
ion
of E
mpl
oyee
s
Tota
l C
ompe
nsat
ion
of E
mpl
oyee
s pe
r Sal
ary
Ban
d (R
’000
)Lo
wer
ski
lled
(Lev
els
1 - 2
) 37
5,64
40.
71,
752
0.0
62,5
180.
137
6,35
20.
784
9,85
7S
kille
d (L
evel
s 3
- 5)
12,8
83,9
2525
.120
1,16
00.
497
0,87
11.
94,
703,
237
9.2
18,8
09,2
49H
ighl
y sk
illed
pro
duct
ion
(Lev
els
6 - 8
) 14
,238
,511
27.8
239,
097
0.5
625,
756
1.2
1,01
6,60
32.
022
,263
,306
Hig
hly
skill
ed s
uper
visi
on
(Lev
els
9 - 1
2)
4,77
1,92
19.
354
,928
0.1
142,
151
0.3
4,28
30.
08,
594,
186
Sen
ior m
anag
emen
t (Le
vels
13
- 16)
and
Exe
cutiv
e A
utho
rity
593,
989
1.2
00.
02,
297
0.0
2,00
40.
076
8,11
9
TOTA
L32
,863
,989
64.1
496,
937
1.0
1,80
3,59
33.
56,
102,
480
11.9
51,2
84,7
17
ANNUAL REPORT FOR 2013/14 FINANCIAL YEAR - VOTE 25: DEPARTMENT OF POLICE
SOUTH AFRICAN POLICE SERVICE252
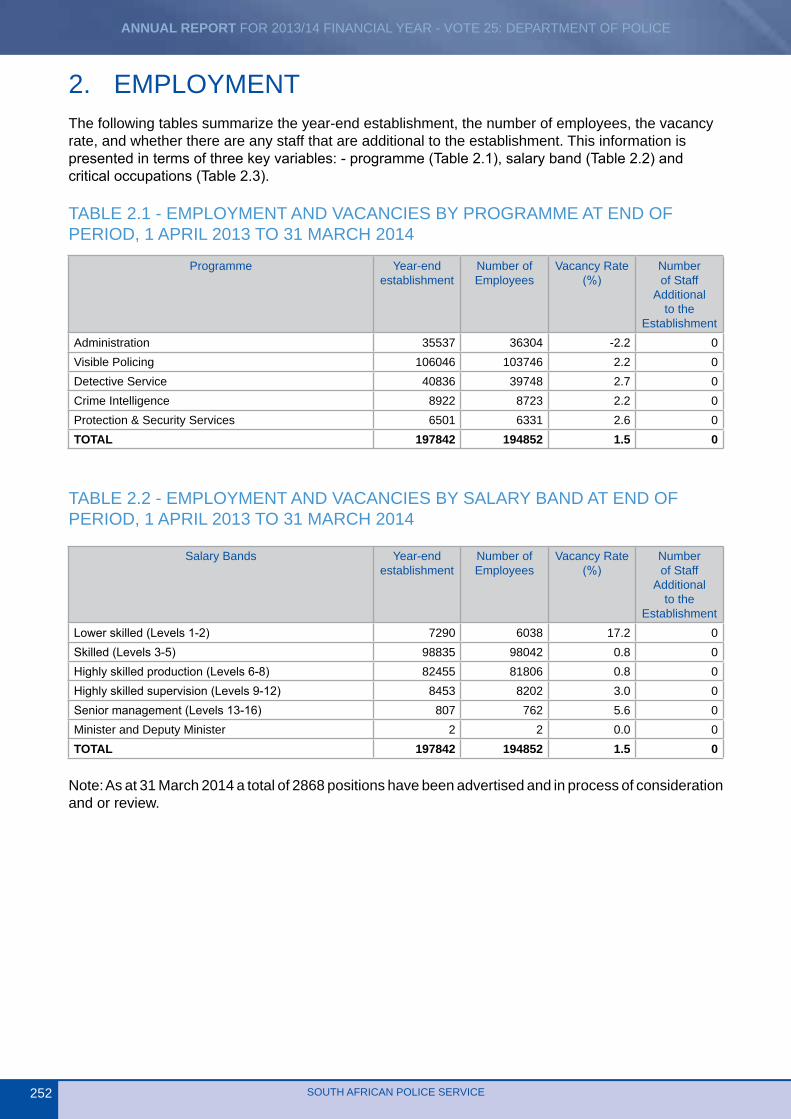
2. EMPLOYMENTThe following tables summarize the year-end establishment, the number of employees, the vacancy rate, and whether there are any staff that are additional to the establishment. This information is presented in terms of three key variables: - programme (Table 2.1), salary band (Table 2.2) and critical occupations (Table 2.3).
TABLE 2.1 - EMPLOYMENT AND VACANCIES BY PROGRAMME AT END OF PERIOD, 1 APRIL 2013 TO 31 MARCH 2014
Programme Year-end establishment
Number of Employees
Vacancy Rate (%)
Number of Staff
Additional to the
EstablishmentAdministration 35537 36304 -2.2 0Visible Policing 106046 103746 2.2 0Detective Service 40836 39748 2.7 0Crime Intelligence 8922 8723 2.2 0Protection & Security Services 6501 6331 2.6 0TOTAL 197842 194852 1.5 0
TABLE 2.2 - EMPLOYMENT AND VACANCIES BY SALARY BAND AT END OF PERIOD, 1 APRIL 2013 TO 31 MARCH 2014
Salary Bands Year-end establishment
Number of Employees
Vacancy Rate (%)
Number of Staff
Additional to the
EstablishmentLower skilled (Levels 1-2) 7290 6038 17.2 0Skilled (Levels 3-5) 98835 98042 0.8 0Highly skilled production (Levels 6-8) 82455 81806 0.8 0Highly skilled supervision (Levels 9-12) 8453 8202 3.0 0Senior management (Levels 13-16) 807 762 5.6 0Minister and Deputy Minister 2 2 0.0 0TOTAL 197842 194852 1.5 0
Note: As at 31 March 2014 a total of 2868 positions have been advertised and in process of consideration and or review.
ANNUAL REPORT FOR 2013/14 FINANCIAL YEAR - VOTE 25: DEPARTMENT OF POLICE
SOUTH AFRICAN POLICE SERVICE 253
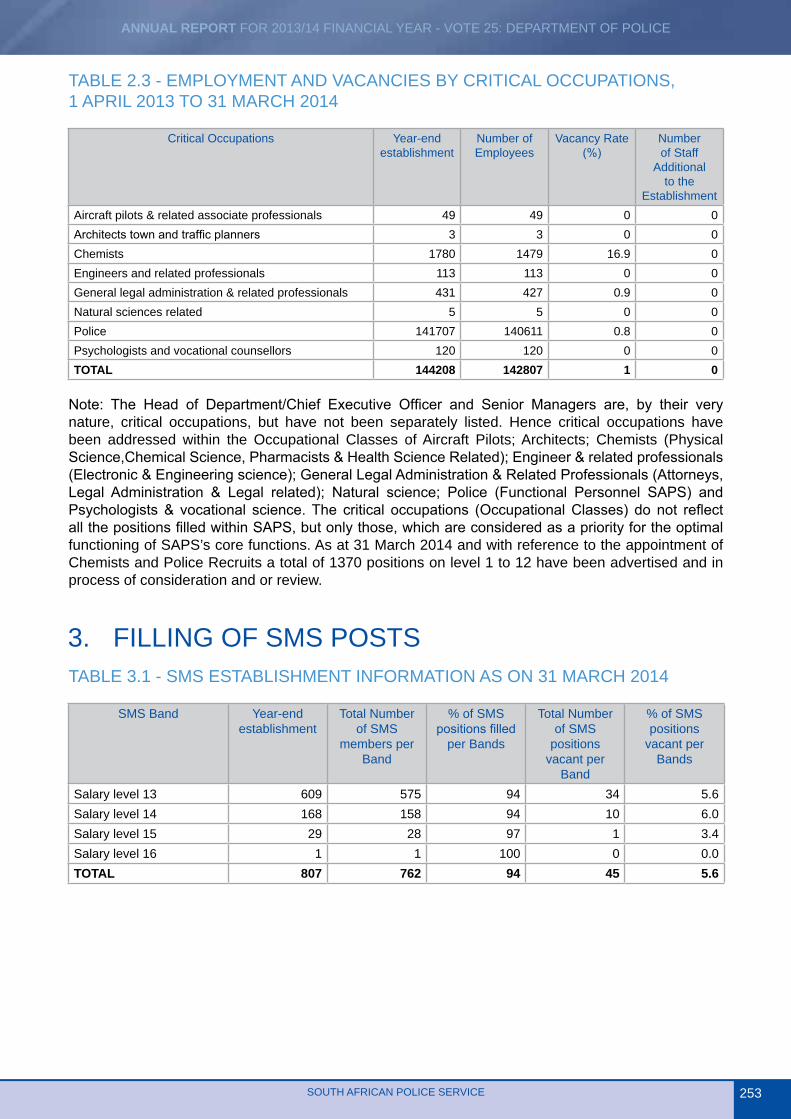
TABLE 2.3 - EMPLOYMENT AND VACANCIES BY CRITICAL OCCUPATIONS, 1 APRIL 2013 TO 31 MARCH 2014
Critical Occupations Year-end establishment
Number of Employees
Vacancy Rate (%)
Number of Staff
Additional to the
EstablishmentAircraft pilots & related associate professionals 49 49 0 0Architects town and traffic planners 3 3 0 0Chemists 1780 1479 16.9 0Engineers and related professionals 113 113 0 0General legal administration & related professionals 431 427 0.9 0Natural sciences related 5 5 0 0Police 141707 140611 0.8 0Psychologists and vocational counsellors 120 120 0 0TOTAL 144208 142807 1 0
Note: The Head of Department/Chief Executive Officer and Senior Managers are, by their very nature, critical occupations, but have not been separately listed. Hence critical occupations have been addressed within the Occupational Classes of Aircraft Pilots; Architects; Chemists (Physical Science,Chemical Science, Pharmacists & Health Science Related); Engineer & related professionals (Electronic & Engineering science); General Legal Administration & Related Professionals (Attorneys, Legal Administration & Legal related); Natural science; Police (Functional Personnel SAPS) and Psychologists & vocational science. The critical occupations (Occupational Classes) do not reflect all the positions filled within SAPS, but only those, which are considered as a priority for the optimal functioning of SAPS’s core functions. As at 31 March 2014 and with reference to the appointment of Chemists and Police Recruits a total of 1370 positions on level 1 to 12 have been advertised and in process of consideration and or review.
3. FILLING OF SMS POSTSTABLE 3.1 - SMS ESTABLISHMENT INFORMATION AS ON 31 MARCH 2014
SMS Band Year-end establishment
Total Number of SMS
members per Band
% of SMS positions filled
per Bands
Total Number of SMS
positions vacant per
Band
% of SMS positions
vacant per Bands
Salary level 13 609 575 94 34 5.6Salary level 14 168 158 94 10 6.0Salary level 15 29 28 97 1 3.4Salary level 16 1 1 100 0 0.0TOTAL 807 762 94 45 5.6
ANNUAL REPORT FOR 2013/14 FINANCIAL YEAR - VOTE 25: DEPARTMENT OF POLICE
SOUTH AFRICAN POLICE SERVICE254
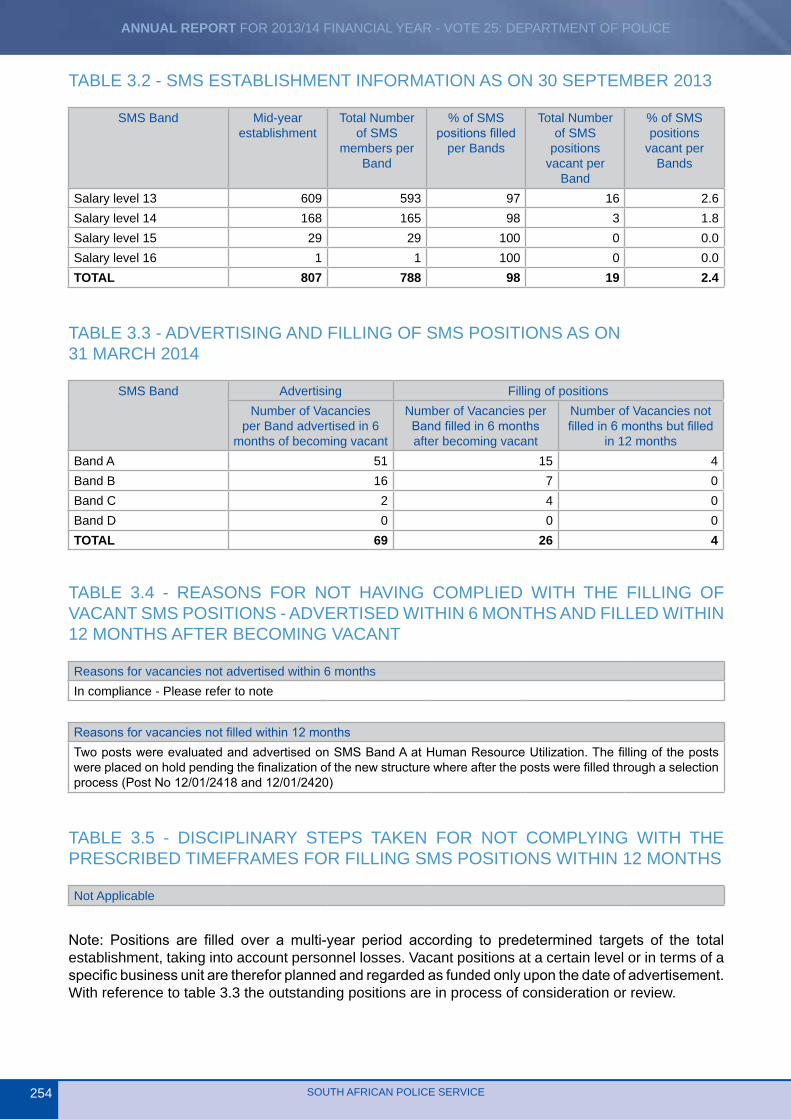
TABLE 3.2 - SMS ESTABLISHMENT INFORMATION AS ON 30 SEPTEMBER 2013
SMS Band Mid-year establishment
Total Number of SMS
members per Band
% of SMS positions filled
per Bands
Total Number of SMS
positions vacant per
Band
% of SMS positions
vacant per Bands
Salary level 13 609 593 97 16 2.6Salary level 14 168 165 98 3 1.8Salary level 15 29 29 100 0 0.0Salary level 16 1 1 100 0 0.0TOTAL 807 788 98 19 2.4
TABLE 3.3 - ADVERTISING AND FILLING OF SMS POSITIONS AS ON 31 MARCH 2014
SMS Band Advertising Filling of positionsNumber of Vacancies
per Band advertised in 6 months of becoming vacant
Number of Vacancies per Band filled in 6 months after becoming vacant
Number of Vacancies not filled in 6 months but filled
in 12 months Band A 51 15 4Band B 16 7 0Band C 2 4 0Band D 0 0 0TOTAL 69 26 4
TABLE 3.4 - REASONS FOR NOT HAVING COMPLIED WITH THE FILLING OF VACANT SMS POSITIONS - ADVERTISED WITHIN 6 MONTHS AND FILLED WITHIN 12 MONTHS AFTER BECOMING VACANT
Reasons for vacancies not advertised within 6 monthsIn compliance - Please refer to note
Reasons for vacancies not filled within 12 monthsTwo posts were evaluated and advertised on SMS Band A at Human Resource Utilization. The filling of the posts were placed on hold pending the finalization of the new structure where after the posts were filled through a selection process (Post No 12/01/2418 and 12/01/2420)
TABLE 3.5 - DISCIPLINARY STEPS TAKEN FOR NOT COMPLYING WITH THE PRESCRIBED TIMEFRAMES FOR FILLING SMS POSITIONS WITHIN 12 MONTHS
Not Applicable
Note: Positions are filled over a multi-year period according to predetermined targets of the total establishment, taking into account personnel losses. Vacant positions at a certain level or in terms of a specific business unit are therefor planned and regarded as funded only upon the date of advertisement. With reference to table 3.3 the outstanding positions are in process of consideration or review.
ANNUAL REPORT FOR 2013/14 FINANCIAL YEAR - VOTE 25: DEPARTMENT OF POLICE
SOUTH AFRICAN POLICE SERVICE 255
4.
JOB
EVA
LUAT
ION
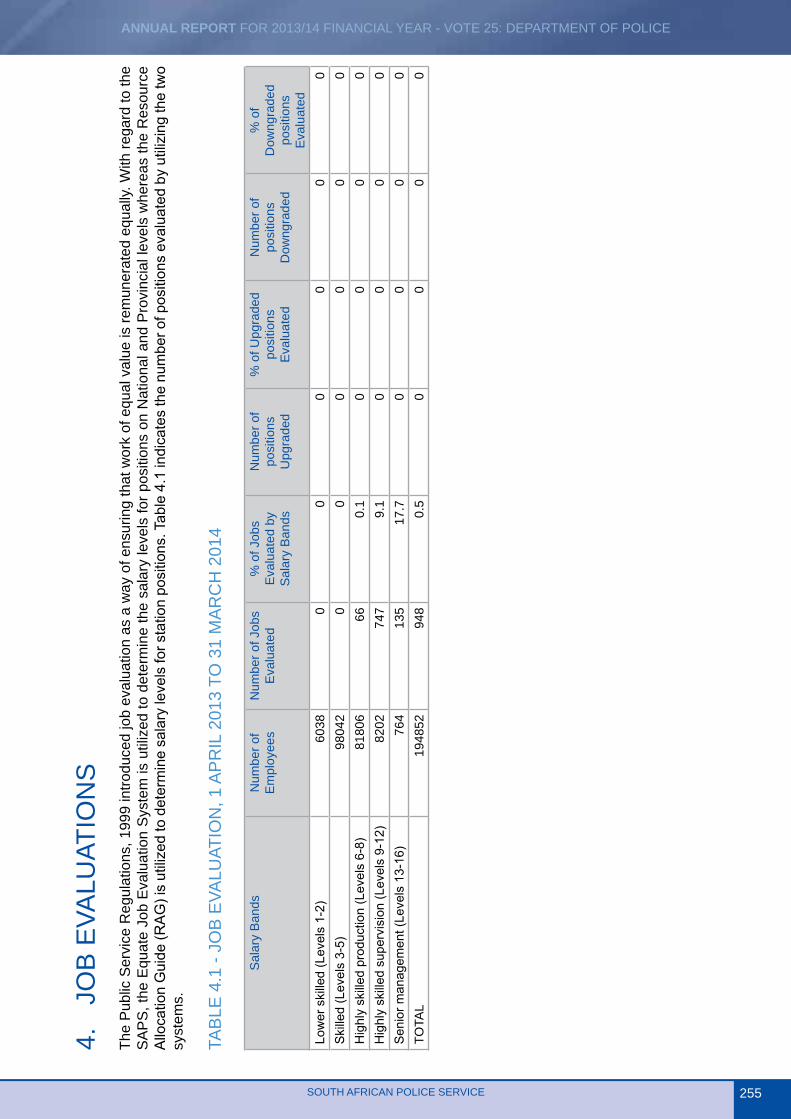
STh
e P
ublic
Ser
vice
Reg
ulat
ions
, 199
9 in
trodu
ced
job
eval
uatio
n as
a w
ay o
f ens
urin
g th
at w
ork
of e
qual
val
ue is
rem
uner
ated
equ
ally.
With
rega
rd to
the
SA
PS
, the
Equ
ate
Job
Eva
luat
ion
Sys
tem
is u
tiliz
ed to
det
erm
ine
the
sala
ry le
vels
for p
ositi
ons
on N
atio
nal a
nd P
rovi
ncia
l lev
els
whe
reas
the
Res
ourc
e A
lloca
tion
Gui
de (R
AG
) is
utili
zed
to d
eter
min
e sa
lary
leve
ls fo
r sta
tion
posi
tions
. Tab
le 4
.1 in
dica
tes
the
num
ber o
f pos
ition
s ev
alua
ted
by u
tiliz
ing
the
two
syst
ems.
TAB
LE 4
.1 -
JOB
EVA
LUAT
ION
, 1 A
PR
IL 2
013
TO 3
1 M
AR
CH
201
4
Sal
ary
Ban
dsN
umbe
r of
Em
ploy
ees
Num
ber o
f Job
s E
valu
ated
% o
f Job
s E
valu
ated
by
Sal
ary
Ban
ds
Num
ber o
f po
sitio
ns
Upg
rade
d
% o
f Upg
rade
d po
sitio
ns
Eva
luat
ed
Num
ber o
f po
sitio
ns
Dow
ngra
ded
% o
f D
owng
rade
d po
sitio
ns
Eva
luat
edLo
wer
ski
lled
(Lev
els
1-2)
6038
00
00
00
Ski
lled
(Lev
els
3-5)
9804
20
00
00
0H
ighl
y sk
illed
pro
duct
ion
(Lev
els
6-8)
81
806
660.
10
00
0H
ighl
y sk
illed
sup
ervi
sion
(Lev
els
9-12
)82
0274
79.
10
00
0S
enio
r man
agem
ent (
Leve
ls 1
3-16
)76
413
517
.70
00
0TO
TAL
1948
5294
80.
50
00
0
ANNUAL REPORT FOR 2013/14 FINANCIAL YEAR - VOTE 25: DEPARTMENT OF POLICE
SOUTH AFRICAN POLICE SERVICE256
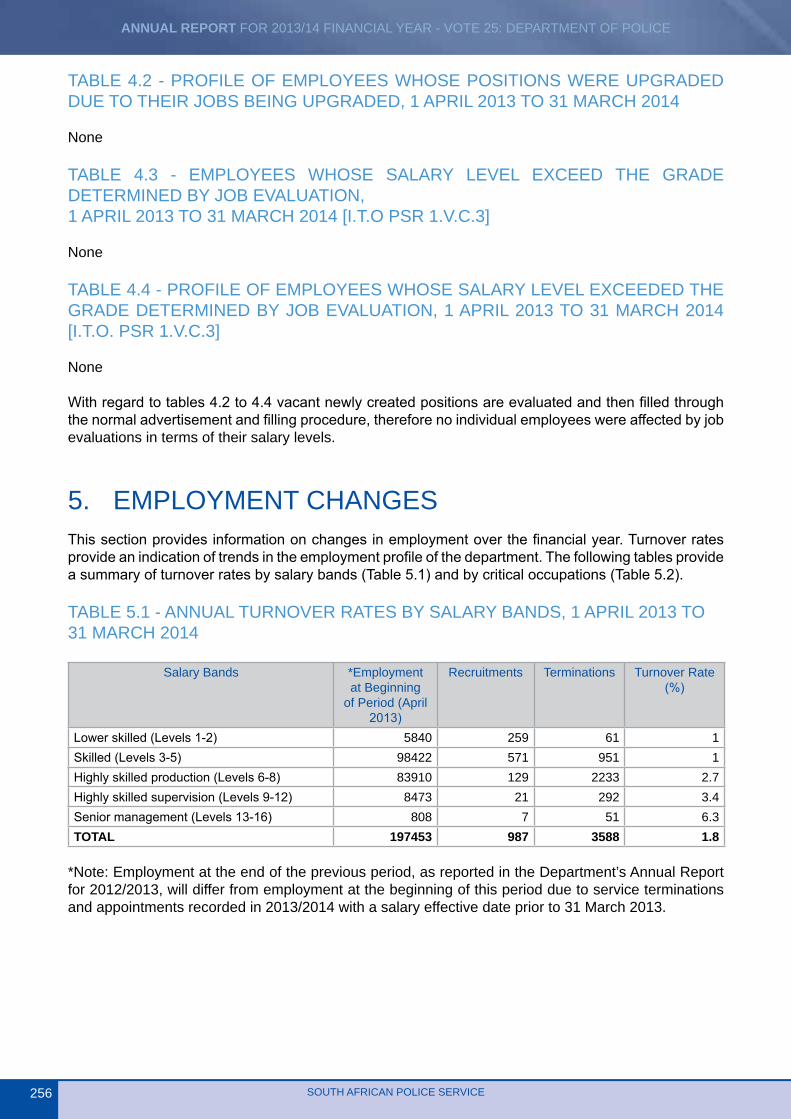
TABLE 4.2 - PROFILE OF EMPLOYEES WHOSE POSITIONS WERE UPGRADED DUE TO THEIR JOBS BEING UPGRADED, 1 APRIL 2013 TO 31 MARCH 2014
None
TABLE 4.3 - EMPLOYEES WHOSE SALARY LEVEL EXCEED THE GRADE DETERMINED BY JOB EVALUATION, 1 APRIL 2013 TO 31 MARCH 2014 [I.T.O PSR 1.V.C.3]
None
TABLE 4.4 - PROFILE OF EMPLOYEES WHOSE SALARY LEVEL EXCEEDED THE GRADE DETERMINED BY JOB EVALUATION, 1 APRIL 2013 TO 31 MARCH 2014 [I.T.O. PSR 1.V.C.3]
None
With regard to tables 4.2 to 4.4 vacant newly created positions are evaluated and then filled through the normal advertisement and filling procedure, therefore no individual employees were affected by job evaluations in terms of their salary levels.
5. EMPLOYMENT CHANGESThis section provides information on changes in employment over the financial year. Turnover rates provide an indication of trends in the employment profile of the department. The following tables provide a summary of turnover rates by salary bands (Table 5.1) and by critical occupations (Table 5.2).
TABLE 5.1 - ANNUAL TURNOVER RATES BY SALARY BANDS, 1 APRIL 2013 TO 31 MARCH 2014
Salary Bands *Employment at Beginning
of Period (April 2013)
Recruitments Terminations Turnover Rate (%)
Lower skilled (Levels 1-2) 5840 259 61 1Skilled (Levels 3-5) 98422 571 951 1Highly skilled production (Levels 6-8) 83910 129 2233 2.7Highly skilled supervision (Levels 9-12) 8473 21 292 3.4Senior management (Levels 13-16) 808 7 51 6.3TOTAL 197453 987 3588 1.8
*Note: Employment at the end of the previous period, as reported in the Department’s Annual Report for 2012/2013, will differ from employment at the beginning of this period due to service terminations and appointments recorded in 2013/2014 with a salary effective date prior to 31 March 2013.
ANNUAL REPORT FOR 2013/14 FINANCIAL YEAR - VOTE 25: DEPARTMENT OF POLICE
SOUTH AFRICAN POLICE SERVICE 257
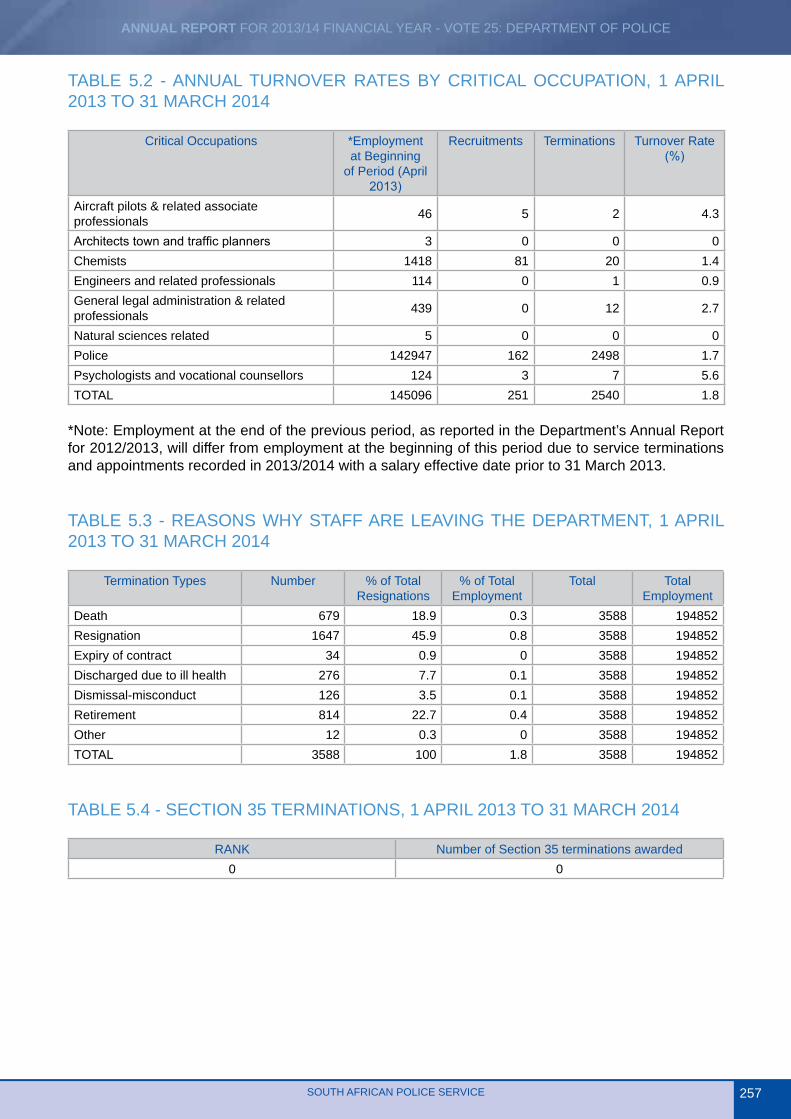
TABLE 5.2 - ANNUAL TURNOVER RATES BY CRITICAL OCCUPATION, 1 APRIL 2013 TO 31 MARCH 2014
Critical Occupations *Employment at Beginning
of Period (April 2013)
Recruitments Terminations Turnover Rate (%)
Aircraft pilots & related associate professionals 46 5 2 4.3
Architects town and traffic planners 3 0 0 0Chemists 1418 81 20 1.4Engineers and related professionals 114 0 1 0.9General legal administration & related professionals 439 0 12 2.7
Natural sciences related 5 0 0 0Police 142947 162 2498 1.7Psychologists and vocational counsellors 124 3 7 5.6TOTAL 145096 251 2540 1.8
*Note: Employment at the end of the previous period, as reported in the Department’s Annual Report for 2012/2013, will differ from employment at the beginning of this period due to service terminations and appointments recorded in 2013/2014 with a salary effective date prior to 31 March 2013.
TABLE 5.3 - REASONS WHY STAFF ARE LEAVING THE DEPARTMENT, 1 APRIL 2013 TO 31 MARCH 2014
Termination Types Number % of Total Resignations
% of Total Employment
Total Total Employment
Death 679 18.9 0.3 3588 194852Resignation 1647 45.9 0.8 3588 194852Expiry of contract 34 0.9 0 3588 194852Discharged due to ill health 276 7.7 0.1 3588 194852Dismissal-misconduct 126 3.5 0.1 3588 194852Retirement 814 22.7 0.4 3588 194852Other 12 0.3 0 3588 194852TOTAL 3588 100 1.8 3588 194852
TABLE 5.4 - SECTION 35 TERMINATIONS, 1 APRIL 2013 TO 31 MARCH 2014
RANK Number of Section 35 terminations awarded0 0
ANNUAL REPORT FOR 2013/14 FINANCIAL YEAR - VOTE 25: DEPARTMENT OF POLICE
SOUTH AFRICAN POLICE SERVICE258
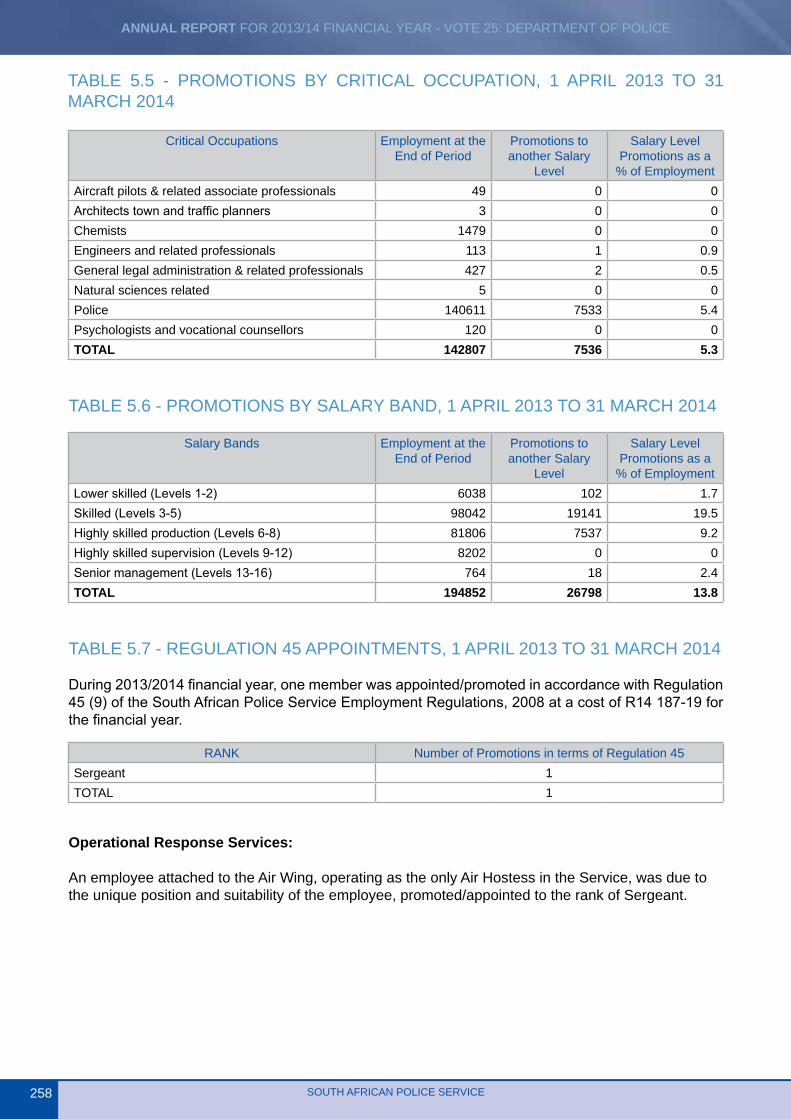
TABLE 5.5 - PROMOTIONS BY CRITICAL OCCUPATION, 1 APRIL 2013 TO 31 MARCH 2014
Critical Occupations Employment at the End of Period
Promotions to another Salary
Level
Salary Level Promotions as a
% of EmploymentAircraft pilots & related associate professionals 49 0 0Architects town and traffic planners 3 0 0Chemists 1479 0 0Engineers and related professionals 113 1 0.9General legal administration & related professionals 427 2 0.5Natural sciences related 5 0 0Police 140611 7533 5.4Psychologists and vocational counsellors 120 0 0TOTAL 142807 7536 5.3
TABLE 5.6 - PROMOTIONS BY SALARY BAND, 1 APRIL 2013 TO 31 MARCH 2014
Salary Bands Employment at the End of Period
Promotions to another Salary
Level
Salary Level Promotions as a
% of EmploymentLower skilled (Levels 1-2) 6038 102 1.7Skilled (Levels 3-5) 98042 19141 19.5Highly skilled production (Levels 6-8) 81806 7537 9.2Highly skilled supervision (Levels 9-12) 8202 0 0Senior management (Levels 13-16) 764 18 2.4TOTAL 194852 26798 13.8
TABLE 5.7 - REGULATION 45 APPOINTMENTS, 1 APRIL 2013 TO 31 MARCH 2014
During 2013/2014 financial year, one member was appointed/promoted in accordance with Regulation 45 (9) of the South African Police Service Employment Regulations, 2008 at a cost of R14 187-19 for the financial year.
RANK Number of Promotions in terms of Regulation 45Sergeant 1TOTAL 1
Operational Response Services: An employee attached to the Air Wing, operating as the only Air Hostess in the Service, was due to the unique position and suitability of the employee, promoted/appointed to the rank of Sergeant.
ANNUAL REPORT FOR 2013/14 FINANCIAL YEAR - VOTE 25: DEPARTMENT OF POLICE
SOUTH AFRICAN POLICE SERVICE 259
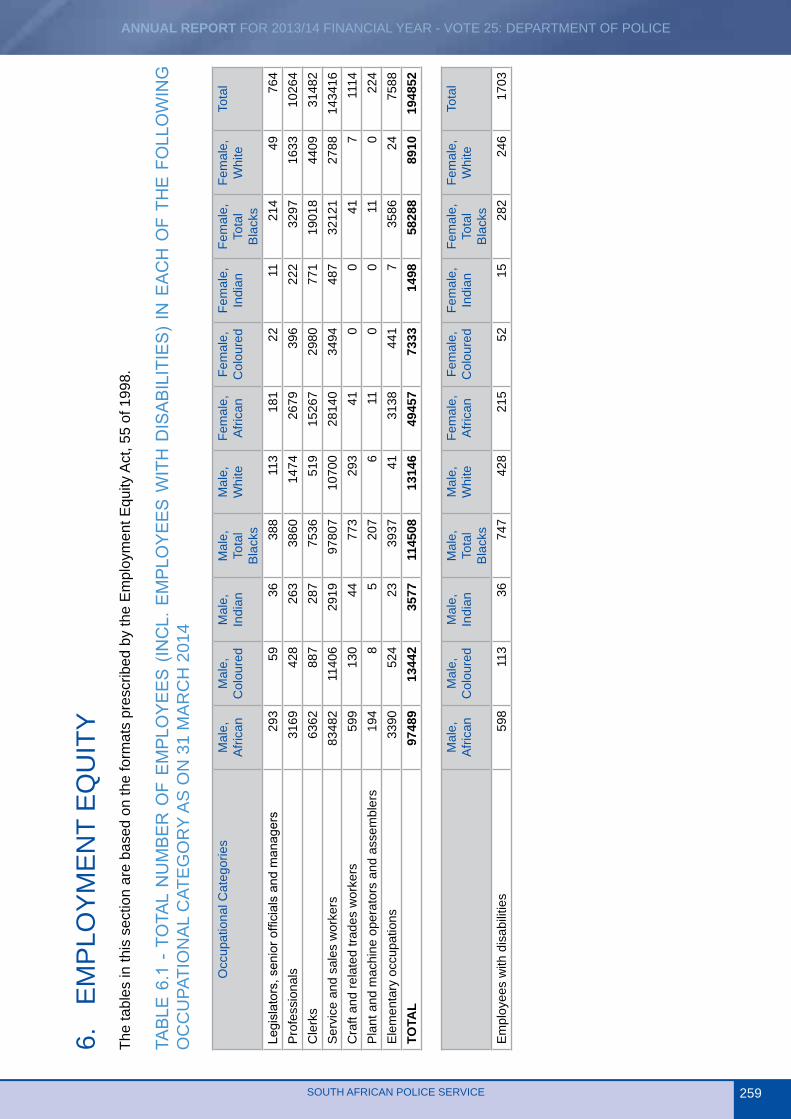
6.
EM
PLO
YM
EN
T E
QU
ITY
The
tabl
es in
this
sec
tion
are
base
d on
the
form
ats
pres
crib
ed b
y th
e E
mpl
oym
ent E
quity
Act
, 55
of 1
998.
TAB
LE 6
.1 -
TO
TAL
NU
MB
ER
OF
EM
PLO
yE
ES
(IN
CL.
EM
PLO
yE
ES
WIT
H D
ISA
BIL
ITIE
S)
IN E
AC
H O
F TH
E F
OLL
OW
ING
O
CC
UPA
TIO
NA
L C
ATE
GO
RY
AS
ON
31
MA
RC
H 2
014
Occ
upat
iona
l Cat
egor
ies
Mal
e,
Afri
can
Mal
e,
Col
oure
dM
ale,
In
dian
Mal
e,
Tota
l B
lack
s
Mal
e,
Whi
teFe
mal
e,
Afri
can
Fem
ale,
C
olou
red
Fem
ale,
In
dian
Fem
ale,
To
tal
Bla
cks
Fem
ale,
W
hite
Tota
l
Legi
slat
ors,
sen
ior o
ffici
als
and
man
ager
s29
359
3638
811
318
122
1121
449
764
Pro
fess
iona
ls
3169
428
263
3860
1474
2679
396
222
3297
1633
1026
4C
lerk
s 63
6288
728
775
3651
915
267
2980
771
1901
844
0931
482
Ser
vice
and
sal
es w
orke
rs83
482
1140
629
1997
807
1070
028
140
3494
487
3212
127
8814
3416
Cra
ft an
d re
late
d tra
des
wor
kers
59
913
044
773
293
410
041
711
14P
lant
and
mac
hine
ope
rato
rs a
nd a
ssem
bler
s 19
48
520
76
110
011
022
4E
lem
enta
ry o
ccup
atio
ns
3390
524
2339
3741
3138
441
735
8624
7588
TOTA
L97
489
1344
235
7711
4508
1314
649
457
7333
1498
5828
889
1019
4852
Mal
e,
Afri
can
Mal
e,
Col
oure
dM
ale,
In
dian
Mal
e,
Tota
l B
lack
s
Mal
e,
Whi
teFe
mal
e,
Afri
can
Fem
ale,
C
olou
red
Fem
ale,
In
dian
Fem
ale,
To
tal
Bla
cks
Fem
ale,
W
hite
Tota
l
Em
ploy
ees
with
dis
abili
ties
598
113
3674
742
821
552
1528
224
617
03
ANNUAL REPORT FOR 2013/14 FINANCIAL YEAR - VOTE 25: DEPARTMENT OF POLICE
SOUTH AFRICAN POLICE SERVICE260
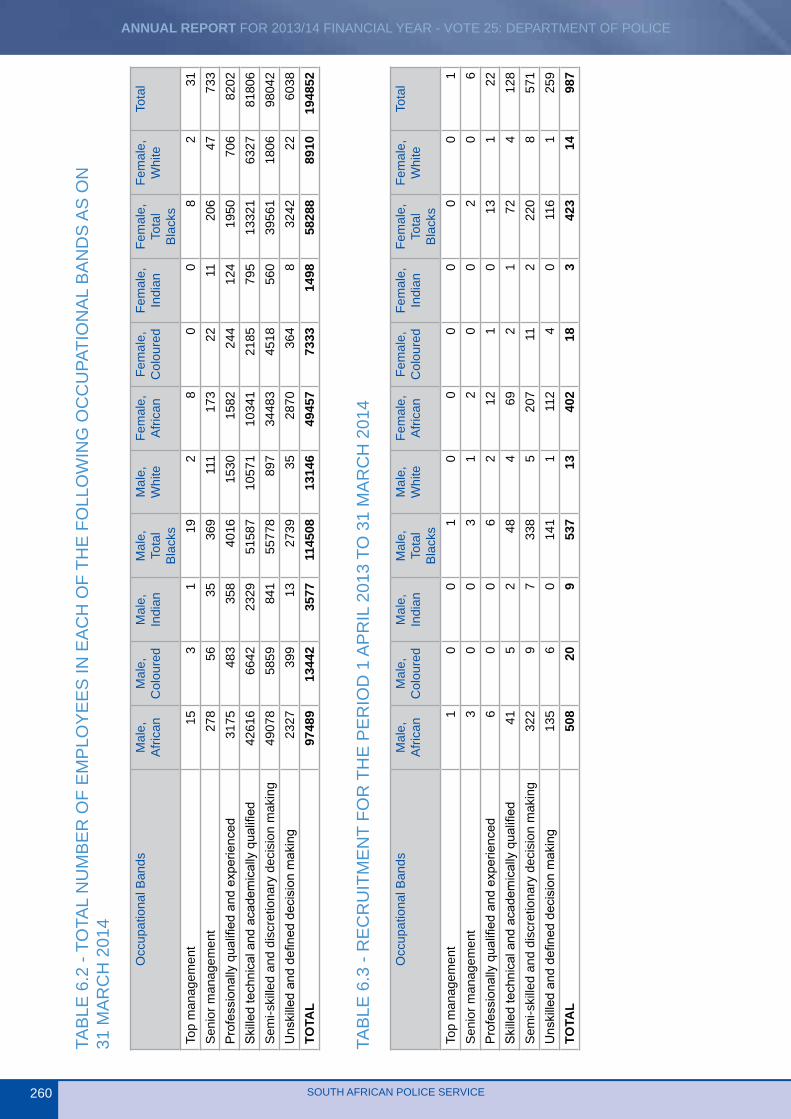
TAB
LE 6
.2 -
TOTA
L N
UM
BE
R O
F E
MP
LOY
EE
S IN
EA
CH
OF
THE
FO
LLO
WIN
G O
CC
UPA
TIO
NA
L B
AN
DS
AS
ON
31
MA
RC
H 2
014
Occ
upat
iona
l Ban
dsM
ale,
A
frica
nM
ale,
C
olou
red
Mal
e,
Indi
anM
ale,
To
tal
Bla
cks
Mal
e,
Whi
teFe
mal
e,
Afri
can
Fem
ale,
C
olou
red
Fem
ale,
In
dian
Fem
ale,
To
tal
Bla
cks
Fem
ale,
W
hite
Tota
l
Top
man
agem
ent
153
119
28
00
82
31S
enio
r man
agem
ent
278
5635
369
111
173
2211
206
4773
3P
rofe
ssio
nally
qua
lified
and
exp
erie
nced
3175
483
358
4016
1530
1582
244
124
1950
706
8202
Ski
lled
tech
nica
l and
aca
dem
ical
ly q
ualifi
ed42
616
6642
2329
5158
710
571
1034
121
8579
513
321
6327
8180
6S
emi-s
kille
d an
d di
scre
tiona
ry d
ecis
ion
mak
ing
4907
858
5984
155
778
897
3448
345
1856
039
561
1806
9804
2U
nski
lled
and
defin
ed d
ecis
ion
mak
ing
2327
399
1327
3935
2870
364
832
4222
6038
TOTA
L97
489
1344
235
7711
4508
1314
649
457
7333
1498
5828
889
1019
4852
TAB
LE 6
.3 -
RE
CR
UIT
ME
NT
FOR
TH
E P
ER
IOD
1 A
PR
IL 2
013
TO 3
1 M
AR
CH
201
4
Occ
upat
iona
l Ban
dsM
ale,
A
frica
nM
ale,
C
olou
red
Mal
e,
Indi
anM
ale,
To
tal
Bla
cks
Mal
e,
Whi
teFe
mal
e,
Afri
can
Fem
ale,
C
olou
red
Fem
ale,
In
dian
Fem
ale,
To
tal
Bla
cks
Fem
ale,
W
hite
Tota
l
Top
man
agem
ent
10
01
00
00
00
1S
enio
r man
agem
ent
30
03
12
00
20
6P
rofe
ssio
nally
qua
lified
and
exp
erie
nced
60
06
212
10
131
22S
kille
d te
chni
cal a
nd a
cade
mic
ally
qua
lified
415
248
469
21
724
128
Sem
i-ski
lled
and
disc
retio
nary
dec
isio
n m
akin
g32
29
733
85
207
112
220
857
1U
nski
lled
and
defin
ed d
ecis
ion
mak
ing
135
60
141
111
24
011
61
259
TOTA
L50
820
953
713
402
183
423
1498
7
ANNUAL REPORT FOR 2013/14 FINANCIAL YEAR - VOTE 25: DEPARTMENT OF POLICE
SOUTH AFRICAN POLICE SERVICE 261
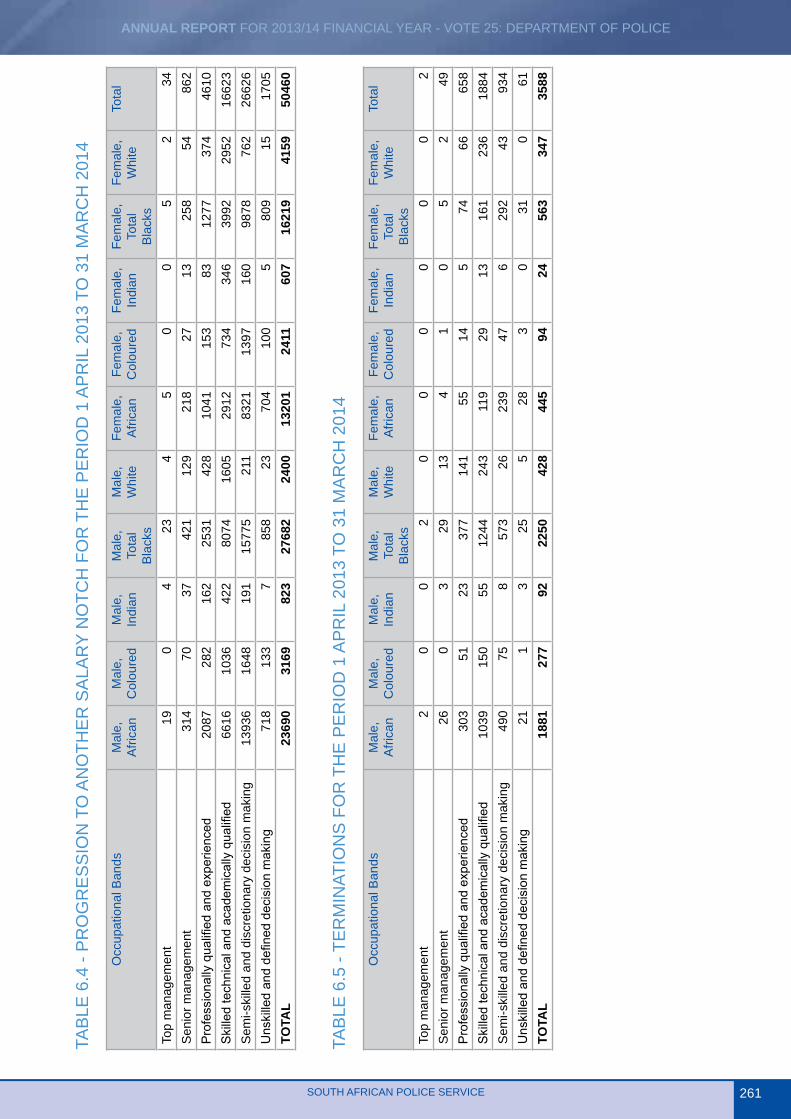
TAB
LE 6
.4 -
PR
OG
RE
SS
ION
TO
AN
OTH
ER
SA
LAR
Y N
OTC
H F
OR
TH
E P
ER
IOD
1 A
PR
IL 2
013
TO 3
1 M
AR
CH
201
4
Occ
upat
iona
l Ban
dsM
ale,
A
frica
nM
ale,
C
olou
red
Mal
e,
Indi
anM
ale,
To
tal
Bla
cks
Mal
e,
Whi
teFe
mal
e,
Afri
can
Fem
ale,
C
olou
red
Fem
ale,
In
dian
Fem
ale,
To
tal
Bla
cks
Fem
ale,
W
hite
Tota
l
Top
man
agem
ent
190
423
45
00
52
34S
enio
r man
agem
ent
314
7037
421
129
218
2713
258
5486
2P
rofe
ssio
nally
qua
lified
and
exp
erie
nced
2087
282
162
2531
428
1041
153
8312
7737
446
10S
kille
d te
chni
cal a
nd a
cade
mic
ally
qua
lified
6616
1036
422
8074
1605
2912
734
346
3992
2952
1662
3S
emi-s
kille
d an
d di
scre
tiona
ry d
ecis
ion
mak
ing
1393
616
4819
115
775
211
8321
1397
160
9878
762
2662
6U
nski
lled
and
defin
ed d
ecis
ion
mak
ing
718
133
785
823
704
100
580
915
1705
TOTA
L23
690
3169
823
2768
224
0013
201
2411
607
1621
941
5950
460
TAB
LE 6
.5 -
TER
MIN
ATIO
NS
FO
R T
HE
PE
RIO
D 1
AP
RIL
201
3 TO
31
MA
RC
H 2
014
Occ
upat
iona
l Ban
dsM
ale,
A
frica
nM
ale,
C
olou
red
Mal
e,
Indi
anM
ale,
To
tal
Bla
cks
Mal
e,
Whi
teFe
mal
e,
Afri
can
Fem
ale,
C
olou
red
Fem
ale,
In
dian
Fem
ale,
To
tal
Bla
cks
Fem
ale,
W
hite
Tota
l
Top
man
agem
ent
20
02
00
00
00
2S
enio
r man
agem
ent
260
329
134
10
52
49P
rofe
ssio
nally
qua
lified
and
exp
erie
nced
303
5123
377
141
5514
574
6665
8S
kille
d te
chni
cal a
nd a
cade
mic
ally
qua
lified
1039
150
5512
4424
311
929
1316
123
618
84S
emi-s
kille
d an
d di
scre
tiona
ry d
ecis
ion
mak
ing
490
758
573
2623
947
629
243
934
Uns
kille
d an
d de
fined
dec
isio
n m
akin
g21
13
255
283
031
061
TOTA
L18
8127
792
2250
428
445
9424
563
347
3588
ANNUAL REPORT FOR 2013/14 FINANCIAL YEAR - VOTE 25: DEPARTMENT OF POLICE
SOUTH AFRICAN POLICE SERVICE262
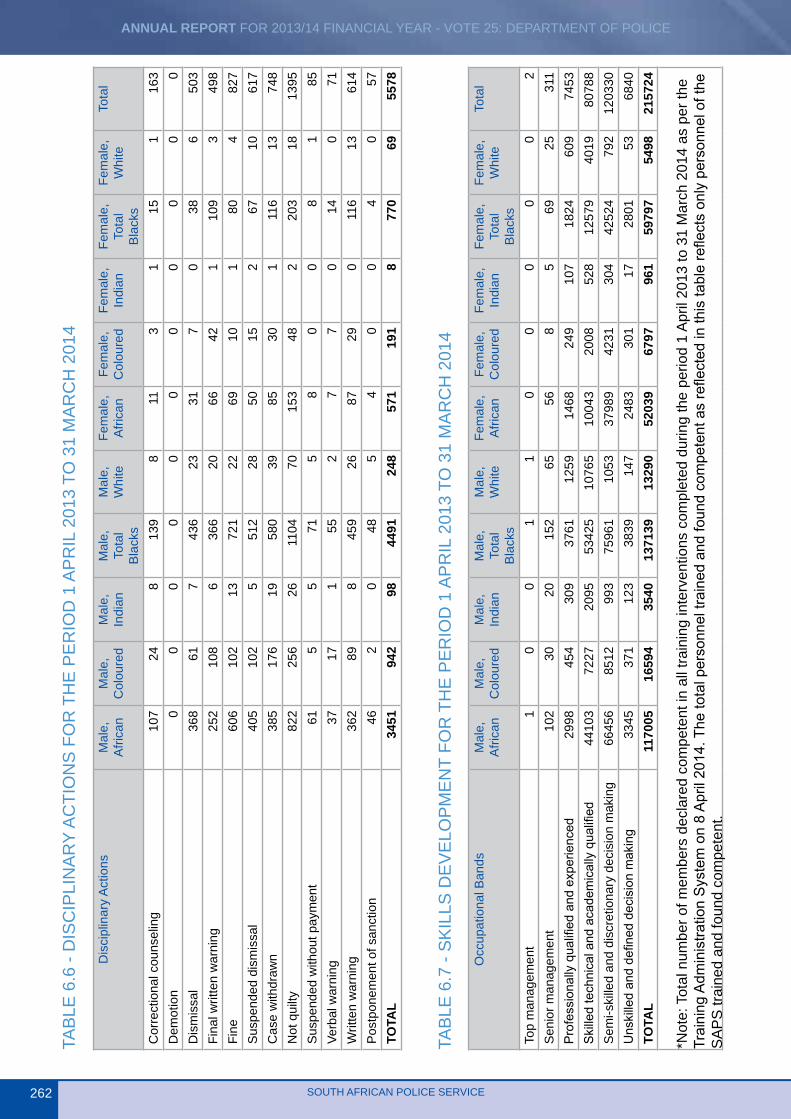
TAB
LE 6
.6 -
DIS
CIP
LIN
AR
Y A
CTI
ON
S F
OR
TH
E P
ER
IOD
1 A
PR
IL 2
013
TO 3
1 M
AR
CH
201
4
Dis
cipl
inar
y A
ctio
nsM
ale,
A
frica
nM
ale,
C
olou
red
Mal
e,
Indi
anM
ale,
To
tal
Bla
cks
Mal
e,
Whi
teFe
mal
e,
Afri
can
Fem
ale,
C
olou
red
Fem
ale,
In
dian
Fem
ale,
To
tal
Bla
cks
Fem
ale,
W
hite
Tota
l
Cor
rect
iona
l cou
nsel
ing
107
248
139
811
31
151
163
Dem
otio
n0
00
00
00
00
00
Dis
mis
sal
368
617
436
2331
70
386
503
Fina
l writ
ten
war
ning
25
210
86
366
2066
421
109
349
8Fi
ne
606
102
1372
122
6910
180
482
7S
uspe
nded
dis
mis
sal
405
102
551
228
5015
267
1061
7C
ase
with
draw
n38
517
619
580
3985
301
116
1374
8N
ot q
uilty
82
225
626
1104
7015
348
220
318
1395
Sus
pend
ed w
ithou
t pay
men
t 61
55
715
80
08
185
Verb
al w
arni
ng
3717
155
27
70
140
71W
ritte
n w
arni
ng
362
898
459
2687
290
116
1361
4P
ostp
onem
ent o
f san
ctio
n46
20
485
40
04
057
TOTA
L34
5194
298
4491
248
571
191
877
069
5578
TAB
LE 6
.7 -
SK
ILLS
DE
VE
LOP
ME
NT
FOR
TH
E P
ER
IOD
1 A
PR
IL 2
013
TO 3
1 M
AR
CH
201
4
Occ
upat
iona
l Ban
dsM
ale,
A
frica
nM
ale,
C
olou
red
Mal
e,
Indi
anM
ale,
To
tal
Bla
cks
Mal
e,
Whi
teFe
mal
e,
Afri
can
Fem
ale,
C
olou
red
Fem
ale,
In
dian
Fem
ale,
To
tal
Bla
cks
Fem
ale,
W
hite
Tota
l
Top
man
agem
ent
10
01
10
00
00
2S
enio
r man
agem
ent
102
3020
152
6556
85
6925
311
Pro
fess
iona
lly q
ualifi
ed a
nd e
xper
ienc
ed29
9845
430
937
6112
5914
6824
910
718
2460
974
53S
kille
d te
chni
cal a
nd a
cade
mic
ally
qua
lified
4410
372
2720
9553
425
1076
510
043
2008
528
1257
940
1980
788
Sem
i-ski
lled
and
disc
retio
nary
dec
isio
n m
akin
g66
456
8512
993
7596
110
5337
989
4231
304
4252
479
212
0330
Uns
kille
d an
d de
fined
dec
isio
n m
akin
g33
4537
112
338
3914
724
8330
117
2801
5368
40TO
TAL
1170
0516
594
3540
1371
3913
290
5203
967
9796
159
797
5498
2157
24
*Not
e: T
otal
num
ber o
f mem
bers
dec
lare
d co
mpe
tent
in a
ll tra
inin
g in
terv
entio
ns c
ompl
eted
dur
ing
the
perio
d 1
Apr
il 20
13 to
31
Mar
ch 2
014
as p
er th
e Tr
aini
ng A
dmin
istra
tion
Sys
tem
on
8 A
pril
2014
. The
tota
l per
sonn
el tr
aine
d an
d fo
und
com
pete
nt a
s re
flect
ed in
this
tabl
e re
flect
s on
ly p
erso
nnel
of t
he
SA
PS
trai
ned
and
foun
d co
mpe
tent
.
ANNUAL REPORT FOR 2013/14 FINANCIAL YEAR - VOTE 25: DEPARTMENT OF POLICE
SOUTH AFRICAN POLICE SERVICE 263
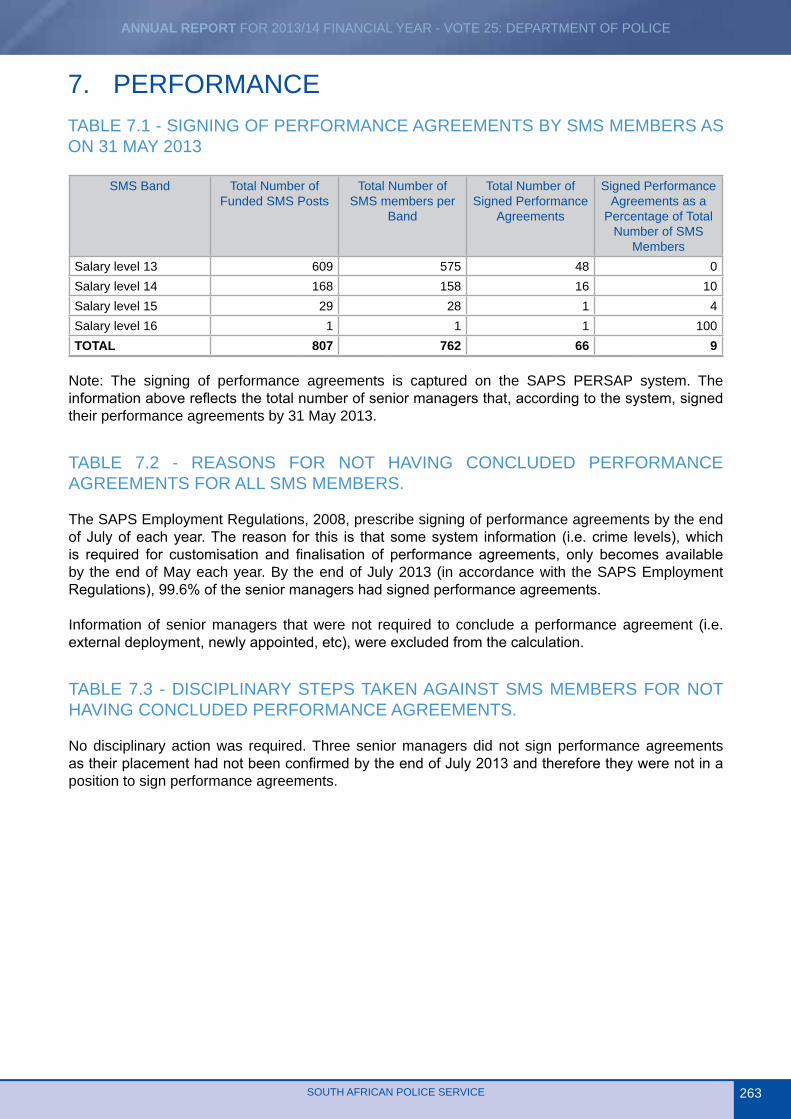
7. PERFORMANCETABLE 7.1 - SIGNING OF PERFORMANCE AGREEMENTS BY SMS MEMBERS AS ON 31 MAY 2013
SMS Band Total Number of Funded SMS Posts
Total Number of SMS members per
Band
Total Number of Signed Performance
Agreements
Signed Performance Agreements as a
Percentage of Total Number of SMS
MembersSalary level 13 609 575 48 0Salary level 14 168 158 16 10Salary level 15 29 28 1 4Salary level 16 1 1 1 100TOTAL 807 762 66 9
Note: The signing of performance agreements is captured on the SAPS PERSAP system. The information above reflects the total number of senior managers that, according to the system, signed their performance agreements by 31 May 2013.
TABLE 7.2 - REASONS FOR NOT HAVING CONCLUDED PERFORMANCE AGREEMENTS FOR ALL SMS MEMBERS.
The SAPS Employment Regulations, 2008, prescribe signing of performance agreements by the end of July of each year. The reason for this is that some system information (i.e. crime levels), which is required for customisation and finalisation of performance agreements, only becomes available by the end of May each year. By the end of July 2013 (in accordance with the SAPS Employment Regulations), 99.6% of the senior managers had signed performance agreements.
Information of senior managers that were not required to conclude a performance agreement (i.e. external deployment, newly appointed, etc), were excluded from the calculation.
TABLE 7.3 - DISCIPLINARY STEPS TAKEN AGAINST SMS MEMBERS FOR NOT HAVING CONCLUDED PERFORMANCE AGREEMENTS.
No disciplinary action was required. Three senior managers did not sign performance agreements as their placement had not been confirmed by the end of July 2013 and therefore they were not in a position to sign performance agreements.
ANNUAL REPORT FOR 2013/14 FINANCIAL YEAR - VOTE 25: DEPARTMENT OF POLICE
SOUTH AFRICAN POLICE SERVICE264
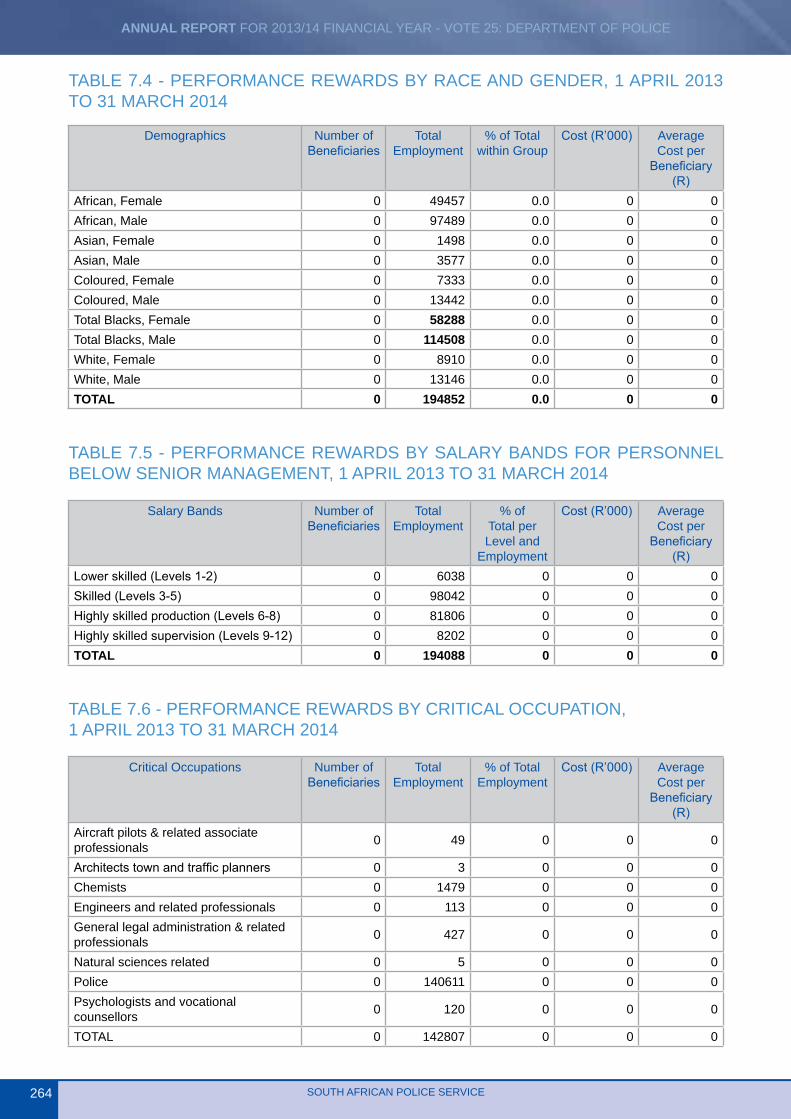
TABLE 7.4 - PERFORMANCE REWARDS BY RACE AND GENDER, 1 APRIL 2013 TO 31 MARCH 2014
Demographics Number of Beneficiaries
Total Employment
% of Total within Group
Cost (R’000) Average Cost per
Beneficiary (R)
African, Female 0 49457 0.0 0 0African, Male 0 97489 0.0 0 0Asian, Female 0 1498 0.0 0 0Asian, Male 0 3577 0.0 0 0Coloured, Female 0 7333 0.0 0 0Coloured, Male 0 13442 0.0 0 0Total Blacks, Female 0 58288 0.0 0 0Total Blacks, Male 0 114508 0.0 0 0White, Female 0 8910 0.0 0 0White, Male 0 13146 0.0 0 0TOTAL 0 194852 0.0 0 0
TABLE 7.5 - PERFORMANCE REWARDS BY SALARY BANDS FOR PERSONNEL BELOW SENIOR MANAGEMENT, 1 APRIL 2013 TO 31 MARCH 2014
Salary Bands Number of Beneficiaries
Total Employment
% of Total per Level and
Employment
Cost (R’000) Average Cost per
Beneficiary (R)
Lower skilled (Levels 1-2) 0 6038 0 0 0Skilled (Levels 3-5) 0 98042 0 0 0Highly skilled production (Levels 6-8) 0 81806 0 0 0Highly skilled supervision (Levels 9-12) 0 8202 0 0 0TOTAL 0 194088 0 0 0
TABLE 7.6 - PERFORMANCE REWARDS BY CRITICAL OCCUPATION, 1 APRIL 2013 TO 31 MARCH 2014
Critical Occupations Number of Beneficiaries
Total Employment
% of Total Employment
Cost (R’000) Average Cost per
Beneficiary (R)
Aircraft pilots & related associate professionals 0 49 0 0 0
Architects town and traffic planners 0 3 0 0 0Chemists 0 1479 0 0 0Engineers and related professionals 0 113 0 0 0General legal administration & related professionals 0 427 0 0 0
Natural sciences related 0 5 0 0 0Police 0 140611 0 0 0Psychologists and vocational counsellors 0 120 0 0 0
TOTAL 0 142807 0 0 0
ANNUAL REPORT FOR 2013/14 FINANCIAL YEAR - VOTE 25: DEPARTMENT OF POLICE
SOUTH AFRICAN POLICE SERVICE 265
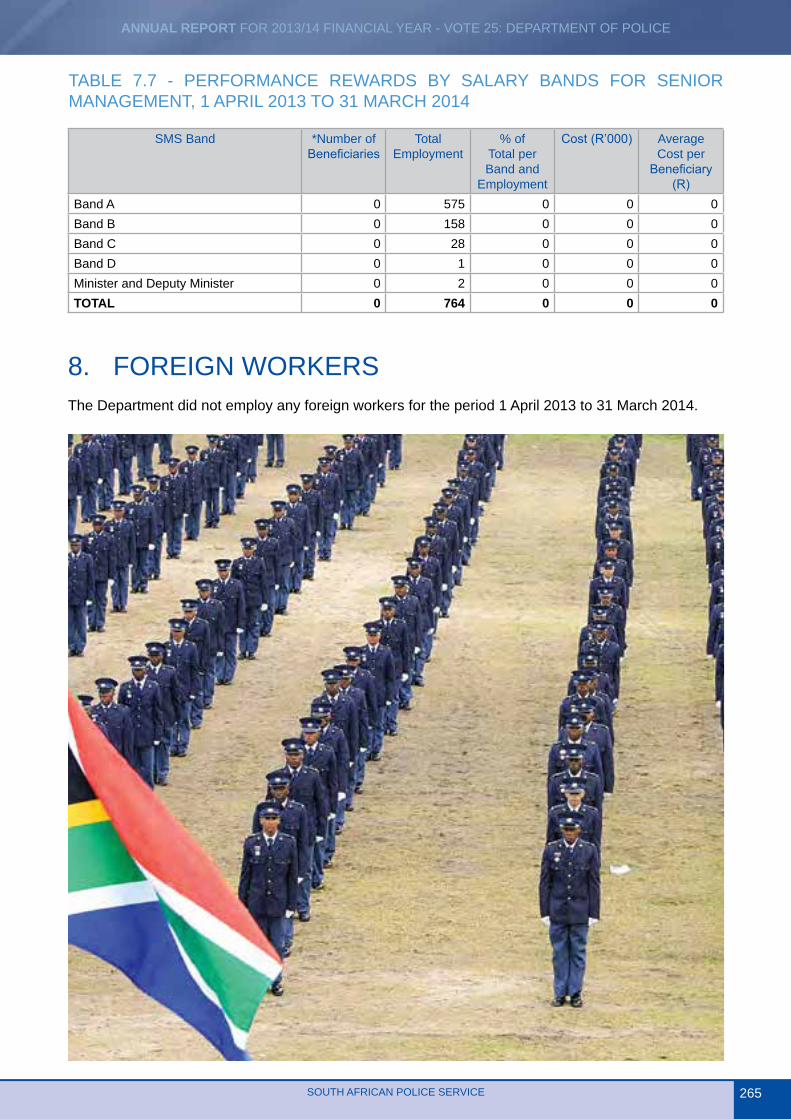
TABLE 7.7 - PERFORMANCE REWARDS BY SALARY BANDS FOR SENIOR MANAGEMENT, 1 APRIL 2013 TO 31 MARCH 2014
SMS Band *Number of Beneficiaries
Total Employment
% of Total per Band and
Employment
Cost (R’000) Average Cost per
Beneficiary (R)
Band A 0 575 0 0 0Band B 0 158 0 0 0Band C 0 28 0 0 0Band D 0 1 0 0 0Minister and Deputy Minister 0 2 0 0 0TOTAL 0 764 0 0 0
8. FOREIGN WORKERSThe Department did not employ any foreign workers for the period 1 April 2013 to 31 March 2014.
ANNUAL REPORT FOR 2013/14 FINANCIAL YEAR - VOTE 25: DEPARTMENT OF POLICE
SOUTH AFRICAN POLICE SERVICE266
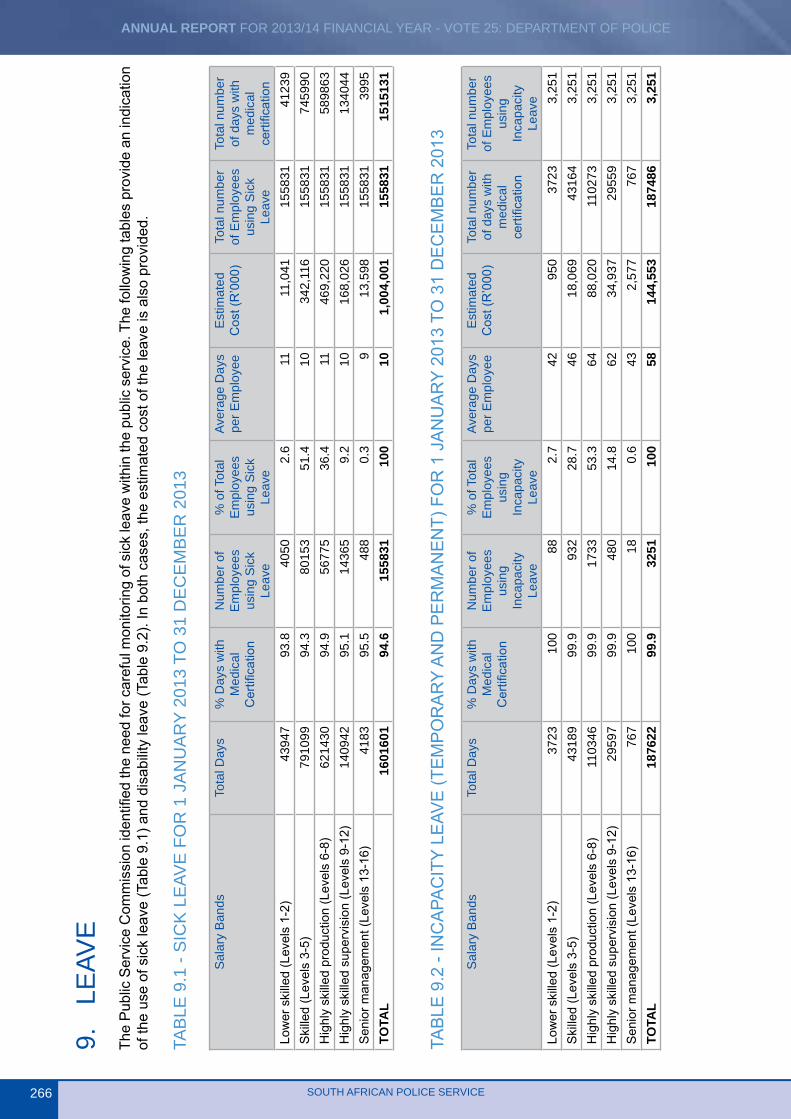
9.
LEAV
ETh
e P
ublic
Ser
vice
Com
mis
sion
iden
tified
the
need
for c
aref
ul m
onito
ring
of s
ick
leav
e w
ithin
the
publ
ic s
ervi
ce. T
he fo
llow
ing
tabl
es p
rovi
de a
n in
dica
tion
of th
e us
e of
sic
k le
ave
(Tab
le 9
.1) a
nd d
isab
ility
leav
e (T
able
9.2
). In
bot
h ca
ses,
the
estim
ated
cos
t of t
he le
ave
is a
lso
prov
ided
.
TAB
LE 9
.1 -
SIC
K L
EAV
E F
OR
1 J
AN
UA
RY
2013
TO
31
DE
CE
MB
ER
201
3
Sal
ary
Ban
dsTo
tal D
ays
% D
ays
with
M
edic
al
Cer
tifica
tion
Num
ber o
f E
mpl
oyee
s us
ing
Sic
k Le
ave
% o
f Tot
al
Em
ploy
ees
usin
g S
ick
Leav
e
Aver
age
Day
s pe
r Em
ploy
eeE
stim
ated
C
ost (
R’0
00)
Tota
l num
ber
of E
mpl
oyee
s us
ing
Sic
k Le
ave
Tota
l num
ber
of d
ays
with
m
edic
al
certi
ficat
ion
Low
er s
kille
d (L
evel
s 1-
2)
4394
793
.840
502.
611
11,0
4115
5831
4123
9S
kille
d (L
evel
s 3-
5)
7910
9994
.380
153
51.4
1034
2,11
615
5831
7459
90H
ighl
y sk
illed
pro
duct
ion
(Lev
els
6-8)
62
1430
94.9
5677
536
.411
469,
220
1558
3158
9863
Hig
hly
skill
ed s
uper
visi
on (L
evel
s 9-
12)
1409
4295
.114
365
9.2
1016
8,02
615
5831
1340
44S
enio
r man
agem
ent (
Leve
ls 1
3-16
) 41
8395
.548
80.
39
13,5
9815
5831
3995
TOTA
L16
0160
194
.615
5831
100
101,
004,
001
1558
3115
1513
1
TAB
LE 9
.2 -
INC
APA
CIT
y LE
AVE
(TE
MP
OR
AR
y A
ND
PE
RM
AN
EN
T) F
OR
1 J
AN
UA
Ry
2013
TO
31
DE
CE
MB
ER
201
3
Sal
ary
Ban
dsTo
tal D
ays
% D
ays
with
M
edic
al
Cer
tifica
tion
Num
ber o
f E
mpl
oyee
s us
ing
Inca
paci
ty
Leav
e
% o
f Tot
al
Em
ploy
ees
usin
g In
capa
city
Le
ave
Aver
age
Day
s pe
r Em
ploy
eeE
stim
ated
C
ost (
R’0
00)
Tota
l num
ber
of d
ays
with
m
edic
al
certi
ficat
ion
Tota
l num
ber
of E
mpl
oyee
s us
ing
Inca
paci
ty
Leav
eLo
wer
ski
lled
(Lev
els
1-2)
37
2310
088
2.7
4295
037
233,
251
Ski
lled
(Lev
els
3-5)
43
189
99.9
932
28.7
4618
,069
4316
43,
251
Hig
hly
skill
ed p
rodu
ctio
n (L
evel
s 6-
8)
1103
4699
.917
3353
.364
88,0
2011
0273
3,25
1H
ighl
y sk
illed
sup
ervi
sion
(Lev
els
9-12
) 29
597
99.9
480
14.8
6234
,937
2955
93,
251
Sen
ior m
anag
emen
t (Le
vels
13-
16)
767
100
180.
643
2,57
776
73,
251
TOTA
L18
7622
99.9
3251
100
5814
4,55
318
7486
3,25
1
ANNUAL REPORT FOR 2013/14 FINANCIAL YEAR - VOTE 25: DEPARTMENT OF POLICE
SOUTH AFRICAN POLICE SERVICE 267
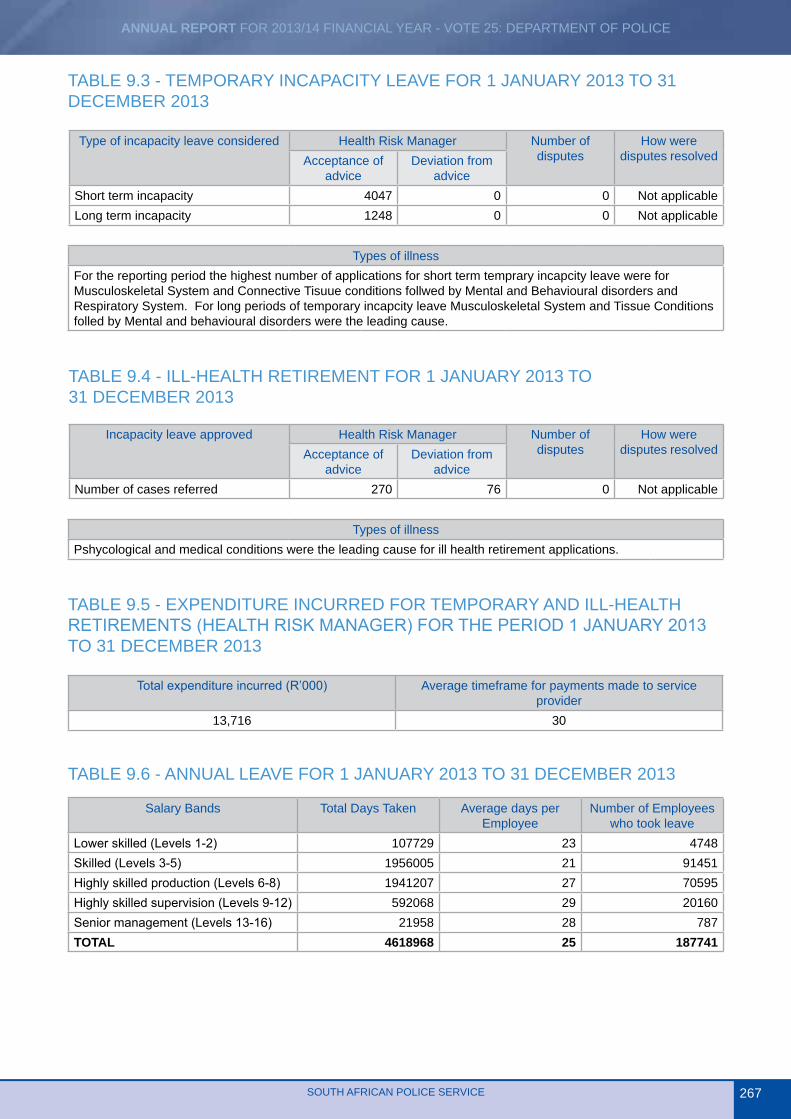
TABLE 9.3 - TEMPORARY INCAPACITY LEAVE FOR 1 JANUARY 2013 TO 31 DECEMBER 2013
Type of incapacity leave considered Health Risk Manager Number of disputes
How were disputes resolvedAcceptance of
adviceDeviation from
adviceShort term incapacity 4047 0 0 Not applicableLong term incapacity 1248 0 0 Not applicable
Types of illnessFor the reporting period the highest number of applications for short term temprary incapcity leave were for Musculoskeletal System and Connective Tisuue conditions follwed by Mental and Behavioural disorders and Respiratory System. For long periods of temporary incapcity leave Musculoskeletal System and Tissue Conditions folled by Mental and behavioural disorders were the leading cause.
TABLE 9.4 - ILL-HEALTH RETIREMENT FOR 1 JANUARY 2013 TO 31 DECEMBER 2013
Incapacity leave approved Health Risk Manager Number of disputes
How were disputes resolvedAcceptance of
adviceDeviation from
adviceNumber of cases referred 270 76 0 Not applicable
Types of illnessPshycological and medical conditions were the leading cause for ill health retirement applications.
TABLE 9.5 - EXPENDITURE INCURRED FOR TEMPORARY AND ILL-HEALTH RETIREMENTS (HEALTH RISK MANAGER) FOR THE PERIOD 1 JANUARy 2013 TO 31 DECEMBER 2013
Total expenditure incurred (R’000) Average timeframe for payments made to service provider
13,716 30
TABLE 9.6 - ANNUAL LEAVE FOR 1 JANUARY 2013 TO 31 DECEMBER 2013
Salary Bands Total Days Taken Average days per Employee
Number of Employees who took leave
Lower skilled (Levels 1-2) 107729 23 4748Skilled (Levels 3-5) 1956005 21 91451Highly skilled production (Levels 6-8) 1941207 27 70595Highly skilled supervision (Levels 9-12) 592068 29 20160Senior management (Levels 13-16) 21958 28 787TOTAL 4618968 25 187741
ANNUAL REPORT FOR 2013/14 FINANCIAL YEAR - VOTE 25: DEPARTMENT OF POLICE
SOUTH AFRICAN POLICE SERVICE268
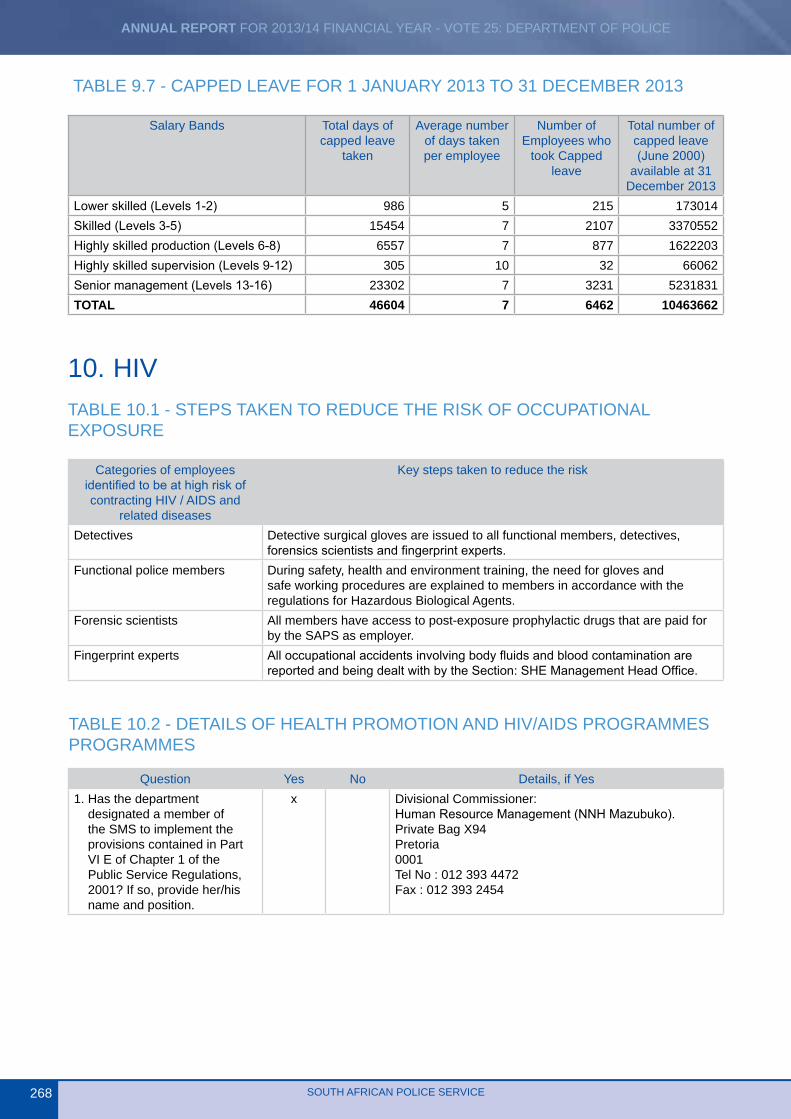
TABLE 9.7 - CAPPED LEAVE FOR 1 JANUARY 2013 TO 31 DECEMBER 2013
Salary Bands Total days of capped leave
taken
Average number of days taken per employee
Number of Employees who
took Capped leave
Total number of capped leave (June 2000)
available at 31 December 2013
Lower skilled (Levels 1-2) 986 5 215 173014Skilled (Levels 3-5) 15454 7 2107 3370552Highly skilled production (Levels 6-8) 6557 7 877 1622203Highly skilled supervision (Levels 9-12) 305 10 32 66062Senior management (Levels 13-16) 23302 7 3231 5231831TOTAL 46604 7 6462 10463662
10. HIVTABLE 10.1 - STEPS TAKEN TO REDUCE THE RISK OF OCCUPATIONAL EXPOSURE
Categories of employees identified to be at high risk of contracting HIV / AIDS and
related diseases
Key steps taken to reduce the risk
Detectives Detective surgical gloves are issued to all functional members, detectives, forensics scientists and fingerprint experts.
Functional police members During safety, health and environment training, the need for gloves and safe working procedures are explained to members in accordance with the regulations for Hazardous Biological Agents.
Forensic scientists All members have access to post-exposure prophylactic drugs that are paid for by the SAPS as employer.
Fingerprint experts All occupational accidents involving body fluids and blood contamination are reported and being dealt with by the Section: SHE Management Head Office.
TABLE 10.2 - DETAILS OF HEALTH PROMOTION AND HIV/AIDS PROGRAMMES PROGRAMMES
Question Yes No Details, if Yes1. Has the department
designated a member of the SMS to implement the provisions contained in Part VI E of Chapter 1 of the Public Service Regulations, 2001? If so, provide her/his name and position.
x Divisional Commissioner: Human Resource Management (NNH Mazubuko). Private Bag X94 Pretoria 0001 Tel No : 012 393 4472 Fax : 012 393 2454
ANNUAL REPORT FOR 2013/14 FINANCIAL YEAR - VOTE 25: DEPARTMENT OF POLICE
SOUTH AFRICAN POLICE SERVICE 269
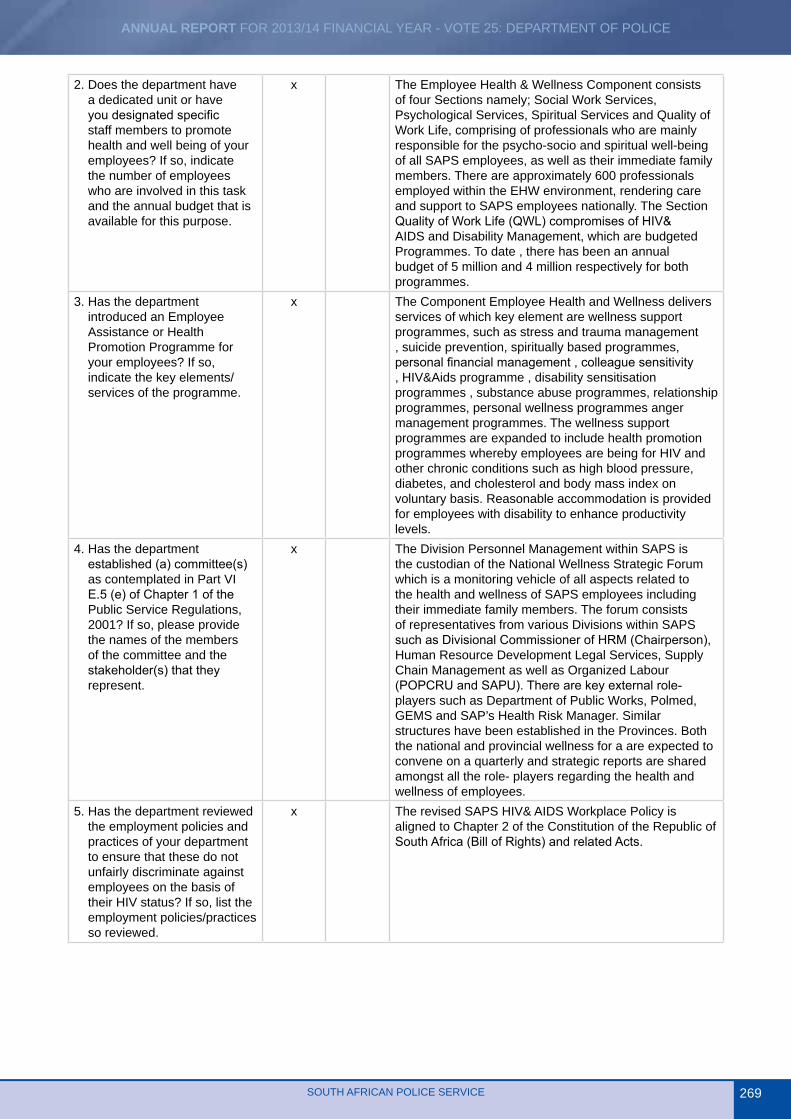
2. Does the department have a dedicated unit or have you designated specific staff members to promote health and well being of your employees? If so, indicate the number of employees who are involved in this task and the annual budget that is available for this purpose.
x The Employee Health & Wellness Component consists of four Sections namely; Social Work Services, Psychological Services, Spiritual Services and Quality of Work Life, comprising of professionals who are mainly responsible for the psycho-socio and spiritual well-being of all SAPS employees, as well as their immediate family members. There are approximately 600 professionals employed within the EHW environment, rendering care and support to SAPS employees nationally. The Section Quality of Work Life (QWL) compromises of HIV& AIDS and Disability Management, which are budgeted Programmes. To date , there has been an annual budget of 5 million and 4 million respectively for both programmes.
3. Has the department introduced an Employee Assistance or Health Promotion Programme for your employees? If so, indicate the key elements/services of the programme.
x The Component Employee Health and Wellness delivers services of which key element are wellness support programmes, such as stress and trauma management , suicide prevention, spiritually based programmes, personal financial management , colleague sensitivity , HIV&Aids programme , disability sensitisation programmes , substance abuse programmes, relationship programmes, personal wellness programmes anger management programmes. The wellness support programmes are expanded to include health promotion programmes whereby employees are being for HIV and other chronic conditions such as high blood pressure, diabetes, and cholesterol and body mass index on voluntary basis. Reasonable accommodation is provided for employees with disability to enhance productivity levels.
4. Has the department established (a) committee(s) as contemplated in Part VI E.5 (e) of Chapter 1 of the Public Service Regulations, 2001? If so, please provide the names of the members of the committee and the stakeholder(s) that they represent.
x The Division Personnel Management within SAPS is the custodian of the National Wellness Strategic Forum which is a monitoring vehicle of all aspects related to the health and wellness of SAPS employees including their immediate family members. The forum consists of representatives from various Divisions within SAPS such as Divisional Commissioner of HRM (Chairperson), Human Resource Development Legal Services, Supply Chain Management as well as Organized Labour (POPCRU and SAPU). There are key external role- players such as Department of Public Works, Polmed, GEMS and SAP’s Health Risk Manager. Similar structures have been established in the Provinces. Both the national and provincial wellness for a are expected to convene on a quarterly and strategic reports are shared amongst all the role- players regarding the health and wellness of employees.
5. Has the department reviewed the employment policies and practices of your department to ensure that these do not unfairly discriminate against employees on the basis of their HIV status? If so, list the employment policies/practices so reviewed.
x The revised SAPS HIV& AIDS Workplace Policy is aligned to Chapter 2 of the Constitution of the Republic of South Africa (Bill of Rights) and related Acts.
ANNUAL REPORT FOR 2013/14 FINANCIAL YEAR - VOTE 25: DEPARTMENT OF POLICE
SOUTH AFRICAN POLICE SERVICE270
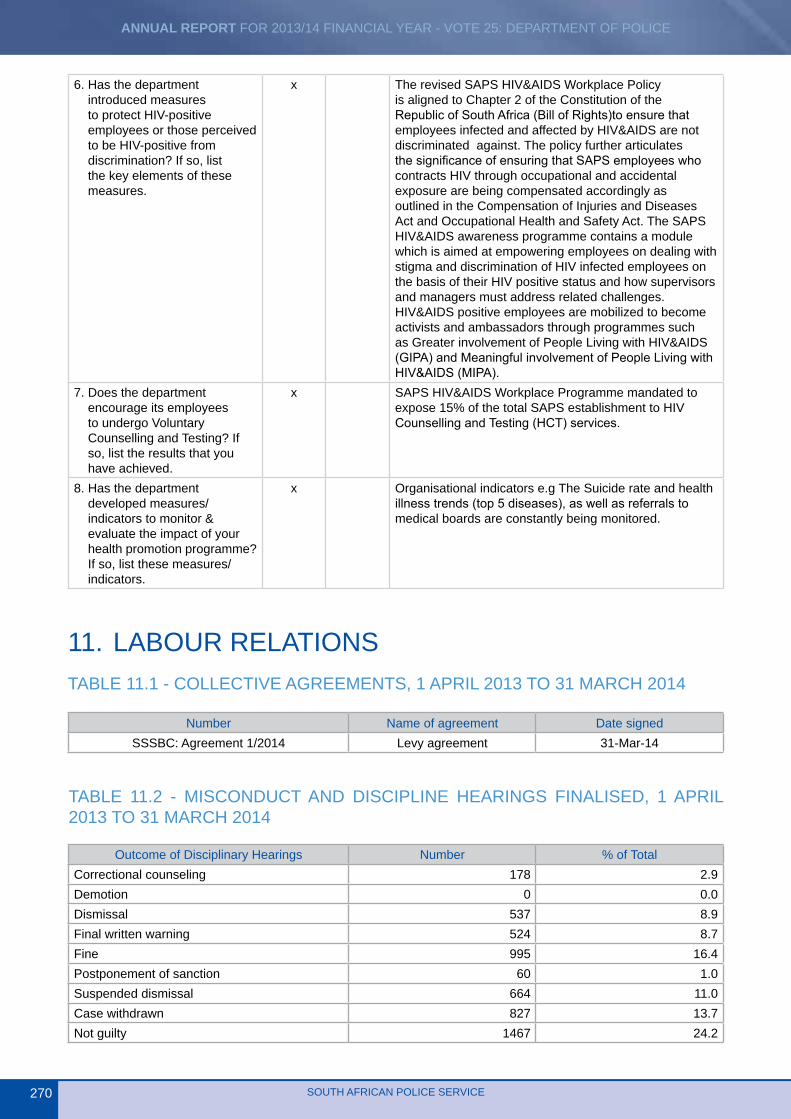
6. Has the department introduced measures to protect HIV-positive employees or those perceived to be HIV-positive from discrimination? If so, list the key elements of these measures.
x The revised SAPS HIV&AIDS Workplace Policy is aligned to Chapter 2 of the Constitution of the Republic of South Africa (Bill of Rights)to ensure that employees infected and affected by HIV&AIDS are not discriminated against. The policy further articulates the significance of ensuring that SAPS employees who contracts HIV through occupational and accidental exposure are being compensated accordingly as outlined in the Compensation of Injuries and Diseases Act and Occupational Health and Safety Act. The SAPS HIV&AIDS awareness programme contains a module which is aimed at empowering employees on dealing with stigma and discrimination of HIV infected employees on the basis of their HIV positive status and how supervisors and managers must address related challenges. HIV&AIDS positive employees are mobilized to become activists and ambassadors through programmes such as Greater involvement of People Living with HIV&AIDS (GIPA) and Meaningful involvement of People Living with HIV&AIDS (MIPA).
7. Does the department encourage its employees to undergo Voluntary Counselling and Testing? If so, list the results that you have achieved.
x SAPS HIV&AIDS Workplace Programme mandated to expose 15% of the total SAPS establishment to HIV Counselling and Testing (HCT) services.
8. Has the department developed measures/indicators to monitor & evaluate the impact of your health promotion programme? If so, list these measures/indicators.
x Organisational indicators e.g The Suicide rate and health illness trends (top 5 diseases), as well as referrals to medical boards are constantly being monitored.
11. LABOUR RELATIONSTABLE 11.1 - COLLECTIVE AGREEMENTS, 1 APRIL 2013 TO 31 MARCH 2014
Number Name of agreement Date signedSSSBC: Agreement 1/2014 Levy agreement 31-Mar-14
TABLE 11.2 - MISCONDUCT AND DISCIPLINE HEARINGS FINALISED, 1 APRIL 2013 TO 31 MARCH 2014
Outcome of Disciplinary Hearings Number % of TotalCorrectional counseling 178 2.9Demotion 0 0.0Dismissal 537 8.9Final written warning 524 8.7Fine 995 16.4Postponement of sanction 60 1.0Suspended dismissal 664 11.0Case withdrawn 827 13.7Not guilty 1467 24.2
ANNUAL REPORT FOR 2013/14 FINANCIAL YEAR - VOTE 25: DEPARTMENT OF POLICE
SOUTH AFRICAN POLICE SERVICE 271
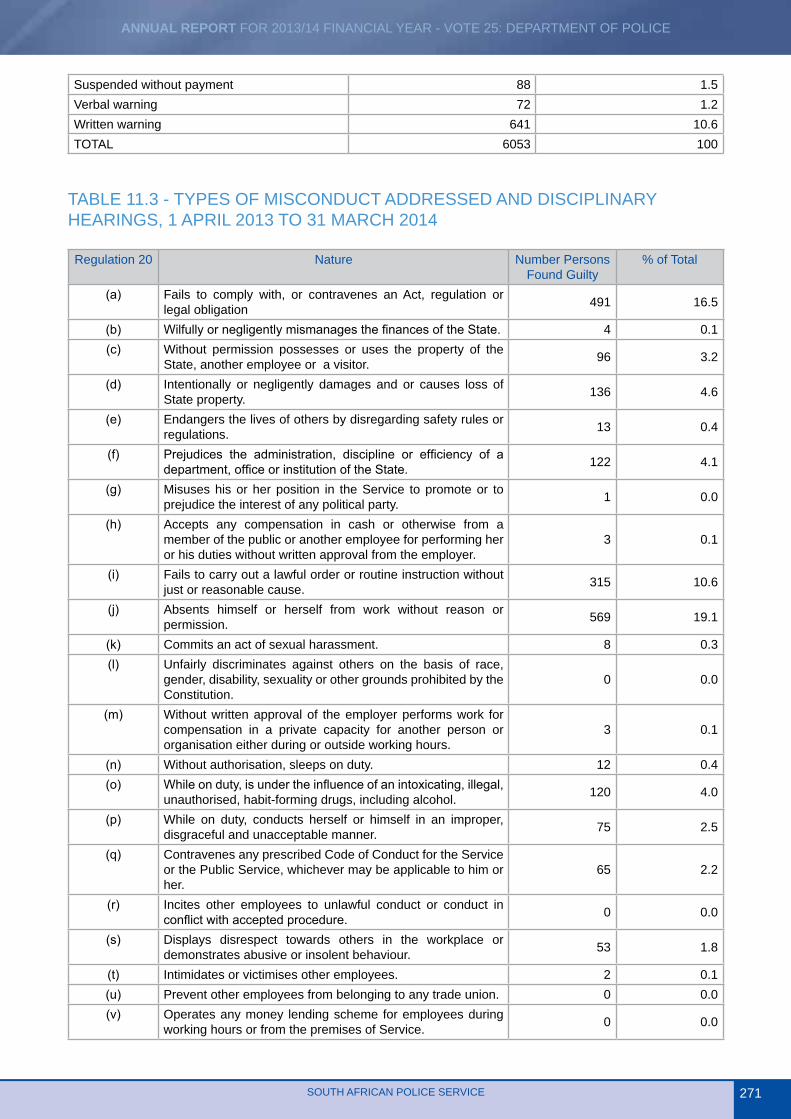
Suspended without payment 88 1.5Verbal warning 72 1.2Written warning 641 10.6TOTAL 6053 100
TABLE 11.3 - TYPES OF MISCONDUCT ADDRESSED AND DISCIPLINARY HEARINGS, 1 APRIL 2013 TO 31 MARCH 2014
Regulation 20 Nature Number Persons Found Guilty
% of Total
(a) Fails to comply with, or contravenes an Act, regulation or legal obligation 491 16.5
(b) Wilfully or negligently mismanages the finances of the State. 4 0.1(c) Without permission possesses or uses the property of the
State, another employee or a visitor. 96 3.2
(d) Intentionally or negligently damages and or causes loss of State property. 136 4.6
(e) Endangers the lives of others by disregarding safety rules or regulations. 13 0.4
(f) Prejudices the administration, discipline or efficiency of a department, office or institution of the State. 122 4.1
(g) Misuses his or her position in the Service to promote or to prejudice the interest of any political party. 1 0.0
(h) Accepts any compensation in cash or otherwise from a member of the public or another employee for performing her or his duties without written approval from the employer.
3 0.1
(i) Fails to carry out a lawful order or routine instruction without just or reasonable cause. 315 10.6
(j) Absents himself or herself from work without reason or permission. 569 19.1
(k) Commits an act of sexual harassment. 8 0.3(l) Unfairly discriminates against others on the basis of race,
gender, disability, sexuality or other grounds prohibited by the Constitution.
0 0.0
(m) Without written approval of the employer performs work for compensation in a private capacity for another person or organisation either during or outside working hours.
3 0.1
(n) Without authorisation, sleeps on duty. 12 0.4(o) While on duty, is under the influence of an intoxicating, illegal,
unauthorised, habit-forming drugs, including alcohol. 120 4.0
(p) While on duty, conducts herself or himself in an improper, disgraceful and unacceptable manner. 75 2.5
(q) Contravenes any prescribed Code of Conduct for the Service or the Public Service, whichever may be applicable to him or her.
65 2.2
(r) Incites other employees to unlawful conduct or conduct in conflict with accepted procedure. 0 0.0
(s) Displays disrespect towards others in the workplace or demonstrates abusive or insolent behaviour. 53 1.8
(t) Intimidates or victimises other employees. 2 0.1(u) Prevent other employees from belonging to any trade union. 0 0.0(v) Operates any money lending scheme for employees during
working hours or from the premises of Service. 0 0.0
ANNUAL REPORT FOR 2013/14 FINANCIAL YEAR - VOTE 25: DEPARTMENT OF POLICE
SOUTH AFRICAN POLICE SERVICE272
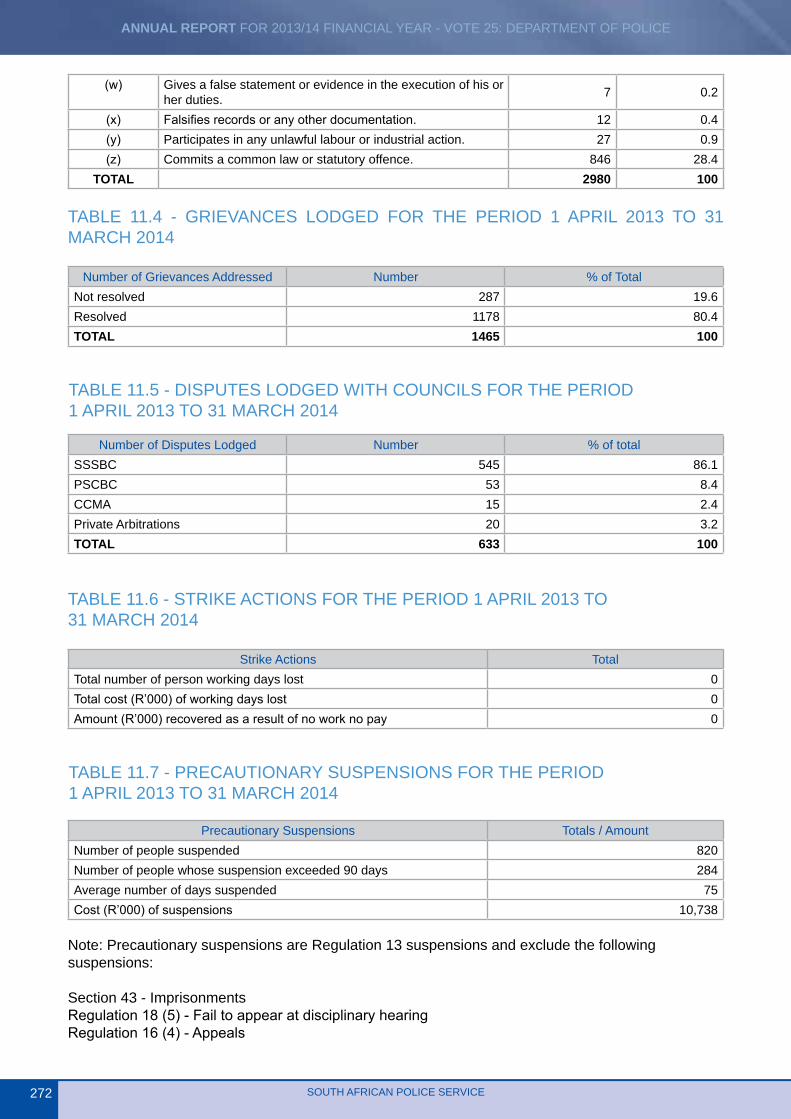
(w) Gives a false statement or evidence in the execution of his or her duties. 7 0.2
(x) Falsifies records or any other documentation. 12 0.4(y) Participates in any unlawful labour or industrial action. 27 0.9(z) Commits a common law or statutory offence. 846 28.4
TOTAL 2980 100
TABLE 11.4 - GRIEVANCES LODGED FOR THE PERIOD 1 APRIL 2013 TO 31 MARCH 2014
Number of Grievances Addressed Number % of TotalNot resolved 287 19.6Resolved 1178 80.4TOTAL 1465 100
TABLE 11.5 - DISPUTES LODGED WITH COUNCILS FOR THE PERIOD 1 APRIL 2013 TO 31 MARCH 2014
Number of Disputes Lodged Number % of totalSSSBC 545 86.1PSCBC 53 8.4CCMA 15 2.4Private Arbitrations 20 3.2TOTAL 633 100
TABLE 11.6 - STRIKE ACTIONS FOR THE PERIOD 1 APRIL 2013 TO 31 MARCH 2014
Strike Actions TotalTotal number of person working days lost 0Total cost (R’000) of working days lost 0Amount (R’000) recovered as a result of no work no pay 0
TABLE 11.7 - PRECAUTIONARY SUSPENSIONS FOR THE PERIOD 1 APRIL 2013 TO 31 MARCH 2014
Precautionary Suspensions Totals / AmountNumber of people suspended 820Number of people whose suspension exceeded 90 days 284Average number of days suspended 75Cost (R’000) of suspensions 10,738
Note: Precautionary suspensions are Regulation 13 suspensions and exclude the following suspensions:
Section 43 - Imprisonments Regulation 18 (5) - Fail to appear at disciplinary hearing Regulation 16 (4) - Appeals
ANNUAL REPORT FOR 2013/14 FINANCIAL YEAR - VOTE 25: DEPARTMENT OF POLICE
SOUTH AFRICAN POLICE SERVICE 273
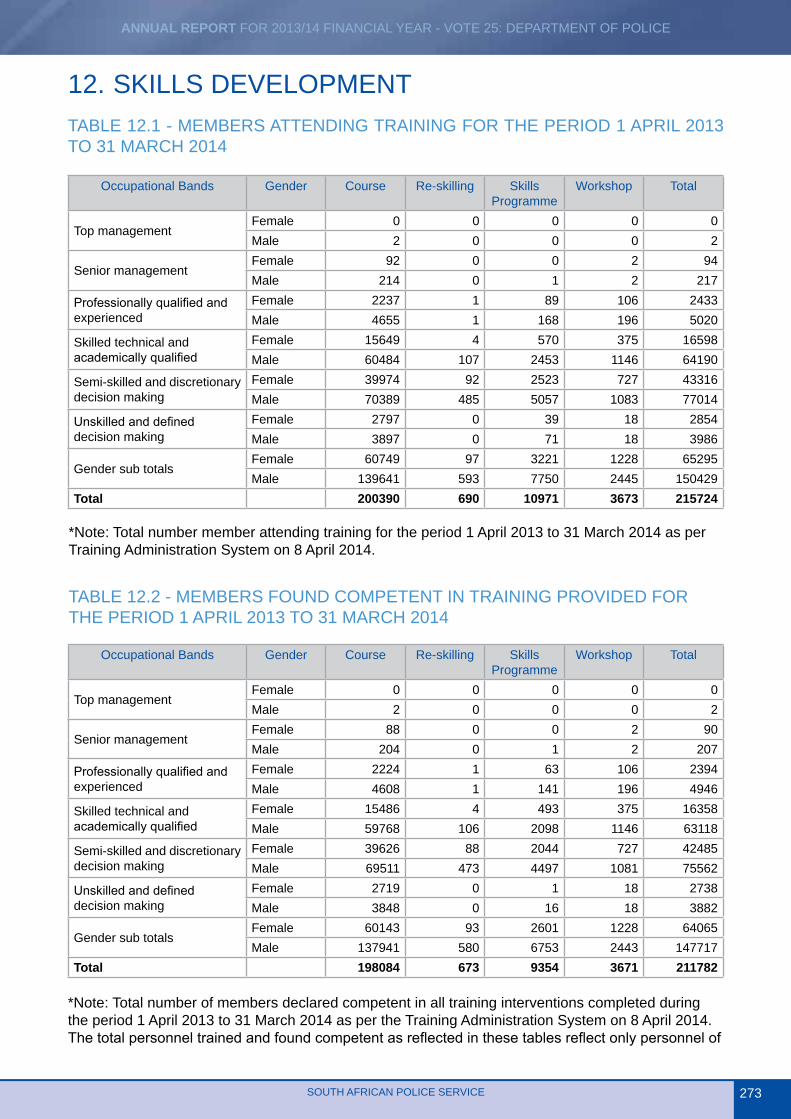
12. SKILLS DEVELOPMENTTABLE 12.1 - MEMBERS ATTENDING TRAINING FOR THE PERIOD 1 APRIL 2013 TO 31 MARCH 2014
Occupational Bands Gender Course Re-skilling Skills Programme
Workshop Total
Top managementFemale 0 0 0 0 0Male 2 0 0 0 2
Senior managementFemale 92 0 0 2 94Male 214 0 1 2 217
Professionally qualified and experienced
Female 2237 1 89 106 2433Male 4655 1 168 196 5020
Skilled technical and academically qualified
Female 15649 4 570 375 16598Male 60484 107 2453 1146 64190
Semi-skilled and discretionary decision making
Female 39974 92 2523 727 43316Male 70389 485 5057 1083 77014
Unskilled and defined decision making
Female 2797 0 39 18 2854Male 3897 0 71 18 3986
Gender sub totals Female 60749 97 3221 1228 65295Male 139641 593 7750 2445 150429
Total 200390 690 10971 3673 215724
*Note: Total number member attending training for the period 1 April 2013 to 31 March 2014 as per Training Administration System on 8 April 2014.
TABLE 12.2 - MEMBERS FOUND COMPETENT IN TRAINING PROVIDED FOR THE PERIOD 1 APRIL 2013 TO 31 MARCH 2014
Occupational Bands Gender Course Re-skilling Skills Programme
Workshop Total
Top managementFemale 0 0 0 0 0Male 2 0 0 0 2
Senior managementFemale 88 0 0 2 90Male 204 0 1 2 207
Professionally qualified and experienced
Female 2224 1 63 106 2394Male 4608 1 141 196 4946
Skilled technical and academically qualified
Female 15486 4 493 375 16358Male 59768 106 2098 1146 63118
Semi-skilled and discretionary decision making
Female 39626 88 2044 727 42485Male 69511 473 4497 1081 75562
Unskilled and defined decision making
Female 2719 0 1 18 2738Male 3848 0 16 18 3882
Gender sub totals Female 60143 93 2601 1228 64065Male 137941 580 6753 2443 147717
Total 198084 673 9354 3671 211782
*Note: Total number of members declared competent in all training interventions completed during the period 1 April 2013 to 31 March 2014 as per the Training Administration System on 8 April 2014. The total personnel trained and found competent as reflected in these tables reflect only personnel of
ANNUAL REPORT FOR 2013/14 FINANCIAL YEAR - VOTE 25: DEPARTMENT OF POLICE
SOUTH AFRICAN POLICE SERVICE274
the SAPS trained and found competent.
13. INJURIESThe following table provides basic information on injury on duty.
TABLE 13.1 - INJURY ON DUTY REPORTED, 1 APRIL 2013 TO 31 MARCH 2014
Nature of injury on duty Number % of totalRequired medical attention with no temporary disablement 2034 30.3Required medical attention with temporary disablement 4167 62Permanent disablement 280 4.2Fatal 236 3.5Total 6717 100
14. UTILIZATION OF CONSULTANTSPage 307 refers to goods and services, of which “consultants, contractors and special services” is a sub-classification.