Embed Size (px)
Citation preview
Final Business Plan – April 2009 Thames Water UtilitiesPart B - Key Components Section B3 – Maintaining Service and Serviceability Confidential – Commercially Sensitive
April 2009 1 Section B3.4 – Sewerage Infra
Part B – Key Components
Section B3 - Maintaining Service and Serviceability
B3.4 - Sewerage Infrastructure
B3.4.1 Summary of Sewerage Infrastructure Capital Maintenance Plan ............... 5
B3.4.2 Serviceability – Historical Analysis ............................................................. 14
B3.4.3 Small Diameter Sewers................................................................................. 21
B3.4.3.1 Overview...................................................................................................... 21 B3.4.3.2 Historical Context......................................................................................... 21 B3.4.3.4 Collapse Avoidance ..................................................................................... 22 B3.4.3.5 Blockage Avoidance .................................................................................... 24 B3.4.3.7 Other Causes Flooding................................................................................ 25 B3.4.3.8 Rehabilitation of Collapsed Sewers ............................................................. 26 B3.4.3.9 Manhole Cover Replacement ...................................................................... 27
B3.4.4 Rising Mains .................................................................................................. 28
B3.4.4.1 Historical Context......................................................................................... 28 B3.4.4.3 Statement of Need....................................................................................... 29
B3.4.5 Large Diameter Sewers................................................................................. 30
B3.4.5.1 Overview...................................................................................................... 30 B3.4.5.2 Historical Context......................................................................................... 30 B3.4.5.3 Statement of Need....................................................................................... 30
B3.4.7 Network Overflows and Outfalls .................................................................. 31
B3.4.7.1 Historical Context........................................................................................ 31 B3.4.7.3 Statement of Need...................................................................................... 33
B3.4.8 Sewer Structures........................................................................................... 34
B3.4.8.1 Overview..................................................................................................... 34 B3.4.8.3 Statement of Needs .................................................................................... 34
B3.4.10 Diversions ...................................................................................................... 35
B3.4.10.3 Statement of Need ................................................................................... 35
B3.4.11 Sewerage Infrastructure Outputs ................................................................ 36
Final Business Plan – April 2009 Thames Water UtilitiesPart B - Key Components Section B3 – Maintaining Service and Serviceability Confidential – Commercially Sensitive
April 2009 2 Section B3.4 – Sewerage Infra
Tables Table 3: Sewerage Infrastructure Serviceability Reference Levels (2010-15) and
Control Limits ............................................................................................................... 7 Table 4: Key Activities in AMP5 - Sewerage Infrastructure Capital Maintenance ........... 9 Table 6: Ofwat Baseline Challenges and Responses ................................................... 11 Table 85: Serviceability Outputs for AMP5 .................................................................. 42
Final Business Plan – April 2009 Thames Water UtilitiesPart B - Key Components Section B3 – Maintaining Service and Serviceability Confidential – Commercially Sensitive
April 2009 3 Section B3.4 – Sewerage Infra
Figures Figure 4: Sewerage Infrastructure Serviceability (JR05) ............................................ 14 Figure 5: Sewerage Infrastructure Serviceability (JR08) ............................................ 15 Figure 6: Total Sewer Collapses JR92 to JR08 .......................................................... 16 Figure 7: Cat 1,2 and 3 Pollution Incidents (Network) JR96 to JR08.......................... 17 Figure 8: Total Sewer Blockages JR06 to JR08 ......................................................... 18 Figure 9: Internal Flooding Due to Other Causes JR93 to JR08 ................................ 19 Figure 10: Internal Flooding Due to Overloaded Sewers JR91 to JR08 ....................... 20 Figure 17: Rising Mains Burst Performance in Comparison to Investment .................. 28 Figure 26: Pollution incidents at CSOs and Surface Water Outfalls ............................. 32 Figure 34: Internal Flooding Due to Overloaded Sewers.............................................. 37 Figure 35: Internal Flooding Due to Other Causes ....................................................... 38 Figure 36: Category 1, 2 and 3 Pollution Incidents Arising from Network Assets......... 39 Figure 37: Number of Sewer Collapses ........................................................................ 40 Figure 38: Number of Blockages .................................................................................. 41
Final Business Plan – April 2009 Thames Water UtilitiesPart B - Key Components Section B3 – Maintaining Service and Serviceability Confidential – Commercially Sensitive
April 2009 4 Section B3.4 – Sewerage Infra
Final Business Plan – April 2009 Thames Water UtilitiesPart B - Key Components Section B3 – Maintaining Service and Serviceability Confidential – Commercially Sensitive
April 2009 5 Section B3.4 – Sewerage Infra
Section B3.4 - Sewerage Infrastructure
B3.4.1 Summary of Sewerage Infrastructure Capital Maintenance Plan
Our Final Business Plan (FBP) sets out a sewerage infrastructure capital maintenance programme that:
Maintains stable serviceability at reduced expenditure in comparison to AMP4 by applying the cost effective objective of the Common Framework for capital maintenance planning
Continues similar levels of AMP4 expenditure to manage Special Risks associated with sewers crossing railways
Includes a specific allocation of expenditure linked to combined sewer overflows, which was allocated to Quality at previous Price Reviews, emerging risks associated with sewer structures and an increase in customer led diversions
[Redacted]
Stable Serviceability
The [Redacted] investment required to maintain stable serviceability in AMP5 has been determined based on our detailed understanding of asset performance and the requirement to maintain service to customers and the environment. There remains a similar level of risk to AMP4 that our shareholders may need to commit additional expenditure above that assumed in our FBP in order to ensure that we maintain stable serviceability throughout AMP5. The investment has been built bottom up where performance risks are linked to the serviceability measures and our Wastewater Risk Framework. [Redacted]
New Capital Maintenance
During AMP4, we have undertaken several investigations and studies to understand the risks associated with sewer structures. As a result of this study work, we have included programmes of work in our FBP to manage the risks associated with ten of the Northern Outfall Sewer bridges and 33 other pipe bridges. [Redacted] At previous price reviews, expenditure to address unsatisfactory intermittent discharges (UIDs) has been included in the Quality Enhancement programmes. However, aside from the overflows to the River Lee, there is no quality driver for overflows in AMP5. During
Final Business Plan – April 2009 Thames Water UtilitiesPart B - Key Components Section B3 – Maintaining Service and Serviceability Confidential – Commercially Sensitive
April 2009 6 Section B3.4 – Sewerage Infra
AMP4, several issues have emerged at intermittent discharges that require us to take action during AMP5 to protect receiving watercourses. [Redacted] We anticipate an increase in customer led diversions activity in AMP5, predominantly due to Crossrail. [Redacted].
Sewerage Infrastructure Asset Groups
Our plan has been established on the basis of business cases for seven asset groups plus a complementary ‘asset group’ for drainage area plans. [Redacted]. We have developed analytical approaches for assessing current and future risks that are applicable to different asset groups. [Redacted].
Expenditure and Output Forecasts
The expenditure forecasts by asset group are set out in Table 2, which also shows a comparison with our DBP forecast and AMP4 spend. The waterfall diagram is shown post efficiency, as this is more relevant to our customers. However, the table below sets out expenditure pre-efficiency to aid Ofwat in the way that they are assessing capital maintenance at this price review. Our proposed AMP5 serviceability outputs in the FBP are set out in Table 3 along with a comparison with our DBP and Ofwat’s draft CIS baseline. We have commented on changes made for our FBP. Our approach is consistent with Ofwat’s stated methodology (RD15/06 and subsequent letter to Water UK dated 27 February 2007). [Redacted]
Final Business Plan – April 2009 Thames Water UtilitiesPart B - Key Components Section B3 – Maintaining Service and Serviceability Confidential – Commercially Sensitive
April 2009 7 Section B3.4 – Sewerage Infra
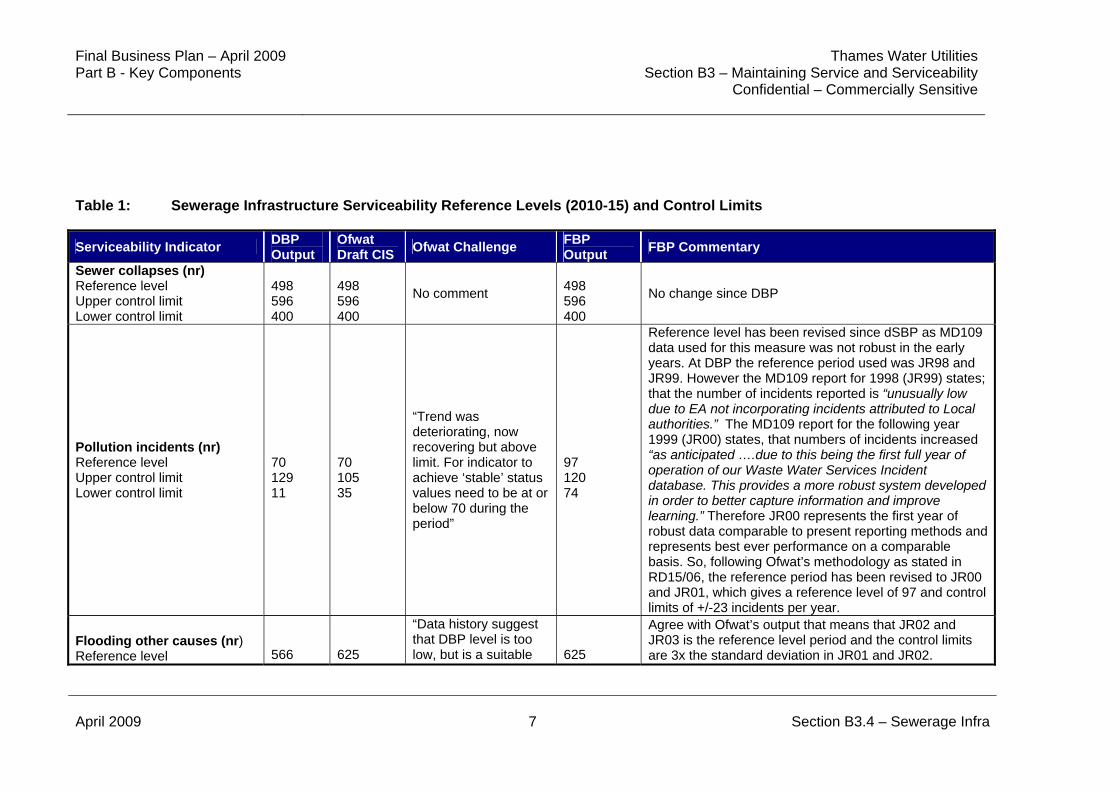
Table 1: Sewerage Infrastructure Serviceability Reference Levels (2010-15) and Control Limits
Serviceability Indicator DBP Output
Ofwat Draft CIS
Ofwat Challenge FBP Output
FBP Commentary
Sewer collapses (nr) Reference level Upper control limit Lower control limit
498 596 400
498 596 400
No comment
498 596 400
No change since DBP
Pollution incidents (nr) Reference level Upper control limit Lower control limit
70 129 11
70 105 35
“Trend was deteriorating, now recovering but above limit. For indicator to achieve ‘stable’ status values need to be at or below 70 during the period”
97 120 74
Reference level has been revised since dSBP as MD109 data used for this measure was not robust in the early years. At DBP the reference period used was JR98 and JR99. However the MD109 report for 1998 (JR99) states; that the number of incidents reported is “unusually low due to EA not incorporating incidents attributed to Local authorities.” The MD109 report for the following year 1999 (JR00) states, that numbers of incidents increased “as anticipated ….due to this being the first full year of operation of our Waste Water Services Incident database. This provides a more robust system developed in order to better capture information and improve learning.” Therefore JR00 represents the first year of robust data comparable to present reporting methods and represents best ever performance on a comparable basis. So, following Ofwat’s methodology as stated in RD15/06, the reference period has been revised to JR00 and JR01, which gives a reference level of 97 and control limits of +/-23 incidents per year.
Flooding other causes (nr) Reference level
566
625
“Data history suggest that DBP level is too low, but is a suitable
625
Agree with Ofwat’s output that means that JR02 and JR03 is the reference level period and the control limits are 3x the standard deviation in JR01 and JR02.
Final Business Plan – April 2009 Thames Water UtilitiesPart B - Key Components Section B3 – Maintaining Service and Serviceability Confidential – Commercially Sensitive
April 2009 8 Section B3.4 – Sewerage Infra
Serviceability Indicator DBP Output
Ofwat Draft CIS
Ofwat Challenge FBP Output
FBP Commentary
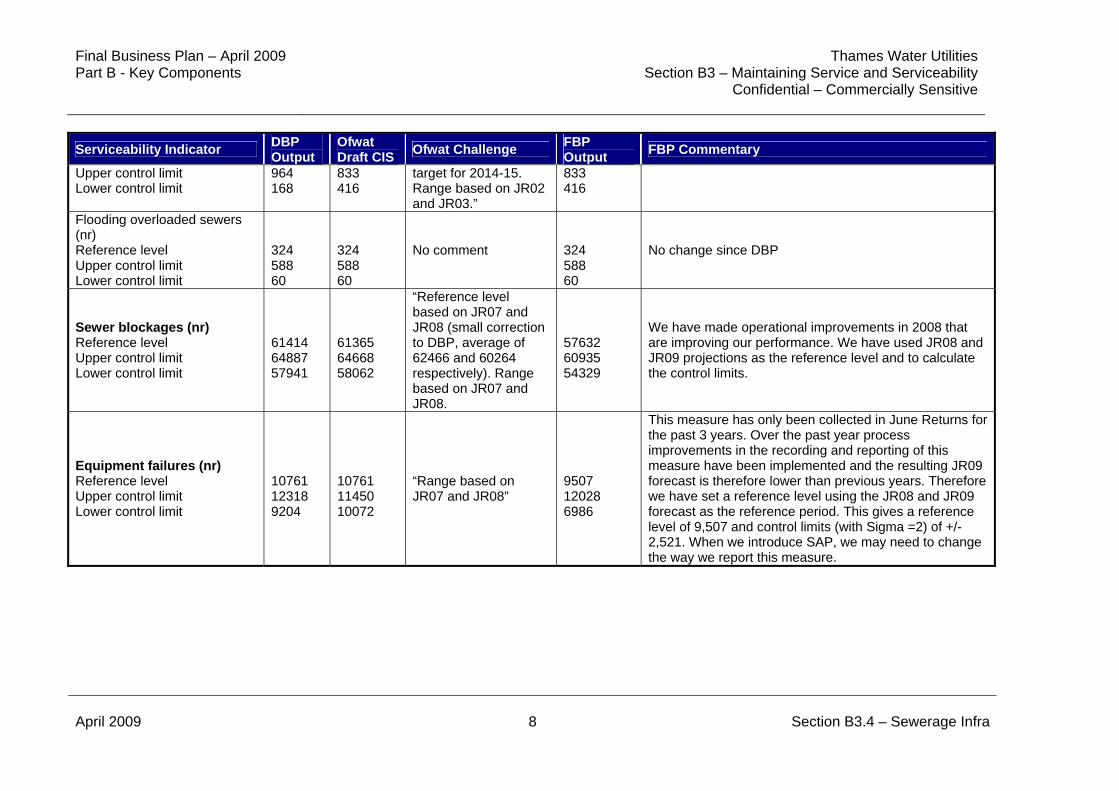
Upper control limit Lower control limit
964 168
833 416
target for 2014-15. Range based on JR02 and JR03.”
833 416
Flooding overloaded sewers (nr) Reference level Upper control limit Lower control limit
324 588 60
324 588 60
No comment
324 588 60
No change since DBP
Sewer blockages (nr) Reference level Upper control limit Lower control limit
61414 64887 57941
61365 64668 58062
“Reference level based on JR07 and JR08 (small correction to DBP, average of 62466 and 60264 respectively). Range based on JR07 and JR08.
57632 60935 54329
We have made operational improvements in 2008 that are improving our performance. We have used JR08 and JR09 projections as the reference level and to calculate the control limits.
Equipment failures (nr) Reference level Upper control limit Lower control limit
10761 12318 9204
10761 11450 10072
“Range based on JR07 and JR08”
9507 12028 6986
This measure has only been collected in June Returns for the past 3 years. Over the past year process improvements in the recording and reporting of this measure have been implemented and the resulting JR09 forecast is therefore lower than previous years. Therefore we have set a reference level using the JR08 and JR09 forecast as the reference period. This gives a reference level of 9,507 and control limits (with Sigma =2) of +/- 2,521. When we introduce SAP, we may need to change the way we report this measure.
Final Business Plan – April 2009 Thames Water UtilitiesPart B - Key Components Section B3 – Maintaining Service and Serviceability Confidential – Commercially Sensitive
April 2009 9 Section B3.4 – Sewerage Infra
Activity Summary
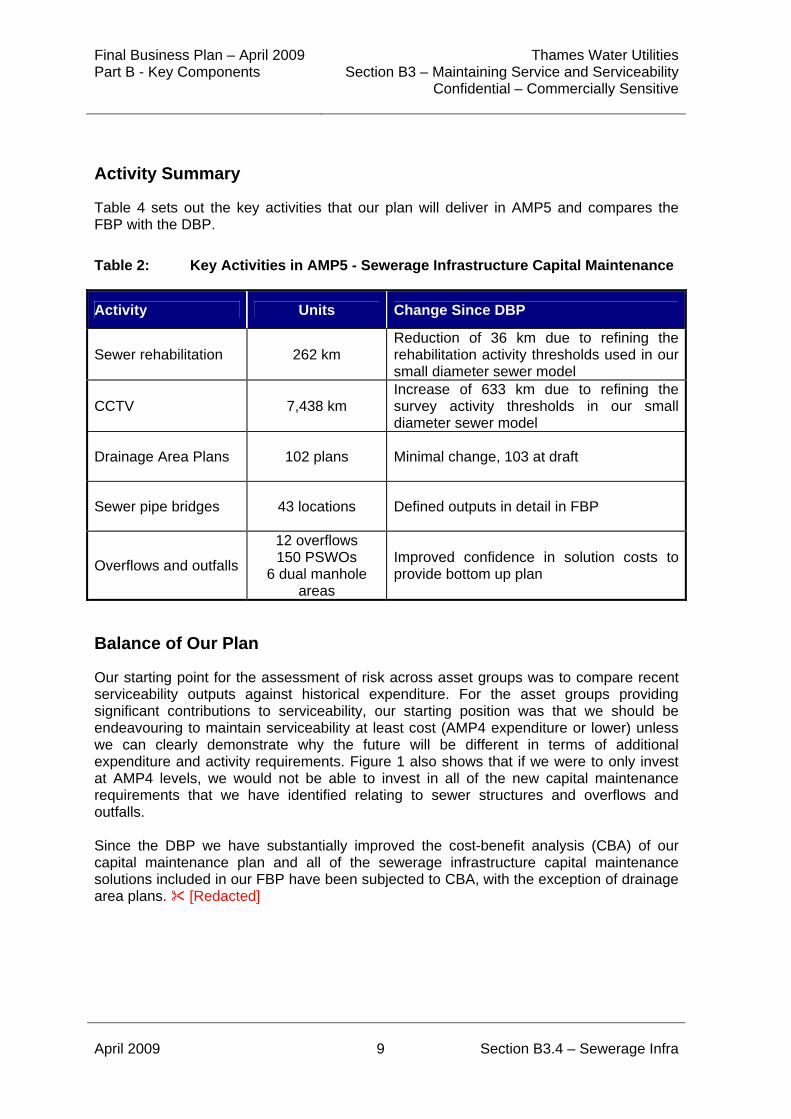
Table 4 sets out the key activities that our plan will deliver in AMP5 and compares the FBP with the DBP.
Table 2: Key Activities in AMP5 - Sewerage Infrastructure Capital Maintenance
Activity Units Change Since DBP
Sewer rehabilitation 262 km Reduction of 36 km due to refining the rehabilitation activity thresholds used in our small diameter sewer model
CCTV 7,438 km Increase of 633 km due to refining the survey activity thresholds in our small diameter sewer model
Drainage Area Plans 102 plans Minimal change, 103 at draft
Sewer pipe bridges 43 locations Defined outputs in detail in FBP
Overflows and outfalls
12 overflows 150 PSWOs
6 dual manhole areas
Improved confidence in solution costs to provide bottom up plan
Balance of Our Plan
Our starting point for the assessment of risk across asset groups was to compare recent serviceability outputs against historical expenditure. For the asset groups providing significant contributions to serviceability, our starting position was that we should be endeavouring to maintain serviceability at least cost (AMP4 expenditure or lower) unless we can clearly demonstrate why the future will be different in terms of additional expenditure and activity requirements. Figure 1 also shows that if we were to only invest at AMP4 levels, we would not be able to invest in all of the new capital maintenance requirements that we have identified relating to sewer structures and overflows and outfalls. Since the DBP we have substantially improved the cost-benefit analysis (CBA) of our capital maintenance plan and all of the sewerage infrastructure capital maintenance solutions included in our FBP have been subjected to CBA, with the exception of drainage area plans. [Redacted]
Final Business Plan – April 2009 Thames Water UtilitiesPart B - Key Components Section B3 – Maintaining Service and Serviceability Confidential – Commercially Sensitive
April 2009 10 Section B3.4 – Sewerage Infra
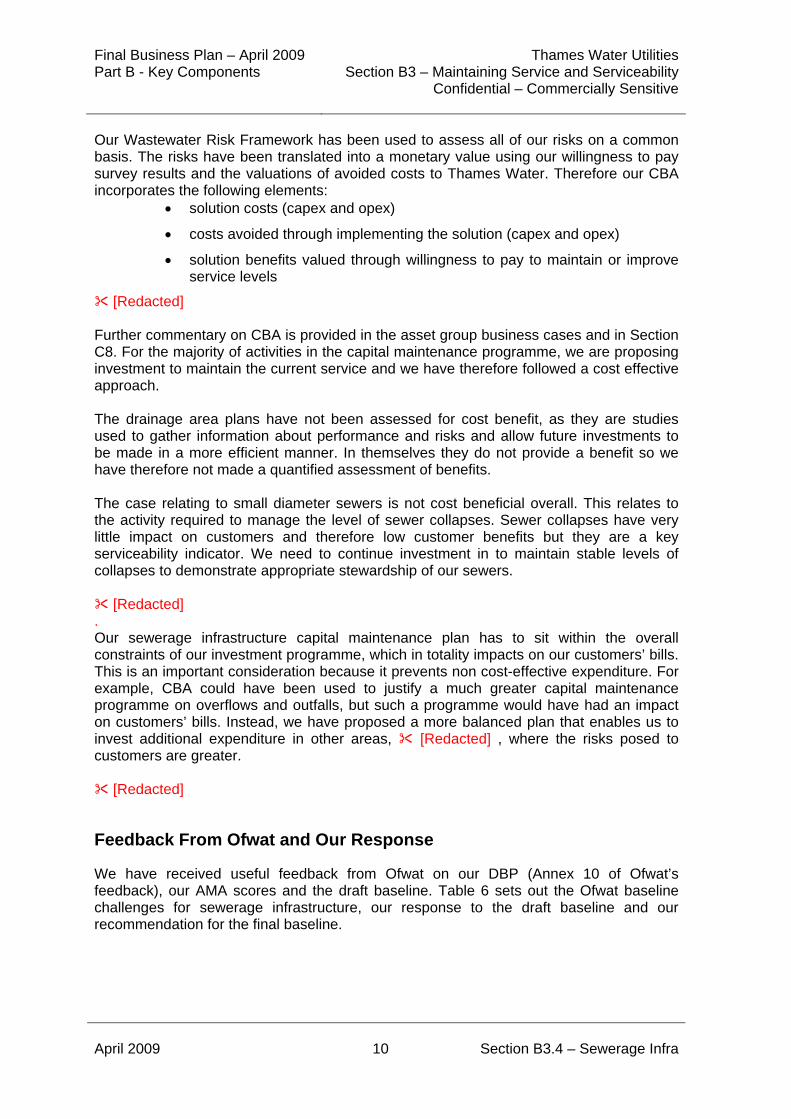
Our Wastewater Risk Framework has been used to assess all of our risks on a common basis. The risks have been translated into a monetary value using our willingness to pay survey results and the valuations of avoided costs to Thames Water. Therefore our CBA incorporates the following elements:
solution costs (capex and opex)
costs avoided through implementing the solution (capex and opex)
solution benefits valued through willingness to pay to maintain or improve service levels
[Redacted] Further commentary on CBA is provided in the asset group business cases and in Section C8. For the majority of activities in the capital maintenance programme, we are proposing investment to maintain the current service and we have therefore followed a cost effective approach. The drainage area plans have not been assessed for cost benefit, as they are studies used to gather information about performance and risks and allow future investments to be made in a more efficient manner. In themselves they do not provide a benefit so we have therefore not made a quantified assessment of benefits. The case relating to small diameter sewers is not cost beneficial overall. This relates to the activity required to manage the level of sewer collapses. Sewer collapses have very little impact on customers and therefore low customer benefits but they are a key serviceability indicator. We need to continue investment in to maintain stable levels of collapses to demonstrate appropriate stewardship of our sewers. [Redacted] . Our sewerage infrastructure capital maintenance plan has to sit within the overall constraints of our investment programme, which in totality impacts on our customers’ bills. This is an important consideration because it prevents non cost-effective expenditure. For example, CBA could have been used to justify a much greater capital maintenance programme on overflows and outfalls, but such a programme would have had an impact on customers’ bills. Instead, we have proposed a more balanced plan that enables us to invest additional expenditure in other areas, [Redacted] , where the risks posed to customers are greater. [Redacted]
Feedback From Ofwat and Our Response
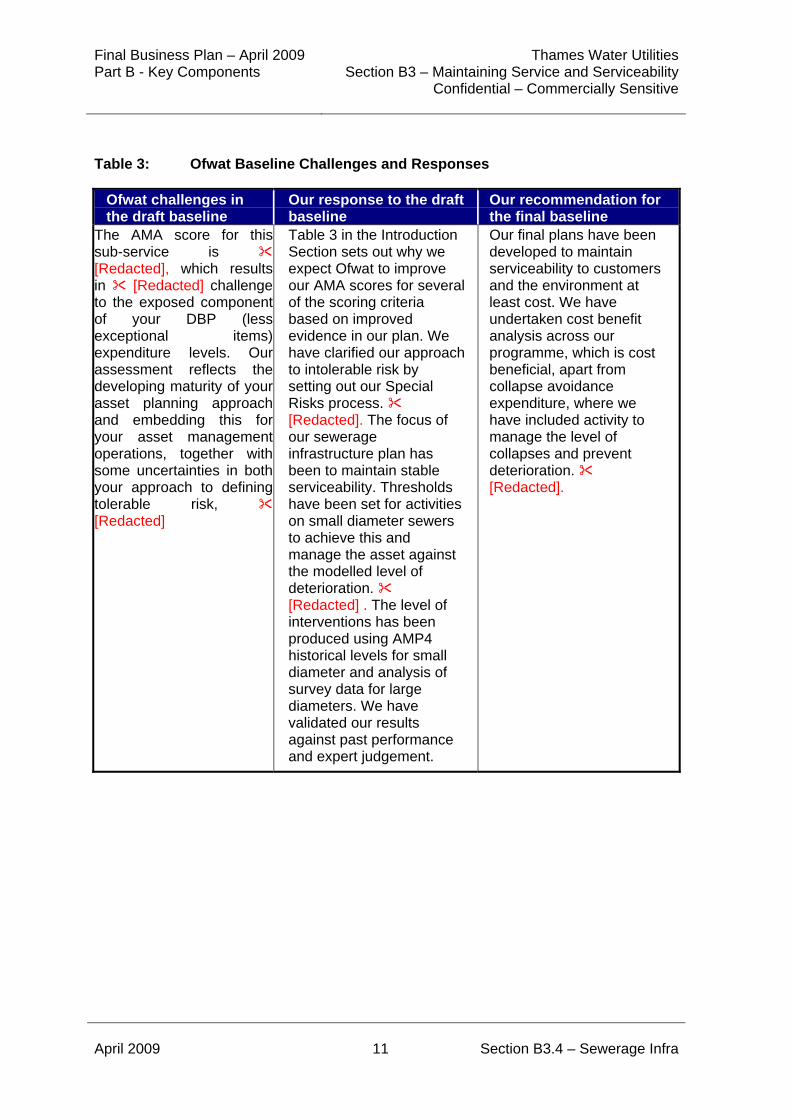
We have received useful feedback from Ofwat on our DBP (Annex 10 of Ofwat’s feedback), our AMA scores and the draft baseline. Table 6 sets out the Ofwat baseline challenges for sewerage infrastructure, our response to the draft baseline and our recommendation for the final baseline.
Final Business Plan – April 2009 Thames Water UtilitiesPart B - Key Components Section B3 – Maintaining Service and Serviceability Confidential – Commercially Sensitive
April 2009 11 Section B3.4 – Sewerage Infra
Table 3: Ofwat Baseline Challenges and Responses
Ofwat challenges in the draft baseline
Our response to the draft baseline
Our recommendation for the final baseline
The AMA score for this sub-service is [Redacted], which results in [Redacted] challenge to the exposed component of your DBP (less exceptional items) expenditure levels. Our assessment reflects the developing maturity of your asset planning approach and embedding this for your asset management operations, together with some uncertainties in both your approach to defining tolerable risk, [Redacted]
Table 3 in the Introduction Section sets out why we expect Ofwat to improve our AMA scores for several of the scoring criteria based on improved evidence in our plan. We have clarified our approach to intolerable risk by setting out our Special Risks process. [Redacted]. The focus of our sewerage infrastructure plan has been to maintain stable serviceability. Thresholds have been set for activities on small diameter sewers to achieve this and manage the asset against the modelled level of deterioration. [Redacted] . The level of interventions has been produced using AMP4 historical levels for small diameter and analysis of survey data for large diameters. We have validated our results against past performance and expert judgement.
Our final plans have been developed to maintain serviceability to customers and the environment at least cost. We have undertaken cost benefit analysis across our programme, which is cost beneficial, apart from collapse avoidance expenditure, where we have included activity to manage the level of collapses and prevent deterioration. [Redacted].
Final Business Plan – April 2009 Thames Water UtilitiesPart B - Key Components Section B3 – Maintaining Service and Serviceability Confidential – Commercially Sensitive
April 2009 12 Section B3.4 – Sewerage Infra
Ofwat challenges in the draft baseline
Our response to the draft baseline
Our recommendation for the final baseline
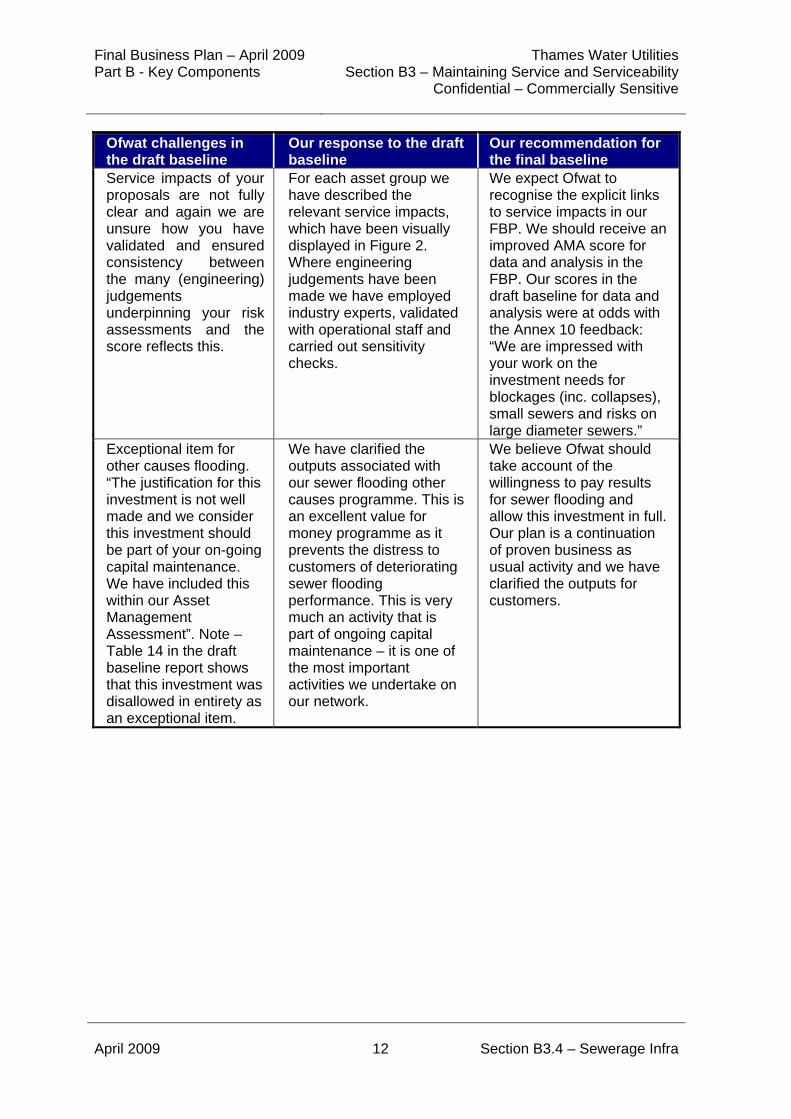
Service impacts of your proposals are not fully clear and again we are unsure how you have validated and ensured consistency between the many (engineering) judgements underpinning your risk assessments and the score reflects this.
For each asset group we have described the relevant service impacts, which have been visually displayed in Figure 2. Where engineering judgements have been made we have employed industry experts, validated with operational staff and carried out sensitivity checks.
We expect Ofwat to recognise the explicit links to service impacts in our FBP. We should receive an improved AMA score for data and analysis in the FBP. Our scores in the draft baseline for data and analysis were at odds with the Annex 10 feedback: “We are impressed with your work on the investment needs for blockages (inc. collapses), small sewers and risks on large diameter sewers.”
Exceptional item for other causes flooding. “The justification for this investment is not well made and we consider this investment should be part of your on-going capital maintenance. We have included this within our Asset Management Assessment”. Note – Table 14 in the draft baseline report shows that this investment was disallowed in entirety as an exceptional item.
We have clarified the outputs associated with our sewer flooding other causes programme. This is an excellent value for money programme as it prevents the distress to customers of deteriorating sewer flooding performance. This is very much an activity that is part of ongoing capital maintenance – it is one of the most important activities we undertake on our network.
We believe Ofwat should take account of the willingness to pay results for sewer flooding and allow this investment in full. Our plan is a continuation of proven business as usual activity and we have clarified the outputs for customers.
Final Business Plan – April 2009 Thames Water UtilitiesPart B - Key Components Section B3 – Maintaining Service and Serviceability Confidential – Commercially Sensitive
April 2009 13 Section B3.4 – Sewerage Infra
Ofwat challenges in the draft baseline
Our response to the draft baseline
Our recommendation for the final baseline
Transfer of Manhole cover replacement, CCTV surveys, reactive repair of sewer ancillaries, residual blockages work in SDACs, rising mains burst repairs and gravity sewer collapse repairs from IRE to opex.
Our solutions in DBP were inappropriately named. The business cases set out our investment requirement. We have met with the Auditor and Reporter to present our capitalisation policy and they agree with our accounting treatment. The Reporter will comment on this in the Reporter’s Report. In our FBP, we have removed the block solutions for blockages and CCTV surveys and assigned the activities on a bottom-up basis to the relevant asset groups. The rehabilitation of collapses, bursts and ancillaries has always been allocated to IRE. We were not challenged on these items at FD04 and therefore the draft baseline was a surprise to us.
We believe our proposals for manhole cover replacement, burst and collapse rehabilitation, sewer ancillaries rehabilitation and asset maintenance work in blockage hotspots should be funded in full as IRE in the final baseline.
In addition to the draft baseline, Ofwat has provided us with the breakdown of AMA score for sewerage infrastructure. [Redacted]. [Redacted], our Executive Summary has highlighted the generic improvements that we have made in response to the draft CIS baseline and how these should be reflected in higher AMA scores in the draft and final determinations. Table 6 provides our response to the specific sewerage infrastructure challenges in the draft baseline, which again should improve our AMA score. The following sections set out our compelling business cases by asset group. These cases provide the justification and the evidence for complete funding of our sewerage infrastructure capital maintenance case. They also set out the impacts of the ‘no investment’ scenario because they clearly set out the benefits that we have attached to our investments.
Final Business Plan – April 2009 Thames Water UtilitiesPart B - Key Components Section B3 – Maintaining Service and Serviceability Confidential – Commercially Sensitive
April 2009 14 Section B3.4 – Sewerage Infra
B3.4.2 Serviceability – Historical Analysis
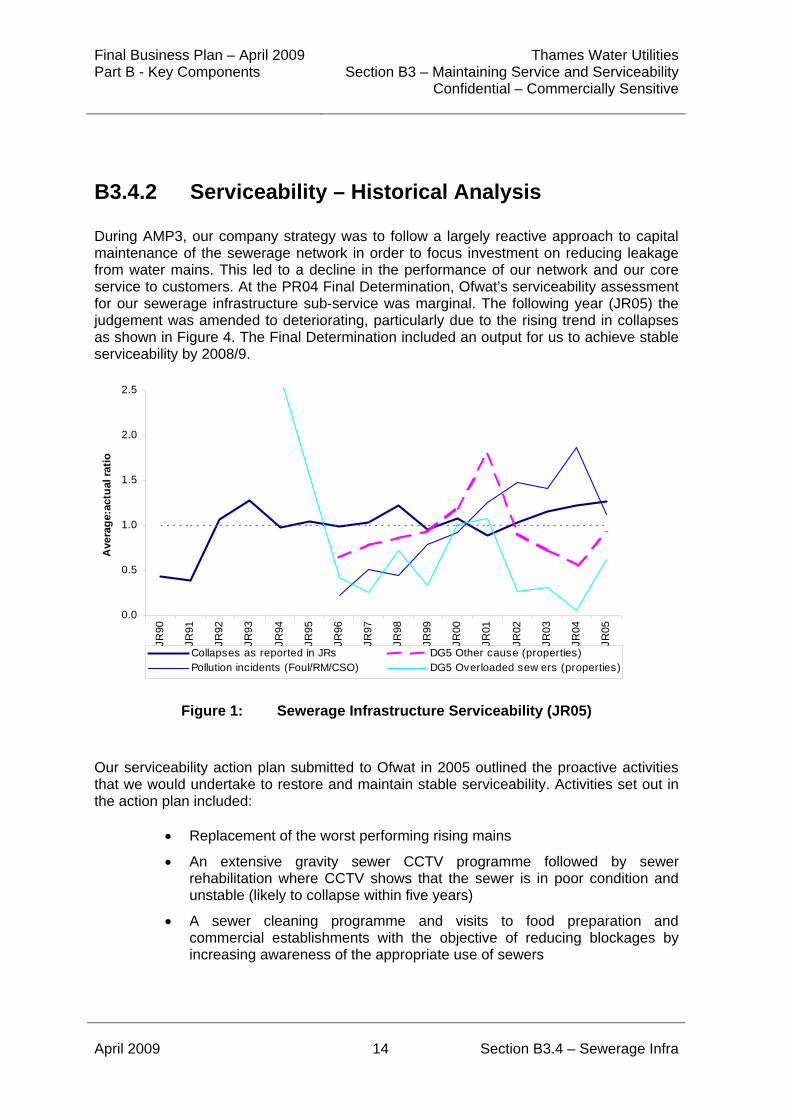
During AMP3, our company strategy was to follow a largely reactive approach to capital maintenance of the sewerage network in order to focus investment on reducing leakage from water mains. This led to a decline in the performance of our network and our core service to customers. At the PR04 Final Determination, Ofwat’s serviceability assessment for our sewerage infrastructure sub-service was marginal. The following year (JR05) the judgement was amended to deteriorating, particularly due to the rising trend in collapses as shown in Figure 4. The Final Determination included an output for us to achieve stable serviceability by 2008/9.
0.0
0.5
1.0
1.5
2.0
2.5
JR90
JR91
JR92
JR93
JR94
JR95
JR96
JR97
JR98
JR99
JR00
JR01
JR02
JR03
JR04
JR05
Ave
rag
e:ac
tual
rat
io
Collapses as reported in JRs DG5 Other cause (properties)Pollution incidents (Foul/RM/CSO) DG5 Overloaded sew ers (properties)
Figure 1: Sewerage Infrastructure Serviceability (JR05)
Our serviceability action plan submitted to Ofwat in 2005 outlined the proactive activities that we would undertake to restore and maintain stable serviceability. Activities set out in the action plan included:
Replacement of the worst performing rising mains
An extensive gravity sewer CCTV programme followed by sewer rehabilitation where CCTV shows that the sewer is in poor condition and unstable (likely to collapse within five years)
A sewer cleaning programme and visits to food preparation and commercial establishments with the objective of reducing blockages by increasing awareness of the appropriate use of sewers
Final Business Plan – April 2009 Thames Water UtilitiesPart B - Key Components Section B3 – Maintaining Service and Serviceability Confidential – Commercially Sensitive
April 2009 15 Section B3.4 – Sewerage Infra
Work at high-risk sites (eg sewers that cross railway lines) with inspection by CCTV or man-entry as appropriate and subsequent rehabilitation if inspection shows that this is necessary.
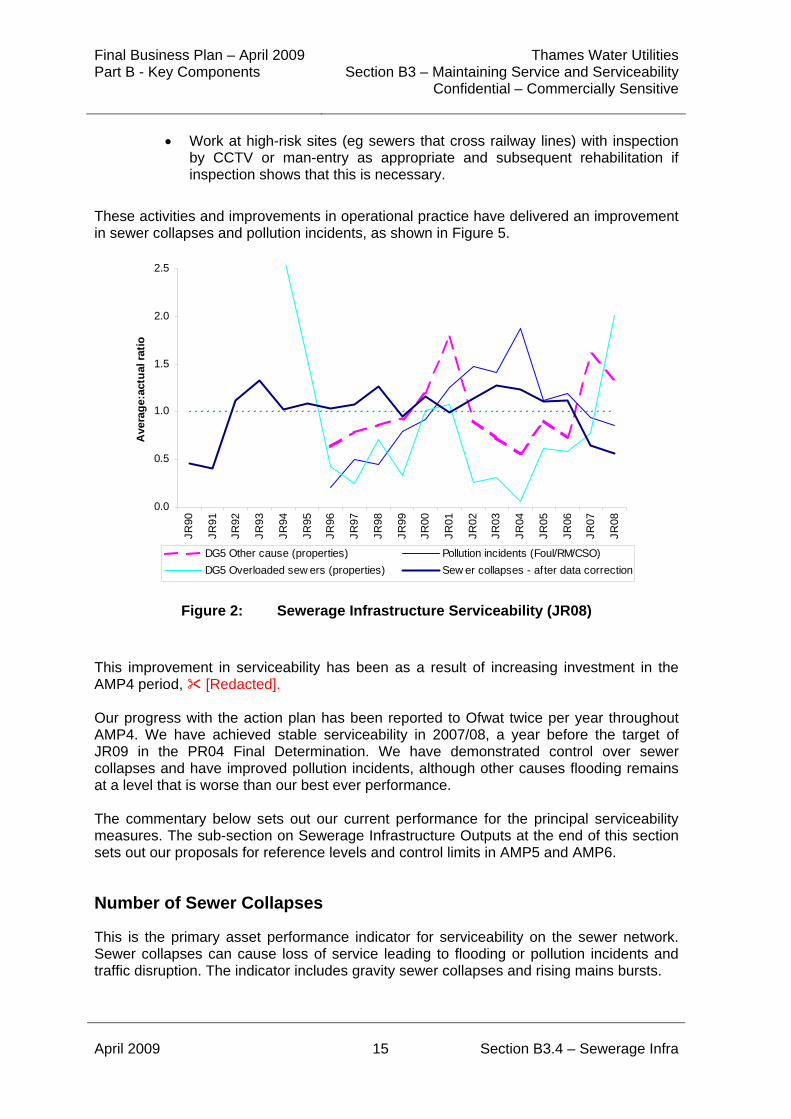
These activities and improvements in operational practice have delivered an improvement in sewer collapses and pollution incidents, as shown in Figure 5.
0.0
0.5
1.0
1.5
2.0
2.5
JR90
JR91
JR92
JR93
JR94
JR95
JR96
JR97
JR98
JR99
JR00
JR01
JR02
JR03
JR04
JR05
JR06
JR07
JR08
Ave
rag
e:ac
tual
rat
io
DG5 Other cause (properties) Pollution incidents (Foul/RM/CSO)
DG5 Overloaded sew ers (properties) Sew er collapses - after data correction
Figure 2: Sewerage Infrastructure Serviceability (JR08)
This improvement in serviceability has been as a result of increasing investment in the AMP4 period, [Redacted]. Our progress with the action plan has been reported to Ofwat twice per year throughout AMP4. We have achieved stable serviceability in 2007/08, a year before the target of JR09 in the PR04 Final Determination. We have demonstrated control over sewer collapses and have improved pollution incidents, although other causes flooding remains at a level that is worse than our best ever performance. The commentary below sets out our current performance for the principal serviceability measures. The sub-section on Sewerage Infrastructure Outputs at the end of this section sets out our proposals for reference levels and control limits in AMP5 and AMP6.
Number of Sewer Collapses
This is the primary asset performance indicator for serviceability on the sewer network. Sewer collapses can cause loss of service leading to flooding or pollution incidents and traffic disruption. The indicator includes gravity sewer collapses and rising mains bursts.
Final Business Plan – April 2009 Thames Water UtilitiesPart B - Key Components Section B3 – Maintaining Service and Serviceability Confidential – Commercially Sensitive
April 2009 16 Section B3.4 – Sewerage Infra
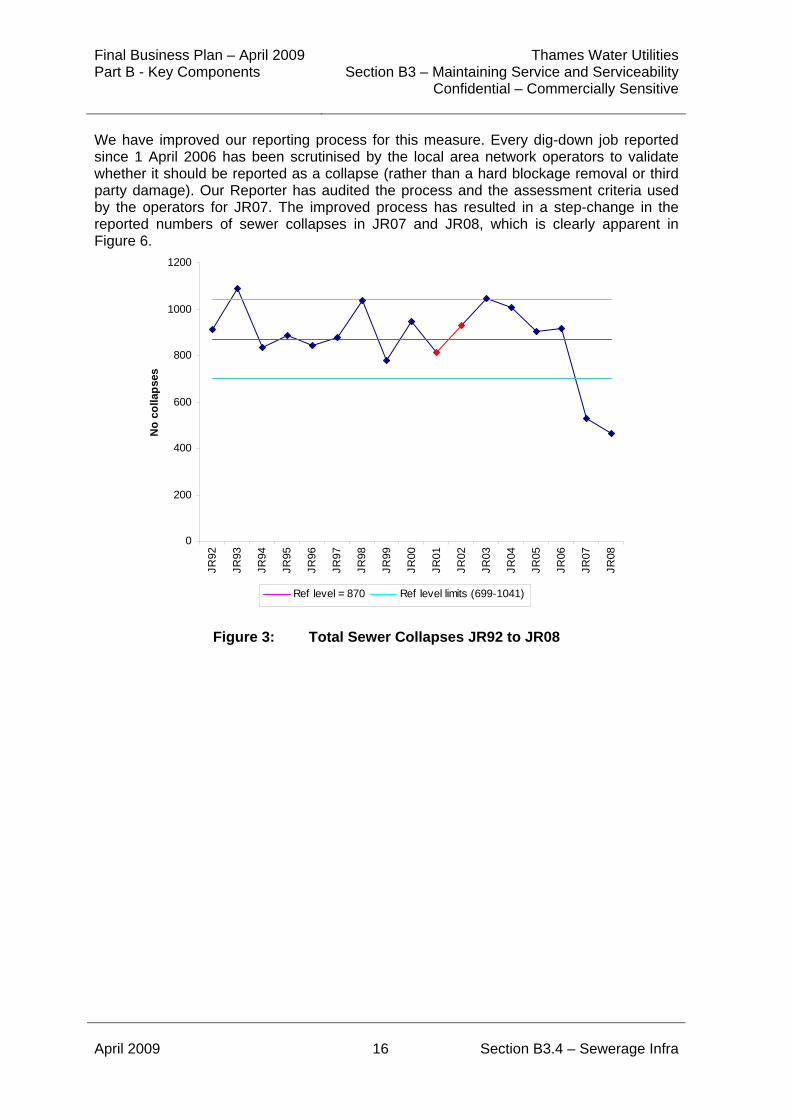
We have improved our reporting process for this measure. Every dig-down job reported since 1 April 2006 has been scrutinised by the local area network operators to validate whether it should be reported as a collapse (rather than a hard blockage removal or third party damage). Our Reporter has audited the process and the assessment criteria used by the operators for JR07. The improved process has resulted in a step-change in the reported numbers of sewer collapses in JR07 and JR08, which is clearly apparent in Figure 6.
0
200
400
600
800
1000
1200
JR92
JR93
JR94
JR95
JR96
JR97
JR98
JR99
JR00
JR01
JR02
JR03
JR04
JR05
JR06
JR07
JR08
No
co
llap
ses
Ref level = 870 Ref level limits (699-1041)
Figure 3: Total Sewer Collapses JR92 to JR08
Final Business Plan – April 2009 Thames Water UtilitiesPart B - Key Components Section B3 – Maintaining Service and Serviceability Confidential – Commercially Sensitive
April 2009 17 Section B3.4 – Sewerage Infra
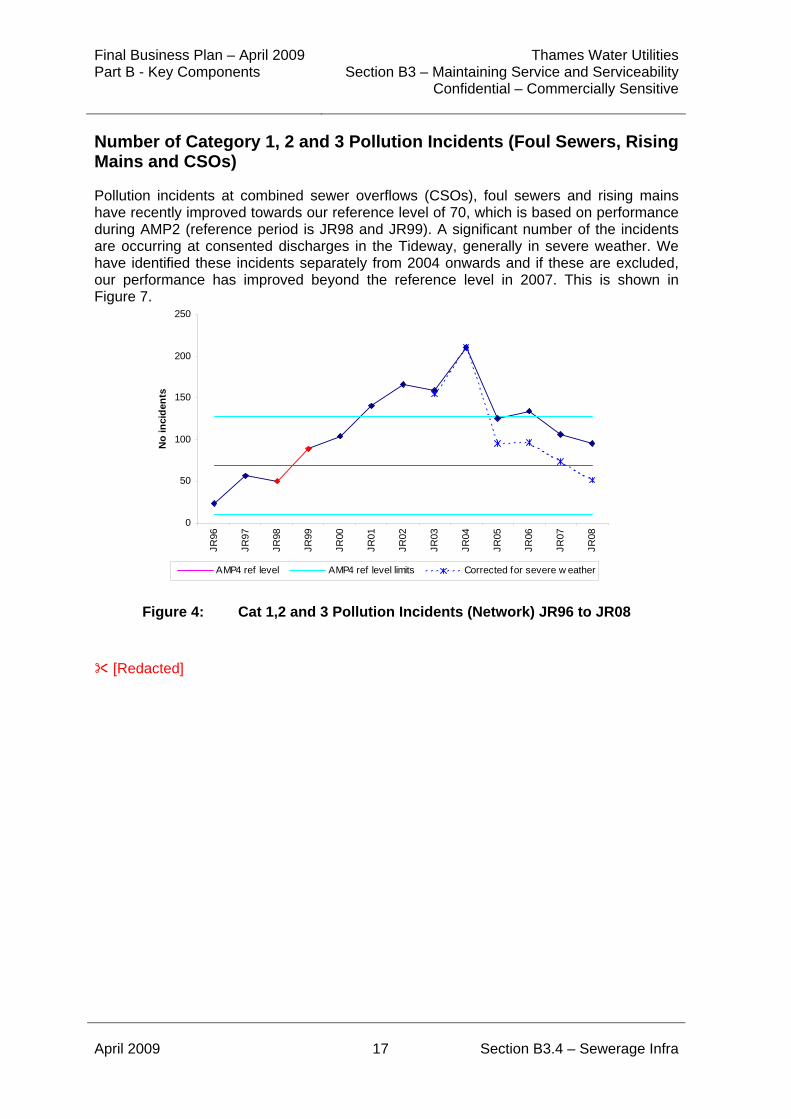
Number of Category 1, 2 and 3 Pollution Incidents (Foul Sewers, Rising Mains and CSOs)
Pollution incidents at combined sewer overflows (CSOs), foul sewers and rising mains have recently improved towards our reference level of 70, which is based on performance during AMP2 (reference period is JR98 and JR99). A significant number of the incidents are occurring at consented discharges in the Tideway, generally in severe weather. We have identified these incidents separately from 2004 onwards and if these are excluded, our performance has improved beyond the reference level in 2007. This is shown in Figure 7.
0
50
100
150
200
250
JR96
JR97
JR98
JR99
JR00
JR01
JR02
JR03
JR04
JR05
JR06
JR07
JR08
No
inci
den
ts
AMP4 ref level AMP4 ref level limits Corrected for severe w eather
Figure 4: Cat 1,2 and 3 Pollution Incidents (Network) JR96 to JR08
[Redacted]
Final Business Plan – April 2009 Thames Water UtilitiesPart B - Key Components Section B3 – Maintaining Service and Serviceability Confidential – Commercially Sensitive
April 2009 18 Section B3.4 – Sewerage Infra
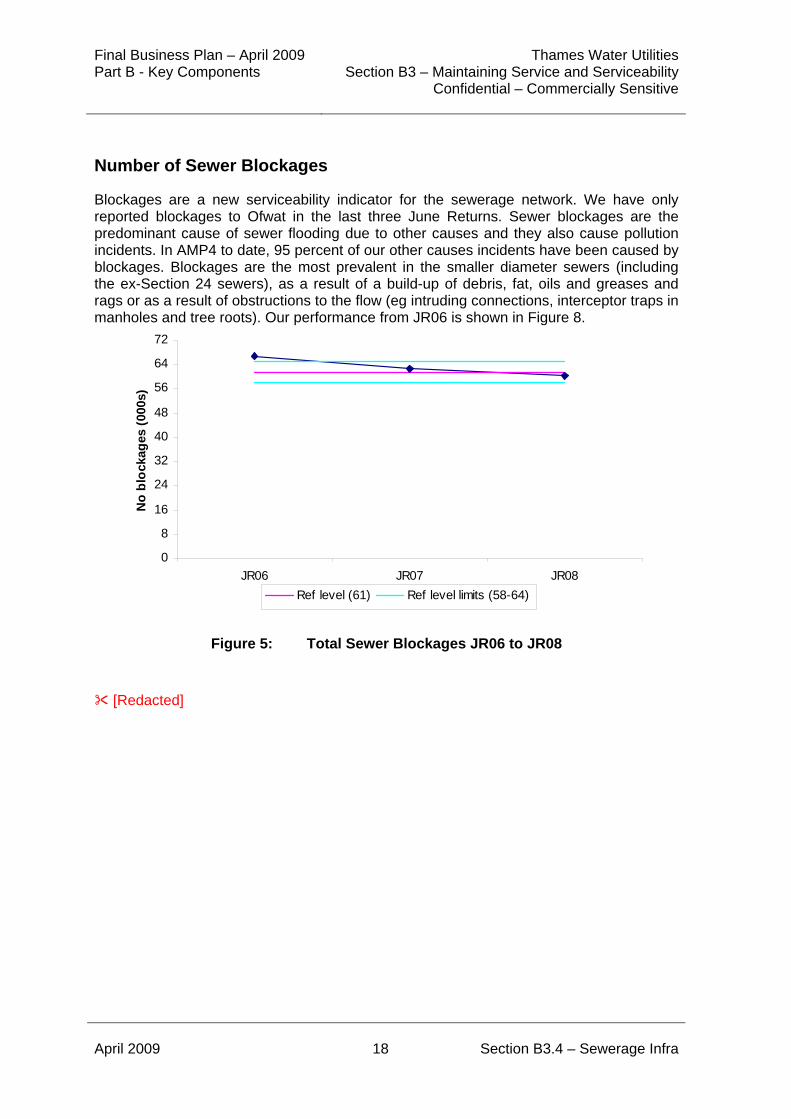
Number of Sewer Blockages
Blockages are a new serviceability indicator for the sewerage network. We have only reported blockages to Ofwat in the last three June Returns. Sewer blockages are the predominant cause of sewer flooding due to other causes and they also cause pollution incidents. In AMP4 to date, 95 percent of our other causes incidents have been caused by blockages. Blockages are the most prevalent in the smaller diameter sewers (including the ex-Section 24 sewers), as a result of a build-up of debris, fat, oils and greases and rags or as a result of obstructions to the flow (eg intruding connections, interceptor traps in manholes and tree roots). Our performance from JR06 is shown in Figure 8.
0
8
16
24
32
40
48
56
64
72
JR06 JR07 JR08
No
blo
ckag
es (
000s
)
Ref level (61) Ref level limits (58-64)
Figure 5: Total Sewer Blockages JR06 to JR08
[Redacted]
Final Business Plan – April 2009 Thames Water UtilitiesPart B - Key Components Section B3 – Maintaining Service and Serviceability Confidential – Commercially Sensitive
April 2009 19 Section B3.4 – Sewerage Infra
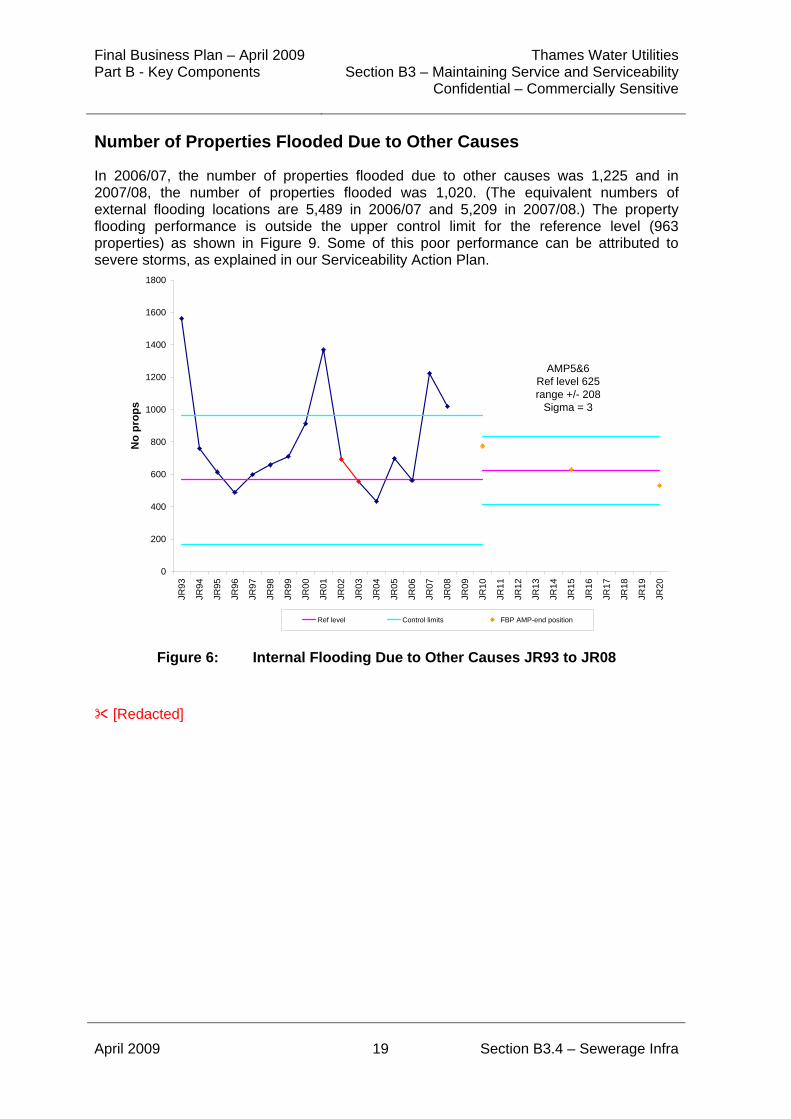
Number of Properties Flooded Due to Other Causes
In 2006/07, the number of properties flooded due to other causes was 1,225 and in 2007/08, the number of properties flooded was 1,020. (The equivalent numbers of external flooding locations are 5,489 in 2006/07 and 5,209 in 2007/08.) The property flooding performance is outside the upper control limit for the reference level (963 properties) as shown in Figure 9. Some of this poor performance can be attributed to severe storms, as explained in our Serviceability Action Plan.
0
200
400
600
800
1000
1200
1400
1600
1800
JR93
JR94
JR95
JR96
JR97
JR98
JR99
JR00
JR01
JR02
JR03
JR04
JR05
JR06
JR07
JR08
JR09
JR10
JR11
JR12
JR13
JR14
JR15
JR16
JR17
JR18
JR19
JR20
No
pro
ps
Ref level Control limits FBP AMP-end position
AMP5&6Ref level 625range +/- 208
Sigma = 3
Figure 6: Internal Flooding Due to Other Causes JR93 to JR08
[Redacted]
Final Business Plan – April 2009 Thames Water UtilitiesPart B - Key Components Section B3 – Maintaining Service and Serviceability Confidential – Commercially Sensitive
April 2009 20 Section B3.4 – Sewerage Infra
Sewer Flooding Due to Overloaded Sewers
Sewer flooding due to overloaded sewers is commented on in detail in Section B6. Recent performance has been disproportionately affected by severe weather events in 2007 (especially extensive flooding in July). Removal of those properties flooded in severe weather shows a stable performance against this measure, as shown in Figure 10. [Redacted]
Figure 7: Internal Flooding Due to Overloaded Sewers JR91 to JR08
The following sections set out our business cases for the following asset groups:
Small diameter sewers
Rising mains
Large diameter sewers
Sewers crossing railways
Network overflows and outfalls
Sewer structures
Drainage area plans
Diversions
The final section in this chapter summarises the key serviceability outputs related to the sewerage infrastructure assets.
Final Business Plan – April 2009 Thames Water UtilitiesPart B - Key Components Section B3 – Maintaining Service and Serviceability Confidential – Commercially Sensitive
April 2009 21 Section B3.4 – Sewerage Infra
B3.4.3 Small Diameter Sewers
B3.4.3.1 Overview
This section sets out our business case for capital maintenance investment of [Redacted] in small diameter sewers in AMP5. After efficiency, this is a reduction of expenditure of £30.7m compared with AMP4 (this reduction is offset by our planned expenditure on drainage area plans and large diameter sewers). The business case includes the following asset types:
Critical sewers less than 450mm diameter, accounting for 9,689km of our network
All of our non-critical sewers, accounting for 48,416km of our network, split further into:
Section 24 sewers (19,542km)
Non-critical sewers excluding Section 24 sewers (28,875km)
Most of our blockages and other causes flooding events are related to the small diameter sewer network. Therefore, the main driver for this asset group is to maintain stable serviceability using the cost effective objective of the common framework.
B3.4.3.2 Historical Context
Historically, most of our survey and proactive activity has been on critical sewers in line with the standard industry practice set out in the Sewerage Rehabilitation Manual. However, most of our serviceability issues result from failures on smaller diameter sewers and therefore during AMP4, we have developed and implemented planned strategies for managing serviceability of non-critical sewers. Our expenditure on small diameter sewers can be broken down into four main categories: planned CCTV and rehabilitation to prevent collapses; alleviation of other causes flooding problems; rehabilitation of collapsed sewers; and replacement of defective manhole covers. Our recent expenditure on this asset group in totality is shown in Table 8.
Final Business Plan – April 2009 Thames Water UtilitiesPart B - Key Components Section B3 – Maintaining Service and Serviceability Confidential – Commercially Sensitive
April 2009 22 Section B3.4 – Sewerage Infra
[Redacted] For ease of reporting, we have broken down the following sections of this asset group business case by activity type. The activity types presented are:
Collapse avoidance
Blockage avoidance (new work not reflected in AMP4 spend)
Other causes flooding avoidance
Rehabilitation of collapsed sewers
Manhole cover replacements
During AMP3, we undertook very little planned CCTV and rehabilitation work as our focus was on leakage from our water infrastructure assets rather than sewerage infrastructure activity. During AMP4, we have significantly increased our survey work. This has enabled us to identify and rehabilitate a proportion of sewers in condition grades 4 and 5 that our engineers consider to be in imminent danger of collapse. Our approach has enabled us to restore and maintain stable serviceability. Our expenditure on collapse avoidance is shown in Table 9. There has been a clear increase in expenditure during AMP4. [Redacted]
B3.4.3.4 Collapse Avoidance
Statement of Needs
Sewer collapses is the principal indicator used by Ofwat to assess the serviceability of our sewerage infrastructure sub-service each regulatory year. As part of our regulatory contract, we are required to maintain stable serviceability. Our deterioration modelling has confirmed that sewers are very long-life assets with low deterioration rates compared with water mains and M&E equipment. For this reason, we have decided to use past performance as our best indicator of future performance as we do not expect the short-term future to be significantly different from the past. Our work on deterioration modelling is discussed further in the following sensitivity analysis section. [Redacted] Our Asset Planning team has split our large STW catchments into more manageable geographical areas that can be used for investment planning. [Redacted] [Redacted] analysis has enabled us to identify the SDACs that we need to target in order to deliver cost-effective solutions to manage the risk of collapse across the whole of our region.
Final Business Plan – April 2009 Thames Water UtilitiesPart B - Key Components Section B3 – Maintaining Service and Serviceability Confidential – Commercially Sensitive
April 2009 23 Section B3.4 – Sewerage Infra
We have also undertaken an exercise to understand the likelihood of a collapse leading to a service failure. However, we were unable to obtain any statistically significant relationships between the attributes of a collapsed sewer and its propensity to cause a service impact. Therefore, at present, we need to rely on simple relationships between collapses and flooding that are reported at company level in the June Return. Sewer collapses are relatively rare occurrences, which generally occur due to very gradual deterioration of the fabric of the sewer. The deterioration is often associated with external factors such as ground disturbance. Collapses cause a very small percentage of the service issues that customers see. In AMP4 to date, only 4% of our internal and 2% of our external sewer flooding other causes incidents have been caused by sewer collapses. [Redacted]
Final Business Plan – April 2009 Thames Water UtilitiesPart B - Key Components Section B3 – Maintaining Service and Serviceability Confidential – Commercially Sensitive
April 2009 24 Section B3.4 – Sewerage Infra
B3.4.3.5 Blockage Avoidance
Historical Context
Our blockage rate is the highest in the country. This rate is correlated to the relative proportion of Section 24 sewers – which is higher in the Inner London area than elsewhere in the country. Table 17 sets out our estimated distribution of blockage rates and number of blockages by sewer type in the report year 2007/08. [Redacted] During AMP4, we have undertaken a comprehensive review of our current routine blockage clearing processes. We have undertaken a trial in West London and as a result we have identified actions that will enable us to reduce the number of repeat blockages occurring within 12 months at the same location. As well as blockage clearing activities including sewer cleaning, our operational area offices send ‘Bag it and Bin It’ educational leaflets to areas where blockage problems are occurring. We have also undertaken 1,000 pollution prevention visits to food service establishments to educate them on appropriate disposal of kitchen waste products. A number of these visits have occurred in conjunction with an Environmental Health Officer from the local authority. We contributed to the WRc Fats, Oils and Greases (FOG) collaborative project. As part of this project we used 100 sensors in the Aylesbury catchment to pilot the proactive management of the sewerage network. We undertook studies to determine what types of wastes are flushable and a trial of a bacterial dosing project to break down FOG was undertaken.
[Redacted]
Statement of Needs
We need to manage our blockage performance to help maintain serviceability with respect to the blockages and flooding other causes measures. [Redacted]
Final Business Plan – April 2009 Thames Water UtilitiesPart B - Key Components Section B3 – Maintaining Service and Serviceability Confidential – Commercially Sensitive
April 2009 25 Section B3.4 – Sewerage Infra
B3.4.3.7 Other Causes Flooding
Historical Context
As part of our sewerage infrastructure serviceability action plan we have been investigating the causes of other causes flooding incidents. Some of these prove to be due to structural anomalies in the sewers (eg dropped joints, interceptor traps) that can act as the starting point for a blockage. These are remedied by minor capital works that improve the sewer by removing the defect. Where the cause is related to tree roots blocking the sewer, we remove the roots and then line the sewer to prevent further ingress and to prevent future blockages and flooding. Other incidents are caused by misuse of our sewers or accumulation of sediment over time. For these incidents regular operational maintenance (eg cleaning or jetting) is required to prevent the likelihood of a further blockage. In AMP4, we have created additional positions in our regional offices to manage the programme of investigation for properties that have flooded more than once due to other causes within the last 10 years. These investigations will further improve our understanding of the causes and propensity for sewers in differing situations to block and thereby enable more proactive management to prevent blockages occurring. [Redacted]
Statement of Need
Throughout our research, customers and stakeholders alike view flooding from sewage as totally unacceptable. Our sewer flooding team maintains a detailed other causes flooding output delivery forecast for all six of our current operational areas. As of 1 December 2008, we had identified capital solutions to 1,873 properties and locations (excluding private drainage issues and incidents due to collapses) and operational solutions to 1,751 properties and locations (excluding private drainage issues and incidents due to collapses). This equates to 500 capital solutions per year and 467 operational solutions per year when averaged over the AMP4 period to date (45 months). Over 1,000 properties and locations flood for the first time each year and a proportion of these will become repeat flooding problems. Analysis of our SFHD since the start of AMP4 shows that 1 in 12.9 of first time floods has become a repeat within four years. Where a property has already suffered repeat flooding, the SFHD shows that the flooding is likely to reoccur every 2.4 years on average. Our current AMP4 performance, as shown earlier in Figure 9, shows that it is vital that we continue to undertake a programme of work in this area to maintain stable serviceability. Despite an extensive AMP4 programme, our current performance is currently some way above our best ever performance that is reflected in our serviceability reference level. [Redacted]
Final Business Plan – April 2009 Thames Water UtilitiesPart B - Key Components Section B3 – Maintaining Service and Serviceability Confidential – Commercially Sensitive
April 2009 26 Section B3.4 – Sewerage Infra
B3.4.3.8 Rehabilitation of Collapsed Sewers
[Redacted]
Statement of Needs
When a sewer collapses, we restore the integrity of the sewer to condition grade 3 or better in order to return the sewer to service and to extend its asset life. Efficient and effective rehabilitation of sewer collapses is required to minimise customer and environmental impacts. Based on our current Medium Term Plan for sewerage infrastructure, we expect to rehabilitate 415 collapsed sewers in 2009/10. We have assumed that this level of activity will continue in AMP5 as our overall strategy for sewer collapses is to maintain performance at the serviceability reference level throughout AMP5. [Redacted]
Final Business Plan – April 2009 Thames Water UtilitiesPart B - Key Components Section B3 – Maintaining Service and Serviceability Confidential – Commercially Sensitive
April 2009 27 Section B3.4 – Sewerage Infra
B3.4.3.9 Manhole Cover Replacement
[Redacted]
Statement of Needs
Replacement of covers is carried out under Section 81 of the New Roads and Street Works Act, which requires undertakers to ensure that any of their apparatus in a street is maintained to the satisfaction of the street authority. Activities are also undertaken as a result of customer contacts. Clearly damaged, ill-fitted or missing manhole covers present health and safety risks to traffic and pedestrians. Poorly fitting covers can also result in noise nuisance. Anecdotal evidence of manhole related motorcycle accidents is collected by pressure groups [Redacted]. Currently, no official figures are available. Police ‘accident reports’ (STATS19) are not set up to record the role of manholes in traffic accidents. There are examples of recent news articles reporting incidents of manhole cover theft (for scrap value) in London. Although this has obvious health and safety concerns, it is a relatively rare occurrence. [Redacted]
Final Business Plan – April 2009 Thames Water UtilitiesPart B - Key Components Section B3 – Maintaining Service and Serviceability Confidential – Commercially Sensitive
April 2009 28 Section B3.4 – Sewerage Infra
B3.4.4 Rising Mains
This section sets out our business case for capital maintenance investment [Redacted] in rising mains in AMP5. [Redacted].
B3.4.4.1 Historical Context
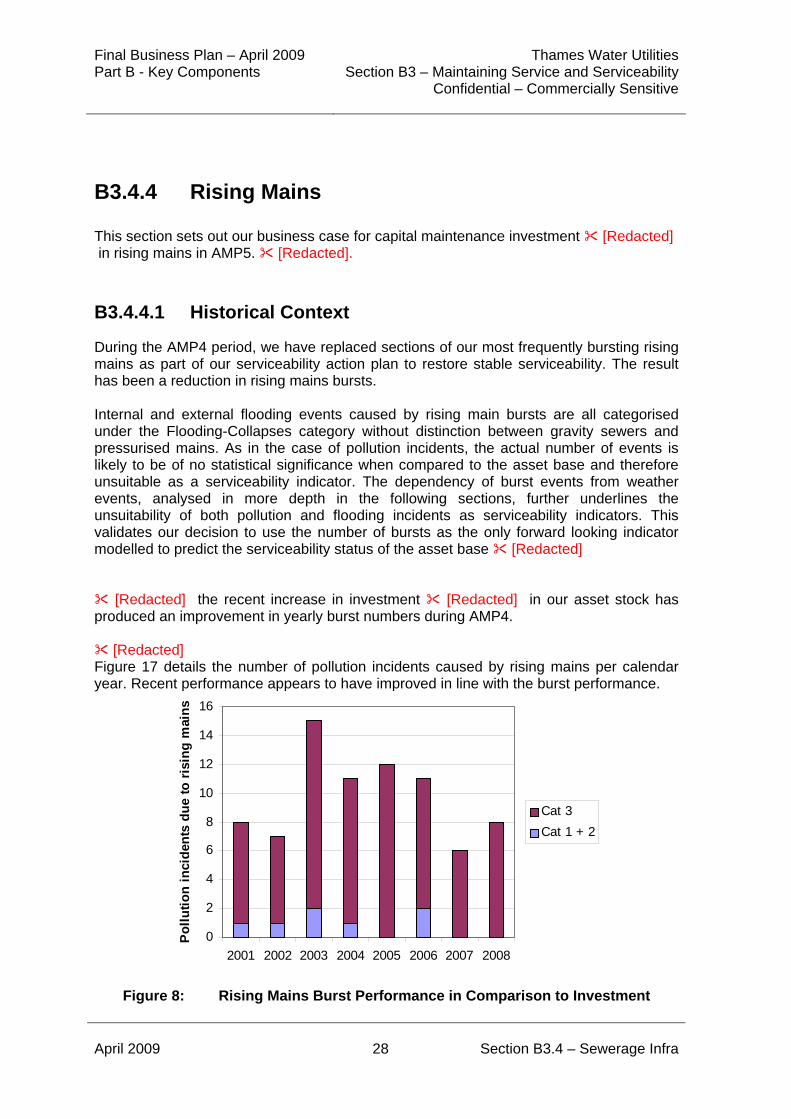
During the AMP4 period, we have replaced sections of our most frequently bursting rising mains as part of our serviceability action plan to restore stable serviceability. The result has been a reduction in rising mains bursts. Internal and external flooding events caused by rising main bursts are all categorised under the Flooding-Collapses category without distinction between gravity sewers and pressurised mains. As in the case of pollution incidents, the actual number of events is likely to be of no statistical significance when compared to the asset base and therefore unsuitable as a serviceability indicator. The dependency of burst events from weather events, analysed in more depth in the following sections, further underlines the unsuitability of both pollution and flooding incidents as serviceability indicators. This validates our decision to use the number of bursts as the only forward looking indicator modelled to predict the serviceability status of the asset base [Redacted] [Redacted] the recent increase in investment [Redacted] in our asset stock has produced an improvement in yearly burst numbers during AMP4. [Redacted] Figure 17 details the number of pollution incidents caused by rising mains per calendar year. Recent performance appears to have improved in line with the burst performance.
0
2
4
6
8
10
12
14
16
2001 2002 2003 2004 2005 2006 2007 2008
Po
llu
tio
n i
nci
den
ts d
ue
to r
isin
g m
ain
s
Cat 3
Cat 1 + 2
Figure 8: Rising Mains Burst Performance in Comparison to Investment
Final Business Plan – April 2009 Thames Water UtilitiesPart B - Key Components Section B3 – Maintaining Service and Serviceability Confidential – Commercially Sensitive
April 2009 29 Section B3.4 – Sewerage Infra
[Redacted]
B3.4.4.3 Statement of Need
The main objective for the rising mains asset group is to maintain stable burst performance and to manage the risk of burst mains causing customer and environmental impacts. Bursts are a subset of the sewer collapses indicator that Ofwat uses as the principal indicator to inform its annual view of sewerage infrastructure serviceability. [Redacted] .
Final Business Plan – April 2009 Thames Water UtilitiesPart B - Key Components Section B3 – Maintaining Service and Serviceability Confidential – Commercially Sensitive
April 2009 30 Section B3.4 – Sewerage Infra
B3.4.5 Large Diameter Sewers
B3.4.5.1 Overview
This section sets out our business case for capital maintenance investment [Redacted] in large diameter sewers in AMP5. [Redacted] [Redacted] Although failures are relatively infrequent, the rehabilitation costs of sewer failures are significant for most sewers greater than 450mm to 900mm diameter and very significant for our largest diameter sewers (>900mm diameter). [Redacted]
B3.4.5.2 Historical Context
As part of our serviceability action plan, we have successfully commenced a number of business improvements to manage our sewerage infrastructure assets and have restored stability to our network. The activities have concentrated on small diameter sewers, sewers crossing railways and rising mains, rather than our group of larger diameter assets. [Redacted]
B3.4.5.3 Statement of Need
The main need for this asset group is to maintain current levels of collapse performance. We also need to fully understand and then maintain our understanding of the risk of failure. [Redacted]
Final Business Plan – April 2009 Thames Water UtilitiesPart B - Key Components Section B3 – Maintaining Service and Serviceability Confidential – Commercially Sensitive
April 2009 31 Section B3.4 – Sewerage Infra
B3.4.7 Network Overflows and Outfalls
This section sets out our business case for capital maintenance investment [Redacted]. This asset group comprises four main asset types:
Combined sewer overflows (CSOs), which relieve hydraulic overloading of the combined sewer network by diverting storm flows to a watercourse
Storm sewer overflows (SSOs), which relieve hydraulic overloading of the separate sewer network by diverting, storm flows to a watercourse
Polluted surface water outfalls (PSWOs) where surface water sewers become polluted with foul sewage, either due to misconnections, overflows from foul sewers or leakage from faulty sewers and the polluted water is discharged from the outfall
Dual manholes, where separate foul and surface water sewers flow into and out of a common chamber, providing the potential for pollution of the surface water system by the foul system when flows are high.
The assets themselves consist of:
flow controls such as weirs, orifice plates and Hydrobrakes
conveyance structures such as connection and outfall pipes and headwalls and aprons
screening equipment such as grills, gratings, mechanical screens and dynamic separators
storage and access structures which store excess flows or provide access to overflows and ancillary equipment
ICA, alarm and telemetry equipment which monitors overflow operation
B3.4.7.1 Historical Context
[Redacted]. Historically, expenditure on overflows has been allocated to the Quality Enhancement programme to address unsatisfactory intermittent discharges.
Final Business Plan – April 2009 Thames Water UtilitiesPart B - Key Components Section B3 – Maintaining Service and Serviceability Confidential – Commercially Sensitive
April 2009 32 Section B3.4 – Sewerage Infra
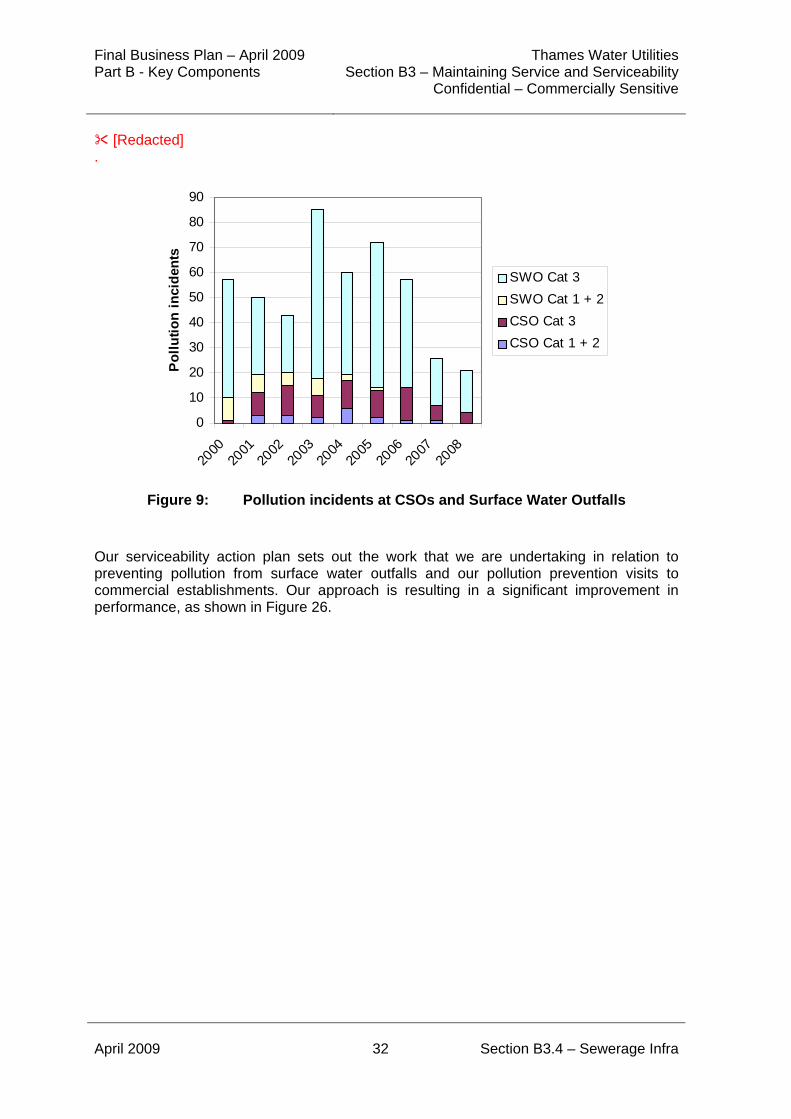
[Redacted] .
0
10
20
30
40
50
60
70
80
90
2000
2001
2002
2003
2004
2005
2006
2007
2008
Po
llu
tio
n i
nci
den
ts
SWO Cat 3
SWO Cat 1 + 2
CSO Cat 3
CSO Cat 1 + 2
Figure 9: Pollution incidents at CSOs and Surface Water Outfalls
Our serviceability action plan sets out the work that we are undertaking in relation to preventing pollution from surface water outfalls and our pollution prevention visits to commercial establishments. Our approach is resulting in a significant improvement in performance, as shown in Figure 26.
Final Business Plan – April 2009 Thames Water UtilitiesPart B - Key Components Section B3 – Maintaining Service and Serviceability Confidential – Commercially Sensitive
April 2009 33 Section B3.4 – Sewerage Infra
[Redacted]
B3.4.7.3 Statement of Need
The principal need associated with this asset group is to maintain serviceability with respect to pollution incidents from CSOs and surface water outfalls. This will ensure no deterioration in the impact of these assets on the quality of receiving watercourses. As these structures provide hydraulic controls in our network, in some cases, they can also contribute to internal or external flooding events. [Redacted]
Final Business Plan – April 2009 Thames Water UtilitiesPart B - Key Components Section B3 – Maintaining Service and Serviceability Confidential – Commercially Sensitive
April 2009 34 Section B3.4 – Sewerage Infra
B3.4.8 Sewer Structures
B3.4.8.1 Overview
This section sets out our business case for capital maintenance investment [Redacted] in sewer structures in AMP5. [Redacted] . The sewer structures asset group comprises three main asset types:
Sewer bridges and pipe bridges where a structure supports a sewer that crosses an obstacle, such as a river
Network storm tanks, which provide storage in the sewerage system
Ancillary items that regulate, isolate or divert flows on the sewerage system to provide operational control
[Redacted]
B3.4.8.3 Statement of Needs
The principal Wastewater Risk Framework measures that we use to assess sewer structures needs are health and safety, pollution incidents, internal flooding and external flooding. Three groups of assets have been identified as requiring capital maintenance in AMP5. These are:
Northern Outfall Sewer bridges and other pipe bridges in our region
Network storm tanks
Sewer ancillaries
[Redacted]
Final Business Plan – April 2009 Thames Water UtilitiesPart B - Key Components Section B3 – Maintaining Service and Serviceability Confidential – Commercially Sensitive
April 2009 35 Section B3.4 – Sewerage Infra
B3.4.10 Diversions
This section sets out our business case for capital maintenance investment [Redacted] in customer led diversions in AMP5. [Redacted] [Redacted]
B3.4.10.3 Statement of Need
There are two types of diversions covered by statutory legislation:
Diversions required during street works by a third party (NRSWA Diversions)
Diversions under Section 185 of the Water Industry Act 1991 whereby any person with an interest in land or in adjacent land, may give notice to us to alter or remove its assets from this land. We are happy to carry out diversionary works as long as the request is reasonable
The forecast levels of activity for this customer-led area are based on AMP4 activity and expenditure levels. [Redacted]
Final Business Plan – April 2009 Thames Water UtilitiesPart B - Key Components Section B3 – Maintaining Service and Serviceability Confidential – Commercially Sensitive
April 2009 36 Section B3.4 – Sewerage Infra
B3.4.11 Sewerage Infrastructure Outputs
This section sets out the AMP5 and 6 reference levels and control limits for the key base service outputs addressed by our plan. Our projections are based on the best value solutions for capital maintenance and enhancements as set out in each asset group of the section. The information is presented in Table B3.2 in summary form. Generally, we will maintain stable levels of performance or service for all serviceability indicators. This section considers the measures that require us to calculate reference levels for AMP5 and AMP6. These are:
Properties internally flooded during the year due to overloaded sewers, excluding severe weather
Properties internally flooded during the year due to other causes
Number of pollution Category 1, 2 and 3 pollution incidents from infrastructure assets
Number of sewer collapses
Number of sewer blockages
Our Table B3.2 commentary covers these outputs and the other outputs where reference levels have not been required. For all of these measures, our approach is guided by Ofwat’s stated methodology for assessing serviceability (set out in RD15/06, published 4 October 2006 and in a subsequent letter to Water UK dated 27 February 2007). We have also been reporting our serviceability action plans to Ofwat on a six-monthly basis throughout AMP4 and our methodology for assessing appropriate future reference levels and control limits is also informed by the dialogue that has taken place with Ofwat during the current AMP period. Additionally, we have taken account of Ofwat’s feedback included in the draft CIS Baseline Report (December 2008). Key assumptions underpinning our calculation of reference levels and control limits are set out below.
Final Business Plan – April 2009 Thames Water UtilitiesPart B - Key Components Section B3 – Maintaining Service and Serviceability Confidential – Commercially Sensitive
April 2009 37 Section B3.4 – Sewerage Infra
Properties Internally Flooded In Year Due To Overloaded Sewers, Excluding Severe Weather
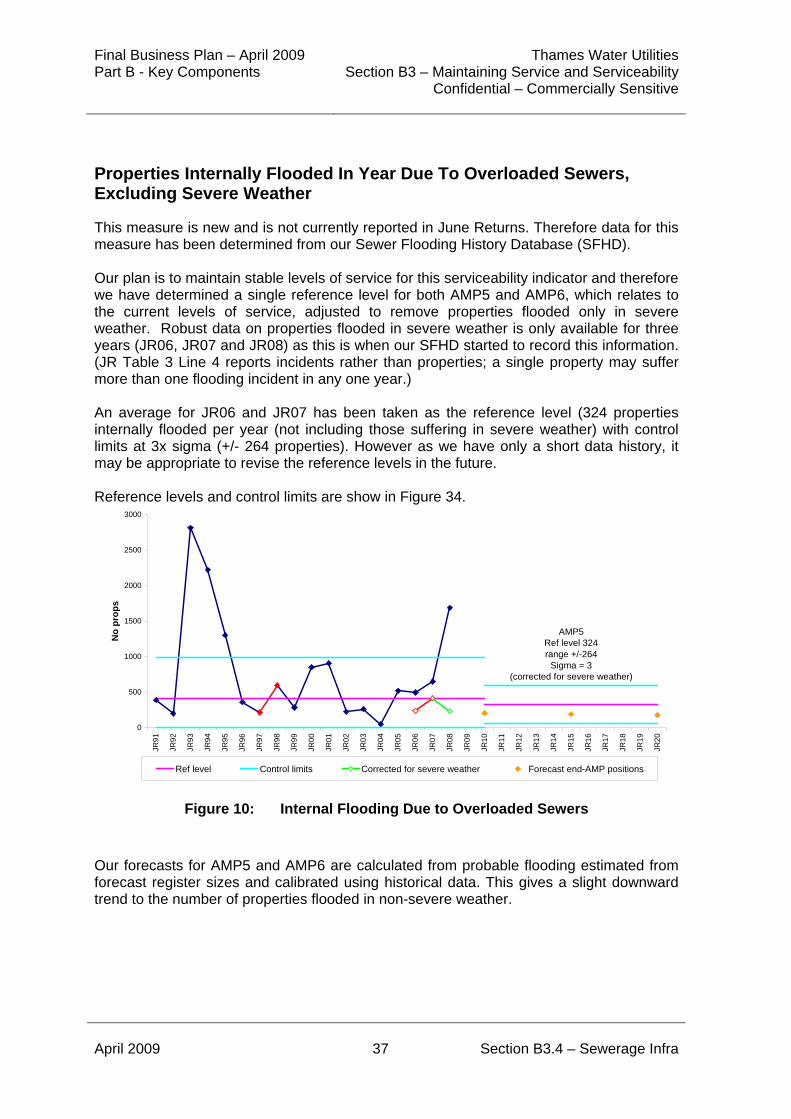
This measure is new and is not currently reported in June Returns. Therefore data for this measure has been determined from our Sewer Flooding History Database (SFHD). Our plan is to maintain stable levels of service for this serviceability indicator and therefore we have determined a single reference level for both AMP5 and AMP6, which relates to the current levels of service, adjusted to remove properties flooded only in severe weather. Robust data on properties flooded in severe weather is only available for three years (JR06, JR07 and JR08) as this is when our SFHD started to record this information. (JR Table 3 Line 4 reports incidents rather than properties; a single property may suffer more than one flooding incident in any one year.) An average for JR06 and JR07 has been taken as the reference level (324 properties internally flooded per year (not including those suffering in severe weather) with control limits at 3x sigma (+/- 264 properties). However as we have only a short data history, it may be appropriate to revise the reference levels in the future. Reference levels and control limits are show in Figure 34.
0
500
1000
1500
2000
2500
3000
JR91
JR92
JR93
JR94
JR95
JR96
JR97
JR98
JR99
JR00
JR01
JR02
JR03
JR04
JR05
JR06
JR07
JR08
JR09
JR10
JR11
JR12
JR13
JR14
JR15
JR16
JR17
JR18
JR19
JR20
No
pro
ps
Ref level Control limits Corrected for severe weather Forecast end-AMP positions
AMP5Ref level 324range +/-264
Sigma = 3(corrected for severe weather)
Figure 10: Internal Flooding Due to Overloaded Sewers
Our forecasts for AMP5 and AMP6 are calculated from probable flooding estimated from forecast register sizes and calibrated using historical data. This gives a slight downward trend to the number of properties flooded in non-severe weather.
Final Business Plan – April 2009 Thames Water UtilitiesPart B - Key Components Section B3 – Maintaining Service and Serviceability Confidential – Commercially Sensitive
April 2009 38 Section B3.4 – Sewerage Infra
Properties Internally Flooded In Year Due To Other Causes
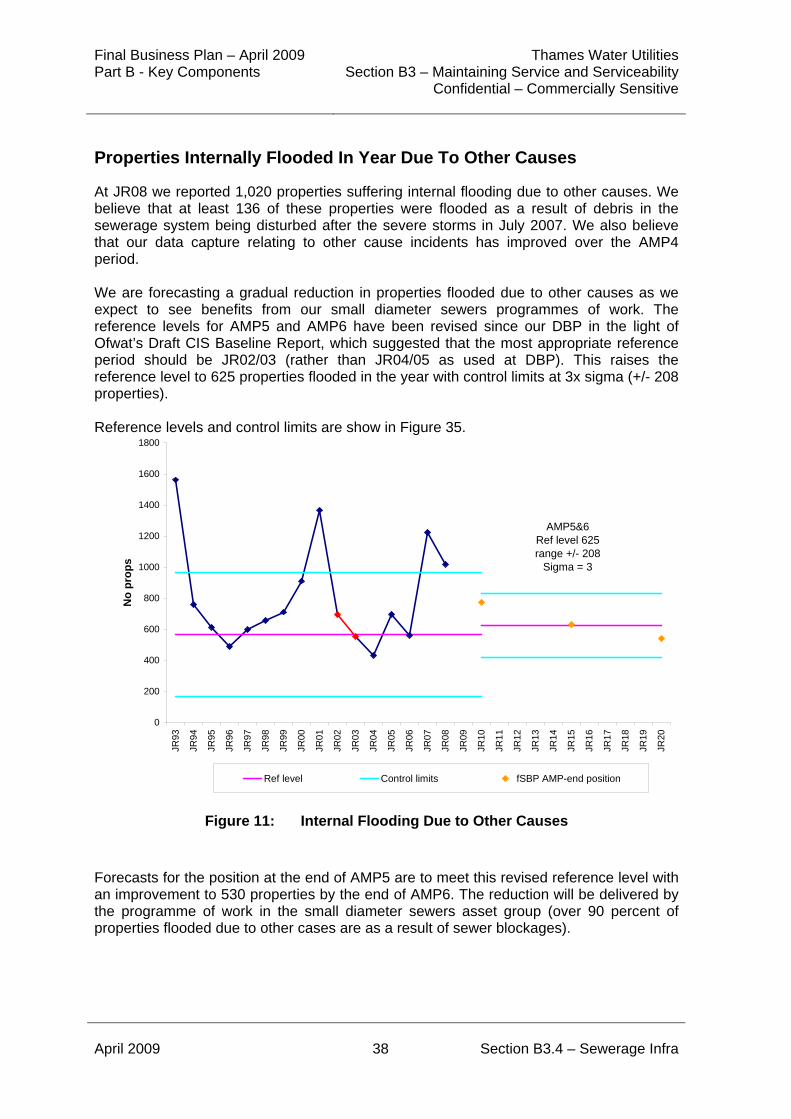
At JR08 we reported 1,020 properties suffering internal flooding due to other causes. We believe that at least 136 of these properties were flooded as a result of debris in the sewerage system being disturbed after the severe storms in July 2007. We also believe that our data capture relating to other cause incidents has improved over the AMP4 period. We are forecasting a gradual reduction in properties flooded due to other causes as we expect to see benefits from our small diameter sewers programmes of work. The reference levels for AMP5 and AMP6 have been revised since our DBP in the light of Ofwat’s Draft CIS Baseline Report, which suggested that the most appropriate reference period should be JR02/03 (rather than JR04/05 as used at DBP). This raises the reference level to 625 properties flooded in the year with control limits at 3x sigma (+/- 208 properties). Reference levels and control limits are show in Figure 35.
0
200
400
600
800
1000
1200
1400
1600
1800
JR93
JR94
JR95
JR96
JR97
JR98
JR99
JR00
JR01
JR02
JR03
JR04
JR05
JR06
JR07
JR08
JR09
JR10
JR11
JR12
JR13
JR14
JR15
JR16
JR17
JR18
JR19
JR20
No
pro
ps
Ref level Control limits fSBP AMP-end position
AMP5&6Ref level 625range +/- 208
Sigma = 3
Figure 11: Internal Flooding Due to Other Causes
Forecasts for the position at the end of AMP5 are to meet this revised reference level with an improvement to 530 properties by the end of AMP6. The reduction will be delivered by the programme of work in the small diameter sewers asset group (over 90 percent of properties flooded due to other cases are as a result of sewer blockages).
Final Business Plan – April 2009 Thames Water UtilitiesPart B - Key Components Section B3 – Maintaining Service and Serviceability Confidential – Commercially Sensitive
April 2009 39 Section B3.4 – Sewerage Infra
Number Of Pollution Incidents (Category 1, 2 and 3) From Network Assets
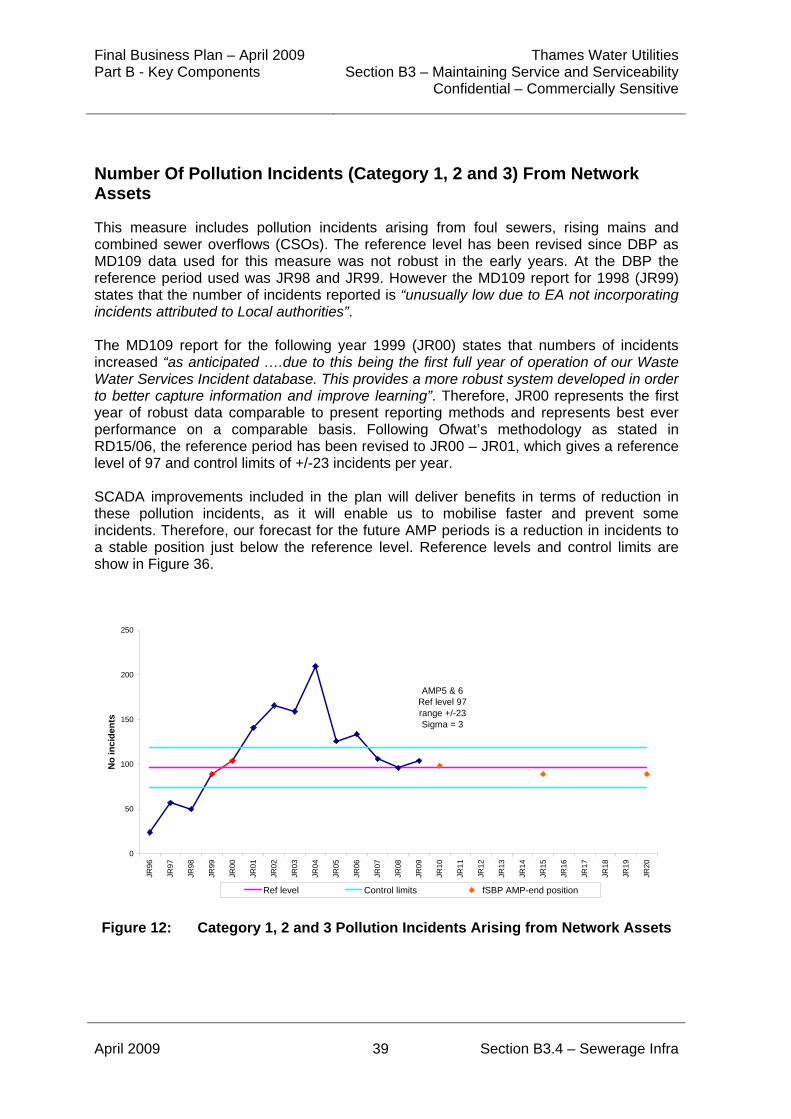
This measure includes pollution incidents arising from foul sewers, rising mains and combined sewer overflows (CSOs). The reference level has been revised since DBP as MD109 data used for this measure was not robust in the early years. At the DBP the reference period used was JR98 and JR99. However the MD109 report for 1998 (JR99) states that the number of incidents reported is “unusually low due to EA not incorporating incidents attributed to Local authorities”. The MD109 report for the following year 1999 (JR00) states that numbers of incidents increased “as anticipated ….due to this being the first full year of operation of our Waste Water Services Incident database. This provides a more robust system developed in order to better capture information and improve learning”. Therefore, JR00 represents the first year of robust data comparable to present reporting methods and represents best ever performance on a comparable basis. Following Ofwat’s methodology as stated in RD15/06, the reference period has been revised to JR00 – JR01, which gives a reference level of 97 and control limits of +/-23 incidents per year. SCADA improvements included in the plan will deliver benefits in terms of reduction in these pollution incidents, as it will enable us to mobilise faster and prevent some incidents. Therefore, our forecast for the future AMP periods is a reduction in incidents to a stable position just below the reference level. Reference levels and control limits are show in Figure 36.
0
50
100
150
200
250
JR96
JR97
JR98
JR99
JR00
JR01
JR02
JR03
JR04
JR05
JR06
JR07
JR08
JR09
JR10
JR11
JR12
JR13
JR14
JR15
JR16
JR17
JR18
JR19
JR20
No
in
cid
ents
Ref level Control limits fSBP AMP-end position
AMP5 & 6Ref level 97range +/-23Sigma = 3
Figure 12: Category 1, 2 and 3 Pollution Incidents Arising from Network Assets
Final Business Plan – April 2009 Thames Water UtilitiesPart B - Key Components Section B3 – Maintaining Service and Serviceability Confidential – Commercially Sensitive
April 2009 40 Section B3.4 – Sewerage Infra
We are aware that there is ongoing work with the Environment Agency, via Water UK, to clarify the guidance for the classification of pollution incidents. We anticipate that this may impact upon the number of Category 3 pollution incidents reported but at present we have not factored any anticipated impact into the forecasts, as there is still considerable uncertainty about what such an impact might be.
Number Of Sewer Collapses
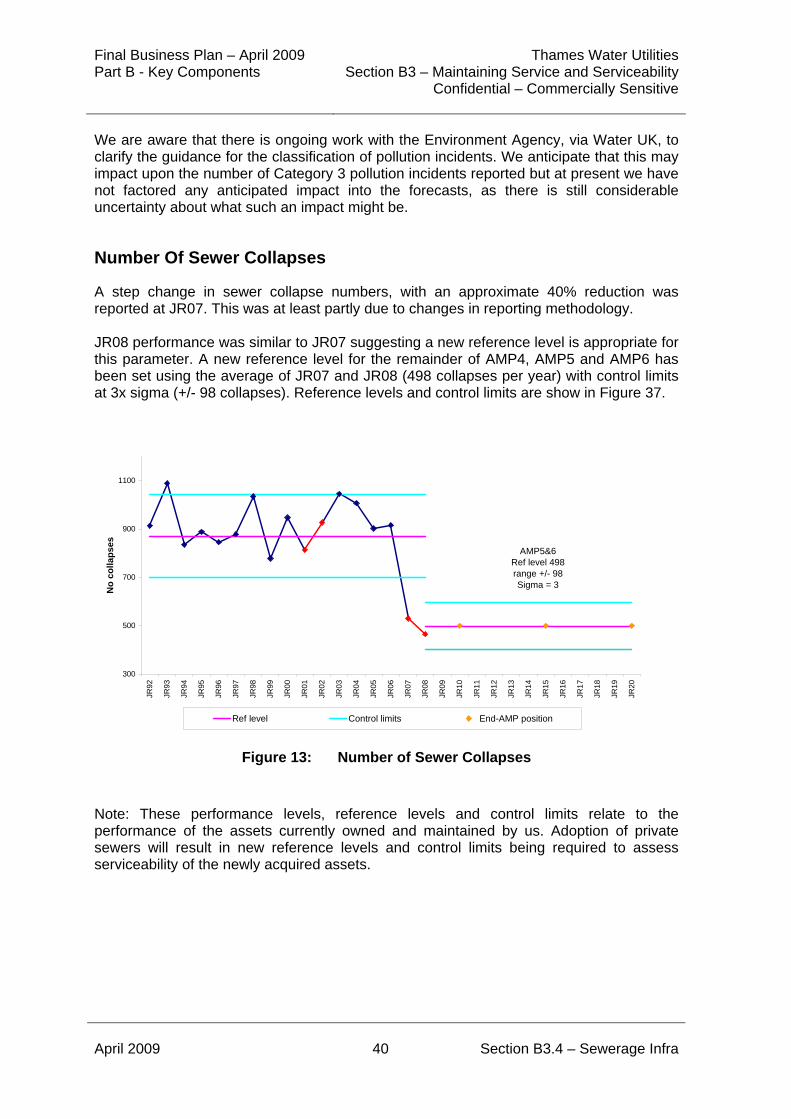
A step change in sewer collapse numbers, with an approximate 40% reduction was reported at JR07. This was at least partly due to changes in reporting methodology. JR08 performance was similar to JR07 suggesting a new reference level is appropriate for this parameter. A new reference level for the remainder of AMP4, AMP5 and AMP6 has been set using the average of JR07 and JR08 (498 collapses per year) with control limits at 3x sigma (+/- 98 collapses). Reference levels and control limits are show in Figure 37.
300
500
700
900
1100
JR92
JR93
JR94
JR95
JR96
JR97
JR98
JR99
JR00
JR01
JR02
JR03
JR04
JR05
JR06
JR07
JR08
JR09
JR10
JR11
JR12
JR13
JR14
JR15
JR16
JR17
JR18
JR19
JR20
No
co
lla
ps
es
Ref level Control limits End-AMP position
AMP5&6Ref level 498 range +/- 98Sigma = 3
Figure 13: Number of Sewer Collapses
Note: These performance levels, reference levels and control limits relate to the performance of the assets currently owned and maintained by us. Adoption of private sewers will result in new reference levels and control limits being required to assess serviceability of the newly acquired assets.
Final Business Plan – April 2009 Thames Water UtilitiesPart B - Key Components Section B3 – Maintaining Service and Serviceability Confidential – Commercially Sensitive
April 2009 41 Section B3.4 – Sewerage Infra
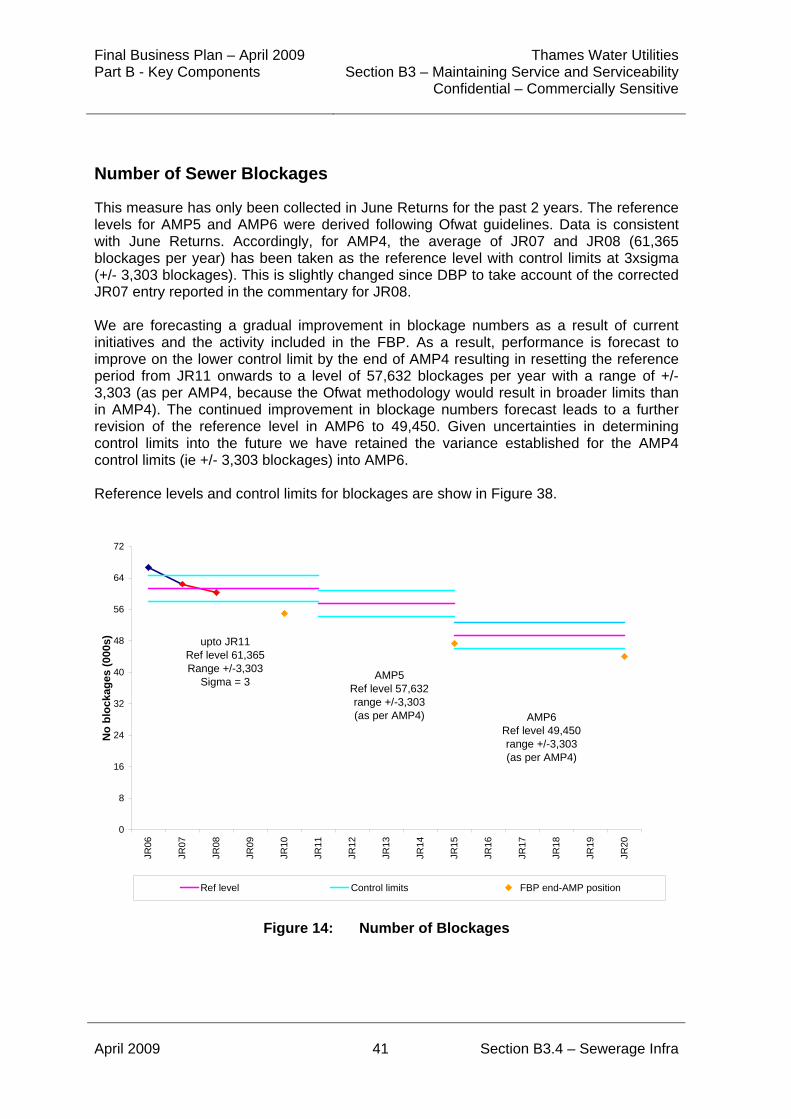
Number of Sewer Blockages
This measure has only been collected in June Returns for the past 2 years. The reference levels for AMP5 and AMP6 were derived following Ofwat guidelines. Data is consistent with June Returns. Accordingly, for AMP4, the average of JR07 and JR08 (61,365 blockages per year) has been taken as the reference level with control limits at 3xsigma (+/- 3,303 blockages). This is slightly changed since DBP to take account of the corrected JR07 entry reported in the commentary for JR08. We are forecasting a gradual improvement in blockage numbers as a result of current initiatives and the activity included in the FBP. As a result, performance is forecast to improve on the lower control limit by the end of AMP4 resulting in resetting the reference period from JR11 onwards to a level of 57,632 blockages per year with a range of +/- 3,303 (as per AMP4, because the Ofwat methodology would result in broader limits than in AMP4). The continued improvement in blockage numbers forecast leads to a further revision of the reference level in AMP6 to 49,450. Given uncertainties in determining control limits into the future we have retained the variance established for the AMP4 control limits (ie +/- 3,303 blockages) into AMP6. Reference levels and control limits for blockages are show in Figure 38.
0
8
16
24
32
40
48
56
64
72
JR06
JR07
JR08
JR09
JR10
JR11
JR12
JR13
JR14
JR15
JR16
JR17
JR18
JR19
JR20
No
blo
ckag
es (
000s
)
Ref level Control limits FBP end-AMP position
AMP5Ref level 57,632range +/-3,303(as per AMP4) AMP6
Ref level 49,450range +/-3,303(as per AMP4)
upto JR11Ref level 61,365Range +/-3,303
Sigma = 3
Figure 14: Number of Blockages
Final Business Plan – April 2009 Thames Water UtilitiesPart B - Key Components Section B3 – Maintaining Service and Serviceability Confidential – Commercially Sensitive
April 2009 42 Section B3.4 – Sewerage Infra
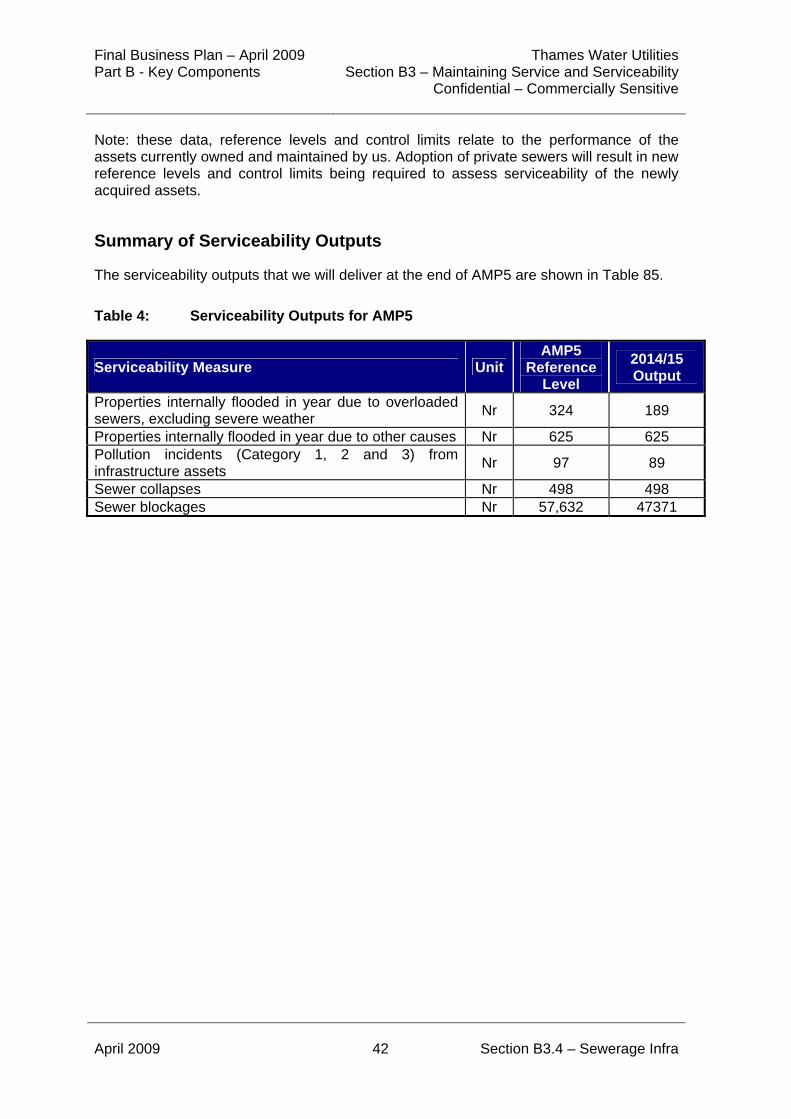
Note: these data, reference levels and control limits relate to the performance of the assets currently owned and maintained by us. Adoption of private sewers will result in new reference levels and control limits being required to assess serviceability of the newly acquired assets.
Summary of Serviceability Outputs
The serviceability outputs that we will deliver at the end of AMP5 are shown in Table 85.
Table 4: Serviceability Outputs for AMP5
Serviceability Measure Unit AMP5
Reference Level
2014/15 Output
Properties internally flooded in year due to overloaded sewers, excluding severe weather
Nr 324 189
Properties internally flooded in year due to other causes Nr 625 625 Pollution incidents (Category 1, 2 and 3) from infrastructure assets
Nr 97 89
Sewer collapses Nr 498 498 Sewer blockages Nr 57,632 47371