Embed Size (px)
Citation preview
Parks Master Plan Phase II - December 2015 | 45
PARK SECTOR
2
46 | Parks Master Plan Phase II - December 2015
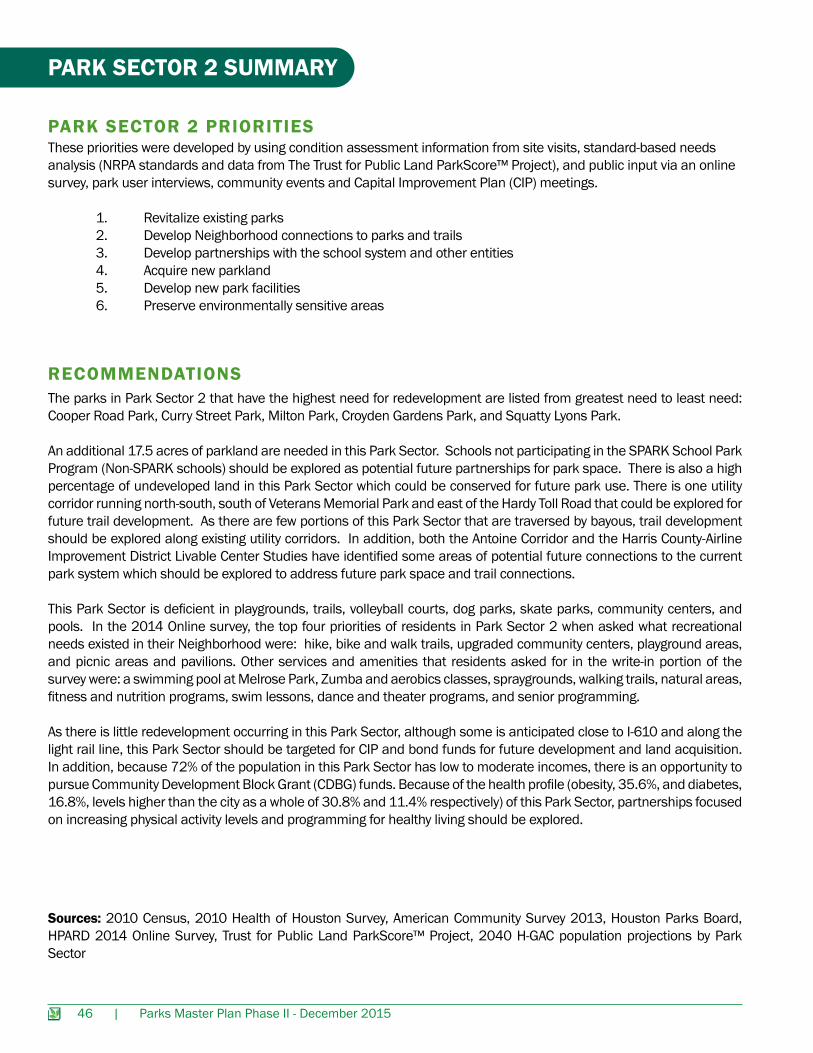
PARK SECTOR 2 PRIORITIES
RECOMMENDATIONS
PARK SECTOR 2 SUMMARY
These priorities were developed by using condition assessment information from site visits, standard-based needs analysis (NRPA standards and data from The Trust for Public Land ParkScore™ Project), and public input via an online survey, park user interviews, community events and Capital Improvement Plan (CIP) meetings.
1. Revitalize existing parks 2. Develop Neighborhood connections to parks and trails 3. Develop partnerships with the school system and other entities 4. Acquire new parkland 5. Develop new park facilities 6. Preserve environmentally sensitive areas
The parks in Park Sector 2 that have the highest need for redevelopment are listed from greatest need to least need: Cooper Road Park, Curry Street Park, Milton Park, Croyden Gardens Park, and Squatty Lyons Park.
An additional 17.5 acres of parkland are needed in this Park Sector. Schools not participating in the SPARK School Park Program (Non-SPARK schools) should be explored as potential future partnerships for park space. There is also a high percentage of undeveloped land in this Park Sector which could be conserved for future park use. There is one utility corridor running north-south, south of Veterans Memorial Park and east of the Hardy Toll Road that could be explored for future trail development. As there are few portions of this Park Sector that are traversed by bayous, trail development should be explored along existing utility corridors. In addition, both the Antoine Corridor and the Harris County-Airline Improvement District Livable Center Studies have identified some areas of potential future connections to the current park system which should be explored to address future park space and trail connections.
This Park Sector is deficient in playgrounds, trails, volleyball courts, dog parks, skate parks, community centers, and pools. In the 2014 Online survey, the top four priorities of residents in Park Sector 2 when asked what recreational needs existed in their Neighborhood were: hike, bike and walk trails, upgraded community centers, playground areas, and picnic areas and pavilions. Other services and amenities that residents asked for in the write-in portion of the survey were: a swimming pool at Melrose Park, Zumba and aerobics classes, spraygrounds, walking trails, natural areas, fitness and nutrition programs, swim lessons, dance and theater programs, and senior programming.
As there is little redevelopment occurring in this Park Sector, although some is anticipated close to I-610 and along the light rail line, this Park Sector should be targeted for CIP and bond funds for future development and land acquisition. In addition, because 72% of the population in this Park Sector has low to moderate incomes, there is an opportunity to pursue Community Development Block Grant (CDBG) funds. Because of the health profile (obesity, 35.6%, and diabetes, 16.8%, levels higher than the city as a whole of 30.8% and 11.4% respectively) of this Park Sector, partnerships focused on increasing physical activity levels and programming for healthy living should be explored.
Sources: 2010 Census, 2010 Health of Houston Survey, American Community Survey 2013, Houston Parks Board, HPARD 2014 Online Survey, Trust for Public Land ParkScore™ Project, 2040 H-GAC population projections by Park Sector
Parks Master Plan Phase II - December 2015 | 47
48 | Parks Master Plan Phase II - December 2015
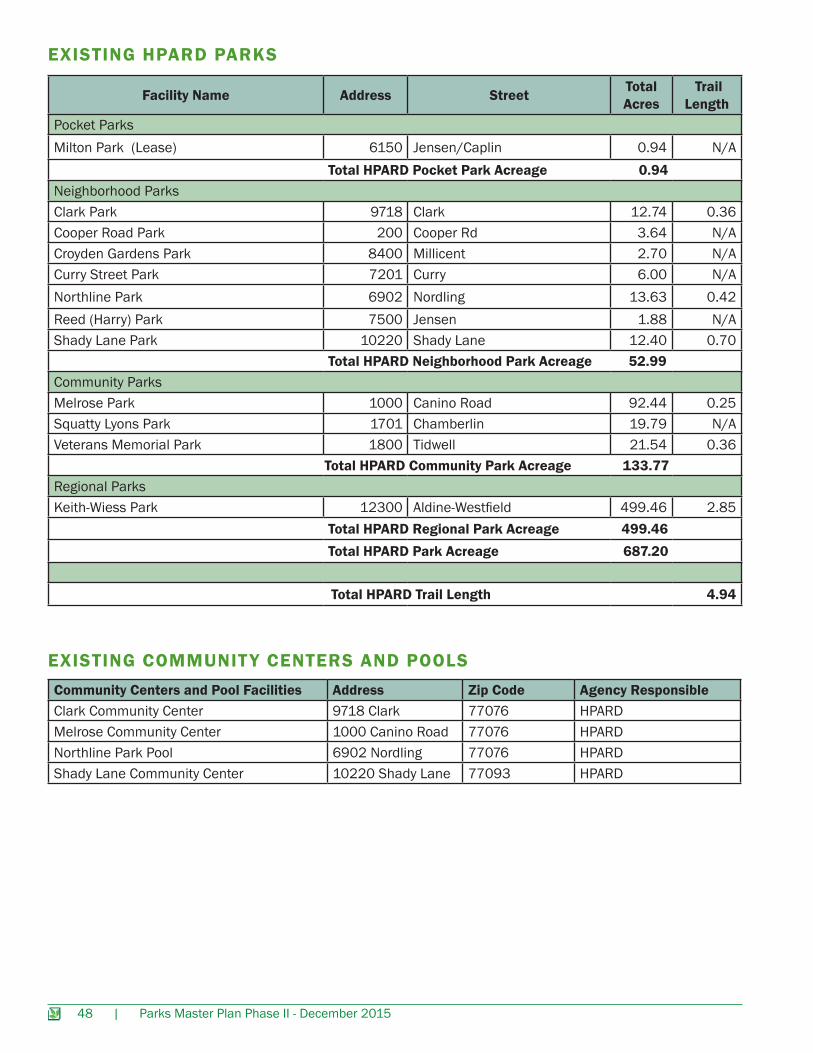
EXISTING HPARD PARKS
EXISTING COMMUNIT Y CENTERS AND POOLSCommunity Centers and Pool Facilities Address Zip Code Agency ResponsibleClark Community Center 9718 Clark 77076 HPARDMelrose Community Center 1000 Canino Road 77076 HPARDNorthline Park Pool 6902 Nordling 77076 HPARDShady Lane Community Center 10220 Shady Lane 77093 HPARD
Facility Name Address Street Total Acres
TrailLength
Pocket ParksMilton Park (Lease) 6150 Jensen/Caplin 0.94 N/A Total HPARD Pocket Park Acreage 0.94Neighborhood ParksClark Park 9718 Clark 12.74 0.36Cooper Road Park 200 Cooper Rd 3.64 N/ACroyden Gardens Park 8400 Millicent 2.70 N/ACurry Street Park 7201 Curry 6.00 N/ANorthline Park 6902 Nordling 13.63 0.42Reed (Harry) Park 7500 Jensen 1.88 N/AShady Lane Park 10220 Shady Lane 12.40 0.70 Total HPARD Neighborhood Park Acreage 52.99Community ParksMelrose Park 1000 Canino Road 92.44 0.25Squatty Lyons Park 1701 Chamberlin 19.79 N/AVeterans Memorial Park 1800 Tidwell 21.54 0.36 Total HPARD Community Park Acreage 133.77Regional ParksKeith-Wiess Park 12300 Aldine-Westfield 499.46 2.85 Total HPARD Regional Park Acreage 499.46 Total HPARD Park Acreage 687.20
Total HPARD Trail Length 4.94
Parks Master Plan Phase II - December 2015 | 49
PARK SERVICE AREAS
NEEDS ASSESSMENT FOR AMENITIES IN PARK SECTOR
PARK SECTOR FACTS
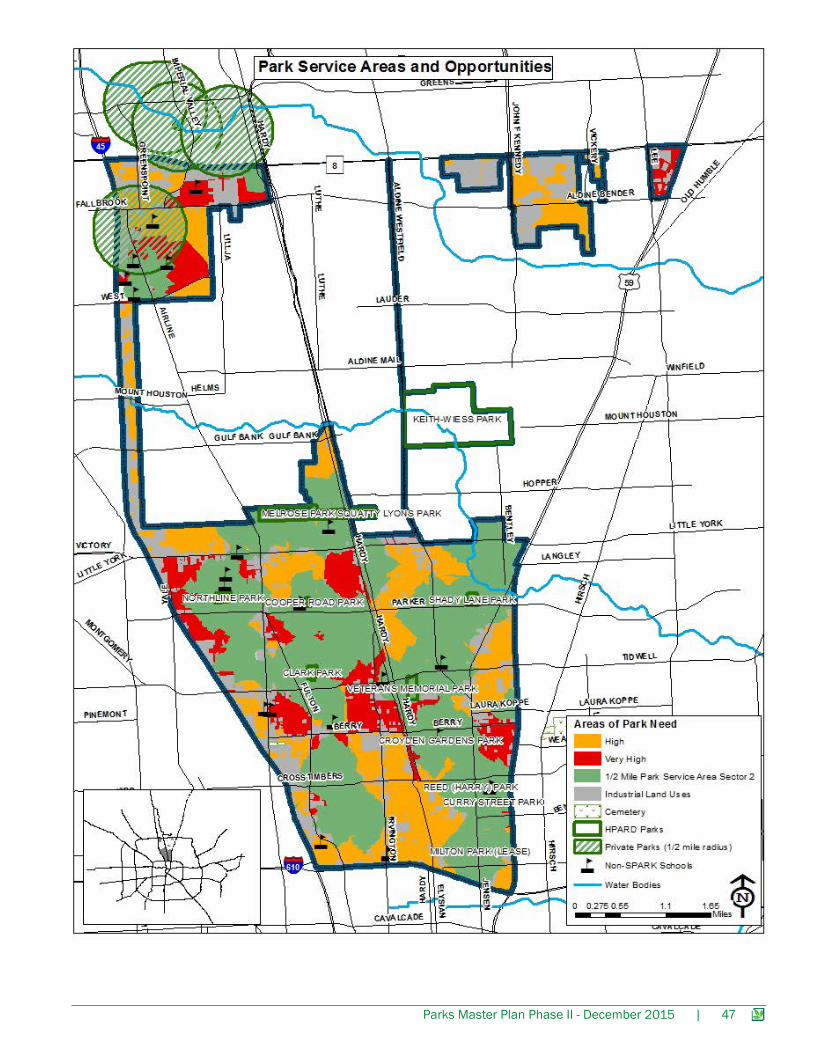
The Park Service Area map was produced using data provided by the Trust for Public Land ParkScore™ Project to identify areas of park need. The green areas represent a ½ mile service area of public parks (city or county) and SPARK Parks (school parks open to the public after school) or other publicly accessible non-HPARD Parks.
The orange and red represent areas where there is not access to a park within a ½ mile. The degree of need (red is very high need and orange is high need) is based on population density, household income (less than $35,000), and presence of youth (19 yrs or younger). The office and industrial land uses are represented in gray, to specifically highlight residential and commercial areas of need. Approximately 40% of the area in this Park Sector is in need of parkland accessible within a ½ mile, as compared to the 45% of the population of the city of Houston who need park access. Non-SPARK schools are indicated on the map as black flags to explore as potential future partnerships for park space.
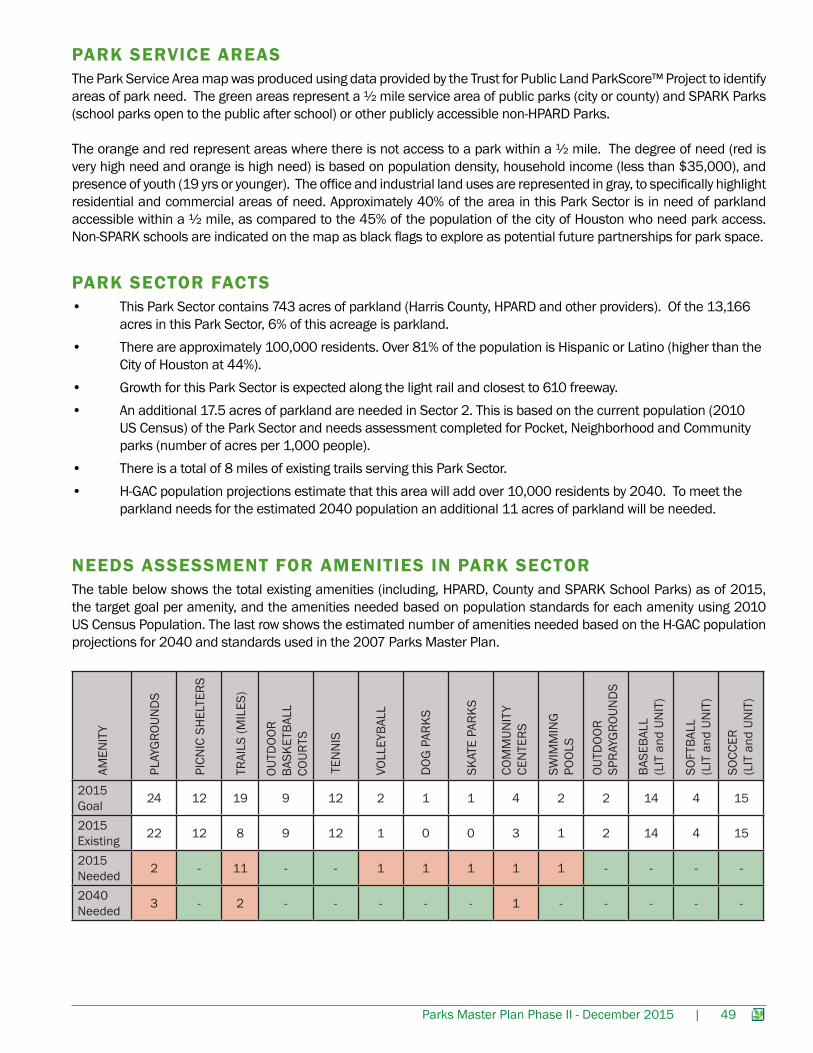
The table below shows the total existing amenities (including, HPARD, County and SPARK School Parks) as of 2015, the target goal per amenity, and the amenities needed based on population standards for each amenity using 2010 US Census Population. The last row shows the estimated number of amenities needed based on the H-GAC population projections for 2040 and standards used in the 2007 Parks Master Plan.
• This Park Sector contains 743 acres of parkland (Harris County, HPARD and other providers). Of the 13,166 acres in this Park Sector, 6% of this acreage is parkland. • There are approximately 100,000 residents. Over 81% of the population is Hispanic or Latino (higher than the City of Houston at 44%).• Growth for this Park Sector is expected along the light rail and closest to 610 freeway.• An additional 17.5 acres of parkland are needed in Sector 2. This is based on the current population (2010 US Census) of the Park Sector and needs assessment completed for Pocket, Neighborhood and Community parks (number of acres per 1,000 people).• There is a total of 8 miles of existing trails serving this Park Sector.• H-GAC population projections estimate that this area will add over 10,000 residents by 2040. To meet the parkland needs for the estimated 2040 population an additional 11 acres of parkland will be needed.
2015 Goal 24 12 19 9 12 2 1 1 4 2 2 14 4 15
2015 Existing 22 12 8 9 12 1 0 0 3 1 2 14 4 15
2015 Needed 2 - 11 - - 1 1 1 1 1 - - - -
2040 Needed 3 - 2 - - - - - 1 - - - - -
AMEN
ITY
PLAY
GRO
UND
S
PICN
IC S
HEL
TERS
TRAI
LS (M
ILES
)
TEN
NIS
VOLL
EYBA
LL
DOG
PAR
KS
SKAT
E PA
RKS
SWIM
MIN
GPO
OLS
OUTD
OOR
SPRA
YGRO
UND
S
BASE
BALL
(L
IT a
nd U
NIT
)
SOFT
BALL
(L
IT a
nd U
NIT
)
SOCC
ER(L
IT a
nd U
NIT
)
COM
MUN
ITY
CEN
TERS
OUTD
OOR
BASK
ETBA
LL
COUR
TS
50 | Parks Master Plan Phase II - December 2015
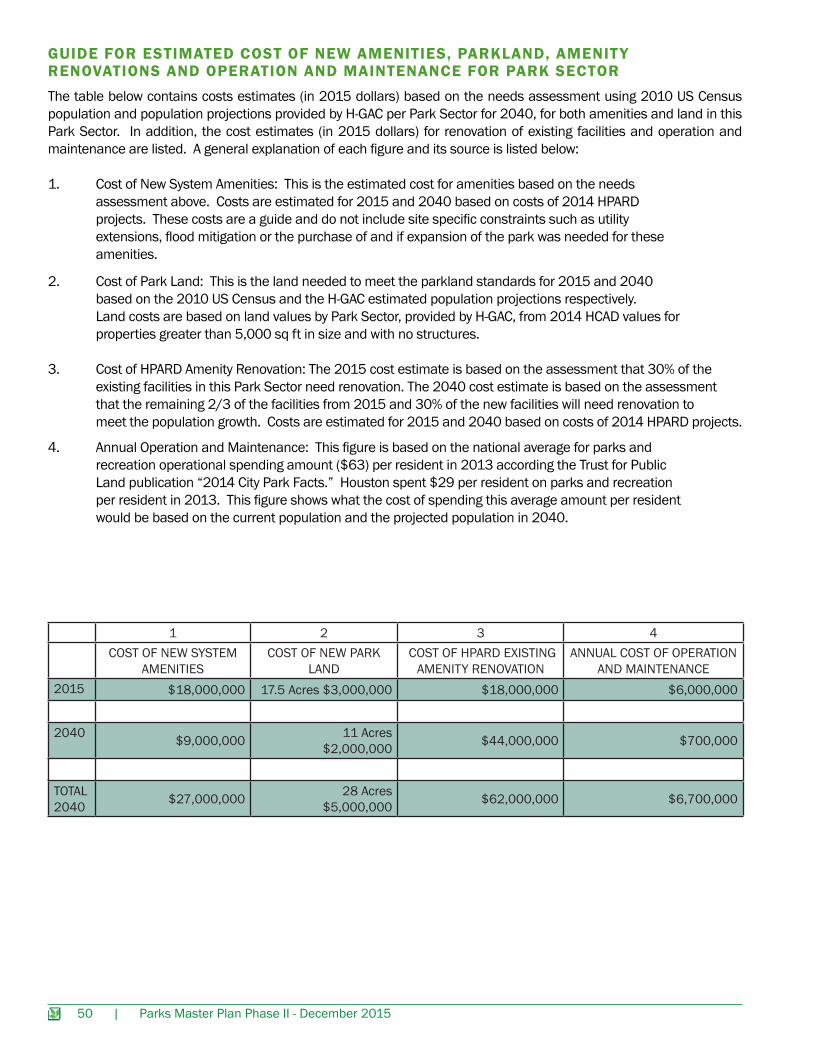
GUIDE FOR ESTIMATED COST OF NEW AMENITIES, PARKLAND, AMENIT Y RENOVATIONS AND OPERATION AND MAINTENANCE FOR PARK SECTORThe table below contains costs estimates (in 2015 dollars) based on the needs assessment using 2010 US Census population and population projections provided by H-GAC per Park Sector for 2040, for both amenities and land in this Park Sector. In addition, the cost estimates (in 2015 dollars) for renovation of existing facilities and operation and maintenance are listed. A general explanation of each figure and its source is listed below:
1. Cost of New System Amenities: This is the estimated cost for amenities based on the needs assessment above. Costs are estimated for 2015 and 2040 based on costs of 2014 HPARD projects. These costs are a guide and do not include site specific constraints such as utility extensions, flood mitigation or the purchase of and if expansion of the park was needed for these amenities.
2. Cost of Park Land: This is the land needed to meet the parkland standards for 2015 and 2040 based on the 2010 US Census and the H-GAC estimated population projections respectively. Land costs are based on land values by Park Sector, provided by H-GAC, from 2014 HCAD values for properties greater than 5,000 sq ft in size and with no structures.
3. Cost of HPARD Amenity Renovation: The 2015 cost estimate is based on the assessment that 30% of the existing facilities in this Park Sector need renovation. The 2040 cost estimate is based on the assessment that the remaining 2/3 of the facilities from 2015 and 30% of the new facilities will need renovation to meet the population growth. Costs are estimated for 2015 and 2040 based on costs of 2014 HPARD projects.
4. Annual Operation and Maintenance: This figure is based on the national average for parks and recreation operational spending amount ($63) per resident in 2013 according the Trust for Public Land publication “2014 City Park Facts.” Houston spent $29 per resident on parks and recreation per resident in 2013. This figure shows what the cost of spending this average amount per resident would be based on the current population and the projected population in 2040.
1 2 3 4COST OF NEW SYSTEM
AMENITIES COST OF NEW PARK
LAND COST OF HPARD EXISTING
AMENITY RENOVATIONANNUAL COST OF OPERATION
AND MAINTENANCE2015 $18,000,000 17.5 Acres $3,000,000 $18,000,000 $6,000,000
2040 $9,000,000 11 Acres$2,000,000 $44,000,000 $700,000
TOTAL 2040 $27,000,000 28 Acres
$5,000,000 $62,000,000 $6,700,000
Parks Master Plan Phase II - December 2015 | 51
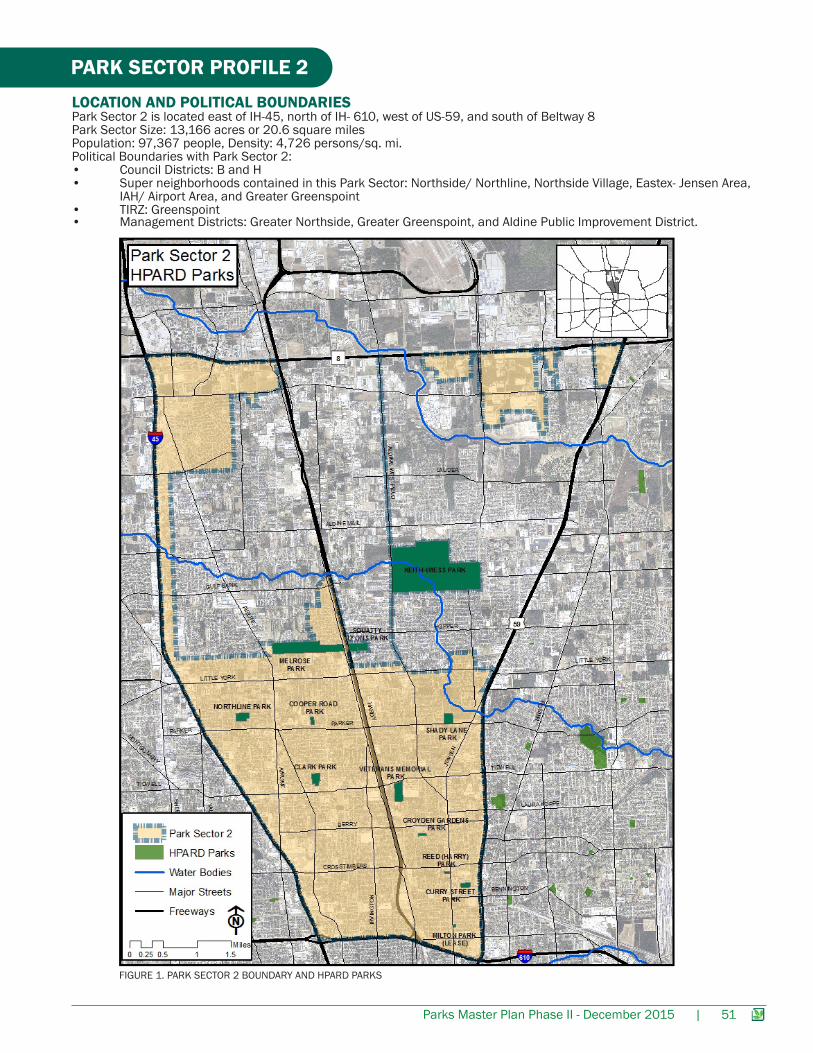
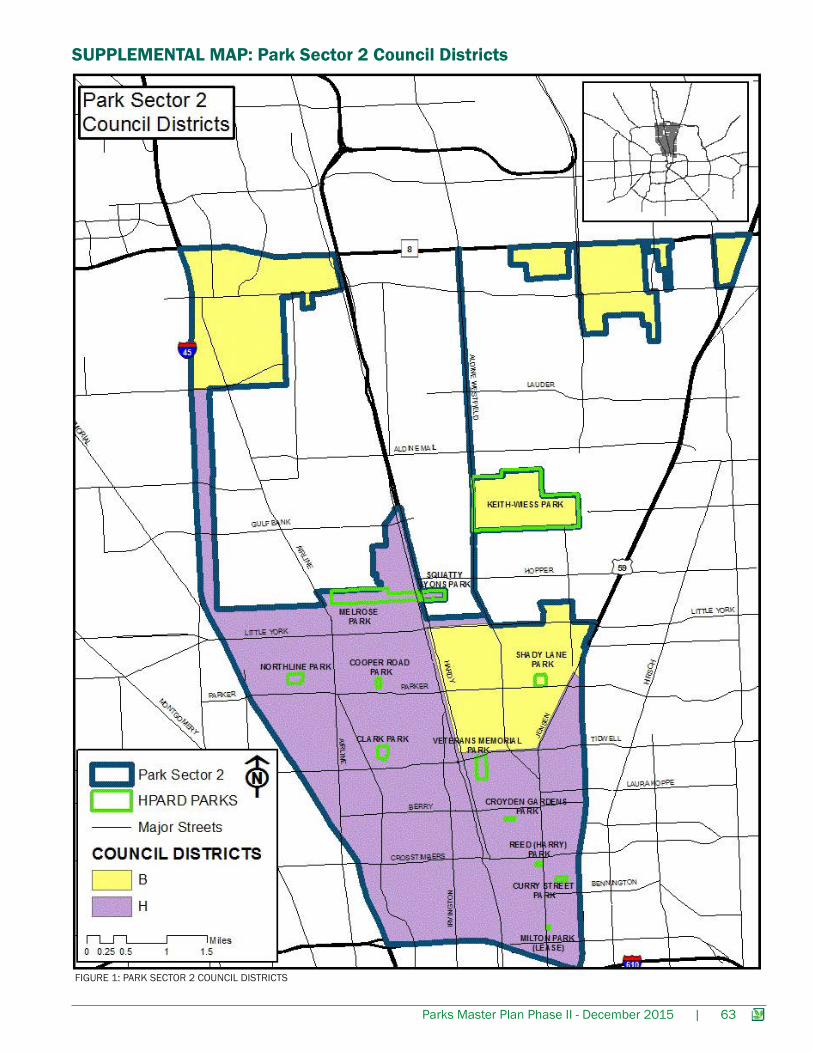
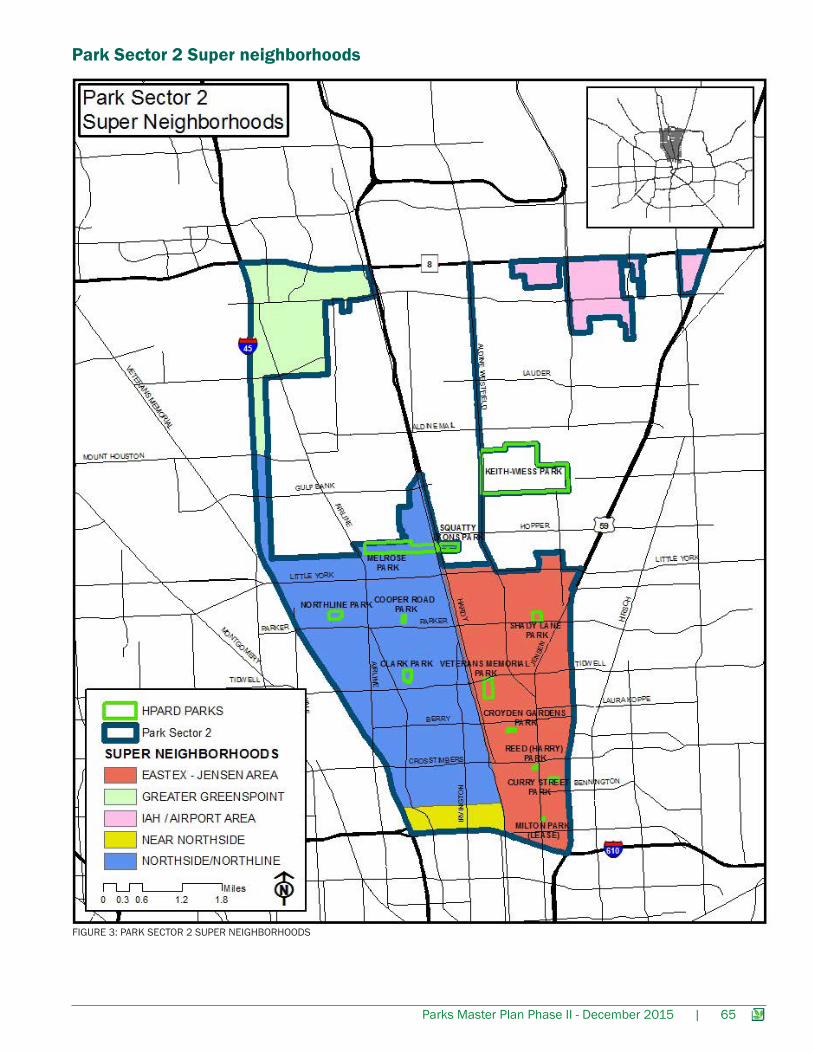
PARK SECTOR PROFILE 2LOCATION AND POLITICAL BOUNDARIESPark Sector 2 is located east of IH-45, north of IH- 610, west of US-59, and south of Beltway 8Park Sector Size: 13,166 acres or 20.6 square milesPopulation: 97,367 people, Density: 4,726 persons/sq. mi. Political Boundaries with Park Sector 2:• Council Districts: B and H• Super neighborhoods contained in this Park Sector: Northside/ Northline, Northside Village, Eastex- Jensen Area, IAH/ Airport Area, and Greater Greenspoint• TIRZ: Greenspoint• Management Districts: Greater Northside, Greater Greenspoint, and Aldine Public Improvement District.
FIGURE 1. PARK SECTOR 2 BOUNDARY AND HPARD PARKS
52 | Parks Master Plan Phase II - December 2015
DEMOGRAPHIC PROFILE
Park Sector 2Population
Park Sector 2 Percent of
TotalHouston
PopulationHouston
Percent of Total
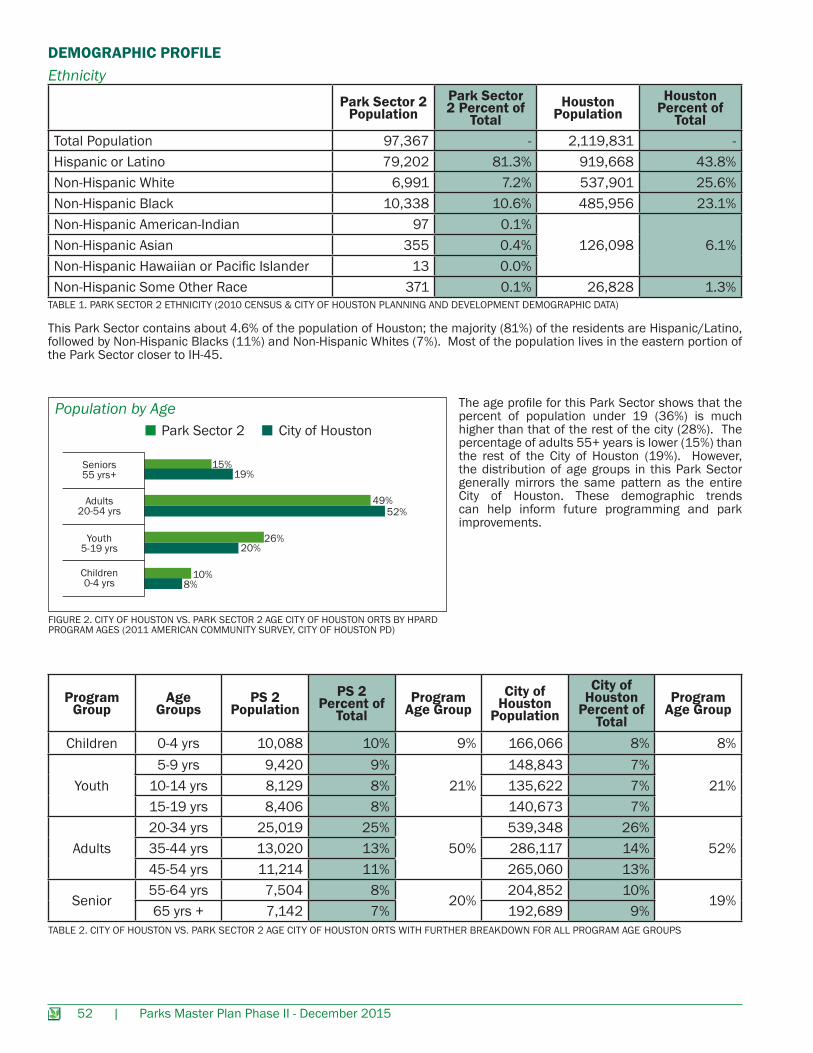
Total Population 97,367 - 2,119,831 -Hispanic or Latino 79,202 81.3% 919,668 43.8%Non-Hispanic White 6,991 7.2% 537,901 25.6%Non-Hispanic Black 10,338 10.6% 485,956 23.1%Non-Hispanic American-Indian 97 0.1%
126,098 6.1%Non-Hispanic Asian 355 0.4%Non-Hispanic Hawaiian or Pacific Islander 13 0.0%Non-Hispanic Some Other Race 371 0.1% 26,828 1.3%
TABLE 1. PARK SECTOR 2 ETHNICITY (2010 CENSUS & CITY OF HOUSTON PLANNING AND DEVELOPMENT DEMOGRAPHIC DATA)
This Park Sector contains about 4.6% of the population of Houston; the majority (81%) of the residents are Hispanic/Latino, followed by Non-Hispanic Blacks (11%) and Non-Hispanic Whites (7%). Most of the population lives in the eastern portion of the Park Sector closer to IH-45.
The age profile for this Park Sector shows that the percent of population under 19 (36%) is much higher than that of the rest of the city (28%). The percentage of adults 55+ years is lower (15%) than the rest of the City of Houston (19%). However, the distribution of age groups in this Park Sector generally mirrors the same pattern as the entire City of Houston. These demographic trends can help inform future programming and park improvements.
City of HoustonPark Sector 2
Seniors 55 yrs+ 19%
15%
52%49%
20%26%
8%10%
Adults20-54 yrs
Youth5-19 yrs
Children0-4 yrs
FIGURE 2. CITY OF HOUSTON VS. PARK SECTOR 2 AGE CITY OF HOUSTON ORTS BY HPARD PROGRAM AGES (2011 AMERICAN COMMUNITY SURVEY, CITY OF HOUSTON PD)
ProgramGroup
Age Groups
PS 2Population
PS 2 Percent of
TotalProgram
Age GroupCity of
Houston Population
City of Houston
Percent of Total
Program Age Group
Children 0-4 yrs 10,088 10% 9% 166,066 8% 8%
Youth5-9 yrs 9,420 9%
21%148,843 7%
21%10-14 yrs 8,129 8% 135,622 7%15-19 yrs 8,406 8% 140,673 7%
Adults20-34 yrs 25,019 25%
50%539,348 26%
52%35-44 yrs 13,020 13% 286,117 14%45-54 yrs 11,214 11% 265,060 13%
Senior55-64 yrs 7,504 8%
20%204,852 10%
19%65 yrs + 7,142 7% 192,689 9%
TABLE 2. CITY OF HOUSTON VS. PARK SECTOR 2 AGE CITY OF HOUSTON ORTS WITH FURTHER BREAKDOWN FOR ALL PROGRAM AGE GROUPS
Ethnicity
Population by Age
Parks Master Plan Phase II - December 2015 | 53
ProgramGroup
Age Groups
PS 2Population
PS 2 Percent of
TotalProgram
Age GroupCity of
Houston Population
City of Houston
Percent of Total
Program Age Group
Children 0-4 yrs 10,088 10% 9% 166,066 8% 8%
Youth5-9 yrs 9,420 9%
21%148,843 7%
21%10-14 yrs 8,129 8% 135,622 7%15-19 yrs 8,406 8% 140,673 7%
Adults20-34 yrs 25,019 25%
50%539,348 26%
52%35-44 yrs 13,020 13% 286,117 14%45-54 yrs 11,214 11% 265,060 13%
Senior55-64 yrs 7,504 8%
20%204,852 10%
19%65 yrs + 7,142 7% 192,689 9%
Housing
Income
Educational Attainment
There are a total of 30,859 housing units in this Park Sector. The percent of vacant housing in Park Sector 2 (10.5%) is lower than the vacancy rates for the entire city (12.3%). Home ownership for this Park Sector (40.3%) is just above the City of Houston’s home ownership rate (39.7%); similarly, the share of renters (49%) is just above that of the city’s as a whole (47.1%).
The median household income for this Park Sector ($29,259) is much lower than that of the City of Houston ($48,322). In this Park Sector, 72% of the population is low to moderate income; therefore, this area could qualify for Community Development Block Grant (CDBG) funds.
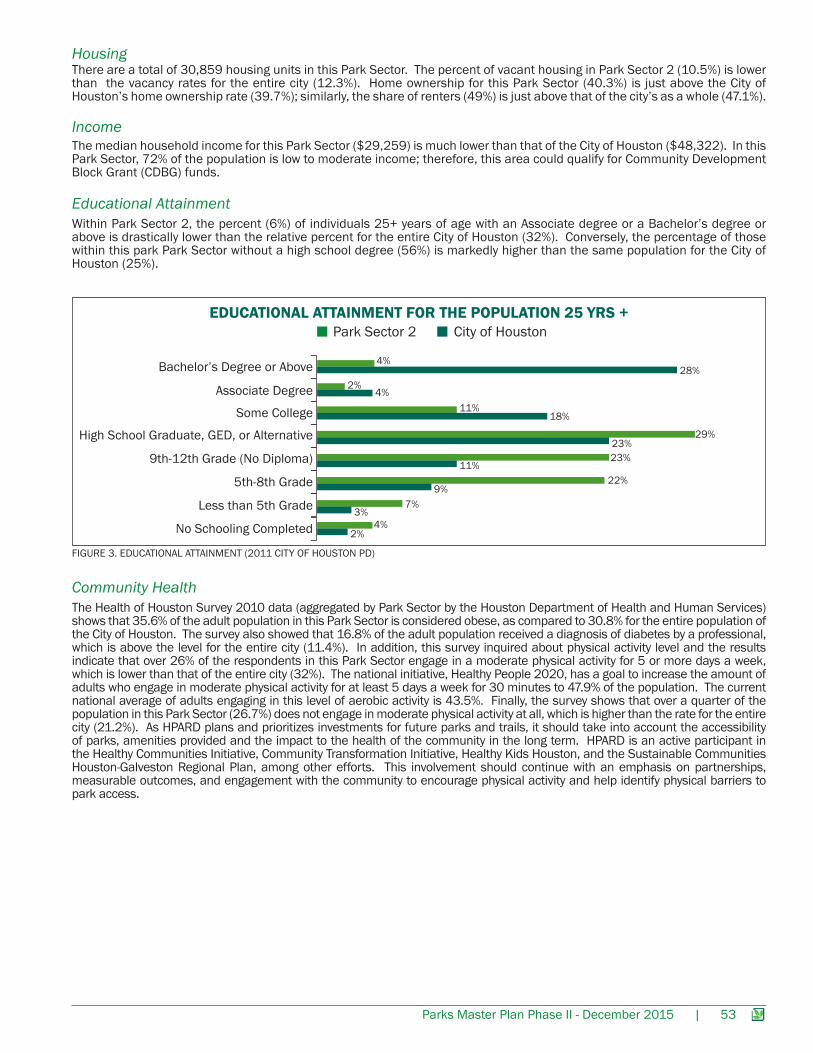
Within Park Sector 2, the percent (6%) of individuals 25+ years of age with an Associate degree or a Bachelor’s degree or above is drastically lower than the relative percent for the entire City of Houston (32%). Conversely, the percentage of those within this park Park Sector without a high school degree (56%) is markedly higher than the same population for the City of Houston (25%).
EDUCATIONAL ATTAINMENT FOR THE POPULATION 25 YRS +City of HoustonPark Sector 2
Bachelor’s Degree or Above 28%4%
4%2%
18%11%
23%29%
11%23%
9%22%
3%7%
2%4%
Associate Degree
Some College
High School Graduate, GED, or Alternative
9th-12th Grade (No Diploma)
5th-8th Grade
Less than 5th Grade
No Schooling Completed
FIGURE 3. EDUCATIONAL ATTAINMENT (2011 CITY OF HOUSTON PD)
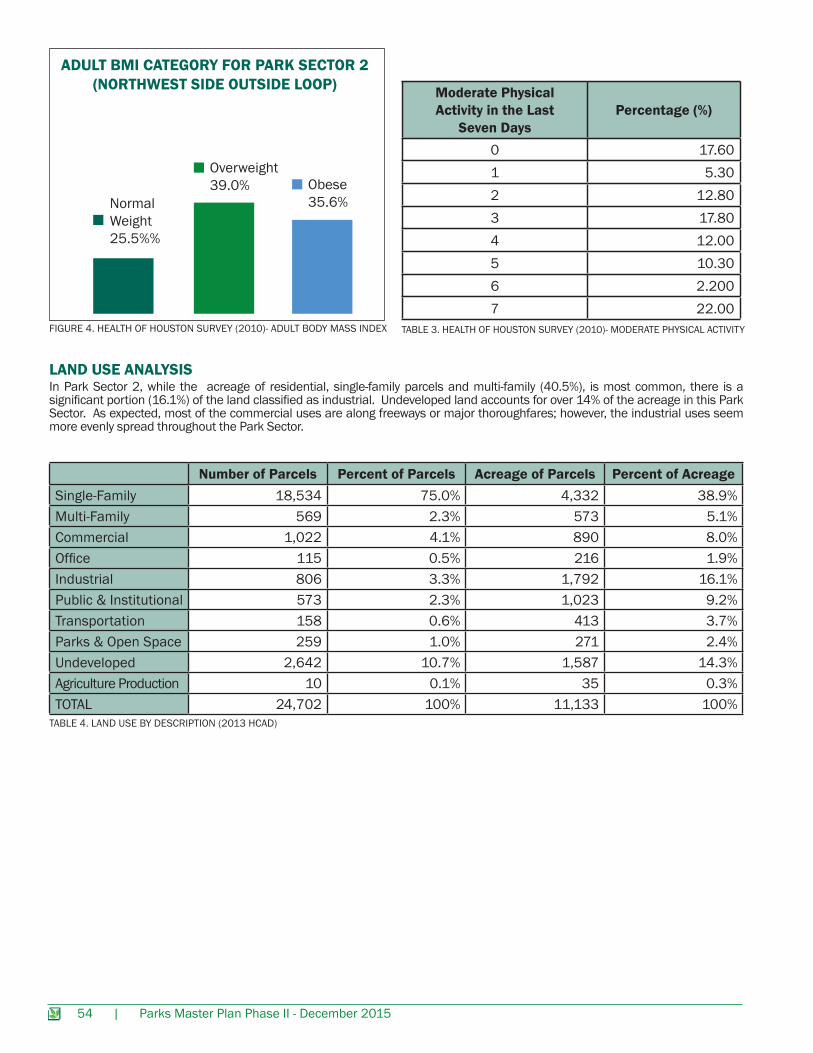
Community HealthThe Health of Houston Survey 2010 data (aggregated by Park Sector by the Houston Department of Health and Human Services) shows that 35.6% of the adult population in this Park Sector is considered obese, as compared to 30.8% for the entire population of the City of Houston. The survey also showed that 16.8% of the adult population received a diagnosis of diabetes by a professional, which is above the level for the entire city (11.4%). In addition, this survey inquired about physical activity level and the results indicate that over 26% of the respondents in this Park Sector engage in a moderate physical activity for 5 or more days a week, which is lower than that of the entire city (32%). The national initiative, Healthy People 2020, has a goal to increase the amount of adults who engage in moderate physical activity for at least 5 days a week for 30 minutes to 47.9% of the population. The current national average of adults engaging in this level of aerobic activity is 43.5%. Finally, the survey shows that over a quarter of the population in this Park Sector (26.7%) does not engage in moderate physical activity at all, which is higher than the rate for the entire city (21.2%). As HPARD plans and prioritizes investments for future parks and trails, it should take into account the accessibility of parks, amenities provided and the impact to the health of the community in the long term. HPARD is an active participant in the Healthy Communities Initiative, Community Transformation Initiative, Healthy Kids Houston, and the Sustainable Communities Houston-Galveston Regional Plan, among other efforts. This involvement should continue with an emphasis on partnerships, measurable outcomes, and engagement with the community to encourage physical activity and help identify physical barriers to park access.
54 | Parks Master Plan Phase II - December 2015
Normal Weight25.5%%
Overweight39.0% Obese
35.6%
ADULT BMI CATEGORY FOR PARK SECTOR 2(NORTHWEST SIDE OUTSIDE LOOP)
LAND USE ANALYSIS
Moderate Physical Activity in the Last
Seven DaysPercentage (%)
0 17.601 5.302 12.803 17.804 12.005 10.306 2.2007 22.00
FIGURE 4. HEALTH OF HOUSTON SURVEY (2010)- ADULT BODY MASS INDEX TABLE 3. HEALTH OF HOUSTON SURVEY (2010)- MODERATE PHYSICAL ACTIVITY
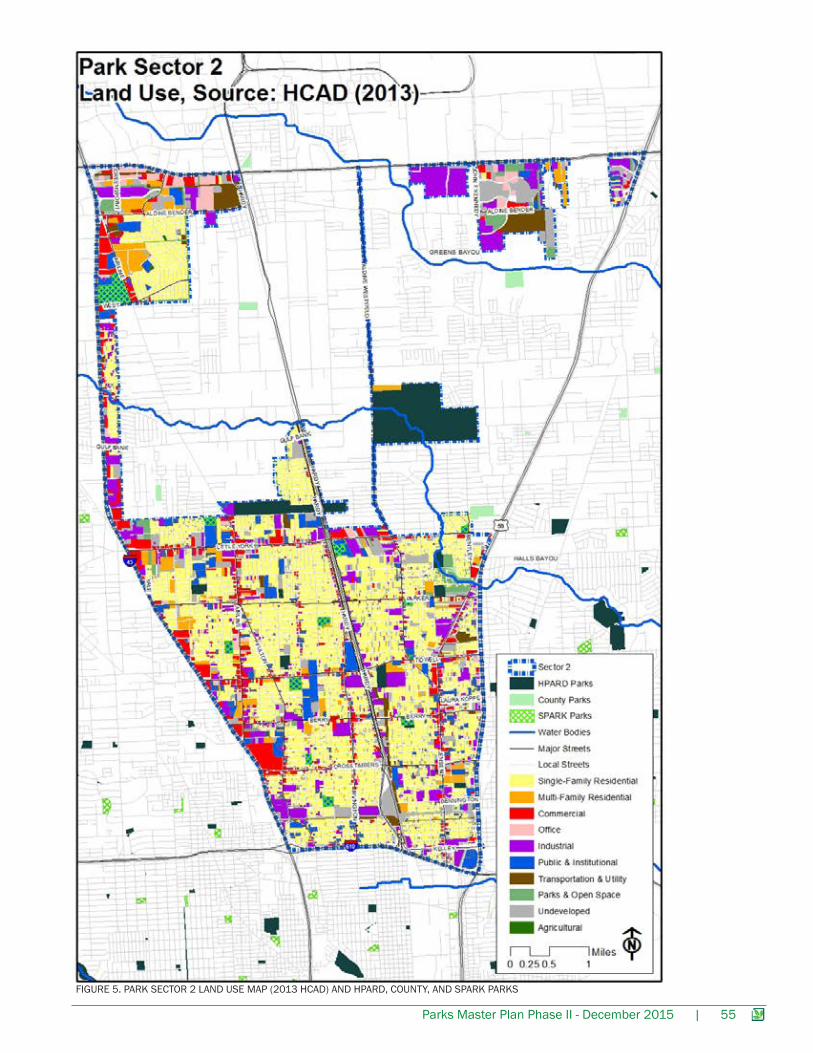
Number of Parcels Percent of Parcels Acreage of Parcels Percent of AcreageSingle-Family 18,534 75.0% 4,332 38.9%Multi-Family 569 2.3% 573 5.1%Commercial 1,022 4.1% 890 8.0%Office 115 0.5% 216 1.9%Industrial 806 3.3% 1,792 16.1%Public & Institutional 573 2.3% 1,023 9.2%Transportation 158 0.6% 413 3.7%Parks & Open Space 259 1.0% 271 2.4%Undeveloped 2,642 10.7% 1,587 14.3%Agriculture Production 10 0.1% 35 0.3%TOTAL 24,702 100% 11,133 100%
TABLE 4. LAND USE BY DESCRIPTION (2013 HCAD)
In Park Sector 2, while the acreage of residential, single-family parcels and multi-family (40.5%), is most common, there is a significant portion (16.1%) of the land classified as industrial. Undeveloped land accounts for over 14% of the acreage in this Park Sector. As expected, most of the commercial uses are along freeways or major thoroughfares; however, the industrial uses seem more evenly spread throughout the Park Sector.
Parks Master Plan Phase II - December 2015 | 55
FIGURE 5. PARK SECTOR 2 LAND USE MAP (2013 HCAD) AND HPARD, COUNTY, AND SPARK PARKS
56 | Parks Master Plan Phase II - December 2015
Facility Name Address Street Total Acres
TrailLength
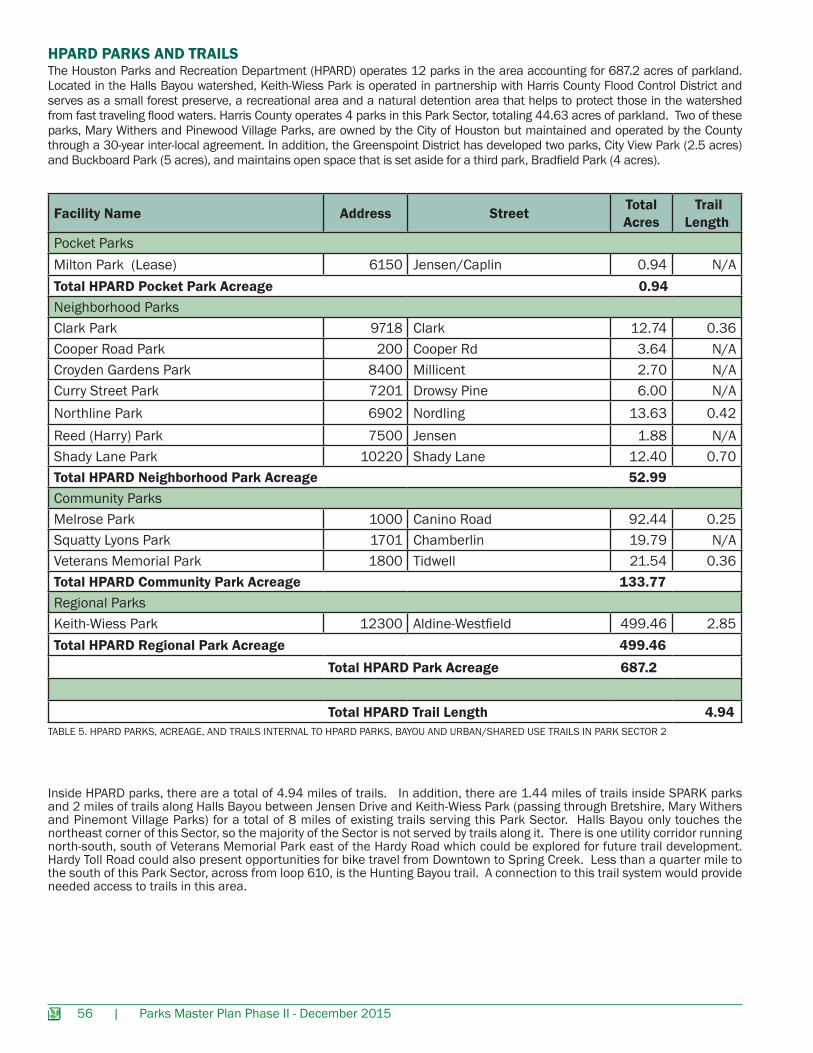
Pocket ParksMilton Park (Lease) 6150 Jensen/Caplin 0.94 N/ATotal HPARD Pocket Park Acreage 0.94Neighborhood ParksClark Park 9718 Clark 12.74 0.36Cooper Road Park 200 Cooper Rd 3.64 N/ACroyden Gardens Park 8400 Millicent 2.70 N/ACurry Street Park 7201 Drowsy Pine 6.00 N/ANorthline Park 6902 Nordling 13.63 0.42Reed (Harry) Park 7500 Jensen 1.88 N/AShady Lane Park 10220 Shady Lane 12.40 0.70Total HPARD Neighborhood Park Acreage 52.99Community ParksMelrose Park 1000 Canino Road 92.44 0.25Squatty Lyons Park 1701 Chamberlin 19.79 N/AVeterans Memorial Park 1800 Tidwell 21.54 0.36Total HPARD Community Park Acreage 133.77Regional ParksKeith-Wiess Park 12300 Aldine-Westfield 499.46 2.85Total HPARD Regional Park Acreage 499.46 Total HPARD Park Acreage 687.2
Total HPARD Trail Length 4.94TABLE 5. HPARD PARKS, ACREAGE, AND TRAILS INTERNAL TO HPARD PARKS, BAYOU AND URBAN/SHARED USE TRAILS IN PARK SECTOR 2
HPARD PARKS AND TRAILSThe Houston Parks and Recreation Department (HPARD) operates 12 parks in the area accounting for 687.2 acres of parkland. Located in the Halls Bayou watershed, Keith-Wiess Park is operated in partnership with Harris County Flood Control District and serves as a small forest preserve, a recreational area and a natural detention area that helps to protect those in the watershed from fast traveling flood waters. Harris County operates 4 parks in this Park Sector, totaling 44.63 acres of parkland. Two of these parks, Mary Withers and Pinewood Village Parks, are owned by the City of Houston but maintained and operated by the County through a 30-year inter-local agreement. In addition, the Greenspoint District has developed two parks, City View Park (2.5 acres) and Buckboard Park (5 acres), and maintains open space that is set aside for a third park, Bradfield Park (4 acres).
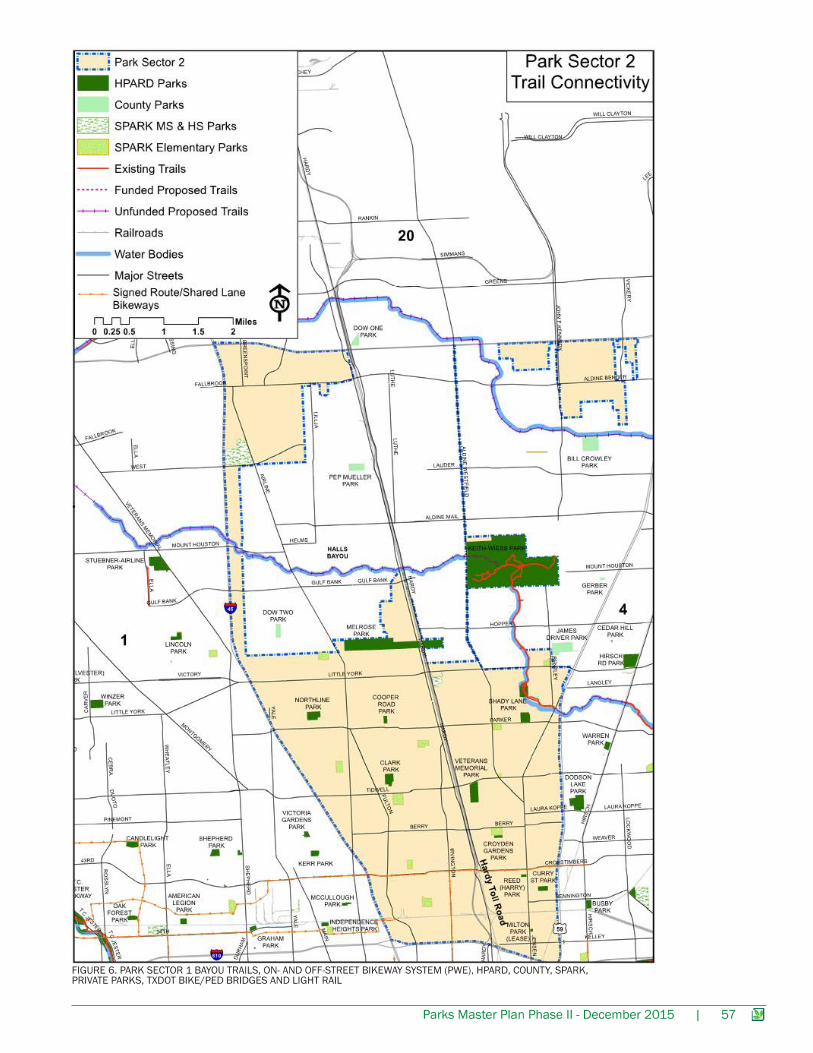
Inside HPARD parks, there are a total of 4.94 miles of trails. In addition, there are 1.44 miles of trails inside SPARK parks and 2 miles of trails along Halls Bayou between Jensen Drive and Keith-Wiess Park (passing through Bretshire, Mary Withers and Pinemont Village Parks) for a total of 8 miles of existing trails serving this Park Sector. Halls Bayou only touches the northeast corner of this Sector, so the majority of the Sector is not served by trails along it. There is one utility corridor running north-south, south of Veterans Memorial Park east of the Hardy Road which could be explored for future trail development. Hardy Toll Road could also present opportunities for bike travel from Downtown to Spring Creek. Less than a quarter mile to the south of this Park Sector, across from loop 610, is the Hunting Bayou trail. A connection to this trail system would provide needed access to trails in this area.
Parks Master Plan Phase II - December 2015 | 57
FIGURE 6. PARK SECTOR 1 BAYOU TRAILS, ON- AND OFF-STREET BIKEWAY SYSTEM (PWE), HPARD, COUNTY, SPARK, PRIVATE PARKS, TXDOT BIKE/PED BRIDGES AND LIGHT RAIL
58 | Parks Master Plan Phase II - December 2015
EXISTING PARK FACILITIES
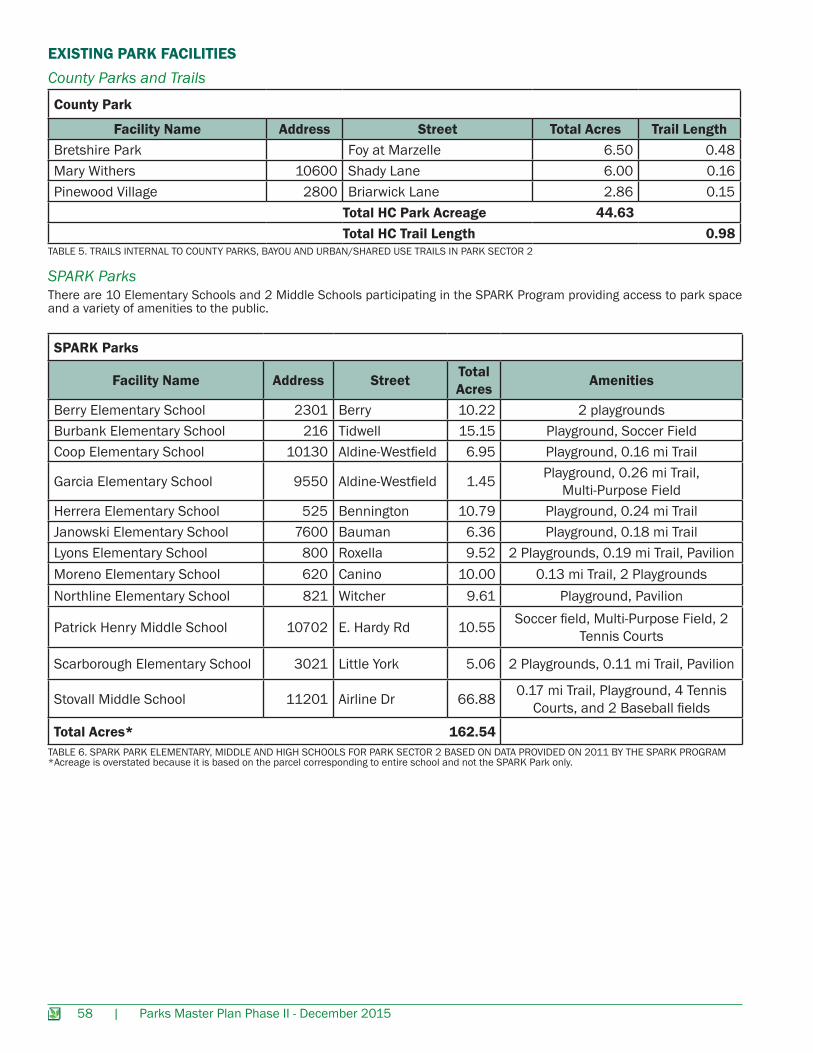
There are 10 Elementary Schools and 2 Middle Schools participating in the SPARK Program providing access to park space and a variety of amenities to the public.
County Park
Facility Name Address Street Total Acres Trail LengthBretshire Park Foy at Marzelle 6.50 0.48Mary Withers 10600 Shady Lane 6.00 0.16Pinewood Village 2800 Briarwick Lane 2.86 0.15 Total HC Park Acreage 44.63 Total HC Trail Length 0.98
County Parks and Trails
SPARK Parks
SPARK Parks
Facility Name Address Street Total Acres Amenities
Berry Elementary School 2301 Berry 10.22 2 playgroundsBurbank Elementary School 216 Tidwell 15.15 Playground, Soccer FieldCoop Elementary School 10130 Aldine-Westfield 6.95 Playground, 0.16 mi Trail
Garcia Elementary School 9550 Aldine-Westfield 1.45 Playground, 0.26 mi Trail, Multi-Purpose Field
Herrera Elementary School 525 Bennington 10.79 Playground, 0.24 mi TrailJanowski Elementary School 7600 Bauman 6.36 Playground, 0.18 mi TrailLyons Elementary School 800 Roxella 9.52 2 Playgrounds, 0.19 mi Trail, PavilionMoreno Elementary School 620 Canino 10.00 0.13 mi Trail, 2 PlaygroundsNorthline Elementary School 821 Witcher 9.61 Playground, Pavilion
Patrick Henry Middle School 10702 E. Hardy Rd 10.55 Soccer field, Multi-Purpose Field, 2 Tennis Courts
Scarborough Elementary School 3021 Little York 5.06 2 Playgrounds, 0.11 mi Trail, Pavilion
Stovall Middle School 11201 Airline Dr 66.88 0.17 mi Trail, Playground, 4 Tennis Courts, and 2 Baseball fields
Total Acres* 162.54
TABLE 5. TRAILS INTERNAL TO COUNTY PARKS, BAYOU AND URBAN/SHARED USE TRAILS IN PARK SECTOR 2
TABLE 6. SPARK PARK ELEMENTARY, MIDDLE AND HIGH SCHOOLS FOR PARK SECTOR 2 BASED ON DATA PROVIDED ON 2011 BY THE SPARK PROGRAM*Acreage is overstated because it is based on the parcel corresponding to entire school and not the SPARK Park only.
Parks Master Plan Phase II - December 2015 | 59
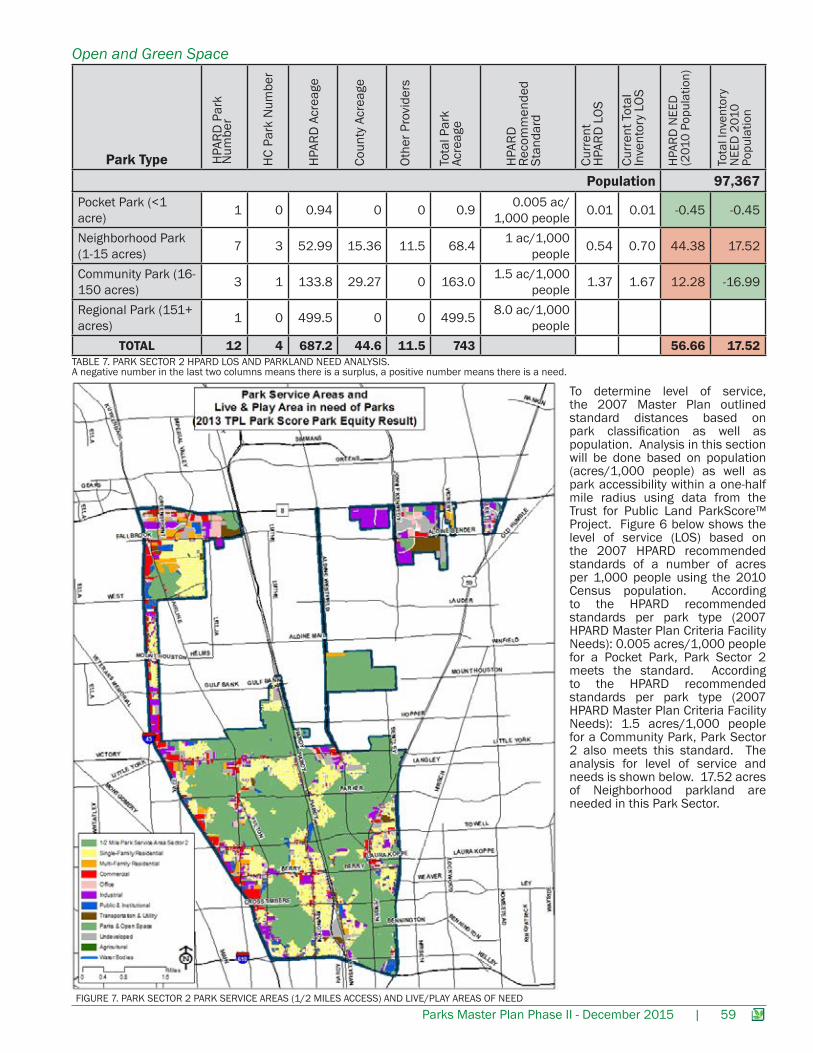
To determine level of service, the 2007 Master Plan outlined standard distances based on park classification as well as population. Analysis in this section will be done based on population (acres/1,000 people) as well as park accessibility within a one-half mile radius using data from the Trust for Public Land ParkScore™ Project. Figure 6 below shows the level of service (LOS) based on the 2007 HPARD recommended standards of a number of acres per 1,000 people using the 2010 Census population. According to the HPARD recommended standards per park type (2007 HPARD Master Plan Criteria Facility Needs): 0.005 acres/1,000 people for a Pocket Park, Park Sector 2 meets the standard. According to the HPARD recommended standards per park type (2007 HPARD Master Plan Criteria Facility Needs): 1.5 acres/1,000 people for a Community Park, Park Sector 2 also meets this standard. The analysis for level of service and needs is shown below. 17.52 acres of Neighborhood parkland are needed in this Park Sector.
Park TypePopulation 97,367
Pocket Park (<1 acre) 1 0 0.94 0 0 0.9 0.005 ac/
1,000 people 0.01 0.01 -0.45 -0.45
Neighborhood Park (1-15 acres) 7 3 52.99 15.36 11.5 68.4 1 ac/1,000
people 0.54 0.70 44.38 17.52
Community Park (16-150 acres) 3 1 133.8 29.27 0 163.0 1.5 ac/1,000
people 1.37 1.67 12.28 -16.99
Regional Park (151+ acres) 1 0 499.5 0 0 499.5 8.0 ac/1,000
peopleTOTAL 12 4 687.2 44.6 11.5 743 56.66 17.52
HPA
RD P
ark
Num
ber
HC
Park
Num
ber
HPA
RD A
crea
ge
Coun
ty A
crea
ge
Othe
r Pro
vide
rs
Tota
l Par
k Ac
reag
e
Curr
ent
HPA
RD L
OS
Curr
ent T
otal
Inve
ntor
y LO
S
Tota
l Inv
ento
ry
NEE
D 2
010
Popu
latio
n
HPA
RD N
EED
(2
010
Popu
latio
n)
HPA
RD
Reco
mm
ende
d St
anda
rd
TABLE 7. PARK SECTOR 2 HPARD LOS AND PARKLAND NEED ANALYSIS. A negative number in the last two columns means there is a surplus, a positive number means there is a need.
Open and Green Space
FIGURE 7. PARK SECTOR 2 PARK SERVICE AREAS (1/2 MILES ACCESS) AND LIVE/PLAY AREAS OF NEED
60 | Parks Master Plan Phase II - December 2015
Another way to measure the level of service provided by parks is by looking at a “walkable” distance (1/2 mile radius) from the park regardless of the size of this park. The Rice University Shell Center for Sustainability published the Houston Sustainable Development Indicators: A Comprehensive Development Review for Citizens, Analysts, and Decision Makers and used ¼ of a mile distance of persons living from a park as a sustainability indicator for quality of life and determined that 44% of residents have access to a public space (King 2012). The Trust for Public Land (TPL) ParkScore™ study mapped the park needs of the City of Houston based on accessibility by density, age, and income. The methodology used by Trust for Public Land (TPL) ParkScore™ Project factors in the accessibility to a public park within ½ mile considering freeways and major thoroughfares as barriers to park access. Trust for Public Land (TPL) ParkScore™ found that 45% of residents have access to public spaces (Trust for Public Land (TPL) 2012). The map was produced using data provided by Trust for Public Land (TPL) ParkScore™ Project. The areas in green in Figure 7 represent the area within ½ mile of existing parks not blocked by freeways or major roads. Roughly 40% of the live/play areas (residential= yellow and orange and some commercial= red) in this Park Sector are not served by a park, which is lower than that of the entire city (55%). This percentage was calculated by subtracting the areas served, industrial areas, and acreage of private parks from the total acreage of the Park Sector. The hatched areas touching the boundaries of the Park Sector correspond to the existing Greenspoint District parks: CityView Park, Buckboard Park and Bradfield Park. These parks serve the most northwestern portion of this Park Sector. The other hatched areas hatched outside the Park Sector are proposed parks (according to the Greens Bayou Corridor Coalition Parks (GBCC) and Trails Master Plan) along Greens Bayou. The hatched areas are not accounted in the percentage for the areas served at this time, so the service area percentage is underestimated.
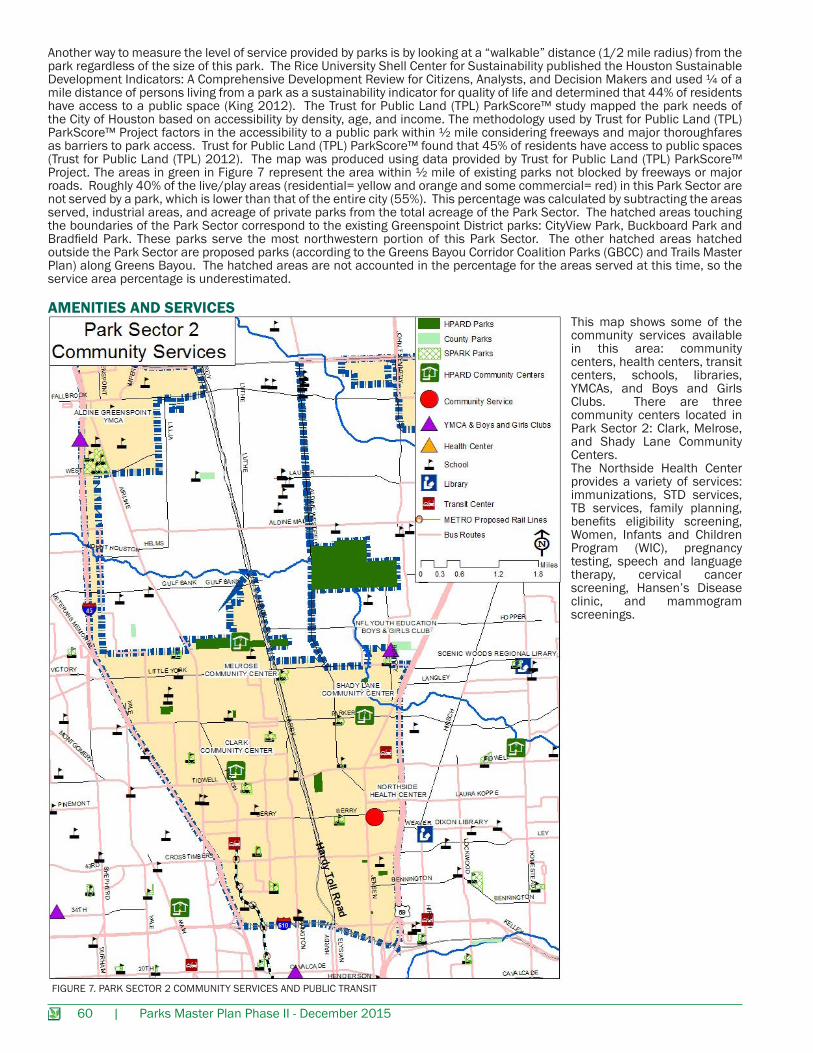
This map shows some of the community services available in this area: community centers, health centers, transit centers, schools, libraries, YMCAs, and Boys and Girls Clubs. There are three community centers located in Park Sector 2: Clark, Melrose, and Shady Lane Community Centers.The Northside Health Center provides a variety of services: immunizations, STD services, TB services, family planning, benefits eligibility screening, Women, Infants and Children Program (WIC), pregnancy testing, speech and language therapy, cervical cancer screening, Hansen’s Disease clinic, and mammogram screenings.
AMENITIES AND SERVICES
FIGURE 7. PARK SECTOR 2 COMMUNITY SERVICES AND PUBLIC TRANSIT
Parks Master Plan Phase II - December 2015 | 61
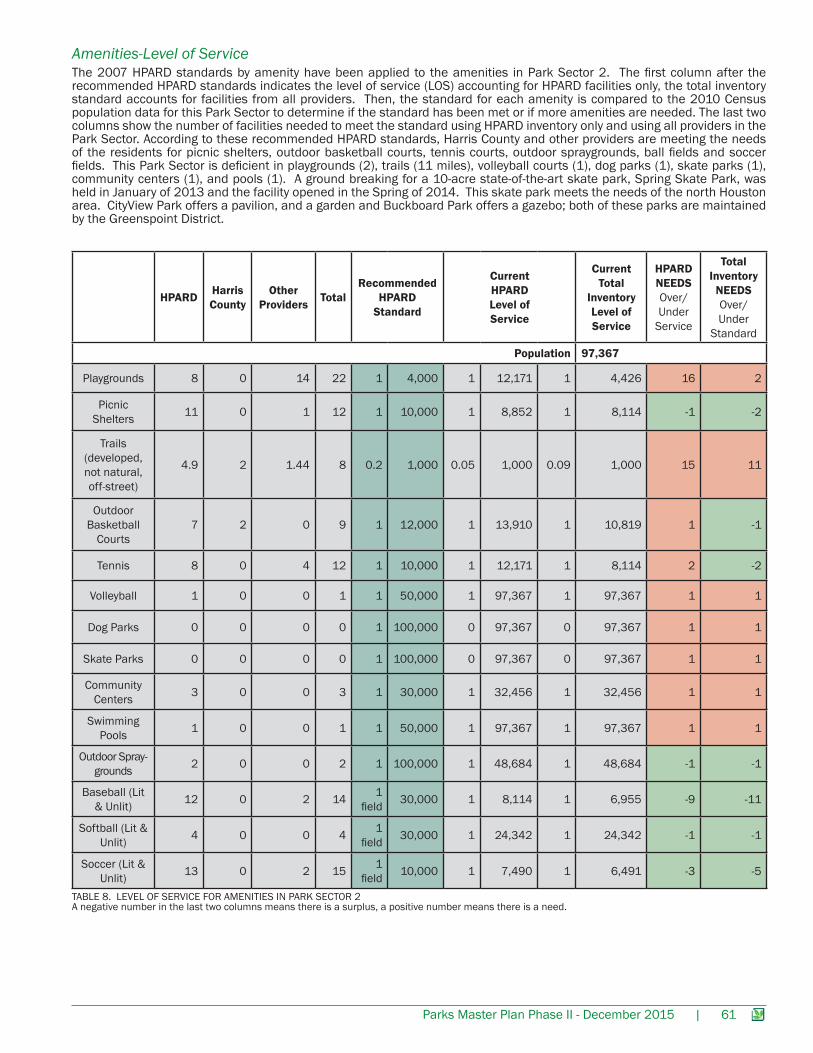
TABLE 8. LEVEL OF SERVICE FOR AMENITIES IN PARK SECTOR 2A negative number in the last two columns means there is a surplus, a positive number means there is a need.
The 2007 HPARD standards by amenity have been applied to the amenities in Park Sector 2. The first column after the recommended HPARD standards indicates the level of service (LOS) accounting for HPARD facilities only, the total inventory standard accounts for facilities from all providers. Then, the standard for each amenity is compared to the 2010 Census population data for this Park Sector to determine if the standard has been met or if more amenities are needed. The last two columns show the number of facilities needed to meet the standard using HPARD inventory only and using all providers in the Park Sector. According to these recommended HPARD standards, Harris County and other providers are meeting the needs of the residents for picnic shelters, outdoor basketball courts, tennis courts, outdoor spraygrounds, ball fields and soccer fields. This Park Sector is deficient in playgrounds (2), trails (11 miles), volleyball courts (1), dog parks (1), skate parks (1), community centers (1), and pools (1). A ground breaking for a 10-acre state-of-the-art skate park, Spring Skate Park, was held in January of 2013 and the facility opened in the Spring of 2014. This skate park meets the needs of the north Houston area. CityView Park offers a pavilion, and a garden and Buckboard Park offers a gazebo; both of these parks are maintained by the Greenspoint District.
Amenities-Level of Service
HPARD Harris County
Other Providers Total
Recommended HPARD
Standard
Current HPARD Level of Service
Current Total
Inventory Level of Service
HPARD NEEDS Over/Under
Service
Total Inventory
NEEDS Over/Under
Standard
Population 97,367
Playgrounds 8 0 14 22 1 4,000 1 12,171 1 4,426 16 2
Picnic Shelters 11 0 1 12 1 10,000 1 8,852 1 8,114 -1 -2
Trails (developed, not natural, off-street)
4.9 2 1.44 8 0.2 1,000 0.05 1,000 0.09 1,000 15 11
Outdoor Basketball
Courts7 2 0 9 1 12,000 1 13,910 1 10,819 1 -1
Tennis 8 0 4 12 1 10,000 1 12,171 1 8,114 2 -2
Volleyball 1 0 0 1 1 50,000 1 97,367 1 97,367 1 1
Dog Parks 0 0 0 0 1 100,000 0 97,367 0 97,367 1 1
Skate Parks 0 0 0 0 1 100,000 0 97,367 0 97,367 1 1
Community Centers 3 0 0 3 1 30,000 1 32,456 1 32,456 1 1
Swimming Pools 1 0 0 1 1 50,000 1 97,367 1 97,367 1 1
Outdoor Spray-grounds 2 0 0 2 1 100,000 1 48,684 1 48,684 -1 -1
Baseball (Lit & Unlit) 12 0 2 14 1
field 30,000 1 8,114 1 6,955 -9 -11
Softball (Lit & Unlit) 4 0 0 4 1
field 30,000 1 24,342 1 24,342 -1 -1
Soccer (Lit & Unlit) 13 0 2 15 1
field 10,000 1 7,490 1 6,491 -3 -5
62 | Parks Master Plan Phase II - December 2015
• Keith-Wiess Park received funds to execute a project of which the scope of work includes: 3 new soccer fields, irrigation, water well, parking lot, field and parking lot lighting, electrical service, bleachers, and side walks. The work was completed in April 2013.
• Shady Lane Park received $1.5 million in CIP funds and other private and public grants for a major renovation. The scope of the work consists of demolishing of existing playground equipment, picnic tables, benches and concrete pads and replacing these with new grading, drainage, sidewalks, concrete bordering, playground, swings, picnic tables, grills, benches, decomposing granite pathways, boulder placement and outdoor exercise equipment. The existing picnic shelter plaza was expanded and water spray features were constructed. The work was finished in October of 2013.
Status of Projects (POS/CIP/CDBG/Grants)
Parks Master Plan Phase II - December 2015 | 63
FIGURE 1: PARK SECTOR 2 COUNCIL DISTRICTS
SUPPLEMENTAL MAP: Park Sector 2 Council Districts

64 | Parks Master Plan Phase II - December 2015
FIGURE 2: PARK SECTOR 2 MANAGEMENT DISTRICTS AND TIRZS
Park Sector 2 Tax Increment Reinvestment Zones (TIRZs) and Management Districts
Parks Master Plan Phase II - December 2015 | 65
FIGURE 3: PARK SECTOR 2 SUPER NEIGHBORHOODS
Park Sector 2 Super neighborhoods
66 | Parks Master Plan Phase II - December 2015
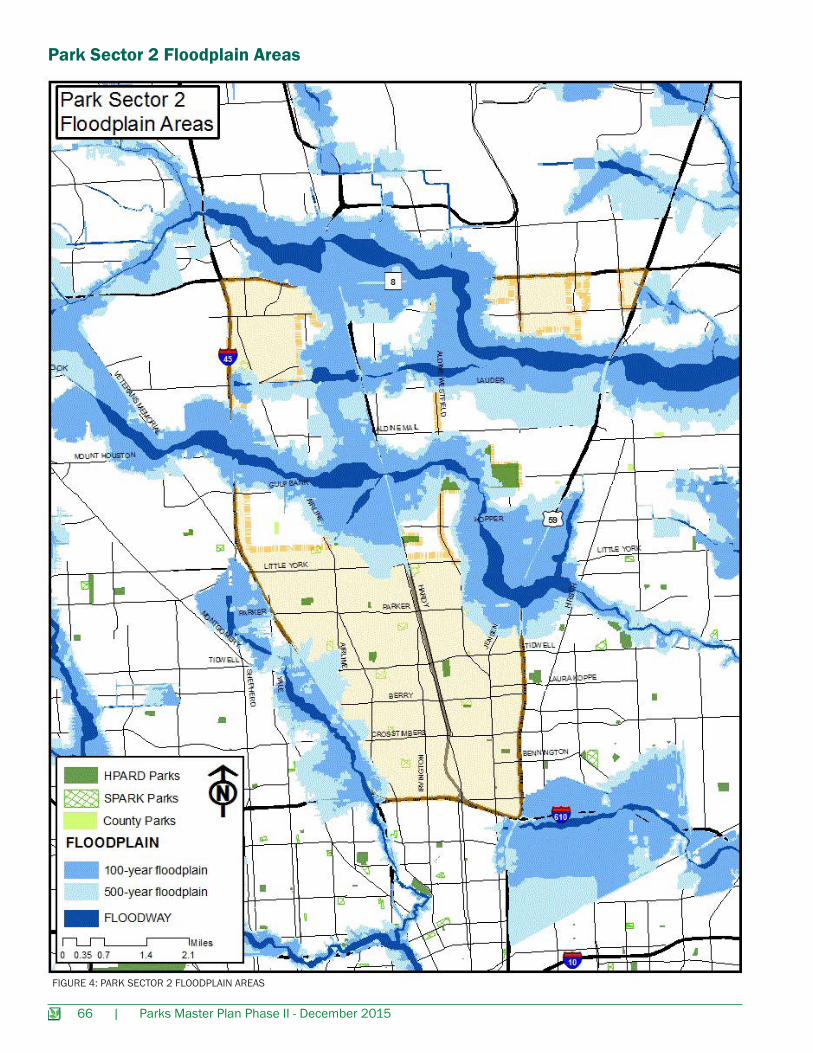
FIGURE 4: PARK SECTOR 2 FLOODPLAIN AREAS
Park Sector 2 Floodplain Areas