Embed Size (px)
Citation preview


Houston Mayoral Survey 2019 October 20, 2019
Highlights This fall Houstonians will elect the mayor who will serve until the end of 2023. To better understand the dynamics of this contest, the University of Houston Hobby School of Public Affairs conducted a representative live operator telephone survey, using land-line and cell phones in English and Spanish, of 501 likely voters between October 1 and October 9. The results provide a snapshot of public opinion related to the mayoral race four to five weeks before the November 5 election day and two to three weeks before the start of early voting on October 21. Much can happen during this stretch however, ranging from an October surprise adversely affecting a frontrunner to increased exposure of a trailing candidate leading to greater support for them among voters. The data suggest Mayor Sylvester Turner is, at least at the present time, potentially on a path to victory. Among all likely voters, 43.5% intend to vote for Turner, and early runoff pairings suggest that at least as of early October, he would easily defeat all four of his most likely rivals in a runoff. In the event of a runoff, Tony Buzbee would be Turner’s most likely rival. Buzbee is supported by 23.4% of likely voters, triple the number who intend to vote for Bill King (7.8%) and Dwight Boykins (6.8%), with Sue Lovell at 1.2%. The data suggest Turner would defeat all four rivals in a runoff by a margin of between 18.8% (vs. Buzbee) and 38.5% (vs. Lovell). Strong ethnic/racial differences exist in the support for the candidates. Buzbee’s support is strongest among Anglo/White voters, of whom 37.2% indicate they plan to vote for Buzbee, followed closely by 34.4% for Turner, and 11.8% for King. Turner is the overwhelming favorite among African American voters, 59.4% of whom plan to cast a vote for the mayor. Among the other candidates, only Boykins enjoys double-digit support among African Americans (13.5%). Turner is the preferred candidate among Latino voters (42.6%), with Buzbee the only other candidate with double-digit support (13.1%). Boykins and King suffer from relatively low name recognition among likely voters. More than two-thirds (68.7%) do not know enough about Boykins to have either a favorable or unfavorable opinion of him; those who have an opinion on average have a favorable one. More than one-half of likely voters (54.3%) do not know enough about King to have an opinion of him; those who do on average have a favorable one. The most well-known politician is President Donald Trump. Trump is also the least popular; 31.9% hold a favorable and 63.1% an unfavorable opinion. Unsurprisingly for a survey taken in the aftermath of Tropical Storm Imelda, 41.1% of likely voters rank flooding as the most important problem facing Houston, followed by crime (22.0%), rising property taxes (9.0%), traffic congestion (8.4%), and road quality (8.0%).

2
Background Public opinion surveys conducted by reputable pollsters using state of the art methodology remain the best tool available to assess the state of play of an electoral contest. This is in spite of the many challenges facing the polling industry, ranging from declining response rates to changing patterns of phone and technology use. That said, this survey should be best thought of as a snapshot of the state of play of the 2019 Houston mayoral election during the first week and a half of October, with all of the estimates also reflecting the natural error of any sample survey (in this case plus or minus 4.4%), indicating that a candidate whose vote intention in a survey is 40% could have a level of support as high as 44.4% and as low as 35.6%. The following ten sections contain detailed information on the popular support for the leading mayoral candidates as well as information on problems facing Houston and on the City's trajectory. Section 1 provides extensive information on how likely voters are planning to vote as well as on ethnic/racial, gender, generational, socioeconomic, and partisan differences in support for the leading candidates. Section 2 examines four distinct runoff scenarios between Mayor Sylvester Turner and his four most likely runoff rivals. Section 3 takes a look at the second preferences of the mayoral candidates’ supporters to see to whom their support would most likely pass if they were to falter during the campaign homestretch. Section 4 reveals the candidates’ favorability ratings among likely voters while Section 5 does the same thing for a select group of officeholders. Section 6 deepens the analysis in Section 5 by analyzing the relationship between a voter’s evaluation of President Donald Trump and their support for the leading mayoral candidates. Section 7 details the problems likely voters believe to be the most important facing Houston. Section 8 explores the view of these same voters of the City’s current trajectory. Section 9 digs deeper into the preferences of undecided voters in an attempt to determine which mayoral candidate is most likely to receive their vote. Section 10 provides details on the survey methodology. 1. The Mayoral Vote The survey respondents were asked who would they vote for if the Houston mayoral election were held today. Table 1 and Figure 1 on page 3 provides the responses to this question for two groups of voters: Likely Voters (those who responded they definitely or probably would vote in the 2019 Houston mayoral election) and Most Likely Voters (those who responded they definitely would vote in the 2019 Houston mayoral election). As the data in the table reveal, there is little difference in the vote intention among the Likely and Most Likely Voters (though to the extent to which there is a difference, it would appear to ever so slightly favor Buzbee, Boykins, and King rather than the incumbent Turner). For this reason, unless otherwise mentioned, all discussion in the remainder of this report will focus on the Likely Voter group. The Mayoral Vote: Likely and Most Likely Voters Turner enjoys the support of 43.5% of the likely voters, followed by Tony Buzbee (23.4%), Bill King (7.8%), Dwight Boykins (6.8%), Sue Lovell (1.2%), and one of the seven other candidates in the race (0.2%). Nearly one in five voters (17.2%) is undecided or did not wish to voice their vote intention.

3
Deeper analysis (Section 9) suggests at least one-third of these undecided voters is considering Turner as one of their top two options.
TABLE 1. MAYOR'S RACE (%)
Candidate All Likely Voters Most Likely Voters
Sylvester Turner 43.5 43.0 Tony Buzbee 23.4 24.3 Bill King 7.8 8.4 Dwight Boykins 6.8 7.5 Sue Lovell 1.2 1.0 Someone Else 0.2 0.0 Don't Know/Undecided 17.2 15.9 Total Cases 501 416
FIGURE 1. MAYOR'S RACE (%)

4
The Mayoral Vote & Ethnicity/Race Table 2 provides similar vote intention information broken down by ethnicity/race: Anglo/White, African American/Black, Latino/Hispanic, Asian American/Native American (a combined group given the small size). In the survey population, Anglos represent 50.5% of respondents, African Americans 33.9%, Latinos 12.2%, and Asian Americans and Native Americans 3.4% of respondents. These proportions are comparable to those of voters in the 2015 Houston mayoral election, with the modest exception that the Latino share is projected to be slightly lower in 2019 compared to 2015 due primarily to the absence of a high profile Latino mayoral candidate (Adrian Garcia in 2015), and the Anglo proportion slightly higher. TABLE 2. MAYOR'S RACE: SUPPORT BY ETHNICITY/RACE (%)
Buzbee (37.2%) and Turner (34.4%) enjoy comparable levels of support among Houston Anglos, with King in a distant third (11.8%), Boykins (2.4%) and Lovell (0.8%) possessing very modest support, and 13.4% of whom remain undecided. Turner is the African American community’s favored candidate by a substantial margin with 59.4%, followed by Boykins with 13.5%. African American support for Buzbee (4.7%), King (1.8%), and Lovell (0.6%) is very modest, though there is still some room for them to grow, as nearly one in five (19.4%) of African Americans remains undecided. Turner also enjoys a substantial advantage among Latino voters (42.6%), more than three times the vote intention of his next closest rival, Buzbee (13.1%). Boykins is third among Latinos (8.2%), followed by King (4.9%), and Lovell (3.3%). More than one in four (27.9%) Latinos remains undecided, suggesting even more room for many of these candidates to grow within the Latino community. The Mayoral Vote & Gender Table 3 provides comparable information of vote intention by gender. Turner possesses the highest vote intention among both women and men, although his support among women (47.0%) is significantly higher than his support among men (39.5%). Buzbee's support is relatively equal among women (22.0%) and men (24.9%). Both King and Boykins enjoy moderately more support among men (9.0% and 8.6%) than among women (6.7% and 5.2%), with the opposite true for Lovell whose support among women (1.5%) is greater than among men (0.9%).
Candidate Anglo/White African American/Black Latino/Hispanic Asian & Native AmericanSylvester Turner 34.4 59.4 42.6 23.5Tony Buzbee 37.2 4.7 13.1 41.2Bill King 11.8 1.8 4.9 17.7Dwight Boykins 2.4 13.5 8.2 0.0Sue Lovell 0.8 0.6 3.3 5.9Someone Else 0.0 0.6 0.0 0.0Don't Know/Undecided 13.4 19.4 27.9 11.8
Total Cases 253 170 61 17Distribution 50.5 33.9 12.2 3.4

5
TABLE 3. MAYOR'S RACE: SUPPORT BY GENDER (%)
Candidate Women Men Sylvester Turner 47.0 39.5 Tony Buzbee 22.0 24.9 Bill King 6.7 9.0 Dwight Boykins 5.2 8.6 Sue Lovell 1.5 0.9 Someone Else 0.4 0.0 Don't Know/Undecided 17.2 17.2 Total Cases 268 233 Distribution 53.5 46.5
The Mayoral Vote & Gender + Race Table 4 provides a similar breakdown by gender, but further differentiated by the City of Houston voting electorate's two predominant ethnic/racial groups: Anglos and African Americans. It underscores that Turner's advantage among women compared to men transcends race, with a 38.1% to 30.7% advantage among Anglos and a 63.9% to 51.6% among African Americans. Buzbee's support among Anglo women (37.3%) and men (37.0%) is virtually identical.
TABLE 4. MAYOR'S RACE: SUPPORT BY GENDER AND RACE (%)
Candidate Anglo Women
Anglo Men
African American Women
African American Men
Sylvester Turner 38.1 30.7 63.9 51.6 Tony Buzbee 37.3 37.0 2.8 8.1 Bill King 11.1 12.6 2.8 0.0 Dwight Boykins 0.0 4.7 11.1 17.7 Sue Lovell 0.0 1.6 0.9 0.0 Someone Else 0.0 0.0 0.9 0.0 Don't Know/Undecided 13.5 13.4 17.6 22.6
The Mayoral Vote & Generation Table 5 looks at the mayoral vote intention through a generational lens, with the population divided into four generational groups: Generation Z (those born since 1997) combined with Millennials (those born between 1981 and 1996); Generation X (1965-1980), Boomers (1946-1964), and the Silent Generation (1923-1945). There are relatively few noteworthy generational difference in vote intention with two principal exceptions. First, Millennials and members of Generation Z are significantly more likely to be undecided (32.6%) than members of the other generations, which could signify that they

6
are a potential source for candidates looking to increase their vote intention, but which could also signify that in the end these younger Houstonians may not actually make it out to vote. Second, Buzbee's support among Millennials and Generation Z is notably weaker than among the other three generations. However, this could possibly be due to this groups limited knowledge of Buzbee, with 51.2% of Millennials and Generation Z indicating they did not know enough about Buzbee to have an opinion, compared to 22.1% who did not know enough about Turner. TABLE 5. MAYOR'S RACE: SUPPORT BY GENERATION (%)
The Mayoral Vote & Household Income Table 6 on page 7 explores the support for the mayoral candidates based on respondent income. The likely voters are split in Table 6 into three categories: those with a pre-tax household income greater than $50,000, those with a pre-tax household income less than $50,000, and those who did not respond to this question. According to the most recent U.S. Census estimate (from 2017) the median household income in the City of Houston was $49,399 in 2017 dollars ($51,745 in 2019 dollars). Across the board there exist only modest income differences in vote intention. Turner enjoys a moderately higher level of support among lower income voters than among higher income voters (50.9% vs. 44.2%) with the opposite true for Buzbee (18.1% vs. 23.5%) and King (4.3% vs. 8.5%).
Candidate Generation Z & Millennials Generation X Boomers Silent Generation(1997- ) & (1981-1996) (1965-1980) (1946-1964) (1928-1945)
Sylvester Turner 39.5 40.5 44.0 48.7Tony Buzbee 10.5 30.2 23.4 26.1Bill King 7 6.9 9.8 6.1Dwight Boykins 5.8 6.0 8.7 5.2Sue Lovell 4.7 0 0.6 0.9Someone Else 0 0 0.5 0Don't Know/Undecided 32.6 16.4 13 13
Total Cases 86 116 184 115Distribution 17.2 23.2 36.7 23

7
TABLE 6. MAYOR'S RACE: SUPPORT BY HOUSEHOLD INCOME (%)
Candidate Income More than $50k Income Less than $50k No Response
Sylvester Turner 44.2 50.9 27.3
Tony Buzbee 23.5 18.1 31.9
Bill King 8.5 4.3 10.6
Dwight Boykins 7.2 6.0 6.1
Sue Lovell 1.3 1.7 0.0
Someone Else 0.0 0.9 0.0
Don't Know/Undecided 15.4 18.1 24.2
Total Cases 319 116 66
Distribution 63.7 23.2 13.2 The Mayoral Vote & Partisanship
Table 7 displays the mayoral vote intention based on the partisanship of the voter. The population was divided into three categories: Democrats (very strong to leaners), Republicans (very strong to leaners) and Independents combined with those who identify with other parties or did not respond to the question. In the survey population, 55.1% of the respondents are Democrats, 33.3% Republicans, and 11.6% Independents/Others. Turner has the support of 63.0% of Democrats, followed by Boykins with 9.8%, Buzbee with 6.2%, King with 3.6%, and Lovell with 1.8%. In contrast, more than half of Republicans (56.3%) intend to vote for Buzbee, followed by 15.6% for King, 12.0% for Turner, 3.0% for Boykins, and 0.6% for Lovell. Finally, while only 15.2% and 12.6% of Democrats and Republicans are undecided about their vote choice, a whopping 39.7% of Independents/Others are undecided. Two out of five of the members of this latter group intend to vote for Turner, with 10.3% Buzbee supporters and no other candidate in the double digits.
TABLE 7. MAYOR'S RACE: SUPPORT BY PARTISANSHIP (%)
Candidate Democrat Republican Independent/Other/ Don't Know
Sylvester Turner 63.0 12.0 41.4 Tony Buzbee 6.2 56.3 10.3 Bill King 3.6 15.6 5.2 Dwight Boykins 9.8 3.0 3.5 Sue Lovell 1.8 0.6 0.0 Someone Else 0.4 0.0 0.0 Don't Know/Undecided 15.2 12.6 39.7 Total Cases 276 167 58 Distribution 55.1 33.3 11.6

8
The Mayoral Election: Some Caveats on Turnout and Projections Projecting who will turn out in relatively low participation elections such as the 2019 Houston mayoral election, where past elections suggest somewhere between 20% and 30% of registered voters will participate, can be difficult. For example, for the purposes of this analysis, our survey data project Anglos to account for 50.3% of voters, African Americans for 33.9%, and Latinos for 12.2%. Based on the data presented above, if Anglos account for a larger share of the actual voters than 50.3%, then we would expect the share of the vote won by Buzbee and King to rise and that by Turner and Boykins to fall. Conversely, if African Americans account for a larger share of the actual voters than 33.9%, then we would expect the share of the vote won by Turner and Boykins to rise and that won by Buzbee and King to fall. In a similar vein, in our survey population the partisan split of the electorate is 55.1% Democrat and 33.3% Republican. If the actual partisan split among the 2019 voters contains a higher proportion of Democrats and a lower proportion of Republicans, we would expect to see both Turner (especially) and Boykins win a larger share of the vote and Buzbee and King to win a smaller share. Conversely, if the actual partisan split contains a higher proportion of Republicans and a lower proportion of Democrats, we would expect to see both Buzbee (especially) and King win a larger share of the vote and Turner and Boykins win a smaller share. 2. Four Runoff Scenarios If a runoff is held, it will take place in December, two months after the survey was conducted and following an additional month of first round campaigning followed by a month of runoff election campaigning. As a result, this runoff vote intention should by no means be considered to be set in stone, especially since a significant number of likely voters still do not know a great deal about several of the candidates. If there is a runoff, one thing is certain: Turner will be one of the two runoff candidates. Table 8 on page 9 provides the runoff vote intention for Turner versus his four most likely runoff rivals: Buzbee, King, Boykins, and Lovell. Information is provided for both All Likely Voters as well as those considered to be the Most Likely to vote in November. As the vote intention varies little across the two populations, here we focus on the All Likely Voter group. The data indicate that were the runoff to have been held during the first part of October, Turner would have won an absolute majority of the vote against all four of his potential rivals, with a vote intention ranging from a high of 59.7% against Lovell to a low of 54.1% against Boykins. The vote intention of Turner’s four rivals ranges from a high of 35.7% (Buzbee) to a low of 21.2% (Lovell). Across the four runoff scenarios only around one in ten voters is undecided, while a small proportion indicate they would vote for neither candidate in the runoff, ranging from 1.8% in the event of a Turner-Buzbee runoff to a high of 7.2% in the event of a Turner-Lovell runoff.

9
TABLE 8: FOUR MAYORAL RUNOFF SCENARIOS (%)
Runoff Pairings Runoff Vote: All Likely Runoff Vote: Most Likely
Buzbee vs. Turner Turner 54.5 54.1 Buzbee 35.7 36.1 Neither 1.8 2.2 Undecided 8.0 7.7 King vs. Turner Turner 54.7 54.6 King 32.1 33.2 Neither 3.6 3.6 Undecided 9.6 8.7 Boykins vs. Turner Turner 54.1 53.4 Boykins 28.1 29.3 Neither 6.2 6.5 Undecided 11.6 10.8 Lovell vs. Turner Turner 59.7 60.6 Lovell 21.2 20.9 Neither 7.2 7.2 Undecided 12.0 11.3
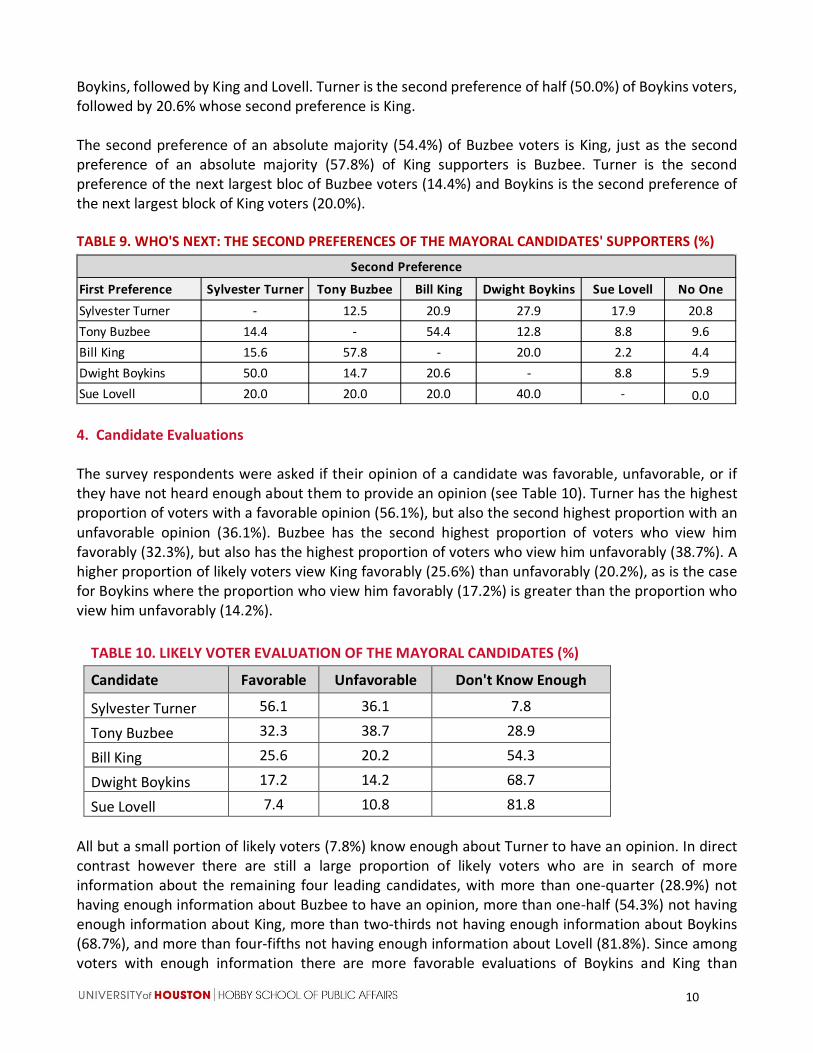
3. Mayoral Candidate Second Preferences The survey asked respondents to rank-order their preferences among the five leading mayoral candidates from most to least preferred. A total of 454 respondents provided at least one ranking. Table 9 on page 10 displays the distribution of the second preferences of the supporters of the five leading mayoral candidates. The top second preference for Turner supporters is Boykins (27.9%), followed by King (20.9%), No One (20.8%), and Lovell (17.9%). That is, more than a quarter of Turner supporters identified Boykins as their next preferred candidate, a fifth identified King, and a fifth indicated that they did not have a second preference after Turner. These numbers suggest that if Turner begins to experience a decline in support during the final weeks of the campaign, the most likely beneficiary of this decline will be
10
Boykins, followed by King and Lovell. Turner is the second preference of half (50.0%) of Boykins voters, followed by 20.6% whose second preference is King. The second preference of an absolute majority (54.4%) of Buzbee voters is King, just as the second preference of an absolute majority (57.8%) of King supporters is Buzbee. Turner is the second preference of the next largest bloc of Buzbee voters (14.4%) and Boykins is the second preference of the next largest block of King voters (20.0%). TABLE 9. WHO'S NEXT: THE SECOND PREFERENCES OF THE MAYORAL CANDIDATES' SUPPORTERS (%)
4. Candidate Evaluations The survey respondents were asked if their opinion of a candidate was favorable, unfavorable, or if they have not heard enough about them to provide an opinion (see Table 10). Turner has the highest proportion of voters with a favorable opinion (56.1%), but also the second highest proportion with an unfavorable opinion (36.1%). Buzbee has the second highest proportion of voters who view him favorably (32.3%), but also has the highest proportion of voters who view him unfavorably (38.7%). A higher proportion of likely voters view King favorably (25.6%) than unfavorably (20.2%), as is the case for Boykins where the proportion who view him favorably (17.2%) is greater than the proportion who view him unfavorably (14.2%).
TABLE 10. LIKELY VOTER EVALUATION OF THE MAYORAL CANDIDATES (%)
Candidate Favorable Unfavorable Don't Know Enough
Sylvester Turner 56.1 36.1 7.8
Tony Buzbee 32.3 38.7 28.9
Bill King 25.6 20.2 54.3
Dwight Boykins 17.2 14.2 68.7
Sue Lovell 7.4 10.8 81.8 All but a small portion of likely voters (7.8%) know enough about Turner to have an opinion. In direct contrast however there are still a large proportion of likely voters who are in search of more information about the remaining four leading candidates, with more than one-quarter (28.9%) not having enough information about Buzbee to have an opinion, more than one-half (54.3%) not having enough information about King, more than two-thirds not having enough information about Boykins (68.7%), and more than four-fifths not having enough information about Lovell (81.8%). Since among voters with enough information there are more favorable evaluations of Boykins and King than
First Preference Sylvester Turner Tony Buzbee Bill King Dwight Boykins Sue Lovell No OneSylvester Turner - 12.5 20.9 27.9 17.9 20.8Tony Buzbee 14.4 - 54.4 12.8 8.8 9.6Bill King 15.6 57.8 - 20.0 2.2 4.4Dwight Boykins 50.0 14.7 20.6 - 8.8 5.9Sue Lovell 20.0 20.0 20.0 40.0 - 0.0
Second Preference

11
unfavorable ratings, the data underscore the potential for growth in vote intention among both. This is especially the case for Boykins who is not well known by two out of every three likely voters citywide, but among likely voters in the city council district he has represented since 2014 (District D), where Boykins is best known, he is viewed favorably by more than twice as many likely voters as view him unfavorably. 5. Officeholder Evaluations The respondents also were asked for their evaluation of four current officeholders: President Donald Trump, Texas Governor Greg Abbott, Harris County Judge Lina Hidalgo, and City of Houston Controller Chris Brown (see Table 11). President Trump and Governor Abbott are well known to voters, with only 5.0% and 13.6% respectively not knowing enough about them to be able to offer an opinion. In contrast, more than half of likely voters (51.9%) do not know enough about Judge Hidalgo to offer an opinion, and more than two-thirds (71.5%) do not know enough about Controller Brown to offer an opinion. TABLE 11. LIKELY VOTER EVALUATION OF FEDERAL, STATE AND LOCAL ELECTED OFFICIALS (%)
Official Favorable Unfavorable Don't Know Enough
Donald Trump 31.9 63.1 5.0 Greg Abbott 47.3 39.1 13.6 Lina Hidalgo 27.9 20.2 51.9 Chris Brown 23.4 5.2 71.5
More than three-fifths of likely voters (63.1%) have an unfavorable opinion of President Trump, almost double the proportion (31.9%) who have a favorable opinion of the president. The numbers are reversed for Governor Abbott, who is viewed favorably (47.3%) by more voters than unfavorably (39.1%). In a similar vein, a larger proportion of voters view Judge Hidalgo favorably (27.9%) than unfavorably (20.2%). Finally, more than four times as many likely voters view Controller Brown favorably (23.4%) than unfavorably (5.2%). 6. Donald Trump and the Mayoral Vote Table 12 on page 11 examines the distribution of supporters of the mayoral candidates (see column 2 in Table 1) based on their evaluation of President Trump. Among likely voters who intend to vote for Turner, 84.9% have an unfavorable opinion of Trump versus 7.3% who have a favorable opinion. Boykins voters have a similar distribution, with 85.3% viewing Trump unfavorably versus 8.8% who view him favorably. Among likely voters who intend to vote for Buzbee, 79.5% have a favorable opinion of Trump versus 19.7% who have an unfavorable opinion. The most mixed group in terms of their evaluation of Trump are King voters, 66.7% of whom have a favorable opinion of Trump versus 33.3% who have an unfavorable opinion.

12
TABLE 12. OPINION OF PRESIDENT TRUMP AMONG LEADING MAYORAL CANDIDATE SUPPORTERS (%)
Voter Opinion of Trump
Candidate Favorable Unfavorable Don't Know Enough
Sylvester Turner 7.3 84.9 7.8
Tony Buzbee 79.5 19.7 0.9
Bill King 66.7 33.3 0.0
Dwight Boykins 8.8 85.3 5.9
Sue Lovell 16.7 83.3 0.0
Someone Else 0.0 100.0 0.0
Don't Know/Undecided 24.4 69.8 5.8
Overall 31.9 63.1 5.0
7. Most Important Problem Facing Houston The likely voters were asked what they considered to be the most important problem facing Houston today. Table 13 and Figure 2 (page 13) provides the responses, and underscores how two issues are dominating the concerns of likely voters: flooding and crime. Unsurprisingly in the immediate aftermath of Tropical Storm Imelda, 41.3% of likely voters identify flooding as the most important problem facing Houston today. Another 22.0% list crime as the City's most important problem.
TABLE 13. THE MOST IMPORTANT PROBLEM FACING HOUSTON TODAY (%)
Problem Percentage
Flooding 41.3 Crime 22.0 Rising Property Taxes 9.0 Traffic Congestion 8.4 Road Quality 8.0 Inequality 4.0 None of These/Don't Know 2.8 Air Quality 2.6 Trash Collection & Recycling 2.0
A trio of issues occupies a second tier among voters: rising property taxes (9.0%), traffic congestion (8.4%), and road quality (8.0%). A third tier of issues is viewed as the most important problem facing Houston by a miniscule proportion of likely voters: inequality (4.0%), air quality (2.6%), and trash collection and recycling (2.0%).

13
FIGURE 2. THE MOST IMPORTANT PROBLEM FACING HOUSTON TODAY (%)
Voters who intend to cast a ballot for Buzbee are equally divided between those who name crime (34.2%) as the most important problem facing the City and those who list flooding (31.6%) as the most important problem. King and Boykins supporters are more likely than the average voter to consider crime (33.3% and 26.5% respectively) the most important problem facing Houston, but in both cases the proportion that considers flooding (41.0% and 38.2%) the most important problem is substantially larger. In contrast, a relatively small share of Turner voters view crime (16.5%) as Houston’s most important problem, while the proportion who see flooding (45.9%) as the most problematic issue confronting the City is substantially higher. 8. The City of Houston’s Current Trajectory The voters were asked if they thought things in the City of Houston are heading in the right direction, or if they are headed on the wrong track (see Table 14 and Figure 3 on page 14). A majority of likely voters believe that things are heading in the right direction (57.3%), although more than a third (34.9%) believe things are headed on the wrong track.
TABLE 14. HOW ARE THINGS HEADING IN HOUSTON TODAY? (%)
Direction Voters
In the Right Direction 57.3 On the Wrong Track 34.9 Don't Know 7.8

14
FIGURE 3. HOW ARE THINGS HEADING IN HOUSTON TODAY? (%)
A substantial majority of Buzbee (76.9%) and King (69.2%) voters believe things in the City of Houston are headed on the wrong track. Conversely, approximately a fifth of Buzbee (18.0%) and King (20.5%) voters think things in Houston are heading in the right direction. Nine out of ten Turner voters (88.5%) think Houston is headed in the right direction, with a mere 6.9% of the belief that the City is headed down the wrong track. Boykins is the candidate with the greatest balance between likely voters who believe things in Houston are heading in the right direction (35.3%) and likely voters who believe things are heading down the wrong track (52.9%). 9. Mayoral Candidate Support Among Undecided Voters Undecided Voters with Preferences There are 86 undecided voters in the survey, among whom 44 (8.8% of the likely voters) responded to a set of questions that asked them to rank-order the five mayoral candidates from most preferred to least preferred. Table 15 on page 15 provides a window on where these 44 undecided voters are leaning, either split between two candidates (e.g., Boykins vs. Turner) or leaning toward only a single candidate (e.g., Turner or No One). The largest share (20.5%) of these undecided voters with preferences are conflicted over whether to vote for Boykins or Turner, followed by those conflicted between Buzbee and Turner (15.9%), Buzbee and King (13.6%), King and Turner (11.4%), Lovell and Turner (9.1%), and Boykins and Lovell (4.6%). In addition, 18.1% are leaning toward Turner alone, and 2.3% toward Buzbee alone. Overall, among these undecided voters, 75.0% have Turner as one of their top two or only preference. Buzbee is among the top two or only preference of 31.8% of these undecided voters, followed by Boykins (27.4%), King (27.3%), and Lovell (16.0%).

15
TABLE 15. UNDECIDED VOTERS WITH PREFERENCES: TOP TWO PREFERRED OPTIONS
Candidates Share of Undecided (with preference)
Boykins vs. Turner 20.5 Turner or No One 18.1 Buzbee vs. Turner 15.9 Buzbee vs. King 13.6 King vs. Turner 11.4 Lovell vs. Turner 9.1 Boykins vs. Lovell 4.6 Buzbee or No One 2.3 Boykins vs. King 2.3 King vs. Lovell 2.3
Note: 44 of 86 undecided voters have one or more preferred candidates. Undecided Voters Without Preferences While 44 of the undecided voters expressed a preference for one or more mayoral candidates, 42 did not (8.4% of likely voters). We can however glean some information about these voters from their evaluation of the mayoral candidates, which is provided in Table 16. One common theme related to these undecided voters and all candidates other than Turner is that an overwhelming majority of these undecided voters do not know enough about the candidates to have either a favorable or unfavorable opinion. When it comes to the challengers, between 69.1% (Buzbee) and 88.1% (Boykins) of these truly undecided voters do not yet know enough about them, in sharp contrast to Turner who remains an unknown quantity in the eyes of only 35.7%.
TABLE 16. UNDECIDED VOTERS WITHOUT PREFERENCES: CANDIDATE EVALUATION (%)
Candidate Favorable Unfavorable Don't Know Enough
Sylvester Turner 38.1 26.2 35.7 Tony Buzbee 14.3 16.7 69.1 Bill King 14.3 9.5 76.2 Dwight Boykins 11.9 0.0 88.1 Sue Lovell 9.5 7.1 83.3
Note: 42 of 86 undecided voters are in this category. 10. Methodology The representative survey was conducted between October 1 and October 9 in English or Spanish. Live operators called a mixture of landline and cellular phone numbers of registered voters in the City of Houston who had: 1) voted in the 2015 mayoral election, 2) not voted in the 2015 mayoral election but voted in the 2016 presidential and 2018 gubernatorial/midterm elections, 3) registered after the 2016

16
presidential election cycle but voted in the 2018 gubernatorial/midterm election, or 4) registered to vote after the 2018 gubernatorial/midterm election cycle. A screening question was then used to gauge the likelihood the individual would vote in the upcoming 2019 mayoral election, with the survey administered only to those who indicated they definitely would vote or probably would vote. In all, 501 likely Houston voters were interviewed who are representative of the electorate which is expected to vote in the November 5, 2019 City of Houston mayoral election. The survey was funded entirely by the University of Houston Hobby School of Public Affairs under the supervision of Renée Cross, Mark P. Jones, and Richard Murray with the assistance of Agustín Vallejo. The project was reviewed and approved by the University of Houston's Institutional Review Board (IRB), under the IRB project number of STUDY00001842.