Embed Size (px)
Citation preview

Bus Transit Operational Efficiency Resulting from Passenger Boardings at Park-and-Ride Facilities
MTI Report 12-60
Funded by U.S. Department of Transportation and California Department of Transportation
MT
I2012 C
ensus of California W
ater Transit ServicesM
TI Report 12-02
Decem
ber 2012

The Mineta Transportation Institute (MTI) was established by Congress in 1991 as part of the Intermodal Surface Transportation Equity Act (ISTEA) and was reauthorized under the Transportation Equity Act for the 21st century (TEA-21). MTI then successfully competed to be named a Tier 1 Center in 2002 and 2006 in the Safe, Accountable, Flexible, Efficient Transportation Equity Act: A Legacy for Users (SAFETEA-LU). Most recently, MTI successfully competed in the Surface Transportation Extension Act of 2011 to be named a Tier 1 Transit-Focused University Transportation Center. The Institute is funded by Congress through the United States Department of Transportation’s Office of the Assistant Secretary for Research and Technology (OST-R), University Transportation Centers Program, the California Department of Transportation (Caltrans), and by private grants and donations.
The Institute receives oversight from an internationally respected Board of Trustees whose members represent all major surface transportation modes. MTI’s focus on policy and management resulted from a Board assessment of the industry’s unmet needs and led directly to the choice of the San José State University College of Business as the Institute’s home. The Board provides policy direction, assists with needs assessment, and connects the Institute and its programs with the international transportation community.
MTI’s transportation policy work is centered on three primary responsibilities:
MINETA TRANSPORTATION INSTITUTELEAD UNIVERSITY OF MNTRC
Research MTI works to provide policy-oriented research for all levels of government and the private sector to foster the development of optimum surface transportation systems. Research areas in-clude: transportation security; planning and policy development; interrelationships among transportation, land use, and the environment; transportation finance; and collaborative labor-management relations. Certified Research Associates conduct the research. Certification requires an advanced degree, gener-ally a PhD, a record of academic publications, and profession-al references. Research projects culminate in a peer-reviewed publication, available both in hardcopy and on TransWeb, the MTI website (http://transweb.sjsu.edu).
Education The educational goal of the Institute is to provide graduate-lev-el education to students seeking a career in the development and operation of surface transportation programs. MTI, through San José State University, offers an AACSB-accredited Master of Science in Transportation Management and a graduate Certifi-cate in Transportation Management that serve to prepare the na-tion’s transportation managers for the 21st century. The master’s degree is the highest conferred by the California State Univer-
sity system. With the active assistance of the California Department of Transportation, MTI delivers its classes over a state-of-the-art videoconference network throughout the state of California and via webcasting beyond, allowing working transportation professionals to pursue an advanced degree regardless of their location. To meet the needs of employers seeking a diverse workforce, MTI’s education program promotes enrollment to under-represented groups.
Information and Technology Transfer MTI promotes the availability of completed research to professional organizations and journals and works to integrate the research findings into the graduate education program. In addition to publishing the studies, the Institute also sponsors symposia to disseminate research results to transportation professionals and encourages Research Associates to present their findings at conferences. The World in Motion, MTI’s quarterly newsletter, covers innovation in the Institute’s research and education pro-grams. MTI’s extensive collection of transportation-related publications is integrated into San José State University’s world-class Martin Luther King, Jr. Library.
The contents of this report reflect the views of the authors, who are responsible for the facts and accuracy of the information presented herein. This document is disseminated under the sponsorship of the U.S. Department of Transportation, University Transportation Centers Program and the California Department of Transportation, in the interest of information exchange. This report does not necessarily reflect the official views or policies of the U.S. government, State of California, or the Mineta Transportation Institute, who assume no liability for the contents or use thereof. This report does not constitute a standard specification, design standard, or regulation.
DISCLAIMER
MTI FOUNDER Hon. Norman Y. Mineta
MTI/MNTRC BOARD OF TRUSTEES
Karen Philbrick, Ph.D.Executive Director
Peter Haas, Ph.D.Education Director
Directors
MNTRCMINETA NATIONAL TRANSITRESEARCH CONSORTIUM
Hilary Nixon, Ph.D.Research and Technology Transfer Director
Brian Michael JenkinsNational Transportation Safety and Security Center
Ben TripousisNational High-Speed Rail Connectivity Center
Asha Weinstein Agrawal, Ph.D.National Transportation Finance Center
Founder, Honorable Norman Mineta (Ex-Officio)Secretary (ret.), US Department of TransportationVice ChairHill & Knowlton, Inc.
Honorary Chair, Honorable Bill Shuster (Ex-Officio)ChairHouse Transportation and Infrastructure CommitteeUnited States House of Representatives
Honorary Co-Chair, Honorable Peter DeFazio (Ex-Officio)Vice ChairHouse Transportation and Infrastructure CommitteeUnited States House of Representatives
Chair, Nuria Fernandez (TE 2017)General Manager and CEOValley Transportation Authority
Vice Chair, Grace Crunican (TE 2019)General ManagerBay Area Rapid Transit District
Executive Director, Karen Philbrick, Ph.D.Mineta Transportation InstituteSan José State University
Joseph Boardman (Ex-Officio)Chief Executive OfficerAmtrak
Anne Canby (TE 2017)DirectorOneRail Coalition
Donna DeMartino (TE 2018)General Manager and CEOSan Joaquin Regional Transit District
William Dorey (TE 2017)Board of DirectorsGranite Construction, Inc.
Malcolm Dougherty (Ex-Officio)DirectorCalifornia Department of Transportation
Mortimer Downey* (TE 2018)PresidentMort Downey Consulting, LLC
Rose Guilbault (TE 2017)Board MemberPeninsula Corridor Joint Powers Board (Caltrain)
Ed Hamberger (Ex-Officio)President/CEOAssociation of American Railroads
Steve Heminger* (TE 2018)Executive DirectorMetropolitan Transportation Commission
Diane Woodend Jones (TE 2019)Principal and Chair of BoardLea+Elliot, Inc.
Will Kempton (TE 2019)Executive DirectorTransportation California
Art Leahy (TE 2018)CEOMetrolink
Jean-Pierre Loubinoux (Ex-Officio)Director GeneralInternational Union of Railways (UIC)
Abbas Mohaddes (TE 2018)CEOThe Mohaddes Group
Jeff Morales (TE 2019)CEOCalifornia High-Speed Rail Authority
Beverley Swaim-Staley (TE 2019)PresidentUnion Station Redevelopment Corporation
Michael Townes* (TE 2017)PresidentMichael S. Townes, LLC
Marlene Turner, Ph.D. (Ex-Officio)Interim Dean, College of BusinessSan José State University
Richard A. White (Ex-Officio)Interim President and CEOAmerican Public TransportationAssociation (APTA)
Bud Wright (Ex-Officio)Executive DirectorAmerican Association of State Highway and Transportation Officials (AASHTO)
Edward Wytkind (Ex-Officio)PresidentTransportation Trades Dept., AFL-CIO
(TE) = Term Expiration or Ex-Officio* = Past Chair, Board of Trustee
A publication of
Mineta Transportation InstituteCreated by Congress in 1991
College of BusinessSan José State UniversitySan José, CA 95192-0219
REPORT 12-60
BUS TRANSIT OPERATIONAL EFFICIENCY RESULTING FROM PASSENGER BOARDINGS AT PARK-AND-RIDE FACILITIES
John S. Niles, MSJ.M. Pogodzinski, PhD
August 2016

TECHNICAL REPORT DOCUMENTATION PAGE
1. Report No. 2. Government Accession No. 3. Recipient’s Catalog No.
4. Title and Subtitle 5. Report Date
6. Performing Organization Code
7. Authors 8. Performing Organization Report
9. Performing Organization Name and Address 10. Work Unit No.
11. Contract or Grant No.
12. Sponsoring Agency Name and Address 13. Type of Report and Period Covered
14. Sponsoring Agency Code
15. Supplemental Notes
16. Abstract
17. Key Words 18. Distribution Statement
19. Security Classif. (of this report) 20. Security Classif. (of this page) 21. No. of Pages 22. Price
Form DOT F 1700.7 (8-72)
86
CA-MTI-16-1401
Bus Transit Operational Efficiency Resulting from Passenger Boardings atPark-and-Ride Facilities
August 2016
MTI Report 12-60John S. Niles, MS and J.M. Pogodzinski, PhD
Mineta Transportation InstituteCollege of BusinessSan José State UniversitySan José, CA 95192-0219
California Department of TransportationDivision of Research, Innovation and Systems InformationMS-42, PO Box 942873Sacramento, CA 94273-0001
U.S. Department of TransportationOffice of the Assistant Secretary for Research and TechnologyUniversity Transportation Centers Program1200 New Jersey Avenue, SEWashington, DC 20590
Final Report
UnclassifiedUnclassified
No restrictions. This document is available to the public throughThe National Technical Information Service, Springfield, VA 22161
DTRT12-G-UTC21
$15.00
Public transportation; bus publictransit; park-and-ride; multimodalfacilities; geographic informationsystems
In order to save time and money by not driving to an ultimate destination, some urban commuters drive themselves a few miles tospecially designated parking lots built for transit customers and located where trains or buses stop. The focus of this paper is theeffect Park-and-Ride (P&R) lots have on the efficiency of bus transit as measured in five bus transit systems in the western U.S.This study describes a series of probes with models and data to find objective P&R influence measures that, when combinedwith other readily-available data, permit a quantitative assessment of the significance of P&R on transit efficiency. The authorsdeveloped and describe techniques that examine P&R as an influence on transit boardings at bus stops and on bus boardingsalong an entire route.The regression results reported are based on the two in-depth case studies for which sufficient data were obtained to examine(using econometric techniques) the effects of park-and-ride availability on bus transit productivity. Both Ordinary Least Square(OLS) regression and Poisson regression are employed.The results from the case studies suggest that availability of parking near bus stops is a stronger influence on transit ridershipthan residential housing near bus stops. Results also suggest that expanding parking facilities near suburban park-and-ride lotsincreases the productivity of bus operations as measured by ridership per service hour. The authors also illustrate that reasonabledaily parking charges (compared to the cost of driving to much more expensive parking downtown) would provide sufficientcapital to build and operate new P&R capacity without subsidy from other revenue sources.

To order this publication, please contact:
Mineta Transportation Institute College of Business
San José State University San José, CA 95192-0219
Tel: (408) 924-7560 Fax: (408) 924-7565
Email: [email protected]
transweb.sjsu.edu
by Mineta Transportation Institute All rights reserved
Library of Congress Catalog Card Number:
Copyright © 2016
2016951102
082916
Mineta Transportat ion Inst i tute
iv
ACKNOWLEDGMENTS
The authors are most appreciative for funding from the Mineta Transportation Institute at San Jose State University and the California Department of Transportation in support of this work. The authors also thank King County Metro Transit and Santa Clara Valley Transportation Authority for access to numerical and geographic map layer data that made this study possible. Los Angeles County Metro, Community Transit of Snohomish County Washington, and Pierce Transit based in Lakewood, Washington also provided data. King County Metro staffs were generous in reviewing and assisting in the development of analytical concepts. The editors at Mineta Transportation Institute are responsible for many improvements in the wording and formatting. We also received research assistance from Gloria Yan, Yanan Li, and Cameron Simons. Three anonymous reviewers’ comments considerably strengthened the report.
The authors also thank MTI staff, including Executive Director Karen Philbrick, PhD; Publication Support Coordinator Joseph Mercado; Executive Administrative Assistant Jill Carter; and Editor and Webmaster Frances Cherman.

Mineta Transportat ion Inst i tute
v
TABLE OF CONTENTS
Executive Summary 1
Organization of the Paper 3
I. Case Studies 4County and Urbanized Area Comparisons 6Transit System Comparisons 8
II. Broad Policy Context of Park-and-Ride 9
III. Costs and Benefits of Park-and-Ride 14
IV. Data Used to Estimate Park-and-Ride Impact on Transit Efficiency 16Sources of Data and Data Quality 16Variables 17Dependent Variables 17Independent Variables 17
V. Econometric Strategy to Estimate Park-and-Ride Impact on Transit Efficiency 19
Route-Level and Stop-Level Analyses 19Regression Methods: OLS and Poisson 25Stop-Level Analysis 25
VI. Route-Level Analysis 29
VII. Regression Results 30
VIII. Stop-Level Results 31
IX. Interpretation of Stop-Level Results 37
X. Route-Level Results 39Route-level Analysis and Influence Variables 39King County Metro 39Focused Case Study: King County Metro Transit 41Economic Consequence of Higher Productivity from Transit Access at P&R Lots 44Santa Clara Valley Transportation Authority, San Jose, California 45Los Angeles County Metro 47Community Transit, Snohomish County Results 52Pierce Transit Results 54

Mineta Transportat ion Inst i tute
viTable of Contents
XI. Summary with Conclusions and Implications 56
XII. Suggestions for Further Research 58
Appendix A. The Case Studies 59King County Metro Transit (KCM) 59Santa Clara Valley Transportation Authority (VTA) 60Los Angeles County Metropolitan Transportation Authority 60Community Transit (Snohomish County, Washington) 61Pierce Transit (Tacoma, Washington and Vicinity) 63
Appendix B. A Heuristic Example of Route-Level and Stop-Level Analysis 64
Appendix C. Descriptive Statistics of the Samples 72
Appendix D. Density vs. Park-and-Ride 74
Abbreviations and Acronyms 77
Bibliography 78
Endnotes 80
About the Authors 85
Peer Review 86

Mineta Transportat ion Inst i tute
vii
LIST OF FIGURES
1. Population Growth 2000-2010 in King County 10
2. Population Growth 2000-2010 in Santa Clara County 11
3. High and Low Boardings-per-Revenue-Hour Routes for King County Metro 19
4. High Morning Boardings Stops for King County Metro 20
5. High and Low Boardings-per-Revenue-Hour Routes for Valley Transportation Authority 21
6. High Morning Boardings Stops for Valley Transportation Authority 22
7. Stops with Boardings per Trip Greater Than or Equal to 10 and Park-and-Ride Lots for VTA 23
8. Stop-Level Regression Specifications 24
9. The Marginal Effect of Park-and-Ride Capacity for KCM 40
10. Seattle and East King County Bus Stops with More Than 250 A.M Peak Boardings 41
11. Bus Route Productivity in East King County, Washington 43
12. Impact of Total Park-and-Ride Spaces along a Route 48
13. Impact of Total Park-and-Ride Spaces along a Route 50
14. Impact of Total Park-and-Ride Spaces along a Route Based on Poisson Regression 51
15. King County Metro Selected Bus Routes and Park-and-Ride Lots 59
16. Santa Clara VTA Selected Bus Routes and Park-and-Ride Lots 60
17. Los Angeles Metro Selected Bus Routes and Park-and-Ride Lots 61
18. Map of the Community Transit System 62
19. Map of the Pierce Transit System 63
20. Heuristic Public Transit System 64

Mineta Transportat ion Inst i tute
viii
LIST OF TABLES
1. Statistical Overview of Case Study Agencies 5
2. Comparison of Santa Clara County and King County 6
3. Commuting Comparisons for San Jose and Seattle Urbanized Areas 7
4. KCM and VTA Transit System 8
5. Ordinary Least Squares Stop-Level Regression Results for KCM and VTA 32
6. Poisson Regressions for KCM and VTA with Various Park-and-Ride Variables 35
7. Calculating Incremental Impacts of Various Variables 37
8. Route-Level Regression for KCM 40
9. Park-and-Ride Influence Variable for 53 KCM Routes 42
10. VTA Route-Level Regression 46
11. OLS Regression with Boardings per Revenue Hour as Dependent Variable and Total Park-and-Ride Spaces along Route as Park-and-Ride Influence Variable 47
12. OLS Regression with Boardings per Revenue Hour as Dependent Variable and the Number of Park-and-Ride Lots along Route as Park-and-Ride Influence Variable 48
13. OLS Regression with Average Daily Riders as Dependent Variable and Total Park-and-Ride Spaces along Route as Park-and-Ride Influence Variable 49
14. OLS Regression with Average Daily Riders as Dependent Variable and Number of Park-and-Ride Lots along Route as Park-and-Ride Influence Variable 50
15. Poisson Regression with Average Daily Riders as Dependent Variable and Total Park-and-Ride Spaces along Route as Park-and-Ride Influence Variable 51
16. Regression Summary, Community Transit, AM Peak Route Sample 53
17. Regression Summary, Pierce Transit, AM Peak Route Sample 55

Mineta Transportat ion Inst i tute
ixList of Tables
18. Inbound and Outbound Sequence Numbers Implied by the Heuristic Public Transit System 65
19. Hypothetical Boardings Data for the Heuristic Public Transit System 66
20. Boardings per Revenue Hour and Related Data for the Heuristic Public Transit System 67
21. Route-Level Regression Result for the Heuristic Public Transit System 68
22. Stop-Level Regression Result for the Heuristic Public Transit System 70
23. King County Poisson Regression Using QMDummy 74
24. VTA Poisson Regression Using QMDummy 75
25. KCM Poisson Regression Using Distance-Decay Function 75
26. VTA Poisson Regression Using Distance-Decay Function 76
Mineta Transportat ion Inst i tute
1
EXECUTIVE SUMMARY
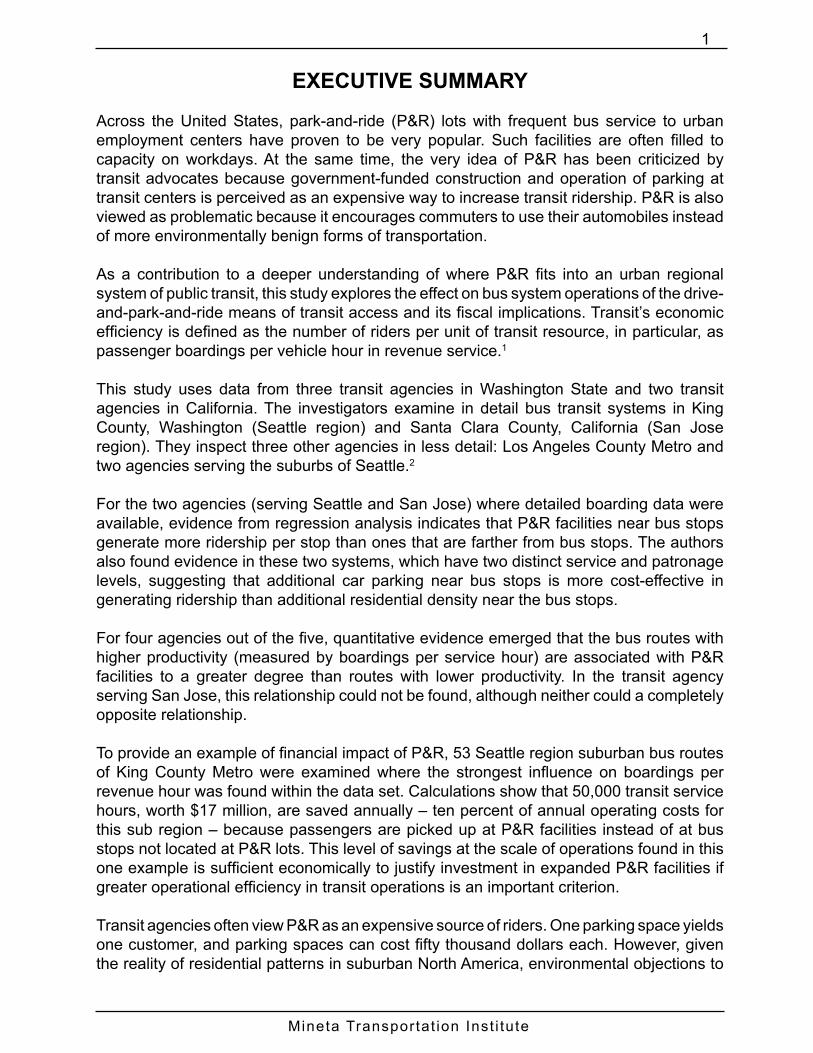
Across the United States, park-and-ride (P&R) lots with frequent bus service to urban employment centers have proven to be very popular. Such facilities are often filled to capacity on workdays. At the same time, the very idea of P&R has been criticized by transit advocates because government-funded construction and operation of parking at transit centers is perceived as an expensive way to increase transit ridership. P&R is also viewed as problematic because it encourages commuters to use their automobiles instead of more environmentally benign forms of transportation.
As a contribution to a deeper understanding of where P&R fits into an urban regional system of public transit, this study explores the effect on bus system operations of the drive-and-park-and-ride means of transit access and its fiscal implications. Transit’s economic efficiency is defined as the number of riders per unit of transit resource, in particular, as passenger boardings per vehicle hour in revenue service.1
This study uses data from three transit agencies in Washington State and two transit agencies in California. The investigators examine in detail bus transit systems in King County, Washington (Seattle region) and Santa Clara County, California (San Jose region). They inspect three other agencies in less detail: Los Angeles County Metro and two agencies serving the suburbs of Seattle.2
For the two agencies (serving Seattle and San Jose) where detailed boarding data were available, evidence from regression analysis indicates that P&R facilities near bus stops generate more ridership per stop than ones that are farther from bus stops. The authors also found evidence in these two systems, which have two distinct service and patronage levels, suggesting that additional car parking near bus stops is more cost-effective in generating ridership than additional residential density near the bus stops.
For four agencies out of the five, quantitative evidence emerged that the bus routes with higher productivity (measured by boardings per service hour) are associated with P&R facilities to a greater degree than routes with lower productivity. In the transit agency serving San Jose, this relationship could not be found, although neither could a completely opposite relationship.
To provide an example of financial impact of P&R, 53 Seattle region suburban bus routes of King County Metro were examined where the strongest influence on boardings per revenue hour was found within the data set. Calculations show that 50,000 transit service hours, worth $17 million, are saved annually – ten percent of annual operating costs for this sub region – because passengers are picked up at P&R facilities instead of at bus stops not located at P&R lots. This level of savings at the scale of operations found in this one example is sufficient economically to justify investment in expanded P&R facilities if greater operational efficiency in transit operations is an important criterion.
Transit agencies often view P&R as an expensive source of riders. One parking space yields one customer, and parking spaces can cost fifty thousand dollars each. However, given the reality of residential patterns in suburban North America, environmental objections to

Mineta Transportat ion Inst i tute
2Executive Summary
adding P&R spaces could be mitigated by having a quantifiable financial benefit for the transit agency from increasing the productivity of bus service.
Finally, the authors describe financial calculations illustrating that reasonable fees for customers of P&R would likely be sufficient to pay for constructing and maintaining the facilities where parking is provided. Of course, to attract customers, the P&R fee combined with the transit fare would have to provide an alternative to competition from private vehicle modes that is partially defined by exogenous price levels for motor vehicle fuel and for parking in employment centers that are customer destinations.
Mineta Transportat ion Inst i tute
3
ORGANIZATION OF THE PAPER
The first section following this one, “Case Studies,” gives a snapshot of the five cases that we consider in this report. (Details of the five case studies appear in Appendix A.)
The next section of the paper, “Broad Policy Context of Park-and-Ride,” includes a discussion of productivity measures for bus transit services and the costs and benefits of P&R. That section also describes the broad policy implications of the present study.
The next section of the paper discusses Costs and Benefits of Park-and-Ride. This section discusses the trade-offs implicit in supporting transit using park-and-ride.
The next section of the paper, “Data Used to Estimate Park-and-Ride Impact on Transit Efficiency,” discusses the data employed in the analysis of transit systems and P&R and the econometric strategy for estimating parameters associated with P&R. Three types of analyses that correspond to three different sets of variables are employed: route-level analysis, stop-level analysis of boardings, and stop-level analysis of boardings per trip. The different types of analyses examine the same underlying phenomenon from different perspectives. (The connection between stop-level analysis and route-level analysis is developed in a heuristic example detailed in Appendix B.)
Route-level analysis employs boardings per revenue hour as the dependent variable; stop-level analysis employs both boardings at a stop and boardings per trip at a stop as the dependent variables (where the data permit the use of both variables). For stop-level analysis of boardings at a stop, both Ordinary Least Squares (OLS) regression results and Poisson regression are presented.3 The rationale for and interpretation of the OLS and the Poisson regressions is discussed in greater detail in this section.
The discussion in the next section shows that the results of route-level and stop-level analyses of the two main cases are generally consistent, and the analyses of stop-level results show great consistency between King County Metro and VTA, both for OLS and Poisson regressions across various specifications of the P&R variables.
The next section after this is devoted to the additional case studies. The policy implications of these results are given in the penultimate section. The final section is conclusions and summary.

Mineta Transportat ion Inst i tute
4
I. CASE STUDIES
We consider five case studies, each of which represents a different transit agency. A statistical overview of the case studies is given in Table 1. We develop detailed analyses of two of the cases for which we had the most complete data: King County Metro (Seattle) and Valley Transportation Authority (San Jose). The two cases we examine in detail are broadly similar to one another in service area population. Our other cases include small suburban systems near Seattle, and the Los Angeles Metropolitan Transportation Authority – a very large system.

Mineta T
ransportation Institute
5C
ase Studies
Table 1. Statistical Overview of Case Study Agencies
Agency
Service Area Population (millions)
Annual Boardings (millions)
Passenger Miles
(millions)
Vehicle Revenue Miles
(millions)
Vehicle Revenue
Hours (thousands)
Computed Average Speed (MPH) – vehicle revenue miles
divided by vehicle
revenue hours
Operating Cost/ Vehicle
Hour Operating
Cost/ Boarding
Santa Clara Valley Transportation Authority
1.88 32 166 15 1,210 12.4 $186 $6.93
Los Angeles County Metropolitan Transportation Authority DBA: Metro
8.63 336 1,387 68 6,232 10.9 $143 $2.66
King County Department of Transportation - Metro Transit Division
2.04 98 484 32 2,679 11.9 $161 $4.41
Pierce County Transportation Benefit Area Authority
0.56 10 42 4 374 10.7 $132 $4.75
Community Transit (Snohomish County)
0.69 8 79 6 357 16.8 $239 $10.66
Central Puget Sound Regional Transit Authority
2.81 17 248 12 547 21.9 $194 $6.39

Mineta Transportat ion Inst i tute
6Case Studies
Table 1 summarizes basic operational data on the case studies from the National Transit Data Base for 2013; all motorbus routes considered.4 King County buses (including buses contracted by Sound Transit) carry around 100 million passengers annually, while VTA buses carry around 32 million. These ridership numbers mean per capita annual bus ridership (boardings divided by population of the transit service territory) in King County is 50, while in the VTA territory, the annual per capita bus ridership is 18. Beyond buses, VTA includes 42 miles of light rail serving 10.7 million boardings annually, while the light rail in King County amounts to a single 17-mile route carrying 9.7 million per year.
Table 2 provides a brief outline comparison of Santa Clara County and King County based on data from the American Community Survey.5
COUNTY AND URBANIZED AREA COMPARISONS
Table 2. Comparison of Santa Clara County and King CountySanta Clara County King County
Population 1,812,208 1,974,567
Median Household Income $91,702 $71,811
Total Employment 865,327 1,030,515
Population Density per Square Mile 10,599.37 7,919.26
Housing Unit Density per Square Mile 3,881.68 3,822.69
Santa Clara County and King County are broadly similar in some basic respects. They have approximately equal population, and the housing unit density per square mile is similar. However, in other respects the counties are quite different. Median household income in Santa Clara County is almost 28% greater than median household income in King County.6 There are 19% more workers in King County than in Santa Clara County (although population is only 9% greater in King County than in Santa Clara County). Population density is almost 34% higher in Santa Clara County compared to King County, although housing unit density is very similar in the two counties. Other factors held constant, higher incomes can be expected to reduce ridership, while greater density can be expected to increase ridership. These suppositions are confirmed for both of the main case studies in the regression results we report below.
Table 3 compares the San Jose urbanized area with the Seattle urbanized area in terms of commuting to work.7

Mineta T
ransportation Institute
7C
ase Studies
Table 3. Commuting Comparisons for San Jose and Seattle Urbanized AreasMEANS OF TRANSPORTATION (Percent of Workers)
Urbanized AreaTotal
WorkersCar, truck,
or vanCar, truck, or van
- Drove aloneCar, truck, or van
- CarpooledCar, truck, or van -
Workers per car, truck, or vanPublic
transportation WalkedSan Jose, CA Urbanized Area (2010) 811,698 86.8 76.6 10.2 1.07 3.7 2Seattle, WA Urbanized Area (2010) 1,572,387 78.9 68.7 10.2 1.08 9.4 3.9

Mineta Transportat ion Inst i tute
8Case Studies
Seattle has 18% more commuters than San Jose, but public transit use in Seattle is more than two-and-a-half times the rate in San Jose. The proportion of workers who walk to work is also about two times as great in Seattle as in San Jose.
TRANSIT SYSTEM COMPARISONS
The bus transit systems that serve King County Washington and Santa Clara County California are very different, as indicated in Table 4.
Table 4. KCM and VTA Transit System8
KCM VTA
NumberPer 100,00 Workers
Per 100 Square Miles Number
Per 100,00 Workers
Per 100 Square Miles
Routes 221 14.06 21.88 88 10.84 30.80Stops 8,076 513.61 799.47 3,971 489.22 1,389.98Park and Ride Lots 130 8.27 12.87 40 4.93 14.00Total Capacity of Park
and Ride Lots25,528 1,623.52 2,527.10 11,752 1,447.83 4,113.60
King County Metro (KCM) has more than two-and-a-half times as many bus routes, more than twice as many stops, more than three times as many P&R lots, and more than twice as many parking spaces in P&R lots as does the bus network of Santa Clara VTA. Overall, public transit is a more significant component of workers’ commutes in the Seattle area than in the San Jose area. Transit resources are greater in Seattle compared to San Jose on a per worker (potential commuter) basis, but because the Seattle urbanized area covers a much greater area than the San Jose urbanized area, the resources per square mile are fewer in Seattle than in San Jose.9
The study did not consider many of the policy choices faced by regional transit leaders, such as choices about where to establish bus routes and P&R facilities, the setting of fare levels, or the authorization of financial and nonfinancial incentives for commuters to use transit. For example, all of the jurisdictions covered in this study offer a level of employer-managed incentives such as discounted bus fares and guaranteed rides home for emergencies that come up for commuters who do not bring a personal vehicle to their employment site. While such policies may significantly impact bus transit ridership, they are outside the scope of this study.

Mineta Transportat ion Inst i tute
9
II. BROAD POLICY CONTEXT OF PARK-AND-RIDE
Park-and-ride should be viewed in the overall context of public transit in the U.S., which is subsidized by governments with a view toward providing affordable transportation for people who cannot afford a car or are physically unable to drive, and also because it is a mode of transportation that has smaller adverse environmental effects. This view is supported by Duncan and Cook.10 Additionally, public transit is supportive of Smart Growth, meaning compact, relatively dense, walkable communities organized for pedestrian and bicycle access to transit for a high percentage of daily travel. Numerous regional public policy initiatives are meant to motivate Smart Growth and related policies.11 Examples of public policy promoting Smart Growth and density include Plan Bay Area 204012 in the San Francisco Bay Area of California and Vision 204013 in the central Puget Sound region of Washington State.
The Smart Growth rationale ties into environmental improvement from emissions reductions brought about by lower use of automobiles in favor of transit. Reducing traffic congestion is sometimes considered by policy makers to be a motivation for supporting transit expenditures, although there is no direct evidence supporting a causal connection between more transit and lower road congestion. A more reasonable justification for transit is that it provides an alternative to driving in congestion.
P&R fits mostly clearly with the environmental rationale mentioned above. As concerns Smart Growth, there is a widespread perception that P&R is not compatible with zones of transit-oriented development, because P&R promotes use of automobiles, contrary to a major objective of Smart Growth and transit-oriented development. However, this perceived incompatibility is not strictly true. P&R promotes short driving trips over long driving trips. P&R increases vehicle use in less congested suburbs and reduces vehicle use in more congested downtown areas. P&R also promotes short driving trips over greater expansion of costly transit to support picking up dispersed commuters. P&R facilities serve to aggregate riders so that transit can work with greater efficiency in low-density suburbs. As pointed out by Reid Ewing, “…the service area for a transit station or stop with a park-and-ride facility is on the order of 400 times greater than the service area based on walk access alone.”14 Ewing’s geometric calculation corresponds precisely to comparing a typical quarter-mile nominal walking range for a bus stop to a five-mile vehicle movement radius around a P&R passenger access point.
There is a possibility of P&R usage causing Vehicle Miles Traveled (VMT) increases if travelers were motivated to switch from 100 percent transit use to a combination of transit and P&R access. Consider the theoretical example of a neighborhood well served by a bus line to downtown instead suffering the truncation of that bus line at a new P&R facility to which the bus riders would be forced to drive in order to access the bus. Private vehicle mileage rises in this case from zero to the sum of the new driving trips to the P&R facility. However, most studies of real world experience have associated P&R with VMT reduction (Turnbull, Evans, and Levinson 2004). How much reduction depends on how the P&R user would travel if the P&R facility were not available. The general case with P&R involves attracting suburban commuters having no easy bus access to convert from door-to-door private vehicle use to instead making trips in a multimodal combination of driving and bus riding, a commuting mode change that clearly reduces VMT.

Mineta Transportat ion Inst i tute
10Broad Policy Context of Park-and-Ride
Even with all the documented virtues of high-density living and transit-oriented development, many Americans now reside in low-density areas not within walking distance of transit. The sprawling residential neighborhoods on the fringes of most urban areas are likely to remain well spread out for the foreseeable future. In the meantime, (which may be a long time), policies should be pursued to operate transit as efficiently as possible.
Suburbanization and areas of relatively low density continue expanding in the United States generally, as revealed by recent U.S. Census estimates15 and in the two example regions in particular.16 As shown in the maps in Figures 1a and 1b, the locations of the greatest growth are widely dispersed outside the higher-density central city areas, creating a challenge in providing transit service to and between the zones of high growth. Given the distribution of many urban residents in low-density suburbs and the concentration of jobs to denser parts of the region, P&R may be an economically attractive form of commuting. Invariably, there are many suburban residents who are not within walking or cycling distance of fast, frequent transit service to job centers. However, residents with cars and jobs in central places served by transit are able to drive to transit stations and centers with parking lots and leave their vehicle there during the workday.
Figure 1. Population Growth 2000-2010 in King County

Mineta Transportat ion Inst i tute
11Broad Policy Context of Park-and-Ride
Figure 2. Population Growth 2000-2010 in Santa Clara County
Robert Spillar notes in his comprehensive guide to P&R,
“Suburban park-and-ride lots, as the name suggests, are typically located at the outer edges of the urban landscape. The chief function of these lots is to collect potential transit patrons as close to their place of origin (their homes) as possible, and provide a transfer point to long-haul (often express) transit service. These facilities rely on the private automobile as the collection and distribution mode. They rely on trunk-line transit routes (bus or rail) to provide the long-haul aspect of the home-to-work trip. Suburban park-and-ride lots are typically funded by public investment, but can in some cases sustain private ownership.”17
Spillar states further,
“New park-and-ride facilities should be located adjacent to existing major transit corridors, where peak transit service can be provided with headways on the order of 15 minutes or less (10 minutes or less is optimal). Midday service can also be critical to generating high demand characteristics. Transit service should be oriented to the park-and-ride facility so as to minimize downstream transfers (i.e., the transit mode serving the park-and-ride facility should serve the primary activity center directly, without necessitating a transit-to-transit transfer). To achieve this goal, park-and-ride lots should be placed in proximity to the existing transit route structure within the given corridor.” (Spillar 1997, 35, referring to Parsons Brinckerhoff Quade & Douglas, Inc. 1995)
Mineta Transportat ion Inst i tute
12Broad Policy Context of Park-and-Ride
While increasing ridership is important, increasing ridership per dollar of expenditure is paramount. Transit agencies able to increase ridership per operating dollar are, in effect, reducing the public subsidy per rider.
The cost comparison of P&R with bus pickup at local stops in a low-density suburb is relatively straightforward. One can compare the cost of (a) providing parking places for transit customers coming (typically in the usual morning commute period) from a series of first origins to a single P&R point of pick up against (b) the cost of a transit vehicle traveling additional hours to reach a series of dispersed bus stops to which travelers walk or are chauffeured from first origins.18
Consider this simplified cost analysis based on the “payback period” of an investment: the average operating cost of a bus in 2013 was $127 per hour according to the U.S. National Transit Data Base.19 According to the same source, all across America in cities large and small, buses averaged 34 boardings per revenue hour of service. The cost of providing a parking space for a car ranges widely depending on cost of land and whether the parking lot is grass and gravel, paved, or in a structure. Structured parking around Seattle costs about $30,000 per space. As an illustration of marginal effect, the authors assume running a single suburban bus an extra hour in the morning and again in the evening would allow service directly to the neighborhoods of 34 suburban customers commuting to a central city district where they worked all day. For the 250 workdays in a year, the marginal bus cost is 250 days times two revenue hours per day times $127 per hour, or $63,500. At the same time, this extra expense would be eliminated if the 34 customers drove themselves to a P&R facility, because we assume the bus would have a shorter route to that place. For simplicity, assume that the bus passes by the P&R facility and continues on for more route distance in the case of traveling through the residential neighborhood. If the cost of providing parking were $30,000 per stall, then the 34 stalls would cost $1,020,000. Payback on that investment, if it came only from reduced bus operating costs in this simplified marginal analysis, would then be $1,020,000 divided by $63,500 or 16 years, well within the expected life span of a parking structure. However, it is also reasonable to assume that an extra fee could be charged for commuters using a P&R facility, which would allow payback on the investment in parking stalls to be realized even more quickly. Parking fees are discussed at the end of this report.
The benefits of P&R facilities have motivated implementation worldwide. For example, the American Public Transportation Association reports that there are 210,000 P&R spaces in 360 U.S. cities as of January 2012.20 These facilities are not necessarily owned by transit agencies; for example, the State Departments of Transportation in California and in Washington own some P&R lots. A survey of European cities by Dijk and Montalvo21 found moderate or extensive adoption of P&R in cities of the United Kingdom, Netherlands, Germany, Switzerland, Norway, Finland, Czech Republic, Austria, and Poland.
Several aspects of P&R have been systematically investigated in previous work. Research has been carried out on the optimal location of P&R lots to attract the largest number of users.22 Work has also been done to measure benefits to commuters and to the environment from reductions in VMT and emissions.23 As summarized in a policy guidance document from the U.S. Environmental Protection Agency, “In developing and implementing fringe

Mineta Transportat ion Inst i tute
13Broad Policy Context of Park-and-Ride
park-and-ride facilities, an assessment of the air quality impacts should be undertaken which looks at the emission reductions expected due to VMT reduction balanced against cold start emissions which are not eliminated and options for reducing auto trips altogether.”24 The environmental damage from the cold-start phase of a trip from home to a P&R lot a few miles away is likely to be mitigated in the future as electric hybrid and battery vehicles become more widely used.25 This mitigation of environmental damage is especially likely in California and other states with zero-emission vehicle goals set by regulation, and will become more widespread under the 54.5 mpg Corporate Average Fuel Economy (CAFE) goal for year 2025 new cars set in regulations issued by the Obama Administration.26
However, remarkably little attention has been given to the measurement of park and ride impact on the operational productivity of the public bus lines that serve these lots.27A key reference on P&R, TCRP Report 95, Chapter 3, alludes to the productivity yielded by P&R facilities as a collector of customers by noting the following objective: “Concentrating transit rider demand to a level enabling transit service that could not otherwise be provided.” The report goes on to describe that “…in many low-density areas, without park-and-ride facilities and service, no attractive public transit could be effectively operated.”28 This objective clearly hints at the importance of attracting enough riders to make transit service a reasonable expenditure of public resources in suburban jurisdictions.
In this research the authors focus on the narrower issue of which of two modes of passenger collection is better – driving buses on suburban routes to a large number of bus stops near the home locations of dispersed customers versus picking up these same customers from a place that they have brought themselves to in their private vehicles.
The paper does not distinguish between the various categories of potential owners of P&R facilities, whether owned by a transit agency, by a State Government agency, or a non-government organization. Our analysis also assumes that no part of the bus transit system is at capacity. The provision of bus service is not a smooth, continuous production curve – capacity is added in discrete increments of distinct routes, bus runs and P&R facilities, each with a cost to establish and operate and with a capacity constraint. Considering a single new commuter moving into an existing suburban environment with bus routes and P&R facilities already in place and with spare capacity in both, the transit agency should be indifferent as to how this customer interfaces with the system; there will be space on the bus whether the customer boards at a neighborhood bus stop or drives to a P&R. The marginal cost of the added rider will be zero.

Mineta Transportat ion Inst i tute
14
III. COSTS AND BENEFITS OF PARK-AND-RIDE
The efficiency, or productivity, of transit is directly measured by cost per boarding. Boardings of passengers is a key production measure in public transit. The ratio of this production measure to cost is mathematically related to a less direct productivity measure, boardings per vehicle revenue hour. A vehicle revenue hour is an hour when the bus is in operation and available to pick up and discharge passengers. Cost per boarding is the product of cost per revenue hour and revenue hour per boarding. Higher efficiency is marked by lower cost per boarding. Reducing costs per boarding requires reducing service hours per boarding, or considering the reciprocal, raising boardings per service hour. The more boardings per service hour, the greater is the productivity of service.29
One way to raise boardings per service hour for a given number of passengers is to collect them at fewer locations. Rather than routing buses through low density suburbs to pick up passengers, the transit agency can let the passengers assemble themselves at a more limited number of locations, ideally located on or near the roads that buses take when going to their final destinations. This strategy is implemented by providing P&R lots for transit customers.
P&R works well if there is a parking space actually available when a customer drives into the facility, and if, after commuters park their cars, buses come to pick up them up according to the schedule or expected frequency of service. These success factors can be present both with all-day transit service and peak-period-only transit service. Because buses are usually more intensively used in peak than in off-peak periods, the transit efficiency would be higher in peak than off peak. However, the performance distinction of P&R that we sought to analyze would be visible in either case, if extant.
At the same time, it must be acknowledged that for midday, off-peak P&R service to be viable, there must be available parking spaces for arriving travelers seeking to access bus service, and there must be bus service itself on a midday schedule. There are examples of P&R facilities in all five of the case study jurisdictions where midday service is either nonexistent by design, or else the parking facility is filled to capacity with morning-arriving cars so that boardings from drive-up customers on midday bus trips on certain routes is necessarily nil.
Different types of bus service may serve a P&R lot, especially if the facility is part of a more general transit hub. Customers may arrive or depart on a local bus serving a residential neighborhood, with a bus-to-bus transfer either to or from an express bus serving an employment center, or even from one local bus route to another. In this study, the authors usually generalized (with exceptions noted) across different types of bus service (local, express, and bus rapid transit) to obtain more general findings about the relationship of parking availability to bus operations.
While P&R lots in theory make public transit more efficient by raising boardings per service hour and thus lowering cost per boarding, the cost of providing the P&R lots needs to be considered. In addition to paying for the construction of parking facilities, or renting such facilities, there may be maintenance costs. These include providing security and

Mineta Transportat ion Inst i tute
15Costs and Benefits of Park-and-Ride
monitoring for illegal usage, such as a customer parking in a space for more than a stated length of time of 12 hours or 24 hours. Illegal multiple day parking is sometimes motivated by quick transit access to an airport or train station with intercity service. Additionally, there may be a cost in providing additional bus service if P&R leads to a larger number of transit boardings than before. An agency may choose to collect a fee for parking to offset the cost of the facility, which then requires expenditure for collection of fees via personnel or automated means.
The focus of this report is the impact of P&R on bus transit efficiency. This is only a subset of policy issues that might be addressed. P&R may be established to facilitate, van or carpool assembly, or for use by inter- or intra- city rail passengers. From an analytical perspective, these other uses can be viewed as constraints on the impacts for bus transit productivity, in that fewer slots for bus patrons (because of more space used for non-bus transit) simply limit the impact that car-parking bus passengers can have on operational performance of the buses.
The authors also note that bus passengers who arrive by other means than in a private vehicle parked at the P&R facility are not distinguished in the present analysis from those who simply drive in and park. The other means of arrival can be a walk from a nearby residence, bicycle, kiss-and-ride drop off, a local shuttle operated by other than the transit agency in focus, or an intercity train.
P&R customers save both time and money. Financial savings come from driving fewer miles in a car, and saving on parking at the trip destination. It’s also possible that the experience of parking and riding is simply more comfortable and convenient than driving more and parking at the destination, or than getting to a bus stop closer to the trip origin and waiting for a bus.
Society benefits from reduced vehicle traffic as commuters are take themselves off the road by parking their cars and getting aboard transit vehicles. The local traffic around a P&R may be perceived as a cost by jurisdictions or by citizens who live close to the facilities. If the lots fill up, there can be spillover that consumes parking spots in neighborhoods where P&R lots are located. In fact, P&R lots are often popular to the point of demand exceeding capacity in U.S. and Canadian urban regions.

Mineta Transportat ion Inst i tute
16
IV. DATA USED TO ESTIMATE PARK-AND-RIDE IMPACT ON TRANSIT EFFICIENCY
The authors apply consistent methodologies to two case studies where they were able to obtain the most complete data. Broadly speaking, these methodologies are route-level analysis and stop-level analysis. Route-level analysis examines at route-level a performance measure such as boardings per revenue hour; stop-level analysis examines measures such as boardings at a stop or boardings per trip at a stop. The authors extended certain aspects of the methodologies to three other agencies where they had less data. The methodology is intended to elucidate the impact that P&R lots have on the efficiency of transit. The study focused on bus ridership during morning commute hours.
The types of data used in the two most comprehensive cases in this study are comprised of data in Geographic Information Systems (GIS) layers, files of ridership and cost data by route, boardings at each stop, characteristics of each route such as length and speed, and demographic and economic data about areas near bus stops.
The study employed the following types of data:
• GIS layer of bus routes
• GIS layer of bus stops
• GIS layer of park-and-ride lots
• GIS layer of Census tracts with economic and demographic variables
• GIS layer of Census block groups with economic and demographic variables
• GIS layer of Census blocks with population and housing
• Ridership data – typically boardings and trips by stop by route by time
• Route efficiency data – boardings per revenue hour and related measures by route
SOURCES OF DATA AND DATA QUALITY
GIS and related data on Census tracts, Census block groups, and Census blocks comes from the U.S. Census Bureau as part of the American Community Survey (ACS) and the 2010 Census. GIS data on bus routes, bus stops, P&R lots, boardings, and route efficiency data come from the transit agencies. Data from the U.S. Census Bureau employ a consistent methodology. Data from transit agencies differ in terms of the detail and completeness with which they are provided.

Mineta Transportat ion Inst i tute
17Data Used to Estimate Park-and-Ride Impact on Transit Efficiency
VARIABLES
A variety of variables is available for either kind of analysis. These variables are usefully divided into outcome variables (dependent variables in a regression equation) and explanatory variables (independent variables in a regression equation). Each type of variable can also be characterized as a route-level variable, a stop-level variable, or a neighborhood-level variable. Route-level variables are always classified by route number, direction (e.g., “inbound” or “outbound”), and time of day. Stop-level variables may sometimes also be identified by route number, direction, and time of day. Some stop-level variables may be characterized by proximity to another feature (e.g., to a P&R lot, to an employment concentration, or to a residential concentration). Neighborhood-level variables are variables associated with areas such as buffers of a given radius around stops or P&R lots, Census block groups, or Census tracts. For example, the authors construct quarter-mile buffers around stops. A quarter mile is often thought of as the distance a potential bus rider is willing to walk to ride the bus. Neighborhoods consisting of buffers around stops or P&R lots can be associated with stop-level variables or route-level variables. Neighborhoods consisting of buffers around routes can be associated with route-level variables.
DEPENDENT VARIABLES
• Boardings per revenue hour (route-level)
• Boardings (stop-level)
• Boardings per Trip (stop-level)
INDEPENDENT VARIABLES
• Number of stops along a route (route-level)
• Speed (velocity) of bus along a route (route-level)
• P&R Influence (route-level)
• Residential Density (stop-level)
• Number of routes serving a stop (stop-level)
• Distance to nearest P&R lot (stop-level)
• P&R lot characteristics (e.g., number of spaces, stop-level or route-level)
• Demographic and economic characteristics (such as number of works, population density, and income) of a buffer around a stop (stop-level or route-level)
The P&R Influence variable (route-level) can be formulated to include P&R characteristics, such as number of spaces.

Mineta Transportat ion Inst i tute
18Data Used to Estimate Park-and-Ride Impact on Transit Efficiency
Several of the variables mentioned above were created using a GIS program. For example, residential density within a quarter mile of a bus stop was created by first determining quarter-mile buffers (rings) around each stop and then intersecting the quarter-mile buffers with Census Block data on population. Likewise, measures of median income and employment within a quarter mile of a stop were computed by intersecting the quarter-mile buffers with the relevant American Community Survey data for Census Block Groups.
In some cases, the authors employ several versions of some variables. For example, the variable squared is employed along with the original variable, in order to capture potential nonlinearities. Where appropriate, the natural logarithm of a variable is used, to capture potential nonlinearities and to estimate elasticities. The descriptive statistics of all variables used in the report over various data sets appear in Appendix C.

Mineta Transportat ion Inst i tute
19
V. ECONOMETRIC STRATEGY TO ESTIMATE PARK-AND-RIDE IMPACT ON TRANSIT EFFICIENCY
ROUTE-LEVEL AND STOP-LEVEL ANALYSES
Figures 2a – 2e show selected routes and stops for KCM and VTA. These maps are suggestive of the relationships our econometric analysis seeks to uncover.
Figure 3. High and Low Boardings-per-Revenue-Hour Routes for King County Metro

Mineta Transportat ion Inst i tute
20Econometric Strategy to Estimate Park-and-Ride Impact on Transit Efficiency
Figure 4. High Morning Boardings Stops for King County Metro
Both Figure 3 and 4 show that higher boardings are seen more within the city limits of Seattle than outside of the city. The city of Bellevue does not exhibit particularly high transit demand compared to the surrounding smaller cities outside Seattle.

Mineta Transportat ion Inst i tute
21Econometric Strategy to Estimate Park-and-Ride Impact on Transit Efficiency
Figure 5. High and Low Boardings-per-Revenue-Hour Routes for Valley Transportation Authority

Mineta Transportat ion Inst i tute
22Econometric Strategy to Estimate Park-and-Ride Impact on Transit Efficiency
Figure 6. High Morning Boardings Stops for Valley Transportation Authority
Figure 7 shows high boardings-per-trip stops relative to P&R locations and parking capacities for VTA.

Mineta Transportat ion Inst i tute
23Econometric Strategy to Estimate Park-and-Ride Impact on Transit Efficiency
Figure 7. Stops with Boardings per Trip Greater Than or Equal to 10 and Park-and-Ride Lots for VTA
The broad framework for the stop-level results is given in Figure 8.

Mineta Transportat ion Inst i tute
24Econometric Strategy to Estimate Park-and-Ride Impact on Transit Efficiency
Figure 8. Stop-Level Regression Specifications
Figure 8 shows three alternative dependent variables (blue). Two of the variables represent morning boardings on each system, but the boardings on KCM were averaged, so the original data included decimals. One of the regression methods employed (Poisson regression) requires count data, so the authors rounded the KCM data to the nearest integer when estimating Poisson regressions. The authors determined (by running regressions with both the rounded data and the original data) that rounding did not affect the coefficient estimates.
This Figure also shows three categories of independent variables: transit variables, economic and demographic variables, and P&R variables. For the base cases for KCM and VTA the authors use as a transit variable (purple) the number of lines serving a stop. The authors expect this variable to be positively related to boardings.
The authors also use economic and demographic variables (green) describing the areas within walking distance (a quarter mile) of each stop: population density, number employed, and median household income. The authors expect the first two of these variables to be positively related to morning boardings and the last variable, income, to be negatively related to boardings.
Figure 8 shows three alternative P&R variables (brown): a Quarter Mile Dummy,30 a Quarter Mile Capacity variable, and Distance Decay variables that have two components (capacity and distance). The Quarter Mile Dummy is equal to 1 if the stop is within a quarter mile of a P&R lot; otherwise it is zero. The Quarter Mile Capacity variable is equal to the capacity (size) of the P&R lot if it is within a quarter mile of the stop; otherwise it is zero. Basically, the authors are weighting the Quarter Mile Dummy by the capacity of the P&R lot. This can be viewed as a sort of Distance Decay function. Finally, for one of the regression methods

Mineta Transportat ion Inst i tute
25Econometric Strategy to Estimate Park-and-Ride Impact on Transit Efficiency
below (Poisson regression) the authors use a traditional Distance Decay function that results in two independent variables (representing, respectively, capacity of the P&R lot and distance to the bus stop). The reason for introducing this Distance Decay function is explained below.
REGRESSION METHODS: OLS AND POISSON
The authors employ two estimation procedures: Ordinary Least Squares (OLS) regression and Poisson regression. The authors use OLS because it provides a good base line for understanding all regression results; it provides coefficient estimates that are straightforward to interpret; and it will allow them to examine the results of stop-level and route-level analysis in the same framework. OLS is the only method the authors can use for the route-level data (although several specifications of the OLS regressions are examined). The authors employ Poisson regressions to address two issues with the OLS estimates of stop-level data. The dependent variable (boardings) is a count variable. That is, it is 0, or 1, or 2, or …31 The Poisson model is more appropriate and more accurate than OLS for count-dependent variables. Second, as noted below, the interpretation of the OLS coefficients as marginal impacts is somewhat stilted. Given that absolute changes, say, in income, represent very different things in King County compared to Santa Clara County, it would be better to have coefficient estimates that represent elasticity: the impact in percentage terms on the dependent variable of a given percentage change in the independent variable, holding constant all other variables. In the OLS framework, this would require that the dependent variable be logarithmically transformed. However, as is typical with count data, many of the observations on the dependent variable are zero, for which the logarithm is undefined. The authors can overcome this difficulty and obtain elasticity estimates for some dependent variables in the base case regressions using the Poisson estimation method. Furthermore, Poisson regression is robust to a wide range of specification errors.32 The functional form of our specifications for stop-level and route-level analysis is detailed below.
STOP-LEVEL ANALYSIS
Stop-level analysis employs stop-level data to determine whether P&R lots contribute significantly to boardings at a stop, and, if so, how much they contribute. Typically, there are many more stops (thousands) than routes (scores), so estimates of stop-level models generally employ many more observations. But just as route-level analysis employs some stop-level data (represented by the various influence variables discussed above), stop-level analysis can employ some route-level and neighborhood-level variables if these variables are made compatible with the stop-level approach. One disadvantage of stop-level analysis is that there appears to be no straightforward way to recover the key performance variable: boardings per revenue hour. However, a host of other policy-relevant variables emerge from stop-level analysis.
We present three formulations of stop-level analysis: OLS analysis with boardings as a dependent variable, Poisson analysis with boardings as a dependent variable, and OLS analysis with boardings per trip as a dependent variable.

Mineta Transportat ion Inst i tute
26Econometric Strategy to Estimate Park-and-Ride Impact on Transit Efficiency
OLS Analysis with Boardings as a Dependent Variable
Our formulation is:
1 𝐵𝐵𝐵𝐵𝐵𝐵𝐵𝐵𝐵𝐵𝐵𝐵𝐵𝐵𝐵𝐵𝐵𝐵𝐵𝐵= 𝛽𝛽$ + 𝛽𝛽𝑁𝑁𝑁𝑁𝑁𝑁𝑁𝑁𝑁𝑁𝑁𝑁𝑁𝑁𝑁𝑁𝑁𝑁𝑁𝑁𝑁𝑁𝑁𝑁𝑁𝑁𝑁𝑁𝑁𝑁𝑁𝑁𝑁𝑁𝑁𝑁𝐵𝐵
+ 𝛽𝛽𝑃𝑃𝑁𝑁𝑃𝑃𝑁𝑁𝑁𝑁𝑁𝑁𝑃𝑃𝑃𝑃𝑁𝑁𝑃𝑃𝑃𝑃𝑃𝑃𝑃𝑃𝑃𝑃𝐵𝐵 𝐵𝐵𝐵𝐵 + 𝛽𝛽𝑃𝑃𝑁𝑁𝑃𝑃𝑃𝑃𝑃𝑃𝑃𝑃𝑁𝑁𝑃𝑃𝑃𝑃𝑃𝑃𝐵𝐵 + 𝛽𝛽𝑃𝑃𝐵𝐵𝑃𝑃𝑃𝑃𝑃𝑃𝐵𝐵𝐵𝐵𝑃𝑃𝑁𝑁𝑃𝑃𝑃𝑃𝑁𝑁𝑁𝑁𝑁𝑁𝐵𝐵
+ 𝛽𝛽𝑁𝑁𝑃𝑃𝐵𝐵𝑀𝑀𝑀𝑀𝑀𝑀𝐵𝐵𝑀𝑀𝑁𝑁𝑁𝑁𝑃𝑃𝑀𝑀𝑀𝑀𝑀𝑀𝑁𝑁𝑃𝑃𝐵𝐵 + 𝛽𝛽𝑁𝑁𝑃𝑃𝑃𝑃𝑁𝑁𝑁𝑁𝑃𝑃𝐵𝐵 + 𝜖𝜖𝐵𝐵
where
s is the stop;
𝛽𝛽𝑁𝑁𝑁𝑁𝑁𝑁𝑁𝑁𝑁𝑁𝑁𝑁𝑁𝑁𝑁𝑁𝑁𝑁 is the coefficient on the number of routes serving a particular stop s;
𝑁𝑁𝑁𝑁𝑁𝑁𝑁𝑁𝑁𝑁𝑁𝑁𝑁𝑁𝑁𝑁𝑁𝑁𝑠𝑠 is the number of routes serving a particular stop s;
𝛽𝛽𝑃𝑃𝑃𝑃𝑃𝑃𝑃𝑃𝑃𝑃𝑃𝑃𝑃𝑃 is the coefficient on the P&R dummy variable that indicates whether a particular stop s is within a critical distance of a P&R lot;
𝑃𝑃𝑃𝑃𝑃𝑃𝑃𝑃𝑃𝑃𝑃𝑃𝑃𝑃𝑠𝑠 is a dummy variable indicating whether a stop is within a critical distance of a P&R lot;
𝛽𝛽𝑃𝑃𝑃𝑃𝑃𝑃𝑃𝑃𝑃𝑃 is the coefficient on the P&R capacity variable;
𝑃𝑃𝑃𝑃𝑃𝑃𝑃𝑃𝑃𝑃𝑃𝑃𝑃𝑃𝑃𝑃𝑃𝑃𝑃𝑃𝑠𝑠 is the capacity of the nearest P&R lot to stop s;
𝑃𝑃𝑃𝑃𝑃𝑃𝑃𝑃𝑃𝑃𝑠𝑠 = [𝑃𝑃𝑃𝑃𝑃𝑃𝑃𝑃𝑃𝑃𝑃𝑃𝑃𝑃𝑃𝑃𝑃𝑃𝑦𝑦𝑠𝑠 ∗ 𝑃𝑃𝑃𝑃𝑃𝑃𝑃𝑃𝑃𝑃𝑃𝑃𝑦𝑦𝑠𝑠];
𝛽𝛽𝑃𝑃𝑃𝑃𝑃𝑃𝑃𝑃𝑃𝑃𝑃𝑃𝑃𝑃 is the coefficient on population density within a quarter mile of a stop;
𝑃𝑃𝑃𝑃𝑃𝑃𝑃𝑃𝑃𝑃𝑃𝑃𝑃𝑃𝑠𝑠 is the population density within a quarter mile of a stop;
𝛽𝛽𝑀𝑀𝑀𝑀𝑀𝑀𝑀𝑀𝑀𝑀𝑀𝑀𝑀𝑀𝑀𝑀 is the coefficient on median household income within a quarter mile of a stop;
𝑀𝑀𝑀𝑀𝑀𝑀𝑀𝑀𝑀𝑀𝑀𝑀𝑀𝑀𝑀𝑀𝑠𝑠 is median household income within a quarter mile of stop s;
𝛽𝛽𝐸𝐸𝐸𝐸𝐸𝐸 is the coefficient on employment within a quarter-mile of a stop;
𝐸𝐸𝐸𝐸𝐸𝐸𝑠𝑠 is employment within a quarter mile of a stop;
es is an error term.

Mineta Transportat ion Inst i tute
27Econometric Strategy to Estimate Park-and-Ride Impact on Transit Efficiency
Poisson Analysis with Boardings as a Dependent Variable
2 𝐵𝐵𝐵𝐵𝐵𝐵𝐵𝐵𝐵𝐵𝐵𝐵𝐵𝐵𝐵𝐵𝐵𝐵𝐵𝐵= 𝛽𝛽$ +𝛽𝛽𝑙𝑙𝐵𝐵𝑙𝑙𝑙𝑙𝑙𝑙𝑙𝑙𝑙𝑙𝑙𝑙𝐵𝐵(𝑙𝑙𝑙𝑙𝑙𝑙𝑙𝑙𝑙𝑙𝐵𝐵) + 𝛽𝛽𝑙𝑙𝐵𝐵𝑙𝑙𝐵𝐵𝑙𝑙𝑙𝑙𝑙𝑙𝐵𝐵𝐵𝐵𝑙𝑙𝐵𝐵(𝑙𝑙𝑃𝑃𝑙𝑙𝑙𝑙𝑃𝑃𝑃𝑃𝑃𝑃𝐵𝐵)+ 𝛽𝛽𝑙𝑙𝐵𝐵𝑙𝑙𝑙𝑙𝐵𝐵𝑙𝑙𝑙𝑙𝑙𝑙𝐵𝐵𝑙𝑙𝑙𝑙𝐵𝐵(𝑙𝑙𝑃𝑃𝑙𝑙𝑙𝑙𝑙𝑙𝑙𝑙𝑃𝑃𝑙𝑙𝐵𝐵) + 𝛽𝛽𝑙𝑙𝐵𝐵𝑃𝑃𝑙𝑙𝑙𝑙𝑙𝑙𝐵𝐵(𝑃𝑃𝑙𝑙𝑙𝑙𝐵𝐵) + 𝜖𝜖𝐵𝐵
where
s is the stop;
𝛽𝛽𝑙𝑙𝑙𝑙𝑙𝑙𝑙𝑙𝑙𝑙𝑙𝑙𝑙𝑙 is the coefficient on the logarithm of the P&R capacity variable;
𝑙𝑙𝑙𝑙(𝑃𝑃𝑃𝑃𝑃𝑃𝑃𝑃𝑃𝑃𝑃𝑃𝑃𝑃𝑃𝑃𝑃𝑃𝑃𝑃𝑠𝑠) is the logarithm of the capacity of the nearest P&R lot to stop s;
𝑃𝑃𝑃𝑃𝑃𝑃𝑃𝑃𝑃𝑃𝑠𝑠 = [𝑃𝑃𝑃𝑃𝑃𝑃𝑃𝑃𝑃𝑃𝑃𝑃𝑃𝑃𝑃𝑃𝑃𝑃𝑦𝑦𝑠𝑠 ∗ 𝑃𝑃𝑃𝑃𝑃𝑃𝑃𝑃𝑃𝑃𝑃𝑃𝑦𝑦𝑠𝑠];
𝛽𝛽𝑙𝑙𝑙𝑙𝑙𝑙𝑙𝑙𝑙𝑙𝑙𝑙𝑙𝑙𝑙𝑙𝑙𝑙𝑙𝑙 is the coefficient on the logarithm of median household income within a quarter mile of a stop;
𝑙𝑙𝑙𝑙(𝑀𝑀𝑀𝑀𝑀𝑀𝑀𝑀𝑀𝑀𝑀𝑀𝑀𝑀𝑀𝑀𝑠𝑠) is logarithm of median household income within a quarter mile of stop s;
𝛽𝛽𝑙𝑙𝑙𝑙𝑙𝑙𝑙𝑙𝑙𝑙 is the coefficient on the logarithm of employment within a quarter mile of a stop;
ln(𝐸𝐸𝐸𝐸𝐸𝐸𝑠𝑠) is employment within a quarter mile of a stop;
es is an error term.
OLS Analysis with Boardings Per Trip as a Dependent Variable
3 𝐵𝐵𝐵𝐵𝐵𝐵𝐵𝐵𝐵𝐵𝐵𝐵𝐵𝐵𝐵𝐵𝐵𝐵𝑝𝑝𝑝𝑝𝐵𝐵𝑇𝑇𝐵𝐵𝐵𝐵𝑝𝑝𝐵𝐵= 𝛽𝛽$ + 𝛽𝛽𝑃𝑃𝑃𝑃𝑃𝑃𝑃𝑃𝑃𝑃𝑃𝑃𝑃𝑃𝑃𝑃𝑃𝑃𝑃𝑃𝐵𝐵 + 𝛽𝛽𝑃𝑃𝐵𝐵𝑝𝑝𝑃𝑃𝑝𝑝𝐵𝐵𝐵𝐵𝑃𝑃𝑃𝑃𝑃𝑃𝑃𝑃𝑃𝑃𝑃𝑃𝑃𝑃𝐵𝐵 + 𝛽𝛽𝑃𝑃𝐵𝐵𝑝𝑝𝑃𝑃𝑝𝑝𝐵𝐵𝐵𝐵𝑃𝑃𝑃𝑃𝐵𝐵𝐵𝐵𝑃𝑃𝑃𝑃𝑃𝑃𝑃𝑃𝑃𝑃𝑃𝑃𝑃𝑃𝑃𝑃𝑃𝑃𝑃𝑃𝐵𝐵+ 𝛽𝛽𝑀𝑀𝑝𝑝𝐵𝐵𝑀𝑀𝑀𝑀𝑀𝑀𝐵𝐵𝑀𝑀𝑀𝑀𝑃𝑃𝑃𝑃𝑀𝑀𝑀𝑀𝑀𝑀𝑃𝑃𝑃𝑃𝐵𝐵 + 𝛽𝛽𝑀𝑀𝑝𝑝𝐵𝐵𝑀𝑀𝑀𝑀𝑀𝑀𝐵𝐵𝑀𝑀𝑃𝑃𝑃𝑃𝐵𝐵𝐵𝐵𝑀𝑀𝑃𝑃𝑃𝑃𝑀𝑀𝑀𝑀𝑀𝑀𝑃𝑃𝑃𝑃𝑃𝑃𝑃𝑃𝑃𝑃𝑃𝑃𝐵𝐵+ 𝛽𝛽𝑃𝑃𝐸𝐸𝑝𝑝𝑃𝑃𝑀𝑀𝑃𝑃𝐵𝐵 + 𝜖𝜖𝐵𝐵
where
s is the stop;
𝛽𝛽𝑃𝑃𝑃𝑃𝑃𝑃𝑃𝑃𝑃𝑃 is the coefficient on the P&R capacity variable;
𝑃𝑃𝑃𝑃𝑃𝑃𝑃𝑃𝑃𝑃𝑃𝑃𝑃𝑃𝑃𝑃𝑃𝑃𝑃𝑃𝑠𝑠 is the capacity of the nearest P&R lot to stop s;
𝑃𝑃𝑃𝑃𝑃𝑃𝑃𝑃𝑃𝑃𝑠𝑠 = [𝑃𝑃𝑃𝑃𝑃𝑃𝑃𝑃𝑃𝑃𝑃𝑃𝑃𝑃𝑃𝑃𝑃𝑃𝑦𝑦𝑠𝑠 ∗ 𝑃𝑃𝑃𝑃𝑃𝑃𝑃𝑃𝑃𝑃𝑃𝑃𝑦𝑦𝑠𝑠];
𝛽𝛽𝑃𝑃𝑃𝑃𝑃𝑃𝑃𝑃𝑃𝑃𝑃𝑃𝑃𝑃 is the coefficient on population density within a quarter mile of a stop;
𝑃𝑃𝑃𝑃𝑃𝑃𝑃𝑃𝑃𝑃𝑃𝑃𝑃𝑃𝑠𝑠 is the population density within a quarter mile of a stop;

Mineta Transportat ion Inst i tute
28Econometric Strategy to Estimate Park-and-Ride Impact on Transit Efficiency
𝛽𝛽𝑃𝑃𝑃𝑃𝑃𝑃𝑃𝑃𝑃𝑃𝑃𝑃𝑃𝑃𝑃𝑃𝑃𝑃𝑃𝑃𝑃𝑃 is the coefficient on population density squared within a quarter mile of a stop;
𝑃𝑃𝑃𝑃𝑃𝑃𝑃𝑃𝑃𝑃𝑃𝑃𝑃𝑃𝑃𝑃𝑃𝑃𝑃𝑃𝑠𝑠 is the population density within a quarter mile of a stop squared;
𝛽𝛽𝑀𝑀𝑀𝑀𝑀𝑀𝑀𝑀𝑀𝑀𝑀𝑀𝑀𝑀𝑀𝑀 is the coefficient on median household income within a quarter mile of a stop;
𝑀𝑀𝑀𝑀𝑀𝑀𝑀𝑀𝑀𝑀𝑀𝑀𝑀𝑀𝑀𝑀𝑠𝑠 is median household income within a quarter mile of stop s;
𝛽𝛽𝑀𝑀𝑀𝑀𝑀𝑀𝑀𝑀𝑀𝑀𝐼𝐼𝑛𝑛𝑛𝑛𝑛𝑛𝑛𝑛𝑛𝑛𝑀𝑀 is the coefficient on median household income within a quarter mile of a stop squared;
𝑀𝑀𝑀𝑀𝑀𝑀𝑀𝑀𝑀𝑀𝑀𝑀𝑀𝑀𝑀𝑀𝑀𝑀𝑀𝑀𝑀𝑀𝑀𝑀𝑠𝑠 is median household income within a quarter mile of stop s squared;
𝛽𝛽𝐸𝐸𝐸𝐸𝐸𝐸 is the coefficient on employment within a quarter mile of a stop;
𝐸𝐸𝐸𝐸𝐸𝐸𝑠𝑠 is employment within a quarter mile of a stop;
es is an error term

Mineta Transportat ion Inst i tute
29
VI. ROUTE-LEVEL ANALYSIS
Route-level analyses focus on route characteristics and performance measures. Route-level analysis casts everything in terms of routes. The main outcome variable for route-level analyses is boardings per revenue hour. Determinants of the outcome variable include length of route, speed of the bus along the route, and the number of stops along the route. Data that are inherently neighborhood-level or stop-level are converted into route-level data in a manner discussed below.
Since focus of route-level analysis is a key route performance measure (boardings per revenue hour), the regression model seeks to explain boardings per revenue hour as a function of various independent variables.
4 𝐵𝐵𝐵𝐵𝐵𝐵𝐵𝐵𝐵𝐵𝐵𝐵𝐵𝐵𝐵𝐵𝐵𝐵𝑝𝑝𝑝𝑝𝐵𝐵𝑅𝑅𝑝𝑝𝑅𝑅𝑝𝑝𝐵𝐵𝑅𝑅𝑝𝑝𝐻𝐻𝐵𝐵𝑅𝑅𝐵𝐵𝐵𝐵
= 𝛽𝛽$ + 𝛽𝛽𝑆𝑆𝑆𝑆𝑆𝑆𝑆𝑆𝑆𝑆𝑆𝑆𝑆𝑆𝑆𝑆𝑆𝑆𝑆𝑆𝐵𝐵 + 𝛽𝛽𝑆𝑆𝑅𝑅𝑃𝑃𝑆𝑆𝑅𝑅𝑃𝑃𝐵𝐵 + 𝛽𝛽𝑆𝑆𝑝𝑝𝐵𝐵𝑅𝑅𝑆𝑆𝑆𝑆𝑝𝑝𝑝𝑝𝑆𝑆𝑆𝑆𝑅𝑅𝑆𝑆𝑆𝑆𝑆𝑆𝑆𝑆𝑆𝑆𝐵𝐵 + 𝜖𝜖𝐵𝐵
where
r is the route number;
𝛽𝛽! is a constant;
𝛽𝛽𝑆𝑆𝑆𝑆𝑆𝑆𝑆𝑆𝑆𝑆 is the coefficient on the speed (velocity) of the bus along route r;
𝑆𝑆𝑆𝑆𝑆𝑆𝑆𝑆𝑆𝑆𝑟𝑟 is the speed of the bus along route r;
𝛽𝛽𝑃𝑃𝑃𝑃𝑃𝑃 is the coefficient on the P&R Influence variable along route r;
𝑃𝑃𝑃𝑃𝑃𝑃𝑟𝑟 is the P&R Influence variable along route r a;
𝛽𝛽𝑆𝑆𝑒𝑒𝑒𝑒𝑒𝑒𝑒𝑒𝑒𝑒𝑒𝑒𝑒𝑒 is the coefficient on service type along route r;
𝑆𝑆𝑆𝑆𝑆𝑆𝑆𝑆𝑆𝑆𝑆𝑆𝑆𝑆𝑆𝑆𝑟𝑟 is the service type (e.g., “limited”) along route r;
er is an error term.

Mineta Transportat ion Inst i tute
30
VII. REGRESSION RESULTS
The authors present regression results for stop-level data and then for route-level data. The results are generated by separate but related data sets.
The descriptive statistics show that relative to respective areas of operation, King County Metro (KCM) is the larger and more comprehensive system. KCM has more than twice as many stops, routes, and P&R spaces as VTA in Santa Clara. More than three times as many workers (almost 12%) commute by public transit in King County compared to Santa Clara County (3.6%). Average morning boardings are more than four and one-half times greater for KCM compared to VTA.

Mineta Transportat ion Inst i tute
31
VIII. STOP-LEVEL RESULTS
For both KCM and VTA across all specifications of stop-level regression equations, all coefficients estimates are statistically significant (using robust standard errors) and of the expected sign. Generally, the story that emerges from OLS regression is consistent with the story that emerges from Poisson regression. Generally, all the coefficient estimates are larger in absolute value for KCM compared to VTA.
Table 5 gives the results for OLS regressions for KCM and VTA. Four regression results are reported in this table. These are the base line OLS regressions comparing KCM and VTA because the variables are identical for the pairs of regressions. In the upper panels of Table 5, regressions using the Quarter Mile Dummy to capture the effect of P&R are reported. In the lower panels of Table 5 regressions using the Quarter Mile Capacity variable to capture the effect of P&R are reported.

Mineta T
ransportation Institute
32S
top-Level Results
Table 5. Ordinary Least Squares Stop-Level Regression Results for KCM and VTADependent Variable: AM Boardings KCM VTA
Independent Variables Coef.Robust Std. Err. t P>t
[95% Conf. Interval] Coef.
Robust Std. Err. t P>t
[95% Conf. Interval]
Number of Bus Lines 5.955272 0.8695442 6.85 0 4.25067 7.659874 1.553749 0.1944596 7.99 0 1.17242 1.935078
Quarter Mile Dummy 11.29876 2.191439 5.16 0 7.002795 15.59472 2.603722 0.4688241 5.55 0 1.684374 3.523071
Population Density per Square Mile within a quarter mile of a stop
0.0009723 0.000094 10.34 0 0.0007881 0.0011566 0.000097 0.0000143 6.79 0 0.000069 0.000125
Median Household Income within a quarter mile of a stop
-0.0000291 0.0000135 -2.16 0.031 -0.0000555 -2.70E-06 -0.00000594 0.00000163 -3.65 0 -0.00000913 -0.00000275
Total Number of Employed Persons within a quarter mile of a stop
0.0036785 0.0015098 2.44 0.015 0.0007187 6.64E-03 0.0005444 0.0002764 1.97 0.049 0.00000232 0.0010864
Constant -8.226792 2.245989 -3.66 0 -12.62969 -3.82389 -0.523463 0.3992922 -1.31 0.19 -1.306462 0.2595357
Number of obs
= 6,321 Number of obs
= 2,373
F(5, 6315) = 44.82 F(5, 2367) = 47.17
Prob > F = 0 Prob > F = 0
R-squared = 0.1438 R-squared = 0.152
Root MSE = 25.909 Root MSE = 2.9132

Mineta T
ransportation Institute
33S
top-Level Results
Dependent Variable: AM Boardings KCM VTA
Independent Variables Coef.Robust Std. Err. t P>t
[95% Conf. Interval] Coef.
Robust Std. Err. t P>t
[95% Conf. Interval]
Number of Bus Lines 5.64982 0.7929109 7.13 0 4.095446 7.204195 1.611726 0.1997048 8.07 0 1.220112 2.003341
Quarter Mile Capacity Dummy
0.0438956 0.0116719 3.76 0 0.0210147 0.0667765 0.0054681 0.0011113 4.92 0 0.0032889 0.0076472
Population Density per Square Mile within a quarter mile of a stop
0.0010106 0.0000927 10.9 0 0.0008288 0.0011924 0.0000987 0.0000146 6.78 0 0.0000701 0.0001273
Median Household Income within a quarter mile of a stop
-0.0000321 0.000014 -2.3 0.022 -0.0000595 -0.00000471 -0.00000611 0.00000162 -3.78 0 -0.00000929 -0.00000294
Total Number of Employed Persons within a quarter mile of a stop
0.0034447 0.0014507 2.37 0.018 0.0006008 0.0062886 0.0007274 0.0002762 2.63 0.009 0.0001858 0.0012689
Constant -7.576285 2.225762 -3.4 0.001 -11.93953 -3.213036 -0.7009497 0.396153 -1.77 0.077 -1.477792 0.0758931
Number of obs
= 6321 Number of obs
= 2373
F(5, 6315) = 46.9 F(5, 2367) = 49.68
Prob > F = 0 Prob > F = 0
R-squared = 0.1657 R-squared = 0.1468
Root MSE = 25.576 Root MSE = 2.9223
Table 5. Continued

Mineta Transportat ion Inst i tute
34Stop-Level Results
Coefficient estimates in OLS regressions are interpreted as marginal effects. That is, the coefficient on the variable “number of bus lines serving a stop” represents the effect on morning boardings of increasing the number of bus lines serving a stop by one, holding all other variables constant. The coefficient estimates in the upper panels of Table 5 say that increasing the number of bus lines serving a stop by one bus line will increase morning boardings at that stop by about six riders in King County and by about one and a half riders in Santa Clara County. Both coefficient estimates are statistically significant.
For the Quarter Mile Dummy, the coefficient estimates are 11.29876 for KCM and 2.603722 for VTA. Both coefficient estimates are statistically significant. The coefficient on this dummy variable has the standard interpretation as a marginal effect. The presence of a P&R lot within a quarter mile of a stop increases morning boardings at that stop by an average of 11.3 for KCM and by an average of 2.6 for VTA. (The average size of P&R lots differs in the two cases. For King County, the average sized P&R lot has 196 spaces; for Santa Clara County, the average sized P&R lot has 294 spaces. The average number of stops within a quarter mile of a P&R lot also differs between the two systems. For KCM there is an average of about six stops within a quarter mile of a P&R lot, while for VTA there is an average of almost eight stops within a quarter mile of a P&R lot. However, KCM has many more lots and many more stops within a quarter mile. About 9.5% of KCM stops are within a quarter mile of a P&R lot, while for VTA the corresponding figure is 7.9 %.)
As expected, increasing median household income has a negative effect on boardings. Apparently, higher income people prefer to drive a car rather than take the bus. Increasing median household income by $10,000 for households within a quarter mile of a bus stop decreases ridership by about one-third of a rider. An increase in median household income by the same amount in Santa Clara County would reduce ridership by six-hundredths of a rider. An increase of $10,000 in median household income is a larger percentage of average income in King County than in Santa Clara County. This observation suggests that it would be better to estimate these comparative effects in terms of elasticities (percentage changes in boardings for a given percentage change in income). This topic will be addressed when Poisson regressions are discussed. Population density and number of employees residing within a quarter mile of a bus stop both have positive and statistically significant effects on ridership.
The lower panels of Table 5 give the OLS regression results for the same dependent variable, but now the authors use a variable called the Quarter Mile Capacity variable to measure the effect of P&R. The coefficient estimates are essentially the same as for the upper panel, except for the coefficient on the Quarter Mile Capacity variable. For KCM, an increase of one space within a quarter mile of a stop increases boardings at that stop by 0.044 riders. For VTA, the corresponding increase is 0.0055 riders. Both coefficients are statistically significant.
In Table 6, the authors present the results of Poisson estimation of the model. This table presents four regression results. The upper panels compare Poisson regressions for KCM and VTA using the Quarter Mile Dummy. The bottom panels compare Poisson regressions for KCM and VTA using a standard distance-decay function with components representing capacity of the nearest P&R lot and distance to the nearest P&R lot.

Mineta T
ransportation Institute
35S
top-Level Results
Table 6. Poisson Regressions for KCM and VTA with Various Park-and-Ride VariablesKCM VTA
Boardings Coef.Robust Std. Err. z P>z [95% Conf. Interval] Boardings Coef.
Robust Std. Err. z P>z [95% Conf. Interval]
Number of Lines 0.157815 0.0200694 7.86 0 0.1184798 0.1971503 Number of Lines 0.4663701 0.0454978 10.25 0 0.377196 0.5555443
QuarterMileDummy 1.05605 0.1076717 9.81 0 0.8450175 1.267083 QuarterMileDummy 0.7546589 0.1062149 7.11 0 0.5464816 0.9628362
lnPopDens 0.4770794 0.0543236 8.78 0 0.3706072 0.5835517 lnPopDens 0.1952375 0.0476164 4.1 0 0.1019111 0.288564
lnMedHHInc -0.1290285 0.0706135 -1.83 0.068 -0.2674284 0.0093715 lnMedHHInc -0.3351254 0.074623 -4.49 0 -0.4813837 -0.188867
lnNumberEmployees 0.5071294 0.1614605 3.14 0.002 0.1906726 0.8235861 lnNumberEmployees 0.3458637 0.1059983 3.26 0.001 0.1381109 0.5536166
_cons -4.365956 1.25215 -3.49 0 -6.820125 -1.911787 _cons -0.1468349 1.280329 -0.11 0.909 -2.656233 2.362563
KCM VTA
Boardings Coef.Robust Std. Err. z P>z [95% Conf. Interval] Boardings Coef.
Robust Std. Err. z P>z [95% Conf. Interval]
Number of Lines 0.1702552 0.0207485 8.21 0 0.1295889 0.2109216 Number of Lines 0.4668109 0.0455926 10.24 0 0.3774509 0.5561708
lnParkingSpaces 0.0725646 0.024395 2.97 0.003 0.0247512 0.120378 lnParkingSpaces 0.0457416 0.0292318 1.56 0.118 -0.0115516 0.1030347
lnDIST_Nearest_PnR -0.2987086 0.0409151 -7.3 0 -0.3789008 -0.2185165 lnDIST_Nearest_PnR -0.1742338 0.0450712 -3.87 0 -0.2625717 -0.0858959
lnPopDens 0.5289155 0.0549829 9.62 0 0.4211511 0.63668 lnPopDens 0.1808069 0.0449739 4.02 0 0.0926596 0.2689542
lnMedHHInc -0.1674258 0.0671871 -2.49 0.013 -0.2991102 -0.0357414 lnMedHHInc -0.2537793 0.0731053 -3.47 0.001 -0.397063 -0.1104956
lnNumberEmployees 0.5615903 0.1649103 3.41 0.001 0.238372 0.8848086 lnNumberEmployees 0.3664808 0.1197535 3.06 0.002 0.1317683 0.6011934
_cons -2.485067 1.251699 -1.99 0.047 -4.938352 -0.0317833 _cons 0.220165 1.502881 0.15 0.884 -2.725427 3.165757

Mineta Transportat ion Inst i tute
36Stop-Level Results
In order to generate the most meaningful results, the authors used logarithmic transformations of population density, median household income, and number of workers within a quarter mile of a bus stop in all the Poisson regressions. The authors could not apply the logarithmic transformation to either the Quarter Mile Dummy or the Quarter Mile Capacity variable, because they take on zero values for some observations. In the bottom panels of Table 6, the authors replace the Quarter Mile Dummy with a more standard distance-decay function that allows us to use the logarithmic transformation for both the capacity and the distance components.
Starting with the upper panel of Table 6, the authors see that the presence of a P&R lot within a quarter mile of a stop leads to a 1.05% increase in boardings at that stop. Recall that for KCM there is an average of 4.7 stops within a quarter mile of a P&R lot, while for VTA there is an average of 6.5 stops within a quarter mile of a P&R lot. A 1% increase in density results in a 0.48% increase in boardings. Both results are highly statistically significant (z-values/t-stats of 9.81 and 8.78, respectively). By comparison, for VTA the presence of a P&R lot within a quarter mile of a stop leads to a 0.75% increase in boardings at that stop. A 1% increase in density results in a 0.2% increase in boardings. Both results are highly statistically significant (z-values/t-stats of 7.11 and 4.1, respectively) but less statistically significant than for KCM.
The problem with the Quarter Mile Dummy (or the Quarter Mile Capacity variable) is that it is truncated at a quarter of a mile. An alternative is to define a distance decay-variable of the form: Capacity divided by Distance. A logarithmic transformation of the right-hand side of the Poisson equation gives two new variables, ln(Capacity) and ln(Distance), the logarithms of Capacity and Distance, respectively. These are defined for all observations, and have standard elasticity interpretations. For KCM, the results of incorporating the distance-decay formulation are:
For each 1% increase in spaces, the number of boardings at a stop at the average distance from a P&R lot increases by 0.07%. The effect of increasing the number of spaces at a P&R lot by 1% is strongly influenced by the distance of the stop from the P&R lot. For each 1% increase in distance, the percent change in ridership at such a stop decreases by 0.3%. The effect of a 1% increase in population density is about a 0.53% increase in boardings at a stop within a quarter mile of a P&R lot. All the results are statistically significant with the results for distance and density especially so, suggesting that these variables are the most significant in determining the result.
For VTA the results are:
For each 1% increase in spaces, the number of boardings at a stop at the average distance from a P&R lot increases by 0.04%. The effect of increasing the number of spaces at a P&R lot by 1% is strongly influenced by the distance of the stop from the P&R lot. For each 1% increase in distance, the percent change in ridership at such a stop decreases by 0.17%. The effect of a 1% increase in population density is about a 0.18% increase in boardings at a stop within a quarter mile of a P&R lot. The results for distance and density are statistically significant, suggesting that these variables are the most significant in determining the result. The result for the number of spaces in a P&R is of the expected sign but not statistically significant.

Mineta Transportat ion Inst i tute
37
IX. INTERPRETATION OF STOP-LEVEL RESULTS
The coefficients from the stop-level analysis of KCM and VTA illustrate that parking availability is a stronger influence than residential density on the performance measure of boardings per stop. To see this, consider Table 7, which uses the regression results in the bottom panel of Table 5 to illustrate how nearby housing and parking influence boardings at bus stops. The third column in the table uses the reciprocal of the coefficient in the second column as the increment of the independent variable that increases boardings by one person.
For example, across the KCM system, using the increments in the third column, 23 more parking spaces within one quarter mile of an average bus stop have the same influence on boardings per stop as an increase in density of 990 more people per square mile for the housing within a quarter mile of the stop. This latter density number translates by geometry to 194 more people residing within the quarter mile radius. So in and around Seattle, 194 more people (or 97 couples) living near a stop have the equivalent effect of 23 commuter parking cars near the bus stop to access a ride. It is manifestly less costly to achieve parking space for 23 more cars near the stop than it is to build housing for 97 more couples, so the authors rate parking as more influential.
The comparative numbers for VTA adding one more rider at a stop are 18 more car parking spaces versus 199 more people (100 couples), so the influence gap is even larger than in Seattle, where 23 parking spaces had the same influence as housing for 97 couples. Therefore, in the San Jose region, compared to the Seattle region, parking appears to be even more influential than nearby housing for attracting bus riders.
Table 7. Calculating Incremental Impacts of Various VariablesIncrement of independent variable to Increase boardings by One Person
Mean Value(Appendix C)
Coefficient(Table 5) (Reciprocal of the Coefficient)
King County Metro Number of Bus Lines 1.5825 5.65 0.2
Number of Parking Spaces within 1/4 Mile
24.1 0.0439 22.8
Population Density within 1/4 Mile 5,839.187 0.00101 990.1
Constant -7.58
AM Boardings per Stop 10.11
VTANumber of Bus Lines 1.22 1.612 0.1
Number of Parking Spaces Within 1/4 Mile
22.7 0.00547 18.3
Population Density within 1/4 Mile 7,599 0.0000987 1,013.2Constant -0.7AM Boardings per Stop 2.21

Mineta Transportat ion Inst i tute
38Interpretation of Stop-Level Results
Details and further explorations of the relative importance of P&R compared to other variables, especially density, are provided in Appendix D.

Mineta Transportat ion Inst i tute
39
X. ROUTE-LEVEL RESULTS
In this section the authors present results of route-level regressions. The authors will discuss the results of the route-level analysis one transit system at a time. The dependent variable in all these regressions is boardings per revenue hour associated with the route.
ROUTE-LEVEL ANALYSIS AND INFLUENCE VARIABLES
Several variables above have been called “influence” variables, most notably the P&R Influence variable. These influence variables arise from using neighborhood or stop-level data in a route-level analysis. P&R lots are associated with catchment areas about which the authors have some demographic and economic data. For example, the clientele of a particular P&R lot may come from several identifiable suburban areas. American Community Survey (ACS) data can be used to estimate the total number of residents in such an area who are employed. Total employees in the catchment area of a P&R lot can be used as a characteristic of the P&R lot, and also as a characteristic of routes that serve that P&R lot.
Likewise, specific stops can be associated with a P&R lot (say, those stops within walking distance of it). Stop-level data provides us with boardings by stop and by route. For a specific route, the authors can determine the fraction of total boardings along the route (at a particular time and in a particular direction) that arise from stops associated with a P&R lot. This would allow us to construct a variable associated with the route that represents the total fraction of boardings at a particular time and in a particular direction that arise from stops close to P&R lots.
The authors can construct more refined “influence” variables – variables that account for some characteristics of the P&R lots, such as the total number of spaces in the lot.
The advantage of route-level analysis is that it can be cast directly in terms of what transit agency policy makers view as a key performance measure: boardings per revenue hour. There are, however, several disadvantages. There are fewer routes than stops, so compared to stop-level analysis, route-level analysis will always involve fewer observations (scores of observations as opposed to thousands of observations). Also, while it is possible to construct a variety of “influence” variables, these variables do not always have straightforward interpretations in the analysis. With any such influence variable, basically non-route data is being forced into a route mold.
The results for King County Metro, Valley Transportation Authority, Los Angeles Metro, Community Transit of Snohomish County, and Pierce Transit are presented in this section.
KING COUNTY METRO
The influence Park-and-Ride for King County Metro as measured by the total number of spaces at P&R lots that a bus passes turns out to be statistically significant. The authors incorporate a quadratic term in the P&R variable to account for any nonlinearities. Other variables include the speed of the bus and a dummy variable for the type of service. All

Mineta Transportat ion Inst i tute
40Route-Level Results
the coefficient estimates are statistically significant (using robust standard errors) and are of the expected sign. The result is given in Table 8:
Table 8. Route-Level Regression for KCMLinear regression Number of obs = 177
F(4, 172) = 40.06Prob > F = 0R-squared = 0.4529Root MSE = 17.107
RobustBoardingsperRevHr Coef. Std. Err. t P>t [95% Conf. Interval]
MPH -1.083738 0.3519573 -3.08 0.002 -1.77845 -0.3890265TotalREG_SPACES -0.022046 0.0101466 -2.17 0.031 -0.0420739 -0.0020182TotalREG_SPACES_Sqrd 0.0000143 6.06E-06 2.36 0.019 2.35E-06 0.0000263SeattleCoreDummy 25.00968 2.82017 8.87 0 19.44308 30.57628_cons 53.88109 4.879703 11.04 0 44.24928 63.5129
The service to the Seattle core has about 25 more boardings per revenue hour than non-Seattle core service, other factors held constant. A decrease of one mile per hour on the bus route decreases boardings per revenue hour by about one.
The effect of the total number of P&R spaces along the route is harder to interpret, because the variable enters as a quadratic. To determine the marginal effect (the effect of one additional space along the route), the quadratic is graphed as a function of total spaces in Figure 9.
-10
-8
-6
-4
-2
0
2
4
6
0 500 1000 1500 2000
Addi
tiona
lBoa
rdin
gsp
erR
even
ueH
our
TotalNumberofSpacesinPark-and-RideLotsAlongtheRoute
Impact
Figure 9. The Marginal Effect of Park-and-Ride Capacity for KCM

Mineta Transportat ion Inst i tute
41Route-Level Results
So, roughly, P&R capacity has a positive effect when the bus route passes P&R lots with a capacity of about 1,500 or more. Which routes are those?
It turns out that the routes in the Seattle area that have P&R capacity of 1,500 and above are in the bus routes numbered 200, that is, those that serve the Eastside suburbs of Seattle.33 These routes are analyzed separately in the next section.
FOCUSED CASE STUDY: KING COUNTY METRO TRANSIT
P&R is an important form of transit access in the Seattle suburbs. Sixty-two percent of suburban transit customers east of Lake Washington used P&R in the last 30 days before the date of a 2014 survey. Thirty-nine percent of surveyed customers across all parts of the greater Seattle service area used P&R.34
The regional Metropolitan Planning Organization, Puget Sound Regional Council, reports that since 2010, “Park and Rides fill earlier and more frequently.”35
Figure 10, a Metro route map with the City of Seattle on the left and the Eastside suburbs on the right, shows all the Metro bus stops that experienced over 250 boardings in the morning peak period in spring 2014. Green numbers are morning boardings divided by 10. Across Lake Washington, east from the City of Seattle, large P&R facilities are prominent among highly used suburban bus stops, with parking capacities shown in red.
Figure 10. Seattle and East King County Bus Stops with More Than 250 A.M Peak Boardings
The authors chose the 53 King County Metro Eastside routes as the target for exploration of P&R influence on productivity because of data availability and the authors’ personal knowledge that P&R is well used in this part of the Puget Sound region. Also, there is

Mineta Transportat ion Inst i tute
42Route-Level Results
evidence from the analysis earlier in this report that the routes serving the Seattle eastern suburbs are those most influenced by P&R availability. Most of the lots in this sector are filled to capacity before the morning peak period is over. The authors’ data included the 200 series of Metro routes; eight Sound Transit 500 series regional routes operated by Metro under a contract with the Sound Transit multi-county regional transit agency; and one of Metro’s arterial BRT routes, RapidRide B in the City of Bellevue.
As before, boardings per service hour are selected as the productivity performance measure, a well recognized ratio of production to resources. The focus is on analyzing morning peak inbound runs from residential areas to urban centers as a likely indicator of all-day P&R influence, since the typical and overwhelmingly common pattern of usage is all-day parking beginning in the morning.
The authors sought out how to measure the influence of P&R on ridership of each particular route in a more precise way than that used in the study of all the King County Metro routes, described above. The focus was on the morning peak direction, meaning from lower-density residential areas toward employment centers such as downtown Seattle, downtown Bellevue, and the University of Washington main campus. The authors started by simply creating a dummy variable: routes that went by P&R lots were coded as “1” and those that did not as “0.” While using this dummy variable picked up some influence, at the urging of King County Transit staff the authors dug deeper to measure the percentage of ridership on a route that is collected at the bus stops next to P&R facilities, which was then set as the P&R Influence Variable. That number could range in theory from zero if the route did not serve any P&R lots, to 100 percent if all the passengers on a route boarded at the parking lot. In fact, after examining boardings at every P&R lot, this measure ranged from zero to 97 percent. Twelve of the 53 routes in the data set did not pass by significant P&R facilities. Forty-one routes passing by P&R facilities of more than 100 spaces had influence measures between two percent and 97 percent. Table 9 shows the value of the P&R influence variable for the entire sample of 53 Routes.
Table 9. Park-and-Ride Influence Variable for 53 KCM RoutesRoute Coding Route Coding Route Coding Route Coding 200 0.00 218 0.86 243 0.00 271 0.14 201 0.00 219 0.67 244 0.26 277 0.32 202 0.17 221 0.00 245 0.02 522 (ST) 0.49 203 0.00 224 0.18 246 0.00 540 (ST) 0.58 205 0.25 226 0.00 248 0.22 542 (ST) 0.59 208 0.00 232 0.36 249 0.10 545 (ST) 0.60 209 0.02 234 0.17 250 0.00 550 (ST) 0.52 210 0.61 235 0.30 252 0.47 554 (ST) 0.84 211 0.61 236 0.03 255 0.38 555 (ST) 0.75 212 0.97 237 0.40 257 0.42 556 (ST) 0.74 214 0.88 238 0.07 260 0.00 672 (RR-B) 0.13 215 0.40 240 0.00 265 0.46 216 0.60 241 0.17 268 0.69 217 0.00 242 0.26 269 0.19

Mineta Transportat ion Inst i tute
43Route-Level Results
Metro staff mentioned that the influence being measured would also blend in customers who did not drive a vehicle to the P&R lot, but rather walked from nearby housing, or rode a bicycle. In fact, Metro has lately been pursuing a policy of encouraging transit customers to arrive with passengers in their vehicle. This point slightly obscures the influence of car drivers using P&R lots compared to other ways of arriving, but the main point is the aggregation of customers ready to ride at a limited number of places, no matter how they reach the collection points.
Figure 11. Bus Route Productivity in East King County, Washington
The correlation of the P&R influence variable with the productivity measure is 0.68, and P&R influence alone explains 47% of the variation in boardings per service hour, as shown in Figure 11.
In order to explain more of the influences on boardings per service hour, the authors experimented with adding other variables to the regression analysis. Through trial and error they found two other variables for a linear equation that estimates annualized peak period boardings per revenue hour. The additional variables are all-day boardings per route mile and bus stops per mile over the entire route of the bus.
The authors expected all-day boardings per route mile to push up boardings per service hour since this is a simple measure of ridership proportional to the length of the route. Bus stops per mile were expected to drive down boardings per service hour, because small numbers of passengers spread over many bus stops would tend to slow the speed of the bus. In the case of both variables, this is how the equation turned out.

Mineta Transportat ion Inst i tute
44Route-Level Results
When the authors ran all three of the variables in a linear regression calculation, the adjusted R-squared equaled 0.90 with all the coefficients of the equation statistically significant at p<.01 and the constant significant at p<0.1. This is the strongest model found across all five of the case-study agencies.
The model developed for the 53 King County Metro routes was as follows:
5 𝐴𝐴𝐴𝐴𝐴𝐴𝐴𝐴𝐴𝐴𝐴𝐴𝐴𝐴𝐴𝐴𝐴𝐴𝐴𝐴𝑝𝑝𝐴𝐴𝐴𝐴𝑝𝑝𝑝𝑝𝐴𝐴𝑝𝑝𝐴𝐴𝑝𝑝𝐴𝐴𝑏𝑏𝑝𝑝𝐴𝐴𝑝𝑝𝐴𝐴𝐴𝐴𝐴𝐴𝑏𝑏𝑏𝑏𝑝𝑝𝐴𝐴𝑝𝑝ℎ𝑝𝑝𝐴𝐴𝑝𝑝= 𝛽𝛽$ + 𝛽𝛽& 𝐴𝐴𝐴𝐴𝑃𝑃𝐴𝐴𝑝𝑝𝑝𝑝− 𝐴𝐴𝐴𝐴𝐴𝐴− 𝑅𝑅𝐴𝐴𝐴𝐴𝐴𝐴𝐼𝐼𝐴𝐴𝐼𝐼𝐴𝐴𝐴𝐴𝐴𝐴𝐴𝐴𝐼𝐼𝐴𝐴𝐹𝐹𝑝𝑝𝐴𝐴𝐼𝐼𝐹𝐹𝐴𝐴𝑝𝑝𝐴𝐴+𝛽𝛽( 𝐴𝐴𝐴𝐴𝐴𝐴− 𝐴𝐴𝐴𝐴𝑑𝑑𝑏𝑏𝑝𝑝𝐴𝐴𝑝𝑝𝐴𝐴𝐴𝐴𝐴𝐴𝑏𝑏𝑏𝑏𝑝𝑝𝐴𝐴𝑝𝑝𝑝𝑝𝑝𝑝𝐴𝐴𝐹𝐹𝐴𝐴𝑚𝑚𝐴𝐴𝐴𝐴𝐴𝐴+ 𝛽𝛽) 𝑆𝑆𝐹𝐹𝑝𝑝𝑝𝑝𝑏𝑏𝑝𝑝𝐴𝐴𝑝𝑝𝑚𝑚𝐴𝐴𝐴𝐴𝐴𝐴𝑝𝑝𝑜𝑜𝐴𝐴𝑝𝑝𝐴𝐴𝐴𝐴𝐹𝐹𝐴𝐴𝑝𝑝𝐴𝐴𝑝𝑝𝑝𝑝𝐴𝐴𝐹𝐹𝐴𝐴 + 𝜖𝜖
where
𝛽𝛽! = 7.9, 𝛽𝛽! = 16.6, 𝛽𝛽' = 15.5, and 𝛽𝛽! = −2.4.
The constant can be considered to provide an estimate of other undetermined influences on bus service productivity as measured by boardings per service hour.
ECONOMIC CONSEQUENCE OF HIGHER PRODUCTIVITY FROM TRANSIT ACCESS AT P&R LOTS
Going further, the authors realized that the model of P&R influence on the productivity measured in boardings per bus service hour permits a calculation of what P&R is worth in dollar terms as a means of aggregating passengers.
The coefficient on P&R influence, when multiplied by the value of the influence variable for each route, represents the marginal P&R contribution to boardings per service hour.
Here is an example of how the model equation can be interpreted for one route: for Metro route 210, with P&R generating 61% of the morning peak customers, the data reveal that this line achieved 44.5 boardings per service hour across 2,288 service hours in a year. The marginal influence of P&R from the coefficient of 16.6 on P&R influence in the regression estimation is 10.2 boardings per service hour, that is, 16.6 times 61%. These 10.2 boardings per service hour over the course of a year is equivalent to saving 678 service hours.36
Let X be the number of hours of saving, which is already stated as 678 service hours. To derive this number, the problem at hand is to solve for X where
6 𝐻𝐻+𝑋𝑋 ∗ 𝑃𝑃1 − 𝑃𝑃2 = 𝐻𝐻 ∗ 𝑃𝑃1
P1 = 44.48 boardings per hour
P2 = 10.17boardings per hour
H = 2,288 hours

Mineta Transportat ion Inst i tute
45Route-Level Results
By algebraic manipulation,
7 𝑋𝑋 =
𝐻𝐻𝐻𝐻2(𝐻𝐻1 − 𝐻𝐻2).
After substituting data for variables, X = 678.2
For this one Metro route, when 678 hours of saving is multiplied by the $262-per-service-hour operating cost of route 210, the annual dollar savings for this one route from P&R -influenced operations is $178,000.
The contribution of the 41 routes sums to 49,562 service hours saved in reaching the overall ridership achieved. The multiplication of the service hours array for the 41 routes where there is P&R influence multiplied by the cost per hour array for the same 41 routes yields an array of cost savings that sum to approximately $17 million.
Summing across all the routes, 49,562 service hours are saved annually by the 41 routes out of 53 stopping at P&R facilities. These hours are worth $17 million using available Metro cost data. In other words, if the beneficial impact of the P&R facilities were not present, instead of $95 million actually spent, $112 million in service hours would be spent on the 53 routes. The $17 million difference is 15% of $112 million.
This theoretical saving would be realized to the degree that existing service to customers by operating buses through dispersed neighborhoods were replaced with more service from P&R facilities. On the margin, bus VMT would be reduced, because the buses would have fewer miles traveling in residential areas. Private vehicle VMT would rise as more bus customers drive to P&R facilities rather than wait to be picked up by a bus closer to home. The public policy trade-off of reduced public transit VMT for more private VMT would have to be considered in assessing the public costs and benefits of emphasizing P&R-based service.
SANTA CLARA VALLEY TRANSPORTATION AUTHORITY, SAN JOSE, CALIFORNIA
The authors estimated a regression using route-level productivity data for bus service for VTA. Speed by route data was not available. The route-level regression for VTA is given in Table 10.

Mineta Transportat ion Inst i tute
46Route-Level Results
Table 10. VTA Route-Level RegressionLinear regression Number of obs = 57
F(4, 52) = 18.79Prob > F = 0R-squared = 0.3745Root MSE = 5.8278
Robust
BoardingsperRevHr Coef. Std. Err. t P>t [95% Conf. Interval]
TotalQUANTITY 0.0025932 0.0073608 0.35 0.726 -0.0121773 0.0173636TotalQUANTITYSqurd -4.62E-06 6.08E-06 -0.76 0.451 -0.0000168 7.59E-06Service Type: Core 8.324875 1.516724 5.49 0 5.281347 11.3684Service Type: Limited -4.515359 1.59985 -2.82 0.007 -7.725694 -1.305024_cons 19.48711 1.773885 10.99 0 15.92755 23.04667
Type of service is very statistically significant. The holdout category for bus service is community buses. Neither of the terms associated with total P&R spaces along the route is statistically significant. In a regression with just the linear term for total P&R spaces, the coefficient estimate is also not statistically significant.
In explaining the lack of structural similarity in the empirical analysis of the two case studies, the authors note that the overall reported bus boardings per service hour in the most recent National Transit Database summary (2013) shows VTA at 27, while King County Metro (KCM) is 33 percent higher at 36 boardings per service hour. In other words, VTA buses operate at a lower level of productivity which may be based on less use of buses by car drivers compared to KCM, a difference that in turn comes from lower availability of parking spaces at VTA (1,448 per 100,000 workers) than at KCM (1,624 per 100,000 workers), as reported above. Also, parking in the VTA network is more supportive of light rail access at multiple stations than is the case with KCM, where only one P&R serves light rail access.
Most of the larger P&R facilities are aligned along the Gilroy-Morgan Hill-San Jose corridor, which is also served by the CalTrain commuter rail. Other P&R lots serve VTA’s light rail lines as well as the bus routes, which apparently confounds the interpretation of P&R influence on bus boardings per service hour. Another issue for data analysis is that a number of bus lines in the morning peak period pass through and go beyond the most important work center destinations like downtown San Jose, so that the ridership of a line in the morning represents the daily peak for part of the route, and off peak for the tail of the route. So while the stop-level analysis revealed an influence of parking on ridership, we did not find an influence on route productivity.

Mineta Transportat ion Inst i tute
47Route-Level Results
LOS ANGELES COUNTY METRO
In this section the authors present route-level results for LA Metro. The focus is on local bus service for which boardings per service hour and ridership data are available. The average daily ridership data are from December 2014. The authors employ both OLS and Poisson regressions using alternative dependent variables of boardings per service hour and average daily boardings. Also employed are alternative measures of P&R influence: the total number of P&R spaces at stops within a quarter mile of stops along the bus route and the total number of P&R lots along the bus route.
First OLS results using boardings per revenue hour are considered as the dependent variable. The results with total spaces along the route (entered as a quadratic term) are:
Table 11. OLS Regression with Boardings per Revenue Hour as Dependent Variable and Total Park-and-Ride Spaces along Route as Park-and-Ride Influence Variable
Linear regression Number of obs = 30F(3, 26) = 11.53Prob > F = 0.0001R-squared = 0.2862Root MSE = 10.452
RobustBperRH Coef. Std. Err. t P>t [95% Conf. Interval]
TotalSPACENum 2.00E-02 4.07E-03 4.91 0 1.16E-02 2.83E-02TotalSPACENumSqrd -4.82E-06 8.90E-07 -5.41 0 -6.65E-06 -2.99E-06RouteLengthMi -0.4367271 0.2468826 -1.77 0.089 -0.9442015 0.0707473_cons 58.08789 9.41299 6.17 0 38.73921 77.43656
The coefficient estimates on the P&R variables are very statistically significant, and the coefficient on the route length in miles is nearly statistically significant. The route length coefficient is negative and indicates that an increase in route length of one mile decreases boardings per revenue hour by 0.44.
The impact of increasing the total P&R spaces available along a route is given by the following graph.
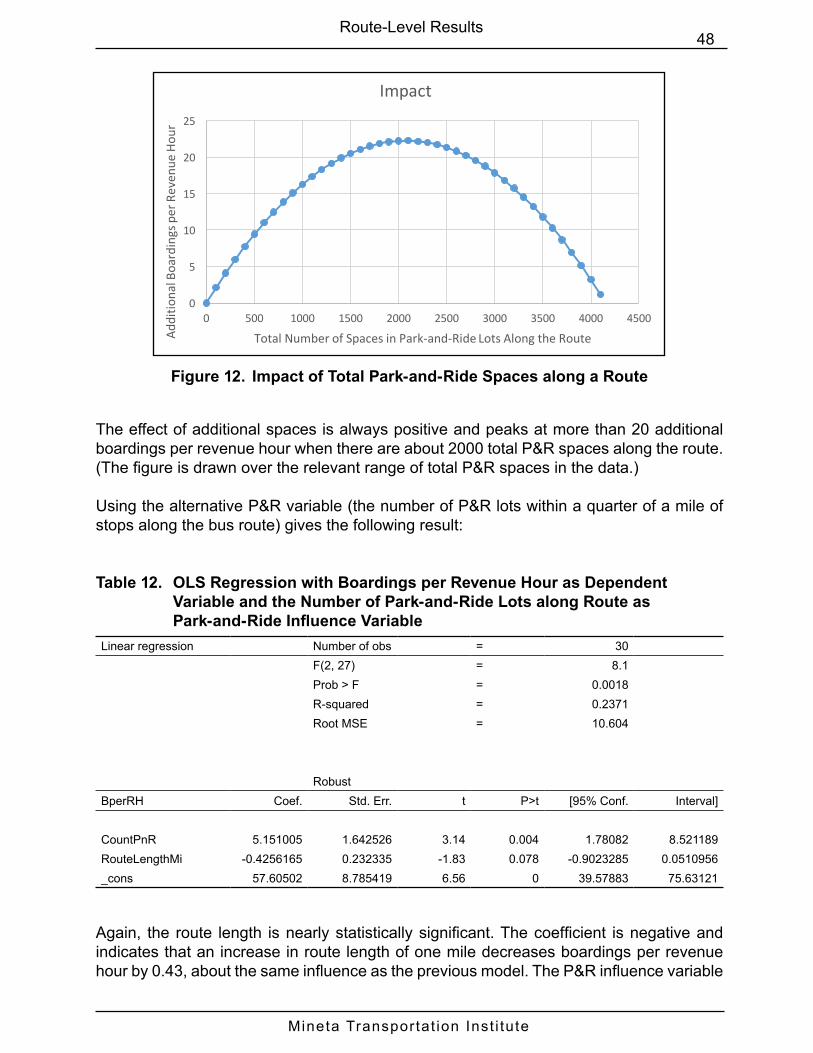
Mineta Transportat ion Inst i tute
48Route-Level Results
0
5
10
15
20
25
0 500 1000 1500 2000 2500 3000 3500 4000 4500
Addi
tiona
lBoa
rdin
gsp
erR
even
ueH
our
TotalNumberofSpacesinPark-and-RideLotsAlongtheRoute
Impact
Figure 12. Impact of Total Park-and-Ride Spaces along a Route
The effect of additional spaces is always positive and peaks at more than 20 additional boardings per revenue hour when there are about 2000 total P&R spaces along the route. (The figure is drawn over the relevant range of total P&R spaces in the data.)
Using the alternative P&R variable (the number of P&R lots within a quarter of a mile of stops along the bus route) gives the following result:
Table 12. OLS Regression with Boardings per Revenue Hour as Dependent Variable and the Number of Park-and-Ride Lots along Route as Park-and-Ride Influence Variable
Linear regression Number of obs = 30F(2, 27) = 8.1Prob > F = 0.0018R-squared = 0.2371Root MSE = 10.604
RobustBperRH Coef. Std. Err. t P>t [95% Conf. Interval]
CountPnR 5.151005 1.642526 3.14 0.004 1.78082 8.521189RouteLengthMi -0.4256165 0.232335 -1.83 0.078 -0.9023285 0.0510956_cons 57.60502 8.785419 6.56 0 39.57883 75.63121
Again, the route length is nearly statistically significant. The coefficient is negative and indicates that an increase in route length of one mile decreases boardings per revenue hour by 0.43, about the same influence as the previous model. The P&R influence variable

Mineta Transportat ion Inst i tute
49Route-Level Results
is statistically significant and indicates that the addition of a P&R lot of average size along a route increases boardings per revenue hour by just over 5.
Regression analysis of influence on the numerator of the ratio boardings per revenue hour, namely, Average Daily Boardings, reveals that it is the driver of productivity. The data on Average Daily Boardings are counts as opposed to ratios, so Poisson regression can be used in addition to OLS.
Using Average Daily Ridership as the dependent variable and total spaces along the route as the P&R influence variable (analogous to the treatment for boardings per revenue hour above), this result is obtained:
Table 13. OLS Regression with Average Daily Riders as Dependent Variable and Total Park-and-Ride Spaces along Route as Park-and-Ride Influence Variable
Linear regression Number of obs = 30F(3, 26) = 5.44Prob > F = 0.0049R-squared = 0.2287Root MSE = 5830.1
RobustAvgDailyRiders Coef. Std. Err. t P>t [95% Conf. Interval]
TotalSPACENum 10.7197 3.199432 3.35 0.002 4.143173 17.29623TotalSPACENumSqrd -0.0026654 0.0007442 -3.58 0.001 -0.0041952 -0.0011356RouteLengthMi -47.34366 135.6041 -0.35 0.73 -326.0819 231.3946_cons 11446.64 4943.421 2.32 0.029 1285.295 21607.99
In this case the P&R influence variables are statistically significant, and the route length variable is insignificant. The coefficient values are much larger than was the case for boarding per revenue hour, but that is because the ridership variable is orders of magnitude larger (as indicated by the descriptive statistics). The P&R impact is indicated in the following graph.

Mineta Transportat ion Inst i tute
50Route-Level Results
-2000
0
2000
4000
6000
8000
10000
12000
0 500 1000 1500 2000 2500 3000 3500 4000 4500
Aver
age
Daily
Rid
ers
TotalNumberofSpacesinPark-and-RideLotsAlongtheRoute
Impact
Figure 13. Impact of Total Park-and-Ride Spaces along a Route
The figure looks very similar to Figure 12. However, note that the vertical axis has different units: total boardings instead of boardings per revenue hour. Again, adding P&R spaces along a route yields positive additions to ridership over the relevant range, with a peak at about 2000 spaces, the same maximum point as with boardings per revenue hour as the dependent variable.
The regression using the number of P&R lots along a route gives:
Table 14. OLS Regression with Average Daily Riders as Dependent Variable and Number of Park-and-Ride Lots along Route as Park-and-Ride Influence Variable
Linear regression Number of obs = 30F(2, 27) = 2.73Prob > F = 0.0832R-squared = 0.1257Root MSE = 6091.1
RobustAvgDailyRid~s Coef. Std. Err. t P>t [95% Conf. Interval]
CountPnR 2308.35 1006.893 2.29 0.03 242.377 4374.323RouteLengthMi -27.08647 133.6691 -0.2 0.841 -301.3529 247.1799_cons 10976.15 4748.821 2.31 0.029 1232.375 20719.93

Mineta Transportat ion Inst i tute
51Route-Level Results
The coefficient estimate on the number of P&R lots along a route is positive and statistically significant, and indicates that an additional average-sized P&R lot along the route contributes over 2300 additional daily riders.
The Poisson regression results are given in the table below.
Table 15. Poisson Regression with Average Daily Riders as Dependent Variable and Total Park-and-Ride Spaces along Route as Park-and-Ride Influence Variable
Poisson regression Number of obs = 30Wald chi2(3) = 25.23Prob > chi2 = 0
Log pseudolikelihood = -43802.292 Pseudo R2 = 0.1844
RobustAvgDailyRiders Coef. Std. Err. z P>z [95% Conf. Interval]
TotalSPACENum 0.0007728 0.0002067 3.74 0 0.0003676 0.0011779TotalSPACENumSqrd -1.93E-07 4.64E-08 -4.17 0 -2.84E-07 -1.02E-07RouteLengthMi -0.0040831 0.0121965 -0.33 0.738 -0.0279878 0.0198217_cons 9.347731 0.4394227 21.27 0 8.486478 10.20898
Again, the results indicate a statistically significant effect of total P&R spaces along the route. The probability of adding a boarding along the route by adding a P&R space is given in Figure 14.
00.10.20.30.40.50.60.70.80.9
1
0 500 1000 1500 2000 2500 3000 3500 4000 4500
Prob
abili
tyo
fAdd
ition
alB
oard
ing
Alon
ga
Rout
e
TotalNumberofSpacesinPark-and-RideLotsAlongtheRoute
Impact
Figure 14. Impact of Total Park-and-Ride Spaces along a Route Based on Poisson Regression

Mineta Transportat ion Inst i tute
52Route-Level Results
COMMUNITY TRANSIT, SNOHOMISH COUNTY RESULTS
For Community Transit, OLS regression was used on all of the agency’s 49 AM peak routes, including six operated for Sound Transit, the regional mass transit agency. After experimentation with several models, the best fit found for explaining boardings per service hour is the equation
8 𝐵𝐵𝐵𝐵𝐵𝐵𝐵𝐵𝐵𝐵𝐵𝐵𝐵𝐵𝐵𝐵𝐵𝐵𝑝𝑝𝑝𝑝𝐵𝐵𝐵𝐵𝑝𝑝𝐵𝐵𝑠𝑠𝐵𝐵𝑠𝑠𝑝𝑝ℎ𝐵𝐵𝑜𝑜𝐵𝐵 = 18.1 + 11.5 ∗ 𝑃𝑃&𝑅𝑅𝑅𝑅𝐵𝐵𝑅𝑅𝑅𝑅𝑜𝑜𝑝𝑝𝐵𝐵𝑠𝑠𝑝𝑝
where P&R influence is measured simply by a dummy variable, zero or one, signifying whether a route explicitly serves one of the listed P&R facilities named by the Community Transit agency, coded as a one. This variable was coded one for 36 of the 49 routes. The regression equation indicates that a route serving P&R exhibits a boarding per service hour that is 11.5 higher than routes that don’t serve P&R. The R squared for this equation is 0.16, and both the P&R coefficient and the constant were highly significant, as well as the entire equation as signified by F=8.7, p=.005.

Mineta T
ransportation Institute
53R
oute-Level Results
Table 16. Regression Summary, Community Transit, AM Peak Route SampleSUMMARY OUTPUT AM peak group
Regression StatisticsMultiple R 0.395677512R Square 0.156560693Adjusted R Square 0.138615176Standard Error 11.99289398Observations 49
ANOVAdf SS MS F Significance F
Regression 1 1254.800681 1254.800681 8.724222979 0.004891571Residual 47 6759.986782 143.829506Total 48 8014.787464
Coefficients Standard Error t Stat P-value Lower 95% Upper 95% Lower 95.0% Upper 95.0%Intercept 18.14008306 3.326230322 5.45364611 1.78788E-06 11.44857087 24.83159524 11.44857087 24.83159524X Variable 1 11.46205496 3.880602042 2.953679566 0.004891571 3.655290741 19.26881917 3.655290741 19.26881917

Mineta Transportat ion Inst i tute
54Route-Level Results
PIERCE TRANSIT RESULTS
With Pierce Transit, the authors again were limited in data available, but did code all 50 AM routes for P&E influence, including the 14 series 500 routes operated under a contract from Sound Transit. We examined bus routes and rated those that served P&R lots as “1” and those that did not as “0.” The authors examined all the routes and found that 29 of them served P&R facilities. The authors again used an OLS model equation for boardings per service hour, leading to the following result.
9 𝐵𝐵𝐵𝐵𝐵𝐵𝐵𝐵𝐵𝐵𝐵𝐵𝐵𝐵𝐵𝐵𝐵𝐵𝑝𝑝𝑝𝑝𝐵𝐵𝐵𝐵𝑝𝑝𝐵𝐵𝑠𝑠𝐵𝐵𝑠𝑠𝑝𝑝ℎ𝐵𝐵𝑜𝑜𝐵𝐵 = 18.4 + 4.2 ∗ 𝑃𝑃&𝑅𝑅𝑅𝑅𝐵𝐵𝑅𝑅𝑅𝑅𝑜𝑜𝑝𝑝𝐵𝐵𝑠𝑠𝑝𝑝
In this case, the R-squared was 0.06, and the coefficient for P&R influence was positive but statistically significant only at the level of p=.08, t=1.8. The constant was highly significant at t=10.2. The complete equation showed F=3.2 with a significance of p=.08

Mineta T
ransportation Institute
55R
oute-Level Results
Table 17. Regression Summary, Pierce Transit, AM Peak Route SampleSUMMARY OUTPUT
Regression StatisticsMultiple R 0.251109R Square 0.06305573Adjusted R Square 0.043536057Standard Error 8.221750868Observations 50
ANOVAdf SS MS F Significance F
Regression 1 218.3638082 218.3638082 3.230368257 0.078576913Residual 48 3244.664992 67.59718733Total 49 3463.0288
Coefficients Standard Error t Stat P-value Lower 95% Upper 95% Lower 95.0% Upper 95.0%Intercept 18.37619048 1.794133128 10.24237844 1.14963E-13 14.76884411 21.98353684 14.76884411 21.98353684P&R scoring 4.234154351 2.355812212 1.797322524 0.078576913 -0.50252348 8.970832182 -0.50252348 8.970832182

Mineta Transportat ion Inst i tute
56
XI. SUMMARY WITH CONCLUSIONS AND IMPLICATIONS
The authors have developed through this research some quantitative methods to link the existence and influence of P&R facilities to transit performance measures, in particular, boardings per service hour. As the proportion of riders on a bus coming from P&R facility rises, it appears from this evidence that in some agencies, boardings per revenue hour rise.
P&R service, including the effect of customers who arrive at P&R collection points by other means than a parked car, can be more cost-effective in generating bus ridership in a suburban setting than service that does not take advantage of P&R. The authors showed this for four case studies out of five. There was evidence of potential for savings in the three Seattle area bus systems, and with Los Angeles Metro. The result was not so clear for Santa Clara Valley Transportation Authority.
Where the P&R differential influence can be shown, the quantified measure of economic benefit for the operations of a transit agency may spur management interest in expanding and improving P&R service to grow transit ridership within the market of frustrated commuters who seek but cannot find space to park in P&R lots, as the authors showed for a set of suburban routes of King County Metro.
At the same time, the strong demand for P&R suggests customers may be willing to pay for it, especially if high-quality amenities were to be included, such as guaranteed access to a parking spot in the lot, a short walk to the bus, and a guaranteed seat on the bus.
Transit agencies often view P&R as an expensive source of riders. For example, transit officials in Seattle mention a range of thirty to fifty thousand dollars to build each structured parking space. Non-motorized access, for example, walking and bike access from close to where the bus stops, is better for the environment than driving from farther away. However, given the reality of how urban regions disperse, and given the popularity of P&R, agency and societal objections to a supply of parking spaces that keeps up with demand can perhaps be mitigated. That this type of access can be shown to have a quantifiable financial benefit from increasing the productivity of bus service is a useful first step in mitigation.
Additional elements of mitigation for sustainably expanding P&R include the following.
• Give special treatment for smaller, cleaner cars, to motivate purchase of such vehicles by transit customers. The pollution, safety, and congestion negatives of cars are subject to extensive regulation-driven mitigation via improved technology over the coming decades.37
• Require users to pay to park in exchange for receiving additional amenities, like a parking space closer to the bus stop and a guaranteed seat on the bus. In Seattle, P&R parking has been traditionally free; in California, there is a mix of free and paid parking across P&R facilities.
• Provide incentives for vehicles with multiple passengers.

Mineta Transportat ion Inst i tute
57Summary with Conclusions and Implications
Although transit agencies may not be in a position to fund P&R expansion out of their current funding stream, the authors note that customer parking fee payments providing a return on private investment capital for expanded P&R construction is a potential mechanism for more capacity on the urban fringe.
The authors have created a parking fee estimator38 that calculates a total daily fee to cover the repayment of a construction loan plus a daily maintenance fee for a structured parking space such as would be found in a new P&R facility. For example, assuming $30,000 borrowed at 5% interest over 30 years to construct a parking space and $500 per year to manage and maintain it, including cleaning, security, and daily parking fee collection, the fee estimator shows that a daily fee of $10.24 would cover costs over 250 annual work days at 95% occupancy. The fare to ride the bus is not included. Because a price to park at this level may be a shock compared to a previous environment of free or nominally priced parking, this level would only work if it provided a significant discount from downtown parking fees, and furthermore supported features such as watchful security preventing car break-ins and guaranteed seating on the bus.
Other assumptions can be tested, and the authors have found that the parking fee under a range of assumptions is likely less than the price of parking in a city downtown such as Seattle or San Jose. Of course, to attract customers, the P&R fee combined with the transit fare would have to provide an attractive alternative to competition from private vehicle modes that have a price defined by many exogenous component price levels beyond parking, such as for gasoline or for fees to join a car pool. At the same time, even assuming the commuter does not have regular passengers that would allow driving in a high-occupancy vehicle lane (HOV), there are a host of other real-world conditions that bear on commuters’ decisions beyond comparing the cost of parking on the fringe of an urban area versus close by an employment-site destination. For example, a traveler may simply prefer the environment sitting in her car, despite driving in congestion, compared to the environment of sitting or standing on a bus. She may also make accustomed intermediate stops traveling to or from work that are easier to make in a private vehicle than in a multi-stop transit trip.
At the same time, the authors acknowledge that other approaches to transit access work well in some markets, for example, walkable transit-oriented development with bicycle access. However, low-density suburbs exist and cannot be picked up and moved. This paper shows a financially sustainable, transit-supportive way to deal with the reality of suburban, car-oriented development beyond the transit-oriented-development market segment.
In conclusion, the authors recommend the agencies consider engaging in analysis aimed at staff understanding and quantifying the economic benefit of P&R to the operations for transit agencies, especially those that can choose whether to provide more or less service via P&R. Available quantitative information collected by transit agencies likely permits this to be accomplished, which (as shown in this report) can have operational benefit.

Mineta Transportat ion Inst i tute
58
XII. SUGGESTIONS FOR FURTHER RESEARCH
Both the differences and the similarities between the findings in San Jose and in the Seattle area suggest that there may be more to learn by analyzing P&R usage for bus system efficiency in other urban regions of North America. The methodologies in this study could be applied to any other urban region where data is available to enrich the level of understanding of how aggregating transit customers at P&R facilities generates operational efficiencies in transit operations.
In particular, it would be interesting to locate a public transit agency in North America or Europe where P&R is encouraged with the supply of parking spaces managed for all-day availability through ample supply responding to growth in demand, and by pricing. Then researchers should examine boardings per service hour in both peak and off-peak periods throughout the day.
As of 2016, there is a growing number of small-vehicle alternatives available to commuters in new forms of commercially offered, smart-phone-enabled car-sharing, ride-sharing, and internet-dispatched ride services that in principle can be used by travelers to reach transit hubs with frequent bus service. The claim has been made that these services are ideal for building transit ridership without adding all-day parking at hubs. This hope should be subject to measurement to validate the potential for public policy encouragement and support because of beneficial influence on boardings per service hour.39

Mineta Transportat ion Inst i tute
59
APPENDIX A. THE CASE STUDIES
KING COUNTY METRO TRANSIT (KCM)
King County Metro Transit is the largest public transit agency in the Seattle region of Washington State, serving all of King County, which includes the cities of Seattle and Bellevue. Metro in 2013 operated 984 diesel and 131 electric trolley buses, the latter all within City of Seattle. Across the entire region, the agency maintains 130 P&R lots serving about 20,000 customers per day.40 As a special focus of this study, a selected part of the diesel-electric-hybrid bus network where 20 large P&R lots are well used (east King County, across Lake Washington from Seattle) is also studied. This part of the Metro service territory is covered by the 200 series of bus routes. We also included the Sound Transit Regional Express 500 series, which are limited-stop express buses that travel in this East County part of the network. These buses are operated under contract by Metro.
Figure 15. King County Metro Selected Bus Routes and Park-and-Ride Lots

Mineta Transportat ion Inst i tute
60Appendix A. The Case Studies
SANTA CLARA VALLEY TRANSPORTATION AUTHORITY (VTA)
Santa Clara VTA is the public transit network for Santa Clara County in California, in which San Jose is the largest city, along with smaller cities such as Palo Alto and Mountain View. This network serves Silicon Valley, one of the US’s premier technical industry areas. VTA in 2013 operated 371 motorbuses serving a 326-square-mile urbanized area, and also operated a 42-mile light rail network. VTA serves 40 P&R lots, most of which are operated by the agency, but some of which are operated by the commuter railroad CalTrain.41
Figure 16. Santa Clara VTA Selected Bus Routes and Park-and-Ride Lots
LOS ANGELES COUNTY METROPOLITAN TRANSPORTATION AUTHORITY
LA Metro is the public transit network for Los Angeles County, in which Los Angeles is the biggest city, while Long Beach and Santa Monica are among prominent smaller jurisdictions. The service area is 1,433 square miles, home to nearly one-third of California residents. LA Metro operates 1,860 motorbuses, as well as commuter trains, a heavy rail subway, and light rail. There are around 150 park-and-ride lots, many of which are located near rail stations.42

Mineta Transportat ion Inst i tute
61Appendix A. The Case Studies
Figure 17. Los Angeles Metro Selected Bus Routes and Park-and-Ride Lots
COMMUNITY TRANSIT (SNOHOMISH COUNTY, WASHINGTON)
Community Transit is one of two public transit agencies serving Snohomish County, the part of the Seattle region adjacent to King County to the north. The City of Everett has its own bus system, which is not part of this research. This study includes all of the 178 buses operated by Community Transit, which includes local service with many bus stops, as well as a fleet of commuter buses that serve 45 P&R lots north of Seattle and end morning runs in downtown Seattle and at the University of Washington campus north of downtown. Some of the buses that Community Transit operates belong to Sound Transit’s Regional Express 500 series service into downtown Seattle and downtown Bellevue.43

Mineta Transportat ion Inst i tute
62Appendix A. The Case Studies
CANYONPARK
MAYSPOND
SILVERFIRS
TULALIP
SMOKEYPOINT
LAKEWOOD
SNOHOMISH
LAKE STEVENS
MARYSVILLE
GRANITEFALLS
DARRINGTON
ARLINGTON
STANWOOD
MONROE
SULTAN
GOLD BAR
MILL CREEK
BOTHELL
MOUNTLAKETERRACE
BRIER
SEATTLE
LYNNWOOD
MUKILTEO
EVERETT
EDMONDS
KamiakHigh
School
MarinerHighSchool
LynnwoodHigh School
MeadowdaleHigh School
Edmonds-Woodway HS Mountlake Terrace High School
Henry M Jackson High School
SnohomishHigh School
Granite FallsHigh School
Marysville-PilchuckHigh School
Marysville GetchellHigh School
EverettHigh School
Lake StevensHigh School
ArlingtonHigh School
LakewoodHigh School
StanwoodHS
Boeing
PaineField
AlderwoodMall
Premera
QuilCeda
Village
ArlingtonAirport
SNOHOMISH COUNTY
KING COUNTY
SKAGIT COUNTY
SNOHOMISH COUNTY
EdmondsCommunity
College
EverettCommunity
College
UW BothellCascadia College
Universityof Washington
CascadeHighSchool
84th
Ave
100t
h Av
e
66th
56th
Ave
52nd
48th
Ave
44th
Ave
28th
Brier
Rd
Mer
idian
4th
Ave
29th
20th
220th
Ash W
ay
35th
Ave
NE 185th Beards
lee
120t
h Av
e
228th St
208th St
28th
Ave
Dam
son
Rd
Both
ell E
vere
tt Hw
y
132nd St134th Pl
148th St
164th St164th St
150th
18th
Ave
154th St
20th St
4th St99
th A
ve
20th St
Main
St
127t
h Av
e
16th St
Grade Rd
Grove St
88th St
67th
Ave
4th St
10th
108th St
Smokey Point Blvd
100th St
152nd St
172nd St
174th Pl
140th St
Lakewood Rd
116th St
84th St
Sunn
ysid
e Bl
vd
Mar
ine D
r
Burn Rd
47th
Ave
67th
Ave
204th St
Highland Dr
1st St
Stilla
guam
ish A
ve
Olym
picAv
e
236th St
271st St
276th St
72nd
Ave
Pioneer Hwy
80th
Ave
88th
84th
102n
d
99th
Cemetery Rd
188th St
27th
Ave
64thSm
okey
Poi
nt B
lvd
45 Rd
51st
Ave
51st
Ave
Stat
e Av
eCe
dar A
ve
Bickford Ave
Main St
180th St
168th St
2nd St
Ave
D
179t
h Av
e
Kelse
y St
Tjerne Pl Chain
Lake
Rd
91st
Ave
Lew
is St
68th
Ave
72nd
76th
Ave
76th
Ave
9th
Ave
96th
Ave
Main St
Dayton
5th
Ave
3rd
Railro
ad Av
e
Caspers St
NE 205th St
N 200th St
244th St
238th
228th228th
236th St
228th St
196th St
204th St
220th220th St
208th St
204th St
200th
196th St196th St
194th
44th
Ave
48th
52nd
Ave 35
th36
th A
ve33
rd A
ve
Beech
Rd
Alderwood Mall B
lvd
184th
Mukilteo Speedway
Airport Rd
47th
Everg
reen W
ay
Everett Mall Way
Beve
rly Pa
rk Rd
168th St
176th St
148th St
75th St
Seaw
ay B
lvd
Beve
rly Ln
Broa
dway
Broa
dway
Madison St
Pacific AveHewitt Ave
Everett Ave
Ruck
er A
veCo
lby
Pecks Dr
52nd St
128th St
112th St
Casino Rd
4th
Ave
212th StBowd oin Way
Frye
lands
Blvd
Sea
ttle Hill R
d
Se
attle Hi
ll Rd
148th St
Pu
get Park
Dr
Snoho
mish
Casca
de D
r
Village G reen Dr
Trillium Blv d
Mill
Cree
k Blvd
Alde
rwoo
d
Olym
pic
View
Dr
Harb
our Po
int e B
lvdM
ukilt
eo Sp
eedw
ay
Mukilteo Blvd
41st St
Smith
Ave
Sunn
ysid
e B
lvd
Lundeen Pkwy
Mari
ne Dr
Marine Dr
Marine Dr
Shoulte
s Rd
Jim Creek Rd
Arlington Heights Rd
Kayak Point Rd
Ever
gree
n Way
Chenn a u lt Beach
Rd
Bothell Way
SNOHOMISH COUNTYKING COUNTY
Mall
Pkw
y
Darrington St
Sauk
Ave
Fir St
Mountain Loop Hw
y
Stanley St
Pioneer St
S Alder Ave
8th
St
4th
St5t
h St
1st S
t
High St
10th
St
1st St
Lewis Ave Villag e G
ree
n Dr 35th Ave
Edmon
ds W
ay
Totem Beach Rd
Smokey Point Blvd
Pioneer Hwy
NE 195th St
Both
ell E
vere
tt Hw
y
To University District& Downtown Seattle
To Bellevue &Downtown Seattle
To Monroe,Sultan & Gold Bar
To Darrington
Edmonds Park & Ride
Swamp Creek Park & Ride
Lynnwood Transit Center
Mountlake TerraceTransit Center
Canyon ParkPark & Ride
Ash Way Park & Ride
MarinerPark & Ride
McCollum ParkPark & Ride
Aurora VillageTransit Center
MonroePark & Ride
SnohomishPark & Ride
Everett Station
Lake StevensTransit Center
Marysville IPark & Ride
Granite FallsPark & Ride
Marysville IIPark & Ride
Marysville Ash AvePark & Ride
Marysville atCedar and GrovePark & Ride
ArlingtonPark & Ride
Smokey PointTransit Center
Stanwood IIPark & Ride
StanwoodStation
Stanwood IPark & Ride
SultanPark & Ride
Gold BarPark & Ride
Edmonds Station116 130 196 416
111 112 119 130 410413 415 435 810 871 511 512 513
105 106 120 435 532 535
270 275 277 424
277 424
280 425
821227 421 422
247 422
201 202 220 227 230 240
227
247 422240 247 422
421 821
280
270 277
112 113 115 116 120 130 201 202 402 417 421 422 425 810 821 855 511 512 535
112 115 116 119 201 202 410 413 415 810 860 880 511 512 532
112 413 415 880
101 105 106 115 201 202 410 810 860
201 202 270 271 277 280 510 512 532
412 810 860
101 115 130
405 871
Swift
Swift
Mukilteo Station/Ferry Terminal113 417 880
Metro Metro
Everett Transit
Everett TransitSkagit Transit
Island TransitIsland Transit
510 512 532
South EverettFreeway Station
513
EastmontPark & Ride
To SnohomishCounty
Universityof Washington
NE 45th StFreeway Station810 821 855 860 871 880 512Metro
NE 45th St
Mem
oria
l Way
15th
Ave
NE
NE 40th St
Stevens Way
Steve ns W
a y
UNIVERSITY DISTRICT
SEATTLE ROUTINGTO DOWNTOWN TO SNOHOMISH COUNTY
Madison St
Marion St
Columbia St
Cherry St
James St
Jefferson St
S Jackson StS King St
Stewart
St
Yesler Way
5th Ave2nd Ave4th Ave
2nd Ave
4th Ave
S Washington StS Main St
Spring StSeneca StUniversity
St
3rd Ave1st Ave
5th Ave
6th Ave
7th Ave
8th Ave
9th Ave
Boren
Minor
Union St
Pike StPine St
Terry Ave
Howell
St
Olive St
4th
Ave
5th
Ave
0
Mile½
King Street StationAmtrakSounderLink
Madison St
Marion St
Columbia St
Cherry St
James St
Jefferson St
S Jackson StS King St
Stewart
St
Yesler Way
5th Ave2nd Ave 4th Ave
2nd Ave
4th Ave
S Washington StS Main St
Spring StSeneca StUniversity
St
3rd Ave1st Ave
5th Ave
6th Ave
7th Ave
8th Ave
9th Ave
Boren
Minor
Union St
Pike St
Pine St
Terry Ave
Olive St
Howell
St4t
h Av
e
0
Mile½
King Street StationAmtrakSounderLink
Yesler Bridge constructionbegins 2nd quarter 2016
PM routingbefore constructionPM routingduring construction
402, 405, 410, 415, 417, 422, 424 510, 511, 512, 513412, 413, 416, 421, 425, 435 512 only424 only
SULTAN
Sultan River
High Ave
Fir Ave
Date Ave
Main
SultanPark & Ride270 271 277
3rd
St
1st S
t
8th
St
Alder Ave
4th
St
5th
St
Birch St
SultanHigh School
MONROE
Main St
Old Owen RdChain
Lake
Rd
Kelse
y St
V i llage Way
179t
h Av
e
154th St
Frye
land
s Blvd
Lew
is St
Columbia St
Monroe Park & Ride270 271 277 424
Woo
ds Cree
k RdEvergreen State
Fairgrounds
GOLD BAR
1st S
t
May Creek Rd
3rd St
5th St
8th St
10th
St
Gold BarPark & Ride
Lewis Ave
DARRINGTON
Darrington St
Alvord St
Sauk
Ave
Give
ns A
veEm
ens A
ve
Elwell
Ave
Fir St
Seeman St
Mountain Loop Hw
y
Darrington High School
0316
For the Latest Information
The Community Transit System Map is as accurate as possible at the time it is printed. Temporary routing and facility changes which occur between printings are not reflected here.
For the most up-to-date route schedules and maps, visit www.communitytransit.org or call (425) 353-7433.
SwiftBus Rapid Transit
SWIFT Everett – Aurora VillageSwift station
Local Routesserving Snohomish County
101 Mariner P&R – Aurora Village105 Mariner P&R – Bothell106 Mariner P&R – Bothell111 Brier – Mountlake Terrace112 Mountlake Terrace – Ash Way P&R113 Mukilteo – Lynnwood115 Mariner P&R – Aurora Village116 Edmonds – Silver Firs119 Ash Way P&R – Mountlake Terrace120 Canyon Park – Edmonds Comm.
College130 Edmonds – Lynnwood196 Edmonds – Alderwood Mall201 Smokey Point – Lynnwood202 Smokey Point – Lynnwood220 Arlington – Smokey Point222 Marysville – Tulalip227 Arlington – Boeing230 Darrington – Smokey Point240 Stanwood – Smokey Point247 Stanwood – Boeing270 Gold Bar/Monroe – Everett271 Gold Bar/Monroe – Everett277 Gold Bar/Monroe – Boeing280 Granite Falls/Lake Stevens –
Everett/Boeing
Commuter Routesserving Seattle
402 Lynnwood Transit Center – Seattle405 Edmonds P&R – Seattle410 Mariner P&R – Seattle412 Silver Firs – Seattle413 Swamp Creek P&R – Seattle415 North Lynnwood – Seattle416 Edmonds – Seattle417 Mukilteo – Seattle421 Marysville – Seattle422 Stanwood – Seattle424 Snohomish – Seattle425 Lake Stevens – Seattle435 Mill Creek – Seattle
Commuter Routesserving University District
810 McCollum Park P&R – University District 821 Marysville – University District 855 Lynnwood – University District 860 McCollum Park P&R – University District 871 Edmonds P&R – University District 880 Mukilteo – University District
Sound TransitST Express Routesserving Seattle and Bellevue
510 Everett – Seattle511 Ash Way P&R – Seattle512 Everett – Seattle513 Evergreen Way – Seattle532 Everett – Bellevue535 Lynnwood – Bellevue
Park & Ride / Transit Center
Train Station
Ferry Terminal
ORCA revalue location
Hospital
School
S N O H O M I S H C O U N T Y
COMMUNITY TRANSIT
SYSTEM MAP
N
Figure 18. Map of the Community Transit SystemSource: Community Transit, Snohomish County, Washington44

Mineta Transportat ion Inst i tute
63Appendix A. The Case Studies
PIERCE TRANSIT (TACOMA, WASHINGTON AND VICINITY)
Pierce Transit is the public transit agency operating south of Seattle that serves Pierce County, in which the largest city is Tacoma. The Pierce Transit operates a fleet of 106 motorbuses serving local routes in the urbanized parts of the County. In addition, as is the case with King County Metro and Community Transit, Pierce operates some of the Sound Transit Regional Express 500 series buses that take morning commuters to downtown Seattle and downtown Bellevue. The agency serves 30 P&R lots.45
Puget Sound
Commencement Bay
Puget Sound
FOX ISLAND
KETRONISLAND
VASHONISLAND
Anderson-Ketron Ferry
Vash
on F
erry 5
5
NORTHEAST TACOMA
NORTHSHORE
45TH
49TH
AVE
29TH NE
53RD
FEDERAL WAY
28TH
AVE
S
349TH
324TH
348TH
20TH
WEY
ERHA
EUSE
R W
Y
ENCHANTED PARKWAY
VETE
RANS D
R
SEQUALISH
COMMERCIAL
UNIO
N
BARN
ES
PACIF
IC HWY S
BRIDGEPORT
WASHINGTON
100TH
40TH
96TH
FARW
EST
LAKE
WO
OD
DR
LEXINGTON
STEILACOOM BLVD
RIGNEY
LAKEWOODSTEILACOOM
UNIVERSITYPLACE
FIRCRESTS 35TH
27TH
19TH
REGENTS
40TH W
TYLE
R
GRANDVIEW
CIRQUE DR
BRID
GEP
ORT
CUSTER
NEW YORK
PT F
OSD
ICK
DR
SOUN
DVI
EW
BORGEN
144TH
PEAC
OCK
HIL
LL
EDGEWOODMILTON
MILTON WY 28TH
AVEFIFE
20TH ST E
PUYALLUP
SOUTH HILL
128TH ST E
E 160TH
E 176TH SUNRISE BLVD
S 224TH
8TH
AVE
22N
D A
VE
CAN
YON
RD
CAN
YON
RD
66TH
AVE
23RD AVE
15TH AVE
9TH
SW
5TH
SW7TH AVE
PIONEER WY
STEWART
RIVER RD
3RD
SE
MER
IDIA
N
94TH
AVE
E
E 104TH
E 112TH
WAL
LER
RD
E 96TH
E 84TH
MER
IDIA
N
E 168THGEMHEIGHTS
5TH4TH
10TH
MER
IDIA
NM
ERID
IAN
272ND ST
159TH
138TH
MER
IDIA
N
AUBURN
LAKELAND HILLS
3RD E
A ST
E
PORT
LAN
D A
VE
E 72ND
66TH
56 TH
S 47TH
S 35TH
25TH
STADIUM W
Y
S 9TH
MIL
DRE
D
CENTER
YAKI
MA
S 48TH
THO
MPS
ON
SHER
IDAN
S M
ST
PIN
E
MCK
INLE
Y AV
E
PACI
FIC
AVE
YAKI
MA
HOSM
ER
OAK
ES
S TA
CO M
A W
Y
STEE
LE
112TH116TH
PARK
AVE
E 38TH
PORT
LAN
D
32ND
44TH
ROO
SEVELT
TACOMA
RUSTON
TACOMAN I STN M ST
DIVISION
ALD
ER
STEV
ENS
PRO
CTO
R
VASS
AULT
PEAR
L
CHEY
ENN
E
UNIO
N
6TH AVE6TH AVE N 11
N 26TH
N 30TH
N 34TH
N 45TH
N 21ST
STEE
LE
WAR
NER
AIN
SWO
RTH
DUPONT
TILLICUM
5THBERKELEY
PORTLAND 146TH SWW
OO
DBROO
K
MILITARY RD
122ND
PACI
FIC
AVE
SPAN
AWAY
-M
CKEN
NA
PARKLAND
SPANAWAY
JOINT BASELEWIS-MCCHORD
7
OLD
SUMNER
MAIN
VALLEY AVE
MIL
WAU
KEE
THOMPSON
E MAINE MAIN29TH
509
WO
OD
LAN
D A
VE
FRUI
TLAN
D A
VE
43RD AVE
500
501
501
Lak eland Hills Wy
497
409409
402
402
400
425
300
214
212
202
206
102
102
63
57
56
55
54
51
5253
48
45
42 41
28
16
14
13
11
10
Walmart
Fred Meyer
Fred Meyer
Winco
FredMeyer
FredMeyer
Tideflats
Old Town
DSHS
Browns Point
Dash Point
TACID
Fred Meyer
Fred Meyer
Walmart
�e CrossingsShoppingCenter
�e Commonsat Federal Way
WildWaves
Pt Defiance Park
Tacoma Dome
NarrowsBridge
OlympicVillage
Lakewood Towne Center
Salishan
S FederalWay Park
& Ride
GIG HARBOR
PURDYPurdy Connection
Commissary BX
Emerald Queen
Library
Library
Library
Library
Library
Library
St ClareHospital
Good Samaritan Hospital
Madigan Hospital
VA Hospital FranciscanMedicalPavilion
Western StateHospital
St Anthony’s Hospital
to Olympia
410
512
167
512
16
P
P
Sumner SounderStation
Puyallup Sounder Station
LakewoodSounderStation
S TacomaSounderStation
Tacoma Dome Station
AuburnSounderStation
South Hill Mall
Transit Center
ParklandTransit Center
LakewoodTransit Center
72nd StTransitCenter
Tacoma MallTransitCenter
Tacoma CommunityCollege Transit Center
Federal WayTransit Center
Rogers HS
Lakes HS
Mt Tahoma HS
Steilacoom HS
Clover Park HS
Lincoln HS
Foss HS
Wilson HS
Stadium HS
Bethel HS
Chief LeschiSchool
St Joseph’s
TacomaGeneralHosp
Allenmore
Meeker MS
Pierce College
PacificLutheran
University
Pierce College
U ofPuget Sound
CloverPark Tech
SEE
DOWNTOWN
MAP
160T
H AV
E
5
VALLEY
VALLEY AVE54
TH A
VE
70TH
AVE
PUYALLUP AVE PACIFIC HWY EAST
PACI
FIC
HWY
S
PORT OF TACOMA
53
PIONEE
R
VICK
ERY
AVE
ORC
HARD
S 12TH
ORC
HARD
150TH SW
425
Group Health
YMCA
Sunset Garden
39TH44
Gig HarborN ShoppingCenter
31ST
43RD
MARINE VIEW DR
NORPOINT
425
NORTHSHORE
45TH
63
400
336TH STS 333RD
9TH
AVE
SW CAMPUS DR
NO
RPOIN
T
903903
101 100
Figure 19. Map of the Pierce Transit SystemSource: Pierce Transit, Lakewood, Washington46

Mineta Transportat ion Inst i tute
64
APPENDIX B. A HEURISTIC EXAMPLE OF ROUTE-LEVEL AND STOP-LEVEL ANALYSIS
To conceptualize our empirical analysis, consider the following heuristic example (Figure 20).
Figure 20. Heuristic Public Transit System
Figure 20 shows six bus routes (green, dark blue, purple, red, light blue, and orange) in each of two directions: inbound and outbound. All the routes except two (dark blue and red) connect directly to an employment center. Two of the routes (green and light blue) are served directly by P&R lots. Because of transfers, P&R lots may affect ridership on all routes except orange.47 The clientele of stops associated with P&R lots may come from car commuters from the catchment area of the P&R lot, or from “feeder” lines. There are 15 stops, some serving more than one line. For a given route, time, and direction, each stop on a route has a sequence number, i.e., the order in which that stop appears in that

Mineta Transportat ion Inst i tute
65Appendix B. A Heuristic Example of Route-Level and Stop-Level Analysis
route, time, and direction. (Typically, inbound and outbound buses use different stops – usually on opposite sides of the street. The authors have eliminated that complication in our heuristic model.)
This heuristic framework yields the following data concerning sequence numbers:
Table 18. Inbound and Outbound Sequence Numbers Implied by the Heuristic Public Transit System
INBOUND SEQUENCE NUMBERSSTOPS Green Dark Blue Purple Red Light Blue Orange
1 12 23 14 3 2 25 3 56 4 47 18 19 2 2
10 311 512 613 7 214 115 1
OUTBOUND SEQUENCE NUMBERSSTOPS Green Dark Blue Purple Red Light Blue Orange
1 72 6 13 24 5 25 1 16 4 27 38 29 1 4
10 311 312 213 1 114 515 2
For the framework outlined above, assume that the following represents boardings data for the morning commute.

Mineta Transportat ion Inst i tute
66Appendix B. A Heuristic Example of Route-Level and Stop-Level Analysis
Tabl
e 19
. H
ypot
hetic
al B
oard
ings
Dat
a fo
r the
Heu
ristic
Pub
lic T
rans
it Sy
stem
HY
PO
THE
TIC
AL
INB
OU
ND
BO
AR
DIN
GS
DAT
A
STO
PSG
reen
Dar
k B
lue
Purp
leR
edLi
ght B
lue
Ora
nge
Tota
l Boa
rdin
gs
per S
top
P&R
D
umm
yP&
R
Cap
acity
Num
ber
of L
ines
Se
rvin
g St
op1
1010
00
1
215
00
150
170
2
345
450
01
415
1934
00
2
50
00
00
2
612
6577
00
2
725
250
01
847
470
01
90
100
100
145
2
1023
230
01
1117
170
01
126
60
01
130
00
00
2
1449
490
01
1512
012
00
01
LEN
GTH
11.5
16
16.
54
NU
MB
ER O
F ST
OPS
72
32
52
STO
PS P
ER L
ENG
TH0.
6086
9565
22
0.5
20.
7692
3076
90.
5
SPEE
D20
4540
4530
45
REV
ENU
E H
OU
RS
0.57
50.
0222
2222
20.
150.
0222
2222
20.
2166
6666
70.
0888
8888
9
TOTA
L B
OA
RD
ING
S21
045
4447
237
120
BO
AR
DIN
GS
PER
R
EVEN
UE
HO
UR
365.
2173
913
2025
293.
3333
333
2115
1093
.846
154
1350
P&R
Influ
ence
0.71
4285
714
00
00.
4219
4092
80
P&R
Dum
my
10
00
10
P&R
Cap
acity
700
00
450
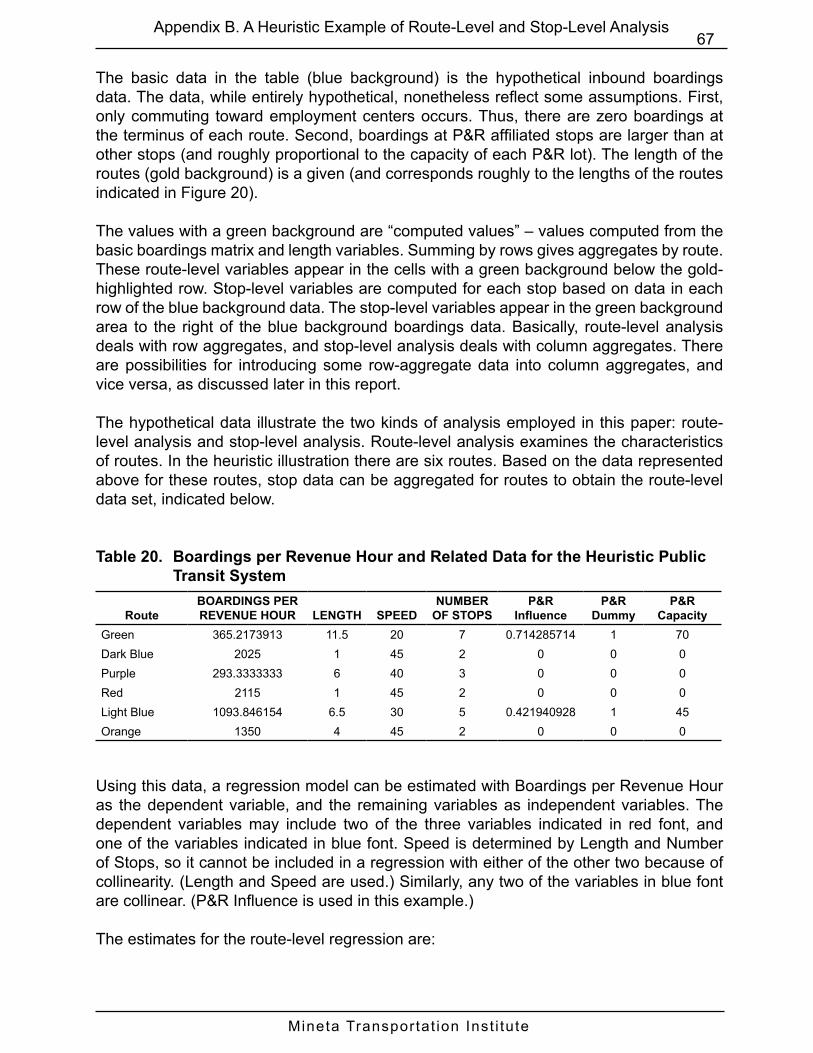
Mineta Transportat ion Inst i tute
67Appendix B. A Heuristic Example of Route-Level and Stop-Level Analysis
The basic data in the table (blue background) is the hypothetical inbound boardings data. The data, while entirely hypothetical, nonetheless reflect some assumptions. First, only commuting toward employment centers occurs. Thus, there are zero boardings at the terminus of each route. Second, boardings at P&R affiliated stops are larger than at other stops (and roughly proportional to the capacity of each P&R lot). The length of the routes (gold background) is a given (and corresponds roughly to the lengths of the routes indicated in Figure 20).
The values with a green background are “computed values” – values computed from the basic boardings matrix and length variables. Summing by rows gives aggregates by route. These route-level variables appear in the cells with a green background below the gold-highlighted row. Stop-level variables are computed for each stop based on data in each row of the blue background data. The stop-level variables appear in the green background area to the right of the blue background boardings data. Basically, route-level analysis deals with row aggregates, and stop-level analysis deals with column aggregates. There are possibilities for introducing some row-aggregate data into column aggregates, and vice versa, as discussed later in this report.
The hypothetical data illustrate the two kinds of analysis employed in this paper: route-level analysis and stop-level analysis. Route-level analysis examines the characteristics of routes. In the heuristic illustration there are six routes. Based on the data represented above for these routes, stop data can be aggregated for routes to obtain the route-level data set, indicated below.
Table 20. Boardings per Revenue Hour and Related Data for the Heuristic Public Transit System
RouteBOARDINGS PER REVENUE HOUR LENGTH SPEED
NUMBER OF STOPS
P&R Influence
P&R Dummy
P&R Capacity
Green 365.2173913 11.5 20 7 0.714285714 1 70Dark Blue 2025 1 45 2 0 0 0Purple 293.3333333 6 40 3 0 0 0Red 2115 1 45 2 0 0 0Light Blue 1093.846154 6.5 30 5 0.421940928 1 45Orange 1350 4 45 2 0 0 0
Using this data, a regression model can be estimated with Boardings per Revenue Hour as the dependent variable, and the remaining variables as independent variables. The dependent variables may include two of the three variables indicated in red font, and one of the variables indicated in blue font. Speed is determined by Length and Number of Stops, so it cannot be included in a regression with either of the other two because of collinearity. (Length and Speed are used.) Similarly, any two of the variables in blue font are collinear. (P&R Influence is used in this example.)
The estimates for the route-level regression are:

Mineta T
ransportation Institute
68A
ppendix B. A H
euristic Exam
ple of Route-Level and S
top-Level Analysis
Table 21. Route-Level Regression Result for the Heuristic Public Transit SystemSUMMARY OUTPUT
Regression StatisticsMultiple R 0.998142229R Square 0.996287909Adjusted R Square 0.990719773Standard Error 75.4882644Observations 6
ANOVAdf SS MS F Significance F
Regression 3 3058828.549 1019609.516 178.9266371 0.005562966Residual 2 11396.95612 5698.478062Total 5 3070225.505
Coefficients Standard Error t Stat P-value Lower 95% Upper 95% Lower 95.0% Upper 95.0%Intercept -3387.714696 1324.629012 -2.55748188 0.124884277 -9087.133331 2311.703938 -9087.133331 2311.703938LENGTH -225.6807971 28.11961344 -8.025743229 0.015172496 -346.6697286 -104.6918656 -346.6697286 -104.6918656SPEED 125.8014856 28.7534669 4.375176252 0.04847369 2.085302697 249.5176684 2.085302697 249.5176684P&R Influence 5310.361941 735.9338116 7.215814597 0.01866951 2143.894317 8476.829564 2143.894317 8476.829564
Mineta Transportat ion Inst i tute
69Appendix B. A Heuristic Example of Route-Level and Stop-Level Analysis
Each of these variables has the expected sign and significance. Boardings per Revenue Hour decline with the length of the route, and increase with speed along the route. The P&R influence variable (the percentage of total boardings occurring at a stop associated with a park-and-ride lot) is positive and strongly statistically significant.
Exactly the same data can be used to estimate an alternative regression equation, using stop-level data (based on column sums). The dependent variable is Boardings per Stop. Possible independent variables include a P&R Dummy variable or a P&R Capacity variable, and the Number of Routes serving a particular stop. The P&R Dummy and the P&R Capacity are collinear. P&R Capacity is employed in the example. Looking at Boardings per Stop in the hypothetical data referred to above allows estimating the stop-level regression given by:

Mineta T
ransportation Institute
70A
ppendix B. A H
euristic Exam
ple of Route-Level and S
top-Level Analysis
Table 22. Stop-Level Regression Result for the Heuristic Public Transit SystemSUMMARY OUTPUT
Regression StatisticsMultiple R 0.73030262R Square 0.533341917Adjusted R Square 0.455565569Standard Error 33.72753303Observations 15
ANOVAdf SS MS F Significance F
Regression 2 15601.17552 7800.587761 6.857379341 0.010327442Residual 12 13650.55781 1137.546484Total 14 29251.73333
Coefficients Standard Error t Stat P-value Lower 95% Upper 95% Lower 95.0% Upper 95.0%Intercept 48.64165931 27.99442367 1.737548159 0.107861189 -12.35295013 109.6362688 -12.35295013 109.6362688P&R Capacity 1.711738747 0.490879892 3.487082635 0.004487406 0.642203341 2.781274153 0.642203341 2.781274153Number of Lines Serving Stop -10.64165931 20.11232445 -0.529111358 0.6063775 -54.46264987 33.17933124 -54.46264987 33.17933124

Mineta Transportat ion Inst i tute
71Appendix B. A Heuristic Example of Route-Level and Stop-Level Analysis
The P&R Capacity variable has the expected sign and significance. Because the units of P&R Capacity are spaces, it is possible to interpret the coefficient on the P&R Capacity variable as the marginal impact of an additional space on boardings. Thus, an additional space at a P&R lot would increase boardings at the associated stop by 1.7 riders.

Mineta T
ransportation Institute
72
APPENDIX C. DESCRIPTIVE STATISTICS OF THE SAMPLES
Stop -Level Analysis
KCMVariable Obs Mean Std. Dev. Min MaxAM Boardings 6,321 10.11004 27.98965 0 733.8668Number of Bus Lines 6,321 1.582503 1.256957 1 19Quarter Mile Dummy 6,321 0.0930233 0.290488 0 1Quarter Mile Capacity 6,321 24.07926 121.5429 0 1614Population Density within a quarter mile of a stop 6,321 5839.187 4617.272 1.114756 35207.31Median Household Income within a quarter mile of a stop 6,321 52993.28 25041.8 3520 190417Total Number of Employed Persons within a quarter mile of a stop 6,321 1013.021 313.0951 46 2820Natural logarithm of Median Household Income within a quarter mile of a stop 6,321 10.75773 0.5213081 8.166216 12.15697Natural logarithm of Total Number of Employed Persons within a quarter mile of a stop 6,321 6.871508 0.3335464 3.828641 7.944492Natural logarithm of Population Density within a quarter mile of a stop 6,321 8.289489 1.181536 0.1086359 10.46901Natural logarithm of the number of spaces in the nearest park-and-ride lot 6,321 4.509727 1.343232 2.197225 7.386471Natural logarithm of the distance to the nearest park-and-ride lot 6,321 8.46682 0.9990408 2.960813 10.15481
VTAVariable Obs Mean Std. Dev. Min MaxAM Boardings 2,373 2.210282 3.160282 0 51Number of Bus Lines 2,373 1.217025 0.5271836 1 5Quarter Mile Dummy 2,373 0.0670038 0.2500813 0 1Quarter Mile Capacity 2,373 22.66035 110.0352 0 1155Population Density within a quarter mile of a stop 2,373 7599.162 4254.235 0.7843507 28508.55Median Household Income within a quarter mile of a stop 2,373 92208.61 35075.4 22776 250001Total Number of Employed Persons within a quarter mile of a stop 2,373 879.0719 271.038 228.5 2525.25Natural logarithm of Median Household Income within a quarter mile of a stop 2,373 11.36173 0.3781453 10.03346 12.42922Natural logarithm of Total Number of Employed Persons within a quarter mile of a stop 2,373 6.733751 0.3015335 5.431536 7.834095Natural logarithm of Population Density within a quarter mile of a stop 2,373 8.645622 1.094975 -0.242899 10.25796Natural logarithm of the number of spaces in the nearest park-and-ride lot 2,373 5.258127 0.8872343 3.091043 7.051856Natural logarithm of the distance to the nearest park-and-ride lot 2,373 8.546036 0.9646226 3.665396 10.9175

Mineta T
ransportation Institute
73A
ppendix C. D
escriptive Statistics of the S
amples
Route-Level Analysis
KCMVariable Obs Mean Std. Dev. Min MaxBoardings Per Revenue Hour 177 49.01291 22.86366 4.302027 109.1164MPH 177 15.77912 5.066547 6.845767 31.03317Total spaces in park-and-ride lots along the route 177 468.2712 472.0876 0 1614Total spaces in park-and-ride lots along the route squared 177 440885.4 716346.3 0 2604996Seattle Core Dummy 177 0.6497175 0.4784117 0 1
VTAVariable Obs Mean Std. Dev. Min MaxBoardings Per Revenue Hour 57 21.73158 7.100909 6.1 36.8Total spaces in park-and-ride lots along the route 57 358.3158 298.3434 0 1155Total spaces in park-and-ride lots along the route squared 57 215837.4 324912.2 0 1334025Core Dummy 57 0.3157895 0.4689614 0 1Limited Dummy 57 0.0701754 0.2577131 0 1
LAVariable Obs Mean Std. Dev. Min MaxBoardings Per Revenue Hour 30 48.14233 11.71403 17.8 71.52Average Daily Ridership 30 11826.33 6285.569 1338 25365Total spaces in park-and-ride lots along the route 30 494.5667 1041.938 0 4036Total spaces in park-and-ride lots along the route squared 30 1294043 4106357 0 1.63E+07Count of number of park-and-ride lots along the route 30 0.7333333 0.980265 0 4Route length in miles 30 31.10802 8.954876 12.54851 53.64589

Mineta Transportat ion Inst i tute
74
APPENDIX D. DENSITY VS. PARK-AND-RIDE
The authors were interested in looking at the relative strength of housing density and P&R as influenced on bus transit ridership. The cleanest way to make the comparison (both in terms of comparing P&R to density and in terms of comparing one system to another) is to cast everything in terms of elasticities (i.e., percentage changes in density vs. percentage changes in park-and-ride), and then compare the percentages between P&R and density, and compare these elasticities between the two systems. For this to be read off directly from the Poisson regression equation, the independent variables need to be logarithmic transformations of the original variables. The problem is that all the P&R variables are essentially dummy variables. The Quarter Mile Dummy is a dummy variable, equal to either 0 or 1. The logarithm of zero is undefined, whereas the logarithm of density is perfectly fine. So one is left with comparing an elasticity of density (1% change in density leads to a small percent change in boardings), to an absolute change in P&R (there is or is not a P&R lot within a quarter mile) with a percent change in boardings. That’s what the “regular” Poisson gives us.
That said, some good results can be shown.
Table 23. King County Poisson Regression Using QMDummyPoisson regression Number of obs = 6,321
Wald chi2(5) = 564.25Prob > chi2 = 0
Log pseudolikelihood = -71429.715 Pseudo R2 = 0.2224
RobustROUNDON Coef. Std. Err. z P>z [95% Conf. Interval]
COUNTTOTAL 0.157815 0.0200694 7.86 0 0.1184798 0.1971503QuarterMileDummy 1.05605 0.1076717 9.81 0 0.8450175 1.267083lnPopDens 0.4770794 0.0543236 8.78 0 0.3706072 0.5835517lnMin_B19013e1 -0.1290285 0.0706135 -1.83 0.068 -0.2674284 0.0093715lnMax_B23025e4 0.5071294 0.1614605 3.14 0.002 0.1906726 0.8235861_cons -4.365956 1.25215 -3.49 0 -6.820125 -1.911787
The presence of a P&R lot within a quarter mile of a stop leads to a 1.05% increase in boardings at that stop. Recall that for KCM there is an average of 5.9 stops within a quarter mile of a P&R lot, while for VTA there is an average of 7.8 stops within a quarter mile of a P&R lot. A 1% increase in density results in a 0.48% increase in boardings. Both results are highly statistically significant (z-values/t-stats of 9.81 and 8.78, respectively).

Mineta Transportat ion Inst i tute
75Appendix D. Density vs. Park-and-Ride
Table 24. VTA Poisson Regression Using QMDummyPoisson regression Number of obs = 2,373
Wald chi2(5) = 326.58Prob > chi2 = 0
Log pseudolikelihood = -5264.4094 Pseudo R2 = 0.1116
RobustTOTALRIDERS Coef. Std. Err. z P>z [95% Conf. Interval]
TOTALCOUNT 0.4663701 0.0454978 10.25 0 0.377196 0.5555443QuarterMileDummy 0.7546589 0.1062149 7.11 0 0.5464816 0.9628362lnAvg_B19013e1 -0.3351254 0.074623 -4.49 0 -0.4813837 -0.188867lnAvg_B23025e4 0.3458637 0.1059983 3.26 0.001 0.1381109 0.5536166lnPopDens 0.1952375 0.0476164 4.1 0 0.1019111 0.288564_cons -0.1468349 1.280329 -0.11 0.909 -2.656233 2.362563
By comparison, for VTA the presence of a P&R lot within a quarter mile of a stop leads to a 0.75% increase in boardings at that stop. A 1% increase in density results in a 0.2% increase in boardings. Both results are highly statistically significant (z-values/t-stats of 7.11 and 4.1, respectively) but less statistically significant than for KCM.
Table 25. KCM Poisson Regression Using Distance-Decay FunctionPoisson regression Number of obs = 6,321
Wald chi2(6) = 498.54Prob > chi2 = 0
Log pseudolikelihood = -71934.821 Pseudo R2 = 0.2169
RobustROUNDON Coef. Std. Err. z P>z [95% Conf. Interval]
COUNTTOTAL 0.1702552 0.0207485 8.21 0 0.1295889 0.2109216lnREG_SPACES 0.0725646 0.024395 2.97 0.003 0.0247512 0.120378lnNEAR_DIST -0.2987086 0.0409151 -7.3 0 -0.3789008 -0.2185165lnPopDens 0.5289155 0.0549829 9.62 0 0.4211511 0.63668lnMin_B19013e1 -0.1674258 0.0671871 -2.49 0.013 -0.2991102 -0.0357414lnMax_B23025e4 0.5615903 0.1649103 3.41 0.001 0.238372 0.8848086_cons -2.485067 1.251699 -1.99 0.047 -4.938352 -0.0317833
The authors define a distance-decay variable of the form (Capacity/Distanceγ). With a logarithmic transformation of the right-hand side of the Poisson equation, this gives two new variables, lnCapacity and lnDistance. These are defined for all observations, and have standard elasticity interpretations. For KCM, the results of incorporating the distance-decay formulation are as follows.

Mineta Transportat ion Inst i tute
76Appendix D. Density vs. Park-and-Ride
For each 1% increase in spaces, the number of boardings at a stop at the average distance from a P&R lot increases by 0.07%. The effect of increasing the number of spaces at a P&R lot by 1% is strongly influenced by the distance of the stop from the P&R lot. For each 1% increase in distance, the percent change in ridership at such a stop decreases by 0.3%. The effect of a 1% increase in population density is about a 0.53% increase in boardings at a stop within a quarter mile of a P&R lot. All the results are statistically significant, the results for distance and density especially so, suggesting that these variables are the most significant in determining the result.
Table 26. VTA Poisson Regression Using Distance-Decay FunctionPoisson regression Number of obs = 2,373
Wald chi2(6) = 328.18Prob > chi2 = 0
Log pseudolikelihood = -5321.3844 Pseudo R2 = 0.102
RobustTOTALRIDERS Coef. Std. Err. z P>z [95% Conf. Interval]
TOTALCOUNT 0.4668109 0.0455926 10.24 0 0.3774509 0.5561708lnQUANTITY 0.0457416 0.0292318 1.56 0.118 -0.0115516 0.1030347lnNEAR_DIST -0.1742338 0.0450712 -3.87 0 -0.2625717 -0.0858959lnAvg_B19013e1 -0.2537793 0.0731053 -3.47 0.001 -0.397063 -0.1104956lnAvg_B23025e4 0.3664808 0.1197535 3.06 0.002 0.1317683 0.6011934lnPopDens 0.1808069 0.0449739 4.02 0 0.0926596 0.2689542_cons 0.220165 1.502881 0.15 0.884 -2.725427 3.165757
For each 1% increase in spaces, the number of boardings at a stop at the average distance from a P&R lot increases by 0.04%. The effect of increasing the number of spaces at a P&R lot by 1% is strongly influenced by the distance of the stop from the P&R lot. For each 1% increase in distance, the percent change in ridership at such a stop decreases by 0.17%. The effect of a 1% increase in population density is about a 0.18% increase in boardings at a stop within a quarter mile of a P&R lot. The results for distance and density are statistically significant, suggesting that these variables are the most significant in determining the result. The result for the number of spaces in a P&R is of the expected sign but not statistically significant.
The upshot of these estimations is that both proximity to a park-and-ride lot and population density in the neighborhood of a stop are strongly significant influences on ridership. Generally, both proximity to a park-and-ride lot and the capacity of the park-and-ride lot are strongly significant influences, with proximity the greater influence. The estimates involving the quarter-mile dummy variable suggest that the influence of the park-and-ride variable is marginally greater than the influence of the population density variable.
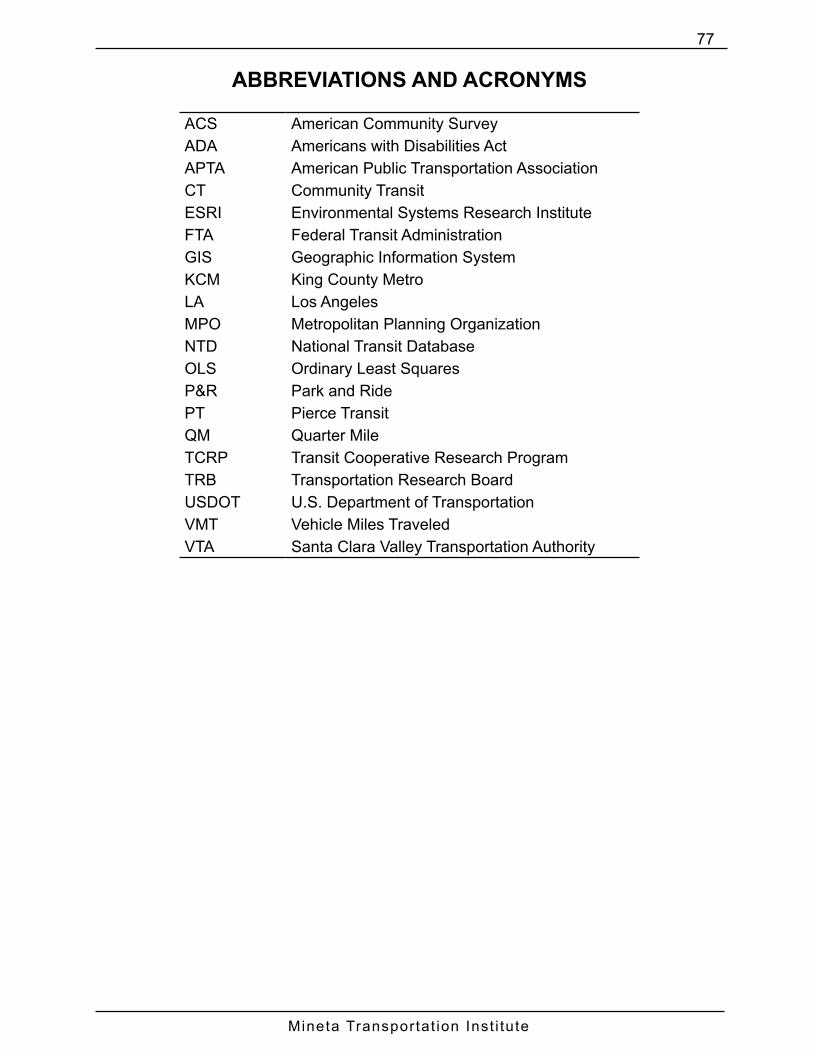
Mineta Transportat ion Inst i tute
77
ABBREVIATIONS AND ACRONYMS
ACS American Community SurveyADA Americans with Disabilities ActAPTA American Public Transportation AssociationCT Community TransitESRI Environmental Systems Research InstituteFTA Federal Transit AdministrationGIS Geographic Information SystemKCM King County MetroLA Los AngelesMPO Metropolitan Planning OrganizationNTD National Transit DatabaseOLS Ordinary Least SquaresP&R Park and RidePT Pierce TransitQM Quarter MileTCRP Transit Cooperative Research ProgramTRB Transportation Research BoardUSDOT U.S. Department of TransportationVMT Vehicle Miles TraveledVTA Santa Clara Valley Transportation Authority

Mineta Transportat ion Inst i tute
78
BIBLIOGRAPHY
APTA Public Transportation Fact Book (American Public Transportation Association) Fall, 2015. http://www.apta.com/resources/statistics/Documents/FactBook/2015-APTA-Fact-Book.pdf (accessed May 10, 2016).
Badger, Emily. “New Census Data: Americans are Returning to the Far-flung Suburbs.” The Washington Post Wongblog. March 26, 2015. http://www.washingtonpost.com/blogs/wonkblog/wp/2015/03/26/new-census-data-americans-are-returning-to-the-far-flung-suburbs/ (accessed July 29, 2015).
Committee on Transitions to Alternative Vehicles and Fuels; Board on Energy and Environmental Systems; Division on Engineering and Physical Sciences; National Research Council. Transitions to Alternative Vehicles and Fuels. National Academies Press, 2013. http://www.nap.edu/catalog.php?record_id=18264 (accessed July 30, 2015).
CTC & Associates LLC, “Assessing Park-and-Ride Impacts,” for Caltrans Division of Research and Innovation, June 2, 2010
Dijk, Marc and Carlos Montalvo. “Policy Frames of Park-and-Ride in Europe.” Journal of Transport Geography 19 (2011): 1106–1119.
Duncan, Michael and David Cook. “Is the Provision of Park-and-Ride Facilities at Light Rail Stations an Effective Approach to Reducing Vehicle Kilometers Traveled in a US Context?” Transportation Research Part A, 66 (2014), 65-74.
Environmental Protection Agency, “Park-and-Ride/Fringe Parking,” Transportation Control Measure Information Documents EPA 400 R92006, March 1992. https://www3.epa.gov/otaq/stateresources/policy/transp/tcms/park-fringepark.pdf (accessed April 8, 2016).
Ewing, Reid, Transportation & Land Use Innovations: When You Can’t Pave Your Way Out of Congestion. Chicago: American Planning Association, 1997.
Florida Planning and Development Lab, Transit-Oriented Development: “A Literature Review of Bus Passenger Facility Planning, Siting, and Design.” Department of Urban and Regional Planning, Florida State University, March 2004.
Nichols, B.G., Kockelman, K.M., and Reiter, M. “Air Quality Impacts of Electric Vehicle Adoption in Texas.” Transportation Research Part D 34 (2015): 208-218. http://www.caee.utexas.edu/prof/kockelman/public_html/TRB15EVEmissionsinTX.pdf (accessed April 8, 2016).
Parsons Brinckerhoff Quade & Douglas, Inc. “Park-and-Ride Demand Estimation Study: Final Report and User’s Manual,” for King County Department of Metropolitan Services (Metro), Seattle, WA, 1995.

Mineta Transportat ion Inst i tute
79Bibliography
Qian, Zhen (Sean), and Michael Zhang, “The Economics of Parking Provision for the Morning Commute.” Transportation Research Part A, Vol.45(9) (2011): 861-879.
Shared-Use Mobility Center, “Shared Mobility and the Transformation of Public Transit,” American Public Transportation Association, http://www.apta.com/resources/reportsandpublications/Documents/APTA-Shared-Mobility.pdf (accessed April 8, 2016).
Spillar, Robert J. Park and Ride Planning and Design Guidelines, New York: Parsons Brinkerhoff, 1997.
Turnbull, Katherine, John Evans, and Herbert Levinson. “Park-And- Ride/Pool: Traveler Response to Transport System Changes.” Chapter 3; Report 95, Transit Cooperative Research Program; Transportation Research Board, 2004.
Wooldridge, Jeffrey M., Econometric Analysis of Cross Section and Panel Data, 2nd edition. MIT Press, 2010.
Wooldridge, Jeffrey M., Introductory Econometrics: A Modern Approach, 5th edition. South-Western Publishing Company, 2013.

Mineta Transportat ion Inst i tute
80
ENDNOTES
1. The variable Boardings Per Revenue Hour is defined as the number of people who board all the buses on a particular route over a defined period of time divided by the number of hours that these buses are operating in service on the route. Hours of service include only the periods where customers are able to board the bus and ride, not the time before and after the minutes when the bus is actually running the route in service to customers.
2. Both King County Transit and Santa Clara Valley Transit Authority also deploy non-bus transit (light rail). These non-bus options are not included in the data on which our regressions are based.
3. Poisson regression is used because the data are integer counts, for which Poisson regression is the most appropriate technique and because Poisson regression is robust to many violations of underlying assumptions, as explained in the section.
4. Federal Transit Administration, 2013 Annual Database Agency Information, https://www.transit.dot.gov/ntd/data-product/2013-annual-database-agency-information (accessed July 22, 2016).
5. U.S. Census, SELECTED ECONOMIC CHARACTERISTIC American Community Survey (ACS) 5-Year Estimate, 2010-2014.
6. Accounting for differences in regional prices, per capita real personal income is only about 11% greater in the San Jose Metropolitan Statistical Area than in the Seattle Metropolitan Statistical Area. Bureau of Economic Analysis, Real Personal Income [RPI1] by Metropolitan Statistical Area, http://www.bea.gov/regional/ (accessed May 4, 2016).
7. U.S. Census, ACS 2010-2014 5-Year Estimates for Urban Areas, Table S0801.
8. Data obtained from GIS files for King County Metro and Santa Clara Valley Transportation Authority.
9. We made the calculations in Tables 3 and 4 based on Census Urbanized Areas to make the data compatible with statistics in the 2016 Public Transportation Fact Book (American Public Transportation Association, Fall, 2016).
10. Duncan, Michael and David Cook, “Is the provision of park-and-ride facilities at light rail stations an effective approach to reducing vehicle kilometers traveled in a US context?” Transportation Research Part A, 66 (2014): 65-74.
11. These include varieties of dense residential and commercial development that transit can serve well, because origins and destinations of travelers are concentrated, meaning transit vehicles do not have to stop so often to pick up and discharge passengers. When this concentration of origins and destinations exists, multi-passenger transit

Mineta Transportat ion Inst i tute
81Endnotes
vehicles can board and unload multiple travelers in fewer locations, thus making operations efficient compared to serving passengers at low-volume bus stops.
12. See Metropolitan Transportation Commission, “Plan Bay Area 2040,” (2015), http://planbayarea.org/pdf/Project_Update_Call_for_Projects_and_Needs_Assessments_Guidance.pdf (accessed January 20, 2016).
13. Puget Sound Regional Council, “Vision 2040,” (2009), http://www.psrc.org/assets/366/7293-V2040.pdf?processed=true (accessed January 20, 2016).
14. Ewing, Reid, Transportation & Land Use Innovations: When You Can’t Pave Your Way Out of Congestion, (Chicago: American Planning Association, 1997).
15. Badger, Emily, “New Census data: Americans are returning to the far-flung suburbs,” The Washington Post Wongblog, (March 26, 2015), http://www.washingtonpost.com/blogs/wonkblog/wp/2015/03/26/new-census-data-americans-are-returning-to-the-far-flung-suburbs/ (accessed July 29, 2015).
16. U.S. Census Bureau, “Patterns of Metropolitan and Micropolitan Population Change: 2000 to 2010,” http://www.census.gov/population/metro/data/c2010sr-01patterns.html (accessed July 23, 2016).
17. Spillar, Robert J., Park and Ride Planning and Design Guidelines, (New York: Parsons Brinkerhoff, 1997).
18. The analysis is more complicated if one considers that some potential customers will not ride the bus if only P&R service is provided, and others will not ride the bus if boardings are supported only at neighborhood bus stops. A much more involved calculation is required if one looks at the economics from an overall societal point of view, where the costs of providing transit overall to this region need to be factored in, including the costs of commuters simply using their private vehicles instead of riding the bus.
19. Federal Transit Administration, National Transit Database, 2013 Annual Database Operating Expenses, https://www.transit.dot.gov/ntd/data-product/2013-annual-database-operating-expenses (accessed July 23, 2016)
20. 2015 Public Transportation Fact Book, (American Public Transportation Association, 2015), http://www.apta.com/resources/statistics/Documents/FactBook/2015-APTA-Fact-Book.pdf (accessed January 20, 2016).
21. Dijk, Marc and Carlos Montalvo, “Policy frames of Park-and-Ride in Europe,” Journal of Transport Geography 19 (2011): 1106–1119.
22. Turnbull, Katherine; John Evans, and Herbert Levinson, “Park-And- Ride/Pool: Traveler Response to Transport System Changes,” Chapter 3; Report 95, Transit Cooperative Research Program; Transportation Research Board, (2004).

Mineta Transportat ion Inst i tute
82Endnotes
23. Duncan, Michael and David Cook, “Is the provision of park-and-ride facilities at light rail stations an effective approach to reducing vehicle kilometers traveled in a US context?” Transportation Research Part A, 66 (2014): 65-74.
24. Environmental Protection Agency, “Park-and-Ride/Fringe Parking,” Transportation Control Measure Information Documents EPA 400 R92006, (March 1992) https://www3.epa.gov/otaq/stateresources/policy/transp/tcms/park-fringepark.pdf (accessed April 8, 2016).
25. Nichols, B.G., Kockelman, K.M., and Reiter, M., “Air Quality Impacts of Electric Vehicle Adoption in Texas,” Transportation Research Part D 34 (2015); 208-218. http://www.caee.utexas.edu/prof/kockelman/public_html/TRB15EVEmissionsinTX.pdf (accessed April 8, 2016).
26. Committee on Transitions to Alternative Vehicles and Fuels; Board on Energy and Environmental Systems; Division on Engineering and Physical Sciences; National Research Council, Transitions to Alternative Vehicles and Fuels, (National Academies Press, 2013), http://www.nap.edu/catalog.php?record_id=18264 (accessed July 30, 2015).
27. Turnbull, Katherine; John Evans, and Herbert Levinson, “Park-And- Ride/Pool: Traveler Response to Transport System Changes,” Chapter 3; Report 95, Transit Cooperative Research Program; Transportation Research Board, 2004; Qian, Zhen (Sean), and Michael Zhang, “The economics of parking provision for the morning commute,” Transportation Research Part A, Vol.45(9) (2011): 861-879.
28. Turnbull, Katherine; John Evans, and Herbert Levinson, “Park-And- Ride/Pool: Traveler Response to Transport System Changes,” Chapter 3; Report 95, Transit Cooperative Research Program; Transportation Research Board, (2004), 3-2.
29. Consider the example of 40 passengers commuting to a downtown employment center from a sprawling neighborhood in the suburbs. For the bus to serve these passengers close to their residential locations, 30 minutes or more could be easily consumed, in addition to the 30 minutes it required to get all the way downtown from the last bus stop in this example suburb. So the boardings per service hour would be 40 in this scenario. On the other hand, if these 40 passengers made their way to a single pick-up point at a P&R facility, the time assigned to getting these passengers aboard the bus in the morning would be reduced to about 5 minutes, and the bus could then begin the 30 minutes to reach downtown. This means that the boardings per service hour would drop down to 40 passengers divided by 35 minutes, or 69 boardings per service hour, a gain of 71 percent.
30. We chose a quarter mile as the standard distance that people are willing to walk to get the bus. Many transit centers have stops located at the transit center. However, with modern GPS (Geographic Positioning System) technology, stops are typically identified as distinct from the transit centers where they are located. Depending on the layout of the transit center, stops located at the transit center may show up as a few hundred feet away.

Mineta Transportat ion Inst i tute
83Endnotes
31. There are several stops both for KCM and VTA where the count of boardings is zero. This is an important technical point when running Poisson regressions.
32. See Wooldridge, Jeffrey M., Introductory Econometrics: A Modern Approach, 5th edition (South-Western Publishing Company, 2013), 604-609; Wooldridge, Jeffrey M., Econometric Analysis of Cross Section and Panel Data, 2nd edition. (MIT Press, 2010), 723-776
33. Routes 212, 214, 216, 217, 218, 219, 221, 226, 240, 241, 245, and 271.
34. King County Metro Transit, “2014 Rider Survey Final Report Summary,” (April, 2015), http://metro.kingcounty.gov/am/reports/2014/2014-rider-survey-summary.pdf (January 20, 2016), pg. 38.
35. Transportation Policy Board, “Stuck in Traffic: 2015 Report,” (March 12, 2015), http://www.psrc.org/assets/12332/Stuck_in_Traffic_-_2015_Report.pdf (January 20, 2016), pg. 3.
36. This is proved by noting that the actually achieved 2,288 hours X 44.5 boardings per hour is equal to (2,288 hours + 678 hours) X (44.5 boardings per hour – 10.2 boardings per hour). In other words, a service hour consumption 678 hours above the actual when multiplied by a boardings per hour number that is 10.2 boarding per hour lower yields the same actual boardings number that is the product of the actual 2,288 hours and the actual boardings per hour of 44.5.
37. Committee on Transitions to Alternative Vehicles and Fuels; Board on Energy and Environmental Systems; Division on Engineering and Physical Sciences; National Research Council, Transitions to Alternative Vehicles and Fuels, (National Academies Press, 2013), http://www.nap.edu/catalog.php?record_id=18264 (accessed July 30, 2015).
38. In Excel spreadsheet format at http://bettertransport.info/P&R parking fee calculator.xlsx (accessed April 24, 2016)
39. Shared-Use Mobility Center, “Shared Mobility and the Transformation of Public Transit, American Public Transportation Association, http://www.apta.com/resources/reportsandpublications/Documents/APTA-Shared-Mobility.pdf (accessed April 8, 2016).
40. King County Metro Online “About Metro,” http://metro.kingcounty.gov/am/ (accessed July 23, 2016).
41. Santa Clara Valley Transportation Authority Home Page, http://vta.org (accessed July 23, 2016).
42. LA Metro Home Page, http://Metro.net (accessed July 23, 2016).
43. Community Transit Home Page, http://commtrans.org (accessed July 23, 2016).

Mineta Transportat ion Inst i tute
84Endnotes
44. Community Transit, “System Maps,” https://communitytransit.org/busservice/systemmaps/, (accessed January 25, 2016).
45. Pierce Transit Home Page, http://piercetransit.org (accessed July 23, 2016).
46. Pierce Transit, “System Map,” http://www.piercetransit.org/system-map/, (accessed January 25, 2016).
47. We assume that riders on the orange route commute toward one of the employment centers.

Mineta Transportat ion Inst i tute
85
ABOUT THE AUTHORS
JOHN S. NILES, MS
John Niles is Research Director at the Seattle think tank Center for Advanced Transportation and Energy Solutions (CATES), and a Research Associate of the Mineta Transportation Institute. His research interests include high-technology vehicle deployment strategies and impacts, urban transportation policy, and public transit productivity. John is the author or co-author of many reports and essays, including a chapter in the book Road Vehicle Automation (Springer, 2014) and the essay “Planning for transportation-as-a-service” in Ontario Planning Journal. He earned an MS in industrial administration at Carnegie Mellon University and a bachelor’s degree in mathematics from Massachusetts Institute of Technology.
J.M. POGODZINSKI, PhD
Mike Pogodzinski is Professor of Economics at San Jose State University and a Research Associate of the Mineta Transportation Institute. His primary research interests are GIS applications in transportation, economic development, education, urban analysis, and public finance. Mike is the co-author of the book Economic Development and GIS (ESRI Press 2012). He has published numerous peer-reviewed papers in urban and public finance economics. He earned his PhD and M.A. in economics at the State University of New York at Stony Brook, and a bachelor’s degree in industrial and labor relations from Cornell University.

Mineta Transportat ion Inst i tute
86
PEER REVIEW
San José State University, of the California State University system, and the MTI Board of Trustees have agreed upon a peer review process required for all research published by MTI. The purpose of the review process is to ensure that the results presented are based upon a professionally acceptable research protocol.
Research projects begin with the approval of a scope of work by the sponsoring entities, with in-process reviews by the MTI Research Director and the Research Associated Policy Oversight Committee (RAPOC). Review of the draft research product is conducted by the Research Committee of the Board of Trustees and may include invited critiques from other professionals in the subject field. The review is based on the professional propriety of the research methodology.

The Mineta Transportation Institute (MTI) was established by Congress in 1991 as part of the Intermodal Surface Transportation Equity Act (ISTEA) and was reauthorized under the Transportation Equity Act for the 21st century (TEA-21). MTI then successfully competed to be named a Tier 1 Center in 2002 and 2006 in the Safe, Accountable, Flexible, Efficient Transportation Equity Act:A Legacy for Users (SAFETEA-LU). Most recently, MTI successfully competed in the Surface Transportation Extension Act of 2011 to be named a Tier 1 Transit-Focused University Transportation Center. The Institute is funded by Congress through the United States Department of Transportation’s Office of the Assistant Secretary for Research and Technology (OST-R), University Transportation Centers Program, the California Department of Transportation (Caltrans), and by private grants and donations.
The Institute receives oversight from an internationally respected Board of Trustees whose members represent all major surface transportation modes. MTI’s focus on policy and management resulted from a Board assessment of the industry’s unmet needs and led directly to the choice of the San José State University College of Business as the Institute’s home. The Board provides policy direction, assists with needs assessment, and connects the Institute and its programs with the international transportation community.
MTI’s transportation policy work is centered on three primary responsibilities:
MINETA TRANSPORTATION INSTITUTELEAD UNIVERSITY OF MNTRC
Research MTI works to provide policy-oriented research for all levels of government and the private sector to foster the development of optimum surface transportation systems. Research areas in-clude: transportation security; planning and policy development; interrelationships among transportation, land use, and theenvironment; transportation finance; and collaborative labor-management relations. Certified Research Associates conduct the research. Certification requires an advanced degree, gener-ally a Ph.D., a record of academic publications, and profession-al references. Research projects culminate in a peer-reviewed publication, available both in hardcopy and on TransWeb, the MTI website (http://transweb.sjsu.edu).
Education The educational goal of the Institute is to provide graduate-lev-el education to students seeking a career in the development and operation of surface transportation programs. MTI, through San José State University, offers an AACSB-accredited Master of Science in Transportation Management and a graduate Certifi-cate in Transportation Management that serve to prepare the na-tion’s transportation managers for the 21st century. The master’sdegree is the highest conferred by the California State Univer-
sity system. With the active assistance of the California Department of Transportation, MTI delivers its classes over a state-of-the-art videoconference network throughout the state of California and via webcasting beyond, allowing working transportation professionals to pursue an advanced degree regardless of their location. To meet the needs of employers seeking a diverse workforce, MTI’s education program promotes enrollment to under-represented groups.
Information and Technology Transfer MTI promotes the availability of completed research to professional organizations and journals and works tointegrate the research findings into the graduate education program. In addition to publishing the studies, the Institute also sponsors symposia to disseminate research results to transportation professionals and encourages ResearchAssociates to present their findings at conferences. The World in Motion, MTI’s quarterly newsletter, coversinnovation in the Institute’s research and education pro-grams. MTI’s extensive collection of transportation-related publications is integrated into San José State University’s world-class Martin Luther King, Jr. Library.
The contents of this report reflect the views of the authors, who are responsible for the facts and accuracy of the information presentedherein. This document is disseminated under the sponsorship of the U.S. Department of Transportation, University Transportation Centers Program and the California Department of Transportation, in the interest of information exchange. This report does not necessarilyreflect the official views or policies of the U.S. government, State of California, or the Mineta Transportation Institute, who assume no liability for the contents or use thereof. This report does not constitute a standard specification, design standard, or regulation.
DISCLAIMER
MTI FOUNDER Hon. Norman Y. Mineta
MTI/MNTRC BOARD OF TRUSTEES
MNTRCMINETA NATIONAL TRANSITRESEARCH CONSORTIUM
Hilary Nixon, PhDResearch and Technology Transfer Director
Brian Michael JenkinsNational Transportation Safety and Security Center
Ben TripousisNational High-Speed Rail Connectivity Center
Asha Weinstein Agrawal, PhDNational Transportation Finance Center
Founder, Honorable Norman Mineta (Ex-Officio)Secretary (ret.), US Department of TransportationVice ChairHill & Knowlton, Inc.
Honorary Chair, Honorable Bill Shuster (Ex-Officio)ChairHouse Transportation and Infrastructure Committee United States House of Representatives
Honorary Co-Chair, Honorable Peter DeFazio (Ex-Officio) Vice ChairHouse Transportation and Infrastructure Committee United States House of Representatives
Chair, Nuria Fernandez (TE 2017)General Manager and CEO Valley Transportation Authority
Vice Chair, Grace Crunican (TE 2019)General ManagerBay Area Rapid Transit District
Executive Director, Karen Philbrick, PhDMineta Transportation Institute San José State University
Directors
Karen Philbrick, PhDExecutive Director
Peter Haas, PhDEducation Director
Joseph Boardman (Ex-Officio)Chief Executive OfficerAmtrak
Anne Canby (TE 2017)DirectorOneRail Coalition
Donna DeMartino (TE 2018)General Manager and CEOSan Joaquin Regional Transit District
William Dorey (TE 2017)Board of DirectorsGranite Construction, Inc.
Malcolm Dougherty (Ex-Officio)DirectorCalifornia Department of Transportation
Mortimer Downey* (TE 2018)PresidentMort Downey Consulting, LLC
Rose Guilbault (TE 2017)Board MemberPeninsula Corridor Joint Powers Board (Caltrain)
Ed Hamberger (Ex-Officio)President/CEOAssociation of American Railroads
Steve Heminger* (TE 2018)Executive DirectorMetropolitan Transportation Commission
Diane Woodend Jones (TE 2019) Principal and Chair of BoardLea+Elliot, Inc.
Will Kempton (TE 2019) Executive DirectorTransportation California
Art Leahy (TE 2018)CEOMetrolink
Jean-Pierre Loubinoux (Ex-Officio) Director GeneralInternational Union of Railways (UIC)
Abbas Mohaddes (TE 2018)CEOThe Mohaddes Group
Jeff Morales (TE 2019)CEOCalifornia High-Speed Rail Authority
Beverley Swaim-Staley (TE 2019) PresidentUnion Station Redevelopment Corporation
Michael Townes* (TE 2017) PresidentMichael S. Townes, LLC
Marlene Turner, PhD (Ex-Officio) Interim Dean, College of Business San José State University
Richard A. White (Ex-Officio)Interim President and CEOAmerican Public Transportation Association (APTA)
Bud Wright (Ex-Officio)Executive DirectorAmerican Association of State Highway and Transportation Officials (AASHTO)
Edward Wytkind (Ex-Officio)PresidentTransportation Trades Dept., AFL-CIO
(TE) = Term Expiration or Ex-Officio* = Past Chair, Board of Trustee

2012 Census of California Water Transit Services
MTI Report 12-02
Funded by U.S. Department of Transportation and California Department of Transportation
MT
I2012 C
ensus of California W
ater Transit ServicesM
TI Report 12-02
Decem
ber 2012