Embed Size (px)
Citation preview
Parasite Biology
21NIMR Annual Report 2007–08
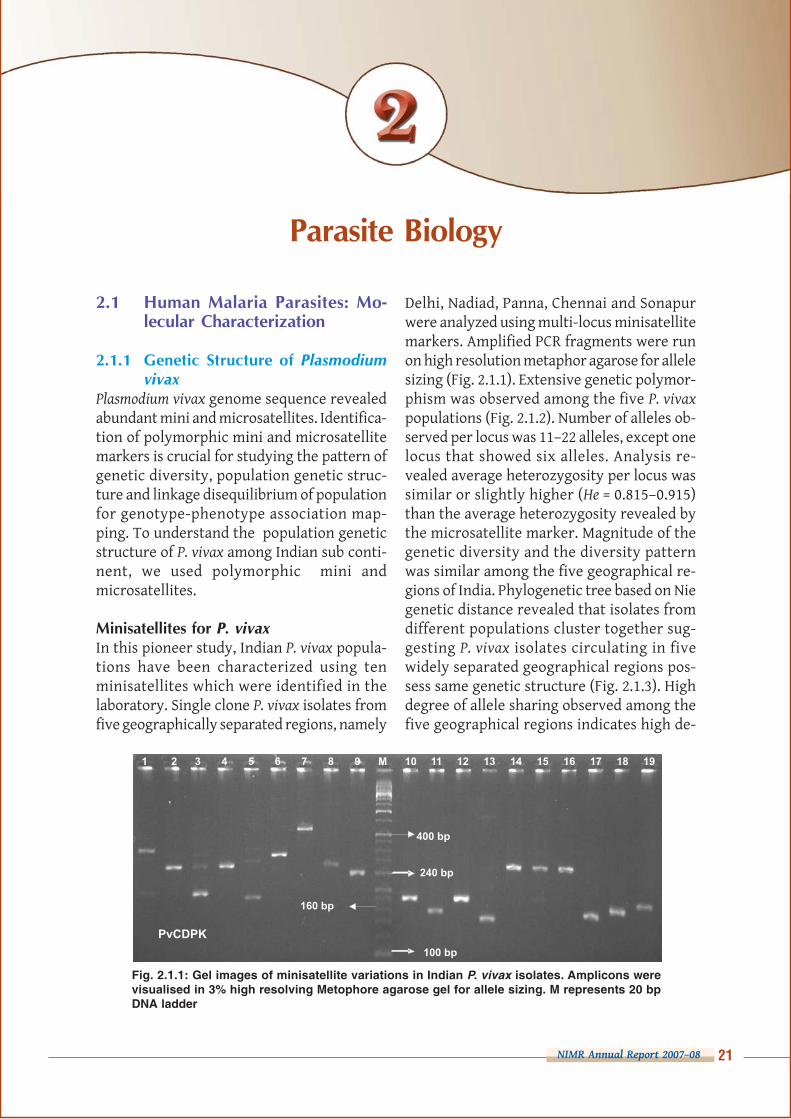
Fig. 2.1.1: Gel images of minisatellite variations in Indian P. vivax isolates. Amplicons werevisualised in 3% high resolving Metophore agarose gel for allele sizing. M represents 20 bpDNA ladder
1 2 3 4 5 6 78 9 M 10 11 12 13
100 bp
160 bp
240 bp
400 bp
PvCDPK
1 2 3 4 5 6 7 8 9 M 10 11 12 13 14 15 16 17 18 19
100 bp
160 bp
240 bp
400 bp
PvCDPK
1 2 3 4 5 6 78 9 M 10 11 12 13
100 bp
160 bp
240 bp
400 bp
PvCDPK
1 2 3 4 5 6 7 8 9 M 10 11 12 13 14 15 16 17 18 19
100 bp
160 bp
240 bp
400 bp
PvCDPK
Delhi, Nadiad, Panna, Chennai and Sonapurwere analyzed using multi-locus minisatellitemarkers. Amplified PCR fragments were runon high resolution metaphor agarose for allelesizing (Fig. 2.1.1). Extensive genetic polymor-phism was observed among the five P. vivax
populations (Fig. 2.1.2). Number of alleles ob-served per locus was 11–22 alleles, except onelocus that showed six alleles. Analysis re-vealed average heterozygosity per locus wassimilar or slightly higher (He = 0.815–0.915)than the average heterozygosity revealed bythe microsatellite marker. Magnitude of thegenetic diversity and the diversity patternwas similar among the five geographical re-gions of India. Phylogenetic tree based on Niegenetic distance revealed that isolates fromdifferent populations cluster together sug-gesting P. vivax isolates circulating in fivewidely separated geographical regions pos-sess same genetic structure (Fig. 2.1.3). Highdegree of allele sharing observed among thefive geographical regions indicates high de-
2.1 Human Malaria Parasites: Mo-
lecular Characterization
2.1.1 Genetic Structure of Plasmodium
vivax
Plasmodium vivax genome sequence revealedabundant mini and microsatellites. Identifica-tion of polymorphic mini and microsatellitemarkers is crucial for studying the pattern ofgenetic diversity, population genetic struc-ture and linkage disequilibrium of populationfor genotype-phenotype association map-ping. To understand the population geneticstructure of P. vivax among Indian sub conti-nent, we used polymorphic mini andmicrosatellites.
Minisatellites for P. vivax
In this pioneer study, Indian P. vivax popula-tions have been characterized using tenminisatellites which were identified in thelaboratory. Single clone P. vivax isolates fromfive geographically separated regions, namely
Parasite Biology

NIMR Annual Report 2007–08
Parasite Biology
22
Fig. 2.1.4: Neighbour-Joining phylogenetic tree de-rived from genetic distance scored at eightmicrosatellites showing genetic relationship amongIndian P. vivax isolates. Line colours in the phyloge-netic tree represent geographical origins of isolates.Blue, red, and green coloured lines represent Chennai,Delhi and Nadiad population isolates respectively
Fig. 2.1.2: Extent of genetic diversity and allele sharing in P. vivax isolates from five different populationsat minisatellite locus
Delhi Kheda Chennai Panna Kamrup
Delhi Nadiad Chennai
520
PvCDPK
0
0.2
0.4
0.6
0.8
1.0
150 160 170 180 190 200 220 230 240 256 268 280 310 320 330 360 380 400 440 500
AL
LE
LE
FR
EQ
UE
NC
YKamrup Panna Chennai Delhi Kheda
gree of gene flow among the widely separatedgeographical regions of India. The study sug-gests that minisatellites have potential resolv-ing power for genetic diversity.
Microsatellite Markers
Microsatellite markers were identified byscanning P. vivax genome sequence. About2–3 nucleotide repeat sequences with at least12–15 copy number (repeat number) were se-lected for the study. Eight microsatellites outof ten studied were observed to be highlypolymorphic. Number of alleles observed perlocus was 6–13 and heterozygosity among thestudy populations varied between 0.65 and0.90. High degree of allele sharing observed
Fig. 2.1.3: Neighbour-Joining phylogenetic treeshowing genetic relationship among Indian P. vivaxisolates using ten minisatellites
among the isolates from three geographicalregions namely, Delhi, Nadiad and Chennaiindicates high degree of gene flow among thewidely separated geographical regions of In-dia. Phylogenetic analysis reflected that P.
vivax isolates circulating in different geo-graphical regions cluster together, suggestiveof similar genetic structure among differentgeographical regions of India (Fig. 2.1.4).
2.1.2 Antigenic Repertoires of VaccineCandidates
Antigenic diversity in the natural parasitepopulations is the major obstacle in the devel-opment and success of effective antimalarialcontrol measures. Antigenic repertoires of


NIMR Annual Report 2007–08
Parasite Biology
24
lates showed 55 and 58% ‘New world’ isolatesrespectively. Similarly, Panna and Goa isolateswere predominantly of ‘New world’ type. Iso-lates of Car Nicobar also showed higher pro-portion of ‘New world’ (80%) isolates. On theother hand, isolates of Sonapur, Rourkela andRaipur were dominated by ‘Old world’ typeand their proportions were about 80%.
To understand the genetic structure and relat-edness of two sub-types (Old and New world),multi-locus genotyping was initiated. We usedhighly polymorphism marker, MSP-3α to iden-tify single clonal isolates using PCR-RFLPmethod. Analyses revealed about 20% of thetotal isolates are multi-clonal and the rest aresingle clones. One hundred single-clone iso-lates, comprised of 50 ‘Old world’ and 50 ‘Newworld’ types were selected from the pooled 354P. vivax isolates for further molecular charac-terization of point mutations in dhfr and dhpsgenes, known to be responsible for the py-
rimethamine and sulphad-oxine resistance respec-tively. In all, 100 isolates ofsuccessful amplification forPvdhfr and Pvdhps geneswere obtained. Amplified
PCR products were purified with the commer-cially available gel extraction kit and se-quenced. DNA sequences were edited andaligned with reference sequence (wild type) forboth the genes to identify mutant isolates.
n = 52
n = 52
n = 27
n = 49
n = 18
n = 18
n = 13
n = 26
n = 54
n = 354
New world (F)
Old world (S)
Both F & S
Fig. 2.1.6: Distribution of two P. vivax SSUrRNAsubtypes in India
ing. Dimorphic nature of SSUrRNA S type genewas observed among the isolates. Based onthe fragment size, a slow moving (S) 480 bpfragment (Old world ortype I) or fast moving (F)454 bp (New world ortype II) were designated.Distribution of both types ofS-type 18S SSUrRNA wasnearly equal among the study isolates, how-ever, their proportions varied among isolatesof different regions (Fig. 2.1.6). In Delhi, both‘Old’ and ‘New world’ isolates were in equalproportions, while Nadiad and Chennai iso-
“Both Old and New worldP. vivax subtypes are equallyprevalent all over India”
0
10
30
40
Single
mutant
Double
mutant
Quadruple
mutant
Wild
type
Single
mutant
Double
mutant
dhfr
Old world
20
50
Wild
type
dhps
New world
ALLELES
NU
MB
ER
OF
ISO
LA
TE
S
Fig. 2.1.7: Genotype wise distribution of dhfr/dhps alleles among ‘Old’ and ‘New world’sub-populations of P. vivax

Parasite Biology
25NIMR Annual Report 2007–08
Sequences obtained were submitted toGenBank vide accession numbers EU145878-EU145947 for dhfr and EU149665-EU149764 fordhps.
In the Pvdhfr gene, single, double and qua-druple mutants were observed alongwith wildtype genotype. In Pvdhps gene, limited pointmutations (single and double mutants) wereobserved. Proportion of mutant dhfr alleles
2.1.4 Molecular Determination of Chloro-
quine Resistance in Indian P. falci-
parum Isolates
Widespread use of chloroquine (CQ) for thepast few decades has led to chloroquine resis-tant parasites and emergence of clinical fail-ure of chloroquine treatment. Previous stud-ies on the Pfcrt (Plasmodium falciparum chloro-quine resistance transporter) gene, that is re-sponsible for the chloroquine resistance, re-vealed a heterogeneous situation of chloro-quine resistance in Indian P. falciparum iso-lates. These studies analyzed the randomlycollected samples and were not supportedwith clinical assessment of chloroquine effi-cacy, however, their results indicate Pfcrt geneas an attractive target for studying the epide-miological and molecular aspects of drug re-
NU
MB
ER
OF
ISO
LA
TE
S
0
10
20
Mutant
type
dhfr dhps
New world Old world
30
40
50
Wild
type
Mutant
type
Wild
type
ALLELES
Fig. 2.1.8: Distribution of dhfr/dhps mutant geno-types among ‘Old’ and ‘New world’ sub-populationsof P. vivax
“Proportion of mutant alleles(dhfr and dhps) conferring SPresistance was higher in Oldworld isolates than New worldisolates, though differences werenot statistically significant”
were more in Old world types (48%) comparedto New world types (40%). Similar scenario wasobserved for mutant dhps alleles, where mu-tant alleles were more in ‘Old world’ isolates(18%) compared to ‘New world’ isolates (10%).Proportions of wild and mutant alleles at bothdhfr and dhps loci in ‘Old world’ and ‘New world’isolates are given in Figs. 2.1.7 and 2.1.8. Simi-larly, proportions of mutant alleles conferringdrug resistance (double mutant) and higherlevel of resistance (quadruple mutant) weremore in ‘Old world’ isolates compared to ‘Newworld’ isolates, at both dhfr and dhps loci butthese differences were not statistically signifi-cant (χ2 = 1.98, df = 3, p = 0.577).
sistance. About 200 malaria patients enrolledfor the chloroquine (CQ) therapeutic efficacystudies and 68 uncomplicated malaria pa-tients from different geographical regionswere assessed for genetic basis of chloroquineresistance using molecular markers. Thestatus of point mutation responsible for CQresistance was assessed by PCR amplificationof Pfcrt gene. Three types of amino acidhaplotypes, encoding 72aa–76aa (amino acid)of Pfcrt protein, namely SVMNT, CVIET andCVMNK were observed. We observed theprevalence of SVMNT haplotype in both clini-cally sensitive (70%) and resistant (74%) iso-lates. The wild type CVMNK was found only in
“SVMNT (mutant) haplotypewas observed in both clinicallysensitive (70%) and resistant(74%) isolates, however, thewild type CVMNK was foundonly in clinically sensitive cases(20%). Prevalence of SVMNThaplotype is observed in allgeographical regions irrespectiveof endemicity of malaria”

NIMR Annual Report 2007–08
Parasite Biology
26
Fig. 2.1.9: Distribution of Pfcrt haplotypes among field isolates. (a) Prevalence of haplotypesin chloroquine-treated malaria cases and (b) Prevalence of haplotypes in high and lowmalaria endemic areas. ACPR— adequate clinical and parasitological response; ETF— earlytreatment failure; and LTF—late treatment failure
ACPR ETF LTF
CLINICAL RESPONSE
CVMNK
SVMNT
CVIET
NU
MB
ER
OF
ISO
LA
TE
S
0
10
20
30
40
50
60
70
80
0
5
10
15
20
25
30
35
40
Orissa Chhattis-
garh
Jhar-
khand
West
Bengal
Raja-
sthan
Tamil
Nadu
Gujarat Goa
High endemic area Low endemic area
Assam
NU
MB
ER
OF
ISO
LA
TE
S
(a)
(b)
clinically sensitive cases (20%) (Fig. 2.1.9a).Prevalence of SVMNT haplotype was ob-served in all geographical regions irrespectiveof endemicity of malaria. Proportion ofSVMNT was nearly 100% in low endemic ar-eas, while in high endemic areas all the threehaplotypes were observed (Fig. 2.1.9b).
2.1.5 Characterisation of the P. falci-
parum Strains Prevalent in North-
eastern States
Objectives of this study were: (i) to identifydrug resistant cases using therapeutic efficacyprotocol in P. falciparum and to validate usingmolecular markers; (ii) to generate data onparasitic diversity using microsatellite mark-ers, anchored primer amplification of DNA
(APAD) and resistant markers for chloroquine(CQ) and sulfadoxine-pyrimethamine (SP);and (iii) to correlate clinical and parasitologi-cal data with genotypic data.
Molecular Characteristics of Drug Resis-
tance Associated Mutations in Plasmodium
falciparum from Northeastern India
The therapeutic efficacies of commonly usedantimalarials were ascertained for the treat-ment of uncomplicated P. falciparum malariapatients who were enrolled for the follow-upof in vivo antimalarial response according toWHO protocol with regular clinical and para-sitological assessment.
Blood samples were collected from two sites;(i) PHC Kumarikata, District Nalbari (Indo-

Parasite Biology
27NIMR Annual Report 2007–08
Bhutan border area), Assam (KNA); (ii) CHCDalu, District Tura (Indo-Bangladesh borderarea), Meghalaya (DTM). Patients reportedwith fever were clinically examined. Boththick and thin blood smears were checked bymicroscopy for the presence of P. falciparum.Four to five drops of blood were spotted ontosterile filter paper (Whatman No. 3) strips intriplicate for molecular studies. Finger-prickblood samples (59 of KNA and 55 of DTM) weretaken from each patient before treatment.Post-treatment sample was also taken as andwhen the patients reported with parasitaemiaduring the 28-day follow-up period. DNA fromblood spots was extracted with Qiagen DNAmini kit according to manufacturer’s protocol.
Parasitized blood before and after treatmentwas analyzed by PCR assayfor variants in the targetgenes for pfcrt, dhfr anddhps. The nested mutation-specific PCR methods wereused to determine theprevalence of pfcrt alleleLys-76 and Thr-76 (K76T),dhfr polymorphism at 16,51, 59, 108 and 164 and dhpspolymorphism at 436, 437, 540, 581 and 613codon sites, respectively.
The unequal distribution of genotypes wasobserved in two areas. We found some of theisolates had mixed genotypes of both wild and
mutant (Fig. 2.1.10). Majority of the isolateshad Thr
76 mutation in pfcrt. The mutant geno-
types Ile51
, Arg59
and Asn108
of dhfr and Gly437
and Glu540
of dhps were significantly associatedwith the recrudescent parasites.
Analysis of Recrudescent Infection
Analysis of recrudescence in P. falciparum in-fection was done by genotyping of paired P.falciparum samples. Three paired P. falciparumsamples collected on Day 0 and on the day ofreappearance of parasitaemia were analyzedto distinguish between recrudescence andnew infection. Two genetic markers, MSP-1and MSP-2 were used for the genotyping bystudying length variations in repeat nucle-otide sequence regions. The genotyping of re-crudescence infections using three surface
protein markers, MSP-1,MSP-2 and GLURP revealedthat of five chloroquine fail-ure cases, only three hadsame genotype suggestiveof true drug failure (Fig.2.1.11). Similarly, for ACT, ofsix failure cases, four haddifferent genotypes sugges-tive of new infections. In
2007, studies based in Dalu CHC of West GaroHill district of Meghalaya along Indo-Banglaborder population groups revealed that ACTwas seemingly effective for the treatment ofP. falciparum cases. Of 54 cases, 51 (94%) wereACPR, and only 3 (6%) were late clinical fail-ures (LCF).
Genetic Diversity Study
Genetic diversity study in P. falciparum isolateswas done with MSP-1, MSP-2, GLURP andmicrosatellite markers. Ninety-six P. falci-parum isolates collected from Kumari Kata Dis-trict Nalbari, were analyzed with GLURP andthe results revealed polymorphic nature of thefield isolates and a total of 14 alleles werefound. Proportion of multi-clone isolates wereless compared to Dalu isolates. Microsatelliteanalysis using two loci (ARA2 and TAA60)
0
20
40
60
80
100
KNA (n = 59) DTM (n = 55)
K76 T76 K+T
PE
RC
EN
TIS
OL
AT
ES
Fig. 2.1.10: Prevalence of wild, mutant and mixedgenotypes of Pfcrt (KNA—Kumarikata, Nalbari dis-trict, Assam; DTM—Duke, Tura district, Meghalaya)
“Majority of the isolates fromnorth-eastern states had Thr
76
mutation in pfcrt. The mutationof Ile
51, Arg
59 and Asn
108 of dhfr
and Gly437
and Glu540
of dhpswere significantly associatedwith the recrudescent parasites”

NIMR Annual Report 2007–08
Parasite Biology
28
TAA 60
0
0.05
0.1
0.15
0.2
0.25
66 68 70 72 74 76 78 80 82 84 86 92 96
AL
LE
LE
FR
EQ
UE
NC
IES
ALLELES (SIZE IN BP)
ARA 2
64 66 68 70 72 74 76 78 80 82 84 86 92
ALLELES (SIZE IN BP)
AL
LE
LE
FR
EQ
UE
NC
IES
0.35
0.30
0.25
0.20
0.15
0.10
0.05
0
Fig. 2.1.11: Gel image showing variations in MSP-1 and MSP-2 gene allelic families in the Plasmodiumfalciparum field isolates
Fig. 2.1.12: Allelic frequencies of two microsatellite loci TAA60 and ARA 2 alleles in the population
500 bp
100 bp
MSP-1 K
500 bp
100 bp
MSP-1 K
100 bp
500 bp
MSP-1 M
100 bp
500 bp
MSP-1 M
100 bp
500 bp
MSP-2 F
100 bp
500 bp
100 bp
500 bp
MSP-2 F
100 bp
500 bp
MSP-2 D
100 bp
500 bp
MSP-2 D
revealed both loci were highly polymorphic inthe field isolates. Allele per locus was 13 andheterozygosity at both loci were 0.86 (ARA2)and 0.89 (TAA60). Allele frequencies per locusper allele were variable in the population (Fig.2.1.12). This high degree of genetic diversityat both loci in the field isolates of P. falciparumsuggests that microsatellite could be a poten-tial genetic marker for the recrudescence in-fection study.
Forty-eight P. falciparum isolates from Dalucollected during 2007 were analyzed for MSP-1and MSP-2 genes to assess the genetic diver-sity. The results revealed that the P. falciparum
isolates from Dulu were highly polymorphicand diverse. Proportion of multi-clone infec-tions (48.83%) was very high. MSP-1 gene hasthree allelic families, namely K, RO33 andMAD, of them only RO33 was monomorphic,whereas K and MAD were having wide allelerange in the population. Similarly, MSP-2 genehas two allelic families 3D7 and FC27 and bothwere polymorphic in the population. The dis-tribution of allelic families in the MSP-1 andMSP-2 varied in the population (Fig. 2.1.13).Studies on microsatellite markers are inprogress for more number of loci to resolvethe genetic diversity and their pattern in thepopulations.

Parasite Biology
29NIMR Annual Report 2007–08
Data generated on clinical efficacy of drugswill be validated by molecular markers as wellas prevalence of drug resistance related mark-ers among the field isolates, thus, generatingaccurate data on problem of drug resistance inthe area.
2.1.6 Genotyping of Plasmodium falci-
parum parasites using Anchored
Poly-A and Poly-T oligonucleotides
from Northeastern India
Malaria parasites provide an excellent systemto study the genomic effects of strong selectionin a recombining eukaryote. The genetic struc-ture of P. falciparum shows deletion and rear-rangement of chromosome segments, expan-sion or shortening in the number of repetitiveelements, point mutations and size polymor-phism. These changes seem to be one of the im-portant mechanisms to help the parasites inevasion of host immunity for their survival. Acouple of markers have been developed forgenotyping of parasites; anchored primer am-
plification of DNA (APAD) is one of them. Thisis a recently developed method, which readilydisplays genetic difference in A-T rich DNA se-quences.
Blood samples of P. falciparum patients col-lected from two sites: (i) PHC Kumarikata, Dis-trict Nalbari (Indo-Bhutan border area), Assam(KNA); and (ii) CHC Dalu, District Tura (Indo-Bangladesh border area), Meghalaya (DTM)were analysed by APAD. DNA extraction wasperformed with Qiagen DNA mini kit accord-ing to manufacturer’s protocol. APAD was per-formed by using different sets of Poly-A and
0
5
10
15
20
25
30
35
40
K MAD RO33 3D7
MSP-1 MSP-2
NU
MB
ER
OF
ISO
LA
TE
S
FC27
Fig. 2.1.13: Distribution of MSP-1 and MSP-2 allelicfamilies in the population
“The APAD method could be auseful tool for parasitegenotyping”
Fig. 2.1.14: Different isolates of P. falciparum showing variations by the primerA14GCATCG by APAD; M=100 bp
Poly-T primers with di- to hexa-nucleotide an-chored at 3’end. Out of these primers, somewere giving smear or no bands, so were ex-cluded from the study and some selected prim-ers giving discrete bands were used for furtherstudy. Mostly di- and tri-nucleotide anchoredprimers produced smears or no bands. Most ofthe penta– and hexa-nucleotide anchoredprimers produced discrete bands.
Following primers produced discrete bands:(1) A
14GCATCG (5) A
15GTGTA
(2) A14
GGTTCC (6) T14
CGACGA(3) A
14CGACGA (7) T
14 GCAGCA
(4) A14
CATGCC (8) T15
GTCTA

NIMR Annual Report 2007–08
Parasite Biology
30
Twenty isolates have been studied for geneticdiversity study. Some primers gave multipleand distinct bands with all the isolates andsome show slight differences in the pattern ofbands. Differences in the patterns of bandswith the same primer in P. falciparum parasitesrevealed diversity among the isolates ob-tained from different patients (Figs. 2.1.14 and2.1.15).
This method can be very useful for identifyingpolymorphism that can distinguish closely re-lated parasite isolates. This method is veryuseful for rapid parasite typing because largenumber of loci in the genome can be checkedquickly. This method also provides a poten-tially powerful tool for developing geneticmarkers from different parasite species.
2.2 Parasite Immunology
2.2.1 Naturally Acquired Immune Re-
sponses to Stage-specific P. falci-
parum and P. vivax Antigens in a
Population of Central India
The study has been initiated with objectives:(i) to characterize immune responses to stage-specific P. falciparum and P. vivax antigens inchildren and adults naturally exposed to ma-laria; (ii) to study the development and main-tenance of immune responses in different agegroups with emphasis of infants, their oldersiblings and mothers, including identificationof epitopes that correlate with protection; (iii)to determine the role of stage-specific anti-gens in the development and maintenance ofnatural immunity to malaria; and (iv) to
evaluate the immune mechanisms, those areinvolved in pathogenesis of malaria, espe-cially anaemia, cerebral malaria and placentalmalaria. The study was conducted in threepopulations. They are: (i) infants, children andadults from the community; (ii) pregnantwomen from the community; and (iii)Hospitalised patients with severe malaria.Peripheral blood, placental and cord blood atdelivery were taken for determining the anti-bodies against species and stage-specific anti-gens by enzyme immunoassay. The antibodylevels were quantified using known antima-larial antibody (positive controls) and this al-lowed us to estimate antibody levels in O.D.values. Sera from non-endemic healthy sub-jects were taken as negative control (Figs.2.2.1 and 2.2.2). Cellular response was deter-mined in peripheral blood mononuclear cellsby lymphocyte transformation test in thepresence of P. falciparum and P. vivax antigensand cytokines (IL-4 and IFN-γ) level was esti-mated in activated T-lymphocytes culture su-pernatant by sandwich ELISA. The peripheralblood mononuclear cells (PBMC) were isolatedfrom venous blood of subjects who have pastexperience of malaria and the proliferative re-sponses against P. falciparum and P. vivax anti-gens (5 each) were determined in individualset of PBMCs. Only a subset of adults and olderchildren above 14 years were participated inthis study. In general, the study subjects re-sponded to T-cell epitopes. The mean stimu-lation index (SI) was not significantly differ-ent among positive responders. The SI of >2was taken as cut-off to determine the positiveresponders. The in vitro stimulation of T-cells
Fig. 2.1.15: Different isolates of P. falciparum showing variations by the primer A14GGTTCCby APAD; M=100 bp

Parasite Biology
31NIMR Annual Report 2007–08
Fig. 2.2.2: Responder frequency to Plasmodium vivax antigens
from malaria-exposed donors results in theproduction of IL-4 and IFN-γ in concordancewith the serum concentrations of antibodiesspecific for the antigens used for lymphocytestimulation (Figs. 2.2.3 and 2.2.4). Peripheralblood from healthy cohort participants andP. falciparum malaria patients were taken forthe estimation of cytokines (IL-4, IL-10, IP-10,IFN-γ and TNF-α) in plasma using commer-cially developed two-site ELISA assay kits.
Study needs to identify the antigen-specificantibody responses in the serum of pregnant
0
20
40
60
80
100
CSP MSP-1 MSP-2 AMA-1 RAP-1 EBA-175 PfG27
ANTIGENS
<1 (n = 76) 1–<5 (n = 66) 5– <15 (n = 47) >15 (n = 198)
PE
RC
EN
TR
ES
PO
ND
ER
S
Fig. 2.2.1: Responder frequency to Plasmodium falciparum antigens
0
20
40
60
80
100
CSP MSP-1 MSP-2 AMA-1 PvG25 PvG28
ANTIGENS
<1 (n = 76) 1–<5 (n = 66) 5– <15 (n = 47) >15 (n = 198)
PE
RC
EN
TR
ES
PO
ND
ER
S
women who do not suffer from the placentalmalaria, which may suggest that these anti-bodies are important for protecting themother against infection. Antibodies pro-duced by adults (mothers) were correlatedwith protection. Therefore, it is important todetermine if infants mount antibody re-sponses to species and stage-specific antigensand the association between infant’s antibod-ies with protection. An important componentof this study is to understand the role of im-munologic factors in the pathogenesis of se-vere malaria. The current understanding of

NIMR Annual Report 2007–08
Parasite Biology
32
2.2.2 Parasite Growth Inhibition and
ELISA IgG Responses by Antibody
Dependent Cellular Inhibition
(ADCI) Assay
Batches of high antibody titer sera from clini-cally immune subjects were tested for theireffect in growth of P. falciparum in vitro by an-tibody dependent cellular inhibition (ADCI)assay in the presence of peripheral bloodmonocytes. The isolation of monocytes wasdone from peripheral whole blood of healthyadults, who had no past malaria history. Awell-adapted, stable culture line of P. falci-parum was used for determining the effect ofvarious sera in the parasite growth. The aver-age rate of multiplication of this strain was8–10 fold after 96 h. Sera of clinically immuneindividuals (n = 20) with high antibody titerwere taken for the assay. They were tested at1 : 10 dilution for their effect on the parasitegrowth in the absence of monocytes bygrowth inhibition assay or in the presence ofmonocytes by ADCI assay in an established P.falciparum culture line. Culture synchronizedat ring stage was added in 96-well flat bottomtissue culture plates at 5% hematocrit with 1%parasitaemia. Assay was done for 48 h at 37 oCby Candle-jar technique. Growth of the para-site (development and multiplication) wasmonitored microscopically in thin smearscounting number of ring and early trophozo-ite stages. The sera showed growth inhibitionat a range of 33–67%, but same sera showedenhancement of 49–82% in the presence ofmonocytes. The control serum pool also
Fig. 2.2.4: Cytokine level in lymphocyte culture su-pernatant with Plasmodium vivax antigens
0
10
20
30IL-4 IFN-�
ME
AN
CO
NC
EN
TR
AT
ION
(PG
/ML
)
PvCSP PvMSP1 PvMSP2 PvAMA1 PvG28
ANTIGENS
0
10
20
30 IL-4 IFN-�
MSP-119
MSP-142
MSP-183
PfAMA-1 PfpoolAg
ME
AN
CO
NC
EN
TR
AT
ION
(PG
/ML
)
ANTIGENS
Fig. 2.2.3: Cytokine level in lymphocyte culture su-pernatant with Plasmodium falciparum antigens
the immunology of severe malaria is mostlybased on African studies. However, Indianpopulations face a different epidemiologicsetting due to differences in the malaria trans-mission and occurence of both P. falciparumand P. vivax.
As proposed in the project, data on allabove parameters would be generatedto fulfill the objectives in more numberof samples for determining the role of stage-specific antigens in the development andmaintenance of immune responses in differ-ent age groups with emphasis on infants andmothers. Cellular immune responses andcytokine profiles in both P. falciparum andP. vivax patients would also be determined bya hospital-based survey.
0
10
20
30
40
50
60
70
80
90
100
0 2 4 6 8 10 12 14 16 18 20 22
SAMPLES
Serum Serum + Monocytes
%M
II
Fig. 2.2.5: Merozoite invasion inhibition (MII) in theabsence or presence of monocytes

Parasite Biology
33NIMR Annual Report 2007–08
showed an average of 12.3% inhibition in thepresence of monocytes. Therefore, test serumshowing monocyte-mediated inhibitionabove 15% (Mean ± 2 SD; 12.3 ± 2.7) was consid-ered significant. All 20 sera, which showedability to promote monocyte-mediated cyto-toxicity to P. falciparum had substantial level ofantigen-specific IgG (Fig. 2.2.5). However,there was no significant correlation betweenthe presence of antibodies and merozoite in-vasion inhibition.
The biological function of antibodies detectedby ELISA was assayed in P. falciparum culturefor their ability to inhibit the parasite growth.All 20 clinically immune donors had antibod-ies to merozoite stage antigens substantially.However, all of them could not cause signifi-cant inhibition of parasite multiplication. Theaddition of monocytes to cultures containingthese antibodies affected parasite multiplica-tion to some extent with all the sera. It is to beexpected that sera containing cytophilic oropsonic antibodies mediate in phagocytosis offree merozoites causing inhibition in merozo-ite invasion of new RBC. The lack of signifi-cance of correlations between serum-depen-dent monocytes-mediated cytotoxicity andantibodies may indicate the failure of the serato recognize appropriate antigens on the sur-face of infected erythrocytes. It was observedthat most of the sera, despite the presence of
high antibodies to blood stage antigens, couldnot substantially control parasite growthalone. Antibody-dependent monocytes-mediated antimerozoite activity has been sug-gested as one of the important in vivoantiparasite mechanisms. To monitor suchmechanisms, appropriate assays would be es-sential to provide feed back in the vaccinedevelopment.
2.2.3 Purification and Characterization of
Monoclonal Antibodies against
Erythrocytic Stages of Plasmodium
vivax
This is in continuation of the earlier work re-lated to characterization of monoclonal anti-bodies. Of the 27 hybridomas, 15 lines wererevived. They were grown in vitro. Theseclones were taken for antibody productionand characterization. Supernatant of eachculture line was tested by ELISA for antibodyagainst P. vivax, P. falciparum and human-NRBClysate. Fifteen P. vivax antibody positive cloneswere characterized by immunoglobulinisotyping by ELISA. Of the 15 hybridomas, 13produced IgG type of antibody, one showedboth IgG and IgM responses and one pro-duced IgM type antibody. Of the 13 IgG pro-ducing hybridomas, 11 showed stable growthand by subclass analysis these were found tobe IgG1 type (Fig. 2.2.6). Culture supernatantfrom 11 growing hybridomas was tested for
0
0.2
0.4
0.6
0.8
1.0
1.2
1.4
1.6
1.8
2.0
HYBRIDOMAS
IgG IgG1 IgG2a IgG2b IgG3
Hyb-1 Hyb-2 Hyb-3 Hyb-4 Hyb-5 Hyb-6 Hyb-7 Hyb-8 Hyb-9 Hyb-10 Hyb-11 Sp20
ME
AN
AB
SO
RB
AN
CE
Fig. 2.2.6: Immunoglobulin subclass analysis of hybridomas

NIMR Annual Report 2007–08
Parasite Biology
34
their reactivity with P. vivax erythrocyticstages by IFA test. All 11 MAbs reacted withblood stages of P. vivax with varying intensity.Of the 11 monoclonals, 8 were tested on dot-blots with patients’ blood samples. The P. vivaxcrude antigen (PvC) was subjected to SDS-PAGE to check the bandpatterns on the gel. Pro-teins from the unstainedSDS-PAGE slab gel weretransferred electrophoreti-cally to polyvinylidenedifluoride (PVDF) mem-brane. They were used todevelop Western blot by re-acting with six MAbs. OnWestern blot, each MAb re-acted with proteins of P.vivax lysate. Seroreactivity of 6 MAbs was alsodetermined against PvC antigen by competi-tive binding assay in an indirect ELISA. The ad-dition of second MAb showed a rise inseroreactivity as observed in percent increasein antibody binding. Dot ELISA showed spe-cific reaction of monoclonal antibodies with P.vivax infected patients’ blood.
2.2.4 Circulatory Cytokines in Clinically
Active Plasmodium vivax Infection
Malaria parasites have evolved to acquire di-verse immune evasion mechanisms that
evoke poor immune responses and allow in-fection to individuals previously exposed. Themalarial parasite, P. vivax is sensitive to in-flammatory response, and thus, the circulat-ing cytokine evaluation has attracted interestin the field of diagnosis, therapeutics and
monitoring in view of ma-larial and clinical complica-tions. Our knowledge of thecytokine profile and imbal-ance in cytokine network inclinical severity, pathogen-esis, protection and suscep-tibility of vivax malaria isvery limited. Thus, to estab-lish its relevance to activeclinical vivax malaria aswell as the clinical response
of pro- and anti-inflammatory cytokine in se-verity, pathogenesis and diagnosis of disease,we investigated the impact of the content ofTNF-α, IL-2, IL-6, IL-8, IFN-γ, IL-10 and IL-12 inserum of adults with an emphasis of clinicallydefined heterogeneous groups. Thesecytokines were evaluated because of their bio-logical relevance in inflammatory andimmunomodulatory responses in order toobtain a global measure of the patients’ actualreactivity towards Plasmodium challenge. Wealso studied the association and specific in-volvement in terms of clinically heteroge-
“Humoral responses to theerythrocytic stage antigens wereacquired in an age-dependentmanner during natural course ofinfection, and these seracontaining antigen-specificantibodies mediated in parasitephagocytosis”
Fig. 2.2.7: Differences inserum cytokine levels ofTNF-α (1, 2)α (1, 2)α (1, 2)α (1, 2)α (1, 2), IL-6 (3,4),IL-10 (5,6), IFN-γ γ γ γ γ (7,8), IL-8(9,10), IL-12 (11,12) andIL-2 (13,14) (in pg/ml) inclinical vivax malaria ascompared to healthysubjects. Horizontal barsindicate cytokine wisemedians and SE for eachcytokine is denoted byerror bars; P— Patients;H— Healthy subjects
Parasite Biology
35NIMR Annual Report 2007–08
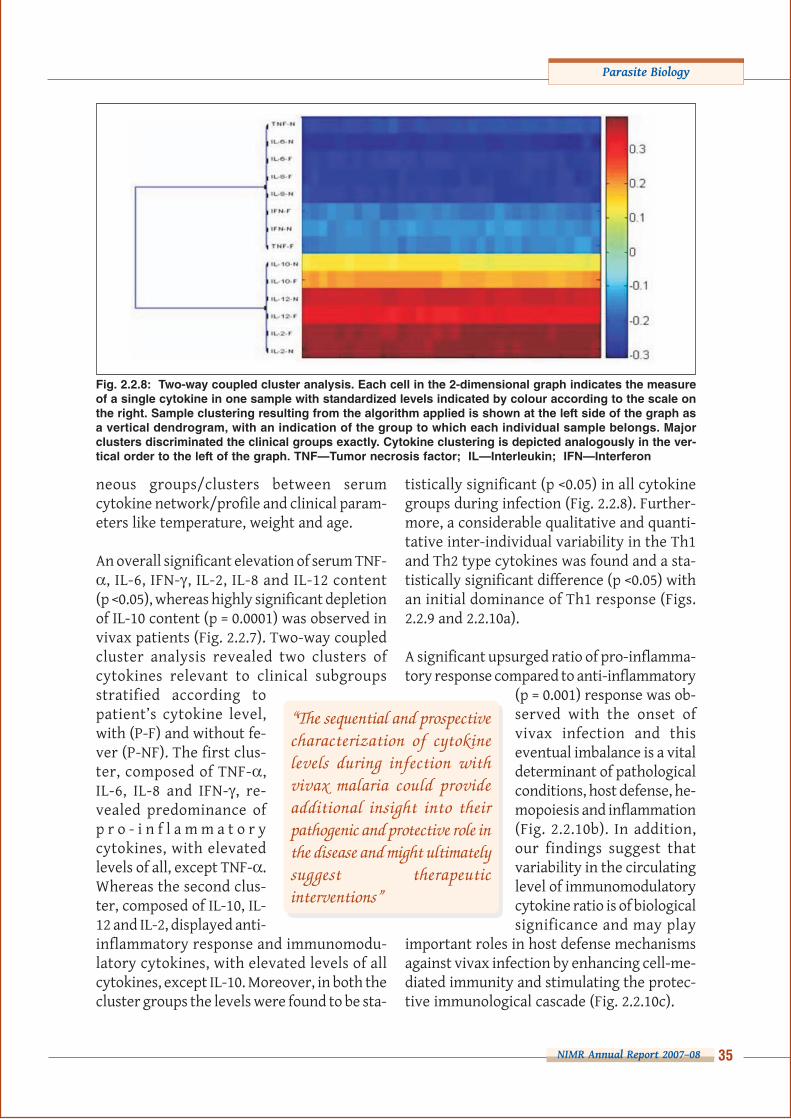
Fig. 2.2.8: Two-way coupled cluster analysis. Each cell in the 2-dimensional graph indicates the measureof a single cytokine in one sample with standardized levels indicated by colour according to the scale onthe right. Sample clustering resulting from the algorithm applied is shown at the left side of the graph asa vertical dendrogram, with an indication of the group to which each individual sample belongs. Majorclusters discriminated the clinical groups exactly. Cytokine clustering is depicted analogously in the ver-tical order to the left of the graph. TNF—Tumor necrosis factor; IL—Interleukin; IFN—Interferon
“The sequential and prospectivecharacterization of cytokinelevels during infection withvivax malaria could provideadditional insight into theirpathogenic and protective role inthe disease and might ultimatelysuggest therapeuticinterventions”
neous groups/clusters between serumcytokine network/profile and clinical param-eters like temperature, weight and age.
An overall significant elevation of serum TNF-α, IL-6, IFN-γ, IL-2, IL-8 and IL-12 content(p <0.05), whereas highly significant depletionof IL-10 content (p = 0.0001) was observed invivax patients (Fig. 2.2.7). Two-way coupledcluster analysis revealed two clusters ofcytokines relevant to clinical subgroupsstratified according topatient’s cytokine level,with (P-F) and without fe-ver (P-NF). The first clus-ter, composed of TNF-α,IL-6, IL-8 and IFN-γ, re-vealed predominance ofp r o - i n f l a m m a t o r ycytokines, with elevatedlevels of all, except TNF-α.Whereas the second clus-ter, composed of IL-10, IL-12 and IL-2, displayed anti-inflammatory response and immunomodu-latory cytokines, with elevated levels of allcytokines, except IL-10. Moreover, in both thecluster groups the levels were found to be sta-
tistically significant (p <0.05) in all cytokinegroups during infection (Fig. 2.2.8). Further-more, a considerable qualitative and quanti-tative inter-individual variability in the Th1and Th2 type cytokines was found and a sta-tistically significant difference (p <0.05) withan initial dominance of Th1 response (Figs.2.2.9 and 2.2.10a).
A significant upsurged ratio of pro-inflamma-tory response compared to anti-inflammatory
(p = 0.001) response was ob-served with the onset ofvivax infection and thiseventual imbalance is a vitaldeterminant of pathologicalconditions, host defense, he-mopoiesis and inflammation(Fig. 2.2.10b). In addition,our findings suggest thatvariability in the circulatinglevel of immunomodulatorycytokine ratio is of biologicalsignificance and may play
important roles in host defense mechanismsagainst vivax infection by enhancing cell-me-diated immunity and stimulating the protec-tive immunological cascade (Fig. 2.2.10c).
NIMR Annual Report 2007–08
Parasite Biology
36
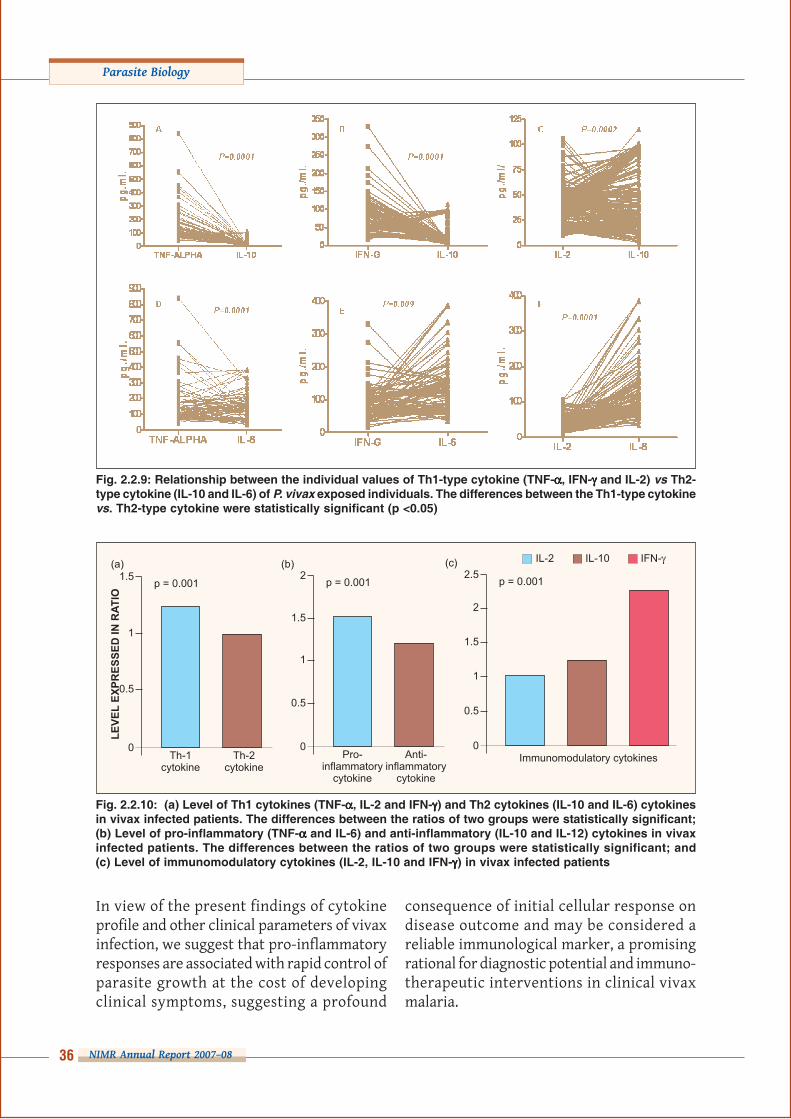
Fig. 2.2.10: (a) Level of Th1 cytokines (TNF-ααααα, IL-2 and IFN-γγγγγ) and Th2 cytokines (IL-10 and IL-6) cytokinesin vivax infected patients. The differences between the ratios of two groups were statistically significant;(b) Level of pro-inflammatory (TNF-ααααα and IL-6) and anti-inflammatory (IL-10 and IL-12) cytokines in vivaxinfected patients. The differences between the ratios of two groups were statistically significant; and(c) Level of immunomodulatory cytokines (IL-2, IL-10 and IFN-γγγγγ) in vivax infected patients
Fig. 2.2.9: Relationship between the individual values of Th1-type cytokine (TNF-ααααα, IFN-γγγγγ and IL-2) vs Th2-type cytokine (IL-10 and IL-6) of P. vivax exposed individuals. The differences between the Th1-type cytokinevs. Th2-type cytokine were statistically significant (p <0.05)
Th-1
cytokine
Th-2
cytokine
p = 0.001
LE
VE
LE
XP
RE
SS
ED
INR
AT
IO
1.5
1
0.5
0Pro-
inflammatory
cytokine
Anti-
inflammatory
cytokine
p = 0.0012
1.5
0.5
0
1
p = 0.0012.5
2
0.5
0
1.5
1
Immunomodulatory cytokines
IL-2 IL-10 IFN-�(a) (b) (c)
In view of the present findings of cytokineprofile and other clinical parameters of vivaxinfection, we suggest that pro-inflammatoryresponses are associated with rapid control ofparasite growth at the cost of developingclinical symptoms, suggesting a profound
consequence of initial cellular response ondisease outcome and may be considered areliable immunological marker, a promisingrational for diagnostic potential and immuno-therapeutic interventions in clinical vivaxmalaria.

Parasite Biology
37NIMR Annual Report 2007–08
2.3 Bioinformatics
2.3.1 Comparative Evolutionary Genomics
of Plasmodium falciparum and P.
vivax
Complex and rapidly evolving behaviours ofthe two human malaria parasites, P. falciparumand P. vivax have always been mysterious tothe evolutionary biologists as the former isthe most virulent and the latter is most preva-lent malaria parasite species across the globe.With the availability of whole genome se-quence data, it is now feasible to pinpoint ge-nomic similarities and differences betweenthe parasites with comparative evolutionarygenetic approaches and thus, define new mea-
sures for malaria control. We herewith uti-lized available genome information of thesetwo species and compared functional genes ofP. falciparum with partially-assembled wholegenome sequences of P. vivax. Four differentkinds of genes are present in the entire ge-nome of P. falciparum. The distribution of thesegenes are shown in Fig. 2.3.1. About 82% oftotal functional genes of P. falciparum werefound to be conserved in P. vivax and rest 18%to be unique to P. falciparum. Although bothtypes of genes were distributed across all 14chromosomes of P. falciparum, the distributionwas slightly biased towards two separatechromosomes for each category (Fig. 2.3.2).About a half of the conserved genes was in-tron-less, whereas almost all unique geneshave introns. However, number of intronswas comparatively higher (usually >2) in theintron-possessing conserved genes than inthe unique genes (mostly <2) (Fig. 2.3.3). Sta-tistically significant positive correlations be-tween total intron length and gene lengthswere detected in 11 chromosomes for uniquegenes, whereas only in three chromosomesfor conserved genes. Three most conservedgenes (Actin, Elongation factor alpha 1 and Ri-bosomal protein L 10 putative) between P.falciparum and P. vivax were found to be highlyconserved in four other species of Plasmodium(except Actin gene in P. chabaudi) and were
Fig. 2.3.2: Different proportions of unique and conserved genes in chromosomes of P. falciparum
Functional
PutativeHypothetical
Pseudogene
Fig. 2.3.1: Total genes in P. falciparum genome.Note that the putative and functional categories (to-gether considered as functional) of genes have beenutilized in the present study
0
50
100
150
200
250
Chr 1 Chr 2 Chr 3 Chr 4 Chr 5 Chr 6 Chr 7 Chr 8 Chr 9 Chr 10 Chr 11 Chr 12 Chr 13 Chr 14
CHROMOSOMES OF P. FALCIPARUM
Conserved Unique
NU
MB
ER
OF
GE
NE
S

NIMR Annual Report 2007–08
Parasite Biology
38
mostly intron-less. Phylogenetic trees wereconstructed separately for each of the threegenes (Fig. 2.3.4); in two genes (Actin andElongation factor alpha 1) (Fig. 2.3.4 a, b) dif-ferent Plasmodium species were placed in al-most similar positions, whereas Ribosomal
protein L 10 putative show different relation-ships between Plasmodium species (Fig. 2.3.4c).Three unique gene families in three Plasmo-dium species (P. falciparum, P. vivax and P.knowlesi) were studied in detail for total intronlength and correlations between intronlengths and gene lengths, which corroboratefindings on the overall patterns of wholeunique genes of P. falciparum. The results arediscussed in terms of chromosome and intronevolution in Plasmodium in general, relevanceof introns in differential functions of P. falci-parum genes and genetic similarities and dif-ferences between P. falciparum and P. vivax andits implications in malaria, in particular.
2.3.2 Genetic Characterization and Evolu-
tionary Analysis of Human CD36
Gene
Understanding evolutionary genetic details ofimmune system genes responsible for infec-tious diseases is of prime importance concern-ing disease pathogenecity. Considering ma-laria as a devastating disease in the world in-cluding India, detail evolutionary understand-ing on human immune system gene is essen-tial. The primary aim of this study is to initiatework on such genes. To start with, we have con-sidered the human CD36 gene that is respon-sible in malaria pathogenesis. DNA sequencesof the human CD36 gene present in chromo-
2 1 0>4 4 3
CHROMOSOMES OF P. FALCIPARUM
0
50
100
150
200
250
Chr 1 Chr 2 Chr 3 Chr 4 Chr 5 Chr 6 Chr 7 Chr 8 Chr 9 Chr 10 Chr 11 Chr 12 Chr 13 Chr 14
Un
iqu
e
Un
iqu
e
Un
iqu
e
Un
iqu
e
Un
iqu
e
Un
iqu
e
Un
iqu
e
Un
iqu
e
Un
iqu
e
Un
iqu
e
Un
iqu
e
Un
iqu
e
Un
iqu
e
Un
iqu
e
Co
nse
rve
d
Co
nse
rve
d
Co
nse
rve
d
Co
nse
rve
d
Co
nse
rve
d
Co
nse
rve
d
Co
nse
rve
d
Co
nse
rve
d
Co
nse
rve
d
Co
nse
rve
d
Co
nse
rve
d
Co
nse
rve
d
Co
nse
rve
d
Co
nse
rve
d
NU
MB
ER
OF
GE
NE
S
Fig. 2.3.3: Distribution of genes with different intron numbers in conserved and unique genes in chromo-somes of P. falciparum
Fig. 2.3.4: (a) Phylogenetic status based on actin;(b) Phylogenetic status based on elongation factoralpha 1; and (c) Phylogenetic relationship based onribosomal protein L10 putative
(a)P. knowlesi
P. vivax
P. falciparum
P. berghei
NA
37.8
100
P. yoelii yoelii
P. yoelii yoelii
P. knowlesi
P. falciparum
P. chabaudiNA
100
100
99.5
P. berghei
P. vivax
P. vivax
P. berghei
P. yoelii yoelii
P. chabaudi
P. falciparum
P. knowlesiNA
100
58.9
78.3
(b)
(c)


NIMR Annual Report 2007–08
Parasite Biology
40
Macaca mulatta
Gallus gallus
Canis familiaris
Homo sapiensPan troglodytes
Rattus norvegicus
Mus musculus
0.179
0.481
0.295
0.013
0.439
0.472
0.4900.010
0.1620.015
0.040
0.025
Fig. 2.3.8: Phylogenetic status of different taxa atCD36 gene. Values depict length of each branchleading to a single taxon
nificantly (Fig. 2.3.8). Gene copy number varia-tion was observed across different taxa (Fig.2.3.9). Comparative genomic study of a human
2.3.3 In silico Genetic Characterization
and Evolutionary Inference of TNF-αααααTNF-α is an important human cytokine thatimparts dualism in malaria pathogenecity. Athigh dosages TNF-α is believed to exhibitpathogenecity against cerebral malaria and atlower dosages TNF-α is protective against se-vere human malaria. In order to understandthe human TNF-α gene closely and to ascer-tain evolutionary aspect of its dualistic natureon malaria pathogenecity, we first character-ized this gene in detail in six different mam-malian taxa. The avian taxa, Gallus gallus were
“Cluster analysis of cytokinesrevealed that balance ofinflammation mediates hostdefence against vivax infectionand differential cytokine responsescorrelate with clinical outcomesand triggers clinical immunityduring active clinical malaria”
immune-system gene was conducted for thefirst time in CD36 gene, which revealed rela-tionships among different taxa at the evolu-tionary level. The information can be used forfuture study in this gene at the molecular level,especially the level of genetic diversity in ma-laria endemic zones and correlate it furtherwith malaria pathogenecity.
Homo sapiens
Pan troglodytes
Macaca mulata
Rattus norvegicus
Mus musculus
Canis familiaris
Gallus gallus
5� 3�
Fig. 2.3.10: Fine-scale characterization of TNF-αααααgene among six mammalian taxa with coding exons(red) and untranslated region (UTR) or non-codingexons (blue). For G. gallus information on the TNF-βββββ has been provided. The length of non-coding ex-ons, coding exons and introns are not in scale.
60
50
40
30
20
10
0
CO
PY
NU
MB
ER
Rattusnorvegicus
Gallusgallus
Canisfamiliaris
Homosapiens
Macacamulatta
Pantroglodytes
Musmusculus
TAXA
Fig.2.3.9: Copy numbers of CD36 gene in different taxa

Parasite Biology
41NIMR Annual Report 2007–08
included in the present study, as TNF-α is notpresent in birds, therefore, a tandemly placed
Fig. 2.3.11: Size distribution of exons and introns across all the seven taxa
8000
7000
6000
5000
4000
3000
2000
1000
0
SIZ
E(b
p)
Total size of intron
Rattusnorvegicus
Gallusgallus
Canisfamiliaris
Homosapiens
Macacamulatta
Pantroglodytes
Musmusculus
TAXA
Total size of exon
variation, intron and exon size and numbervariation, differential compositions of coding
“Genetic characterisation ofhuman TNF-α gene andcomparison among six mammaliantaxa ascertain evolutionaryaspects and dualistic nature inmalaria pathogenecity”
duplicate of TNF-α (LT-α or TNF-α) was in-cluded in this study (Fig. 2.3.10). Comparativestudy was performed on nucleotide length
“Comparative study ofP. falciparum functional geneswith other Plasmodium speciessignifies chromosome and intronevolution”
to the non-coding bases etc. to look for simi-larities/dissimilarities at the TNF-α geneacross all seven taxa (Fig. 2.3.11 & 2.3.12). The
Fig. 2.3.12: Proportion of total coding and non-coding nucleotide in TNF-ααααα gene across different taxa

NIMR Annual Report 2007–08
Parasite Biology
42
phylogenetic study revealed the patternfound in other genes, as human, chimpanzeeand rhesus monkey were placed in a singleclade and rat and mouse in another, with theG. gallus in a clearly separate branch (Fig.2.3.13). We further focused on these threetaxa and aligned the amino acid sequencesand found fewer differences between humanand chimpanjee but great differences were
Fig. 2.3.13: Taxonomic position of different taxa in an unrooted Neighbour-Joining tree at the TNF-α gene.The branch length values are shown at each branch leading to taxa. In case of G. gallus, the TNF- β genehas been considered, as the TNF-α gene is not present in the birds
0.146
0.098
0.058 0.056 0.014
0.076
0.061
0.028
0.019
0.308
Rattusnorvegicus
Mus musculusCanis familiaris
Macacamulatta
Pan troglodytes Homosapiens
Gallus gallus
observed in rhesus monkey from the othertwo taxa. Further, comparison of coding andnon-coding nucleotide length variations andcoding to non-coding nucleotide ratio be-tween TNF-α and TNF- β among these threemammalian taxa provided a first-hand indica-tion on the role of TNF-α gene, not its dupli-cate TNF-β in dualistic nature of TNF-α in ma-laria pathogenecity.