Embed Size (px)
Citation preview

ORIGINAL ARTICLE
Parametric study of the dynamic motions and mechanicalcharacteristics of power cables for wave energy converters
Shun-Han Yang1 • Jonas W. Ringsberg1 • Erland Johnson1,2
Received: 28 April 2016 / Accepted: 12 April 2017 / Published online: 28 April 2017
� The Author(s) 2017. This article is an open access publication
Abstract A case study of a point-absorber wave energy
converter (WEC) system is presented. The WEC system
forms an array, with several WECs located around a central
hub to which they are each connected by a short, free-
hanging power cable. The objective of the study is to
analyse the dynamic characteristics and estimate the fati-
gue life of the power cable which is not yet in use or
available on the commercial market. Hence, a novel
approach is adopted in the study considering that the power
cable’s length is restricted by several factors (e.g., the
clearances between the service vessel and seabed and the
cable), and the cable is subject to motion and loading from
the WEC and to environmental loads from waves and
currents (i.e., dynamic cable). The power cable’s charac-
teristics are assessed using a numerical model subjected to
a parametric analysis, in which the environmental param-
eters and the cable’s design parameters are varied. The
results of the numerical simulations are compared and
discussed regarding the responses of the power cables,
including dynamic motion, curvature, cross-sectional for-
ces, and accumulated fatigue damage. The effects of
environmental conditions on the long-term mechanical life
spans of the power cables are also investigated. Important
cable design parameters that result in a long power cable
(fatigue) service life are identified, and the cable service
life is predicted. This study contributes a methodology for
the first-principle design of WEC cables that enables the
prediction of cable fatigue life by considering environ-
mental conditions and variations in cable design
parameters.
Keywords Cable dynamics � Fatigue � Power cable � Wave
energy converter
1 Introduction
Recent research by Folley and Whittaker [1] has shown
that wave energy converters (WECs) should be grouped
into an array around a centrally shared hub for economic
viability. The energy produced by the WECs is collected
by the hub via power cables and then transmitted ashore.
Given the ocean environment in which WECs operate, the
cables are affected by other system components and envi-
ronmental loads, such as the motions of the WEC, motions
of the hub, wave loads, and currents. These factors result in
dynamic motions along the cable that influences its struc-
tural integrity and service life. A reliable cable design is
imperative for the cost-effective operation of WEC array
systems; however, it is challenging to design and select
appropriate cable properties because relevant field experi-
ence is lacking [2].
Several issues related to the structural safety of a cable
of this type regarding its operational limits have been
presented in the literature. First, the cable interior may
undergo fretting fatigue damage, which is a major factor
that contributes to internal component failure and, in the
worst case, the breakage of the entire cable [3, 4]. Second,
the complexity of the cable’s umbilical geometry can make
it difficult to accurately predict the axial stiffness and
bending stiffness of the cable. In addition, a realistic
& Shun-Han Yang
1 Department of Mechanics and Maritime Sciences, Chalmers
University of Technology, SE-412 96 Gothenburg, Sweden
2 Department of Safety-Mechanics Research, SP Technical
Research Institute of Sweden, P.O. Box 857,
SE-501 15 Boras, Sweden
123
J Mar Sci Technol (2018) 23:10–29
https://doi.org/10.1007/s00773-017-0451-0
analysis of cable characteristics must consider a variety of
environmental conditions, including currents and waves
[5]. Third, variations in the environmental loads, including
currents and waves, result in cable fatigue damage.
Moreover, because the cable is linked to a floating unit, the
interactions between the components and their motions
must be considered when evaluating the cable’s fatigue
damage [2, 4]. Finally, because the target operational ser-
vice life of a WEC system is generally 25 years, all of the
components in the WEC system, including the cable,
should be capable of withstanding ageing [6, 7].
Underwater power cables are used in several applica-
tions. Lane et al. [8] developed a customized procedure
capable of reflecting the nonlinear influences of the avail-
able materials and manufacturing procedures for flexible
risers. In addition, Olsen et al. [9] developed a friction
testing device that is capable of determining the friction
coefficients between all components in an umbilical riser.
To investigate the mobility of a remotely operated vehicle,
Katsui et al. [10] developed a numerical method for eval-
uating cable tension that includes the bending elasticity of
the cable. From a motion perspective, Fortaleza et al. [11]
investigated the dynamic behaviours of cables used to
connect vessel and sea floor equipment during equipment
installation, and Aranha and Pinto [12] presented an alge-
braic approximation for calculating the dynamic tension on
submerged lines induced by harmonic motion.
Major progress in the development of power cables has
been made since the beginning of the twenty-first century.
Karlsen [13] performed tests to measure tension and
bending responses to investigate the failure mechanisms of
power cables, Green et al. [14] evaluated the cost and
performance of cables and illustrated how they are affected
by the layout of an offshore wind farm, and Buitrago et al.
[15] developed a method for testing the fatigue damage of
entire cables. Regarding the umbilical cross section of a
cable, Silva et al. [16] studied the viability of using the
finite element (FE) method to calculate its allowable
bending radius and crush resistance, and Barbeiro and
Yamada da Silveira [5] performed a global analysis of the
force and stress responses of cables to investigate their
axial stiffness.
Research on cables specifically used in marine energy
systems has been presented by Thies et al. [2], who
developed a numerical approach for assessing the
mechanical loading and fatigue life of cables. Marta et al.
[17] reviewed different approaches for designing, mod-
elling and testing dynamic power cables that are used in
floating offshore renewable energy applications. They
found that best practices in the design of ‘‘novel’’ dynamic
power cables require performing a global load analysis,
with combined hydrodynamic and mechanical modelling,
along with both static and dynamic mechanical tests.
Trarieux et al. [18] presented valuable data on the curva-
ture of cables under certain environmental conditions and
assessed the causes of potential structural damage to a
cable. In their study, the cables were used to monitor
systems in the petroleum industry. However, similar mea-
surements are not currently available for the cables that are
used in floating WECs; therefore, loading analyses are
often based on tank tests and/or numerical model simula-
tions [19].
For a power cable connected to a floating unit (such as the
floating WEC discussed in the present study), its fatigue life
has been emphasized as a critical engineering challenge in
many of the abovementioned studies [2, 4, 13, 15, 17, 19].
Additional studies have also addressed the same issue:
Nasution et al. [20–22] conducted a series of experiments
and FE analyses to study the fatigue life of copper power
conductors. Their research provided insight into the failure
mechanisms of power conductors, and the fatigue properties
of the conductors were presented in S-N diagrams. Through
accelerated reliability tests, Thies et al. [23] investigated the
fatigue life of a pipe bend restrictor, which is used to protect
static submarine power cables used in offshore wind appli-
cations. Hansen-Zahl et al. [24] found that the static con-
figuration of umbilicals and risers has a marked impact on
their vortex-induced vibrations. In a configuration with a
larger curvature, higher modes are excited, resulting in a
shorter fatigue life.
This study investigates a new type of power cable that
will be used in an array of point-absorber-type WECs.
Compared with the cables that have been presented in the
literature, the power cable investigated here is unique in the
sense that it is relatively short (less than 100 m), has a high
degree of flexibility (i.e., a low bending stiffness), and is
designed to hang freely in the seawater rather than being in
contact with the seabed. Because no similar cable has been
presented in the literature for WEC applications, this study
contributes to knowledge regarding the design of this type
of power cable and its mechanical characteristics. With the
aim of assisting in the future development of free-hanging
cables for WECs, this study was conducted with two main
objectives. First, to develop a methodology (Sect. 2) which
enables the evaluation of the cable dynamics (Sect. 4.1)
and fatigue life (Sect. 4.3) against its actual environmental
conditions and loads (waves and currents). Second, to
identify cable design parameters that contribute to reducing
the fatigue damage to the cable (Sect. 4.2), and then pro-
pose a cable configuration that has a longer fatigue life
compared with that of the initial configuration (Sect. 4.3).
The main contribution of this study is the establishment of
an analysis procedure that enables fatigue-life estimation
for a free-hanging power cable used in WEC systems.
The paper is structured as follows. Section 2 presents
the developed simulation procedure and the software used
J Mar Sci Technol (2018) 23:10–29 11
123

to investigate the cable’s dynamics and fatigue life. The
case study WEC system is presented in Sect. 3. The cable
properties from an initial design based on preliminary
engineering judgement are presented in Sect. 3.3; and a
final and improved cable configuration is proposed as an
outcome of this study. Results of the study are presented
and discussed in Sect. 4. Section 4.1 elaborates on the
dynamic cable characteristics under various environmental
loads. Based on a parametric study, Sect. 4.2 compares
different cable design parameters with regard to the
dynamic response of the cable. A demonstration of the
fatigue analysis methodology and an evaluation of the
cable fatigue life are presented in Sect. 4.3. A new and
improved power cable configuration, enhanced with fatigue
life as the main objective function, is also presented in
Sect. 4.3. Finally, Sect. 5 presents the observations and
conclusions drawn from the investigation.
2 Methodology
In this study, numerical simulations are introduced to cal-
culate the motion response of an entire WEC system unit
within an array (see [2, 17] for a motivation for WEC unit
analysis), and a fatigue methodology is developed for the
fatigue damage analysis of a power cable attached to the
unit. The following sections provide a brief introduction to
the simulation procedure and software used.
2.1 Motion and structural response analysis
The purpose of the motion and structural response analyses is
to investigate the dynamic response of the power cable under
operational-mode conditions. The dynamics of a WEC sys-
tem can be simulated and analysed using both coupled and
de-coupled models. In the de-coupled model, a simulation is
carried out in two subsequential steps. First, the motion
responses of the WEC are calculated in a linear frequency-
domain analysis. The motion responses at the fairleads of the
mooring lines and the connection point of the cable are post-
processed and transferred to the time-domain. Second, in the
following nonlinear time-domain simulations, the responses
in the mooring lines and the cable are calculated based on the
previously calculated motion responses at the attachment
point as prescribed boundary conditions [25, 26]. In the
coupled model, the equations of motion of the WEC, the
mooring lines, and the cable are simultaneously solved using
a nonlinear time-domain analysis. Consequently, the
motions of the mooring lines and cable implicitly influence
the instantaneous mean position and dynamic response of the
WEC [27, 28]. More accurate predictions are expected using
the coupled model. Several types of simulation models and
various software tools have been investigated in previous
studies [29, 30]. From these investigations, it was concluded
that the coupled simulation model should be used to analyse
the structural responses of the moorings or cables in a WEC
system. Hence, the coupled analysis model was used in this
study.
The DNV DeepC [31] software was used to determine
the motions of the WEC system and the structural
responses of the cable. The coupled analysis required two
solvers that were incorporated in DeepC: SIMO [32] was
used to simulate the motions of the hub and the WEC buoy,
and RIFLEX [33] was used to perform the hydrodynamic
and structural analyses of the cable and mooring lines. The
structural responses of the cable were used as inputs for the
fatigue damage analysis (see Sect. 2.2). Specifically, we
used the curvatures, cross-sectional axial force, and bend-
ing moments determined from the structural responses
simulated by DeepC. Based on these results, the stress
components of the cable were calculated separately (see
Sect. 3.3 for details). Eventually, the total stress history
was derived for use in the fatigue damage analysis.
2.2 Fatigue damage analysis
The purpose of the fatigue damage analysis is to identify
fatigue-critical locations along the length of the cable and
to estimate the cable’s fatigue life and its dependence on its
design and environmental parameters. Hence, the fatigue
analysis was performed on a ‘‘global’’ model level
according to first-principle design, and the intrinsic failure
mechanisms of the cable and their physics were not con-
sidered in the model [17]. A detailed design based on the
first-principle design presented in this paper should
include, e.g., the influences of the wear, fretting, thermal
effects, and physical model of the cable, to achieve more
realistic fatigue lives. These phenomena and effects will be
investigated in future studies.
The cross section of the cable was simplified to a thick-
walled tube, see Sect. 3.3 for details. In the numerical
model, the cable was modelled using beam elements with
constant cross sections. Each cross section was assessed for
its weakest fatigue location by calculating the accumulated
fatigue damage at 12 points on the periphery of the thick-
walled tube, i.e., at the locations separated by an angle of
30�. Thus, the fatigue analysis results can be used to
identify fatigue-critical locations associated with variations
in the cable characteristics and environmental conditions.
Before obtaining a complete set of numerical simula-
tions, initial test cases were considered to study the stress
responses of the cable. These simulations showed that the
stress level of the cable is considerably lower than the
design yield stress of the current cable design. The stress-
based approach was therefore adopted in the fatigue
analysis.
12 J Mar Sci Technol (2018) 23:10–29
123

For the fatigue analysis, the stress history of the cable
was obtained from time-domain simulations (see
Sect. 2.1). In this study, only tensile stresses were assumed
to contribute to the fatigue damage in the fatigue analysis;
hence, the recorded negative (compressive) stresses were
set as zero prior to the cycle counting procedure. Next, the
rainflow-counting (RFC) method was used to extract the
stress cycles and their corresponding stress ranges from the
stress history for the fatigue analysis [34, 35]. The accu-
mulated fatigue damage (FD) was calculated using the
Palmgren–Miner cumulative rule and the S-N (stress-
number of cycles to failure) curve for the cable material
under consideration as follows:
FD ¼X
i
niSmi
að1Þ
where ni is the number of stress cycles with the stress range
Si, which is calculated using the RFC method, and a and
m are material parameters in the S-N diagram, which were
set to 6.098 9 1019 and 6.238, respectively, in this study
[22]. No fatigue limit was considered; thus, all of the stress
ranges contributed to the total fatigue damage. The fatigue
damage analysis was performed using an in-house code
developed in MATLAB [36].
3 Case study of the WEC system
Figure 1 shows the WEC array system considered in this
investigation, which is currently a candidate for full-scale
testing. The WEC array system consists of 8–10 WECs
with a central power-gathering hub that collects and
transmits the generated electricity to the shore. The con-
nection between a WEC and the hub requires a short power
cable (less than 100 m); these cables are the focus of this
study.
The hub is designed to remain in a static position in the
water, which implies that the connection point between a
cable and the hub can be considered to be a spatially fixed
point. Hence, no interactions or couplings arise between
the WECs through the hub’s motions, and our case study
model can be simplified to a single pair consisting of a
WEC and hub connected by a cable. According to the
environmental data from our potential test site near Runde,
Norway, the WEC array system is expected to be exposed
to external environmental loads induced by currents,
waves, and winds. However, wind loads are excluded from
the present investigation because of a lack of wind mea-
surement data at the actual test site as well as the detailed
design of the WEC buoy above the surface of the water; see
Sect. 4.3 for a discussion of the influence of this decision
on the estimated fatigue life of the cable. By using a
parametric study in which the current and wave directions
are varied, we can ensure that our case study model is
representative of any of the WECs in the WEC array
system.
Figure 2 shows the initial configuration of the simplified
system. The WEC is composed of a WEC buoy and its
positioning mooring system. The origin of our reference
Cartesian coordinate system is placed at the water plane at
the geometric centre of the WEC buoy when the buoy is
subjected to still-water conditions. The WEC buoy floats in
a water volume that is infinite in the horizontal x and
y directions and is finite in the z direction (see Fig. 2).
Under still-water conditions, the WEC buoy is positioned
54 m horizontally from the fixed hub. In the following
sections, the physical and numerical models of the WEC
array system and its various components will be described
along with the environmental loading conditions.
Fig. 1 Schematic of a WEC array system
Fig. 2 Illustration of the case study WEC system, including the WEC
and its moorings, the hub, the cable, and the definitions of the
coordinate axes
J Mar Sci Technol (2018) 23:10–29 13
123

3.1 WEC
The WEC is composed of a WEC buoy and its mooring
system, which is used for positioning. The WEC buoy is a
point absorber developed by the company Waves4Power
[37] and generates power from the movement of water
inside the tube at its centre. In this study, the numerical
model of the WEC buoy was simplified with the assistance
of the manufacturer. Figure 3 and Table 1 present the
geometric characteristics of the WEC buoy, which is
modelled as a closed buoy. The total modelled mass cor-
responds to the mass of the buoy plus the mass of the water
inside the tube under still-water conditions. According to
the initial design, water is accelerated in the central tube
(the region enclosed by the dashed line). A Morison model
was used to capture the viscous drag and transverse drag
damping effects from the tube. Constant damping of the
heave degree of freedom (DOF) was introduced to incor-
porate a linear power take-off (PTO) in the model for
power production [38]. Note that the WEC model is only
representative for the wave heights that define the opera-
tional-mode conditions for the current prototype WEC
system. It is not yet intended for use in simulating and
analysing extreme loading and survival-mode conditions,
which are currently defined to correspond to wave heights
greater than 8 m. For larger wave heights, the description
of the PTO model is still under development.
A catenary mooring system with four moorings, which
was first introduced based on a configuration suitable for a
point absorber WEC under strong heave and pitch motions
[26, 29], is considered in this study. The mooring lines are
symmetrically attached around the outer rim of the WEC
buoy (fairleads on the WEC buoy) and are located at
coordinates of (1.24, 1.24, -5.00 m), (-1.24, 1.24,
-5.00 m), (-1.24, -1.24, -5.00 m) and (1.24, -1.24,
-5.00 m). The moorings (chain mooring lines) are
anchored to the seabed at a horizontal distance of 77.58 m
from the fairleads on the WEC and at a depth of 50 m
under water. The boundary conditions at the anchor point
of each mooring line are fixed in all six DOFs at the seabed
level, whereas the connection to the WEC fairleads follows
its three translational DOFs but allows for free rotation.
Fig. 3 (Left) Illustration of the
full hydrodynamic model of the
WEC; (middle) the geometry of
the WEC buoy, where the
dashed region represents the
tube and 80% of the tube is
filled with water under still-
water conditions (units: m); and
(right) the geometry of the
Morison model used to evaluate
the viscous drag damping effect
from the motion of water (units:
m)
Table 1 Properties of the WEC buoy
Draft, T (m) 27.8
Centre of buoyancy (COB) (x, y, z) (m) (0, 0, -10.9)
Mass, MWEC (metric tonnes) 353.8
Centre of gravity (COG) (x, y, z) (m) (0, 0, -11.8)
PTO damping in heave DOF, BPTO (kNs/m) 197.1
14 J Mar Sci Technol (2018) 23:10–29
123
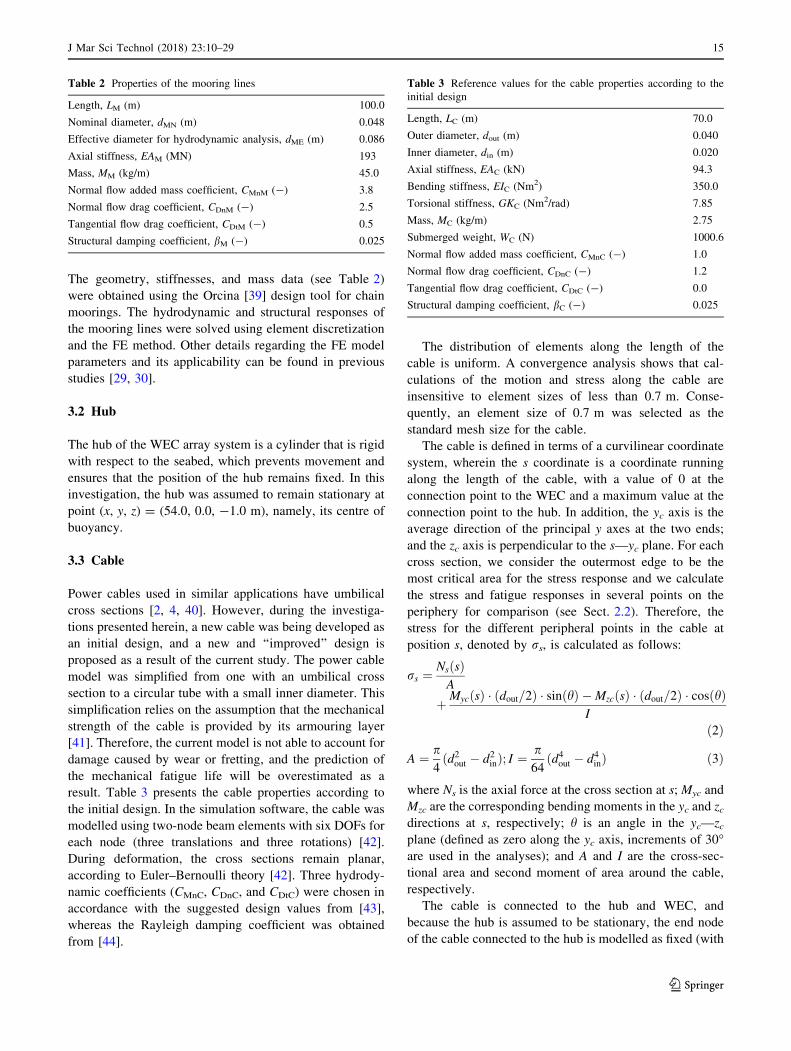
The geometry, stiffnesses, and mass data (see Table 2)
were obtained using the Orcina [39] design tool for chain
moorings. The hydrodynamic and structural responses of
the mooring lines were solved using element discretization
and the FE method. Other details regarding the FE model
parameters and its applicability can be found in previous
studies [29, 30].
3.2 Hub
The hub of the WEC array system is a cylinder that is rigid
with respect to the seabed, which prevents movement and
ensures that the position of the hub remains fixed. In this
investigation, the hub was assumed to remain stationary at
point (x, y, z) = (54.0, 0.0, -1.0 m), namely, its centre of
buoyancy.
3.3 Cable
Power cables used in similar applications have umbilical
cross sections [2, 4, 40]. However, during the investiga-
tions presented herein, a new cable was being developed as
an initial design, and a new and ‘‘improved’’ design is
proposed as a result of the current study. The power cable
model was simplified from one with an umbilical cross
section to a circular tube with a small inner diameter. This
simplification relies on the assumption that the mechanical
strength of the cable is provided by its armouring layer
[41]. Therefore, the current model is not able to account for
damage caused by wear or fretting, and the prediction of
the mechanical fatigue life will be overestimated as a
result. Table 3 presents the cable properties according to
the initial design. In the simulation software, the cable was
modelled using two-node beam elements with six DOFs for
each node (three translations and three rotations) [42].
During deformation, the cross sections remain planar,
according to Euler–Bernoulli theory [42]. Three hydrody-
namic coefficients (CMnC, CDnC, and CDtC) were chosen in
accordance with the suggested design values from [43],
whereas the Rayleigh damping coefficient was obtained
from [44].
The distribution of elements along the length of the
cable is uniform. A convergence analysis shows that cal-
culations of the motion and stress along the cable are
insensitive to element sizes of less than 0.7 m. Conse-
quently, an element size of 0.7 m was selected as the
standard mesh size for the cable.
The cable is defined in terms of a curvilinear coordinate
system, wherein the s coordinate is a coordinate running
along the length of the cable, with a value of 0 at the
connection point to the WEC and a maximum value at the
connection point to the hub. In addition, the yc axis is the
average direction of the principal y axes at the two ends;
and the zc axis is perpendicular to the s—yc plane. For each
cross section, we consider the outermost edge to be the
most critical area for the stress response and we calculate
the stress and fatigue responses in several points on the
periphery for comparison (see Sect. 2.2). Therefore, the
stress for the different peripheral points in the cable at
position s, denoted by rs, is calculated as follows:
rs ¼NsðsÞA
þMycðsÞ � ðdout=2Þ � sinðhÞ �MzcðsÞ � ðdout=2Þ � cosðhÞI
ð2Þ
A ¼ p4ðd2
out � d2inÞ; I ¼
p64
ðd4out � d4
inÞ ð3Þ
where Ns is the axial force at the cross section at s; Myc and
Mzc are the corresponding bending moments in the yc and zcdirections at s, respectively; h is an angle in the yc—zcplane (defined as zero along the yc axis, increments of 30�are used in the analyses); and A and I are the cross-sec-
tional area and second moment of area around the cable,
respectively.
The cable is connected to the hub and WEC, and
because the hub is assumed to be stationary, the end node
of the cable connected to the hub is modelled as fixed (with
Table 2 Properties of the mooring lines
Length, LM (m) 100.0
Nominal diameter, dMN (m) 0.048
Effective diameter for hydrodynamic analysis, dME (m) 0.086
Axial stiffness, EAM (MN) 193
Mass, MM (kg/m) 45.0
Normal flow added mass coefficient, CMnM (-) 3.8
Normal flow drag coefficient, CDnM (-) 2.5
Tangential flow drag coefficient, CDtM (-) 0.5
Structural damping coefficient, bM (-) 0.025
Table 3 Reference values for the cable properties according to the
initial design
Length, LC (m) 70.0
Outer diameter, dout (m) 0.040
Inner diameter, din (m) 0.020
Axial stiffness, EAC (kN) 94.3
Bending stiffness, EIC (Nm2) 350.0
Torsional stiffness, GKC (Nm2/rad) 7.85
Mass, MC (kg/m) 2.75
Submerged weight, WC (N) 1000.6
Normal flow added mass coefficient, CMnC (-) 1.0
Normal flow drag coefficient, CDnC (-) 1.2
Tangential flow drag coefficient, CDtC (-) 0.0
Structural damping coefficient, bC (-) 0.025
J Mar Sci Technol (2018) 23:10–29 15
123

neither translations nor rotations). The end node of the
cable follows the WEC in all six DOFs.
The boundary conditions near the hub and WEC will
influence the responses of the cable near these positions. At
this time, the detailed design of these connections is not
finalized; therefore, the investigation of all results starts at
1.4 m from the end, with the first two elements removed
from both ends of the cable to exclude any uncertainties in
the cable characteristics induced by the modelling of the
boundary conditions. These joints will be investigated
more thoroughly in future studies to determine whether
they will represent weak links in the system with respect to
fatigue.
3.4 Sea water
Sea water is modelled as an incompressible, inviscid, and
irrotational fluid. Thus, the theory of sea water dynamics is
based on potential flow, and the velocity components of sea
water are uniquely determined by the gradient of the har-
monic velocity potential. Although the water is assumed to
be inviscid, a nonzero kinematic viscosity was introduced
to model the viscous drag effect of the water on the cable
and moorings and in the Morison model of the WEC.
Additional descriptions of sea water can be found in
[42, 45]. Table 4 presents the sea water properties used in
the numerical model.
3.5 Wave
Regular waves were considered in this study to determine
the dynamic behaviour of the cable under different wave
conditions. Furthermore, restrictions were introduced under
the assumption of small wave amplitudes and Airy wave
theory [42, 45]. A regular wave is defined by its direction,
height, and period. In this study, these parameters were
systematically varied to study their effects (see Sect. 4.1.2
for details).
3.6 Current
The capability of the power cable to resist ocean currents is
emphasized as one of the key criteria for its design.
Therefore, a current generated by wind and tides was
considered. The WEC development company Waves4Power
[37] has performed ocean current measurements at the test
site. For this study, they provided a design value for the
current speed, which was set to 1.0 m/s. The vertical current
profile was estimated as described in [43]. The current
direction was varied as an independent variable in the
parametric investigation (see Sect. 4.1.2).
3.7 Seabed
The seabed is modelled as a horizontal plane with an
elastic normal stiffness of 1.0 MPa and a tangential friction
coefficient of 1.0. The normal stiffness is modelled as a
linear force–displacement relationship with no damping
[42]. In the case of mooring-seabed contact, the friction
force is calculated as the tangential friction coefficient
multiplied by the normal force that acts on the mooring
from the mooring-seabed contact.
3.8 Model of the contact between the cable
and the WEC
Section 3.7 describes the model of the contact between the
moorings and seabed. Other types of contacts may also be
relevant, such as the contact between the cable and the WEC
buoy. The software used in this study did not include a model
of the contact between the cable and the WEC buoy. Thus, if
such a contact were to occur, post-processing of the results
would show the cable penetrating through the WEC buoy.
Because of the absence of a contact model between the cable
and the WEC, this type of contact has no influence on the
results of the motion and structural response analyses of the
WEC system (see details in Sect. 4.1.1).
3.9 Solution method and numerical parameters
The equation of motion for the assembled FE model of the
WEC system can be written as follows [45]:
M€xþ D _xþ KxþZ t
0
hðt � sÞ _xðsÞds ¼ qðt; x; _xÞ ð4Þ
where €x, _x and x represent the acceleration, velocity and
displacement vectors of the system, respectively; the
matrices M, D and K represent the mass of the system
(including the ordinary mass and added mass contribu-
tions), the damping and the stiffness; and hðsÞ is the
retardation function computed by a transform of the fre-
quency-dependent added-mass and damping. The vector
qðt; x; _xÞ represents the wave excitation forces, drag force,
and any other forces, such as wave drift damping. In the
coupled simulation procedure, the response vectors (€x, _x
and x) in Eq. 4 consist of six DOFs from the WEC and
Table 4 Sea water properties
Acceleration of gravity, g (m/s2) 9.81
Density, qw (kg/m3) 1025.0
Kinematic viscosity, l (m/s2) 1.19 9 10-6
Still-water mean level, Z (m) 0.0
Water depth, h (m) 50.0
16 J Mar Sci Technol (2018) 23:10–29
123
additional DOFs from the mooring system and the cable.
The dynamic equilibrium of the system is solved using the
Newmark-b time stepping scheme. The relationships
between the displacement, velocity and acceleration vec-
tors at times t and t þ Dt are as follows:
_xtþDt ¼ _xt þ ð1 � cÞ€xtDt þ c€xtþDtDt ð5aÞ
xtþDt ¼ xt þ _xtDt þ1
2� b
� �€xtðDtÞ2 þ b€xtþDtðDtÞ2 ð5bÞ
where c and b are parameters that affect the behaviours of
the time steps, such as accuracy, stability, numerical dis-
persion and dissipation. The Newmark parameters c and bwere chosen as 1/2 and 1/4, respectively [42, 45]. A time
step of 2 9 10-3 s was used in all simulations to capture
the cable and mooring dynamics (see [29, 30] for details).
Because of significant nonlinearities in the cable and
mooring system, it is important to perform this type of
simulation in the time domain [46–49]. The motions of all
components instantaneously influence the mean positions
and dynamic responses of all other components. Because
these coupling effects are captured in the analysis, more
accurate predictions are expected.
4 Results and discussion
4.1 Dynamic responses of the cable
under environmental loads
This chapter presents the results for the dynamic responses
of the cable under the actual environmental conditions and
loads at its expected site of operation. The cable’s char-
acteristics are assessed based on the initial cable design
(see Sect. 3.3 for details). Section 4.1.1 focuses on the
instantaneous motion response of the cable, and subse-
quently, a parametric sensitivity study of environmental
loads is presented in Sect. 4.1.2.
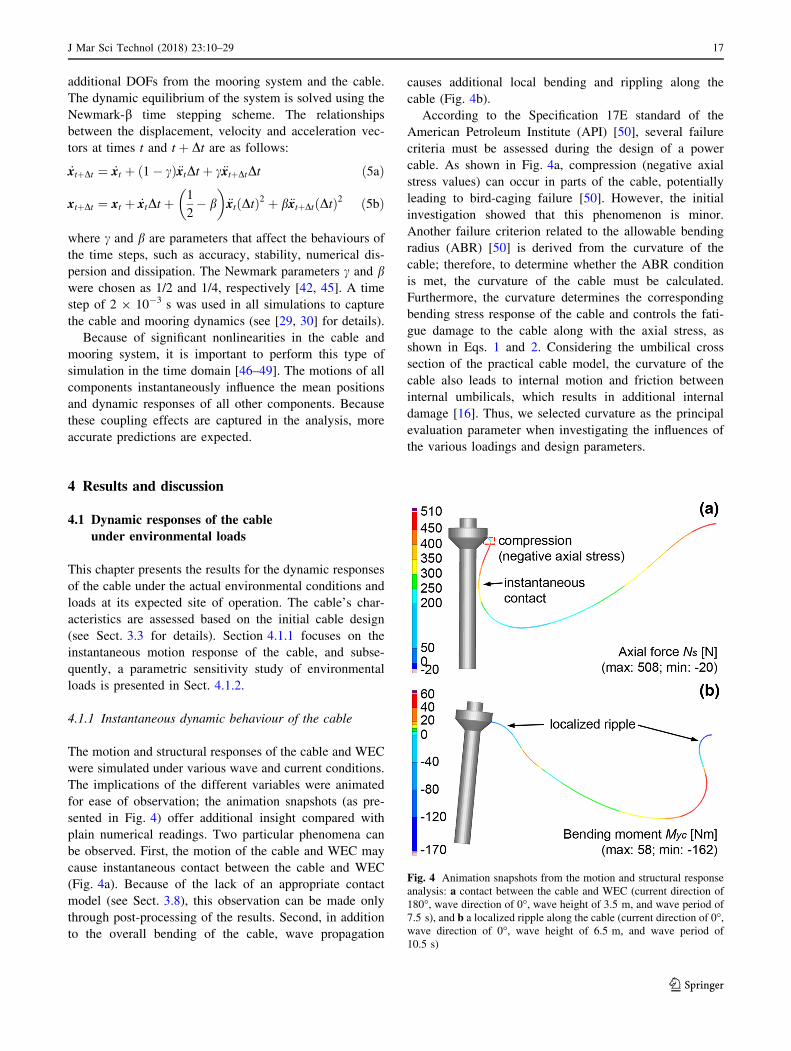
4.1.1 Instantaneous dynamic behaviour of the cable
The motion and structural responses of the cable and WEC
were simulated under various wave and current conditions.
The implications of the different variables were animated
for ease of observation; the animation snapshots (as pre-
sented in Fig. 4) offer additional insight compared with
plain numerical readings. Two particular phenomena can
be observed. First, the motion of the cable and WEC may
cause instantaneous contact between the cable and WEC
(Fig. 4a). Because of the lack of an appropriate contact
model (see Sect. 3.8), this observation can be made only
through post-processing of the results. Second, in addition
to the overall bending of the cable, wave propagation
causes additional local bending and rippling along the
cable (Fig. 4b).
According to the Specification 17E standard of the
American Petroleum Institute (API) [50], several failure
criteria must be assessed during the design of a power
cable. As shown in Fig. 4a, compression (negative axial
stress values) can occur in parts of the cable, potentially
leading to bird-caging failure [50]. However, the initial
investigation showed that this phenomenon is minor.
Another failure criterion related to the allowable bending
radius (ABR) [50] is derived from the curvature of the
cable; therefore, to determine whether the ABR condition
is met, the curvature of the cable must be calculated.
Furthermore, the curvature determines the corresponding
bending stress response of the cable and controls the fati-
gue damage to the cable along with the axial stress, as
shown in Eqs. 1 and 2. Considering the umbilical cross
section of the practical cable model, the curvature of the
cable also leads to internal motion and friction between
internal umbilicals, which results in additional internal
damage [16]. Thus, we selected curvature as the principal
evaluation parameter when investigating the influences of
the various loadings and design parameters.
Fig. 4 Animation snapshots from the motion and structural response
analysis: a contact between the cable and WEC (current direction of
180�, wave direction of 0�, wave height of 3.5 m, and wave period of
7.5 s), and b a localized ripple along the cable (current direction of 0�,wave direction of 0�, wave height of 6.5 m, and wave period of
10.5 s)
J Mar Sci Technol (2018) 23:10–29 17
123

4.1.2 Investigation of the dynamic characteristics
of the cable under environmental loads
Although a WEC system is generally designed to operate in
a particular marine environment, the environmental load-
ing conditions are continuously changing. Because differ-
ent environmental loads (such as loads from waves and
currents) result in different dynamic responses in the sys-
tem, the behaviour of the WEC system (and, hence, the
cable) must be investigated over a range of environmental
loading parameters. Table 5 presents the range of values
considered for each parameter that describe the loads from
waves and currents. The ranges of the wave height and
period were chosen based on the prevailing conditions,
namely, the wave scatter diagram acquired at the test site,
which is presented in Table 6. To maintain the energy
content of the wave when studying the fatigue damage of
the cable, each wave condition in the DeepC software is
simulated as a regular wave represented by the mean wave
height, H ¼ Hs=ffiffiffi2
p, and average wave period, T = Tz.
With a reference diameter of 8 m, the Reynolds numbers
for all investigated cases were between 2.95 9 105 and
2.18 9 107 [43].
The wave scatter diagram was provided by Waves4Power
[37]. All weather conditions with no probability of occur-
rence (cells with a value of 0) were excluded from the sim-
ulations. Because of the limitations of linear wave theory
(Sect. 3.5), it was necessary to place restrictions on the wave
steepness parameter and the shallow water parameter to
avoid invalid results from the numerical simulations [43, 51].
All possible weather conditions were divided into three
categories: the white cells lie in the valid range for linear
wave theory, the light grey cells lie in the intermediate range
between linear wave theory and other nonlinear wave theo-
ries, and the dark grey cells would require higher-order
nonlinear theories in the simulations. In this study, the
weather conditions represented by the white and light grey
cells were simulated (all cells within the dashed region in
Table 6).
Although the conditions represented by the dark grey
cells were excluded from the simulations, it is worth noting
that most of the dark grey cells coincide with the survival
conditions of the WEC system (see Sect. 3.1). Linear Airy
wave theory is therefore demonstrated to be sufficient for
studying the cable’s dynamics under conditions in which
the system is in its operational mode. Together, the simu-
lated cases cover 72.8% of all possible wave load cases at
the planned test site and 74.4% of all possible operational-
mode conditions.
Originally, a duration of 30 min was simulated. The
results showed that after an initial transient phase (after
15 min of simulation time), the structural response of the
cable reaches stable conditions, and a periodic result can be
observed throughout the remainder of the simulation. To
avoid transient start-up effects in the comparison and to
reduce the total computation time, a time interval of
10 min, from 900 to 1500 s, was considered in the subse-
quent investigations.
4.1.2.1 Currents Figure 5 presents examples of the
results obtained by varying the current, where the hori-
zontal axis represents the line coordinate along the cable
(s) and the vertical axis shows the curvature observed
during 10 min of the stable simulation results. The curva-
ture jz was generally minor compared with jy in all but two
simulations. One of these examples is shown in Fig. 5a,
where, for a current at 90� (the other case is at 270� due to
symmetry), the curvatures jy and jz are comparable in
magnitude along the length of the cable. In Fig. 5b, the
vertical axis shows the absolute value of the maximum
curvature (jy) observed during 10 min of the stable simu-
lation results for some current directions. In addition, the
cable curvature under static conditions, representing the
installation conditions, was found to be negligible com-
pared with the dynamic response of the curvature; thus, the
curvature induced by the cable’s static position is less than
5% of the curvature of any instantaneous dynamic motion.
Therefore, the maximum curvature jy was plotted in
Fig. 5b to determine the most critical response during the
motion of the cable.
Note that the WEC system is symmetrical with respect
to the x axis, meaning that the results for currents at 90�and 270� are identical. In addition, when the current is
perpendicular to the cable (90� and 270�), a low curvature
response is observed. Because these observations are valid
for most other wave conditions (there are some exceptions,
but their probabilities in the scatter diagram are low),
currents at 90� and 270� are considered to represent the
mild current conditions for our WEC system.
As mentioned in Sect. 3.3, the first two elements at both
ends of the cable are neglected in the plot; however, the
results still show that the most critical area lies near one of
the end points of the cable (Fig. 5). Moreover, the most
critical area is located near the WEC in most cases,
although under a few weather conditions, the most critical
area may also occur near the hub (as in the curvature
Table 5 Variations in the environmental loads
Environmental load Studied cases
Current (-) Yes/no
Current direction (�) 0, 90, 180, 270
Wave direction (�) 0, 90, 180, 270
Wave height, Hs (m) 0.5–7.5 in intervals of 1 m
Wave period, Tz (s) 3.5–15.5 in intervals of 1 s
18 J Mar Sci Technol (2018) 23:10–29
123

response for a 0� current shown in Fig. 5). Given the sig-
nificant change in curvature per unit length near the two
ends of the cable, the decision to use the third element from
the WEC end of the cable to represent the results for the
different simulation cases appears to be well motivated (see
the discussion regarding the modelling of the boundary
condition in Sect. 3.3).
4.1.2.2 Waves Given a particular wave height and wave
period, Fig. 6 shows one example of the maximum cur-
vature responses jy and jz of the third element of the cable
near the WEC versus the current direction and wave
direction (note that jy is larger than jz in all but two cases).
The figure shows the capacity of the methodology pre-
sented in this investigation and provides an overview of
how different combinations of wave loads and current
directions influenced the curvature responses of the cable.
The information presented, together with the data from the
real environmental conditions where the WEC will be
operated, can guide the creation of a structural design that
fulfils the requirements and expected functionality. At the
test site considered in this investigation, a current is always
present. Hence, the cable must be designed based on
numerical simulations in which a current is included.
According to Fig. 6a and b, the worst case corresponds to a
current angled at 180� and a wave angled at 180�; thus, this
scenario was chosen for the investigation of various cable
design parameters. In addition, the results show that the
curvature response jy is much larger than jz. Therefore, jyis used in the presentation of results in the following sec-
tions and figures, although the cable characteristics are
always evaluated against both jy and jz.The wave height and wave period were also investi-
gated, with the results shown in Fig. 7. One can observe
that the peak curvatures occur at a high wave height and a
wave period similar to the resonance condition of the WEC
buoy (a wave period of 6.25 s). This observation is also
valid for most other current and wave directions, except at
a current direction of 90� or 270�. When the current is
perpendicular to the cable, the maximum curvature is
insensitive to the wave period and is influenced only by the
wave height. Consequently, a high wave height will always
lead to a large curvature response, regardless of the wave
period. This observation suggests that the influence of the
current and wave directions should also be considered in
conjunction with the wave height and wave period when
identifying extreme conditions for consideration in a cable
design. According to our study, the maximum curvature
response of the cable was observed under an environmental
condition with a wave height of 7.5 m, a wave period of
10.5 s, and wave and current directions of 180�. The
maximum curvature response jy was found to be 1.1 m-1,
Table 6 Wave scatter diagram at the test site (unit: 1 9 10-5)
Hs [m]Tz [s]
Sum2.5 3.5 4.5 5.5 6.5 7.5 8.5 9.5 10.5 11.5 12.5 13.5 14.5 15.5
12.5 0 0 0 0 0 0 0 1 2 3 0 0 0 0 611.5 0 0 0 0 0 0 0 2 7 0 0 0 0 0 910.5 0 0 0 0 0 0 0 11 10 0 0 0 0 0 219.5 0 0 0 0 0 0 6 42 10 0 0 0 0 0 588.5 0 0 0 0 0 2 29 87 2 0 0 0 0 0 120
7.5 0 0 0 0 0 14 107 103 2 0 0 0 0 0 226
6.5 0 0 0 0 0 44 267 33 5 1 0 0 0 0 350
5.5 0 0 0 0 7 166 337 37 7 2 0 1 0 0 557
4.5 0 0 0 0 43 558 136 32 14 5 1 1 0 0 790
3.5 0 0 0 1 371 563 123 48 19 6 2 1 0 0 1134
2.5 0 0 4 179 877 303 130 71 33 16 7 2 0 0 1622
1.5 0 0 221 1014 501 220 146 110 66 36 16 3 1 0 2334
0.5 644 367 684 248 107 142 162 192 117 64 19 22 3 4 2775
Sum 644 367 909 1442 1906 2012 1443 769 294 133 45 30 4 4 10002
J Mar Sci Technol (2018) 23:10–29 19
123

which is a result of a horizontal shift of the WEC buoy by
18.9 m and a vertical shift by 3.3 m from its original
position in the still-water condition.
4.1.2.3 Concluding remarks To proceed with the para-
metric study of the cable design parameters, it was nec-
essary to identify a suitable reference condition in terms of
wave and current characteristics. First, the condition cho-
sen for such a purpose should have a high probability of
occurrence to ensure that the observed result can be
regarded as the typical condition under regular usage.
Second, because the intrinsic purpose of the WEC is to
harvest energy, the chosen condition should be similar to
the resonant wave condition [52]. Finally, this reference
condition should not be too mild to avoid the risk of
neglecting phenomena that could damage the cable (see
Sect. 4.1.1). Accordingly, we chose a reference condition
corresponding to a current direction of 180�, a wave
direction of 180�, a wave height of 3.5 m, and a wave
period of 7.5 s for further investigation, as presented in the
following sections.
4.2 Parametric study of cable design parameters
The cable configuration introduced in Sect. 3.3 is the initial
design created based on the experience and engineering
judgement of the cable manufacturer. However, because of
the special cable characteristics required for the application
considered here (see Sect. 1 for details), it is necessary to
review this initial cable configuration to determine if any
improvements can be made with regard to its performance.
The structural response of a cable depends on its geometry
and material properties. From a global analysis perspective,
the main cable properties of interest are the outer diameter,
mass, length, axial stiffness, and bending stiffness [5]. In
addition, the length and bending stiffness of the cable
0 10 20 30 40 50 60 700
0.05
0.1
0.15
0.2
0.25
Line coordinate on cable, s [m]
Cur
vatu
re, κ
y [m−
1 ]
no currentdirection: 0 degdirection: 90 degdirection: 180 degdirection: 270 deg
0 10 20 30 40 50 60 700
0.03
0.06
0.09
0.12
0.15
Line coordinate on cable, s [m]
Cur
vatu
re [m
−1 ]
κ
y
κz
(a)
(b)
Fig. 5 a Comparison of the absolute values of the maximum
curvature responses jy and jz (current direction of 90�, wave
direction of 0�, wave height of 7.5 m, and wave period of 10.5 s).
b Absolute values of the maximum curvature responses jy under
different currents (wave direction of 0�, wave height of 7.5 m, and
wave period of 10.5 s)
Fig. 6 Absolute value of the maximum curvature response a jy and
b jz at the third element of the cable from the WEC for different
current and wave directions (wave height of 3.5 m and wave period of
7.5 s)
20 J Mar Sci Technol (2018) 23:10–29
123

require special attention because of the observed risk of
contact and localized rippling along the cable, which is
addressed in Sect. 4.1.1. Because of these factors, we
identify the cable’s mass, length, and bending stiffness as
key parameters that may be modified to enhance the cable’s
fatigue life. As each of these parameters is varied in the
parametric sensitivity study, all other cable properties are
held fixed at the values defined in Sect. 3.3. Table 7 pre-
sents all 18 investigated cases, including the variations in
the design parameters. These cases were determined to
represent realistic parameter values for the current case
study configuration. Based on the systems engineering
approach [53], the values to be investigated were selected
in collaboration with Waves4Power [37] and the cable
manufacturer. Note that Case 11 is identical to the initial
design of the cable as introduced in Sect. 3.3. The envi-
ronmental condition used as the basis for the discussion in
this section corresponds to a current direction of 180�, a
Fig. 7 Absolute value of the
maximum curvature response jyat the third element of the cable
from the WEC for different
wave conditions (current
direction of 180� and wave
direction of 180�). The invalid
and transitional ranges for the
application of linear wave
theory are indicated by dark
grey cells and thick black lines.
The light grey and white cells
were excluded from the
simulations because their
probabilities of occurrence are
zero. For all wave conditions
that were not simulated, the
corresponding cells are marked
with black dots
Table 7 Cable design
parameters considered in the
parametric study
Properties of the cable
Mass, MC (kg/m) Bending stiffness, EIC (Nm2) Length, LC (m)
2.00 2.75 6.00 50.0 200.0 350.0 70.0 82.0
Case 1 9 9 9
Case 2 9 9 9
Case 3 9 9 9
Case 4 9 9 9
Case 5 9 9 9
Case 6 9 9 9
Case 7 9 9 9
Case 8 9 9 9
Case 9 9 9 9
Case 10 9 9 9
Case 11 9 9 9
Case 12 9 9 9
Case 13 9 9 9
Case 14 9 9 9
Case 15 9 9 9
Case 16 9 9 9
Case 17 9 9 9
Case 18 9 9 9
J Mar Sci Technol (2018) 23:10–29 21
123

wave direction of 180�, a wave height of 3.5 m, and a wave
period of 7.5 s (see Sect. 4.1.2 for the related discussion).
4.2.1 Mass of the cable
The initial mass of the cable (MC) was determined based on
the internal umbilicals required for electricity transmission
(see Table 3). However, because of the observed risk of
contact between the cable and the WEC, a greater cable mass
was proposed as an alternative to reduce cable movement
and mitigate the risk of contact. Waves4Power [37] and the
cable manufacturer provided the lower and upper mass
limits, which were determined by production limitations.
Figure 8 shows the maximum curvature response along
the cable during 10 min of stable simulations for different
cable masses, with a constant bending stiffness of 350 Nm2
and a constant length of 70 m (cases 5, 11, and 17 in
Table 7). Figure 8 is consistent with our expectation that a
low cable mass is not preferred because a smaller mass
introduces more motion and leads to higher peak curvature
magnitudes and significant ripples. Since this observation
is also valid for other combinations of bending stiffness
and length, the use of a higher-mass cable is recommended.
However, because heavier cables are typically produced by
adding more internal wires, further localized evaluation of
the cable cross section is required to reach a final recom-
mendation regarding the cable mass.
4.2.2 Bending stiffness of the cable
From a motion perspective, a large bending stiffness may
be preferable in order to reduce the motion (and hence the
curvature response) of the cable. The bending stiffness was
varied to identify a suitable balance point between the
curvature and stress responses. The range for investigation
was selected based on the properties of the available
materials used in cable production.
Figure 9 shows examples of the influences of different
bending stiffness values and cable masses on the curvature
response. Figure 9a shows that the bending stiffness has
only a minor influence on the curvature response for a
cable with a mass of 2.75 kg/m. However, Fig. 9b shows
that the curvature response close to the WEC is more
sensitive to the bending stiffness for a cable mass of
2.00 kg/m. Furthermore, after reviewing the results for all
18 cases in Table 7, it was found that using a bending
stiffness of 200 Nm2 is appropriate and that the cable mass
is an important design parameter for reducing the curvature
0 10 20 30 40 50 60 700
0.05
0.1
0.15
0.2
0.25
0.3
0.35
0.4
0.45
Line coordinate on cable, s [m]
Cur
vatu
re, κ
y [m−
1 ]
M
C = 2.00 kg/m
MC
= 2.75 kg/m
MC
= 6.00 kg/m
Fig. 8 Absolute value of the maximum curvature responses for
different cable masses: 2.00 kg/m (case 5), 2.75 kg/m (case 11), and
6.00 kg/m (case 17) (current direction of 180�, wave direction of
180�, wave height of 3.5 m, and wave period of 7.5 s)
0 10 20 30 40 50 60 700
0.05
0.1
0.15
0.2
0.25
0.3
0.35
0.4
0.45
Line coordinate on cable, s [m]
Cur
vatu
re, κ
y [m−
1 ]
EIC
= 50 Nm2
EIC
= 200 Nm2
EIC
= 350 Nm2
0 10 20 30 40 50 60 700
0.05
0.1
0.15
0.2
0.25
0.3
0.35
0.4
0.45
Line coordinate on cable, s [m]
Cur
vatu
re, κ
y [m−
1 ]
EIC
= 50 Nm2
EIC
= 200 Nm2
EIC
= 350 Nm2
(a)
(b)
Fig. 9 Absolute value of the maximum curvature responses for
different cable bending stiffnesses (current direction of 180�, wave
direction of 180�, wave height of 3.5 m, and wave period of 7.5 s),
cable length 70 m, and cable mass a 2.75 kg/m and b 2.00 kg/m
22 J Mar Sci Technol (2018) 23:10–29
123

responses for our WEC system (see Fig. 9). The effects of
different bending stiffness values on the stress response
will be discussed in Sect. 4.3.
4.2.3 Length of the cable
The possible range of the cable length is determined by two
counteracting factors. First, the cable cannot be shorter
than a given lower bound because of the minimum
requirement of the clearance between a service vessel and
the cable. Second, the longest length is constrained by the
amount of spare cable, which must not touch the seabed.
Given these two factors, the possible range for the cable
length is between 70 and 82 m, and these two end values
were chosen for comparison.
Figure 10 shows examples of the absolute values of the
maximum curvature responses of cables with different
lengths, bending stiffness, and masses. Figure 10a shows
that minor differences in the curvature response occurred
between two cables with different lengths and a bending
stiffness of 200 Nm2 and a cable mass of 2.75 kg/m. Fig-
ure 10b shows that the curvature response for the shorter
cable will increase near the WEC if the bending stiffness
and cable mass are reduced. These results show the
importance of carrying out parametric studies to observe
and determine which combination of design parameters
should be recommended in the early design phase.
Post-processing by animation of the cable motions for
the 82 m cable shows many cases where unwanted contact
between the cable and the WEC buoy occurs; this hap-
pened only for a few cases for the 70 m cable. From a
structural integrity perspective, such contact is undesirable.
Severe contact can result in damage to the cords or indent
damage to the cable, thereby negatively influencing its
mechanical life. Hence, we chose to maintain a cable
length of 70 m.
4.3 Stress and fatigue damage evaluation
As described in Sects. 2.2 and 3.3, the stress response and
accumulated fatigue damage in the cable at line coordinate
s were calculated at 12 locations in the cross sections
described by the angular coordinate h. An assessment of
every cross section was used to determine the location and
magnitude of the largest accumulated fatigue damage.
Figure 11 shows an example of how this assessment was
carried out. In Fig. 11a, the variation of the accumulated
fatigue damage is shown for 12 locations in a cross section
at s = 1.75 m when only the current direction is altered.
From this analysis, Fig. 11b shows how each fatigue-crit-
ical cross section location (represented by h) in the cable
changes with the length (s) of the cable for some current
directions. This example demonstrates the necessity of
employing systematic and thorough fatigue assessments at
several locations of a cross section.
Figure 12 shows an example of the stress responses
corresponding to the three stress terms in Eq. 2 and the
total stress at various points along the cable. In this
example, the mass was varied as an independent variable,
and the bending stiffness and length were held constant at
200 Nm2 and 70 m, respectively (cases 3, 9, and 15 in
Table 7). The results shown in Fig. 12 and those obtained
for other combinations of bending stiffness and length
show that, for different cable masses, the contribution from
the axial stress to the total stress is either minor
(MC = 2.00 kg/m), meaning that the bending stress is the
major source of the total stress, or the axial stress has a
0 10 20 30 40 50 60 70 800
0.05
0.1
0.15
0.2
0.25
0.3
0.35
0.4
0.45
Line coordinate on cable, s [m]
Cur
vatu
re, κ
y [m−
1 ]
L
C = 70 m
LC
= 82 m
0 10 20 30 40 50 60 70 800
0.05
0.1
0.15
0.2
0.25
0.3
0.35
0.4
0.45
Line coordinate on cable, s [m]
Cur
vatu
re, κ
y [m−
1 ]
L
C = 70 m
LC
= 82 m
(a)
(b)
Fig. 10 Absolute value of the maximum curvature responses for
different cable lengths (current direction of 180�, wave direction of
180�, wave height of 3.5 m, and wave period of 7.5 s): a bending
stiffness 200 Nm2 and cable mass 2.75 kg/m, and b bending stiffness
50 Nm2 and cable mass 2.00 kg/m
J Mar Sci Technol (2018) 23:10–29 23
123

pronounced contribution (MC C 2.75 kg/m) when the line
coordinate s is (approximately) in the interval 5\ s\ 65.
Figure 13 shows an example of the accumulated fatigue
damage values (on the left vertical axis) for different cable
masses (the bending stiffness and length were held at
200 Nm2 and 70 m, respectively) and bending stiffnesses
(the cable mass and length were held at 2.00 kg/m and
70 m, respectively). A comparison with Fig. 12, which
indicates the critical area for the total stress response,
shows that the most critical areas for fatigue damage are
expected to be located at the two ends of the cable. The
right vertical axis in Fig. 13 presents the equivalent fatigue
life corresponding to each value of accumulated fatigue
damage.
Together, Figs. 9 and 13 affirm the dilemma encoun-
tered when varying both the bending stiffness and cable
mass. For example, when the bending stiffness of a cable
with low cable mass is increased, the curvature response of
the cable decreases (Fig. 9b) but the fatigue damage to the
cable increases (Fig. 13b). This result suggests that if a
cable is designed for lower motion and curvature response
(namely, with a high bending stiffness), the cable will be
prone to cyclic tensile stress-induced fatigue damage.
However, if the cable is designed to allow for greater
motion and curvature responses (with a low bending
stiffness), an advanced model must also be used to predict
the intrinsic failure mechanisms of the cable, such as wear
and fretting damage between the internal cable umbilicals
[54]. For our case study WEC system, the ‘‘improved’’
cable design that is recommended among the studied cases
is a cable with a mass of 2.00 kg/m, a bending stiffness of
50 Nm2, and a length of 70 m, for the following two rea-
sons: the risk of contact between the cable and the WEC is
low (see Sect. 4.2.3), and the fatigue lifetime along the
length of the cable is the longest (see Fig. 13b). Under the
specific environmental condition represented in Fig. 13, the
initial cable and the proposed ‘‘improved’’ cable have
fatigue lives of 1.8 9 106 and 6.7 9 109 years, respec-
tively. Notably, if production criteria are limiting and vital
for allowable parameter configurations (see Sects. 4.2.1,
0 30 60 90 120 150 180 210 240 270 300 3300
0.5
1
1.5
2
Angular coordinate in cable cross section, θ [deg]
Acc
umul
ated
fatig
ue d
amag
edu
ring
10 m
inut
es, F
D [1
×10−
13]
no currentdirection: 0 degdirection: 90 degdirection: 180 degdirection: 270 deg
0 10 20 30 40 50 60 70Line coordinate on cable, s [m]
Ang
ular
coo
rdin
ates
θ th
atac
cum
ulat
e la
rges
t fat
igue
dam
age
[deg
]
0
60
120
180
240
300
360
(a)
(b)
Fig. 11 Example of the
influences of the current
direction: a assessment of the
accumulated fatigue damage at
several locations in a cross
section in a line with coordinate
s = 1.75 m (i.e., third element
from the WEC), and
b presentation of the most
fatigue-critical location of each
cross section along the length of
the cable (wave direction of 90�,wave height of 3.5 m, and wave
period of 7.5 s)
24 J Mar Sci Technol (2018) 23:10–29
123

4.2.2), the fatigue life could be significantly lower, espe-
cially near the end points.
In practice, bend stiffeners are used at both ends of the
cable to protect it from over-bending and buckling; see [23]
for an example. At the time this study was conducted, the
design of the bend stiffener for the cable was not available.
Therefore, it was not included in the cable model. In the
post-processing of the results, the first two elements of the
cable at both ends (which each corresponds to the length of
a bend stiffener) were excluded from the assessment of the
numerical results since they cannot represent the (true)
boundary conditions properly. The results from the fatigue
evaluation, presented in Fig. 13, show that the most fati-
gue-critical point occurred near the WEC side in the third
element of the cable. This simplification to the cable model
was studied in a few simulation cases in which a new cable
model was used with a preliminary bend stiffener design.
When the bend stiffener was modelled, the maximum
curvature response of the power cable was reduced by 85%
in the first element near the WEC and by 90% near the hub.
Nevertheless, the results from these simulations showed
that the most fatigue-critical location was in approximately
the same location as indicated by the fatigue evaluation
presented herein, i.e., at a point at the same distance from
the WEC side. A comparison of the calculated fatigue lives
showed that they were of the same order of magnitude.
Therefore, considering the purpose of the current study, the
simplified cable model without bend stiffeners was con-
sidered suitable.
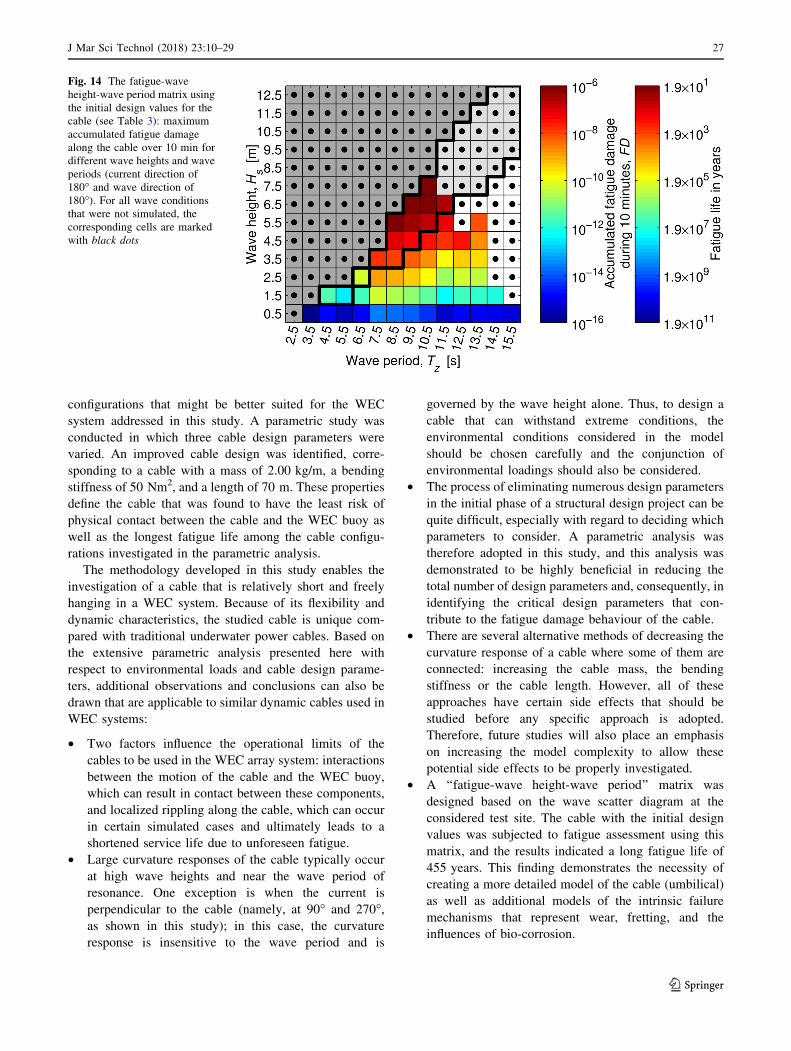
As indicated in Sect. 4.1.2, the curvature response of the
cable depends on the environmental conditions. One can
expect that the service life predicted in a fatigue damage
evaluation based on a single environmental condition (such
as that shown in Fig. 13) will not be accurate or compre-
hensive. Thus, to more realistically predict the fatigue life
of the cable, we treated the wave height and wave period as
independent variables, and assumed a current and wave
angles of 180�. A ‘‘fatigue-wave height-wave period’’
matrix was computed, which shows the cable fatigue
damage under different wave conditions; see Fig. 14.
0 10 20 30 40 50 60 700.5
1.5
2.5
3.5
4.5
5.5
Line coordinate on cable, s [m]
Axi
al s
tres
s, σ
A [M
Pa]
M
C = 2.00 kg/m
MC
= 2.75 kg/m
MC
= 6.00 kg/m
0 10 20 30 40 50 60 700
3
6
9
12
15
Line coordinate on cable, s [m]
Ben
ding
str
ess,
σyc
[MP
a]
M
C = 2.00 kg/m
MC
= 2.75 kg/m
MC
= 6.00 kg/m
0 10 20 30 40 50 60 700
0.4
0.8
1.2
1.6
2
Line coordinate on cable, s [m]
Ben
ding
str
ess,
σzc
[1×1
0−3 M
Pa]
M
C = 2.00 kg/m
MC
= 2.75 kg/m
MC
= 6.00 kg/m
0 10 20 30 40 50 60 700
3
6
9
12
15
Line coordinate on cable, s [m]
Tot
al s
tres
s, σ
s [MP
a]
M
C = 2.00 kg/m
MC
= 2.75 kg/m
MC
= 6.00 kg/m
(a) (b)
(c) (d)
Fig. 12 Maximum a axial
stress rA, b bending stress ryc,c bending stress rzc, and d total
stress rs responses for different
cable masses: 2.00 kg/m (case
3), 2.75 kg/m (case 9), and
6.00 kg/m (case 15) (current
direction of 180�, wave
direction of 180�, wave height
of 3.5 m, and wave period of
7.5 s)
J Mar Sci Technol (2018) 23:10–29 25
123

Note that the results presented in Fig. 14 are for the
initial design of the cable (see Table 3) for ease of com-
parison with the corresponding curvature response (Fig. 7).
The results shown in Fig. 14 represent the maximum pos-
sible fatigue damage accumulated along the cable over
10 min under different environmental conditions. The most
critical point is always near the WEC side, namely, all
values shown in Fig. 14 originated from the third element
of the cable near the WEC. Finally, if we multiply the
fatigue damage readings from Fig. 14 with the probability
of each wave condition as stated in Table 6 and calculate
the corresponding fatigue life, a predicted fatigue life of
455 years is obtained for the cable.
This fatigue life predicted using our methodology may
be considered as an upper bound on the service life for
several reasons. First, a simplified model of the cable
(which is an umbilical in reality but is modelled as a cir-
cular tube) was used in the analyses. The long fatigue life
shows that this model must be improved in future work.
Second, as described in Sect. 2.2, the present fatigue
methodology is based on the first-principle design level
and, consequently, does not include all the intrinsic
mechanisms that lead to the fatigue degradation of the
cable (such as wear, bio-corrosion, and fretting). Third, the
presented results disregard the contribution from survival
wave conditions and may therefore over-predict the actual
fatigue life. Fourth, only regular waves were simulated in
this study, and hence, the contribution to fatigue damage
from single large waves under irregular waves is disre-
garded. However, the potential over-prediction of the
fatigue life is considered to be limited since the energy
content of the waves was maintained in this study (see
Sect. 4.1.2 for details). Fifth, in the estimation of the fati-
gue life of the cable, the wind load acting on the WEC was
disregarded (see Sect. 3). The accurate modelling of the
wind load is a matter for future work. However, a few
initial simulations were conducted based on the reference
condition as defined in Sect. 4.1.2. An extreme wind load
corresponding to a wind speed of 41 m/s [46] was used
together with an estimated projected area of 15 m2. No
correlation between wind speed and wave height was
considered; however, the purpose was simply to investigate
an extreme wind load case to determine the extent to which
the fatigue life of the power cable would be reduced in that
case. The results showed that the cable fatigue life was
reduced by approximately 10%, which is a reasonable
estimate for this combination of wind speed and wave
height. Finally, after evaluation of the potential causes of
the over-prediction of the cable’s fatigue life, it was found
that the findings shown in Fig. 14 can serve as a credible
design reference.
5 Conclusions
In this study, we developed a numerical model of a WEC
system and performed a global analysis of its free-hanging
power cable, which has unique properties for the applica-
tion of interest. A coupled simulation model was used to
simulate the motion and structural responses of the WEC
system, and a stress-based fatigue analysis was applied to
predict the fatigue damage to the cable. The developed
model and methodology were demonstrated to be useful for
studying the dynamics and fatigue characteristics of the
power cable.
Based on the initial design for the cable, a systems
engineering approach was used together with the proposed
model and methodology to investigate alternative cable
Line coordinate on cable, s [m]
Acc
umul
ated
fatig
ue d
amag
edu
ring
10 m
inut
es, F
D
0 10 20 30 40 50 60 7010−18
10−16
10−14
10−12
10−10
1.9×10¹³
1.9×10¹¹
1.9×10⁹
1.9×10⁷
1.9×10⁵
Fat
igue
life
in y
ears
MC
= 2.00 kg/m
MC
= 2.75 kg/m
MC
= 6.00 kg/m
Line coordinate on cable, s [m]
Acc
umul
ated
fatig
ue d
amag
edu
ring
10 m
inut
es, F
D
0 10 20 30 40 50 60 7010−18
10−16
10−14
10−12
10−10
1.9×10¹³
1.9×10¹¹
1.9×10⁹
1.9×10⁷
1.9×10⁵
Fat
igue
life
in y
ears
EIC
= 50 Nm2
EIC
= 200 Nm2
EIC
= 350 Nm2
(a)
(b)
Fig. 13 Accumulated fatigue damage during 10 min of stable re-
sponse a for different cable masses: 2.00 kg/m (case 3), 2.75 kg/m
(case 9), and 6.00 kg/m (case 15) b for different cable bending
stiffnesses: 50 Nm2 (case 1), 200 Nm2 (case 3), and 350 Nm2 (case 5)
(current direction of 180�, wave direction of 180�, wave height of
3.5 m, and wave period of 7.5 s)
26 J Mar Sci Technol (2018) 23:10–29
123
configurations that might be better suited for the WEC
system addressed in this study. A parametric study was
conducted in which three cable design parameters were
varied. An improved cable design was identified, corre-
sponding to a cable with a mass of 2.00 kg/m, a bending
stiffness of 50 Nm2, and a length of 70 m. These properties
define the cable that was found to have the least risk of
physical contact between the cable and the WEC buoy as
well as the longest fatigue life among the cable configu-
rations investigated in the parametric analysis.
The methodology developed in this study enables the
investigation of a cable that is relatively short and freely
hanging in a WEC system. Because of its flexibility and
dynamic characteristics, the studied cable is unique com-
pared with traditional underwater power cables. Based on
the extensive parametric analysis presented here with
respect to environmental loads and cable design parame-
ters, additional observations and conclusions can also be
drawn that are applicable to similar dynamic cables used in
WEC systems:
• Two factors influence the operational limits of the
cables to be used in the WEC array system: interactions
between the motion of the cable and the WEC buoy,
which can result in contact between these components,
and localized rippling along the cable, which can occur
in certain simulated cases and ultimately leads to a
shortened service life due to unforeseen fatigue.
• Large curvature responses of the cable typically occur
at high wave heights and near the wave period of
resonance. One exception is when the current is
perpendicular to the cable (namely, at 90� and 270�,as shown in this study); in this case, the curvature
response is insensitive to the wave period and is
governed by the wave height alone. Thus, to design a
cable that can withstand extreme conditions, the
environmental conditions considered in the model
should be chosen carefully and the conjunction of
environmental loadings should also be considered.
• The process of eliminating numerous design parameters
in the initial phase of a structural design project can be
quite difficult, especially with regard to deciding which
parameters to consider. A parametric analysis was
therefore adopted in this study, and this analysis was
demonstrated to be highly beneficial in reducing the
total number of design parameters and, consequently, in
identifying the critical design parameters that con-
tribute to the fatigue damage behaviour of the cable.
• There are several alternative methods of decreasing the
curvature response of a cable where some of them are
connected: increasing the cable mass, the bending
stiffness or the cable length. However, all of these
approaches have certain side effects that should be
studied before any specific approach is adopted.
Therefore, future studies will also place an emphasis
on increasing the model complexity to allow these
potential side effects to be properly investigated.
• A ‘‘fatigue-wave height-wave period’’ matrix was
designed based on the wave scatter diagram at the
considered test site. The cable with the initial design
values was subjected to fatigue assessment using this
matrix, and the results indicated a long fatigue life of
455 years. This finding demonstrates the necessity of
creating a more detailed model of the cable (umbilical)
as well as additional models of the intrinsic failure
mechanisms that represent wear, fretting, and the
influences of bio-corrosion.
Fig. 14 The fatigue-wave
height-wave period matrix using
the initial design values for the
cable (see Table 3): maximum
accumulated fatigue damage
along the cable over 10 min for
different wave heights and wave
periods (current direction of
180� and wave direction of
180�). For all wave conditions
that were not simulated, the
corresponding cells are marked
with black dots
J Mar Sci Technol (2018) 23:10–29 27
123

Acknowledgements The authors gratefully acknowledge the finan-
cial support provided by the Swedish Energy Agency for the project
‘‘Durability analysis of cables and mooring used in systems for har-
vesting of renewable ocean energy’’ through contract 36357-1. We
also thank Filip Alm, Ph.D., and the Swedish company Waves4Power
(http://www.waves4power.com/) for providing the WEC system
configuration and information on future test sites. Professor Lars
Bergdahl at Chalmers University of Technology and Goran Johans-
son, Ph.D., former at former GVA-Consultants in Gothenburg
(Sweden), are also acknowledged for their advice and support.
Open Access This article is distributed under the terms of the
Creative Commons Attribution 4.0 International License (http://crea
tivecommons.org/licenses/by/4.0/), which permits unrestricted use,
distribution, and reproduction in any medium, provided you give
appropriate credit to the original author(s) and the source, provide a
link to the Creative Commons license, and indicate if changes were
made.
References
1. Folley M, Whittaker T (2013) Preliminary cross-validation of
wave energy converter array interactions. In: Proc ASME 2013
32nd int conf ocean, offshore arct eng (OMAE2013), Nantes,
France, June 9–14, 2013. American Society of Mechanical
Engineers, New York, ASME Paper No. OMAE2013-10837
2. Thies PR, Johanning L, Smith GH (2012) Assessing mechanical
loading regimes and fatigue life of marine power cables in marine
energy applications. Proc Inst of Mech Eng. Part O J Risk and
Reliab 226:18–32. doi:10.1177/1748006X11413533
3. Zhou ZR, Cardou A, Goudreau S, Fiset M (1996) Fundamental
investigations of electrical conductor fretting fatigue. Tribol Int
29:221–232. doi:10.1016/0301-679X(95)00074-E
4. Nasution FP, Sævik S, Berge S (2013) Experimental investigation
of fatigue performance of a 300 mm2 copper power conductor.
In: Proc ASME 2013 32nd int conf ocean, offshore arct eng
(OMAE2013), Nantes, France, June 9–14, 2013. American
Society of Mechanical Engineers, New York, ASME Paper No.
OMAE2013-11193
5. Barbeiro IdC, Yamada da Silveira LM (2013) Investigation about
the effect of axial stiffness on the global response of umbilicals.
In: Proc ASME 2013 32nd int conf ocean, offshore arct eng
(OMAE2013), Nantes, France, June 9–14, 2013. American
Society of Mechanical Engineers, New York, ASME Paper No.
OMAE2013-10941
6. Brooke J (2003) Wave energy conversion, 1st edn. Elsevier
Ocean Eng Ser, Oxford
7. Salter S (2008) Looking back. In: Cruz J (ed) Ocean wave
energy: current status and future perspectives. Springer, Wurz-
burg, pp 7–39
8. Lane M, McNamara JF, Gibson R, Tyrer A (1995) Bend stiffeners
for flexible risers. In: 27th Annu Offshore Technol Conf, Houston,
Texas, May 1–4, 1995. Paper No. OTC 7730, pp 345–353
9. Olsen E, Karlsen S, Jordal L, Hansen-Zahl KA (2012) Determi-
nation of friction within a riser umbilical. In: Proc ASME 2012
31st int conf ocean, offshore arct eng (OMAE2012), Rio de
Janeiro, Brazil, June 1–6, 2012. American Society of Mechanical
Engineers, New York, ASME Paper No. OMAE2012-83089
10. Katsui T, Inoue T, Akashi M (2013) Evaluation of moving
capability of crawler driven ROV considering cable tension. In:
Proc ASME 2013 32nd int conf ocean, offshore arct eng
(OMAE2013), Nantes, France, June 9–14, 2013. American
Society of Mechanical Engineers, New York, ASME Paper No.
OMAE2013-10320
11. Fortaleza E, Albuquerque D, Yamamoto M (2012) An investi-
gation about the trajectory control during the subsea equipment
installation using cable. In: Proc ASME 2012 31st int conf ocean,
offshore arct eng (OMAE2012), Rio de Janeiro, Brazil, June 1–6,
2012. American Society of Mechanical Engineers, New York,
ASME Paper No. OMAE2012-83798
12. Aranha JAP, Pinto MO (2001) Dynamic tension in risers and
mooring lines: an algebraic approximation for harmonic excita-
tion. Appl Ocean Res 23:63–81. doi:10.1016/S0141-
1187(01)00008-6
13. Karlsen S (2010) Fatigue of copper conductors for dynamic
subsea power cables. In: Proc ASME 2010 29th int conf ocean,
offshore arct eng (OMAE2010), Shanghai, China, June 6–11,
2010. American Society of Mechanical Engineers, New York,
ASME Paper No. OMAE2010-2
14. Green J, Bowen A, Fingersh LJ, Wan YH (2007) Electrical
collection and transmission systems for offshore wind power. In:
2007 offshore technol conf, Houston, Texas, April 30–May 3,
2007. Paper No. OTC 19090. doi:10.4043/19090-MS
15. Buitrago J, Swearingen SFS, Ahmad S, Popelar CF (2013) Fati-
gue, creep and electrical performance of subsea power cable. In:
Proc ASME 2013 32nd int conf ocean, offshore arct eng
(OMAE2013), Nantes, France, June 9–14, 2013. American
Society of Mechanical Engineers, New York, ASME Paper No.
OMAE2013-10852
16. Silva D, Balena R, Lisboa R (2012) Methodology for thermo-
plastic umbilical cross section analysis. In: Proc ASME 2012 31st
int conf ocean, offshore arct eng (OMAE2012), Rio de Janeiro,
Brazil, June 1–6, 2012. American Society of Mechanical Engi-
neers, New York, ASME Paper No. OMAE2012-83509
17. Marta M, Mueller-Schuetze S, Ottersberg H, Isus Feu D,
Johanning L, Thies PR (2015) Development of dynamic sub-
marine MV power cable design solutions for floating offshore
renewable energy applications. In: Proc Jicable’15—9th int conf
insul power cables, Paris, France, June 21–25, 2015
18. Trarieux F, Lyons GJ, Patel MH (2006) Investigations with a
bandwidth measure for fatigue assessment of the Foinaven
dynamic umbilical including VIV. Eng Struct 28:1671–1690.
doi:10.1016/j.engstruct.2006.03.014
19. Martinelli L, Lamberti A, Ruol P, Ricci P, Kirrane P, Fenton C,
Johanning L (2010) Power umbilical for ocean renewable energy
systems—feasibility and dynamic response analysis. In: Proc 3rd
int conf ocean energy, Bilbao, Spain, October 6, 2010
20. Nasution FP, Sævik S, Berge S (2014) Experimental and finite
element analysis of fatigue strength for 300 mm2 copper power.
Mar Struct 39:225–254. doi:10.1016/j.marstruc.2014.07.005
21. Nasution FP, Sævik S, Gjøsteen JKØ (2014) Finite element
analysis of the fatigue strength of copper power conductors
exposed to tension and bending loads. Int J Fatigue 59:114–128.
doi:10.1016/j.ijfatigue.2013.09.009
22. Nasution FP, Sævik S, Gjøsteen JKØ, Berge S (2013) Experi-
mental and finite element analysis of fatigue performance of
copper power conductors. Int J Fatigue 47:244–258. doi:10.1016/
j.ijfatigue.2012.09.006
23. Thies PR, Johanning L, Bashir I, Tuk T, Tuk M, Marta M,
Muller-Schutze S (2016) Accelerated reliability testing of artic-
ulated cable bend restrictor for offshore wind applications. Int J
Mar Energy 16:65–82. doi:10.1016/j.ijome.2016.05.006
24. Hansen-Zahl K, Henøen V, Baarholm R, Parsinejad F, Con-
stantinides Y (2015) Effect of damping on VIV response in
umbilicals and flexible risers. In: Proc ASME 2015 34th int
conf ocean, offshore arct eng (OMAE2015), St. John’s, New-
foundland, Canada, May 31–June 5, 2015. American Society
of Mechanical Engineers, New York, ASME Paper No.
OMAE2015-41387
28 J Mar Sci Technol (2018) 23:10–29
123
25. Liu Y, Bergdahl L (1997) Frequency-domain dynamic analysis of
cables. Eng Struct 19:499–506. doi:10.1016/S0141-
0296(96)00091-0
26. Fitzgerald J, Bergdahl L (2008) Including moorings in the
assessment of a generic offshore wave energy converter: a fre-
quency domain approach. Mar Struct 21:23–46. doi:10.1016/j.
marstruc.2007.09.004
27. Chen X, Zhang J, Ma W (2001) On dynamic coupling effects
between a spar and its mooring lines. Ocean Eng 28:863–887.
doi:10.1016/S0029-8018(00)00026-3
28. Astrup OC (2004) DeepC – deep water coupled analysis tool. A
white paper (Rev 3). Det Norske Veritas (DNV), Høvik
29. Yang S-H, Ringsberg JW, Johnson E (2014) Analysis of mooring
lines for wave energy converters—a comparison of de-coupled
and coupled simulation procedures. In: Proc ASME 2014 33rd int
conf ocean, offshore arct eng (OMAE2014), San Francisco, CA,
June 8–13, 2014. American Society of Mechanical Engineers,
New York, ASME Paper No. OMAE2014-23377
30. Yang S-H, Ringsberg JW, Johnson E, Hu ZQ, Palm J (2016) A
comparison of coupled and de-coupled simulation procedures for
the fatigue analysis of wave energy converter mooring lines.
Ocean Eng 117:332–345. doi:10.1016/j.oceaneg.2016.03.018
31. Det Norske Veritas (2013) Sesam DeepC (V4.7-07 edn). Det
Norske Veritas (DNV), Høvik
32. SIMO Project Team (2012) SIMO—general description Version
4.0. Norwegian Marine Technology Research Institute (MAR-
INTEK), Trondheim, Norway. Report No. 516412.00.01
33. Det Norske Veritas (2013) RIFLEX user’s manual Version 4.0
(Rev 3). Det Norske Veritas (DNV), Høvik
34. Endo T, Morrow JD (1969) Cyclic stress-strain and fatigue
behavior of representative aircraft metals. J Mater 4:159–175
35. Rychlik I (1987) A new definition of the rainflow cycle counting
method. Int J Fatigue 9:119–121. doi:10.1016/0142-
1123(87)90054-5
36. The MathWorks Inc (2013) MATLAB, R2013b edn. The Math-
Works Inc, Natick
37. Waves4Power AB (2016) Homepage of Waves4power. http://
www.waves4power.com. Accessed 8 March 2017
38. Falnes J (2002) Wave-energy absorption by oscillating bodies.
Ocean waves and oscillating systems: linear interactions includ-
ing wave-energy extraction. Cambridge University Press, Cam-
bridge, pp 196–224
39. OrcaFlex O (2015) Design tool for chain moorings. https://www.
orcina.com/SoftwareProducts/OrcaFlex/Documentation/Help/
Content/html/Chain.htm. Accessed 8 March 2017
40. Dobson A, Frazer S (2012) Risk mitigation through the appli-
cation of new power umbilical technology. In: Proc ASME 2012
31st int conf ocean, offshore arct eng (OMAE2012), Rio de
Janeiro, Brazil, June 1–6, 2012. American Society of Mechanical
Engineers, New York, ASME Paper No. OMAE2012-83878
41. Worzyk T (2009) Submarine power cables: design, installation,
repair, environmental aspects. Springer, Dordrecht. doi:10.1007/
978-3-642-01270-9
42. Det Norske Veritas (2012) RIFLEX theory manual Version 4.0.
Det Norske Veritas (DNV), Høvik
43. Det Norske Veritas (2010) Recommended practice DNV-RP-
C205 environmental conditions and environmental loads. Det
Norske Veritas (DNV), Høvik. http://diaviou.auth.gr/sites/
default/files/pegatraining/Codes-DNV-RP-C205.pdf. Accessed 8
March 2017
44. Yang S-H, Ringsberg JW, Johnson E (2015) Parametric study of
the mechanical characteristics of power cables under dynamic
motions. In: Proc 11th European wave tidal energy conf, Nantes,
France, September 6–11, 2015. Paper No. 09D5-5
45. SIMO Project Team (2012) SIMO – theory manual Version 4.0
(Rev 1). Norwegian Marine Technology Research Institute
(MARINTEK), Trondheim. Report No. 516412.00.03
46. Faltinsen OM (2002) Sea loads on ships and offshore structures.
Cambridge University Press, Cambridge
47. Roussel P (1976) Numerical solution of static and dynamic
equations of cables. Comput Methods Appl Mech Eng 9:65–74.
doi:10.1016/0045-7825(76)90077-3
48. Aamo OM, Fossen TI (2000) Finite element modelling of
mooring lines. Math Comput Simul 53:415–422. doi:10.1016/
S0378-4754(00)00235-4
49. Escalante MR, Sampaio R, Rosales MB, Ritto T (2011) A
reduced order model of a 3D cable using proper orthogonal
decomposition. In: Oscar M, Javier WS, Mario AS (eds)
Mechanics Computational, pp 1143–1158
50. American Petroleum Institute (1998) API specification-17E
specification for subsea umbilicals. American Petroleum Institute
(API), Washington, DC
51. Chakrabarti SK (1987) Wave theories. Hydrodynamics of off-
shore structures. Springer, Dordrecht, pp 41–85
52. Berteaux HO (1976) Oceanographic buoy systems, classes,
designs, and components-buoy system design. In: McCormick
ME (ed) Buoy engineering. Wiley-Interscience, Canada,
pp 199–272
53. Schlager KJ (1956) Systems engineering—key to modern
development. IRE Trans Eng Manag 3:64–66. doi:10.1109/IRET-
EM.1956.5007383
54. Det Norske Veritas (2012) Recommended practice DNV-RP-
F401 electrical power cables in subsea applications. Det Norske
Veritas (DNV), Høvik. https://rules.dnvgl.com/docs/pdf/DNV/
codes/docs/2012-02/RP-F401.pdf. Accessed 8 March 2017
J Mar Sci Technol (2018) 23:10–29 29
123