Embed Size (px)
Citation preview

1
THESIS – MO142528
PARAMETRIC STUDY OF FATIGUE ANALYSIS ON
EXTERNAL TURRET MOORING LINE
Norman Mahdar Sabana
04111550012002
SUPERVISOR:
Prof. Ir. Eko Budi Djatmiko, M.Sc., Ph.D.
Dr. Eng. Rudi Walujo Prastianto, S.T., M.T.
MAGISTER PROGRAM
DESIGN OF OCEAN STRUCTURES ENGINEERING
DEPARTMENT OF OCEAN ENGINEERING
FACULTY OF MARINE TECHNOLOGY
SEPULUH NOPEMBER INSTITUTE OF TECHNOLOGY
SURABAYA
2018

TESIS – MO142528
PARAMETRIC STUDY OF FATIGUE ANALYSIS ON
EXTERNAL TURRET MOORING LINE
Norman Mahdar Sabana
04111550012002
SUPERVISOR:
Prof. Ir. Eko Budi Djatmiko, M.Sc., Ph.D.
Dr. Eng. Rudi Walujo Prastianto, S.T., M.T.
MAGISTER PROGRAM
DESIGN OF OCEAN STRUCTURES ENGINEERING
DEPARTMENT OF OCEAN ENGINEERING
FACULTY OF MARINE TECHNOLOGY
SEPULUH NOPEMBER INSTITUTE OF TECHNOLOGY
SURABAYA
2018


ii
iii
PARAMETRIC STUDY OF FATIGUE ANALYSIS ON
EXTERNAL TURRET MOORING LINE
Student Name : Norman Mahdar Sabana
REG : 04111550012002
Supervisor : Prof. Ir. Eko Budi Djatmiko, M.Sc., Ph.D.
Dr. Eng. Rudi Walujo Prastianto, S.T., M.T.
ABSTRACT
This thesis presents the parametric study of fatigue life applied on turret-
moored Floating LNG. Several parametrical cases were designed to investigate
the influence of mooring line pretension, water depth and wave load component
(1st order and 2nd order wave load) on the fatigue life of turret mooring systems.
The object is Floating LNG with permanent external turret mooring operated in
602m water depth. The mooring system consists of 12 catenary lines arranged in 3
group with 4 lines of each. Time domain simulation applied to calculated coupled
dynamic response and mooring lines tension. Fatigue life assessed using rainflow
counting method, T-N curves and Palmgren-Miner rule.
Analysis results for mooring pretension show that case study 2 with lowest
pretension (14%MBL) yields shortest mooring fatigue life of 1814.20 years
compared to case study 1 (18%MBL) and case study 3 (22%MBL) with 2034.61
years and 2983.33 years respectively. Despite has the lowest dynamic line tension,
case study 2 has larger tension range that results in the increased of fatigue
damage. The increase in water depth will increase mooring line length, weight and
so it results in the increased of fatigue damage. This is reflected in case study 5
(903m water depth), which has shortest mooring fatigue life of 1842.65 years
compare to case study 1 (602m water depth) and case study 4 (301m water depth)
with 2983.33 years and 3363.62 years respectively. For the case of wave load
type, 1st order wave component yields shorter mooring fatigue life of 1186.71
years compared to 2nd order wave component with mooring fatigue life of 2872.47
years. Although the 1st order wave component has less effect in global motion
response and line tension on moored vessel, its induced higher fatigue damage
than 2nd order wave component.
Keywords: External turret, Fatigue life, Mooring lines, Pretension, Water depth,
Wave load

iv

v
PREFACE
Assalamu’alaikum Wr. Wb.
Praise to Allah SWT for the gracious mercy and tremendous blessing that
enables the author to accomplish the thesis entitled, “Parametric Study of Fatigue Analysis on External Turret Mooring Line”. This thesis is carried out for the
completion of master degree program of Design of Ocean Structures Engineering,
Ocean Engineering Department, Faculty of Marine Technology at Sepuluh
Nopember Institute of Technology (ITS) Surabaya. This thesis generally
discussed the influence of several parameters on fatigue life design of mooring
lines. Floating LNG with external turret mooring system are selected object in this
study.
The author would like to thank everyone for the help and support during the
work of this thesis. At the moment, author would address huge thanks and
appreciation for:
1. My parents, Mr. Sudarmoro (Alm.) and Mrs. Mahmoedah Sjoehadminingsih
for the endless support, timeless pray and unconditional love. My brother,
Augene, and sister, Medina for the constant support.
2. The supervisors, Prof. Ir. Eko Budi Djatmiko, MSc., Ph.D and Dr. Eng. Rudi
Walujo Prastianto, ST., MT for the guidance, comment and continuous help
throughout the thesis work.
3. All lecturer in Department of Ocean Engineering, especially: Prof. Ir. Daniel
M. Rosyid, Ph.D., Yoyok Setyo Hadiwidodo, ST., MT., Ph.D., Nur Syahroni
ST., MT., Ph.D., Ir. Handayanu, M.Sc., Ph.D., and Ir. Herman Pratikno, ST.,
MT., Ph.D. for the advice and recommendation to this thesis. Also for Ir.
Murdjito, M.Sc.Eng for the insight related to offshore structures.
4. All staff at PT. ZEE Engineering, especially Mr. Cecep Hendra, Agus
Budiono, Sukar Martaredja, Fajar Rachmadiarto, Brian Putra for providing
license and guidance on OrcaFlex software. Their help related to OrcaFlex
problems are highly appreciated.
5. All staff at DNV GL, especially Noble Denton’s colleagues in Indonesia.
Their time has always been available for consultation and discussion during
this study.
6. Fahmy Ardhiansyah and Yuni Ari Wibowo for the knowledge sharing and
continuous discussion related to hydrodynamic and mooring analysis. Last
but not least, my colleagues in Design of Ocean Structures Engineering:
Rahmat, Rino, Yani and Aldi.

vi
Learning about hydrodynamic and mooring analysis related to this thesis
has been challenging, yet very useful to the author on understanding the fatigue
life design on mooring line. The author acknowledges that this thesis is not
perfect, advice and suggestion are most welcome for further work. Hopefully, this
thesis can be useful for the readers.
Surabaya, July 2018
Author
Norman Mahdar Sabana

vii
TABLE OF CONTENTS
LEMBAR PENGESAHAN ..................................................................................... i
ABSTRACT ........................................................................................................... iii
PREFACE ............................................................................................................... v
TABLE OF CONTENTS ...................................................................................... vii
LIST OF FIGURES................................................................................................ xi
LIST OF TABLES ............................................................................................... xiii
NOMENCLATURE .............................................................................................. xv
ABBREVIATIONS............................................................................................. xvii
1. INTRODUCTION........................................................................................... 1
1.1 Background............................................................................................... 1
1.2 Problem Definitions.................................................................................. 4
1.3 Research Objective ................................................................................... 4
1.4 Research Scope ......................................................................................... 4
1.5 Report Format ........................................................................................... 5
2. LITERATURE STUDY AND THEORETICAL BACKGROUND .............. 7
2.1 Literature Study ........................................................................................ 7
2.2 Theoretical Background ......................................................................... 10
2.2.1 Rigid Body Motions ........................................................................ 10
2.2.2 Wind Loads ..................................................................................... 12
2.2.3 Current Loads .................................................................................. 17
2.2.4 Wave Loads ..................................................................................... 21
2.2.5 First Order Wave Loads .................................................................. 22
2.2.6 Second Order Wave Forces ............................................................. 22
2.2.7 Mooring System .............................................................................. 25
2.2.8 Mooring Analysis ............................................................................ 27

viii
2.2.9 Fatigue Damage Assessment ........................................................... 31
2.2.10 Rainflow counting ........................................................................... 34
3. METHODOLOGY ........................................................................................ 39
3.1 Research Method .................................................................................... 39
3.2 Research Data ......................................................................................... 44
3.2.1 Vessel Data ...................................................................................... 44
3.2.2 Environmental Data ......................................................................... 45
3.2.3 Mooring Line Data .......................................................................... 47
3.2.4 Corrosion Allowance ....................................................................... 50
3.3 Numerical Model .................................................................................... 51
3.3.1 Vessel Model ................................................................................... 51
3.3.2 Wind and Current Load on Vessel .................................................. 53
3.3.3 Mooring System Design .................................................................. 56
3.3.4 Loading Scenario ............................................................................. 60
4. RESULTS AND DISCUSSIONS ................................................................. 63
4.1 Vessel Hydrodynamic Analysis .............................................................. 63
4.2 Mooring Line Loads ............................................................................... 68
4.2.1 Pretension Case................................................................................ 68
4.2.2 Water Depth Case ............................................................................ 70
4.2.3 Wave Load Type ............................................................................. 72
4.3 Mooring Line Fatigue Life...................................................................... 74
4.3.1 Base Case ......................................................................................... 75
4.3.2 Mooring Pretension Case................................................................. 78
4.3.3 Water Depth Case ............................................................................ 80
4.3.4 Wave Load Type Case ..................................................................... 82
5. CONCLUSION ............................................................................................. 87

ix
5.1 Conclusion from results and discussion ................................................. 87
5.2 Recommendation .................................................................................... 88
REFERENCES ...................................................................................................... 89
APPENDIX

x

xi
LIST OF FIGURES
Figure 1-1 Floating Production Unit with external turret mooring (Wall, 2002) ... 2
Figure 2-1 Floating body motion modes (Mahdarreza, 2011) .............................. 10
Figure 2-2 Definitions used for force and moments (Journee & Massie, 2001) ... 15
Figure 2-3 Example of wind load coefficients (Journee & Massie, 2001) ........... 16
Figure 2-4 Influence of water depth on transverse current load on a tanker
(Journee & Massie, 2001) ..................................................................................... 20
Figure 2-5 Wave drift force obtained from a wave record (Journee & Massie,
2001) ..................................................................................................................... 24
Figure 2-6 Low frequency surge motion of a barge (Journee & Massie, 2001) ... 25
Figure 2-7 FPSO with external turret mooring system (www.ptsc.com.vn) ........ 27
Figure 2-8 FPSO with internal turret mooring system (www.2b1stconsulting.com)
............................................................................................................................... 27
Figure 2-9 Catenary mooring line (Faltinsen, 1990) ............................................. 29
Figure 2-10 Forces on an element of mooring line (Faltinsen, 1990) ................... 30
Figure 2-11 Mooring fatigue design curves (API, 2008) ...................................... 33
Figure 2-12 Stress time history. Left: Constant amplitude stressing. Right:
Random stress time history (Yarveisy, 2015) ....................................................... 35
Figure 2-13 Rainflow cycle counting scheme (Gao, 2008) .................................. 36
Figure 3-1 Analysis Methodology ........................................................................ 39
Figure 3-2 Mooring system configuration ............................................................ 42
Figure 3-3 FLNG General Arrangement ............................................................... 45
Figure 3-4 Mooring legs general arrangement (JTM, 2014)................................. 49
Figure 3-5 Chain table plan view (JTM, 2014) ..................................................... 50
Figure 3-6 Vessel panel model in MOSES: Starboard view ................................. 51
Figure 3-7 Vessel panel model in MOSES: Top view .......................................... 51
Figure 3-8 Vessel panel model in MOSES: Front view ........................................ 52
Figure 3-9 Wind load coefficients graph .............................................................. 53
Figure 3-10 Current load coefficients graph ......................................................... 54
Figure 3-11 Wind area – lateral ............................................................................ 56
Figure 3-12 Wind area – longitudinal ................................................................... 56
xii
Figure 3-13 Coordinate system.............................................................................. 58
Figure 3-14 Mooring system model in OrcaFlex – Plan view .............................. 59
Figure 3-15 Mooring system model in OrcaFlex – Elevation view ...................... 59
Figure 3-16 Mooring system model in OrcaFlex: Isometric 3D view .................. 60
Figure 3-17 Collinear environmental load............................................................. 61
Figure 4-1 Vessel motion operator: Surge ............................................................. 64
Figure 4-2 Vessel motion operator: Sway ............................................................. 64
Figure 4-3 Vessel motion operator: Heave ............................................................ 65
Figure 4-4 Vessel motion operator: Roll ............................................................... 65
Figure 4-5 Vessel motion operator: Pitch .............................................................. 66
Figure 4-6 Vessel motion operator: Yaw .............................................................. 66
Figure 4-7 Irregular JONSWAP wave spectrum for Hs=1.725m ......................... 67
Figure 4-8 Maximum line tension and vessel offset for pretension case .............. 70
Figure 4-9 Maximum tension of Line 6 for water depth case ............................... 72
Figure 4-10 Maximum tension of Line 6 for wave load type case ........................ 74
Figure 4-11 Fatigue life graph at Line 5 ................................................................ 77
Figure 4-12 Tension comparison of Line 5 at arc length 0m vs 826m. Load case
77 with Hs=1.725m; Tp=6.35m; Vw=14.85m/s; Vc=0.68m/s; µ=180o collinear... 78
Figure 4-13 Line section with shortest fatigue life – Line 5 ................................. 78
Figure 4-14 Mooring line fatigue life for cases with different pretension ............ 79
Figure 4-15 Mooring line fatigue life for cases with different water depth .......... 81
Figure 4-16 Mooring line fatigue life for cases with different wave load type ..... 83
Figure 4-17 Time series of tension in Line 5 - arc length 826m. Load case 77 with
Hs=1.725m; Tp=6.35m; Vw=14.85m/s; Vc=0.68m/s; µ=180o collinear ................ 84
Figure 4-18 Time series of tension in Line 5 - arc length 826m at 9200-9500sec.
Load case 77 with Hs=1.725m; Tp=6.35m; Vw=14.85m/s; Vc=0.68m/s; µ=180o
collinear ................................................................................................................. 85
Figure 4-19 Surge response for load case 77 with Hs=1.725m; Tp=6.35m;
Vw=14.85m/s; Vc=0.68m/s; µ=180o collinear ...................................................... 85
Figure 4-20 Surge response for load case 77 at 9000-9500sec with Hs=1.725m;
Tp=6.35m; Vw=14.85m/s; Vc=0.68m/s; µ=180o collinear ................................... 86

xiii
LIST OF TABLES
Table 1-1 Major mooring incidents between 2001 and 2011 (Ma et al., 2013) ...... 3
Table 2-1 Wind coefficients for various tanker hull (Journee & Massie, 2001)... 16
Table 2-2 Coefficient bn and cn for current load coefficients (Journee & Massie,
2001) ..................................................................................................................... 20
Table 2-3 M and K values (API, 2008) ................................................................. 32
Table 3-1 Mooring system configuration for various case study .......................... 43
Table 3-2 Vessel Particular ................................................................................... 44
Table 3-3 Field Scatter Data ................................................................................. 45
Table 3-4 Current speed ........................................................................................ 47
Table 3-5 Mooring line properties ........................................................................ 47
Table 3-6 Mooring line length .............................................................................. 48
Table 3-7 Corrosion allowance ............................................................................. 51
Table 3-8 Acceptable tolerances for hull form dependent (ABS MODU, 2012) . 52
Table 3-9 Model verification ................................................................................ 53
Table 3-10 Wind load coefficients ........................................................................ 54
Table 3-11 Current load coefficients..................................................................... 55
Table 3-12 Fatigue loading condition ................................................................... 61
Table 4-1 Base case mooring properties ............................................................... 68
Table 4-2 Pretension case mooring properties ...................................................... 69
Table 4-3 Mooring line load – Pretension case ..................................................... 69
Table 4-4 Water depth case mooring properties ................................................... 71
Table 4-5 Mooring line load – water depth case ................................................... 71
Table 4-6 Wave load type mooring properties ...................................................... 72
Table 4-7 Mooring line load – wave load type case ............................................. 73
Table 4-8 Summary of base case fatigue analysis ................................................ 75
Table 4-9 Minimum fatigue life with different pretension ................................... 80
Table 4-10 Tension statistics for pretension case ................................................. 80
Table 4-11 Minimum fatigue life with different water depth ............................... 82
Table 4-12 Tension statistics for water depth case ............................................... 82
Table 4-13 Minimum fatigue life with different wave load type .......................... 83

xiv

xv
NOMENCLATURE
AL = lateral projected wind area (m2)
ALS = lateral projected current area (m2)
AT = transverse projected wind area (m2)
ATS = transverse projected current area (m2)
A(ω) = frequency-dependent added mass matrix
B = breadth of the ship (m)
C(ω) = frequency-dependent potential damping matrix
C*w(rw) = rw - dependent wind load coefficient (-)
C-C(c) = c - dependent current load coefficient (-)
Di = annual fatigue damage to the component due to environmental state
i
D1 = linear damping matrix
D2 = quadratic damping matrix
E = elastic modulus 𝐸[𝑅𝑖𝑀] = expected value of the normalized tension range Ri raised to the
power M, in state i 𝑓(�̇�) = vector function where each element is given by �̇�𝑖|�̇�𝑖| Hs = significant wave height
K(x) = position-dependent stiffness matrix
L = length of the ship (m)
Lm = ratio of mean load to reference breaking strength (RBS) for wire
rope
m = body mass matrix
N = number of cycles
Nc = steady horizontal current moment (Nm)
Nw = steady horizontal wind moment (Nm)
ni = the number of tension cycles encountered in state i per year
qCU = current drag force
qoth = other forces including forces from the mooring system
xvi
qWI = wind drag force 𝑞𝑊𝐴1 = first order wave excitation force 𝑞𝑊𝐴2 = second order wave excitation force 𝑞(𝑡, 𝑥, �̇�) = excitation force vector
R = ratio of tension range (double amplitude) to reference breaking
strength (RBS)
Rn = Reynolds number (-) 𝑅(𝜔𝑖) = reflection coefficient (=1.0)
S = wetted surface of the ship (m2)
s = catenary length
T = draft of the ship (m)
Tp = wave peak period 𝑇𝐻 = horizontal component of tension 𝑇𝑧 = vertical component of line tension at the top end
t = time variable
Vc = relative current velocity (m/s)
Vrw = relative wind velocity (m/s)
v = kinematic viscosity of water (m2s)
Xc = steady longitudinal current force (N)
Xw = steady longitudinal wind force (N) 𝑥, �̇�, �̈� = vectors of displacement, velocity and acceleration
Yc = steady lateral current force (N)
Yw = steady lateral wind force (N)
c = relative current direction (-), from astern is zero
w = relative wind direction (-), from astern is zero ⍴ = density of water (kg/m3) ⍴air = density of air (kg/m3) ∅initial = initial diameter of mooring line ∅corroded = corroded diameter of mooring line
ω = frequency of incident waves

xvii
ABBREVIATIONS
ABS = American Bureau of Shipping
API = American Petroleum Institute
CCW = Counter-Clockwise
DNV-OS = Det Norske Veritas – Offshore Standard
DOF = Degree of Freedom
EFCS = Earth-Fixed Coordinate System
FD = Frequency Domain
FLNG = Floating Liquified Natural Gas
FoS = Factor of Safety
FP = Fore Perpendicular
FPSO = Floating Production Storage and Offloading
FPU = Floating Production Unit
ITTC = International Towing Tank Conference
KMl = Keel to Metacentre Longitudinal
KMt = Keel to Metacentre Transversal
LCB = Longitudinal Centre of Buoyancy
LCF = Longitudinal Centre of Floatation
LF = Low-Frequency
MBL = Minimum Breaking Load
MBS = Minimum Breaking Strength
MODU = Mobile Offshore Drilling Unit
NPD = Norwegian Petroleum Directorate
QTF = Quadratic Transfer Function
RAO = Response Amplitude Operator
RBS = Reference Breaking Strength
SPM = Single Point Mooring
STD = Standard Deviation
TCB = Transverse Centre of Buoyancy
TD = Time Domain

xviii
TLP = Tension Leg Platform
VCB = Vertical Centre of Buoyancy
VCG = Vertical Centre of Gravity
VFCS = Vessel-Fixed Coordinate System
WD = Water Depth
WF = Wave-Frequency

1
1. INTRODUCTION
1.1 Background
Floating structures are extensively used for oil and gas production at sea.
The number of floating structures operating in the world increased substantially
during the 1990’s. As of November 2013, the inventory of Floating Production
Units (FPUs) stands at 277 around the world, which 62% of the total are FPSOs
(Offshore, 2013b). Under environmental loads of waves, wind and current, a free-
floating structure experience offsets different from desired operation point. Such
structures are commonly moored to the sea bed. Mooring system consist of
chains, cables, ropes and anchors which connected between seabed and structure.
Mooring lines are still the most important and economically effective components
for station-keeping under environmental loads. Mooring systems must provide
such station keeping capability and high global performance to ensure allowable
excursions against environmental loads.
First Single Point Mooring (SPM) was installed in the Arabian Gulf in
1964, since then, a number of these units are now in use. A typical early facility
consisted of a buoy that serves as a mooring terminal. It is attached to the sea floor
either by catenary lines, taut mooring lines or a rigid column. The vessel is
moored to the buoy either by synthetic hawsers or by a rigid A-frame yoke.
Turntable and fluid swivels on the buoy allow the vessel to weathervane, reducing
the mooring loads. Even though has several good design features, the SPM system
involves many complex components and is subjected to a number of limitations.
More recently, turret mooring systems for monohull floating production and
storage vessels have been developed that are considered to be more economic and
reliable than SPMs, and are widely used today. The turret can either be external or
internal. Mooring lines connect the turret to the seabed (Brown, 2005).
What makes a turret moored system special is that the vessel can rotate
around the fixed turret. The vessel can then position itself in such a way that it
minimizes the forces acting on the vessel from the environment by reducing the
total exposed surface. It is also easier to keep the desired position with such

2
systems. Fewer chains and smaller anchors can then be used compared to a
traditionally spread mooring system. This is one of the main advantages with a
turret moored system. Figure 1-1 shows Floating Production Unit equipped with
external turret mooring on the bow.
Figure 1-1 Floating Production Unit with external turret mooring (Wall, 2002)
When a vessel is exposed to waves, it experiences wave loads that can be
split into first order and second order terms. The first order terms generate motion
at wave frequency, while the second order terms are much smaller but they
include loads with a much lower frequency. These low frequency terms are called
the wave drift loads and they can cause significant slow drift motions of the vessel
if their frequencies are close to a natural frequency of the vessel. Ormberg and
Larsen (1998) studied a turret-moored FPSO operating in different water depth,
showed that for large water depth, the low frequency response becomes dominant
and non-coupled analysis failed to predict the motions accurately.
Variance in wind, current, and wave loads generate variable motion and
tension in the mooring system. Unlike trading ships, Floating Production Unit stay
at the same location year after year without regular dry docking for inspection and
repair. Since the FPU cannot move off the station, then she must withstand
whatever weather comes their way. Gradual accumulation of the variable tension
in the mooring line can lead to cumulative fatigue damage. Between 2001 and
2011, mooring incidents have been occurring at a high rate. More than twenty (20)
incidents have happened to production vessels that are moored on-site for

3
prolonged duration (typically 15-25 years). Among those, at least eight (8) had
multiple line damages, or system failure. Some of them led to vessel drifting (Ma
et al., 2013). Assessing the fatigue life of mooring systems attract industry
attention and becomes important in the offshore industry.
Table 1-1 Major mooring incidents between 2001 and 2011 (Ma et al., 2013)
Year Vessel Name Incident
2011 Banff 5 of 10 lines parted
2011 Volve 2 of 9 lines parted, no damage to riser
2011 Gryphon Alpha 4 of 8 lines parted, vessel drifted a distance, riser
broken
2010 Jubarte 3 lines parted between 2008 and 2010
2009 Nan Hai Fa Xian 4 of 8 lines parted, vessel drifted a distance, riser
broken
2009 Hai Yang Shi You Entire yoke mooring column collapsed; vessel adrift,
riser broken
2006 Liuhua (N.H.S.L) 7 of 10 lines parted, vessel drifted a distance, riser
broken
2002 Girassol Buoy 3 of 9 lines parted, no damage to offloading lines.
This master thesis conduct fatigue analysis on the mooring lines of a
Floating LNG with external turret mooring system. The analysis emphasizes the
influence of several parameters on fatigue life of mooring lines. The influence of
mooring line pretension on the fatigue life of lines will be calculated and
compared. Fatigue life analysis will be conducted for several pretension values
and the results will be compared each other.
The modelled moored vessel will also be simulated in several values of
water depth to investigate its effect on fatigue life mooring lines. The influence of
1st order and 2nd order wave load on the fatigue life of mooring lines will also be
investigated. The various results obtained from these studies can be used as
reference for fatigue analysis of mooring lines with external turret system.

4
1.2 Problem Definitions
This master thesis will cover following problems to be discussed:
1. The influence of mooring line pretension on the fatigue life of external turret
mooring lines.
2. The influence of water depth on the fatigue life of external turret mooring
lines.
3. The influence of wave load (1st order and 2nd order) on the fatigue life of
external turret mooring lines.
1.3 Research Objective
The objective of this research are as follows:
1. Identify the influence of mooring line pretension on the fatigue life of external
turret mooring lines.
2. Identify the influence of water depth on the fatigue life of external turret
mooring lines.
3. Identify the influence of 1st order and 2nd order wave load on the fatigue life of
external turret mooring lines.
1.4 Research Scope
Scope of research for this master thesis are defined as follows:
1. Floating structure assumed as a rigid body, no deformation occurred under
certain loads.
2. Floating structure studied in these research is Floating LNG with external
turret mooring system.
3. Environmental loads of wind, current and wave (1st order and 2nd order) are
considered in the analysis.
4. Tidal conditions are neglected and operational draft measured at mean sea
level (MSL).
5. Seabed profile assumed to be flat.

5
6. Risers and umbilical are not accounted in the analysis.
7. Mooring connection elements/links are not accounted in the analysis.
8. Dynamic simulation performed using time domain coupled analysis.
9. Fatigue damage are calculated based on effective tension of mooring lines
(Tension-Tension Fatigue).
1.5 Report Format
This report starts with introduction on the Section 1. This section covers
research background, problem definition, research objective and scope of work
applied in this research.
Literature study and theoretical background is described in Section 2. This
section covered reference and theory used as guidance for this master thesis.
Reference could be taken from journals, books, rules and codes relevant with
subject of this research.
Section 3 describes research methodology, covers the method and step used
to performed the research. Data identification, structure modelling and model
verification were discussed in this section.
Section 4 describes results obtained from the analysis. The results obtained
from analysis will be processed to give brief understanding related to the subject.
Based on the results, a conclusion will be drawn in the Section 5.
Recommendations for the future research will also be given in this section.

6
7
2. LITERATURE STUDY AND THEORETICAL
BACKGROUND
2.1 Literature Study
During the past years, the requirements to the mooring and station keeping
systems of mobile and permanent units have become more complex. The industry
is moving into new frontiers (ultra-deep water), also the new floating units are
becoming larger and many units are at the end of their lifetime. In addition,
mooring failure rate is unacceptably high. Some incidents have been multiple line
failures, leading to vessel drifting. The investigations show a variety of direct
causes covering both inaccurate design, bad quality in fabrication of mooring line
components and insufficient fatigue resistance of components, in particular the
mooring line component.
Ormberg and Larsen (1998) studied coupled analysis of floater motion and
mooring dynamics of a turret-moored ship. Turret motions and line tensions from
experiments, traditional separated analysis and coupled analysis are compared.
The turret motions estimated by a separated analysis compare well with both
coupled and experiments. However, for both line tension and turret forces,
separated approach gives underpredicted results compared to coupled analysis.
The underprediction is especially the case for vertical turret forces and this trend
increases with increasing water depth. In deep water, a coupled analysis approach
is therefore highly recommended for checks of important design cases.
Lin and Sayer (2015) studies two type of mooring system design method
(coupled Low frequency and fully coupled) and assessed the behavior of mooring
system in different water depth. Both mooring line tension and surge response are
completely determined by the Low frequency (LF) response, particularly for large
water depths. The Wave frequency (WF) surge response is independent of water
depth, in contrast to the LF surge response. Water depth variation has little effect
on mean heave motion, even at resonance. For a catenary chain, the WF response
becomes more significant as the water depth increases. However, for a taut
mooring line, the WF response is significant in intermediate water depths
8
(between 1500m and 2000m), becoming less important in ultra-deep
depths(>2000m).
Han et al. (2010) studied the different composition of mooring system and
its effect on the fatigue life of mooring lines. They compare the extreme dynamic
loads and fatigue life performance of different configuration of mooring system
(4x4 and 4x3) which has similar static stiffness. A time-domain computational is
used to determine the extreme tension, while the spectral method is implemented
for estimating the fatigue life. The maximum tension in 4x3 mooring system is
about 26% higher than that in 4x4 system. The maximum offset is almost same.
The fatigue life of two systems turns out to be similar, which the upper chain has
the shortest fatigue life.
Chrolenko (2013) compare results for mooring lines analyses in Frequency
Domain (FD) and Time Domain (TD) for turret moored FPSO at particular water
depth. The comparison will be to investigate differences in response calculations
for leeward lines, for the purpose of estimating fatigue damage in a given short-
term sea state. For fatigue damage the most important parameters are the standard
deviation (STD) of low- and wave-frequency tension (LF and WF).
Wu et al. (2014) presented numerical analysis of fatigue damage along
mooring lines for semi-submersible in the deepwater. They identify the most
critical fatigue damage locations for different mooring systems. The factors
affecting the critical location, such as: mooring pattern, pretensions, chain length,
water depth are discussed, thus provides recommendations for mooring fatigue
design of offshore structures.
Saidee (2015) presented fatigue design of spread mooring component for
different analysis method as per DNV-OS-E301. Comparative study shows that
RFC method will predict higher fatigue damage compare to other methods. It is
also recommended to do Time domain analysis to be sure about fatigue damage
since only doing Frequency domain analysis might under predicts the fatigue
damage that leading to failure of the mooring lines in future.
9
Kang et al. (2016) studied fatigue analysis of spread mooring line.
Contribution of environmental loads (wind, wave, current), type of responses (WF
and LF motions), vessel offsets, mooring position, loading conditions (ballast,
intermediate, full) and riser behavior (with and without riser) are investigated.
Fatigue analysis performed through dynamic time domain simulation, while
number of cycles of tension is calculated using rain-flow counting method.
Junfeng et al. (2016) studies the effect of several factors on Low frequency
(LF) fatigue damage of mooring lines applied in a Semi-Submersible platform.
Analytical cases designed to perform fatigue analysis to investigate the influence
of water depth, Hs, Tp and riser system on the fatigue damage of mooring
systems. The platform system in deeper water has smaller mooring stiffness and
higher damping ratio, which results in a larger system natural period. For the
mooring line tension and fatigue damage, the WF components increase with the
increase of water depth, but the LF components decrease due to higher damping.
This thesis deals with several parameters that might affect the fatigue
performance of mooring lines. The external turret mooring system of FLNG is
chosen in this study. It has chain and wire components from fairlead to anchor.
The studied parameters for sensitivity are mooring line pretension, water depth
and wave loads type. In order to perform fatigue analysis, time series of tension
mooring lines were calculated through dynamic analysis. Fatigue life of mooring
lines were obtained using Rainflow counting method, T-N curve and the Miner’s
linear cumulative law model which is the common used method for fatigue
damage calculation.

10
2.2 Theoretical Background
2.2.1 Rigid Body Motions
The rigid-body translational motions are referred to as surge, sway and
heave, while the rotational motions are referred to as roll, pitch and yaw. For a
ship-shaped structure, surge is the longitudinal motion and roll is the angular
motion about the longitudinal axis. All six rigid-body motions can be seen in
Figure 2-1.
Figure 2-1 Floating body motion modes (Mahdarreza, 2011)
Motions of floating structures can be divided into static and dynamic
motion. Static motion is the mean offset, whereas dynamic motion can be divided
by frequency-content into:
• Wave-frequency motion: linearly-excited motion in the wave-frequency
range of significant wave energy. This is the ordinary seakeeping motion
of a vessel. It may be calculated using the first-order motion theory.
• High-frequency motion: motion with period substantially below the wave
period. For ocean-going ships, high frequency springing forces arise
producing a high-frequency structural vibration that is termed whipping
(Bhattacharyya, 1978). For floating production structure, this motion is
significant for TLP which have high axial stiffness of tethers, referred to as

11
“ringing” and “springing” and is due to resonance oscillation in heave,
pitch and roll of the platform. The natural periods of these motion modes
are typically 2-4 seconds which are less than most wave periods. They are
excited by non-linear wave effects, where “ringing” is associated with
transient effect and “springing” is steady-state oscillations.
• Slow-drift motion and mean drift: motion with period in the range of 100-
200 seconds. Slow-drift motion arises from resonance oscillations. For a
moored structure, it occurs in surge, sway and yaw. The restoring force are
due to the mooring system and the mass forces due to the structure. The
slowly-varying response is of equal importance as the linear first-order
motions in design of mooring and riser systems. Wind will also induce
slow-drift and mean motion of marine structures with high natural periods.
This is caused by wind gusts with significant energy at periods of the order
of magnitude of a minute.
Mean offset of the floating vessel is determined at an equilibrium position
under the combined mean forces of waves (mean wave drift), wind and current by
considering the nonlinear restoring forces of the mooring system. Dynamic
motions are established at the equilibrium position of the vessel.
The equation of motions for the vessel in regular waves may be written as: 𝑀�̈� + 𝐶�̇� + 𝐷1�̇� + 𝐷2𝑓(�̇�) + 𝐾(𝑥)𝑥 = 𝑞(𝑡, 𝑥, �̇�) (2.1) M = 𝑚 + 𝐴 𝐴 = 𝐴(𝜔) = 𝐴(∞) + 𝑎(𝜔) 𝐶 = 𝐶(𝜔) = 𝐶(∞) + 𝑐(𝜔) = 𝑐(𝜔)
where:
t = time variable
ω = frequency of incident waves 𝑥, �̇�, �̈� = vectors of displacement, velocity and acceleration
m = body mass matrix
A(ω) = frequency-dependent added mass matrix
C(ω) = frequency-dependent potential damping matrix

12
D1 = linear damping matrix
D2 = quadratic damping matrix
K(x) = position-dependent stiffness matrix 𝑓(�̇�) = vector function where each element is given by �̇�𝑖|�̇�𝑖| 𝑞(𝑡, 𝑥, �̇�) = excitation force vector
The excitation force on the right-hand side of Equation (2.1) includes the
following components: 𝑞(𝑡, 𝑥, �̇�) = 𝑞𝑊𝐼 + 𝑞𝑊𝐴1 + 𝑞𝑊𝐴2 + 𝑞𝐶𝑈 + 𝑞𝑜𝑡ℎ (2.2)
where:
qWI = wind drag force 𝑞𝑊𝐴1 = first order wave excitation force 𝑞𝑊𝐴2 = second order wave excitation force
qCU = current drag force
qoth = other forces including forces from the mooring system
2.2.2 Wind Loads
Wind loading is important for prediction of global motion response of
floaters. Accurate modelling of the wind effects is therefore essential. For some
floating systems, the wind loads can be the dominating the excitation.
Similar with all environmental phenomena, wind has a stochastic nature
which greatly depends on time and location. It is usually characterized by large
fluctuations in velocity and direction. It is common meteorological practice to
give the wind velocity in terms of the average over a certain interval of time,
varying from 1 to 60 minutes or more. Local winds are generally defined in terms
of the average velocity and average direction at a standard height of 10 meters
above the still water level. A number of empirical and theoretical formulas are
available in the literature to determine the wind velocity at other elevations. An
adequate vertical distribution of the true wind speed z meters above sea level is
represented by:

13
𝑉𝑡𝑤(𝑍)𝑉𝑡𝑤(10) = ( 𝑍10)0.11 (2.3)
in which:
Vtw(z) = true wind speed at z meter height above the water surface
Vtw(10) = true wind speed at 10 meters height above the water surface
Equation (2.3) is for sea conditions and results from the fact that the sea is
surprisingly smooth from an aerodynamic point of view - about like a well mowed
soccer field. On land, Equation (2.3) has a different exponent: 𝑉𝑡𝑤(𝑍)𝑉𝑡𝑤(10) = ( 𝑍10)0.16 (2.4)
At sea, the variation in the mean wind velocity is small compared to the
wave period. The fluctuations around the mean wind speed will impose dynamic
forces on an offshore structure, but in general these aerodynamic forces may be
neglected in comparison with the hydrodynamic forces, when considering the
structures dynamic behavior. The wind will be considered as steady, both in
magnitude and direction, resulting in constant forces and a constant moment on a
fixed floating or a sailing body.
Wind loads acting in floating structures plays two roles as below:
a) Direct role, where the wind exerts a force on the part of the structure
exposed to the air. Wind forces are exerted due to the flow of air around
the various parts. Only local winds are needed for the determination of
these forces.
b) Indirect role, where winds generate waves and currents and through these
influence a ship indirectly too. This is a fluctuating component due to wind
gust which mainly excite the low frequency motions in surge, sway and
yaw. The effects of waves and currents on floating bodies will be dealt
with separately in later chapters.
Only the direct influence of the winds will be discussed here. Forces and
moments will be caused by the speed of the wind relative to the (moving) body.
The forces and moments which the wind exerts on a structure can therefore be
computed by:

14
𝑋𝑤 = 12 𝜌𝑎𝑖𝑟𝑉𝑟𝑤2 . 𝐶𝑋𝑤(𝛼𝑟𝑤). 𝐴𝑇 (2.5) 𝑌𝑤 = 12 𝜌𝑎𝑖𝑟𝑉𝑟𝑤2 . 𝐶𝑌𝑤(𝛼𝑟𝑤). 𝐴𝐿 (2.6) 𝑁𝑤 = 12 𝜌𝑎𝑖𝑟𝑉𝑟𝑤2 . 𝐶𝑁𝑤(𝛼𝑟𝑤). 𝐴𝐿. 𝐿 (2.7)
in which:
Xw = steady longitudinal wind force (N)
Yw = steady lateral wind force (N)
Nw = steady horizontal wind moment (Nm) ⍴air ⍴water/800 = density of air (kg/m3)
Vrw = relative wind velocity (m/s)
w = relative wind direction (-), from astern is zero
AT = transverse projected wind area (m2)
AL = lateral projected wind area (m2)
L = length of the ship (m)
C*w(rw) = rw - dependent wind load coefficient (-)
Note that it is a normal convention to refer to the true wind direction as the
direction from which the wind comes. A North-West wind will cause South-East
waves, therefore.
For moored ships, only the true wind speed and direction determine the
longitudinal and lateral forces and the yaw moment on the ship, as given in Figure
2-2. Because of the absence of a steady velocity of the structure, the relative wind
is similar to the true wind: 𝑉𝑟𝑤 = 𝑉𝑡𝑤 and 𝛼𝑟𝑤 = 𝛼𝑡𝑤 (2.8)

15
Figure 2-2 Definitions used for force and moments (Journee & Massie, 2001)
The total force and moment experienced by an object exposed to the wind is
partly of viscous origin (pressure drag) and partly due to potential effects (lift
force). For blunt bodies, the wind force is regarded as independent of the
Reynolds number and proportional to the square of the wind velocity.
The gust wind-loading component is simulated by the wind gust spectrum.
Several wind spectra exist. It should be emphasized that a wind spectrum is
selected that best represents the actual geographical area the floater is located.
Wind spectra are generally described with several parameters making it relatively
easy to make input errors. Checking of wind spectrum energies and shapes is
therefore considered essential. The most commonly used wind spectra are the API
and NPD spectra. In this report, NPD spectrum used for dynamic wind load as per
recommended by API RP 2SK.
Due to its importance, the wind load coefficients are usually determined
based on wind tunnel tests. These tests are very often conducted early in the
design process. In case of significant changes to the deck or topside structures
during detail design, these wind tunnel tests may have to be repeated.
Remery and van Oortmerssen (1973) collected the wind data on 11 various
tanker hulls. Their wind force and moment coefficients were expanded in Fourier
series as a function of the angle of incidence. From the harmonic analysis, it was
found that a fifth order representation of the wind data is sufficiently accurate, at
least for preliminary design purposes:

16
𝐶𝑋𝑤 = 𝑎0 + ∑ 𝑎𝑛sin (𝑛. 𝛼𝑟𝑤)5𝑛=1 (2.9) 𝐶𝑌𝑤 = ∑ 𝑏𝑛sin (𝑛. 𝛼𝑟𝑤)5𝑛=1 (2.10) 𝐶𝑁𝑤 = ∑ 𝑐𝑛sin (𝑛. 𝛼𝑟𝑤)5𝑛=1 (2.11)
with wind coefficients as listed below.
Table 2-1 Wind coefficients for various tanker hull (Journee & Massie, 2001)
Figure 2-3 shows, as an example, the measured wind forces and moment
together with their Fourier approximation, for one of the tankers.
Figure 2-3 Example of wind load coefficients (Journee & Massie, 2001)

17
2.2.3 Current Loads
There are some independent phenomena that cause the occurrence of
current, i.e.: the ocean circulation system resulting in a steady current, the cyclical
change in lunar and solar gravity causing tidal currents, wind and differences in
sea water density. The steady wind velocity at the water surface is about 3 percent
of the wind velocity at 10meter height. Tidal currents are of primary importance
in areas of restricted water depth and can attain values up to 10 knots. However,
such extreme velocities are rare; a 2-3 knots tidal current speed is common in
restricted seas. The prediction of tidal currents is left for the oceanographers.
Although surface currents will be the governing ones for floating structures;
the current distribution as a function of depth below the surface may also be of
importance. For the design of a mooring system of a floating structure, the
designer is especially interested in the probability that a certain extreme current
velocity will be exceeded during a certain period of time. Observations obtained
from current speed measurements are indispensable for this purpose. It may be
useful to split up the total measured current in two or more components, for
instance in a tidal and a non-tidal component, since the direction of the various
components will be different, in general. The variation in velocity and direction of
the current is very slow, and current may therefore be considered as a steady
phenomenon.
The forces and moment exerted by a current on a floating object is
composed of the following parts (Journee & Massie, 2001):
a) A viscous part, due to friction between the structure and the fluid, and due
to pressure drag. For blunt bodies the frictional force may be neglected,
since it is small compared to the viscous pressure drag.
b) A potential part, with a component due to a circulation around the object,
and one from the free water surface wave resistance. In most cases, the
latter component is small in comparison with the first and will be ignored.
The forces and moments, as given in Figure 2-2, exerted by the current on a
floating structure can be calculated from:

18
𝑋𝑐 = 12 𝜌. 𝑉𝑐2. 𝐶𝑋𝑐(𝛼𝑐). 𝐴𝑇𝑆 (2.12) 𝑌𝑐 = 12 𝜌𝑉𝑐2. 𝐶𝑌𝑐(𝛼𝑐). 𝐴𝐿𝑆 (2.13) 𝑁𝑐 = 12 𝜌. 𝑉𝑐2. 𝐶𝑁𝑐(𝛼𝑐). 𝐴𝐿𝑆. 𝐿 (2.14)
in which:
Xc = steady longitudinal current force (N)
Yc = steady lateral current force (N)
Nc = steady horizontal current moment (Nm) ⍴ = density of water (kg/m3)
Vc = relative current velocity (m/s)
c = relative current direction (-), from astern is zero
ATS B.T = transverse projected current area (m2)
ALS L.T = lateral projected current area (m2)
L = length of the ship (m)
B = breadth of the ship (m)
T = draft of the ship (m)
C-C(c) = c - dependent current load coefficient (-)
Remery and van Oortmerssen (1973) published current loads on several
tanker models of different sizes, tested at MARIN. The coefficients CXC, CYC and
CNC were calculated from these results. A tanker hull is a rather slender body for a
flow in the longitudinal direction and consequently the longitudinal force is
mainly frictional. The total longitudinal force was very small for relatively low
current speeds and could not be measured accurately. Moreover, extrapolation to
full scale dimensions is difficult, since the longitudinal force is affected by scale
effects.
For mooring problems, the longitudinal force will hardly be of importance.
An estimate of its magnitude can be made by calculating the flat plate frictional
resistance, according to the ITTC skin friction line as given in equation: 𝐼𝑇𝑇𝐶 − 1957: 𝐶𝑓 = 0.075(𝑙𝑜𝑔10(𝑅𝑛)−2)2 (2.15)
19
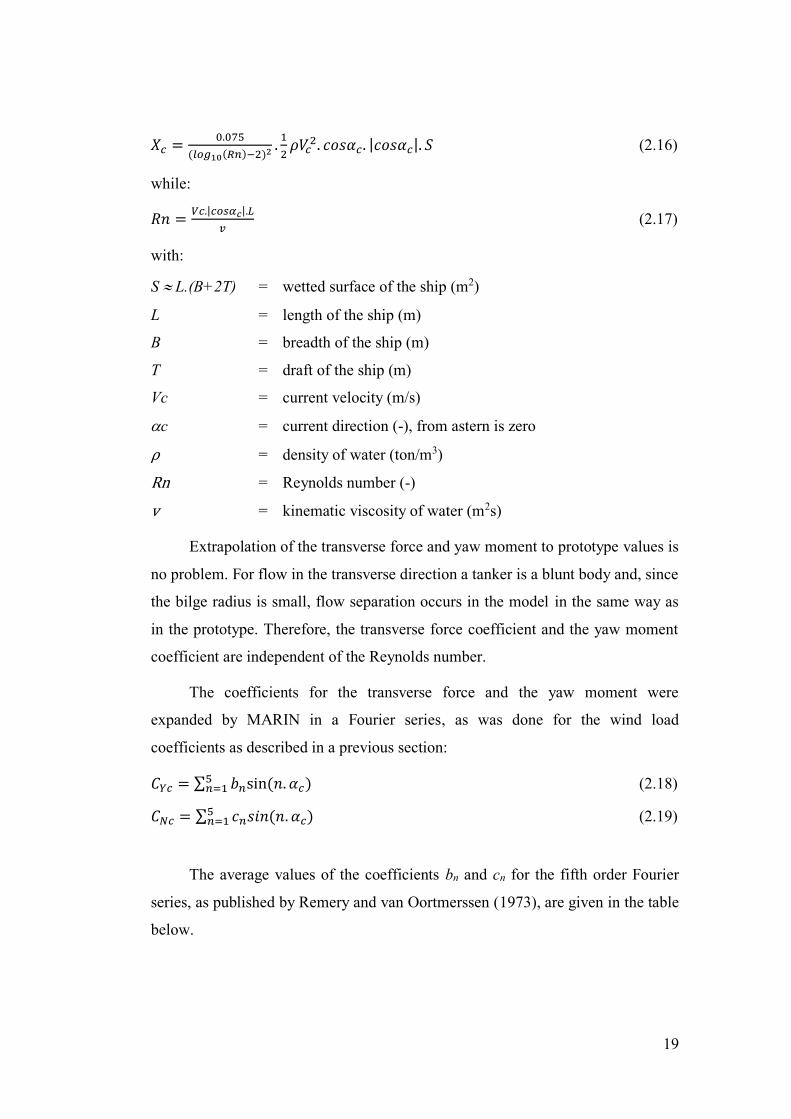
𝑋𝑐 = 0.075(𝑙𝑜𝑔10(𝑅𝑛)−2)2 . 12 𝜌𝑉𝑐2. 𝑐𝑜𝑠𝛼𝑐. |𝑐𝑜𝑠𝛼𝑐|. 𝑆 (2.16)
while: 𝑅𝑛 = 𝑉𝑐.|𝑐𝑜𝑠𝛼𝑐|.𝐿𝑣 (2.17)
with:
S L.(B+2T) = wetted surface of the ship (m2)
L = length of the ship (m)
B = breadth of the ship (m)
T = draft of the ship (m)
Vc = current velocity (m/s)
c = current direction (-), from astern is zero ⍴ = density of water (ton/m3)
Rn = Reynolds number (-)
v = kinematic viscosity of water (m2s)
Extrapolation of the transverse force and yaw moment to prototype values is
no problem. For flow in the transverse direction a tanker is a blunt body and, since
the bilge radius is small, flow separation occurs in the model in the same way as
in the prototype. Therefore, the transverse force coefficient and the yaw moment
coefficient are independent of the Reynolds number.
The coefficients for the transverse force and the yaw moment were
expanded by MARIN in a Fourier series, as was done for the wind load
coefficients as described in a previous section: 𝐶𝑌𝑐 = ∑ 𝑏𝑛sin (𝑛. 𝛼𝑐)5𝑛=1 (2.18) 𝐶𝑁𝑐 = ∑ 𝑐𝑛𝑠𝑖𝑛 (𝑛. 𝛼𝑐)5𝑛=1 (2.19)
The average values of the coefficients bn and cn for the fifth order Fourier
series, as published by Remery and van Oortmerssen (1973), are given in the table
below.

20
Table 2-2 Coefficient bn and cn for current load coefficients (Journee & Massie,
2001)
These results are valid for deep water. For shallow water, the transverse
current force and moment coefficients have to be multiplied by a coefficient,
which is given in Figure 2-4. The influence of the free surface is included in the
data given on the coefficients bn and cn in the previous table. This influence,
however, depends on the water depth and on the Froude number, and
consequently changes if the current velocity or the tanker dimensions’ change. For
the condition to which these data apply, deep water and a prototype current speed
in the order of 3 knots, the effect of the free surface is very small. For the case of a
small clearance under the keel and a current direction of 90 degrees, damming up
of the water at the weather side and a lowering of the water at the lee side of the
ship occurs.
Figure 2-4 Influence of water depth on transverse current load on a tanker
(Journee & Massie, 2001)

21
2.2.4 Wave Loads
Wave loads on floating structures as well as their responses to those loads
can be split into several components. Firstly, there are wave loads which have the
same frequencies as the waves and are linearly proportional in amplitude to the
wave amplitudes. These are known as first order wave forces. Secondly, there are
wave load components which have frequencies both higher and lower than the
frequencies of the waves. These forces are proportional to the square of the wave
amplitudes and known as second order wave forces.
Low frequency second order wave forces have frequencies which
correspond to the frequencies of wave groups present in irregular waves. These
forces, which, beside containing time-varying components, also contain a non-
zero mean component, are known as wave drift forces. This name is a
consequence of the fact that a vessel, floating freely in waves, will tend to drift in
the direction of propagation of the waves under influence of the mean second
order forces (Journee & Massie, 2001). High frequency second order forces
contain frequencies corresponding to double the frequency of the waves (also
known as sum frequencies). The horizontal motions response of moored structures
to these forces is generally small.
As the floating structure are usually had a large volume, hence the inertia
effect will be dominant. This implies that radiation/diffraction analyses need to be
performed with a suitable analysis tool. A linear radiation/diffraction analysis will
usually be sufficiently accurate. The term ‘linear’ means that the velocity potential
is proportional to the wave amplitude, and that the average wetted area of the
floater up to the mean water line is considered. The analysis gives first order
excitation forces, hydrostatics, potential wave damping, added mass, first order
motions in rigid body degrees of freedom and second order mean drift
forces/moments. The mean wave drift forces only dependent on first order
quantities, and can therefore be calculated in a linear analysis.

22
2.2.5 First Order Wave Loads
The most common practice used to analyze the linear steady state response
of large-volume structures in regular waves are Panel methods. It is based on
potential theory, assumed that the oscillation amplitudes of the fluid and the body
are small relative to cross-sectional dimension of the body. The methods can only
predict damping due to radiation of surface waves and added mass, yet they do not
cover viscous effects. In linear analysis of response amplitude operator (RAO),
forces and response are proportional to wave amplitude and response frequency
are primarily at the wave frequency (WF).
The time-averaged value of this wave load and the resulting motion
component are zero. Moored vessel exposed to large first order wave forces,
which are the only contribution to the wave frequency motion for mooring
analysis.
2.2.6 Second Order Wave Forces
Second order wave forces include steady force, a wide range of low
frequency forces (which will excite surge, sway and yaw of a moored floating
system) and high frequency forces (which will excite roll, pitch and heave
springing of a TLP). The most common way to solve non-linear wave-structure
problems is to use perturbation analysis with the wave amplitude as a small
parameter. The non-linear problem is solved in second-order (Faltinsen, 1990).
The effects of second order wave forces are most apparent in the behavior of
anchored or moored floating structures. Low frequency wave forces are normally
an order of magnitude smaller than wave frequency forces, however their effect
could be significant since the low frequencies are close to natural frequencies of
the system. The vessel's natural frequencies in surge, sway and yaw are typically
quite low and so the low frequency wave drift loads can generate large slow drift
excursions in these directions.

23
2.2.6.1 Mean Wave Drift Forces
While the diffraction theory gives the first order force, inclusion of the
second-order term from steeper waves may produce forces that are of the second
order. The time independent portion of this force is called the steady wave drift
force. Therefore, all quantities in the second order are included in the expression
for the steady drift force. the magnitude of steady drift force is expected to be
small. Its magnitude is generally of the order of 5% of the first-order force, which
is often the order of uncertainty in the force computation. Then, why is it
important in a design of an offshore structure? It is generally not that important
for an offshore structure, unless a moored floating structure possesses a soft
mooring stiffness in a certain degree of freedom. Examples of such systems are
the surge and the heave of a catenary moored FPSO or semi, surge of a TLP, etc.
Since the initial stiffness characteristics of such systems are quite low, even a
small steady force induces a large displacement. Thus, under this steady load, the
structure takes on a displaced position. This large displacement may affect its riser
to have a large initial angle. which may be operationally limiting.
2.2.6.2 Slow-Drift Wave Forces
Mean and slowly varying wave drift forces in a random sea has been studied
by Hsu and Blenkarn (1970) also Remery and Hermans (1971) using results of
model tests with a rectangular barge with breadth B. It was moored in irregular
head waves to a fixed point by means of a bow hawser. The wave amplitudes
provide information about the slowly varying wave envelope of an irregular wave
train. The wave envelope is an imaginary curve joining successive wave crests (or
troughs), where the entire water surface motion takes place with the area enclosed
by these two curves.
It seems logical in the light of the earlier results to expect that the square of
the envelope amplitude will provide information about the drift forces in irregular
waves. To do this, one would (in principle) make a spectral analysis of the square
of this wave envelope. In other words, the spectral density of the square of the
wave amplitude provides information about the mean period and the magnitude of

24
the slowly varying wave drift force. In practice, it is very difficult to obtain an
accurate wave envelope spectrum due to the long wave record required. Assuming
about 200-250 oscillations are required for an accurate spectral analysis and that
the mean period of the wave envelope record is about 100 seconds, the total time
that the wave elevation has to be recorded can be up to 7 hours.
Another very simple method is based on individual waves in an irregular
wave train. Assume that the irregular wave train is made up of a sequence of
single waves of which the wave amplitude is characterized by the height of a
wave crest or the depth of a wave trough, ζɑi, while the period, Ti, is determined
by the two adjacent zero crossings.
Figure 2-5 Wave drift force obtained from a wave record (Journee & Massie,
2001)
Each of the so obtained single waves (one for every crest or trough) is
considered to be one out of a regular wave train, which exerts (in this case) a
surge drift force on the barge: 𝐹𝑖 = 12 𝜌𝑔[𝑅(𝜔𝑖). 𝜁𝑎𝑖]2. B (2.20) 𝜔𝑖 = 2𝜋𝑇𝑖 (2.21)
where: 𝑅(𝜔𝑖) = reflection coefficient (=1.0)

25
When this is done for all wave crests and troughs in a wave train, points on
a curve representing a slowly varying wave drift force, F(t), will be obtained. This
drift force consists of a slowly varying force (the low-frequency wave drift force)
around a mean value (the mean wave drift force).
Figure 2-6 Low frequency surge motion of a barge (Journee & Massie, 2001)
2.2.7 Mooring System
Mooring systems are used for anchoring a floating structure to the sea floor
with one of catenary, taut or semi-taut lines. The lines are attached to the floating
structure at different points, where the lower ends of the lines anchored at the
seabed. Mooring lines consist of either steel chain, rope or combination of both.
The ropes itself are available in construction from steel, natural fibre and synthetic
fibre. It is common that each line composed of two or more of different segment
material, e.g. heavy chain at the bottom segment and wire rope at the mid/upper
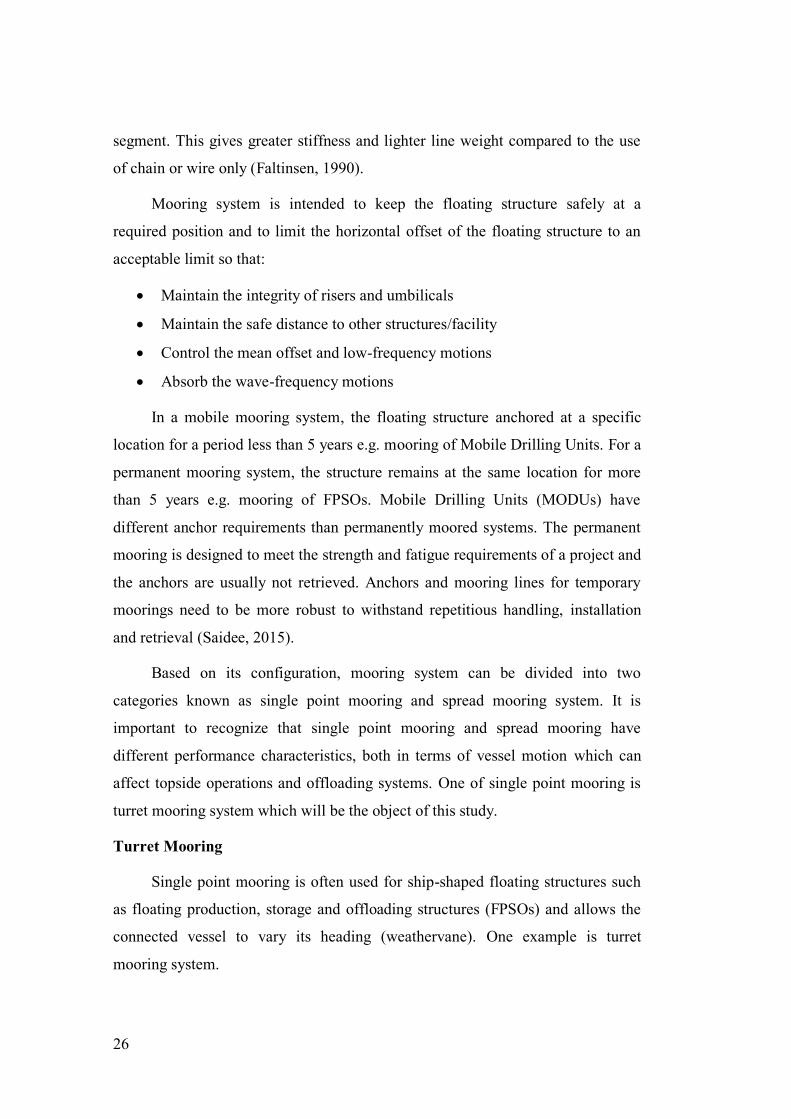
26
segment. This gives greater stiffness and lighter line weight compared to the use
of chain or wire only (Faltinsen, 1990).
Mooring system is intended to keep the floating structure safely at a
required position and to limit the horizontal offset of the floating structure to an
acceptable limit so that:
• Maintain the integrity of risers and umbilicals
• Maintain the safe distance to other structures/facility
• Control the mean offset and low-frequency motions
• Absorb the wave-frequency motions
In a mobile mooring system, the floating structure anchored at a specific
location for a period less than 5 years e.g. mooring of Mobile Drilling Units. For a
permanent mooring system, the structure remains at the same location for more
than 5 years e.g. mooring of FPSOs. Mobile Drilling Units (MODUs) have
different anchor requirements than permanently moored systems. The permanent
mooring is designed to meet the strength and fatigue requirements of a project and
the anchors are usually not retrieved. Anchors and mooring lines for temporary
moorings need to be more robust to withstand repetitious handling, installation
and retrieval (Saidee, 2015).
Based on its configuration, mooring system can be divided into two
categories known as single point mooring and spread mooring system. It is
important to recognize that single point mooring and spread mooring have
different performance characteristics, both in terms of vessel motion which can
affect topside operations and offloading systems. One of single point mooring is
turret mooring system which will be the object of this study.
Turret Mooring
Single point mooring is often used for ship-shaped floating structures such
as floating production, storage and offloading structures (FPSOs) and allows the
connected vessel to vary its heading (weathervane). One example is turret
mooring system.
27
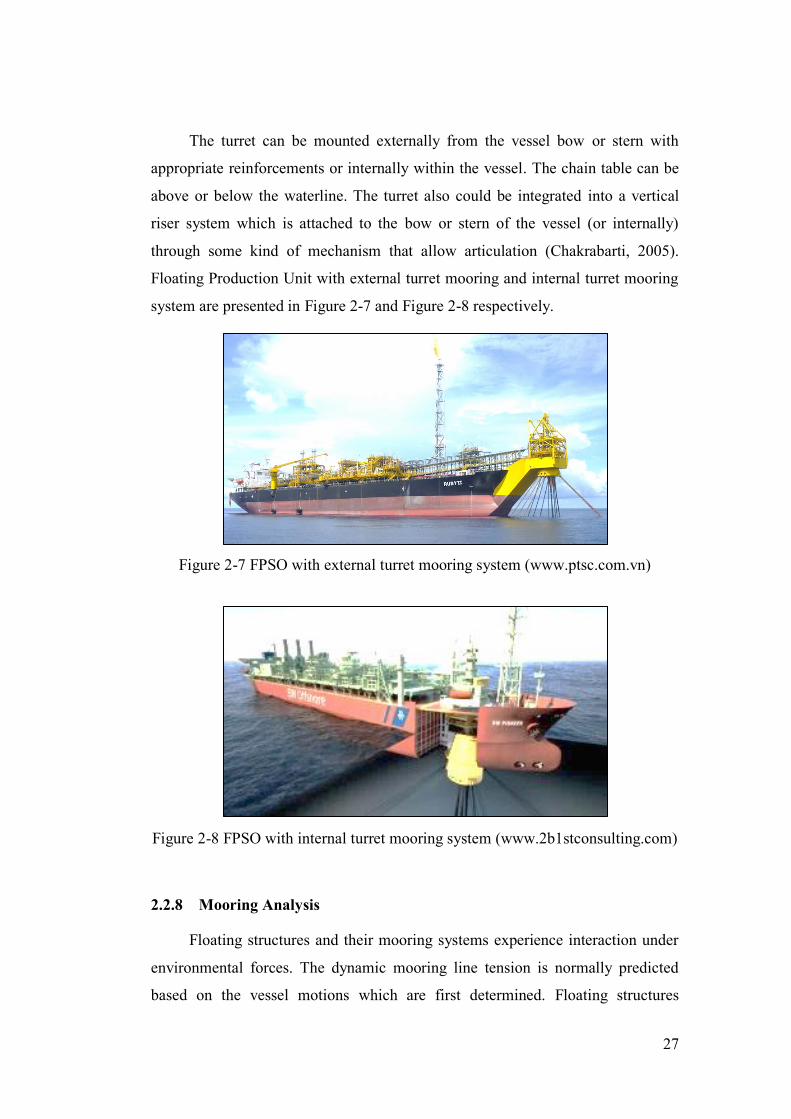
The turret can be mounted externally from the vessel bow or stern with
appropriate reinforcements or internally within the vessel. The chain table can be
above or below the waterline. The turret also could be integrated into a vertical
riser system which is attached to the bow or stern of the vessel (or internally)
through some kind of mechanism that allow articulation (Chakrabarti, 2005).
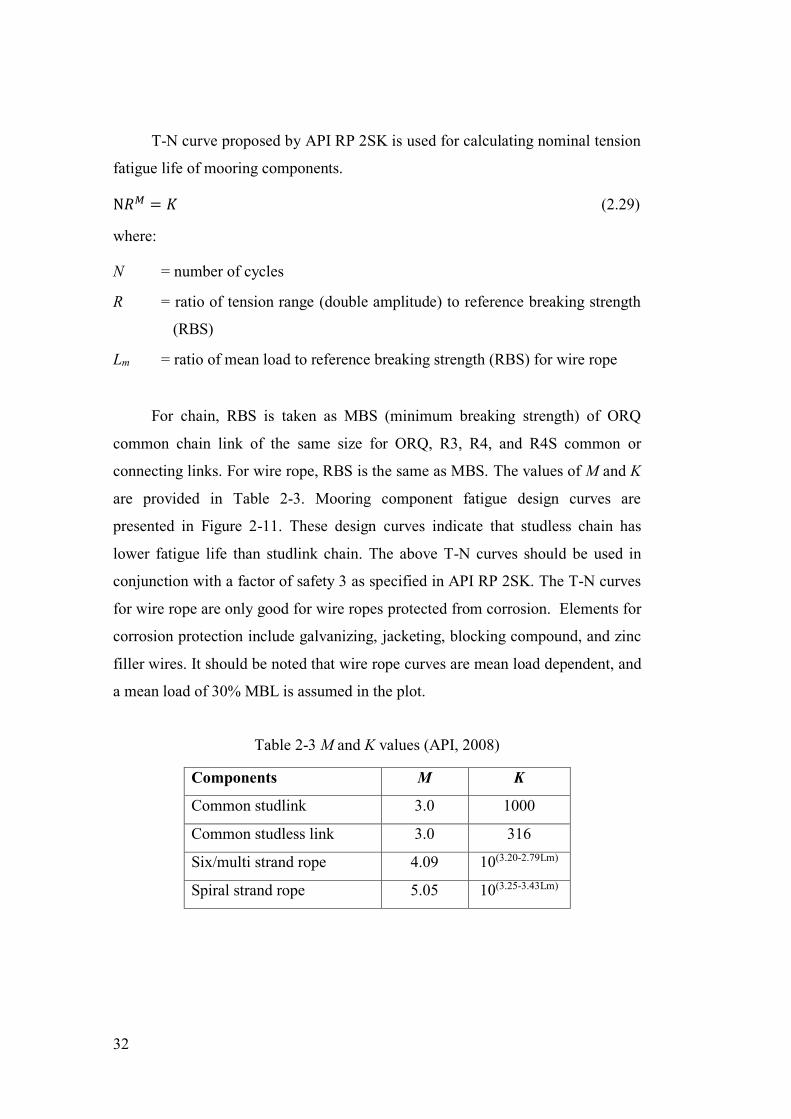
Floating Production Unit with external turret mooring and internal turret mooring
system are presented in Figure 2-7 and Figure 2-8 respectively.
Figure 2-7 FPSO with external turret mooring system (www.ptsc.com.vn)
Figure 2-8 FPSO with internal turret mooring system (www.2b1stconsulting.com)
2.2.8 Mooring Analysis
Floating structures and their mooring systems experience interaction under
environmental forces. The dynamic mooring line tension is normally predicted
based on the vessel motions which are first determined. Floating structures

28
considered herein are ships, semi-submersibles, spars, etc., and they are usually
modelled as rigid bodies in motion analysis.
Vessel motion response in a stationary and short-term sea state can be split
into three components:
• Mean displacement due to mean environmental loads
• Low frequency (LF) motions with natural periods of the moored vessel in
surge, sway and yaw directions due to LF wind loads and second order
wave loads
• Motions at the frequency of incoming waves due to first order wave loads
Mean offset of the floating vessel is determined at an equilibrium position
under the combined mean forces of waves (mean wave drift), wind and current by
considering the nonlinear restoring forces of the mooring system. Dynamic
motions are established at the equilibrium position of the vessel.
Mooring analysis includes both the vessel motion analysis and the analysis
of mooring line tension. Vessel motion responses are caused by steady wave,
wind and current forces, wave frequency (WF) and low frequency (LF) wave
loads as well as LF wind forces. While the LF wave forces are relatively small
compared with the WF forces, the effect on the vessel motions can be significant
due to the resonance of the entire moored structure. Moreover, mooring line
tension is mainly induced by the motions at the fairlead and the contribution of
wave forces directly acting on the lines is relatively small. Thus, the tension
response consists of the mean, WF and LF components similar to the motion
response (Gao, 2008).
Coupled analysis where both the vessel motion and mooring line tension
responses shall be performed by applying either a frequency domain or a time
domain method. It shall be possible to document that the chosen calculation
program is applicable for the particular anchoring system and on the particular
location.
A picture of catenary line is shown in Figure 2-9. Horizontal seabed is
assumed and the bending stiffness effect are neglected. The latter is generally

29
suitable both for chains and wires with a large radius of curvature. Line dynamic
effects also neglected at this stage.
Figure 2-9 Catenary mooring line (Faltinsen, 1990)
An element of catenary line is shown in. The term w is the weight per unit
length of the line in water, A is the cross-sectional area of the mooring line, E is
the elastic modulus and T is the line tension. Forces D and F acting on the element
are the mean hydrodynamic forces per unit length in the normal and tangential
direction respectively (Chakrabarti, 2005).
From Figure 2-10, considering in-line and transverse forcing gives: 𝑑𝑇 − 𝜌𝑔𝐴𝑑𝑧 = [𝑤𝑠𝑖𝑛∅ − 𝐹 ( 𝑇𝐸𝐴)] 𝑑𝑠 (2.22) 𝑇𝑑∅ − 𝜌𝑔𝐴𝑧𝑑∅ = [𝑤𝑐𝑜𝑠∅ + 𝐷(1 + 𝑇𝐸𝐴)] 𝑑𝑠 (2.23)
Ignoring forces F and D together with elasticity allows simplification of the
equations, though it is noted that elastic stretch can be very important and needs to
be considered when lines become tight or for a large suspended line weight (large
10 or deep waters).

30
Figure 2-10 Forces on an element of mooring line (Faltinsen, 1990)
With the above assumptions, we can obtain the suspended line length s and
vertical dimension h as: 𝑠 = (𝑇𝐻𝑤 ) 𝑠𝑖𝑛ℎ (𝑤𝑥𝑇𝐻). (2.24) ℎ = (𝑇𝐻𝑤 ) [𝑐𝑜𝑠ℎ (𝑤𝑥𝑇𝐻) − 1] (2.25)
giving the tension in the line at the top, written in terms of the catenary length s
and depth d as: 𝑇 = 𝑤(𝑠2+𝑑2)2𝑑 (2.26)
The vertical component of line tension at the top end becomes: 𝑇𝑧 = 𝑤𝑠 (2.27)
while the horizontal component of tension is constant along the line and is given
by: 𝑇𝐻 = 𝑇𝑐𝑜𝑠∅𝑤 (2.28)
above analysis assumes that the line is horizontal at the lower end replicating the
case where a gravity anchor with no uplift is used.
Typical mooring analysis requires summation of the effects of up to 16 or
more lines with the surface vessel position co-ordinates near the water plane

31
introducing three further variables. The complexity of this calculation makes it
suitable for implementing within computer software.
For mooring lines laying partially on the seabed, the analysis is modified
using an iteration procedure, so that additional increments of line are
progressively laid on the seabed until the suspended line is in equilibrium.
Furthermore, in many situations, multi-element lines made up of varying lengths
and physical properties are used to increase the line restoring force. Such lines
may be analyzed in a similar manner, where the analysis is performed on each line
element, and the imbalance in force at the connection points between elements is
used to establish displacements through which these points must be moved to
obtain equilibrium (Chakrabarti, 2005).
2.2.9 Fatigue Damage Assessment
As described previously, fatigue is cumulative damage on structure caused
by cyclic loading. The content in this section are mostly taken from API RP 2SK.
Generally, the load amplitude of each cycle is not large enough to cause the
structural failure by itself. However, failure could occur when the accumulated
damage experienced by the structure reaches a critical level. In high cycle fatigue
problem of offshore structures, one often employs S-N curve and linear Palmgren-
Miner law for the fatigue life prediction. The S-N curves are obtained through
multiple fatigue tests executed at different stress levels, where considerable
statistical scatter in the fatigue life will be observed. The deviation of fatigue life
despite similarity in test specimen and loading conditions is due to sample-to-
sample material differences, microscopic defects, surface roughness as well as
human errors such as specimen alignment.
Fatigue life estimates are made by comparing the long-term cyclic loading
in a mooring line component with the resistance of that component to fatigue
damage. For mooring systems, a T-N approach is normally used. This approach
uses a T-N curve, which gives the number of cycles to failure for a specific
mooring component as a function of constant normalized tension range.
32
T-N curve proposed by API RP 2SK is used for calculating nominal tension
fatigue life of mooring components. N𝑅𝑀 = 𝐾 (2.29)
where:
N = number of cycles
R = ratio of tension range (double amplitude) to reference breaking strength
(RBS)
Lm = ratio of mean load to reference breaking strength (RBS) for wire rope
For chain, RBS is taken as MBS (minimum breaking strength) of ORQ
common chain link of the same size for ORQ, R3, R4, and R4S common or
connecting links. For wire rope, RBS is the same as MBS. The values of M and K
are provided in Table 2-3. Mooring component fatigue design curves are
presented in Figure 2-11. These design curves indicate that studless chain has
lower fatigue life than studlink chain. The above T-N curves should be used in
conjunction with a factor of safety 3 as specified in API RP 2SK. The T-N curves
for wire rope are only good for wire ropes protected from corrosion. Elements for
corrosion protection include galvanizing, jacketing, blocking compound, and zinc
filler wires. It should be noted that wire rope curves are mean load dependent, and
a mean load of 30% MBL is assumed in the plot.
Table 2-3 M and K values (API, 2008)
Components M K
Common studlink 3.0 1000
Common studless link 3.0 316
Six/multi strand rope 4.09 10(3.20-2.79Lm)
Spiral strand rope 5.05 10(3.25-3.43Lm)

33
Figure 2-11 Mooring fatigue design curves (API, 2008)
In practical matters, cyclic loading of mechanical components is normally
highly irregular, i.e. variable amplitude load conditions. To estimate the fatigue
life of components undergoing such load histories the vastly used Palmgren–
Miner rule is introduced here. The miner’s rule is used to calculate the annual
cumulative fatigue damage ratio D. The annual fatigue damage, accumulated in a
mooring line component as a result of cyclic loading, is summed up from the
fatigue damage arising in a set of environmental states chosen to discretize the
long-term environment that the mooring system is subjected to: 𝐷 = ∑ 𝐷𝑖𝑖=𝑛𝑖=1 (2.30)
where:
Di = annual fatigue damage to the component due to environmental state i
The discretization into i = 1,…,n environmental states should be sufficiently
detailed to avoid any significant error in the total. Each environmental state is
defined in terms of the wind, wave, and current parameters and directions required
to compute mooring system responses. The probability of occurrence, Pi, is

34
required for each environmental state. Then, the calculated fatigue life of the
mooring system is: 𝐿 = 1𝐷 (𝑦𝑒𝑎𝑟𝑠) (2.31)
The annual fatigue damage accumulated in an individual state may be
computed as: 𝐷𝑖 = 𝑛𝑖𝐾 𝐸[𝑅𝑖𝑀] (2.32)
where:
M and K are defined in Table 2-3.
ni = the number of tension cycles encountered in state i per year. 𝐸[𝑅𝑖𝑀] = the expected value of the normalized tension range Ri raised to the
power M, in state i
In principle, fatigue failure occurs when the total damage D is larger or
equals to 1, this means that 100% of the life is exhausted.
2.2.10 Rainflow counting
Fatigue life of a component can be obtained by using the adjusted stress
amplitude of the component in respect to stress concentration factors of a notched
member from an S-N curve of the selected material. Usually, the extraction of
data points used in regression analysis of forming an S-N curve involves a scheme
named constant amplitude stressing. In constant amplitude testing, the specimen
goes through cycling between constant maximum and minimum stress levels. The
difference of maximum and minimum stresses is the stress range and half this
magnitude is called stress amplitude. The random stress variations of real world
practices are recorded and presented in the same manner. To utilize the available
S-N curves one should be able to identify the stress range and mean of individual
cycles. This can be managed by rainflow counting methods. When facing highly
irregular load histories with time the order in which how individual events should
be considered as a cycle or otherwise is not clear so that the Palmgren-Miner rule
can be employed (Yarveisy, 2015).

35
The stress cycles are counted from the local maxima (peaks) and minima
(troughs) of the stress history by some cycle counting method. The simplest
counting method is the so-called min-Max (Max-min) counting method, where the
local maximum is paired with the preceding local minimum. The stress cycles in
this method only consider the effect of local stresses, but ignore the global effect
including large cycles. Therefore, this method is not capable of estimating the risk
of fatigue failure, since it gives non-conservative (too small) fatigue damages.
The most frequently used rainflow counting method is developed on the
hysteretic properties of material, where the cyclic stress-strain curves form
hysteretic loops. The local maxima are represented by tops of the loops, while
local minima by bottoms of the loops. The rainflow method is to identify the local
minimum which should be paired with a local maximum to form a hysteretic loop.
It is considered to give the most accurate fatigue life predictions.
Figure 2-12 Stress time history. Left: Constant amplitude stressing. Right:
Random stress time history (Yarveisy, 2015)
Rainflow cycle counting method was first proposed by Matsuishi and Endo
(1968). Rainflow counting method is described in the following text. The rainflow
counting method, is visualized by flow of falling rain on pagoda roofs. To
implement this method let’s assume that a stress time history is rotated so that the
earliest time is on top. Such stress time history is shown in Figure 2-13. If rain
drops on a pagoda roof it will flow downwards, following the rules mentioned
below (Gao, 2008):

36
• Each rainflow begins at the beginning of the time series and successively
at the inside of every peak and valley.
• Rainflow initiating at a peak (or a valley) drops down until it reaches
opposite a peak more positive (or a valley more negative) than the peak (or
the valley) it started from.
• Rainflow also stops when it meets the rainflow from a roof above.
• Rainflow must terminate at the end of the time series.
• The horizontal length of each rainflow is counted as a half cycle with that
stress range.
Figure 2-13 Rainflow cycle counting scheme (Gao, 2008)
The implementation methodology mentioned in rainflow counting algorithm
of stress cycles is presented in Figure 2-13, where the flow starts at every peak
and trough. As can be seen on Figure 2-13, the first rainflow starts from the
beginning at 1 as a valley, the second one from the peak 2, the third one from the

37
valley 3, and so on. The end at 10 is considered as a peak herein. There are totally
9 half cycles can be extracted from this time series.
The rainflow initiating at the valley 1 drops down at 2 and ends at 4 because
the following valley 5 has smaller value than the initial point 1. Therefore, a half
cycle of 1-2-4 has been identified. The same rule can be applied to determine the
half cycle of 5-6. The second rainflow starts from 2 and stops at 3, which leads to
a half cycle of 2-3, because the following peak 4 has larger value than 2.
Similarly, the half cycles of 4-5-7 and 8-9 can be extracted based on the same rule
due to the largest peak at 10.
The half cycles of 3-2’, 6-5’ and 9-8’ are determined because the rainflows
started at 3, 6 and 9, respectively, meet the rainflows from roofs above. The half
cycle of 7-8-10 is formed because the time series ends at 10. When all of the 9
half cycles have been identified, the horizontal length of each cycle is used as an
effective stress range to calculate the fatigue damage based on e.g. the linear
damage accumulation law.
Various formats of the rainflow counting method are standardized and
published in ASTM (2005). The rainflow counting method used in this thesis is a
mathematical definition of rainflow counting. This more suitable approach to
statistical analysis of rainflow ranges is introduced by Rychlik (1987).

38

39
3. METHODOLOGY
3.1 Research Method
Methodology applied for this research is shown in the following flowchart.
Figure 3-1 Analysis Methodology
Redesign floater
model (check the lines
plan & coordinates)
B
Model
check/validation
Start
Literature Study
(Text book, Journal, Thesis, Code/Standards)
Data Collection
(Floater, Mooring, Environment, etc.)
Floater Modeling
No
Yes
Hydrodynamic analysis
Output: Motion RAO, Load RAO,
Mean wave drift force QTF,
Added mass & damping
Floater + Mooring Line
modeling using OrcaFlex
A

40
Figure 3-1 Analysis Methodology (Continued)
The details from above diagram explained in the following step:
a) Literature Study and Collecting Data
Study literature intended to obtain any information based on previous
research, project, text books, etc. Information related to the effect of several
parameters on mooring tension and fatigue damage of mooring lines are
collected as references on this thesis. Collecting data covers floating
No error
Simulation:
Error/No error
A
Input parameter study:
variation on pretension,
water depth, wave load type
Static & dynamic analysis
Time domain simulation
using OrcaFlex
Fatigue analysis
mooring line
Results, Discussion
and Conclusion
Finish
Error
Check/redesign
floater, mooring line,
environmental input
B

41
structure data (e.g. dimension, hydrostatic, etc.), mooring lines data (e.g.
mooring configuration, mooring components), environment data (e.g. wave,
wind, current, scatter data).
b) Floating Structure Modelling
Numerical model of floating structure generated as markers (x, y and z-
coordinate) to obtain surface/hull model using MOSES software. Only
floater (FLNG) will be modelled here, mooring system will be modelled on
the later step.
c) Model Check (Validation)
Once the floater model has been generated, it’s shall be validated with
existing/actual data, to ensure whether the model could be used for further
analysis. Components of the model that will be checked against existing data
are:
• Displacement
• Longitudinal Centre of Buoyancy (LCB)
• Vertical Centre of Buoyancy (VCB)
• Longitudinal Centre of Floatation (LCF)
• Keel to Metacentre Transversal (KMt)
• Keel to Metacentre Longitudinal (KMl)
d) Hydrodynamic analysis
Once the model satisfies the validation, a hydrodynamic analysis performed
using frequency domain approach for all degree of freedom (6 DOF). This
analysis intended to obtain hydrodynamic components such as: Motion
Response Amplitude Operator (RAO), load RAO, added mass, damping,
and wave drift force.
e) Floater and Mooring System Design
The next step is modelling floater and mooring systems in OrcaFlex
software. Hydrodynamic characteristics resulted from frequency domain
analysis were used as an input in OrcaFlex, including:
• Structure geometry

42
• Displacement structure
• Displacement RAO
• 1st order wave load (panel wave frequency load)
• Added mass and damping matrix
• Non-dimensional Quadratic Transfer Function as a transfer function of
2nd order wave load.
• Current forces
• Wind forces
Then, turret mooring system configuration and lines components were
defined as per existing data. Mooring system configuration attached at the
external turret are shown in Figure 3-2.
Figure 3-2 Mooring system configuration
f) Parameter Study
Several parameter studies that will be investigated are the influence of
pretension, water depth and wave load type to fatigue life of mooring lines.
• Mooring pretension: mooring line pretension will be set to 14% MBL and
22% MBL, then will be compared to 18% MBL (Base case).

43
• Water depth: different value of water depth will be analyzed to
investigate its effect. Water depth of 301m (50%WD) and 903m
(150%WD) will be compared with actual water depth 602m (Base case).
• Wave Load type: To find out the effect of wave load, three cases were
studied. Firstly is 1st order wave load only, secondly is 2nd order wave
only, and combination of both, 1st order + 2nd order (Base case).
The mooring system configuration for various case studies are summarized
in Table 3-1. There are total seven case studies in this research.
Table 3-1 Mooring system configuration for various case study
Description Case study
1 2 3 4 5 6 7
Notes Base case Pretension
14%MBL
Pretension
22%MBL
50%
water
depth
150%
water
depth
1st order
wave
load
2nd order
wave
load
Pretension 18% MBL
3385 kN
2600 kN 4040 kN 3385 kN 3385 kN 3385 kN 3385 kN
Water depth 602 m 602 m 602 m 301 m 903 m 602 m 602 m
Wave load
type
1st & 2nd
order
1st & 2nd
order
1st &2nd
order
1st & 2nd
order
1st & 2nd
order
1st order
load
2nd order
load
Top chain 100.0 m 123.8 m 86.6 m 50.0 m 150.0 m 100.0 m 100.0 m
Wire rope 725.0 m 725.0 m 725.0 m 362.5 m 1087.5 m 725.0 m 725.0 m
Bottom chain 458.0 m 458.0 m 458.0 m 229.0 m 687.0 m 458.0 m 458.0 m
g) Static and Dynamic Analysis
Static analysis was performed to compute equilibrium position of moored
structure. Then, dynamic analysis using time domain coupled approach was
performed. This analysis intended to obtain moored structure offset and
mooring lines forces. Dynamic coupled analysis performed for each
parameter study. Each parameter study consists of several dynamic
simulations (load case) depends on environmental scatter data.
h) Fatigue Analysis
Tension lines results from dynamic analysis will be proceed to obtain fatigue
damage on the mooring lines. Fatigue damage calculated using Rainflow
method. It uses a cycle counting technique to break down each random wave

44
case into a series of half-cycles, and then sums the damage from each half-
cycle according to Palmgren-Miner rule. This gives damage value for that
load case. Total load case damage values are then summed for each load
case to give the overall total damage. The T-N curve will also require to
define m and K parameter as per API-RP-2SK.
3.2 Research Data
3.2.1 Vessel Data
Barge shaped FLNG, permanently moored with an external turret system
was selected for this study. Main particular of the vessel are provided in Table
3-2.
Table 3-2 Vessel Particular
Vessel particular Unit Value
Loa m 430
Lpp m 381.4
Breadth m 64
Depth m 38
Displacement ton 371020
Draft (even keel) - operating m 15.5
VCG m 24.36
VCB m 7.91
LCB m 191.4
LCF m 191.581
KMt m 30.7
KMl m 814.7
Kxx m 25.27
Kyy m 105.86
Kzz m 105.58

45
Vessel general arrangement presenting starboard side elevation view and
deck plan view are provided in Figure 3-3. More detail picture is attached in
Appendix F.
Figure 3-3 FLNG General Arrangement
3.2.2 Environmental Data
Fatigue wave scatter data were adopted from Bangka field located in
offshore East Kalimantan, Indonesia. Wave occurrence on the scatter data
identified by four variables, i.e. significant wave height (Hs), peak period (Tp),
wind speed and wave direction. Wave and swell scatter data are presented in
Table 3-3.
Table 3-3 Field Scatter Data
All year Wind
(m/s)
Sea wave direction All
Sea Hs (m) Tp (s) N NE E SE S SW W NW
0.15 3.05 4.29 0.19 0.60 0.41 0.34 0.33 0.38 0.22 0.07 2.54
0.15-0.30 3.35 6.06 1.55 5.27 3.83 3.47 4.61 5.60 2.02 0.9 27.25
0.30-0.45 3.73 7.42 2.04 5.19 2.72 1.68 3.21 4.38 0.97 0.57 20.76
0.45-0.60 3.93 8.57 2.23 4.28 1.96 0.70 1.68 2.44 0.40 0.35 14.04
0.60-0.75 4.24 9.58 2.36 4.17 1.69 0.29 0.53 0.79 0.18 0.14 10.15
0.75-0.90 4.58 10.50 2.15 3.47 1.35 0.11 0.13 0.19 0.08 0.06 7.54

46
Table 3-3 Field Scatter Data (Continued)
All year Wind
(m/s)
Sea wave direction All
Sea Hs (m) Tp (s) N NE E SE S SW W NW
0.90-1.05 4.77 11.34 1.96 2.90 1.19 0.05 0.02 0.02 0.03 0.02 6.19
1.05-1.20 4.90 12.12 0.98 1.39 0.59 0.01 0.00 0.00 0.01 0.00 2.98
1.20-1.35 5.38 12.86 0.62 0.84 0.38 0.01 0.00 0.00 0.00 0.00 1.85
1.35-1.50 5.56 13.55 0.13 0.18 0.08 0.00 0.00 0.00 0.00 0.00 0.39
1.50-1.65 6.05 14.22 0.05 0.06 0.03 0.01 0.01 0.01 0.00 0.00 0.17
1.65-1.80 6.35 14.85 0.02 0.04 0.01 0.00 0.00 0.00 0.00 0.00 0.07
1.80-1.95 0.00 0.00 0.00 0.00 0.00 0.00 0.00 0.00 0.00
1.95 0.00 0.00 0.00 0.00 0.00 0.00 0.00 0.00 0.00
Subtotal 14.28 28.39 14.24 6.67 10.52 13.81 3.91 2.11 93.93
All year Wind
(m/s)
Sea wave direction All
Sea Hs (m) Tp (s) N NE E SE S SW W NW
0.15 9.67 0.00 0.00 1.70 0.00 0.00 0.00 0.00 0.00 0.00 1.70
0.15-0.30 9.74 0.00 0.00 2.17 0.00 0.00 0.00 0.00 0.00 0.00 2.17
0.30-0.45 9.50 0.00 0.00 0.05 0.00 0.00 0.00 0.00 0.00 0.00 0.05
0.15 11.64 0.00 0.00 0.15 0.00 0.00 0.00 0.00 0.00 0.00 0.15
0.15-0.30 12.02 0.00 0.00 1.76 0.00 0.00 0.00 0.00 0.00 0.00 1.76
0.30-0.45 12.22 0.00 0.00 0.25 0.00 0.00 0.00 0.00 0.00 0.00 0.25
Total 100.00
As can be seen on Table 3-3, each Hs, Tp and wave direction will represent
one load case. The probability of occurrence of these conditions also be specified.
Based on wave and swell scatter data above, the total number of load cases for
fatigue analysis is 83 cases. In general, 8 to 12 reference directions provide a good
representation of the directional distribution of a long-term environment. The
required number of reference sea states should be in the range of 10 to 50
(DNVGL-OS-E301, 2015). Hence, the scatter data above has complied with
DNVGL standard for mooring fatigue damage prediction.
Current data presented in Table 3-4 showing current speed at different
depth. Current speed is measured at sea surface and modelled as Power Law
method current profiles and assumed same in magnitude for all direction.

47
Table 3-4 Current speed
Depth (m) Current speed (m/s)
0 0.680
50 0.672
300 0.616
602 0.006
3.2.3 Mooring Line Data
The external turret mooring system is used for station-keeping of the vessel.
The mooring system which consist of 12 mooring lines in 3 groups of 4 lines is
located in front of FP. The angle between the groups is 120deg, while the angle
between mooring lines in each group is 3deg. Mooring leg general arrangement
and chain table arrangement are presented in Figure 3-4 and Figure 3-5
respectively.
The mooring line are made of chain-wire-chain configuration. The top chain
and bottom chain are made of 157mm grade R4 studless and 170mm grade R3
studless chain respectively. The steel wire rope is made of 131mm (steel section)
spiral strand sheathed wire. The sheathing adds protection to the outer layer
strands.
Table 3-5 Mooring line properties
Top Chain Steel Wire Bottom chain
Type Studless R4 Spiral strand –
sheathed
Studless R3
Diameter (mm) 157 131 170
MBL (kN) 21234 18300 19692
Axial Stiffness-EA (kN) 1419594 1552000 1487895
Weight (ton/m) 0.487 0.0708 0.495

48
Table 3-6 Mooring line length
Mooring
Group
Mooring
Line
Top chain
(m)
Steel Wire
(m)
Bottom chain
(m)
Anchor
radius (m)
G1
1 100.0 725.0 458.0 1057.2
2 100.0 725.0 458.0 1057.2
3 100.0 725.0 458.0 1057.2
4 100.0 725.0 458.0 1057.2
G2
5 100.0 725.0 458.0 1057.2
6 100.0 725.0 458.0 1057.2
7 100.0 725.0 458.0 1057.2
8 100.0 725.0 458.0 1057.2
G3
9 100.0 725.0 458.0 1057.2
10 100.0 725.0 458.0 1057.2
11 100.0 725.0 458.0 1057.2
12 100.0 725.0 458.0 1057.2

49
Figure 3-4 Mooring legs general arrangement (JTM, 2014)

50
Figure 3-5 Chain table plan view (JTM, 2014)
3.2.4 Corrosion Allowance
Floating unit equipped with mooring lines which are positioned at the same
location for 5 years or more required to carry out fatigue damage calculation.
Corrosion allowance for chain, including wear and tear of chain need to be
included in the calculation. A strength reduction equal to 0.4mm/year corrosion
and wear over 30 years is considered in design of chain sections. It is assumed
that no corrosion allowance applied for steel wire section due to the corrosion
protection (sheathed). It shall be noted that in fatigue analysis, 50% of the chain’s
corrosion allowance shall be taken into account (DNVGL-OS-E301, 2015).
Table 3-7 presents corrosion allowance referred to mooring line diameter
considering 30 years of service life.

51
Table 3-7 Corrosion allowance
Line Segment ∅initial
(mm)
MBL
(kN)
Corrosion
Allowance per
year (mm)
∅corroded
(mm)
MBL corroded
(kN)
Top chain 157 21234 0.4 151 18496
Steel wire 131 18300 - 131 18300
Bottom chain 170 19592 0.4 164 17317
3.3 Numerical Model
3.3.1 Vessel Model
Numerical model of floating unit completed in two different software.
Firstly, a 3-D diffraction software MOSES is used to generate panel model of the
vessel. Hydrostatic and hydrodynamic properties of the vessel also computed in
this frequency domain based software. Secondly, floating unit and its mooring
system modelled using software OrcaFlex, which will be discussed in later
section. Results of vessel panel model from MOSES presented in Figure 3-6 to
Figure 3-8.
Figure 3-6 Vessel panel model in MOSES: Starboard view
Figure 3-7 Vessel panel model in MOSES: Top view

52
Figure 3-8 Vessel panel model in MOSES: Front view
Generated vessel model need to be validated against actual data. It is
important that the model has high level of accuracy to assess the feasibility of the
model for further analysis. The acceptable tolerances for hull form dependent
refer to ABS MODU, 2012 (See Table 3-8).
Table 3-8 Acceptable tolerances for hull form dependent (ABS MODU, 2012)
Hull form Dependent Acceptable tolerance
Displacement 2%
Longitudinal centre of buoyancy (LCB) 1% / 50cm max
Vertical centre of buoyancy (VCB) 1% / 5cm max
Transverse centre of buoyancy (TCB) 0.5% of B/5cm max
Longitudinal centre of floatation (LCF) 1% / 50cm max
Transverse metacentric height (KMt) 1% / 5cm max
Longitudinal metacentric height (KMl) 1% / 50cm max
Table 3-9 shows the comparison results between numerical model and
available hydrostatic data. The results show that deviations are within acceptable
tolerances, therefore the model is acceptable for further analysis.
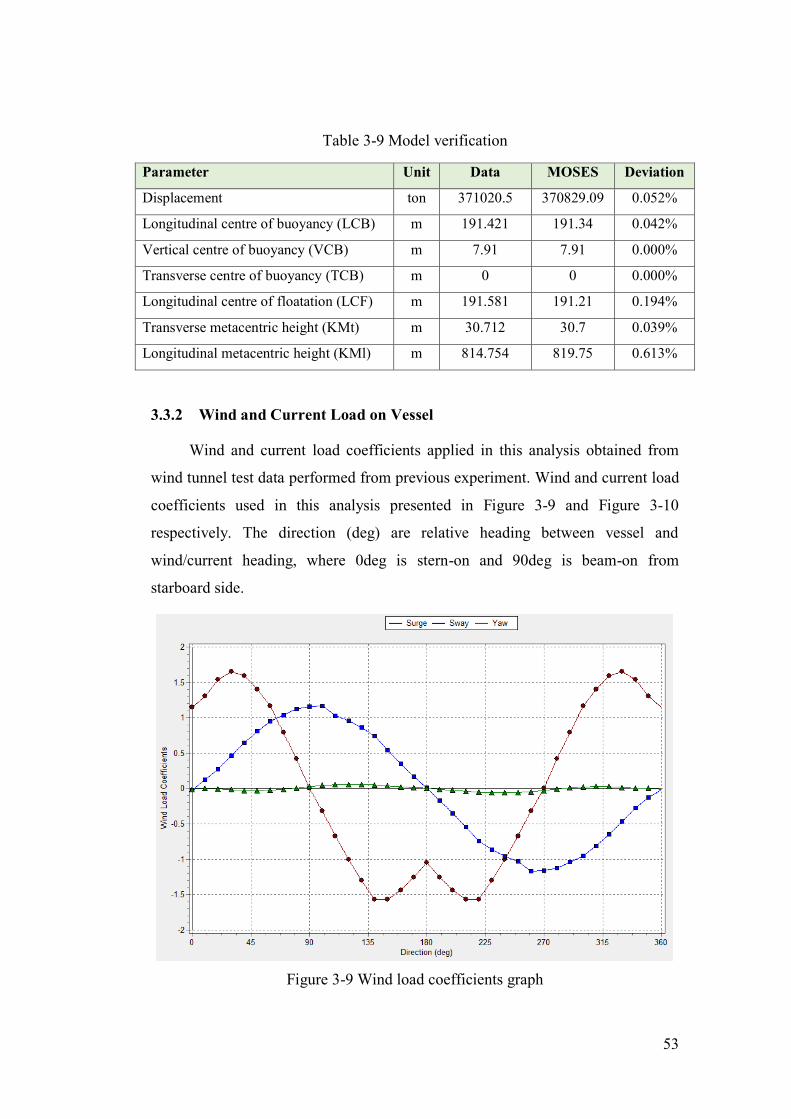
53
Table 3-9 Model verification
Parameter Unit Data MOSES Deviation
Displacement ton 371020.5 370829.09 0.052%
Longitudinal centre of buoyancy (LCB) m 191.421 191.34 0.042%
Vertical centre of buoyancy (VCB) m 7.91 7.91 0.000%
Transverse centre of buoyancy (TCB) m 0 0 0.000%
Longitudinal centre of floatation (LCF) m 191.581 191.21 0.194%
Transverse metacentric height (KMt) m 30.712 30.7 0.039%
Longitudinal metacentric height (KMl) m 814.754 819.75 0.613%
3.3.2 Wind and Current Load on Vessel
Wind and current load coefficients applied in this analysis obtained from
wind tunnel test data performed from previous experiment. Wind and current load
coefficients used in this analysis presented in Figure 3-9 and Figure 3-10
respectively. The direction (deg) are relative heading between vessel and
wind/current heading, where 0deg is stern-on and 90deg is beam-on from
starboard side.
Figure 3-9 Wind load coefficients graph

54
Figure 3-10 Current load coefficients graph
Corresponding value for wind and current coefficient graph above can be
found in Table 3-10 and Table 3-11 respectively.
Table 3-10 Wind load coefficients
Direction Surge Sway Yaw
0 1.149 -0.019 -0.011
20 1.539 0.276 -0.004
40 1.594 0.648 -0.027
60 1.165 0.954 -0.023
80 0.425 1.126 0.005
100 -0.320 1.169 0.044
120 -1.000 0.958 0.060
140 -1.564 0.743 0.052
160 -1.438 0.349 0.024
180 -1.049 0.009 0.007
200 -1.438 -0.349 -0.024
220 -1.564 -0.743 -0.052
240 -1.000 -0.958 -0.060
260 -0.320 -1.169 -0.044
280 0.425 -1.126 0.005
300 1.165 -0.954 0.023
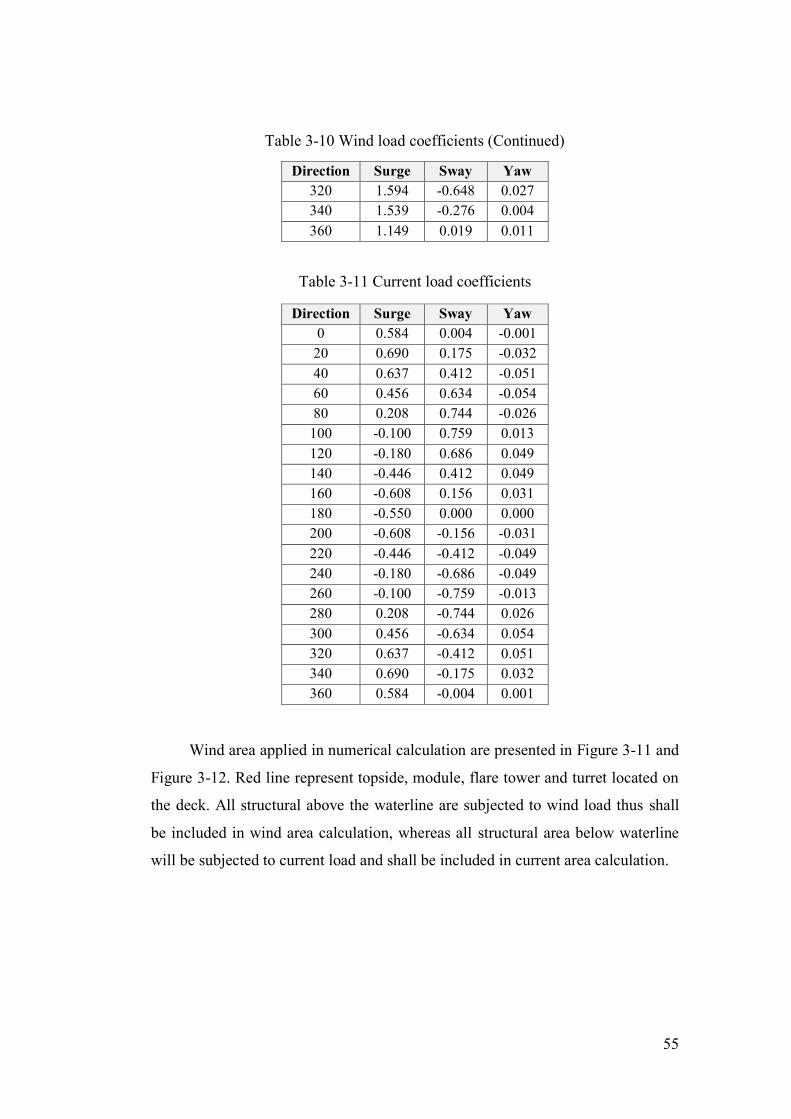
55
Table 3-10 Wind load coefficients (Continued)
Direction Surge Sway Yaw
320 1.594 -0.648 0.027
340 1.539 -0.276 0.004
360 1.149 0.019 0.011
Table 3-11 Current load coefficients
Direction Surge Sway Yaw
0 0.584 0.004 -0.001
20 0.690 0.175 -0.032
40 0.637 0.412 -0.051
60 0.456 0.634 -0.054
80 0.208 0.744 -0.026
100 -0.100 0.759 0.013
120 -0.180 0.686 0.049
140 -0.446 0.412 0.049
160 -0.608 0.156 0.031
180 -0.550 0.000 0.000
200 -0.608 -0.156 -0.031
220 -0.446 -0.412 -0.049
240 -0.180 -0.686 -0.049
260 -0.100 -0.759 -0.013
280 0.208 -0.744 0.026
300 0.456 -0.634 0.054
320 0.637 -0.412 0.051
340 0.690 -0.175 0.032
360 0.584 -0.004 0.001
Wind area applied in numerical calculation are presented in Figure 3-11 and
Figure 3-12. Red line represent topside, module, flare tower and turret located on
the deck. All structural above the waterline are subjected to wind load thus shall
be included in wind area calculation, whereas all structural area below waterline
will be subjected to current load and shall be included in current area calculation.

56
Figure 3-11 Wind area – lateral
Figure 3-12 Wind area – longitudinal
Based on calculation, total lateral and longitudinal windage area is 27548.43
m2 and 6697.02 m2 respectively. Details of windage area calculation are attached
in Appendix C.
3.3.3 Mooring System Design
Hydrodynamic properties resulted from MOSES frequency domain
simulation (see Section 3.1) is used as vessel data input during vessel and mooring

57
system modelling in OrcaFlex. It is a global static and dynamic analysis program
for modelling the behavior of wide variety of marine and offshore systems,
typically including boundary condition such as vessels, buoys, as well as finite
element modelling of line structures. Time domain dynamic analysis performed to
simulate moored vessel under environmental load case. The main purpose of the
dynamic analysis is to obtain mooring line tension for various environmental load
case. The sign convention utilized for the analysis of motion and loads in earth
fixed and vessel fixed local coordinate system are defined below and shown in
Figure 3-13.
1) Earth-fixed coordinate system (EFCS):
• The global X axis is coincident with the geographical North.
• The global Y axis is coincident with the geographical West.
• The global Z axis is vertically upwards, with Z=0 at mean water level.
2) Vessel-fixed coordinate system (VFCS):
• The x-axis is along the vessel centerline, with x=0 at FP and positive
forward.
• The y-axis is positive towards the port side of the vessel, with y=0 at the
FP
• The z-axis is vertically upwards, with z=0 at the vessel keel.

58
Figure 3-13 Coordinate system
Note that plan view angles increase in a counter-clockwise (CCW) fashion.
Unless otherwise noted, both in the analysis and presentation of results, wind,
wave and current angles refer to the directions towards which these environments
propagate (i.e. heading) in the present EFCS system. Additionally, a relative wave
heading of 0deg corresponds to waves approaching the vessel stern-on, while a
relative wave heading of 90deg corresponds to waves approaching the vessel on
the starboard beam. The model of vessel with its mooring system presented in
Figure 3-14 to Figure 3-16.

59
Figure 3-14 Mooring system model in OrcaFlex – Plan view
Figure 3-15 Mooring system model in OrcaFlex – Elevation view

60
Figure 3-16 Mooring system model in OrcaFlex: Isometric 3D view
3.3.4 Loading Scenario
Moored vessel in initial position as per Figure 3-14 will be subjected to
wave, wind and current propagate from the same direction (collinear). Wave and
wind data as well as current speed data has been mentioned in previous section
(see Section 3.2.2). Each magnitude of wave and wind at certain direction will
represent one load cases. Static and dynamic time domain analysis will be
performed per load cases. Total 83 load cases are established for each case study.
The list of fatigue sea states is reflected in Appendix D.
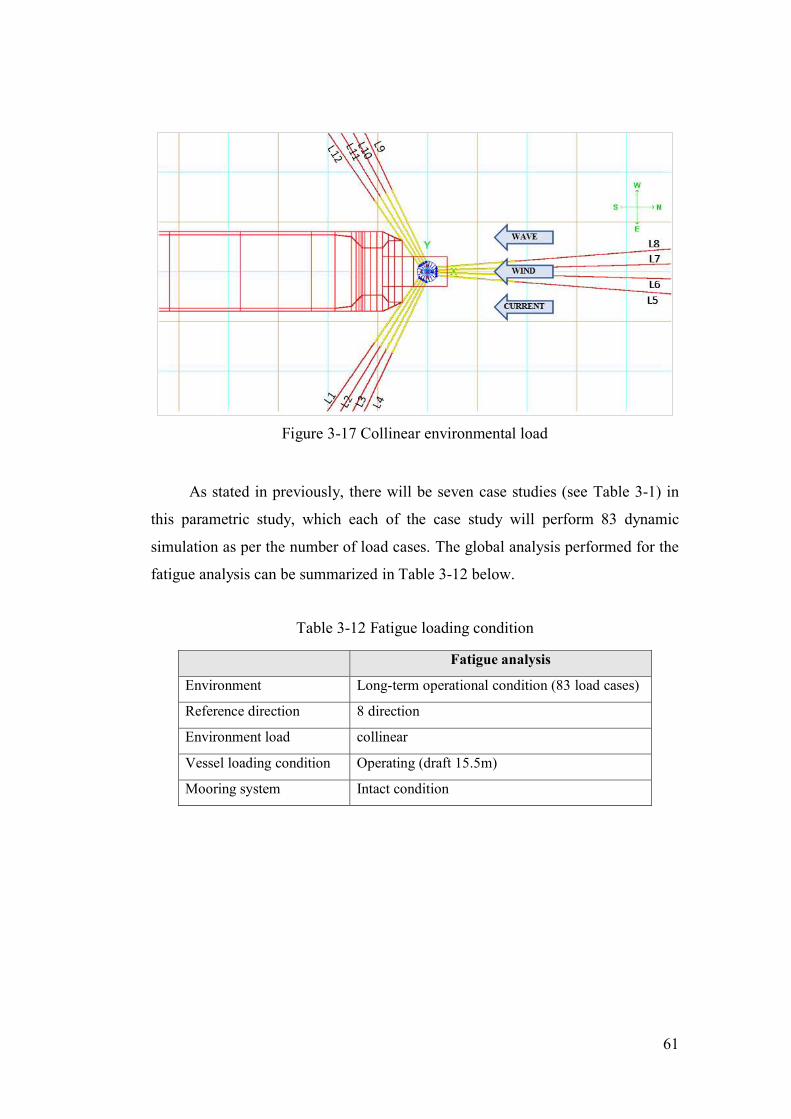
61
Figure 3-17 Collinear environmental load
As stated in previously, there will be seven case studies (see Table 3-1) in
this parametric study, which each of the case study will perform 83 dynamic
simulation as per the number of load cases. The global analysis performed for the
fatigue analysis can be summarized in Table 3-12 below.
Table 3-12 Fatigue loading condition
Fatigue analysis
Environment Long-term operational condition (83 load cases)
Reference direction 8 direction
Environment load collinear
Vessel loading condition Operating (draft 15.5m)
Mooring system Intact condition

62

63
4. RESULTS AND DISCUSSIONS
In this section, the results of numerical analysis are presented. The focus
here is on fatigue life study of mooring lines. The results of dynamic response,
such as: vessel response, mooring line loads and vessel offsets are given as
additional information.
4.1 Vessel Hydrodynamic Analysis
Vessel hydrodynamic analysis were performed using MOSES software.
Frequency domain-based analysis will generate hydrostatic and hydrodynamic
characteristic of free floating vessel, i.e. displacement, buoyancy, added mass and
damping, response amplitude operator (RAO) of motion, mean drift forces and
linearized wave frequency forces. Analysis carried out under vessel’s operating
draft condition, T=15.5m, which is required condition for fatigue analysis.
Wetted surface of vessel consists of 1238 panels. The roll axis for the vessel
is the X-axis. It is oriented along the centerline of the vessel, running forward and
afterward. Longitudinal dimensions are measured along or parallel to this axis.
The pitch axis is the Y-axis. It runs transversely port and starboard. Besides being
the axis for pitch, transverse dimensions are measured along or parallel to this
axis. The yaw axis is the Z-axis. It runs vertically and dimensions are measured
along or parallel to this axis.
RAO for six degree of freedom of the free-floating vessel in regular wave
shown in Figure 4-1 to Figure 4-6. The RAO’s are given with respect to vessel
center of gravity. Surge, sway, and heave motions are described per unit wave
amplitude, and roll, pitch, and yaw are described per unit wave slope.
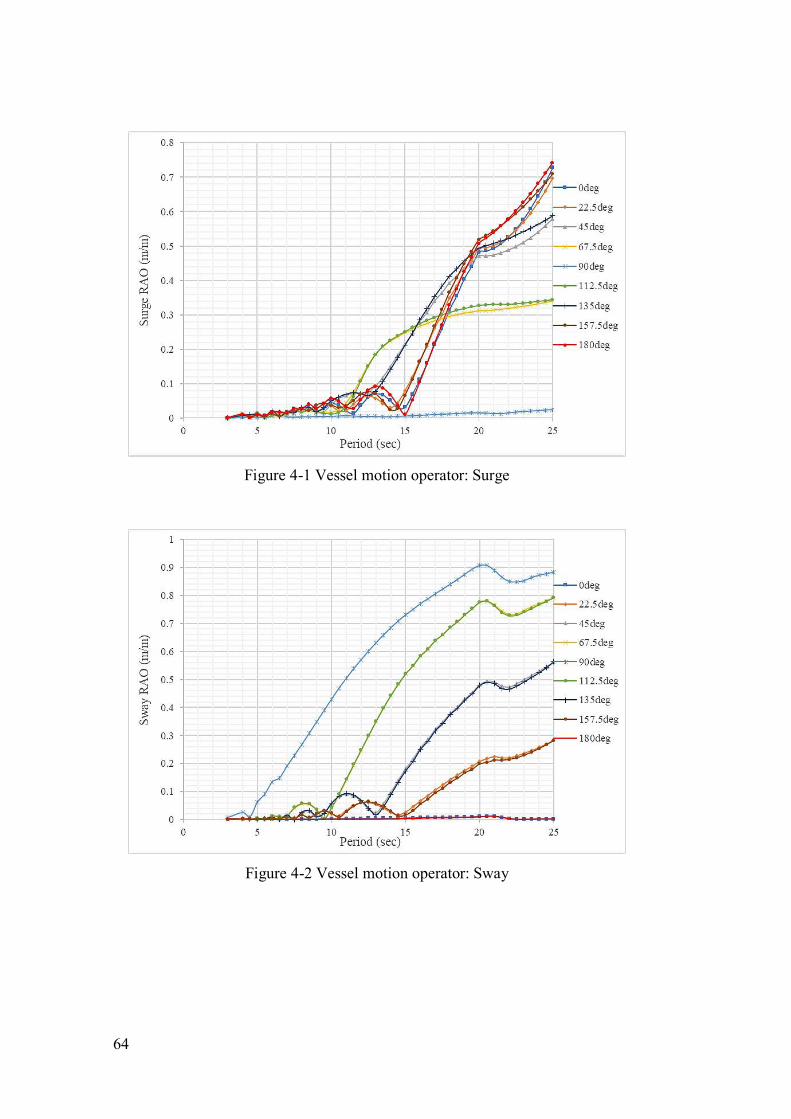
64
Figure 4-1 Vessel motion operator: Surge
Figure 4-2 Vessel motion operator: Sway

65
Figure 4-3 Vessel motion operator: Heave
Figure 4-4 Vessel motion operator: Roll
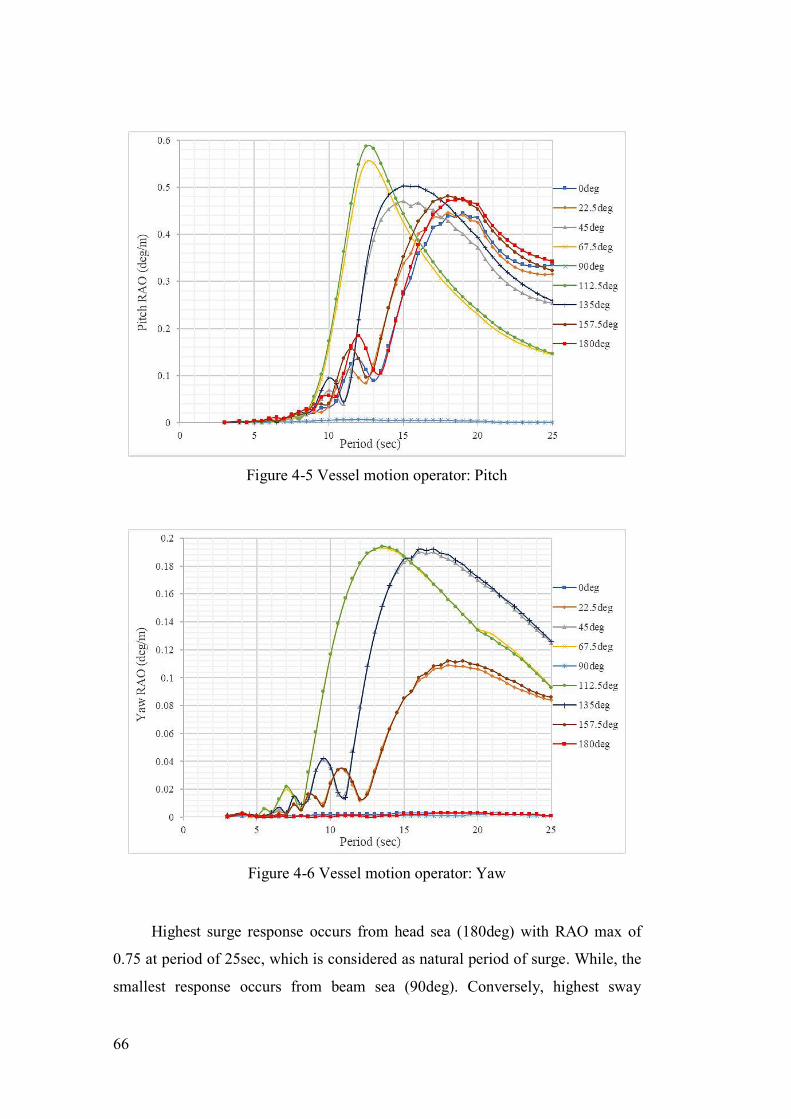
66
Figure 4-5 Vessel motion operator: Pitch
Figure 4-6 Vessel motion operator: Yaw
Highest surge response occurs from head sea (180deg) with RAO max of
0.75 at period of 25sec, which is considered as natural period of surge. While, the
smallest response occurs from beam sea (90deg). Conversely, highest sway

67
response occurs from beam sea (90deg) with RAO max of 0.9 at period of 20sec,
while the lowest occurs from following and head sea (0deg and 180deg
respectively). In higher period, response curve in surge and sway will increase
near 1 and for shorter period, the response will decrease gradually. Heave
response is highest at beam sea (90deg), where near natural period of 12.5sec the
response has peak value around 1.38 and for long waves (long period waves) it
becomes 1.
Roll motion has highest response at beam sea, where near natural period of
21sec the response has peak value around 1.5 and for long waves period the
response decrease significantly up to 0.6. Pitch motion has peak value around 0.59
at its natural period of 12.5sec and for long wave period, the response decrease
gradually up to 0.14.
JONSWAP wave spectrum is chosen in this analysis, as this spectrum is
more suitable to be applied in closed water compared another wave spectrum.
Furthermore, JONSWAP spectrum has been widely used in the design and
analysis of offshore structure operated in Indonesia (Djatmiko, 2012). Calculation
of JONSWAP wave spectrum with Hs=1.725m and peakedness parameter = 3.3
are plotted in Figure 4-7. Wave spectrum curve for irregular wave with Hs=1.75
and = 3.3 has spectra density maximum around 22.5m2/(rad/sec) at wave period
around 12.5sec.
Figure 4-7 Irregular JONSWAP wave spectrum for Hs=1.725m

68
Surge, Sway, Heave, Roll, Pitch, Yaw QTF and added mass-damping are
provided in Appendix B.
4.2 Mooring Line Loads
Mooring lines tension are obtained from time domain based dynamic
analysis in OrcaFlex. Hydrodynamic properties resulted from frequency domain
analysis will be used as input for dynamic analysis of moored vessel. Time
domain dynamic analysis performed by simulating moored vessel in irregular
wave with environmental loads stated in Section 3.2.2.
The simulation of moored vessel starts with static analysis, which intended
to determine the equilibrium configuration of the system (under; weight,
buoyancy, hydrodynamic drag, etc.) and provide starting configuration for
dynamic simulation. The load to be taken into account in static analysis are steady
current, wind and mean wave drift load. Once static equilibrium has been
achieved, followed by dynamic analysis to obtain mooring line tension for each
load cases. It is worth mentioning that the analysis performed at intact condition.
4.2.1 Pretension Case
Base case or case study 1 is a benchmark, which will be used as reference to
comparing the results of other case studies. The characteristic of moored vessel in
this case study is presented in Table 4-1.
Table 4-1 Base case mooring properties
Description Unit Case study 1
Pretension kN 3385 (18% MBL)
Water depth m 602 (100%water depth)
Wave load type - Combined (1st & 2nd order)
Top chain length m 100.0
Wire rope length m 725.0
Bottom chain length m 458.0
Anchor line radius m 1057.2

69
Moored vessel properties for the pretension case are summarized in Table
4-2.
Table 4-2 Pretension case mooring properties
Description Unit Case Study 2 Case Study 3
Pretension kN 2600 (14% MBL) 4040 (22% MBL)
Water depth m 602 602
Wave load type - Combined (1st & 2nd
order)
Combined (1st & 2nd
order)
Top chain length m 123.8 86.6
Wire rope length m 725.0 725.0
Bottom chain length m 458.0 458.0
Anchor line radius m 1057.2 1057.2
Mooring line tension and turret offset results from vessel global analysis for
pretension case are presented in Table 4-3. The results are summarized for highest
tension from all calculated load case. Most tensioned line occurred at line 6 under
load case no.77 with Hs=1.725m; Tp=6.35m; Vw=14.85m/s; Vc=0.68m/s where
the environmental loads are in-line with one mooring group (head sea).
Table 4-3 Mooring line load – Pretension case
Tension
(kN)
Max. offset radius (m)
– from zero position
Case study 1 3898.7 13.3
Case study 2 3128.6 21.3
Case study 3 4437.8 9.7
Case study 3 with pretension of 22% MBL, yields highest line tension of
4437.8kN followed with case study 1 and case study 2 with line tension of
3898.7kN and 3128.6kN respectively. All the highest line tension occurred at
fairlead point (top chain segment). An increase in pretension for 4% will increase
the dynamic line tension by 14% from initial dynamic tension, while a 4%
decrease of pretension will reduce the dynamic line tension by 20% from initial
dynamic tension.
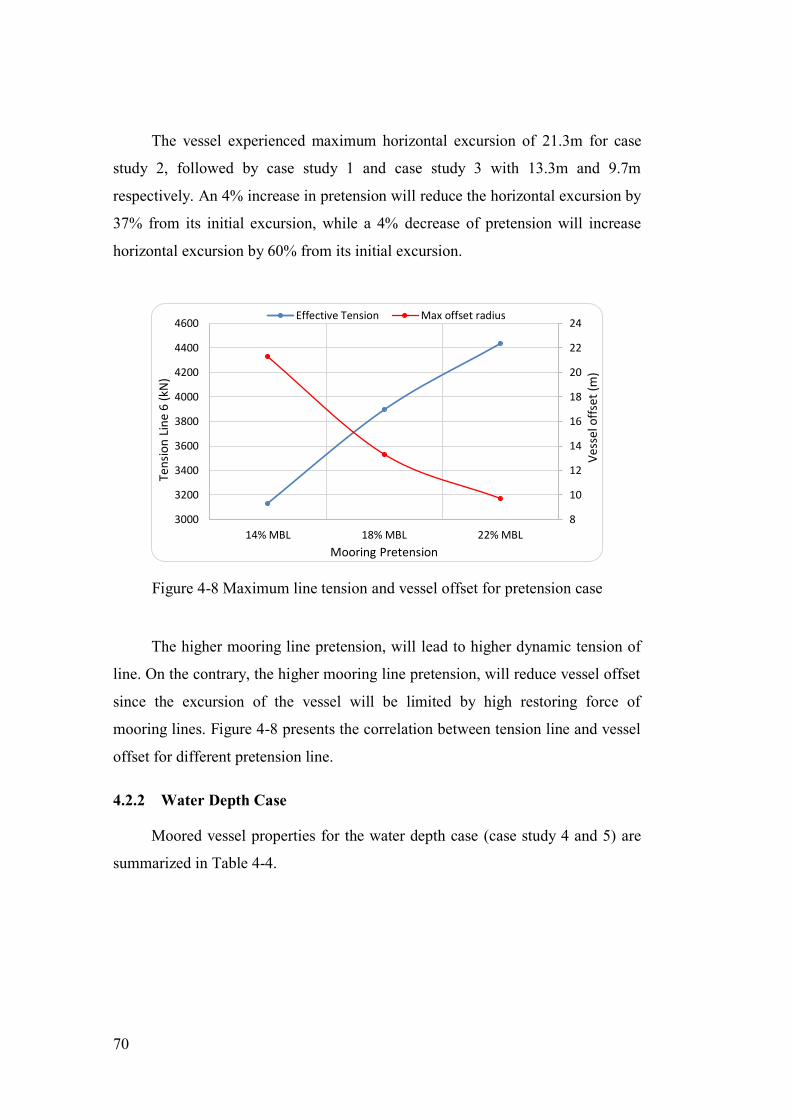
70
The vessel experienced maximum horizontal excursion of 21.3m for case
study 2, followed by case study 1 and case study 3 with 13.3m and 9.7m
respectively. An 4% increase in pretension will reduce the horizontal excursion by
37% from its initial excursion, while a 4% decrease of pretension will increase
horizontal excursion by 60% from its initial excursion.
Figure 4-8 Maximum line tension and vessel offset for pretension case
The higher mooring line pretension, will lead to higher dynamic tension of
line. On the contrary, the higher mooring line pretension, will reduce vessel offset
since the excursion of the vessel will be limited by high restoring force of
mooring lines. Figure 4-8 presents the correlation between tension line and vessel
offset for different pretension line.
4.2.2 Water Depth Case
Moored vessel properties for the water depth case (case study 4 and 5) are
summarized in Table 4-4.
8
10
12
14
16
18
20
22
24
3000
3200
3400
3600
3800
4000
4200
4400
4600
14% MBL 18% MBL 22% MBL
Ve
sse
l o
ffse
t (m
)
Te
nsi
on
Lin
e 6
(k
N)
Mooring Pretension
Effective Tension Max offset radius

71
Table 4-4 Water depth case mooring properties
Description Unit Case Study 4 Case Study 5
Pretension kN 2030 4764
Water depth m 301 (50%WD) 903 (150%WD)
Wave load type - Combined (1st & 2nd
order)
Combined (1st & 2nd
order)
Top chain length m 50.0 150.0
Wire rope length m 362.5 1087.5
Bottom chain length m 229.0 687.0
Anchor line radius m 528.6 1585.8
Mooring line tension and turret offset results from vessel global analysis for
water depth case are presented in Table 4-5. The results are summarized for
highest tension from all calculated load case. Most tensioned line occurred at line
6 under load case no.77 with Hs=1.725m; Tp=6.35m; Vw=14.85m/s; Vc=0.68m/s
where the environmental loads are in-line with one mooring group (head sea).
Table 4-5 Mooring line load – water depth case
Tension
(kN)
Max. offset radius (m)
– from zero position
Case study 1 3898.7 13.3
Case study 4 2432.3 10.1
Case study 5 5198.1 13.5
Case study 5 with water depth 150% of initial water depth, yields highest
line tension of 5198.1kN followed with case study 1 and case study 4 with line
tension of 3898.7kN and 2432.3kN respectively. An increase in water depth for
50% will increase the dynamic line tension by 33% from initial dynamic tension,
while a 50% decrease of water depth will reduce the dynamic line tension by 38%
from initial dynamic tension.
The vessel experienced maximum horizontal excursion of 13.5m for case
study 5, followed by case study 1 and case study 4 with 13.3m and 10.1m
respectively. An increase in water depth for 50% will increase the horizontal

72
excursion by 2% from its initial excursion, while a 50% decrease of water depth
will decrease the horizontal excursion by 24% from its initial excursion.
The higher water depth will increase the mooring line length that lead to the
increase of its weight. The increase in mooring line length will give additional
drag force on the line that leads to higher tension on the line. The increase on the
weight of mooring line will increase the pretension. As discussed previously, the
increase in pretension will leads to higher dynamic tension on the line. Figure 4-9
presents the correlation between tension line and water depth change.
Figure 4-9 Maximum tension of Line 6 for water depth case
4.2.3 Wave Load Type
Moored vessel properties for the wave load type case (case study 6 and 7)
are summarized in Table 4-6.
Table 4-6 Wave load type mooring properties
Description Unit Case Study 6 Case Study 7
Pretension kN 3385 3385
Water depth m 602 602
Wave load type - 1st order 2nd order
Top chain length m 100.0 100.0
Wire rope length m 725.0 725.0
2000
2400
2800
3200
3600
4000
4400
4800
5200
50% wd 100% wd 150% wd
Te
nsi
on
Lin
e 6
(k
N)
Water depth

73
Table 4-6 Wave load type mooring properties (Continued)
Description Unit Case Study 6 Case Study 7
Bottom chain length m 458.0 458.0
Anchor line radius m 1057.2 1057.2
Mooring line tension and turret offset results from vessel global analysis for
wave load type case are presented in Table 4-7. The results are summarized for
highest tension from all calculated load case. Most tensioned line occurred at line
6 under load case no.77 with Hs=1.725m; Tp=6.35m; Vw=14.85m/s; Vc=0.68m/s
where the environmental loads are in-line with one mooring group (head sea).
Table 4-7 Mooring line load – wave load type case
Tension
(kN)
Max. offset radius (m)
– from zero position
Case study 1 3898.7 13.3
Case study 6 3702.5 8.3
Case study 7 3802.4 12.2
Case study 1 with combined 1st order and 2nd order wave load yields highest
line tension of 3898.7kN followed with case study 7 and case study 6 with line
tension of 3802.4kN and 3702.5kN respectively. It is generally agreed that 1st
order wave load has less contribution to the tension of mooring line compared to
2nd order wave load, thus the results above have good agreement with that
statement.
The vessel experienced maximum horizontal excursion of 13.3m for case
study 1, followed by case study 7 and case study 6 with horizontal excursion of
12.2m and 8.3m respectively. In line with the tension results, the 1st order wave
load has less contribution to the excursion of moored structure compared to 2nd
order wave load, where the 2nd order wave load yields higher radius vessel offset
than 1st order wave load.

74
Figure 4-10 Maximum tension of Line 6 for wave load type case
Floating unit normally experience significant LF response in the horizontal
plane and may be particularly sensitive to surge excitation due to the low viscous
hull damping (DNV-RP-F205, 2010). Compared to 1st order wave forces, the 2nd
order wave forces give smaller value and have no significant effect on vertical
motion (heave, roll, pitch) where hydrostatic restoring force are established.
However, for the horizontal motion (surge, sway, yaw) where the restoring forces
arise due to mooring lines, the motion of 2nd order wave forces are quite
significant. This affects the offset radius, where 2nd order wave component gives
higher horizontal vessel offset than 1st order wave component. The higher vessel
offset will increase line restoring force that lead to higher dynamic tension on the
line. Figure 4-10 presents the correlation between tension line and wave load
component.
4.3 Mooring Line Fatigue Life
Tension fatigue analysis is performed to estimate the fatigue life of the
major mooring components, such as top chain, steel wire and bottom chain. It is
worth mentioning that the T-N curve of steel wire is significantly less severe than
the T-N curve of mooring chain (Refer to Section 2.2.9). Consequently, for
similar tension range the damage caused in the mooring chain is significantly
3500
3550
3600
3650
3700
3750
3800
3850
3900
3950
1st order 2nd order 1st + 2nd order
Te
nsi
on
Lin
e 6
(k
N)
Wave load type

75
higher. Therefore, the critical components in this mooring system are the chain
segments.
As mentioned in previous section, the fatigue analysis is performed using
the results of time domain analysis and the cyclic of tension are computed using
Rainflow counting method. The estimates fatigue life for each mooring line are
selected conservatively as the minimum estimated life from all fatigue load cases.
4.3.1 Base Case
Base case or case study 1 is selected to be the control case. This case
represents actual condition of moored FLNG as per existing data mentioned in
Section 3.3. The summary results of fatigue analysis for base case is provided in
Table 4-8. In this table, the expected life of mooring components, i.e. top chain,
steel wire and bottom chain of all 12 mooring lines are presented. The factor of
safety (FoS) in this table is estimated as the ratio of the expected life by the design
life of the system (30 year).
Table 4-8 Summary of base case fatigue analysis
Line No. Line Section Damage Life (year) FoS
Line 1
Top chain 1.8E-04 5568.91 185.6
Steel wire 4.96E-08 20159058.10 671968.6
Bottom chain 2.18E-04 4602.76 153.4
Line 2
Top chain 1.84E-04 5448.56 181.6
Steel wire 4.95E-08 20218888.70 673963.0
Bottom chain 2.20E-04 4547.26 151.6
Line 3
Top chain 1.88E-04 5329.70 177.7
Steel wire 5.02E-08 19938695.70 664623.2
Bottom chain 2.23E-04 4485.81 149.5
Line 4
Top chain 1.94E-04 5165.53 172.2
Steel wire 5.17E-08 19359285.55 645309.5
Bottom chain 2.30E-04 4344.83 144.8
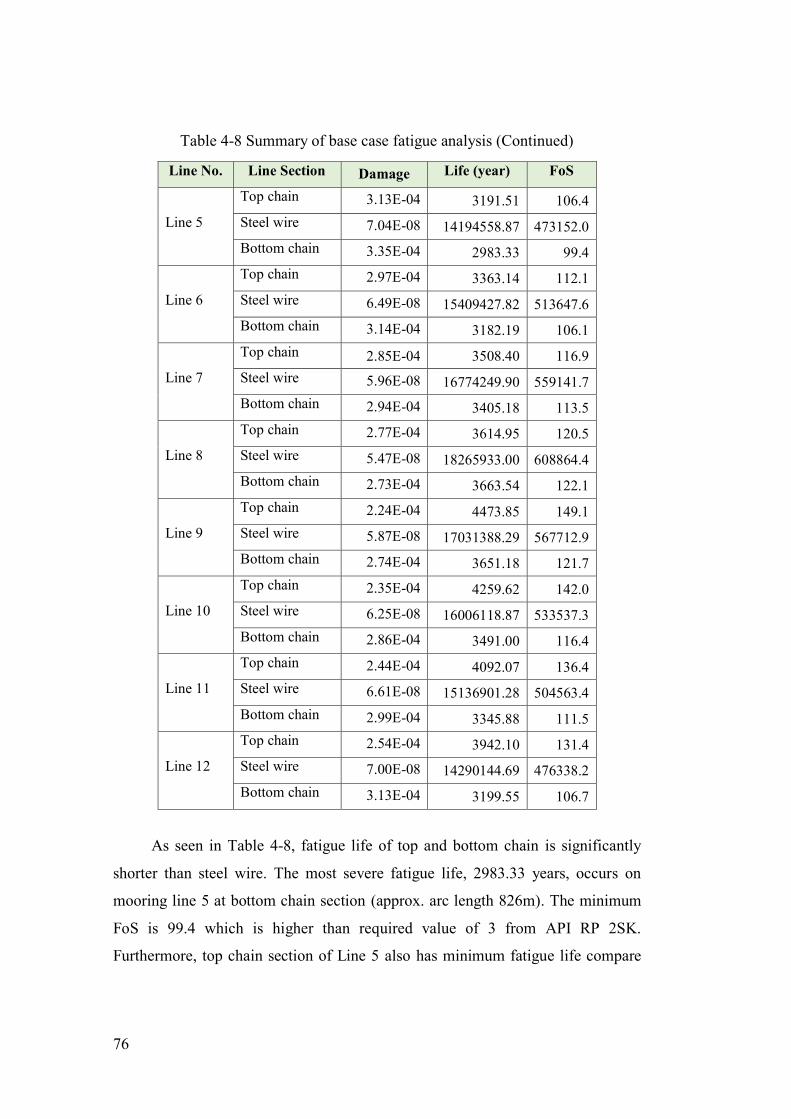
76
Table 4-8 Summary of base case fatigue analysis (Continued)
Line No. Line Section Damage Life (year) FoS
Line 5
Top chain 3.13E-04 3191.51 106.4
Steel wire 7.04E-08 14194558.87 473152.0
Bottom chain 3.35E-04 2983.33 99.4
Line 6
Top chain 2.97E-04 3363.14 112.1
Steel wire 6.49E-08 15409427.82 513647.6
Bottom chain 3.14E-04 3182.19 106.1
Line 7
Top chain 2.85E-04 3508.40 116.9
Steel wire 5.96E-08 16774249.90 559141.7
Bottom chain 2.94E-04 3405.18 113.5
Line 8
Top chain 2.77E-04 3614.95 120.5
Steel wire 5.47E-08 18265933.00 608864.4
Bottom chain 2.73E-04 3663.54 122.1
Line 9
Top chain 2.24E-04 4473.85 149.1
Steel wire 5.87E-08 17031388.29 567712.9
Bottom chain 2.74E-04 3651.18 121.7
Line 10
Top chain 2.35E-04 4259.62 142.0
Steel wire 6.25E-08 16006118.87 533537.3
Bottom chain 2.86E-04 3491.00 116.4
Line 11
Top chain 2.44E-04 4092.07 136.4
Steel wire 6.61E-08 15136901.28 504563.4
Bottom chain 2.99E-04 3345.88 111.5
Line 12
Top chain 2.54E-04 3942.10 131.4
Steel wire 7.00E-08 14290144.69 476338.2
Bottom chain 3.13E-04 3199.55 106.7
As seen in Table 4-8, fatigue life of top and bottom chain is significantly
shorter than steel wire. The most severe fatigue life, 2983.33 years, occurs on
mooring line 5 at bottom chain section (approx. arc length 826m). The minimum
FoS is 99.4 which is higher than required value of 3 from API RP 2SK.
Furthermore, top chain section of Line 5 also has minimum fatigue life compare

77
to another line at the same section, with estimated value 3191.51 years. Fatigue
life at line 5 along the arc length presented in Figure 4-11.
Figure 4-11 Fatigue life graph at Line 5
Bottom chain section (at arc length 826m) has higher tension range compare
to top chain section (at arc length 0m), which is characterized by line tension
standard deviation (STD). Bottom chain section (at arc length 826m) has higher
STD of 43.89, while top chain section (at arc length 0m) has STD of 41.3.
Furthermore, bottom chain section’s material has smaller MBL with 17,317kN
compare to top chain section’s material with MBL of 18,496kN. This will affect
the ratio of tension range to reference breaking strength, R, in the API T-N curve
of mooring chain (see Section 2.2.9). Assumed for fixed value of tension range,
then the bottom chain section has higher ratio R than top chain section. This will
lead to lower value of N (number of cycles to failure), where the lower value of N
will reduce the fatigue life. Tension comparison of Line 5 at different chain
section presented in Figure 4-12.
1.00E+03
1.00E+04
1.00E+05
1.00E+06
1.00E+07
1.00E+08
0 200 400 600 800 1000 1200 1400
Fa
tig
ue
Lif
e (
ye
ars
)
Arc Length (m)
Top chain Steel wire Bottom chain

78
Figure 4-12 Tension comparison of Line 5 at arc length 0m vs 826m. Load case
77 with Hs=1.725m; Tp=6.35m; Vw=14.85m/s; Vc=0.68m/s; µ=180o collinear
Figure 4-13 Line section with shortest fatigue life – Line 5
4.3.2 Mooring Pretension Case
The main purpose of mooring system is to provide seakeeping and maintain
floating structure on position within specific tolerance, typically based on offset
limit. The offset limit can be varying for various system depends on riser
configuration, well position, the existence of another facility in the vicinity of the

79
structure, etc. To provide desirable vessel offset, one can adjust the pretension on
mooring system. Hence, the determination of pretension value has important role
in the operation of mooring system. To investigate the influence of mooring line
pretension on the fatigue life, case study 1, 2 and 3 with different pretension are
specified. Summary results of fatigue life for case study 2 (14%MBL of
pretension) and case study 3 (22%MBL of pretension) provided in Appendix E.
A comparison between the results of fatigue base case and pretension case
are presented in Figure 4-14.
Figure 4-14 Mooring line fatigue life for cases with different pretension
It is seen from Figure 4-14 that base case (18%MBL of pretension) yields
much longer fatigue life than case study 2 (14%MBL of pretension) and case
study 3 (22%MBL of pretension). Generally, the most critical fatigue life occurs
at case study 2, except for line 1 to 4, followed by case study 3 and case study 1
respectively. Case study 2 has the shortest fatigue life of 1814.2 years followed by
case study 3 and case study 1 with 2034.61 years and 2983.33 years respectively.
Detailed minimum fatigue life for each pretension condition are presented in
Table 4-9.

80
Table 4-9 Minimum fatigue life with different pretension
Fatigue Life
(years)
Fatigue
damage
Case study 1 2983.33 3.35E-04
Case study 2 1814.20 5.51E-04
Case study 3 2034.61 4.91E-04
As stated in previous section, dynamic line tension increase with increasing
of pretension, therefore it is agreed that case study 2 has the lowest line tension
(See Table 4-3). It is interesting to note that, despite has the lowest tension, case
study 2 has the highest fatigue damage (shortest fatigue life). Smaller pretension
will cause larger vessel offset, since mooring line tend to be in slack position. The
larger vessel offset could lead to larger tension range of mooring line during
simulation. Tension range distribution during simulation period represented by
standard deviation (STD), where a bigger value of STD indicates larger tension
distribution. Table 4-10 shows max tension, mean tension and standard deviation
(STD) of line tension. Mooring line fatigue life decrease due to the increase in line
tension STD as vessel offset increases. Therefore, the determination of pretension
will affect the fatigue life of mooring lines during operation.
Table 4-10 Tension statistics for pretension case
Case study 1 Case study 2 Case study 3
Max tension (kN) 3898.70 3128.60 4437.80
Mean tension (kN) 3392.77 2554.76 3971.93
STD 50.58 52.09 51.23
4.3.3 Water Depth Case
Water depth is recognized as one of important parameter in mooring system
design. It will affect mooring line length, material and configuration. In order to
investigate the effect of water depth on the mooring line tension and fatigue
damage, dynamic analysis of case study 1, 4 and 5 are performed. Water depth are
301m, 602m and 903m in case study 4, 1 and 5 respectively. The water depth of

81
case study 4 is half (50%) of case study 1, while case study 5 has water depth 1.5
(150%) of case study 1. Summary results of fatigue life for case study 4 and case
study 5 provided in Appendix E.
Comparison results of fatigue base case and water depth case are listed and
discussed as follow.
Figure 4-15 Mooring line fatigue life for cases with different water depth
Figure 4-15 shows that the most critical fatigue life for different water depth
occurs at case study 5 with 903m water depth. While case study 4 with 301m
water depth yields longest fatigue life. Detailed minimum fatigue life for each
water depth condition presented in Table 4-11. Case study 5 has shortest fatigue
life of 1842.65 years followed by case study 1 and 4 with 2983.33 years and
3363.62 years respectively.

82
Table 4-11 Minimum fatigue life with different water depth
Fatigue Life
(years)
Fatigue
damage
Case study 1 2983.33 3.35E-04
Case study 4 3363.62 2.97E-04
Case study 5 1842.65 5.43E-04
As described in Section 4.2.2, in the deeper water depth, the weight of
mooring line will increase due to the increases in mooring line length. This
increase in length and weight will be followed by increase of drag force and
pretension on mooring line, that lead to the increase of effective and mean tension
on the mooring lines. Table 4-12 presents tension statistic for water depth case.
Case study 5 with shortest fatigue life has highest STD of 56.02, while case study
4 with longest fatigue life has lowest STD of 45.34. This results have good
agreement with previous section (pretension case) where the higher STD, means
high tension range, will result in shorter fatigue life.
Table 4-12 Tension statistics for water depth case
Case study 1 Case study 4 Case study 5
Max tension (kN) 3898.70 2432.30 5198.10
Mean tension (kN) 3392.77 2045.30 4692.69
STD 50.58 45.34 56.02
4.3.4 Wave Load Type Case
As described in previous section, wave load acting on floating structure
have 1st order and 2nd order components. The behavior of structure and its
mooring line would also be affected by combination of 1st order and 2nd order
wave loads. The influence of the 1st order and 2nd order wave loads on moored
vessel has been discussed by many researchers, covers the behavior of vessel and
tension of mooring lines. To investigate the influence of wave load component on
the fatigue life of mooring lines, case study 1, 6 and 7 with different wave load
type are specified.
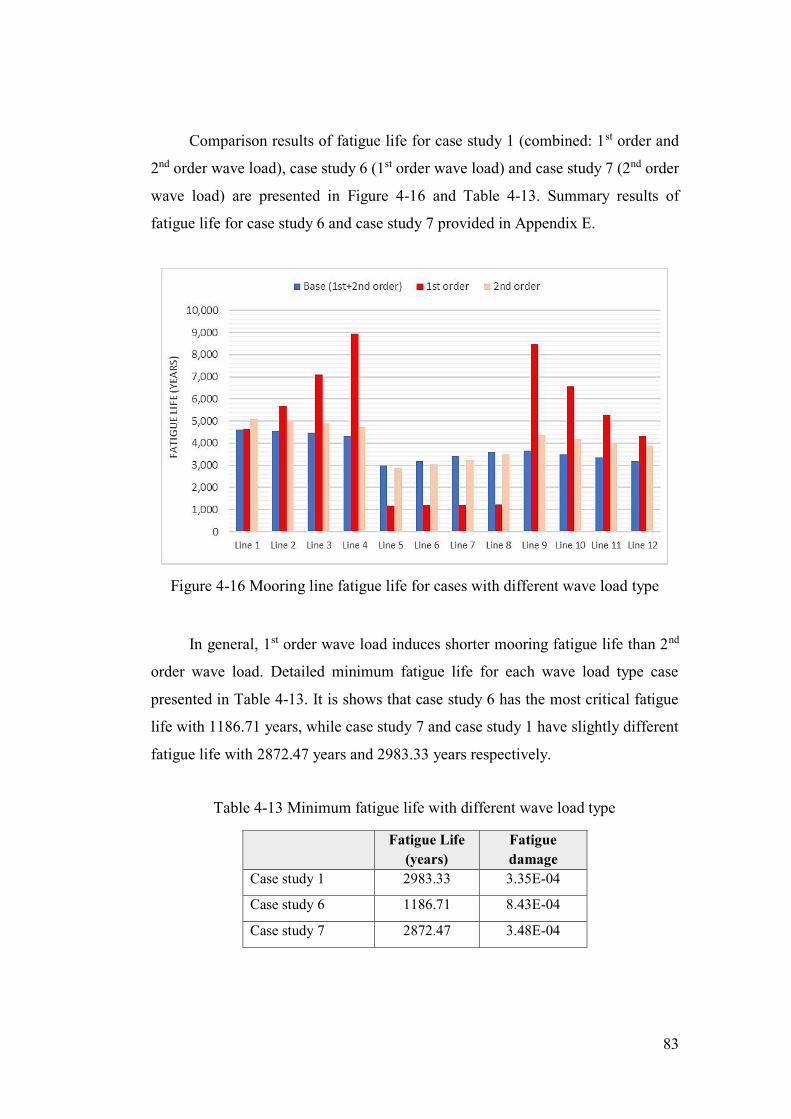
83
Comparison results of fatigue life for case study 1 (combined: 1st order and
2nd order wave load), case study 6 (1st order wave load) and case study 7 (2nd order
wave load) are presented in Figure 4-16 and Table 4-13. Summary results of
fatigue life for case study 6 and case study 7 provided in Appendix E.
Figure 4-16 Mooring line fatigue life for cases with different wave load type
In general, 1st order wave load induces shorter mooring fatigue life than 2nd
order wave load. Detailed minimum fatigue life for each wave load type case
presented in Table 4-13. It is shows that case study 6 has the most critical fatigue
life with 1186.71 years, while case study 7 and case study 1 have slightly different
fatigue life with 2872.47 years and 2983.33 years respectively.
Table 4-13 Minimum fatigue life with different wave load type
Fatigue Life
(years)
Fatigue
damage
Case study 1 2983.33 3.35E-04
Case study 6 1186.71 8.43E-04
Case study 7 2872.47 3.48E-04

84
For the wave load type case, the calculation indicates that line 5 at bottom
chain section (approx. arc length 826m) is the most critical fatigue line. Time
series of dynamic tension in Line 5 at arc length 826m presented in Figure 4-17
and Figure 4-18, while surge response of moored FLNG for load case 77 with
with Hs=1.725m; Tp=6.35m; Vw=14.85m/s; Vc=0.68m/s; µ=180o collinear
presented in Figure 4-19 and Figure 4-20.
Figure 4-17 Time series of tension in Line 5 - arc length 826m. Load case 77 with
Hs=1.725m; Tp=6.35m; Vw=14.85m/s; Vc=0.68m/s; µ=180o collinear

85
Figure 4-18 Time series of tension in Line 5 - arc length 826m at 9200-9500sec.
Load case 77 with Hs=1.725m; Tp=6.35m; Vw=14.85m/s; Vc=0.68m/s; µ=180o
collinear
Figure 4-19 Surge response for load case 77 with Hs=1.725m; Tp=6.35m;
Vw=14.85m/s; Vc=0.68m/s; µ=180o collinear

86
Figure 4-20 Surge response for load case 77 at 9000-9500sec with Hs=1.725m;
Tp=6.35m; Vw=14.85m/s; Vc=0.68m/s; µ=180o collinear
Surge vessel response generated by 1st order wave load, 2nd order wave load
and combination of both presented in Figure 4-19. As can be seen in this figure,
surge response of 1st order wave load relatively small compare to 2nd order load.
Surge response of 1st order wave load has double amplitude approx. of 1.5m,
while 2nd order wave load has double amplitude approx. of 7m.
As previously discussed in Section 4.2.3, in the horizontal motion (surge,
sway, yaw), 2nd order wave load component has significant effect on vessel offset
and line tension of moored vessel compared to 1st order wave load component.
However, in term of fatigue life, 1st order wave load induces higher fatigue
damage (shorter fatigue life) on the mooring line compare to 2nd order component.
The time series of tension in mooring line 5 at arc length 826m is shown in Figure
4-17. The highest line tension of 1st order component, 2690kN, is less than those
of 2nd order component with 2843.7kN. However, the number of cycles in 1st
order component is more than 2nd order component, where 1st order component
has 3166 cycles while 2nd order component has 3118 cycles. The higher number
of cycles leads to higher fatigue damage (shorter fatigue life).
87
5. CONCLUSION
5.1 Conclusion from results and discussion
This thesis investigates several parameters which could affect the fatigue
life of mooring lines by setting up a series of case study for a FLNG with external
turret mooring system. Coupled dynamic analysis under different condition were
performed to investigate the effects of mooring pretension, water depth and wave
load type on the fatigue life of mooring lines.
Based on the numerical results and discussions, following conclusion can be
made as follows:
1. Mooring system with smaller pretension has lower dynamic line tension.
However, the smaller pretension lead to larger vessel offset and smaller
mooring stiffness. This will increase the tension range and standard
deviation (STD) that lead to higher fatigue damage (shorter fatigue life).
2. In the deeper water depth, the weight of mooring line will increase due to
increases in mooring line length that will be followed by increases in
pretension. The increase in mooring length will also give additional drag
force on the line. This increase will lead to increase of effective and mean
tension. In term of fatigue life, the higher water depth will reduce the fatigue
life in mooring system.
3. The contribution of 2nd order wave component on vessel offset and line
tension of moored vessel is more significant compare to 1st order wave
component. However, in term of fatigue life, 1st order wave load induces
higher fatigue damage (shorter fatigue life) compare to 2nd order component.
Mooring pretension, water depth, and wave load component, all these
parameters affect the fatigue life of mooring line. Analysis results obtained from
these parametric studies can be used as guidance to mooring designer for
designing fatigue life of mooring lines on floating structures.

88
5.2 Recommendation
Some recommendation for future work related to this thesis are identified as
follows:
1. Pretension mooring case studied in this thesis are compared in 3 different
cases, where the gap difference of pretension value between each case study
is quite significant (approx. 780kN). It is recommended to add more cases
where the gap difference of pretension is closer each other, thus the trend of
fatigue life results with more details can be assessed.
2. In this thesis, fatigue damages are calculated using Rainflow method. It
would be interesting to perform a comparison study between fatigue damage
methods as per stated in code/standards, e.g.: Rainflow counting compare
with Combined spectrum approach.
3. In order to study the effect of each parameter optimally, it is recommended
using combinatorial factor design.

89
REFERENCES
ABS (2012), Rules for Building and Classing Mobile Offshore Drilling Unit, Part
3, American Bureau of Shipping, Houston.
ASTM (2005), Standard Practice for Cycle Counting in Fatigue Analysis,
Designation E 1049-85, ASTM International, United States.
API RP 2SK (2008), Design and Analysis of Stationkeeping Systems for Floating
Structures, American Petroleum Institute, Washington, D.C.
Bhattacharyya, R. (1978), Dynamics of Marine Vehicles, John Wiley & Son, New
York.
Brown, D.T. (2005), Mooring Systems, In a Chakrabarti, S.K. (Eds.), Handbook
of Offshore Engineering (pp. 663-708), Amsterdam: Elsevier.
Chakrabarti, S.K. (2005), Handbook of Offshore Engineering, Vol. I, Elsevier,
Amsterdam.
Chrolenko, M.O. (2013), Dynamic Analysis and Design of Mooring Lines, Master
Thesis, NTNU, Trondheim.
DNVGL-OS-E301 (2015), Position Mooring, DNV GL AS.
Djatmiko, E.B. (2012), Perilaku dan Operabilitas Bangunan Laut di Atas
Gelombang Acak, ITS press, Surabaya.
Faltinsen, O.M. (1990), Sea Loads on Ships and Offshore Structures, Cambridge
University Press, Melbourne.
Gao, Z. (2008), Stochastic Response Analysis of Mooring System with Emphasis
on Frequency-domain Analysis of Fatigue due to Wide-band Response
Processes, Thesis Ph.D., NTNU, Trondheim.
Han, J.S., Kim, Y.H., Son, Y.J., & Choi, H.S. (2010), ”A Comparative Study on the Fatigue Life of Mooring Systems with Different Composition", 9th
International Conference of Hydrodynamic, Elsevier.
Hsu & Blenkarn (1970), In a Journée, J.M.J., & Massie, W.W. (Eds.), Offshore
Hydromechanics, First Edition, Delft University of Technology.
JTM Consortium (2014), Mooring System Design Load Report, JTM Consortium,
Jakarta.
Journée, J.M.J., & Massie, W.W. (2001), Offshore Hydromechanics, First Edition,
Delft University of Technology.
Junfeng, D., Shuqing, W., Anteng, C., & Huajun, L. (2016), "An Investigation on
Low Frequency Fatigue Damage of Mooring Lines Applied in a Semi-
Submerssible Platform", Journal Ocean University China, doi
10.1007/s11802-016-2819-x.
Kang, C., Lee, C., Jun, S.H., & Oh, Y.T. (2016), "Fatigue Analysis of Spread
Mooring Line", International Journal of Environmental, Chemical,
Geological and Geophysical Engineering, Vol. 10, No. 5.
Lin, Z., & Sayer, P. (2015), "Influence of Water Depth Variation on the
Hydrodynamics of Deep-water Mooring Characteristics". Ocean Engineering, 109, 553-566.

90
Mahdarreza, A. (2011), Analisis Perilaku Floating LNG pada Variasi Metocean
terhadap External Turrret Mooring System Berbasis Simulasi Time
Domain, Final Project, ITS, Surabaya.
Ma, K., Duggal, A., Smedley, P., L'Hostis, D., & Shu, H. (2013), "A Historical
Review on Integrity Isssues of Permanent Moring Systems", Offshore
Technology Conference 24025, Houston, Texas.
Matsuishi, M., & Endo, T. (1968), "Fatigue of Metals Subjected to Varying
Stress", Presented to Japan Society of Mechanical Engineers, Fukuoka,
Japan.
Noble Denton Europe Limited (2006), "Floating Production System - JIP FPS
Mooring Integrity", UK HSE Research Report 444.
Offshore Magazine (2013), "Available FPU count at all-time high", Offshore, 26
November 2013.
Ormberg, H., & Larsen, K. (1998), "Coupled Analysis of Floater Motion and
Mooring Dynamics for a Turret-Moored Ship", Applied Ocean Research,
20, 55-67.
Pinkster, J.A. (1975), "Low-Frequency Phenomena Associated with Vessels
Moored at Sea", Society of Petroleum Engineers Journal.
PTSC (2018), FPSO Ruby II [Photograph], Retrieved from
https://www.ptsc.com.vn/danh-sach-tau-fsofpso/tau-chua-fpso-ruby-
ii.html
Remery & van Oortmerssen (1973), In a Journée, J.M.J., & Massie, W.W. (Eds.),
Offshore Hydromechanics, First Edition, Delft University of Technology.
Remery & Hermans (1971), In a Journée, J.M.J., & Massie, W.W. (Eds.),
Offshore Hydromechanics, First Edition, Delft University of Technology.
Rychlik, I. (1987), "A New Definition of the Rainflow Cycle Counting Method",
Int J Fatigue, No.2, pp 119-121.
Saidee, M.H. (2015), Fatigue Analysis and Design of Mooring Systems.
Assessment and Comparison of Different Methods, Master Thesis, NTNU,
Trondheim.
Wu, Y., Wang, T., Eide, O., & Haverty, K. (2015), "Governing Factor and
Locations of Fatigue Damage on Mooring Lines of Floating Structures",
Ocean Engineering, 96, 109-124.
Wall, M., Pugh, H.R., Reay, A., & Krol, J. (2002), Failure Modes, Reliability and
Integrity of FSU Turret and Swivel Systems (Offshore Technology Report
2001/073), HSE, Norwich.
Yarveisy, R. (2015), Wiener Chaos Expansion for Fatigue Damage
Approximation of an FPSO Mooring Chain, Master Thesis, Chalmers
University of Technology, Goteborg.
2b1stconsulting (2012), Turret [Photograph], Retrieved from
https://www.2b1stconsulting.com/turret/

APPENDIX A
MOSES Input Model

Input MOSES: Model FLNG
$ &model_def -save &model_def -flood no &dimen -save -dimen meters m-tons $ &set vessel = flng &set vName = flng &set vdepth = 38.0 $ barge depth &set vbeam = 64.0 $ barge beam &set vlength = 381.4 $ barge length (LBP) &set l_draft = 11.0 &set h_draft = 15.5 &set diftype = 3ddif $ &desc body flng $ $******************************************** $ MAIN HULL $******************************************** $ $TURRET SUPPORT pgen -perm 1.00 -loc 0.0 0.0 0.0 -diftyp %diftype -cs_wind 1 1 0 -cs_cur 1 1 1 PLANE -52.090 -CARTES 0.000,38.200 12.000,38.200 12.000,45.200 PLANE -24.774 -CARTES 0.000,38.200 12.000,38.200 12.000,45.200 PLANE -15.770 -CARTES 0.000,31.817 12.000,31.817 12.000,45.200 PLANE -15.770 -CARTES 0.000,38.000 12.000,38.000 12.000,45.200 PLANE 0 -CARTES 0.000,20.775 12.000,38.000 end_pgen $ pgen -perm 1.000625 -loc 0.0 0.0 -0.02 -diftyp %diftype -cs_wind 1 1 0 -cs_cur 1 1 1 $--FRONT--- PLANE -15.770 -CARTES 0.000,31.817 24.756,31.817 24.756,32.000 24.756,36.000 24.756,38.000 00.000,38.000 $ 21ST PLANE -9.535 -CARTES 0.000,27.536 24.756,27.536 27.513,31.817 27.513,32.000 27.513,36.000 27.513,38.000 00.000,38.000 $ 20.5ST PLANE -4.768 -CARTES 0.000,24.000 24.756,24.000 28.000,28.986 29.802,31.817 29.802,32.000 29.802,36.000 29.802,38.000 00.000,38.000 $32.000,38.000 $ 20ST $--HULL--- PLANE 0 -CARTES 0.000,12.000 19.000,12.000 20.000,13.599 24.000,19.708 24.756,20.775 28.000,25.817 32.000,31.926 32.000,32.000 32.000,36.000 32.000,38.000 00.000,38.000 $32.000,36.000 32.000,38.000 $ 20ST / FP PLANE 4.7675 -CARTES 0.000,8.480 19.000,8.480 20.000,9.211 23.440,11.772 24.000,12.524 28.000,18.553 32.000,24.543 32.000,28.000 32.000,32.000 32.000,36.000 32.000,38.000 00.000,38.000 $ 19.75ST PLANE 9.535 -CARTES 0.000,4.888 19.000,4.888 20.000,5.637 24.000,8.630 28.000,11.623 28.506,12.071 32.000,17.359 32.000,24.000 32.000,28.000 32.000,32.000 32.000,36.000 32.000,38.000 00.000,38.000 $ 19.50ST PLANE 14.302 -CARTES 0.000,1.396 19.000,1.396 20.000,2.140 24.000,5.118 28.000,8.096 32.000,11.074 32.000,16.000 32.000,20.000 32.000,24.000 32.000,28.000 32.000,32.000 32.000,36.000 32.000,38.000 00.000,38.000 $ 19.25ST PLANE 16.130 -CARTES 0.000,0.000 19.000,0.000 20.000,0.772 24.000,3.752 24.247,4.000 28.000,6.801 29.633,8.000 32.000,9.752 32.000,12.000 32.000,16.000 32.000,24.000 32.000,28.000 32.000,32.000 32.000,36.000 32.000,38.000 00.000,38.000 PLANE 17.130 -CARTES 0.000,0.000 20.000,0.000 24.000,3.011 25.212,4.000 28.000,6.064 30.636,8.000 32.000,9.003 32.000,12.000 32.000,16.000 32.000,24.000 32.000,28.000 32.000,32.000 32.000,36.000 32.000,38.000 00.000,38.000 $ STATION BANTU(19+1) PLANE 1*19.070 -CARTES 0.000,0.000 21.852,0.000 24.000,1.555 27.202,4.000 28.000,4.519 32.000,7.483 32.000,8.000 32.000,20.000 32.000,24.000 32.000,28.000 32.000,32.000 32.000,36.000 32.000,38.000 00.000,38.000 $ 19ST PLANE 21.156 -CARTES 0.000,0.000 24.000,0.000 28.000,2.987 29.258,4.000 32.000,5.946 32.000,8.000 32.000,12.000 32.000,20.000 32.000,24.000 32.000,28.000 32.000,32.000 32.000,38.000 00.000,38.000 $ ST AUX(19-1) PLANE 25.130 -CARTES 0.000,0.000 28.000,0.000 32.000,3.018 32.000,4.000 32.000,8.000 32.000,12.000 32.000,20.000 32.000,24.000 32.000,28.000 32.000,32.000 32.000,36.000 32.000,38.000 00.000,38.000 $ ST AUX(19-1) PLANE 2*19.070 -CARTES 0.000,0.000 29.500,0.000 \ -CIRC 29.500,2.5,2.5,10,10,10 \ -CARTES 32.000,4.000 32.000,8.000 32.000,12.000 32.000,16.000 32.000,20.000 32.000,24.000 32.000,28.000 32.000,32.000 32.000,36.000 32.000,38.000 00.000,38.000 $ 18ST PLANE 3*19.070 4*19.070 5*19.070 6*19.070 7*19.070 8*19.070 9*19.070 10*19.070 11*19.070
12*19.070 13*19.070 14*19.070 15*19.070 16*19.070 17*19.070 18*19.070 \

-CARTES 0.000,0.000 29.500,0.000 \ -CIRC 29.500,2.5,2.5,10,10,10 \ -CARTES 32.000,4.000 32.000,8.000 32.000,12.000 32.000,16.000 32.000,20.000 32.000,24.000 32.000,28.000 32.000,32.000 32.000,36.000 32.000,38.000 00.000,38.000 PLANE 19*19.070-7.970 -CARTES 0.000,0.000 29.500,0.000 \ -CIRC 29.500,2.5,2.5,10,10,10 \ -CARTES 32.000,2.500 32.000,4.000 32.000,8.000 32.000,12.000 32.000,16.000 32.000,20.000 32.000,24.000 32.000,28.000 32.000,32.000 32.000,36.000 32.000,38.000 0.000,38.000 $ 1ST-7.970metre PLANE 19*19.070 -CARTES 0.000,0.000 7.290,0.000 7.290,3.292 29.500,3.292 \ -CIRC 29.500,5.792,2.5,10,10,10 \ -CARTES 32.000,5.792 32.000,8.000 32.000,12.000 32.000,16.000 32.000,20.000 32.000,24.000 32.000,28.000 32.000,32.000 32.000,36.000 32.000,38.000 0.000,38.000 $ 1ST PLANE 19*19.070+4.768 -CARTES 0.000,0.000 7.290,0.000 7.290,5.187 29.500,5.187 \ -CIRC 29.500,7.687,2.5,10,10,10 \ -CARTES 32.000,7.687 32.000,8.000 32.000,12.000 32.000,16.000 32.000,20.000 32.000,24.000 32.000,28.000 32.000,32.000 32.000,36.000 32.000,38.000 0.000,38.000 $ 0.75ST PLANE 19*19.070+9.535 -CARTES 0.000,0.000 7.290,0.000 7.290,7.183 29.500,7.183 \ -CIRC 29.500,9.683,2.5,10,10,10 \ -CARTES 32.000,9.683 32.000,12.000 32.000,16.000 32.000,20.000 32.000,24.000 32.000,28.000 32.000,32.000 32.000,36.000 32.000,38.000 0.000,38.000 $ 0.5ST PLANE 19*19.070+14.303 -CARTES 0.000,0.000 7.290,0.000 7.290,9.078 29.500,9.078 \ -CIRC 29.500,11.578,2.5,10,10,10 \ -CARTES 32.000,11.578 32.000,12.000 32.000,16.000 32.000,20.000 32.000,24.000 32.000,28.000 32.000,32.000 32.000,36.000 32.000,38.000 0.000,38.000 $ 0.25ST PLANE 20*19.070 -CARTES 0.000,0.000 7.290,0.000 7.290,10.974 29.500,10.974 \ -CIRC 29.500,13.474,2.5,10,10,10 \ -CARTES 32.000,13.474 32.000,16.000 32.000,20.000 32.000,24.000 32.000,28.000 32.000,32.000 32.000,36.000 32.000,38.000 0.000,38.000 $ 0ST end_pgen
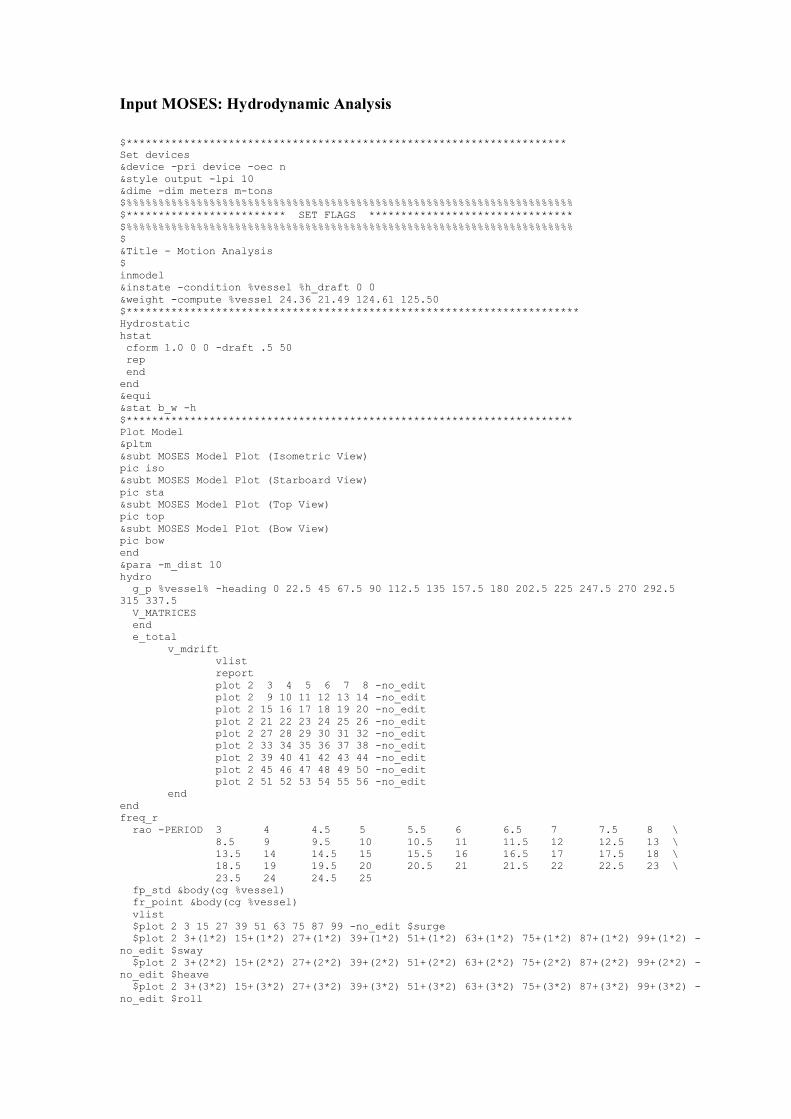
Input MOSES: Hydrodynamic Analysis
$********************************************************************* Set devices &device -pri device -oec n &style output -lpi 10 &dime -dim meters m-tons $%%%%%%%%%%%%%%%%%%%%%%%%%%%%%%%%%%%%%%%%%%%%%%%%%%%%%%%%%%%%%%%%%%%%%% $************************* SET FLAGS ******************************** $%%%%%%%%%%%%%%%%%%%%%%%%%%%%%%%%%%%%%%%%%%%%%%%%%%%%%%%%%%%%%%%%%%%%%% $ &Title - Motion Analysis $ inmodel &instate -condition %vessel %h_draft 0 0 &weight -compute %vessel 24.36 21.49 124.61 125.50 $*********************************************************************** Hydrostatic hstat cform 1.0 0 0 -draft .5 50 rep end end &equi &stat b_w -h $********************************************************************** Plot Model &pltm &subt MOSES Model Plot (Isometric View) pic iso &subt MOSES Model Plot (Starboard View) pic sta &subt MOSES Model Plot (Top View) pic top &subt MOSES Model Plot (Bow View) pic bow end ¶ -m_dist 10 hydro g_p %vessel% -heading 0 22.5 45 67.5 90 112.5 135 157.5 180 202.5 225 247.5 270 292.5 315 337.5 V_MATRICES end e_total v_mdrift vlist report plot 2 3 4 5 6 7 8 -no_edit plot 2 9 10 11 12 13 14 -no_edit plot 2 15 16 17 18 19 20 -no_edit plot 2 21 22 23 24 25 26 -no_edit plot 2 27 28 29 30 31 32 -no_edit plot 2 33 34 35 36 37 38 -no_edit plot 2 39 40 41 42 43 44 -no_edit plot 2 45 46 47 48 49 50 -no_edit plot 2 51 52 53 54 55 56 -no_edit end end freq_r rao -PERIOD 3 4 4.5 5 5.5 6 6.5 7 7.5 8 \
8.5 9 9.5 10 10.5 11 11.5 12 12.5 13 \ 13.5 14 14.5 15 15.5 16 16.5 17 17.5 18 \ 18.5 19 19.5 20 20.5 21 21.5 22 22.5 23 \ 23.5 24 24.5 25
fp_std &body(cg %vessel) fr_point &body(cg %vessel) vlist $plot 2 3 15 27 39 51 63 75 87 99 -no_edit $surge $plot 2 3+(1*2) 15+(1*2) 27+(1*2) 39+(1*2) 51+(1*2) 63+(1*2) 75+(1*2) 87+(1*2) 99+(1*2) -no_edit $sway $plot 2 3+(2*2) 15+(2*2) 27+(2*2) 39+(2*2) 51+(2*2) 63+(2*2) 75+(2*2) 87+(2*2) 99+(2*2) -no_edit $heave $plot 2 3+(3*2) 15+(3*2) 27+(3*2) 39+(3*2) 51+(3*2) 63+(3*2) 75+(3*2) 87+(3*2) 99+(3*2) -no_edit $roll

$plot 2 3+(4*2) 15+(4*2) 27+(4*2) 39+(4*2) 51+(4*2) 63+(4*2) 75+(4*2) 87+(4*2) 99+(4*2) -no_edit $pitch $plot 2 3+(5*2) 15+(5*2) 27+(5*2) 39+(5*2) 51+(5*2) 63+(5*2) 75+(5*2) 87+(5*2) 99+(5*2) -no_edit $yaw $end EQU_SUM matrices -file end exforce -file end end &finish

APPENDIX B
Hydrodynamic Output

Added Mass & Damping Matrix
$ MATRICES
$ Dimensions are Meters and M-Tons
Frequency 0.2513 Period 25.0000
Added Mass
3.48724E-02 -4.13437E-03 3.70014E-02 -1.44354E-01 2.73569E+01 2.06987E+00
1.01227E-02 8.34779E-01 -1.55124E-02 5.41115E+00 6.57567E-01 2.76388E+00
-1.19014E-02 -4.13757E-03 2.73604E+00 1.02429E-01 -2.24289E+00 -3.01195E+00
-1.44354E-01 5.41115E+00 1.02429E-01 2.83152E+02 -1.70434E+02 4.92151E+01
2.73569E+01 6.57567E-01 -2.24289E+00 5.65224E+01 3.01130E+04 -9.75587E+02
2.06987E+00 2.76388E+00 -3.01195E+00 -2.15764E+02 1.90427E+03 7.11682E+03
Damping
5.09544E-03 -2.24181E-04 1.76002E-02 -3.94614E-03 1.91633E+00 9.89303E-02
5.85666E-04 3.19471E-02 -6.87698E-03 4.12733E-01 1.18221E-02 -2.92984E+00
4.19212E-04 -7.25086E-05 4.96985E-01 4.26496E-02 5.53387E+00 -1.27614E+00
-3.94614E-03 4.12733E-01 4.26496E-02 2.16285E+01 -4.43812E+01 -7.18926E+01
1.91633E+00 1.18221E-02 5.53387E+00 4.05390E+01 4.36896E+03 -5.01105E+02
9.89303E-02 -2.92984E+00 -1.27614E+00 -7.68158E+01 4.01007E+02 1.43503E+03
Frequency 0.2565 Period 24.5000
Added Mass
3.47691E-02 -4.11737E-03 3.50622E-02 -1.43490E-01 2.70345E+01 2.05594E+00
1.00348E-02 8.41808E-01 -1.46961E-02 5.45804E+00 6.60155E-01 2.78087E+00
-1.18223E-02 -4.12716E-03 2.68202E+00 9.81088E-02 -2.17742E+00 -2.86777E+00
-1.43490E-01 5.45804E+00 9.81088E-02 2.83517E+02 -1.64159E+02 4.92802E+01
2.70345E+01 6.60155E-01 -2.17742E+00 5.18925E+01 2.98908E+04 -9.15598E+02
2.05594E+00 2.78087E+00 -2.86777E+00 -2.16721E+02 1.84699E+03 7.20721E+03
Damping
5.19913E-03 -2.55535E-04 1.74790E-02 -4.19962E-03 2.10680E+00 1.08492E-01
6.45629E-04 3.61097E-02 -6.85531E-03 4.27516E-01 1.42699E-02 -2.93388E+00
3.29541E-04 -9.87699E-05 5.03140E-01 4.20420E-02 5.50462E+00 -1.27271E+00
-4.19962E-03 4.27516E-01 4.20420E-02 2.17908E+01 -4.53061E+01 -7.21580E+01
2.10680E+00 1.42699E-02 5.50462E+00 4.02794E+01 4.49911E+03 -4.99060E+02
1.08492E-01 -2.93388E+00 -1.27271E+00 -7.82120E+01 4.13891E+02 1.44854E+03
Frequency 0.2618 Period 24.0000
Added Mass
3.46615E-02 -4.09966E-03 3.30423E-02 -1.42590E-01 2.66986E+01 2.04143E+00
9.94331E-03 8.49130E-01 -1.38457E-02 5.50687E+00 6.62850E-01 2.79855E+00
-1.17400E-02 -4.11633E-03 2.62576E+00 9.36082E-02 -2.10928E+00 -2.71758E+00
-1.42590E-01 5.50687E+00 9.36082E-02 2.83896E+02 -1.57623E+02 4.93478E+01
2.66986E+01 6.62850E-01 -2.10928E+00 4.70698E+01 2.96592E+04 -8.53109E+02
2.04143E+00 2.79855E+00 -2.71758E+00 -2.17718E+02 1.78731E+03 7.30137E+03
Damping
5.31982E-03 -2.88195E-04 1.73526E-02 -4.46366E-03 2.30490E+00 1.18452E-01
7.08090E-04 4.04879E-02 -6.83273E-03 4.43941E-01 1.68198E-02 -2.94614E+00
2.36134E-04 -1.26125E-04 5.09750E-01 4.14099E-02 5.51212E+00 -1.26914E+00
-4.46366E-03 4.43941E-01 4.14099E-02 2.20494E+01 -4.62695E+01 -7.26306E+01
2.30490E+00 1.68198E-02 5.51212E+00 4.00090E+01 4.65305E+03 -4.96929E+02
1.18452E-01 -2.94614E+00 -1.26914E+00 -7.98626E+01 4.27311E+02 1.46713E+03
Frequency 0.2674 Period 23.5000
Added Mass
3.45494E-02 -4.08120E-03 3.09364E-02 -1.41652E-01 2.63483E+01 2.02629E+00
9.84790E-03 8.56764E-01 -1.29592E-02 5.55778E+00 6.65661E-01 2.81700E+00
-1.16542E-02 -4.10503E-03 2.56710E+00 8.89162E-02 -2.03812E+00 -2.56100E+00
-1.41652E-01 5.55778E+00 8.89162E-02 2.84292E+02 -1.50808E+02 4.94185E+01
2.63483E+01 6.65661E-01 -2.03812E+00 4.20419E+01 2.94179E+04 -7.87961E+02
2.02629E+00 2.81700E+00 -2.56100E+00 -2.18758E+02 1.72510E+03 7.39953E+03
Damping
5.45710E-03 -3.22244E-04 1.72209E-02 -4.73894E-03 2.51115E+00 1.28835E-01
7.73209E-04 4.50620E-02 -6.80919E-03 4.61299E-01 1.94781E-02 -2.96075E+00
1.38752E-04 -1.54645E-04 5.16743E-01 4.07512E-02 5.53940E+00 -1.26542E+00
-4.73894E-03 4.61299E-01 4.07512E-02 2.23659E+01 -4.72737E+01 -7.31681E+01
2.51115E+00 1.94781E-02 5.53940E+00 3.97273E+01 4.82410E+03 -4.94708E+02
1.28835E-01 -2.96075E+00 -1.26542E+00 -8.16282E+01 4.41302E+02 1.48822E+03
Frequency 0.2732 Period 23.0000
Added Mass
3.44323E-02 -4.06194E-03 2.87390E-02 -1.40673E-01 2.59829E+01 2.01050E+00
9.74833E-03 8.64729E-01 -1.20341E-02 5.61091E+00 6.68594E-01 2.83625E+00
-1.15646E-02 -4.09323E-03 2.50589E+00 8.40201E-02 -1.96391E+00 -2.39760E+00
-1.40673E-01 5.61091E+00 8.40201E-02 2.84705E+02 -1.43698E+02 4.94918E+01
2.59829E+01 6.68594E-01 -1.96391E+00 3.67953E+01 2.91660E+04 -7.19980E+02
2.01050E+00 2.83625E+00 -2.39760E+00 -2.19843E+02 1.66019E+03 7.50196E+03
Damping
5.61169E-03 -3.57774E-04 1.70834E-02 -5.02618E-03 2.72608E+00 1.39670E-01
8.41159E-04 4.98249E-02 -6.78462E-03 4.79164E-01 2.22520E-02 -2.97406E+00
3.71366E-05 -1.84405E-04 5.24084E-01 4.00641E-02 5.57618E+00 -1.26154E+00
-5.02618E-03 4.79164E-01 4.00641E-02 2.27264E+01 -4.83215E+01 -7.36816E+01
2.72608E+00 2.22520E-02 5.57618E+00 3.94333E+01 5.00870E+03 -4.92390E+02
1.39670E-01 -2.97406E+00 -1.26154E+00 -8.34232E+01 4.55901E+02 1.51033E+03
Frequency 0.2793 Period 22.5000
Added Mass
3.43101E-02 -4.04182E-03 2.64439E-02 -1.39651E-01 2.56012E+01 1.99401E+00
9.64435E-03 8.73049E-01 -1.10679E-02 5.66639E+00 6.71657E-01 2.85634E+00
-1.14711E-02 -4.08092E-03 2.44197E+00 7.89065E-02 -1.88641E+00 -2.22695E+00
-1.39651E-01 5.66639E+00 7.89065E-02 2.85136E+02 -1.36271E+02 4.95689E+01
2.56012E+01 6.71657E-01 -1.88641E+00 3.13156E+01 2.89030E+04 -6.48978E+02
1.99401E+00 2.85634E+00 -2.22695E+00 -2.20976E+02 1.59239E+03 7.60895E+03
Damping
5.78605E-03 -3.94883E-04 1.69399E-02 -5.32619E-03 2.95026E+00 1.50987E-01
9.12129E-04 5.47825E-02 -6.75897E-03 4.97414E-01 2.51492E-02 -2.98475E+00
-6.89953E-05 -2.15487E-04 5.31769E-01 3.93466E-02 5.61818E+00 -1.25749E+00
-5.32619E-03 4.97414E-01 3.93466E-02 2.31519E+01 -4.94160E+01 -7.41396E+01
2.95026E+00 2.51492E-02 5.61818E+00 3.91263E+01 5.20621E+03 -4.89969E+02
1.50987E-01 -2.98475E+00 -1.25749E+00 -8.52196E+01 4.71150E+02 1.53315E+03

Frequency 0.2856 Period 22.0000
Added Mass
3.41823E-02 -4.02078E-03 2.40444E-02 -1.38582E-01 2.52022E+01 1.97677E+00
9.53564E-03 8.81747E-01 -1.00578E-02 5.72440E+00 6.74859E-01 2.87735E+00
-1.13733E-02 -4.06804E-03 2.37513E+00 7.35604E-02 -1.80546E+00 -2.04854E+00
-1.38582E-01 5.72440E+00 7.35604E-02 2.85587E+02 -1.28507E+02 4.96492E+01
2.52022E+01 6.74859E-01 -1.80546E+00 2.55868E+01 2.86279E+04 -5.74748E+02
1.97677E+00 2.87735E+00 -2.04854E+00 -2.22160E+02 1.52150E+03 7.72080E+03
Damping
6.18897E-03 -4.33679E-04 1.67898E-02 -5.63984E-03 3.17925E+00 1.62817E-01
9.86325E-04 5.99372E-02 -6.73214E-03 5.15801E-01 2.81781E-02 -2.99048E+00
-1.79952E-04 -2.47982E-04 5.39772E-01 3.85962E-02 5.65592E+00 -1.25325E+00
-5.63984E-03 5.15801E-01 3.85962E-02 2.37229E+01 -5.05602E+01 -7.44860E+01
3.17925E+00 2.81781E-02 5.65592E+00 3.88053E+01 5.43869E+03 -4.87439E+02
1.62817E-01 -2.99048E+00 -1.25325E+00 -8.69653E+01 4.87091E+02 1.56836E+03
Frequency 0.2922 Period 21.5000
Added Mass
3.40485E-02 -3.99876E-03 2.15334E-02 -1.37463E-01 2.47846E+01 1.95873E+00
9.42187E-03 8.90849E-01 -9.00067E-03 5.78511E+00 6.78210E-01 2.89935E+00
-1.12709E-02 -4.05457E-03 2.30519E+00 6.79656E-02 -1.72066E+00 -1.86184E+00
-1.37463E-01 5.78511E+00 6.79656E-02 2.86059E+02 -1.20382E+02 4.97333E+01
2.47846E+01 6.78210E-01 -1.72066E+00 1.95915E+01 2.83401E+04 -4.97067E+02
1.95873E+00 2.89935E+00 -1.86184E+00 -2.23400E+02 1.44732E+03 7.83784E+03
Damping
6.43906E-03 -4.74279E-04 1.66327E-02 -5.96808E-03 3.42308E+00 1.75198E-01
1.06397E-03 6.54628E-02 -6.70407E-03 5.38239E-01 3.13479E-02 -3.02159E+00
-2.96068E-04 -2.81988E-04 5.48468E-01 3.78123E-02 5.75680E+00 -1.24882E+00
-5.96808E-03 5.38239E-01 3.78123E-02 2.46289E+01 -5.17573E+01 -7.54600E+01
3.42308E+00 3.13479E-02 5.75680E+00 3.84697E+01 5.69371E+03 -4.84790E+02
1.75198E-01 -3.02159E+00 -1.24882E+00 -8.94037E+01 5.03774E+02 1.60859E+03
Frequency 0.2992 Period 21.0000
Added Mass
3.39084E-02 -3.97570E-03 1.89028E-02 -1.36291E-01 2.43472E+01 1.93983E+00
9.30268E-03 9.00385E-01 -7.89323E-03 5.84871E+00 6.81721E-01 2.92238E+00
-1.11637E-02 -4.04045E-03 2.23191E+00 6.21044E-02 -1.63190E+00 -1.66624E+00
-1.36291E-01 5.84871E+00 6.21044E-02 2.86554E+02 -1.11869E+02 4.98209E+01
2.43472E+01 6.81721E-01 -1.63190E+00 1.33108E+01 2.80386E+04 -4.15685E+02
1.93983E+00 2.92238E+00 -1.66624E+00 -2.24699E+02 1.36961E+03 7.96048E+03
Damping
6.83691E-03 -5.16813E-04 1.64681E-02 -6.31194E-03 3.67520E+00 1.88168E-01
1.14532E-03 7.12034E-02 -6.67467E-03 5.60576E-01 3.46686E-02 -3.04498E+00
-4.17715E-04 -3.17614E-04 5.57573E-01 3.69910E-02 5.86153E+00 -1.24417E+00
-6.31194E-03 5.60576E-01 3.69910E-02 2.52199E+01 -5.30115E+01 -7.62565E+01
3.67520E+00 3.46686E-02 5.86153E+00 3.81180E+01 5.99192E+03 -4.82015E+02
1.88168E-01 -3.04498E+00 -1.24417E+00 -9.17343E+01 5.21252E+02 1.66258E+03
Frequency 0.3065 Period 20.5000
Added Mass
3.37615E-02 -3.95151E-03 1.61439E-02 -1.35062E-01 2.38884E+01 1.92001E+00
9.17768E-03 9.10386E-01 -6.73177E-03 5.91541E+00 6.85403E-01 2.94654E+00
-1.10513E-02 -4.02565E-03 2.15507E+00 5.59574E-02 -1.53873E+00 -1.46110E+00
-1.35062E-01 5.91541E+00 5.59574E-02 2.87072E+02 -1.02942E+02 4.99134E+01
2.38884E+01 6.85403E-01 -1.53873E+00 6.72363E+00 2.77224E+04 -3.30334E+02
1.92001E+00 2.94654E+00 -1.46110E+00 -2.26061E+02 1.28811E+03 8.08908E+03
Damping
7.22751E-03 -5.61421E-04 1.62956E-02 -6.67259E-03 3.94027E+00 2.01771E-01
1.23063E-03 7.71914E-02 -6.64383E-03 5.83204E-01 3.81513E-02 -3.06325E+00
-5.45295E-04 -3.54978E-04 5.67165E-01 3.61298E-02 5.97952E+00 -1.23930E+00
-6.67259E-03 5.83204E-01 3.61298E-02 2.54214E+01 -5.43268E+01 -7.69392E+01
3.94027E+00 3.81513E-02 5.97952E+00 3.77492E+01 6.31680E+03 -4.79105E+02
2.01771E-01 -3.06325E+00 -1.23930E+00 -9.40260E+01 5.39582E+02 1.71830E+03
Frequency 0.3142 Period 20.0000
Added Mass
3.36072E-02 -3.92612E-03 1.32470E-02 -1.33772E-01 2.34066E+01 1.89919E+00
9.04643E-03 9.20887E-01 -5.51223E-03 5.98544E+00 6.89269E-01 2.97192E+00
-1.09332E-02 -4.01011E-03 2.07438E+00 4.95029E-02 -1.44092E+00 -1.24571E+00
-1.33772E-01 5.98544E+00 4.95029E-02 2.87616E+02 -9.35679E+01 5.00109E+01
2.34066E+01 6.89269E-01 -1.44092E+00 -1.92864E-01 2.73904E+04 -2.40716E+02
1.89919E+00 2.97192E+00 -1.24571E+00 -2.27491E+02 1.20253E+03 8.22411E+03
Damping
7.62713E-03 -6.08260E-04 1.61144E-02 -7.05126E-03 4.21885E+00 2.16054E-01
1.32021E-03 8.35769E-02 -6.61144E-03 6.09355E-01 4.18082E-02 -3.10121E+00
-6.79254E-04 -3.94209E-04 5.77481E-01 3.52265E-02 6.15033E+00 -1.23418E+00
-7.05126E-03 6.09355E-01 3.52265E-02 2.59058E+01 -5.57077E+01 -7.81135E+01
4.21885E+00 4.18082E-02 6.15033E+00 3.73622E+01 6.69143E+03 -4.76049E+02
2.16054E-01 -3.10121E+00 -1.23418E+00 -9.68897E+01 5.58828E+02 1.78992E+03
Frequency 0.3222 Period 19.5000
Added Mass
3.32701E-02 -3.82777E-03 1.22979E-02 -1.32187E-01 2.25695E+01 1.86320E+00
8.80526E-03 9.25236E-01 -4.99197E-03 6.05306E+00 6.86370E-01 2.96335E+00
-1.04806E-02 -3.89236E-03 2.00665E+00 4.84365E-02 -1.37705E+00 -1.15082E+00
-1.32187E-01 6.05306E+00 4.84365E-02 2.88040E+02 -8.56704E+01 4.95507E+01
2.25695E+01 6.86370E-01 -1.37705E+00 -2.43761E+00 2.67689E+04 -2.02587E+02
1.86320E+00 2.96335E+00 -1.15082E+00 -2.27142E+02 1.11644E+03 8.40614E+03
Damping
7.82445E-03 -6.61730E-04 1.55252E-02 -7.24171E-03 4.47179E+00 2.28779E-01
1.39721E-03 9.44338E-02 -6.39622E-03 6.54594E-01 4.83942E-02 -3.11350E+00
-7.72479E-04 -4.35299E-04 5.78471E-01 3.34604E-02 6.23700E+00 -1.19864E+00
-7.24171E-03 6.54594E-01 3.34604E-02 2.64260E+01 -5.57724E+01 -7.89249E+01
4.47179E+00 4.83942E-02 6.23700E+00 3.59464E+01 6.94921E+03 -4.59219E+02
2.28779E-01 -3.11350E+00 -1.19864E+00 -1.00299E+02 5.67663E+02 1.86045E+03
Frequency 0.3307 Period 19.0000
Added Mass
3.29153E-02 -3.72424E-03 1.12989E-02 -1.30519E-01 2.16884E+01 1.82531E+00
8.55139E-03 9.29814E-01 -4.44433E-03 6.12424E+00 6.83318E-01 2.95432E+00
-1.00042E-02 -3.76842E-03 1.93535E+00 4.73140E-02 -1.30992E+00 -1.05094E+00
-1.30519E-01 6.12424E+00 4.73140E-02 2.88486E+02 -7.73573E+01 4.90658E+01
2.16884E+01 6.83318E-01 -1.30992E+00 -4.80050E+00 2.61148E+04 -1.62451E+02
1.82531E+00 2.95432E+00 -1.05094E+00 -2.26776E+02 1.02581E+03 8.59776E+03
Damping
8.08384E-03 -7.18013E-04 1.49050E-02 -7.44219E-03 4.73679E+00 2.42175E-01
1.47827E-03 1.05886E-01 -6.16967E-03 7.02801E-01 5.53268E-02 -3.13105E+00
-8.70610E-04 -4.78552E-04 5.79682E-01 3.16021E-02 6.36065E+00 -1.16124E+00

-7.44219E-03 7.02801E-01 3.16021E-02 2.71623E+01 -5.58403E+01 -7.98915E+01
4.73679E+00 5.53268E-02 6.36065E+00 3.44563E+01 7.24782E+03 -4.41502E+02
2.42175E-01 -3.13105E+00 -1.16124E+00 -1.04000E+02 5.76963E+02 1.94287E+03
Frequency 0.3396 Period 18.5000
Added Mass
3.25421E-02 -3.59505E-03 1.12270E-02 -1.28970E-01 2.06950E+01 1.78516E+00
8.27997E-03 9.28880E-01 -4.26125E-03 6.18319E+00 6.74272E-01 2.92219E+00
-9.49628E-03 -3.61496E-03 1.87257E+00 4.84413E-02 -1.28192E+00 -1.01336E+00
-1.28970E-01 6.18319E+00 4.84413E-02 2.88798E+02 -7.04734E+01 4.83858E+01
2.06950E+01 6.74272E-01 -1.28192E+00 -4.91112E+00 2.53541E+04 -1.49645E+02
1.78516E+00 2.92219E+00 -1.01336E+00 -2.25106E+02 9.41358E+02 8.79738E+03
Damping
8.23193E-03 -7.70680E-04 1.42811E-02 -7.52845E-03 4.95769E+00 2.53614E-01
1.54270E-03 1.19730E-01 -5.92665E-03 7.63712E-01 6.31832E-02 -3.13249E+00
-9.08854E-04 -5.07965E-04 5.76568E-01 2.98712E-02 6.43704E+00 -1.12094E+00
-7.52845E-03 7.63712E-01 2.98712E-02 2.78751E+01 -5.54425E+01 -8.06233E+01
4.95769E+00 6.31832E-02 6.43704E+00 3.29709E+01 7.48782E+03 -4.22241E+02
2.53614E-01 -3.13249E+00 -1.12094E+00 -1.07811E+02 5.81513E+02 2.04652E+03
Frequency 0.3491 Period 18.0000
Added Mass
3.21482E-02 -3.45868E-03 1.11512E-02 -1.27336E-01 1.96465E+01 1.74278E+00
7.99347E-03 9.27894E-01 -4.06799E-03 6.24541E+00 6.64722E-01 2.88827E+00
-8.96009E-03 -3.45298E-03 1.80630E+00 4.96312E-02 -1.25237E+00 -9.73683E-01
-1.27336E-01 6.24541E+00 4.96312E-02 2.89127E+02 -6.32071E+01 4.76679E+01
1.96465E+01 6.64722E-01 -1.25237E+00 -5.02788E+00 2.45511E+04 -1.36128E+02
1.74278E+00 2.88827E+00 -9.73683E-01 -2.23343E+02 8.52211E+02 9.00809E+03
Damping
8.45063E-03 -8.26273E-04 1.36226E-02 -7.61951E-03 5.18934E+00 2.65689E-01
1.61071E-03 1.34353E-01 -5.67013E-03 8.28248E-01 7.14761E-02 -3.13590E+00
-9.49223E-04 -5.39011E-04 5.73438E-01 2.80449E-02 6.54793E+00 -1.07841E+00
-7.61951E-03 8.28248E-01 2.80449E-02 2.87175E+01 -5.50224E+01 -8.14417E+01
5.18934E+00 7.14761E-02 6.54793E+00 3.14031E+01 7.76622E+03 -4.01910E+02
2.65689E-01 -3.13590E+00 -1.07841E+00 -1.11880E+02 5.86316E+02 2.16205E+03
Frequency 0.3590 Period 17.5000
Added Mass
3.18158E-02 -3.31202E-03 1.18805E-02 -1.26052E-01 1.85441E+01 1.70299E+00
7.72376E-03 9.18869E-01 -4.19851E-03 6.28170E+00 6.48179E-01 2.82785E+00
-8.51112E-03 -3.29487E-03 1.75241E+00 5.24774E-02 -1.26189E+00 -9.90642E-01
-1.26052E-01 6.28170E+00 5.24774E-02 2.89233E+02 -5.76304E+01 4.69279E+01
1.85441E+01 6.48179E-01 -1.26189E+00 -3.32596E+00 2.36621E+04 -1.47711E+02
1.70299E+00 2.82785E+00 -9.90642E-01 -2.19885E+02 7.72305E+02 9.19324E+03
Damping
8.51269E-03 -8.73644E-04 1.31355E-02 -7.60378E-03 5.34153E+00 2.75132E-01
1.65530E-03 1.51266E-01 -5.46255E-03 9.07773E-01 7.96096E-02 -3.11887E+00
-9.15446E-04 -5.47366E-04 5.65935E-01 2.67844E-02 6.58276E+00 -1.04464E+00
-7.60378E-03 9.07773E-01 2.67844E-02 2.94690E+01 -5.42798E+01 -8.19054E+01
5.34153E+00 7.96096E-02 6.58276E+00 3.02630E+01 7.95372E+03 -3.84853E+02
2.75132E-01 -3.11887E+00 -1.04464E+00 -1.15799E+02 5.86105E+02 2.31305E+03
Frequency 0.3696 Period 17.0000
Added Mass
3.14638E-02 -3.15674E-03 1.26528E-02 -1.24692E-01 1.73769E+01 1.66086E+00
7.43820E-03 9.09313E-01 -4.33670E-03 6.32012E+00 6.30662E-01 2.76389E+00
-8.03575E-03 -3.12745E-03 1.69534E+00 5.54910E-02 -1.27198E+00 -1.00860E+00
-1.24692E-01 6.32012E+00 5.54910E-02 2.89345E+02 -5.17255E+01 4.61446E+01
1.73769E+01 6.30662E-01 -1.27198E+00 -1.52393E+00 2.27209E+04 -1.59976E+02
1.66086E+00 2.76389E+00 -1.00860E+00 -2.16224E+02 6.87699E+02 9.38927E+03
Damping
8.65441E-03 -9.23801E-04 1.26197E-02 -7.58712E-03 5.50081E+00 2.85130E-01
1.70252E-03 1.69176E-01 -5.24277E-03 9.92048E-01 8.82215E-02 -3.10140E+00
-8.79683E-04 -5.56211E-04 5.58153E-01 2.54504E-02 6.65061E+00 -1.00888E+00
-7.58712E-03 9.92048E-01 2.54504E-02 3.03458E+01 -5.34934E+01 -8.24101E+01
5.50081E+00 8.82215E-02 6.65061E+00 2.90559E+01 8.17439E+03 -3.66792E+02
2.85130E-01 -3.10140E+00 -1.00888E+00 -1.19962E+02 5.85882E+02 2.47684E+03
Frequency 0.3808 Period 16.5000
Added Mass
3.13083E-02 -3.01731E-03 1.37568E-02 -1.23919E-01 1.62788E+01 1.62801E+00
7.21774E-03 8.89638E-01 -4.62271E-03 6.31562E+00 6.08092E-01 2.67835E+00
-7.77255E-03 -3.01169E-03 1.65331E+00 5.87438E-02 -1.28546E+00 -1.05084E+00
-1.23919E-01 6.31562E+00 5.87438E-02 2.89141E+02 -4.73804E+01 4.56713E+01
1.62788E+01 6.08092E-01 -1.28546E+00 8.41501E-01 2.17401E+04 -1.85001E+02
1.62801E+00 2.67835E+00 -1.05084E+00 -2.10672E+02 6.14990E+02 9.48738E+03
Damping
8.60899E-03 -9.66010E-04 1.24679E-02 -7.55369E-03 5.53935E+00 2.93280E-01
1.72720E-03 1.88610E-01 -5.13656E-03 1.09139E+00 9.49739E-02 -3.06006E+00
-7.86765E-04 -5.42667E-04 5.46795E-01 2.50865E-02 6.61179E+00 -9.94466E-01
-7.55369E-03 1.09139E+00 2.50865E-02 3.10606E+01 -5.25258E+01 -8.23678E+01
5.53935E+00 9.49739E-02 6.61179E+00 2.86501E+01 8.26455E+03 -3.57107E+02
2.93280E-01 -3.06006E+00 -9.94466E-01 -1.23585E+02 5.79777E+02 2.69129E+03
Frequency 0.3927 Period 16.0000
Added Mass
3.11429E-02 -2.86918E-03 1.49298E-02 -1.23096E-01 1.51121E+01 1.59309E+00
6.98352E-03 8.68733E-01 -4.92660E-03 6.31083E+00 5.84112E-01 2.58746E+00
-7.49290E-03 -2.88869E-03 1.60866E+00 6.21998E-02 -1.29974E+00 -1.09572E+00
-1.23096E-01 6.31083E+00 6.21998E-02 2.88924E+02 -4.27636E+01 4.51685E+01
1.51121E+01 5.84112E-01 -1.29974E+00 3.35477E+00 2.06979E+04 -2.11590E+02
1.59309E+00 2.58746E+00 -1.09572E+00 -2.04775E+02 5.37738E+02 9.59162E+03
Damping
8.65221E-03 -1.01086E-03 1.23066E-02 -7.51816E-03 5.57806E+00 3.01940E-01
1.75342E-03 2.09249E-01 -5.02371E-03 1.19670E+00 1.02148E-01 -3.01427E+00
-6.88039E-04 -5.28276E-04 5.34882E-01 2.47005E-02 6.60030E+00 -9.79148E-01
-7.51816E-03 1.19670E+00 2.47005E-02 3.19009E+01 -5.14977E+01 -8.22772E+01
5.57806E+00 1.02148E-01 6.60030E+00 2.82190E+01 8.37531E+03 -3.46816E+02
3.01940E-01 -3.01427E+00 -9.79148E-01 -1.27387E+02 5.73289E+02 2.91874E+03
Frequency 0.4054 Period 15.5000
Added Mass
3.13108E-02 -2.75575E-03 1.56496E-02 -1.22880E-01 1.42278E+01 1.57113E+00
6.85784E-03 8.37484E-01 -5.12548E-03 6.24905E+00 5.60743E-01 2.48912E+00
-7.48317E-03 -2.85076E-03 1.57888E+00 6.39519E-02 -1.25467E+00 -1.11289E+00
-1.22880E-01 6.24905E+00 6.39519E-02 2.88327E+02 -3.95514E+01 4.52491E+01
1.42278E+01 5.60743E-01 -1.25467E+00 4.81996E+00 1.97130E+04 -2.31690E+02
1.57113E+00 2.48912E+00 -1.11289E+00 -1.97148E+02 4.79360E+02 9.48482E+03

Damping
8.53928E-03 -1.06271E-03 1.25980E-02 -7.72353E-03 5.47612E+00 3.13216E-01
1.77790E-03 2.29884E-01 -5.04341E-03 1.31297E+00 1.06449E-01 -2.93911E+00
-5.93888E-04 -5.09295E-04 5.20880E-01 2.52960E-02 6.47730E+00 -9.87900E-01
-7.72353E-03 1.31297E+00 2.52960E-02 3.24973E+01 -5.03435E+01 -8.12786E+01
5.47612E+00 1.06449E-01 6.47730E+00 2.86256E+01 8.31789E+03 -3.46930E+02
3.13216E-01 -2.93911E+00 -9.87900E-01 -1.30186E+02 5.59816E+02 3.19618E+03
Frequency 0.4189 Period 15.0000
Added Mass
3.14899E-02 -2.63476E-03 1.64174E-02 -1.22650E-01 1.32846E+01 1.54770E+00
6.72378E-03 8.04150E-01 -5.33761E-03 6.18315E+00 5.35816E-01 2.38422E+00
-7.47280E-03 -2.81029E-03 1.54712E+00 6.58208E-02 -1.20663E+00 -1.13120E+00
-1.22650E-01 6.18315E+00 6.58208E-02 2.87690E+02 -3.61249E+01 4.53352E+01
1.32846E+01 5.35816E-01 -1.20663E+00 6.38284E+00 1.86624E+04 -2.53131E+02
1.54770E+00 2.38422E+00 -1.13120E+00 -1.89013E+02 4.17089E+02 9.37090E+03
Damping
8.52666E-03 -1.11802E-03 1.29087E-02 -7.94259E-03 5.36475E+00 3.25243E-01
1.80401E-03 2.51862E-01 -5.06442E-03 1.43618E+00 1.11037E-01 -2.85260E+00
-4.93460E-04 -4.89048E-04 5.06071E-01 2.59318E-02 6.37022E+00 -9.97236E-01
-7.94259E-03 1.43618E+00 2.59318E-02 3.32071E+01 -4.91123E+01 -8.00591E+01
5.36475E+00 1.11037E-01 6.37022E+00 2.90595E+01 8.25780E+03 -3.47051E+02
3.25243E-01 -2.85260E+00 -9.97236E-01 -1.33017E+02 5.45445E+02 3.48418E+03
Frequency 0.4333 Period 14.5000
Added Mass
3.19226E-02 -2.51648E-03 1.63247E-02 -1.22448E-01 1.26986E+01 1.52728E+00
6.66586E-03 7.63776E-01 -5.33440E-03 6.07069E+00 5.14417E-01 2.27341E+00
-7.62028E-03 -2.82691E-03 1.52426E+00 6.54500E-02 -1.10533E+00 -1.10202E+00
-1.22448E-01 6.07069E+00 6.54500E-02 2.86747E+02 -3.37554E+01 4.55661E+01
1.26986E+01 5.14417E-01 -1.10533E+00 6.39294E+00 1.77392E+04 -2.58442E+02
1.52728E+00 2.27341E+00 -1.10202E+00 -1.79759E+02 3.75218E+02 9.02651E+03
Damping
8.50208E-03 -1.20037E-03 1.34812E-02 -8.60416E-03 5.17674E+00 3.44492E-01
1.85989E-03 2.73070E-01 -5.15820E-03 1.56455E+00 1.14271E-01 -2.73090E+00
-4.57814E-04 -4.88024E-04 4.90347E-01 2.69384E-02 6.20142E+00 -1.01591E+00
-8.60416E-03 1.56455E+00 2.69384E-02 3.37018E+01 -4.78287E+01 -7.76914E+01
5.17674E+00 1.14271E-01 6.20142E+00 2.98913E+01 8.05373E+03 -3.53177E+02
3.44492E-01 -2.73090E+00 -1.01591E+00 -1.34756E+02 5.26760E+02 3.78528E+03
Frequency 0.4488 Period 14.0000
Added Mass
3.24288E-02 -2.35169E-03 1.54932E-02 -1.21694E-01 1.23770E+01 1.49839E+00
6.62007E-03 7.19040E-01 -5.14536E-03 5.92832E+00 4.94951E-01 2.14459E+00
-7.78598E-03 -2.85103E-03 1.50526E+00 6.35140E-02 -1.00062E+00 -1.03903E+00
-1.21694E-01 5.92832E+00 6.35140E-02 2.85597E+02 -3.19794E+01 4.53384E+01
1.23770E+01 4.94951E-01 -1.00062E+00 5.22421E+00 1.69431E+04 -2.49598E+02
1.49839E+00 2.14459E+00 -1.03903E+00 -1.69754E+02 3.47462E+02 8.51656E+03
Damping
8.56693E-03 -1.31215E-03 1.40918E-02 -9.65088E-03 4.98663E+00 3.70560E-01
1.95853E-03 2.93822E-01 -5.26758E-03 1.69638E+00 1.17760E-01 -2.57359E+00
-5.00630E-04 -5.15634E-04 4.73896E-01 2.77884E-02 6.00607E+00 -1.03169E+00
-9.65088E-03 1.69638E+00 2.77884E-02 3.40579E+01 -4.65844E+01 -7.42364E+01
4.98663E+00 1.17760E-01 6.00607E+00 3.07470E+01 7.75382E+03 -3.60594E+02
3.70560E-01 -2.57359E+00 -1.03169E+00 -1.35570E+02 5.07373E+02 4.06587E+03
Frequency 0.4654 Period 13.5000
Added Mass
3.28517E-02 -2.08514E-03 1.39805E-02 -1.19877E-01 1.22783E+01 1.45222E+00
6.52904E-03 6.70501E-01 -4.76579E-03 5.75975E+00 4.75675E-01 1.97635E+00
-7.85073E-03 -2.83246E-03 1.48898E+00 6.05003E-02 -9.37256E-01 -9.51239E-01
-1.19877E-01 5.75975E+00 6.05003E-02 2.84256E+02 -3.05774E+01 4.39305E+01
1.22783E+01 4.75675E-01 -9.37256E-01 3.03342E+00 1.63085E+04 -2.26919E+02
1.45222E+00 1.97635E+00 -9.51239E-01 -1.59168E+02 3.31005E+02 7.87508E+03
Damping
8.75863E-03 -1.44621E-03 1.45645E-02 -1.09673E-02 4.85181E+00 4.01512E-01
2.11090E-03 3.14064E-01 -5.35040E-03 1.83165E+00 1.22399E-01 -2.38018E+00
-6.31854E-04 -5.78725E-04 4.56521E-01 2.80728E-02 5.78253E+00 -1.03644E+00
-1.09673E-02 1.83165E+00 2.80728E-02 3.42670E+01 -4.54460E+01 -6.97045E+01
4.85181E+00 1.22399E-01 5.78253E+00 3.13539E+01 7.37491E+03 -3.65963E+02
4.01512E-01 -2.38018E+00 -1.03644E+00 -1.35328E+02 4.89614E+02 4.29564E+03
Frequency 0.4833 Period 13.0000
Added Mass
3.30074E-02 -1.67586E-03 1.20979E-02 -1.16767E-01 1.22861E+01 1.38555E+00
6.32279E-03 6.17964E-01 -4.24673E-03 5.56557E+00 4.52809E-01 1.74951E+00
-7.68349E-03 -2.70824E-03 1.47464E+00 5.74988E-02 -9.47689E-01 -8.56391E-01
-1.16767E-01 5.56557E+00 5.74988E-02 2.82730E+02 -2.93131E+01 4.07638E+01
1.22861E+01 4.52809E-01 -9.47689E-01 3.73518E-01 1.58378E+04 -1.95234E+02
1.38555E+00 1.74951E+00 -8.56391E-01 -1.48132E+02 3.20809E+02 7.17235E+03
Damping
9.03783E-03 -1.56858E-03 1.47111E-02 -1.22106E-02 4.82221E+00 4.31953E-01
2.30977E-03 3.33551E-01 -5.34866E-03 1.96667E+00 1.28655E-01 -2.11316E+00
-8.12320E-04 -6.63300E-04 4.37231E-01 2.74698E-02 5.43437E+00 -1.02342E+00
-1.22106E-02 1.96667E+00 2.74698E-02 3.40405E+01 -4.43745E+01 -6.32827E+01
4.82221E+00 1.28655E-01 5.43437E+00 3.14319E+01 6.90798E+03 -3.65372E+02
4.31953E-01 -2.11316E+00 -1.02342E+00 -1.32734E+02 4.74632E+02 4.43121E+03
Frequency 0.5027 Period 12.5000
Added Mass
3.27512E-02 -1.15434E-03 1.04132E-02 -1.12856E-01 1.22423E+01 1.30602E+00
5.95431E-03 5.60426E-01 -3.73342E-03 5.33814E+00 4.20722E-01 1.46441E+00
-7.26265E-03 -2.45504E-03 1.46239E+00 5.60253E-02 -1.03056E+00 -7.78953E-01
-1.12856E-01 5.33814E+00 5.60253E-02 2.81001E+02 -2.82434E+01 3.60138E+01
1.22423E+01 4.20722E-01 -1.03056E+00 -1.81509E+00 1.55002E+04 -1.64641E+02
1.30602E+00 1.46441E+00 -7.78953E-01 -1.36849E+02 3.13352E+02 6.49525E+03
Damping
9.22566E-03 -1.62056E-03 1.44406E-02 -1.29183E-02 4.91366E+00 4.55375E-01
2.52015E-03 3.50942E-01 -5.21101E-03 2.08231E+00 1.34966E-01 -1.61820E+00
-9.31897E-04 -7.21451E-04 4.13560E-01 2.60589E-02 4.64361E+00 -9.90412E-01
-1.29183E-02 2.08231E+00 2.60589E-02 3.23388E+01 -4.32697E+01 -5.13556E+01
4.91366E+00 1.34966E-01 4.64361E+00 3.08960E+01 6.26029E+03 -3.56067E+02
4.55375E-01 -1.61820E+00 -9.90412E-01 -1.23318E+02 4.62205E+02 4.40113E+03
Frequency 0.5236 Period 12.0000
Added Mass
3.21008E-02 -6.57069E-04 9.50561E-03 -1.09369E-01 1.20140E+01 1.23022E+00
5.44194E-03 4.97179E-01 -3.42758E-03 5.06047E+00 3.77721E-01 1.15596E+00
-6.82093E-03 -2.15819E-03 1.45387E+00 5.70535E-02 -1.15202E+00 -7.43038E-01

-1.09369E-01 5.06047E+00 5.70535E-02 2.79007E+02 -2.76236E+01 3.11139E+01
1.20140E+01 3.77721E-01 -1.15202E+00 -2.77329E+00 1.52482E+04 -1.47210E+02
1.23022E+00 1.15596E+00 -7.43038E-01 -1.25781E+02 3.07047E+02 5.90114E+03
Damping
9.42003E-03 -1.55377E-03 1.39057E-02 -1.28210E-02 5.07933E+00 4.68820E-01
2.68484E-03 3.65755E-01 -4.95075E-03 2.20087E+00 1.35108E-01 -1.10475E+00
-8.64095E-04 -6.93749E-04 3.86399E-01 2.46220E-02 3.73966E+00 -9.44262E-01
-1.28210E-02 2.20087E+00 2.46220E-02 3.05732E+01 -4.22064E+01 -3.90272E+01
5.07933E+00 1.35108E-01 3.73966E+00 3.00915E+01 5.61510E+03 -3.39197E+02
4.68820E-01 -1.10475E+00 -9.44262E-01 -1.11331E+02 4.52575E+02 4.32844E+03
Frequency 0.5464 Period 11.5000
Added Mass
3.13694E-02 -3.71723E-04 9.44661E-03 -1.07746E-01 1.15730E+01 1.17424E+00
4.88563E-03 4.29930E-01 -3.41500E-03 4.71779E+00 3.38976E-01 8.97022E-01
-6.77660E-03 -1.98158E-03 1.45171E+00 5.97785E-02 -1.25875E+00 -7.53747E-01
-1.07746E-01 4.71779E+00 5.97785E-02 2.76670E+02 -2.71726E+01 2.81811E+01
1.15730E+01 3.38976E-01 -1.25875E+00 -2.73951E+00 1.50458E+04 -1.48860E+02
1.17424E+00 8.97022E-01 -7.53747E-01 -1.15669E+02 2.96997E+02 5.36015E+03
Damping
1.02395E-02 -1.38992E-03 1.35216E-02 -1.22199E-02 5.20898E+00 4.76855E-01
2.74719E-03 3.80673E-01 -4.66747E-03 2.43473E+00 1.20919E-01 -1.56607E+00
-6.30683E-04 -5.74144E-04 3.64283E-01 2.43472E-02 4.37952E+00 -9.03212E-01
-1.22199E-02 2.43473E+00 2.43472E-02 3.46563E+01 -4.14129E+01 -4.99966E+01
5.20898E+00 1.20919E-01 4.37952E+00 2.95950E+01 5.68650E+03 -3.20727E+02
4.76855E-01 -1.56607E+00 -9.03212E-01 -1.20569E+02 4.46065E+02 4.69022E+03
Frequency 0.5712 Period 11.0000
Added Mass
3.23525E-02 -4.24868E-04 8.01375E-03 -1.08491E-01 1.11152E+01 1.17132E+00
4.68227E-03 3.64214E-01 -3.34019E-03 4.32016E+00 3.43358E-01 7.97034E-01
-7.05854E-03 -1.99189E-03 1.45848E+00 6.01809E-02 -1.31870E+00 -7.30703E-01
-1.08491E-01 4.32016E+00 6.01809E-02 2.73964E+02 -2.63082E+01 2.88069E+01
1.11152E+01 3.43358E-01 -1.31870E+00 -3.41930E+00 1.48667E+04 -1.50392E+02
1.17132E+00 7.97034E-01 -7.30703E-01 -1.06585E+02 2.84723E+02 4.72867E+03
Damping
1.01014E-02 -1.21674E-03 1.44960E-02 -1.01586E-02 5.02989E+00 4.55315E-01
2.52335E-03 3.85903E-01 -4.74070E-03 2.57208E+00 9.82368E-02 -1.49359E+00
-5.25848E-04 -4.01942E-04 3.36096E-01 2.99918E-02 3.95211E+00 -9.49174E-01
-1.01586E-02 2.57208E+00 2.99918E-02 3.50457E+01 -4.02684E+01 -4.68983E+01
5.02989E+00 9.82368E-02 3.95211E+00 3.16305E+01 5.25452E+03 -3.29687E+02
4.55315E-01 -1.49359E+00 -9.49174E-01 -1.15200E+02 4.29786E+02 4.84642E+03
Frequency 0.5984 Period 10.5000
Added Mass
2.99819E-02 4.98097E-06 9.54475E-03 -1.01821E-01 1.02737E+01 9.82826E-01
3.84971E-03 3.06334E-01 -4.28643E-03 3.92033E+00 3.40162E-01 7.48809E-01
-6.67192E-03 -1.82124E-03 1.47672E+00 7.09082E-02 -1.71707E+00 -8.90360E-01
-1.01821E-01 3.92033E+00 7.09082E-02 2.71023E+02 -2.62352E+01 2.82621E+01
1.02737E+01 3.40162E-01 -1.71707E+00 2.12143E+00 1.45358E+04 -2.15187E+02
9.82826E-01 7.48809E-01 -8.90360E-01 -9.81609E+01 2.62612E+02 3.94577E+03
Damping
1.05496E-02 -1.27758E-03 1.48496E-02 -1.69834E-02 5.11118E+00 5.17178E-01
2.48216E-03 3.83971E-01 -4.70916E-03 2.64363E+00 1.00957E-01 -1.21358E+00
-1.38772E-03 -4.76508E-04 3.03580E-01 2.77417E-02 3.44464E+00 -9.52043E-01
-1.69834E-02 2.64363E+00 2.77417E-02 3.40801E+01 -3.91442E+01 -3.83120E+01
5.11118E+00 1.00957E-01 3.44464E+00 3.11687E+01 4.73846E+03 -3.31048E+02
5.17178E-01 -1.21358E+00 -9.52043E-01 -1.04832E+02 4.08194E+02 4.88544E+03
Frequency 0.6283 Period 10.0000
Added Mass
3.09198E-02 -7.73312E-04 8.64336E-03 -1.02428E-01 1.04526E+01 9.38473E-01
4.18342E-03 2.55049E-01 -4.56069E-03 3.54587E+00 5.22877E-01 6.70311E-01
-7.61654E-03 -2.78322E-03 1.49394E+00 5.60632E-02 -1.64785E+00 -8.67373E-01
-1.02428E-01 3.54587E+00 5.60632E-02 2.67983E+02 -1.92518E+01 2.69883E+01
1.04526E+01 5.22877E-01 -1.64785E+00 -1.31847E-01 1.45958E+04 -2.29630E+02
9.38473E-01 6.70311E-01 -8.67373E-01 -8.89108E+01 1.94992E+02 3.19075E+03
Damping
1.29058E-02 -1.44801E-03 1.36045E-02 -2.08474E-02 5.90089E+00 6.41725E-01
3.27170E-03 3.80247E-01 -4.00754E-03 2.71112E+00 3.80654E-02 -1.04372E+00
-3.06053E-03 -5.66635E-04 2.65461E-01 2.14681E-02 3.43468E+00 -7.78967E-01
-2.08474E-02 2.71112E+00 2.14681E-02 3.38874E+01 -4.14078E+01 -3.27650E+01
5.90089E+00 3.80654E-02 3.43468E+00 2.69347E+01 4.58169E+03 -2.71635E+02
6.41725E-01 -1.04372E+00 -7.78967E-01 -9.65054E+01 4.36952E+02 4.83214E+03
Frequency 0.6614 Period 9.5000
Added Mass
3.32336E-02 4.64680E-04 4.44992E-03 -1.04500E-01 1.17335E+01 1.14783E+00
5.00367E-03 2.08187E-01 -2.94573E-03 3.26364E+00 3.27247E-01 3.52841E-01
-1.13221E-02 -1.71165E-03 1.50279E+00 4.66241E-02 -1.38268E+00 -6.07600E-01
-1.04500E-01 3.26364E+00 4.66241E-02 2.68003E+02 -2.88343E+01 1.69965E+01
1.17335E+01 3.27247E-01 -1.38268E+00 -1.15888E+01 1.51946E+04 -1.31116E+02
1.14783E+00 3.52841E-01 -6.07600E-01 -9.70612E+01 3.13860E+02 2.65293E+03
Damping
1.26876E-02 -1.28366E-03 1.25686E-02 -1.37930E-02 5.79241E+00 6.05985E-01
3.37647E-03 3.76751E-01 -3.96356E-03 2.81943E+00 9.10686E-02 -6.81339E-01
-3.44670E-03 -9.10502E-04 2.27877E-01 2.85997E-02 2.59090E+00 -7.70593E-01
-1.37930E-02 2.81943E+00 2.85997E-02 3.34109E+01 -3.69241E+01 -2.29546E+01
5.79241E+00 9.10686E-02 2.59090E+00 2.85375E+01 3.98106E+03 -2.62114E+02
6.05985E-01 -6.81339E-01 -7.70593E-01 -8.88981E+01 4.05589E+02 4.54024E+03
Frequency 0.6981 Period 9.0000
Added Mass
3.00809E-02 -7.63017E-04 3.77092E-03 -9.13926E-02 1.06422E+01 9.64050E-01
3.75143E-03 1.61434E-01 -3.34635E-03 2.84319E+00 4.87646E-01 5.41648E-01
-1.04422E-02 -3.29852E-03 1.53226E+00 6.80672E-02 -1.88262E+00 -7.67885E-01
-9.13926E-02 2.84319E+00 6.80672E-02 2.64827E+02 -1.33636E+01 2.34626E+01
1.06422E+01 4.87646E-01 -1.88262E+00 -1.17958E+01 1.51100E+04 -1.45338E+02
9.64050E-01 5.41648E-01 -7.67885E-01 -1.01095E+02 1.88500E+02 2.17974E+03
Damping
1.19343E-02 -8.68038E-04 1.44695E-02 -1.17275E-02 4.92690E+00 5.14861E-01
2.77956E-03 3.66841E-01 -5.11304E-03 2.92327E+00 3.14884E-03 -7.08897E-01
-3.41970E-03 -2.26143E-04 2.00882E-01 3.63815E-02 1.85465E+00 -1.02545E+00
-1.17275E-02 2.92327E+00 3.63815E-02 3.52534E+01 -4.14187E+01 -2.25916E+01
4.92690E+00 3.14884E-03 1.85465E+00 3.52579E+01 3.22693E+03 -3.42440E+02
5.14861E-01 -7.08897E-01 -1.02545E+00 -8.53902E+01 4.09326E+02 4.43552E+03
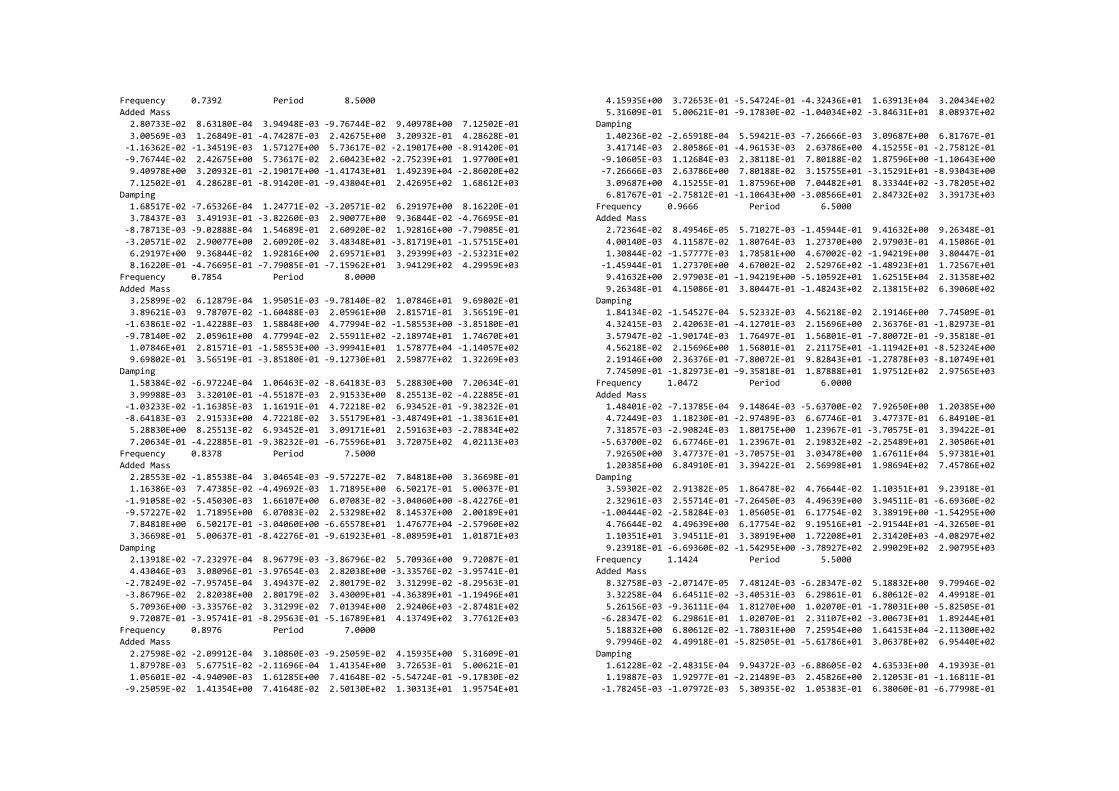
Frequency 0.7392 Period 8.5000
Added Mass
2.80733E-02 8.63180E-04 3.94948E-03 -9.76744E-02 9.40978E+00 7.12502E-01
3.00569E-03 1.26849E-01 -4.74287E-03 2.42675E+00 3.20932E-01 4.28628E-01
-1.16362E-02 -1.34519E-03 1.57127E+00 5.73617E-02 -2.19017E+00 -8.91420E-01
-9.76744E-02 2.42675E+00 5.73617E-02 2.60423E+02 -2.75239E+01 1.97700E+01
9.40978E+00 3.20932E-01 -2.19017E+00 -1.41743E+01 1.49239E+04 -2.86020E+02
7.12502E-01 4.28628E-01 -8.91420E-01 -9.43804E+01 2.42695E+02 1.68612E+03
Damping
1.68517E-02 -7.65326E-04 1.24771E-02 -3.20571E-02 6.29197E+00 8.16220E-01
3.78437E-03 3.49193E-01 -3.82260E-03 2.90077E+00 9.36844E-02 -4.76695E-01
-8.78713E-03 -9.02888E-04 1.54689E-01 2.60920E-02 1.92816E+00 -7.79085E-01
-3.20571E-02 2.90077E+00 2.60920E-02 3.48348E+01 -3.81719E+01 -1.57515E+01
6.29197E+00 9.36844E-02 1.92816E+00 2.69571E+01 3.29399E+03 -2.53231E+02
8.16220E-01 -4.76695E-01 -7.79085E-01 -7.15962E+01 3.94129E+02 4.29959E+03
Frequency 0.7854 Period 8.0000
Added Mass
3.25899E-02 6.12879E-04 1.95051E-03 -9.78140E-02 1.07846E+01 9.69802E-01
3.89621E-03 9.78707E-02 -1.60488E-03 2.05961E+00 2.81571E-01 3.56519E-01
-1.63861E-02 -1.42288E-03 1.58848E+00 4.77994E-02 -1.58553E+00 -3.85180E-01
-9.78140E-02 2.05961E+00 4.77994E-02 2.55911E+02 -2.18974E+01 1.74670E+01
1.07846E+01 2.81571E-01 -1.58553E+00 -3.99941E+01 1.57877E+04 -1.14057E+02
9.69802E-01 3.56519E-01 -3.85180E-01 -9.12730E+01 2.59877E+02 1.32269E+03
Damping
1.58384E-02 -6.97224E-04 1.06463E-02 -8.64183E-03 5.28830E+00 7.20634E-01
3.99988E-03 3.32010E-01 -4.55187E-03 2.91533E+00 8.25513E-02 -4.22885E-01
-1.03233E-02 -1.16385E-03 1.16191E-01 4.72218E-02 6.93452E-01 -9.38232E-01
-8.64183E-03 2.91533E+00 4.72218E-02 3.55179E+01 -3.48749E+01 -1.38361E+01
5.28830E+00 8.25513E-02 6.93452E-01 3.09171E+01 2.59163E+03 -2.78834E+02
7.20634E-01 -4.22885E-01 -9.38232E-01 -6.75596E+01 3.72075E+02 4.02113E+03
Frequency 0.8378 Period 7.5000
Added Mass
2.28553E-02 -1.85538E-04 3.04654E-03 -9.57227E-02 7.84818E+00 3.36698E-01
1.16386E-03 7.47385E-02 -4.49692E-03 1.71895E+00 6.50217E-01 5.00637E-01
-1.91058E-02 -5.45030E-03 1.66107E+00 6.07083E-02 -3.04060E+00 -8.42276E-01
-9.57227E-02 1.71895E+00 6.07083E-02 2.53298E+02 8.14537E+00 2.00189E+01
7.84818E+00 6.50217E-01 -3.04060E+00 -6.65578E+01 1.47677E+04 -2.57960E+02
3.36698E-01 5.00637E-01 -8.42276E-01 -9.61923E+01 -8.08959E+01 1.01871E+03
Damping
2.13918E-02 -7.23297E-04 8.96779E-03 -3.86796E-02 5.70936E+00 9.72087E-01
4.43046E-03 3.08096E-01 -3.97654E-03 2.82038E+00 -3.33576E-02 -3.95741E-01
-2.78249E-02 -7.95745E-04 3.49437E-02 2.80179E-02 3.31299E-02 -8.29563E-01
-3.86796E-02 2.82038E+00 2.80179E-02 3.43009E+01 -4.36389E+01 -1.19496E+01
5.70936E+00 -3.33576E-02 3.31299E-02 7.01394E+00 2.92406E+03 -2.87481E+02
9.72087E-01 -3.95741E-01 -8.29563E-01 -5.16789E+01 4.13749E+02 3.77612E+03
Frequency 0.8976 Period 7.0000
Added Mass
2.27598E-02 -2.09912E-04 3.10860E-03 -9.25059E-02 4.15935E+00 5.31609E-01
1.87978E-03 5.67751E-02 -2.11696E-04 1.41354E+00 3.72653E-01 5.00621E-01
1.05601E-02 -4.94090E-03 1.61285E+00 7.41648E-02 -5.54724E-01 -9.17830E-02
-9.25059E-02 1.41354E+00 7.41648E-02 2.50130E+02 1.30313E+01 1.95754E+01
4.15935E+00 3.72653E-01 -5.54724E-01 -4.32436E+01 1.63913E+04 3.20434E+02
5.31609E-01 5.00621E-01 -9.17830E-02 -1.04034E+02 -3.84631E+01 8.08937E+02
Damping
1.40236E-02 -2.65918E-04 5.59421E-03 -7.26666E-03 3.09687E+00 6.81767E-01
3.41714E-03 2.80586E-01 -4.96153E-03 2.63786E+00 4.15255E-01 -2.75812E-01
-9.10605E-03 1.12684E-03 2.38118E-01 7.80188E-02 1.87596E+00 -1.10643E+00
-7.26666E-03 2.63786E+00 7.80188E-02 3.15755E+01 -3.15291E+01 -8.93043E+00
3.09687E+00 4.15255E-01 1.87596E+00 7.04482E+01 8.33344E+02 -3.78205E+02
6.81767E-01 -2.75812E-01 -1.10643E+00 -3.08566E+01 2.84732E+02 3.39173E+03
Frequency 0.9666 Period 6.5000
Added Mass
2.72364E-02 8.49546E-05 5.71027E-03 -1.45944E-01 9.41632E+00 9.26348E-01
4.00140E-03 4.11587E-02 1.80764E-03 1.27370E+00 2.97903E-01 4.15086E-01
1.30844E-02 -1.57777E-03 1.78581E+00 4.67002E-02 -1.94219E+00 3.80447E-01
-1.45944E-01 1.27370E+00 4.67002E-02 2.52976E+02 -1.48923E+01 1.72567E+01
9.41632E+00 2.97903E-01 -1.94219E+00 -5.10592E+01 1.62515E+04 2.31358E+02
9.26348E-01 4.15086E-01 3.80447E-01 -1.48243E+02 2.13815E+02 6.39060E+02
Damping
1.84134E-02 -1.54527E-04 5.52332E-03 4.56218E-02 2.19146E+00 7.74509E-01
4.32415E-03 2.42063E-01 -4.12701E-03 2.15696E+00 2.36376E-01 -1.82973E-01
3.57947E-02 -1.90174E-03 1.76497E-01 1.56801E-01 -7.80072E-01 -9.35818E-01
4.56218E-02 2.15696E+00 1.56801E-01 2.21175E+01 -1.11942E+01 -8.52324E+00
2.19146E+00 2.36376E-01 -7.80072E-01 9.82843E+01 -1.27878E+03 -8.10749E+01
7.74509E-01 -1.82973E-01 -9.35818E-01 1.87888E+01 1.97512E+02 2.97565E+03
Frequency 1.0472 Period 6.0000
Added Mass
1.48401E-02 -7.13785E-04 9.14864E-03 -5.63700E-02 7.92650E+00 1.20385E+00
4.72449E-03 1.18230E-01 -2.97489E-03 6.67746E-01 3.47737E-01 6.84910E-01
7.31857E-03 -2.90824E-03 1.80175E+00 1.23967E-01 -3.70575E-01 3.39422E-01
-5.63700E-02 6.67746E-01 1.23967E-01 2.19832E+02 -2.25489E+01 2.30506E+01
7.92650E+00 3.47737E-01 -3.70575E-01 3.03478E+00 1.67611E+04 5.97381E+01
1.20385E+00 6.84910E-01 3.39422E-01 2.56998E+01 1.98694E+02 7.45786E+02
Damping
3.59302E-02 2.91382E-05 1.86478E-02 4.76644E-02 1.10351E+01 9.23918E-01
2.32961E-03 2.55714E-01 -7.26450E-03 4.49639E+00 3.94511E-01 -6.69360E-02
-1.00444E-02 -2.58284E-03 1.05605E-01 6.17754E-02 3.38919E+00 -1.54295E+00
4.76644E-02 4.49639E+00 6.17754E-02 9.19516E+01 -2.91544E+01 -4.32650E-01
1.10351E+01 3.94511E-01 3.38919E+00 1.72208E+01 2.31420E+03 -4.08297E+02
9.23918E-01 -6.69360E-02 -1.54295E+00 -3.78927E+02 2.99029E+02 2.90795E+03
Frequency 1.1424 Period 5.5000
Added Mass
8.32758E-03 -2.07147E-05 7.48124E-03 -6.28347E-02 5.18832E+00 9.79946E-02
3.32258E-04 6.64511E-02 -3.40531E-03 6.29861E-01 6.80612E-02 4.49918E-01
5.26156E-03 -9.36111E-04 1.81270E+00 1.02070E-01 -1.78031E+00 -5.82505E-01
-6.28347E-02 6.29861E-01 1.02070E-01 2.31107E+02 -3.00673E+01 1.89244E+01
5.18832E+00 6.80612E-02 -1.78031E+00 7.25954E+00 1.64153E+04 -2.11300E+02
9.79946E-02 4.49918E-01 -5.82505E-01 -5.61786E+01 3.06378E+02 6.95440E+02
Damping
1.61228E-02 -2.48315E-04 9.94372E-03 -6.88605E-02 4.63533E+00 4.19393E-01
1.19887E-03 1.92977E-01 -2.21489E-03 2.45826E+00 2.12053E-01 -1.16811E-01
-1.78245E-03 -1.07972E-03 5.30935E-02 1.05383E-01 6.38060E-01 -6.77998E-01

-6.88605E-02 2.45826E+00 1.05383E-01 4.25079E+01 -4.39530E+00 -5.75075E+00
4.63533E+00 2.12053E-01 6.38060E-01 -5.93486E+00 5.97214E+02 -1.26232E+02
4.19393E-01 -1.16811E-01 -6.77998E-01 -8.43965E+01 3.05318E+01 2.33075E+03
Frequency 1.2566 Period 5.0000
Added Mass
1.03830E-02 4.91671E-04 7.27895E-03 -1.27004E-01 6.72756E+00 1.47823E-01
2.17962E-04 6.88590E-02 -2.04251E-03 5.89715E-01 1.56828E-01 4.27326E-01
-2.09221E-03 -8.09047E-04 1.87642E+00 -1.17457E-02 -1.43552E+00 -4.75581E-01
-1.27004E-01 5.89715E-01 -1.17457E-02 2.28139E+02 -4.04829E+01 2.37000E+01
6.72756E+00 1.56828E-01 -1.43552E+00 -8.86343E+00 1.76332E+04 -1.35889E+02
1.47823E-01 4.27326E-01 -4.75581E-01 -7.08877E+01 2.93977E+02 7.47875E+02
Damping
2.05123E-02 -3.49948E-04 1.44981E-02 -2.14023E-01 6.30833E+00 8.82718E-01
6.17681E-03 1.46446E-01 -3.00108E-03 1.80620E+00 4.92390E-02 -1.76056E-01
-6.15284E-03 -1.42610E-04 7.16985E-02 2.25649E-01 7.71907E-01 -4.71135E-01
-2.14023E-01 1.80620E+00 2.25649E-01 3.13171E+01 -6.44725E+01 2.66326E+00
6.30833E+00 4.92390E-02 7.71907E-01 3.33431E+01 1.24735E+03 -2.85812E+02
8.82718E-01 -1.76056E-01 -4.71135E-01 -3.21877E+01 3.93145E+02 1.76333E+03
Frequency 1.3963 Period 4.5000
Added Mass
1.17857E-02 -2.50681E-04 5.94902E-03 1.71179E-01 4.20011E+00 -3.88818E-01
-2.95130E-03 9.72196E-02 5.99741E-04 1.03000E+00 -7.15764E-01 6.54082E-01
1.55977E-02 -4.50126E-04 1.86889E+00 -3.03840E-01 2.18889E+00 -1.16165E-01
1.71179E-01 1.03000E+00 -3.03840E-01 2.40645E+02 -9.81773E+00 1.91800E+01
4.20011E+00 -7.15764E-01 2.18889E+00 -5.80687E+01 1.77520E+04 3.77845E+01
-3.88818E-01 6.54082E-01 -1.16165E-01 -1.75063E+02 2.98104E+02 9.77820E+02
Damping
1.06309E-02 -1.39684E-03 6.72341E-03 -3.64339E-02 3.76907E+00 -6.97267E-01
-5.40128E-03 1.15700E-02 1.12453E-02 2.65500E-01 -5.89509E-01 -6.64773E-01
9.02918E-03 6.88611E-03 1.06387E-02 7.99912E-03 -1.04365E+00 1.48483E+00
-3.64339E-02 2.65500E-01 7.99912E-03 7.21234E+00 1.91863E+01 1.23188E+01
3.76907E+00 -5.89509E-01 -1.04365E+00 -3.76944E+01 -2.29908E+02 1.48096E+02
-6.97267E-01 -6.64773E-01 1.48483E+00 -2.67886E+01 -2.49992E+02 3.12539E+02
Frequency 1.5708 Period 4.0000
Added Mass
2.09485E-02 3.44098E-03 1.82888E-03 1.97351E-01 4.75090E+00 7.00368E-01
4.72585E-03 1.29409E-01 -7.98886E-03 1.00563E+00 8.19638E-01 8.42483E-01
1.05342E-02 -2.67884E-03 1.88953E+00 -2.41185E-01 1.82660E+00 -1.28900E+00
1.97351E-01 1.00563E+00 -2.41185E-01 2.32363E+02 -1.71762E+01 1.42548E+00
4.75090E+00 8.19638E-01 1.82660E+00 1.63026E+01 1.77765E+04 5.11962E+01
7.00368E-01 8.42483E-01 -1.28900E+00 -1.12509E+02 5.93198E+02 1.30219E+03
Damping
-1.19527E-02 5.97184E-04 3.27325E-02 2.10370E-01 -4.49657E+00 -9.70053E-01
-6.28031E-03 1.33328E-01 9.72798E-03 1.67984E+00 -8.27359E-01 2.28409E-01
2.05419E-02 2.97443E-03 1.02818E-03 -5.29079E-02 6.11895E+00 1.46270E+00
2.10370E-01 1.67984E+00 -5.29079E-02 2.14348E+01 7.67410E+01 8.15354E+00
-4.49657E+00 -8.27359E-01 6.11895E+00 1.55115E+00 -3.16157E+02 6.41150E+02
-9.70053E-01 2.28409E-01 1.46270E+00 1.53743E+01 -4.78218E+02 1.73339E+03
Frequency 2.0944 Period 3.0000
Added Mass
1.94454E-02 6.25880E-04 6.97859E-04 1.07985E-03 7.64035E+00 1.69031E-01
9.26932E-04 1.63048E-01 -6.52289E-03 1.22370E+00 5.91528E-01 8.46363E-01
3.02916E-03 -2.24240E-03 1.92523E+00 3.88079E-04 -1.39629E+00 -1.07918E+00
1.07985E-03 1.22370E+00 3.88079E-04 2.35313E+02 -3.02060E+01 1.41276E+01
7.64035E+00 5.91528E-01 -1.39629E+00 1.55298E+01 1.77437E+04 -2.74372E+02
1.69031E-01 8.46363E-01 -1.07918E+00 -9.75518E+01 4.04172E+02 1.64231E+03
Damping
1.95073E-03 8.97312E-03 6.11238E-03 1.63213E-02 -4.15291E-02 -2.76914E-02
-5.92417E-04 5.48880E-02 1.38579E-03 6.43024E-01 9.61396E-01 5.30965E-01
3.31705E-03 -1.65487E-05 2.84886E-03 -1.42195E-02 1.31199E+00 1.68336E-01
1.63213E-02 6.43024E-01 -1.42195E-02 8.83980E+00 4.47978E+01 7.50271E-01
-4.15291E-02 9.61396E-01 1.31199E+00 1.15350E+01 7.73791E+01 2.02219E+02
-2.76914E-02 5.30965E-01 1.68336E-01 -8.11768E+00 -3.59034E+02 6.79728E+02

Wave Frequency Force & Moment (1st Order)
Page 38 Licensee - PT Zee IndonesiaTangerang Sela Rev 07.10.01.11
***************************************************************************************************************
* *** MOSES *** *
* ---------------- 7 November, 2017 *
* Motion Analysis *
* MOSES Model Plot (Bow View) *
* Draft = 15.5 Meters Trim Angle = 0.00 Deg. *
* Heading = 0.00 Deg. Linearization Based on 1/ 60 *
* *
***************************************************************************************************************
+++ L I N E A R Z E D W A V E F R E Q U E N C Y F O R C E S +++
=====================================================================
Results are in Body System
Of Point On Body FLNG At X = 191.3 Y = -0.0 Z = 24.4
Process is DEFAULT: Units Are Degrees, Meters, and M-Tons Unless Specified
E N C O U N T E R Surge Force / Sway Force / Heave Force / Roll Moment / Pitch Moment / Yaw Moment /
-------------------- Wave Ampl. Wave Ampl. Wave Ampl. Wave Ampl. Wave Ampl. Wave Ampl.
Frequency Period /--------------/ /--------------/ /--------------/ /--------------/ /--------------/ /--------------/
-(Rad/Sec)- -(Sec)- Ampl. Phase Ampl. Phase Ampl. Phase Ampl. Phase Ampl. Phase Ampl. Phase
0.2513 25.00 1411 -15 13 177 12816 86 252 25 1125410 -14 1390 179
0.2565 24.50 1367 -12 13 -174 12146 88 242 32 1095929 -11 1347 -171
0.2618 24.00 1325 -8 13 -166 11470 91 236 39 1069929 -7 1337 -161
0.2674 23.50 1287 -4 13 -157 10792 94 235 47 1048598 -2 1366 -152
0.2732 23.00 1254 0 14 -149 10123 97 239 55 1032402 1 1435 -142
0.2793 22.50 1227 4 14 -141 9472 102 250 62 1022741 6 1544 -134
0.2856 22.00 1209 9 15 -133 8855 107 267 68 1020790 12 1687 -126
0.2922 21.50 1200 15 17 -126 8293 113 288 74 1027768 17 1856 -120
0.2992 21.00 1203 21 18 -119 7816 120 319 88 1044589 23 2076 -114
0.3065 20.50 1219 27 20 -114 7460 128 359 100 1072202 28 2352 -108
0.3142 20.00 1250 33 22 -110 7265 138 397 105 1111278 34 2648 -103
0.3222 19.50 1175 41 23 -99 6456 145 401 117 1077303 41 2831 -92
0.3307 19.00 1119 50 25 -90 5739 154 424 127 1061664 50 3116 -83
0.3396 18.50 1014 59 25 -78 4865 163 427 141 1012307 58 3308 -70
0.3491 18.00 936 71 27 -66 4108 175 456 154 987082 68 3650 -59
0.3590 17.50 796 83 27 -51 3215 -173 454 170 917911 78 3827 -45
0.3696 17.00 698 100 29 -37 2493 -154 493 -173 879662 90 4235 -32
0.3808 16.50 527 118 28 -18 1678 -136 486 -152 784747 102 4375 -15
0.3927 16.00 441 148 31 0 1231 -96 547 -133 728073 117 4889 0
0.4054 15.50 308 -171 30 22 819 -50 536 -108 602359 130 4940 19
0.4189 15.00 404 -123 34 44 1207 0 629 -86 522995 150 5583 38
0.4333 14.50 531 -85 37 70 1507 33 674 -59 403555 172 5848 60
0.4488 14.00 684 -55 39 98 1754 63 713 -30 282898 -159 5988 86
0.4654 13.50 813 -28 42 128 1865 91 748 3 182030 -116 6034 116
0.4833 13.00 880 0 45 161 1792 120 795 41 143810 -50 6132 151
0.5027 12.50 859 31 47 -161 1511 154 872 85 174640 10 6476 -166
0.5236 12.00 741 70 47 -121 1067 -161 977 133 211498 58 7135 -121
0.5464 11.50 549 122 44 -71 671 -92 1087 -174 216921 104 7987 -72
0.5712 11.00 418 -155 42 -8 672 2 1173 -115 178019 155 8730 -20
0.5984 10.50 588 -68 44 57 836 79 1266 -48 115002 -129 8431 43
0.6283 10.00 755 6 50 153 780 150 1136 30 107715 -12 8659 108
0.6614 9.50 603 91 48 -142 620 -105 1541 129 127200 87 8081 -147
0.6981 9.00 475 -146 39 -2 751 30 1474 -130 105783 -173 9974 -50
0.7392 8.50 745 -10 41 87 704 155 1938 0 112853 -21 8005 68
0.7854 8.00 620 141 38 -123 745 -43 1964 153 111085 134 7944 -135
0.8378 7.50 782 -31 31 112 718 147 1616 -33 113960 -39 6552 38
0.8976 7.00 580 -168 17 -46 788 7 1382 -165 74699 -175 5309 -91
0.9666 6.50 609 130 8 -106 812 -90 1764 87 83713 143 2791 140
1.0472 6.00 750 98 25 -5 467 -109 2140 161 90785 108 4593 -150
1.1424 5.50 418 -177 16 -14 379 22 3116 -109 37158 173 6552 -40
1.2566 5.00 526 76 28 -153 273 -160 2606 139 58029 72 10145 -164
1.3963 4.50 108 176 103 -30 124 -168 1823 -125 11050 83 14666 -50
1.5708 4.00 679 15 165 -36 834 -129 7796 -111 115318 19 54153 -84
2.0944 3.00 162 -87 310 -137 192 150 5260 -159 31144 -50 16912 -142
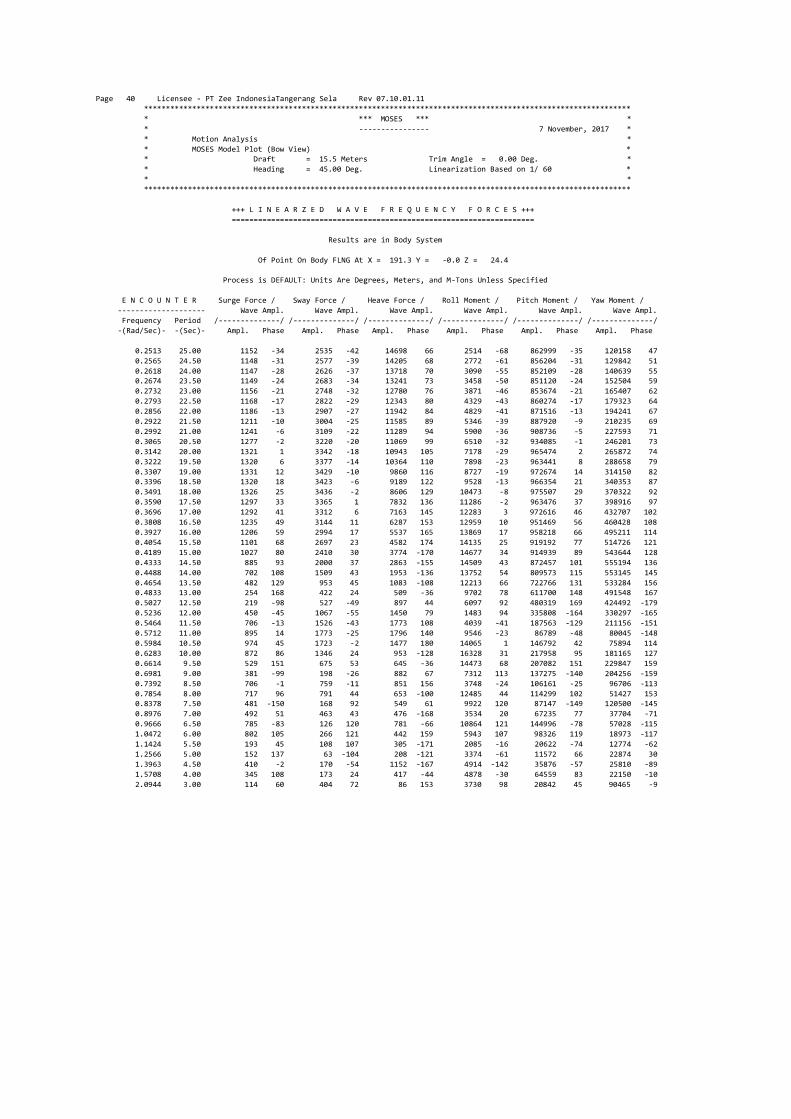
Page 40 Licensee - PT Zee IndonesiaTangerang Sela Rev 07.10.01.11
***************************************************************************************************************
* *** MOSES *** *
* ---------------- 7 November, 2017 *
* Motion Analysis *
* MOSES Model Plot (Bow View) *
* Draft = 15.5 Meters Trim Angle = 0.00 Deg. *
* Heading = 45.00 Deg. Linearization Based on 1/ 60 *
* *
***************************************************************************************************************
+++ L I N E A R Z E D W A V E F R E Q U E N C Y F O R C E S +++
=====================================================================
Results are in Body System
Of Point On Body FLNG At X = 191.3 Y = -0.0 Z = 24.4
Process is DEFAULT: Units Are Degrees, Meters, and M-Tons Unless Specified
E N C O U N T E R Surge Force / Sway Force / Heave Force / Roll Moment / Pitch Moment / Yaw Moment /
-------------------- Wave Ampl. Wave Ampl. Wave Ampl. Wave Ampl. Wave Ampl. Wave Ampl.
Frequency Period /--------------/ /--------------/ /--------------/ /--------------/ /--------------/ /--------------/
-(Rad/Sec)- -(Sec)- Ampl. Phase Ampl. Phase Ampl. Phase Ampl. Phase Ampl. Phase Ampl. Phase
0.2513 25.00 1152 -34 2535 -42 14698 66 2514 -68 862999 -35 120158 47
0.2565 24.50 1148 -31 2577 -39 14205 68 2772 -61 856204 -31 129842 51
0.2618 24.00 1147 -28 2626 -37 13718 70 3090 -55 852109 -28 140639 55
0.2674 23.50 1149 -24 2683 -34 13241 73 3458 -50 851120 -24 152504 59
0.2732 23.00 1156 -21 2748 -32 12780 76 3871 -46 853674 -21 165407 62
0.2793 22.50 1168 -17 2822 -29 12343 80 4329 -43 860274 -17 179323 64
0.2856 22.00 1186 -13 2907 -27 11942 84 4829 -41 871516 -13 194241 67
0.2922 21.50 1211 -10 3004 -25 11585 89 5346 -39 887920 -9 210235 69
0.2992 21.00 1241 -6 3109 -22 11289 94 5900 -36 908736 -5 227593 71
0.3065 20.50 1277 -2 3220 -20 11069 99 6510 -32 934085 -1 246201 73
0.3142 20.00 1321 1 3342 -18 10943 105 7178 -29 965474 2 265872 74
0.3222 19.50 1320 6 3377 -14 10364 110 7898 -23 963441 8 288658 79
0.3307 19.00 1331 12 3429 -10 9860 116 8727 -19 972674 14 314150 82
0.3396 18.50 1320 18 3423 -6 9189 122 9528 -13 966354 21 340353 87
0.3491 18.00 1326 25 3436 -2 8606 129 10473 -8 975507 29 370322 92
0.3590 17.50 1297 33 3365 1 7832 136 11286 -2 963476 37 398916 97
0.3696 17.00 1292 41 3312 6 7163 145 12283 3 972616 46 432707 102
0.3808 16.50 1235 49 3144 11 6287 153 12959 10 951469 56 460428 108
0.3927 16.00 1206 59 2994 17 5537 165 13869 17 958218 66 495211 114
0.4054 15.50 1101 68 2697 23 4582 174 14135 25 919192 77 514726 121
0.4189 15.00 1027 80 2410 30 3774 -170 14677 34 914939 89 543644 128
0.4333 14.50 885 93 2000 37 2863 -155 14509 43 872457 101 555194 136
0.4488 14.00 702 108 1509 43 1953 -136 13752 54 809573 115 553145 145
0.4654 13.50 482 129 953 45 1083 -108 12213 66 722766 131 533284 156
0.4833 13.00 254 168 422 24 509 -36 9702 78 611700 148 491548 167
0.5027 12.50 219 -98 527 -49 897 44 6097 92 480319 169 424492 -179
0.5236 12.00 450 -45 1067 -55 1450 79 1483 94 335808 -164 330297 -165
0.5464 11.50 706 -13 1526 -43 1773 108 4039 -41 187563 -129 211156 -151
0.5712 11.00 895 14 1773 -25 1796 140 9546 -23 86789 -48 80045 -148
0.5984 10.50 974 45 1723 -2 1477 180 14065 1 146792 42 75894 114
0.6283 10.00 872 86 1346 24 953 -128 16328 31 217958 95 181165 127
0.6614 9.50 529 151 675 53 645 -36 14473 68 207082 151 229847 159
0.6981 9.00 381 -99 198 -26 882 67 7312 113 137275 -140 204256 -159
0.7392 8.50 706 -1 759 -11 851 156 3748 -24 106161 -25 96706 -113
0.7854 8.00 717 96 791 44 653 -100 12485 44 114299 102 51427 153
0.8378 7.50 481 -150 168 92 549 61 9922 120 87147 -149 120500 -145
0.8976 7.00 492 51 463 43 476 -168 3534 20 67235 77 37704 -71
0.9666 6.50 785 -83 126 120 781 -66 10864 121 144996 -78 57028 -115
1.0472 6.00 802 105 266 121 442 159 5943 107 98326 119 18973 -117
1.1424 5.50 193 45 108 107 305 -171 2085 -16 20622 -74 12774 -62
1.2566 5.00 152 137 63 -104 208 -121 3374 -61 11572 66 22874 30
1.3963 4.50 410 -2 170 -54 1152 -167 4914 -142 35876 -57 25810 -89
1.5708 4.00 345 108 173 24 417 -44 4878 -30 64559 83 22150 -10
2.0944 3.00 114 60 404 72 86 153 3730 98 20842 45 90465 -9
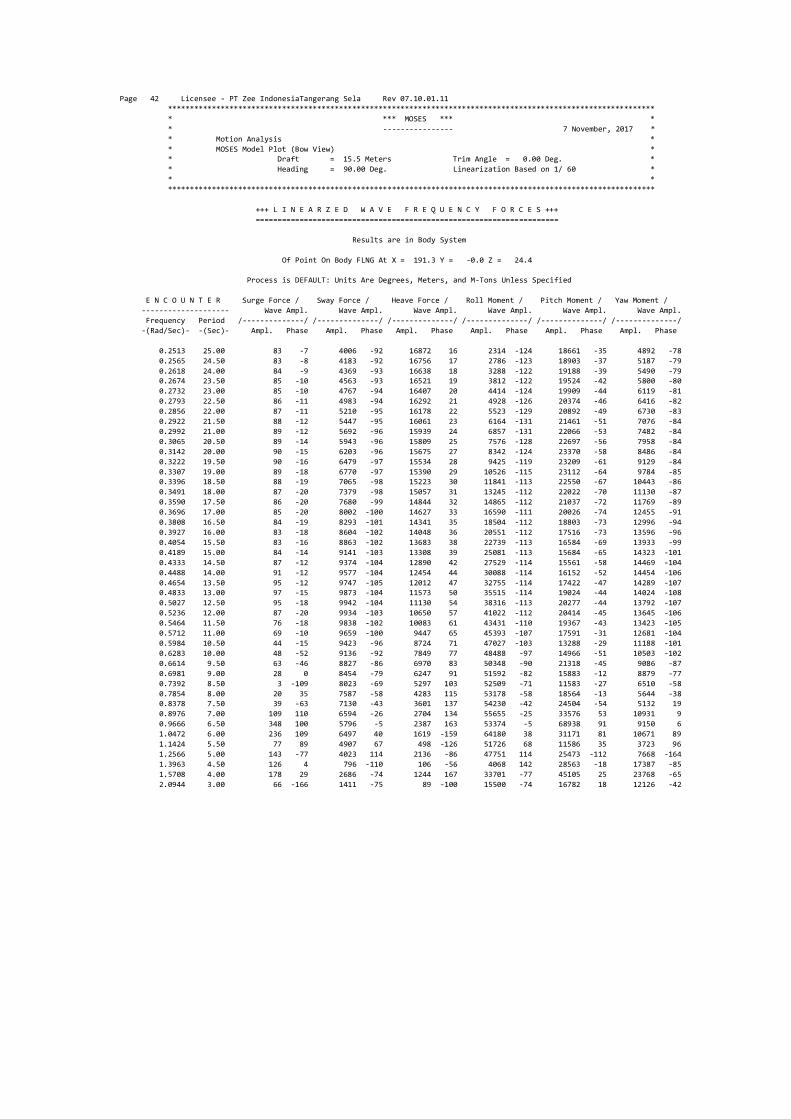
Page 42 Licensee - PT Zee IndonesiaTangerang Sela Rev 07.10.01.11
***************************************************************************************************************
* *** MOSES *** *
* ---------------- 7 November, 2017 *
* Motion Analysis *
* MOSES Model Plot (Bow View) *
* Draft = 15.5 Meters Trim Angle = 0.00 Deg. *
* Heading = 90.00 Deg. Linearization Based on 1/ 60 *
* *
***************************************************************************************************************
+++ L I N E A R Z E D W A V E F R E Q U E N C Y F O R C E S +++
=====================================================================
Results are in Body System
Of Point On Body FLNG At X = 191.3 Y = -0.0 Z = 24.4
Process is DEFAULT: Units Are Degrees, Meters, and M-Tons Unless Specified
E N C O U N T E R Surge Force / Sway Force / Heave Force / Roll Moment / Pitch Moment / Yaw Moment /
-------------------- Wave Ampl. Wave Ampl. Wave Ampl. Wave Ampl. Wave Ampl. Wave Ampl.
Frequency Period /--------------/ /--------------/ /--------------/ /--------------/ /--------------/ /--------------/
-(Rad/Sec)- -(Sec)- Ampl. Phase Ampl. Phase Ampl. Phase Ampl. Phase Ampl. Phase Ampl. Phase
0.2513 25.00 83 -7 4006 -92 16872 16 2314 -124 18661 -35 4892 -78
0.2565 24.50 83 -8 4183 -92 16756 17 2786 -123 18903 -37 5187 -79
0.2618 24.00 84 -9 4369 -93 16638 18 3288 -122 19188 -39 5490 -79
0.2674 23.50 85 -10 4563 -93 16521 19 3812 -122 19524 -42 5800 -80
0.2732 23.00 85 -10 4767 -94 16407 20 4414 -124 19909 -44 6119 -81
0.2793 22.50 86 -11 4983 -94 16292 21 4928 -126 20374 -46 6416 -82
0.2856 22.00 87 -11 5210 -95 16178 22 5523 -129 20892 -49 6730 -83
0.2922 21.50 88 -12 5447 -95 16061 23 6164 -131 21461 -51 7076 -84
0.2992 21.00 89 -12 5692 -96 15939 24 6857 -131 22066 -53 7482 -84
0.3065 20.50 89 -14 5943 -96 15809 25 7576 -128 22697 -56 7958 -84
0.3142 20.00 90 -15 6203 -96 15675 27 8342 -124 23370 -58 8486 -84
0.3222 19.50 90 -16 6479 -97 15534 28 9425 -119 23209 -61 9129 -84
0.3307 19.00 89 -18 6770 -97 15390 29 10526 -115 23112 -64 9784 -85
0.3396 18.50 88 -19 7065 -98 15223 30 11841 -113 22550 -67 10443 -86
0.3491 18.00 87 -20 7379 -98 15057 31 13245 -112 22022 -70 11130 -87
0.3590 17.50 86 -20 7680 -99 14844 32 14865 -112 21037 -72 11769 -89
0.3696 17.00 85 -20 8002 -100 14627 33 16590 -111 20026 -74 12455 -91
0.3808 16.50 84 -19 8293 -101 14341 35 18504 -112 18803 -73 12996 -94
0.3927 16.00 83 -18 8604 -102 14048 36 20551 -112 17516 -73 13596 -96
0.4054 15.50 83 -16 8863 -102 13683 38 22739 -113 16584 -69 13933 -99
0.4189 15.00 84 -14 9141 -103 13308 39 25081 -113 15684 -65 14323 -101
0.4333 14.50 87 -12 9374 -104 12890 42 27529 -114 15561 -58 14469 -104
0.4488 14.00 91 -12 9577 -104 12454 44 30088 -114 16152 -52 14454 -106
0.4654 13.50 95 -12 9747 -105 12012 47 32755 -114 17422 -47 14289 -107
0.4833 13.00 97 -15 9873 -104 11573 50 35515 -114 19024 -44 14024 -108
0.5027 12.50 95 -18 9942 -104 11130 54 38316 -113 20277 -44 13792 -107
0.5236 12.00 87 -20 9934 -103 10650 57 41022 -112 20414 -45 13645 -106
0.5464 11.50 76 -18 9838 -102 10083 61 43431 -110 19367 -43 13423 -105
0.5712 11.00 69 -10 9659 -100 9447 65 45393 -107 17591 -31 12681 -104
0.5984 10.50 44 -15 9423 -96 8724 71 47027 -103 13288 -29 11188 -101
0.6283 10.00 48 -52 9136 -92 7849 77 48488 -97 14966 -51 10503 -102
0.6614 9.50 63 -46 8827 -86 6970 83 50348 -90 21318 -45 9086 -87
0.6981 9.00 28 0 8454 -79 6247 91 51592 -82 15883 -12 8879 -77
0.7392 8.50 3 -109 8023 -69 5297 103 52509 -71 11583 -27 6510 -58
0.7854 8.00 20 35 7587 -58 4283 115 53178 -58 18564 -13 5644 -38
0.8378 7.50 39 -63 7130 -43 3601 137 54230 -42 24504 -54 5132 19
0.8976 7.00 109 110 6594 -26 2704 134 55655 -25 33576 53 10931 9
0.9666 6.50 348 100 5796 -5 2387 163 53374 -5 68938 91 9150 6
1.0472 6.00 236 109 6497 40 1619 -159 64180 38 31171 81 10671 89
1.1424 5.50 77 89 4907 67 498 -126 51726 68 11586 35 3723 96
1.2566 5.00 143 -77 4023 114 2136 -86 47751 114 25473 -112 7668 -164
1.3963 4.50 126 4 796 -110 106 -56 4068 142 28563 -18 17387 -85
1.5708 4.00 178 29 2686 -74 1244 167 33701 -77 45105 25 23768 -65
2.0944 3.00 66 -166 1411 -75 89 -100 15500 -74 16782 18 12126 -42

Page 44 Licensee - PT Zee IndonesiaTangerang Sela Rev 07.10.01.11
***************************************************************************************************************
* *** MOSES *** *
* ---------------- 7 November, 2017 *
* Motion Analysis *
* MOSES Model Plot (Bow View) *
* Draft = 15.5 Meters Trim Angle = 0.00 Deg. *
* Heading = 135.00 Deg. Linearization Based on 1/ 60 *
* *
***************************************************************************************************************
+++ L I N E A R Z E D W A V E F R E Q U E N C Y F O R C E S +++
=====================================================================
Results are in Body System
Of Point On Body FLNG At X = 191.3 Y = -0.0 Z = 24.4
Process is DEFAULT: Units Are Degrees, Meters, and M-Tons Unless Specified
E N C O U N T E R Surge Force / Sway Force / Heave Force / Roll Moment / Pitch Moment / Yaw Moment /
-------------------- Wave Ampl. Wave Ampl. Wave Ampl. Wave Ampl. Wave Ampl. Wave Ampl.
Frequency Period /--------------/ /--------------/ /--------------/ /--------------/ /--------------/ /--------------/
-(Rad/Sec)- -(Sec)- Ampl. Phase Ampl. Phase Ampl. Phase Ampl. Phase Ampl. Phase Ampl. Phase
0.2513 25.00 1158 43 2556 -142 14957 -33 1876 -171 860545 45 120605 129
0.2565 24.50 1170 42 2584 -145 14604 -34 2241 -174 867607 43 130435 124
0.2618 24.00 1183 40 2622 -149 14242 -35 2622 -177 875637 42 141493 120
0.2674 23.50 1198 39 2671 -152 13873 -36 3017 -179 884761 40 153706 116
0.2732 23.00 1214 37 2731 -155 13496 -38 3429 179 895122 39 167020 113
0.2793 22.50 1232 35 2803 -159 13113 -39 3853 177 906951 37 181387 110
0.2856 22.00 1253 34 2890 -162 12726 -41 4290 175 920371 35 196795 107
0.2922 21.50 1275 32 2991 -166 12336 -43 4732 173 935371 33 213231 105
0.2992 21.00 1299 31 3102 -169 11941 -45 5174 173 951538 32 230716 103
0.3065 20.50 1324 29 3223 -172 11541 -47 5632 174 969120 30 249275 101
0.3142 20.00 1353 27 3359 -175 11142 -50 6095 175 989171 28 268920 100
0.3222 19.50 1365 25 3386 180 10585 -53 6787 171 997661 26 292189 95
0.3307 19.00 1379 23 3442 175 10024 -56 7530 168 1008632 23 318499 90
0.3396 18.50 1384 20 3424 169 9381 -59 8309 163 1015289 21 345057 85
0.3491 18.00 1393 18 3443 163 8731 -62 9191 159 1025029 18 376237 79
0.3590 17.50 1385 15 3351 156 7994 -65 9976 153 1027294 15 404696 72
0.3696 17.00 1381 11 3308 149 7244 -69 10908 148 1033440 12 440388 66
0.3808 16.50 1347 8 3111 141 6413 -73 11615 141 1026510 8 466537 58
0.3927 16.00 1317 3 2975 132 5561 -78 12526 134 1024760 3 504134 50
0.4054 15.50 1238 0 2636 123 4652 -81 12891 126 998107 -1 519241 39
0.4189 15.00 1163 -5 2372 110 3706 -87 13575 118 978744 -7 552038 30
0.4333 14.50 1037 -10 1951 97 2730 -91 13646 108 932103 -14 562198 18
0.4488 14.00 875 -15 1448 81 1749 -93 13215 98 863853 -22 557930 5
0.4654 13.50 678 -17 885 57 844 -80 12086 86 770468 -30 535246 -8
0.4833 13.00 461 -12 391 0 612 -10 10051 73 650288 -39 490516 -24
0.5027 12.50 306 16 611 -96 1264 13 6968 60 504303 -49 420551 -42
0.5236 12.00 423 55 1145 -133 1851 8 2897 51 337683 -58 323011 -62
0.5464 11.50 709 60 1574 -159 2161 -2 2173 -179 164924 -58 199473 -88
0.5712 11.00 952 49 1789 175 2134 -16 7325 174 92183 6 66949 -138
0.5984 10.50 1111 30 1707 148 1694 -29 12121 153 207499 26 92048 79
0.6283 10.00 1114 13 1296 117 955 -31 15525 127 298520 13 189289 37
0.6614 9.50 779 3 578 81 744 14 15202 101 279150 -1 233533 3
0.6981 9.00 403 25 249 -96 1330 27 9925 71 159925 -10 199564 -34
0.7392 8.50 698 55 818 -160 1232 13 2238 120 122665 36 84260 -81
0.7854 8.00 833 45 767 146 635 13 11357 145 184880 42 63663 66
0.8378 7.50 461 13 92 30 869 62 12571 95 116781 9 122297 0
0.8976 7.00 560 88 533 -154 794 17 2248 124 120334 84 23726 -83
0.9666 6.50 199 71 60 70 348 108 13670 110 20177 93 73462 28
1.0472 6.00 934 22 287 -169 520 40 6460 144 171480 28 30963 99
1.1424 5.50 210 101 218 -160 477 6 3890 39 66195 67 13488 123
1.2566 5.00 651 61 131 -92 562 169 7139 -169 93668 70 15132 -99
1.3963 4.50 755 178 109 73 850 -6 2402 24 68983 162 33511 91
1.5708 4.00 707 38 270 5 923 -125 7059 -115 100765 24 61090 -77
2.0944 3.00 138 86 738 -7 181 -108 8220 -20 34098 11 68572 102
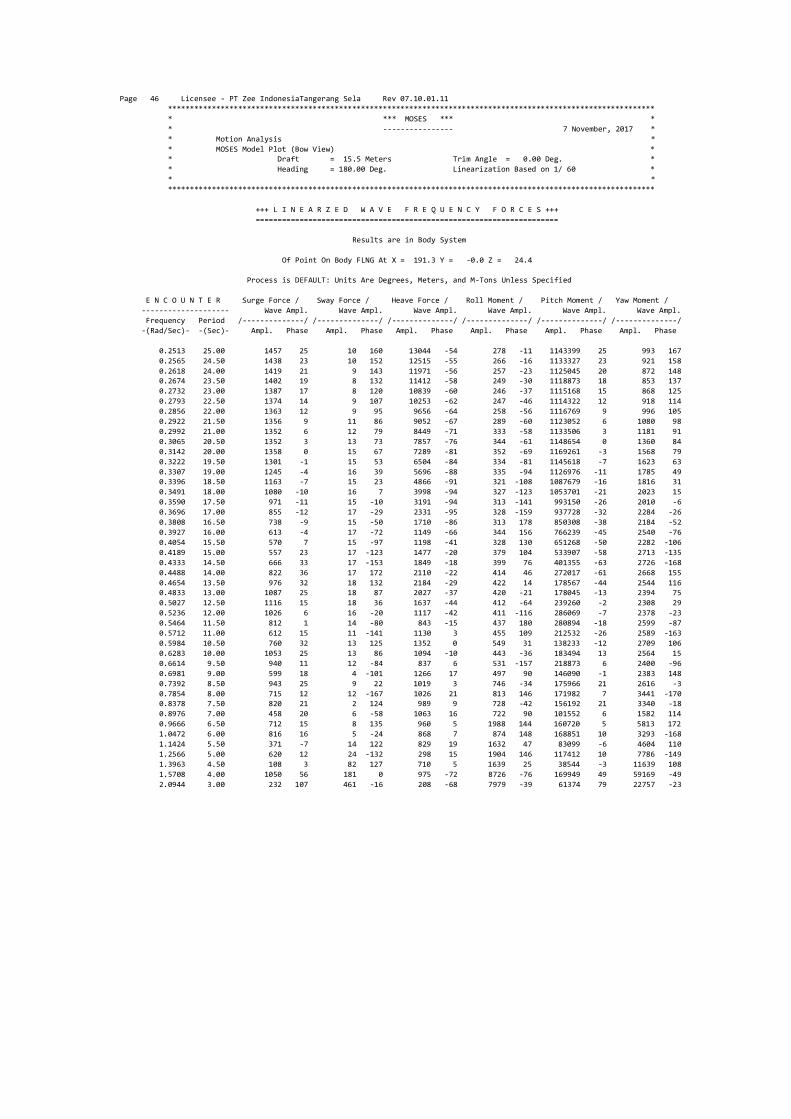
Page 46 Licensee - PT Zee IndonesiaTangerang Sela Rev 07.10.01.11
***************************************************************************************************************
* *** MOSES *** *
* ---------------- 7 November, 2017 *
* Motion Analysis *
* MOSES Model Plot (Bow View) *
* Draft = 15.5 Meters Trim Angle = 0.00 Deg. *
* Heading = 180.00 Deg. Linearization Based on 1/ 60 *
* *
***************************************************************************************************************
+++ L I N E A R Z E D W A V E F R E Q U E N C Y F O R C E S +++
=====================================================================
Results are in Body System
Of Point On Body FLNG At X = 191.3 Y = -0.0 Z = 24.4
Process is DEFAULT: Units Are Degrees, Meters, and M-Tons Unless Specified
E N C O U N T E R Surge Force / Sway Force / Heave Force / Roll Moment / Pitch Moment / Yaw Moment /
-------------------- Wave Ampl. Wave Ampl. Wave Ampl. Wave Ampl. Wave Ampl. Wave Ampl.
Frequency Period /--------------/ /--------------/ /--------------/ /--------------/ /--------------/ /--------------/
-(Rad/Sec)- -(Sec)- Ampl. Phase Ampl. Phase Ampl. Phase Ampl. Phase Ampl. Phase Ampl. Phase
0.2513 25.00 1457 25 10 160 13044 -54 278 -11 1143399 25 993 167
0.2565 24.50 1438 23 10 152 12515 -55 266 -16 1133327 23 921 158
0.2618 24.00 1419 21 9 143 11971 -56 257 -23 1125045 20 872 148
0.2674 23.50 1402 19 8 132 11412 -58 249 -30 1118873 18 853 137
0.2732 23.00 1387 17 8 120 10839 -60 246 -37 1115168 15 868 125
0.2793 22.50 1374 14 9 107 10253 -62 247 -46 1114322 12 918 114
0.2856 22.00 1363 12 9 95 9656 -64 258 -56 1116769 9 996 105
0.2922 21.50 1356 9 11 86 9052 -67 289 -60 1123052 6 1080 98
0.2992 21.00 1352 6 12 79 8449 -71 333 -58 1133506 3 1181 91
0.3065 20.50 1352 3 13 73 7857 -76 344 -61 1148654 0 1360 84
0.3142 20.00 1358 0 15 67 7289 -81 352 -69 1169261 -3 1568 79
0.3222 19.50 1301 -1 15 53 6504 -84 334 -81 1145618 -7 1623 63
0.3307 19.00 1245 -4 16 39 5696 -88 335 -94 1126976 -11 1785 49
0.3396 18.50 1163 -7 15 23 4866 -91 321 -108 1087679 -16 1816 31
0.3491 18.00 1080 -10 16 7 3998 -94 327 -123 1053701 -21 2023 15
0.3590 17.50 971 -11 15 -10 3191 -94 313 -141 993150 -26 2010 -6
0.3696 17.00 855 -12 17 -29 2331 -95 328 -159 937728 -32 2284 -26
0.3808 16.50 738 -9 15 -50 1710 -86 313 178 850308 -38 2184 -52
0.3927 16.00 613 -4 17 -72 1149 -66 344 156 766239 -45 2540 -76
0.4054 15.50 570 7 15 -97 1198 -41 328 130 651268 -50 2282 -106
0.4189 15.00 557 23 17 -123 1477 -20 379 104 533907 -58 2713 -135
0.4333 14.50 666 33 17 -153 1849 -18 399 76 401355 -63 2726 -168
0.4488 14.00 822 36 17 172 2110 -22 414 46 272017 -61 2668 155
0.4654 13.50 976 32 18 132 2184 -29 422 14 178567 -44 2544 116
0.4833 13.00 1087 25 18 87 2027 -37 420 -21 178045 -13 2394 75
0.5027 12.50 1116 15 18 36 1637 -44 412 -64 239260 -2 2308 29
0.5236 12.00 1026 6 16 -20 1117 -42 411 -116 286069 -7 2378 -23
0.5464 11.50 812 1 14 -80 843 -15 437 180 280894 -18 2599 -87
0.5712 11.00 612 15 11 -141 1130 3 455 109 212532 -26 2589 -163
0.5984 10.50 760 32 13 125 1352 0 549 31 138233 -12 2709 106
0.6283 10.00 1053 25 13 86 1094 -10 443 -36 183494 13 2564 15
0.6614 9.50 940 11 12 -84 837 6 531 -157 218873 6 2400 -96
0.6981 9.00 599 18 4 -101 1266 17 497 90 146090 -1 2383 148
0.7392 8.50 943 25 9 22 1019 3 746 -34 175966 21 2616 -3
0.7854 8.00 715 12 12 -167 1026 21 813 146 171982 7 3441 -170
0.8378 7.50 820 21 2 124 989 9 728 -42 156192 21 3340 -18
0.8976 7.00 458 20 6 -58 1063 16 722 90 101552 6 1582 114
0.9666 6.50 712 15 8 135 960 5 1988 144 160720 5 5813 172
1.0472 6.00 816 16 5 -24 868 7 874 148 168851 10 3293 -168
1.1424 5.50 371 -7 14 122 829 19 1632 47 83099 -6 4604 110
1.2566 5.00 620 12 24 -132 298 15 1904 146 117412 10 7786 -149
1.3963 4.50 108 3 82 127 710 5 1639 25 38544 -3 11639 108
1.5708 4.00 1050 56 181 0 975 -72 8726 -76 169949 49 59169 -49
2.0944 3.00 232 107 461 -16 208 -68 7979 -39 61374 79 22757 -23
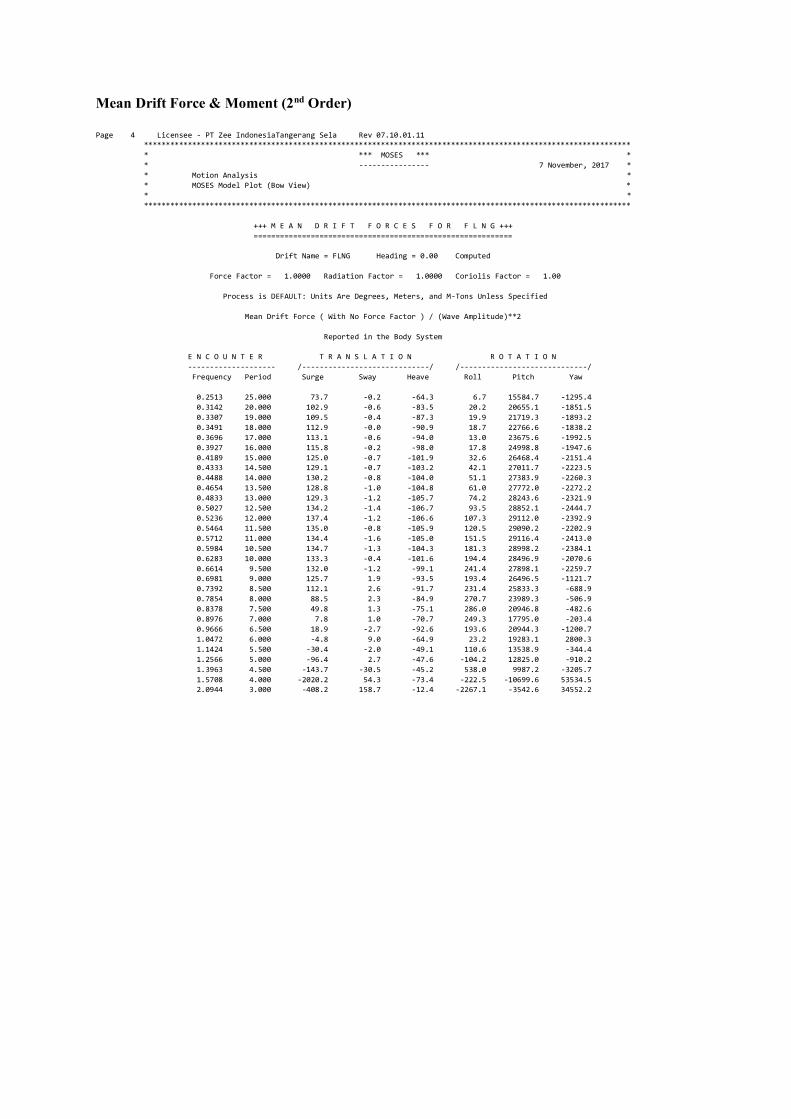
Mean Drift Force & Moment (2nd Order)
Page 4 Licensee - PT Zee IndonesiaTangerang Sela Rev 07.10.01.11
***************************************************************************************************************
* *** MOSES *** *
* ---------------- 7 November, 2017 *
* Motion Analysis *
* MOSES Model Plot (Bow View) *
* *
***************************************************************************************************************
+++ M E A N D R I F T F O R C E S F O R F L N G +++
===========================================================
Drift Name = FLNG Heading = 0.00 Computed
Force Factor = 1.0000 Radiation Factor = 1.0000 Coriolis Factor = 1.00
Process is DEFAULT: Units Are Degrees, Meters, and M-Tons Unless Specified
Mean Drift Force ( With No Force Factor ) / (Wave Amplitude)**2
Reported in the Body System
E N C O U N T E R T R A N S L A T I O N R O T A T I O N
-------------------- /-----------------------------/ /-----------------------------/
Frequency Period Surge Sway Heave Roll Pitch Yaw
0.2513 25.000 73.7 -0.2 -64.3 6.7 15584.7 -1295.4
0.3142 20.000 102.9 -0.6 -83.5 20.2 20655.1 -1851.5
0.3307 19.000 109.5 -0.4 -87.3 19.9 21719.3 -1893.2
0.3491 18.000 112.9 -0.0 -90.9 18.7 22766.6 -1838.2
0.3696 17.000 113.1 -0.6 -94.0 13.0 23675.6 -1992.5
0.3927 16.000 115.8 -0.2 -98.0 17.8 24998.8 -1947.6
0.4189 15.000 125.0 -0.7 -101.9 32.6 26468.4 -2151.4
0.4333 14.500 129.1 -0.7 -103.2 42.1 27011.7 -2223.5
0.4488 14.000 130.2 -0.8 -104.0 51.1 27383.9 -2260.3
0.4654 13.500 128.8 -1.0 -104.8 61.0 27772.0 -2272.2
0.4833 13.000 129.3 -1.2 -105.7 74.2 28243.6 -2321.9
0.5027 12.500 134.2 -1.4 -106.7 93.5 28852.1 -2444.7
0.5236 12.000 137.4 -1.2 -106.6 107.3 29112.0 -2392.9
0.5464 11.500 135.0 -0.8 -105.9 120.5 29090.2 -2202.9
0.5712 11.000 134.4 -1.6 -105.0 151.5 29116.4 -2413.0
0.5984 10.500 134.7 -1.3 -104.3 181.3 28998.2 -2384.1
0.6283 10.000 133.3 -0.4 -101.6 194.4 28496.9 -2070.6
0.6614 9.500 132.0 -1.2 -99.1 241.4 27898.1 -2259.7
0.6981 9.000 125.7 1.9 -93.5 193.4 26496.5 -1121.7
0.7392 8.500 112.1 2.6 -91.7 231.4 25833.3 -688.9
0.7854 8.000 88.5 2.3 -84.9 270.7 23989.3 -506.9
0.8378 7.500 49.8 1.3 -75.1 286.0 20946.8 -482.6
0.8976 7.000 7.8 1.0 -70.7 249.3 17795.0 -203.4
0.9666 6.500 18.9 -2.7 -92.6 193.6 20944.3 -1200.7
1.0472 6.000 -4.8 9.0 -64.9 23.2 19283.1 2800.3
1.1424 5.500 -30.4 -2.0 -49.1 110.6 13538.9 -344.4
1.2566 5.000 -96.4 2.7 -47.6 -104.2 12825.0 -910.2
1.3963 4.500 -143.7 -30.5 -45.2 538.0 9987.2 -3205.7
1.5708 4.000 -2020.2 54.3 -73.4 -222.5 -10699.6 53534.5
2.0944 3.000 -408.2 158.7 -12.4 -2267.1 -3542.6 34552.2
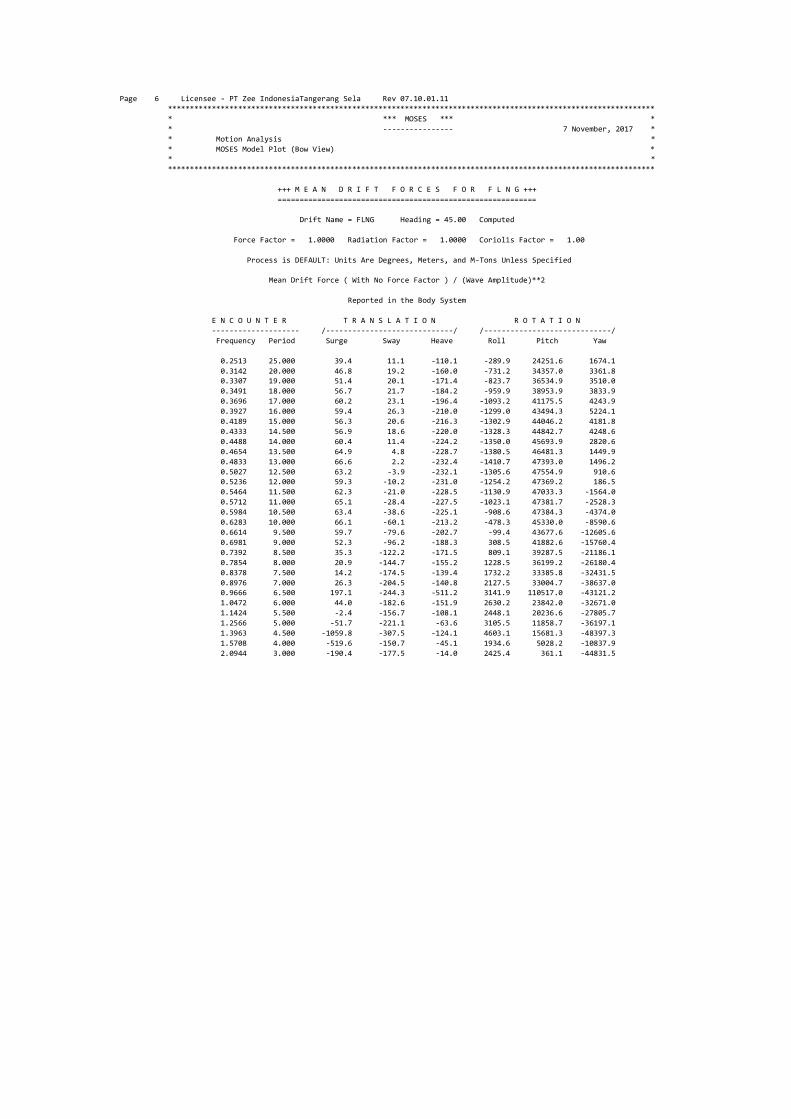
Page 6 Licensee - PT Zee IndonesiaTangerang Sela Rev 07.10.01.11
***************************************************************************************************************
* *** MOSES *** *
* ---------------- 7 November, 2017 *
* Motion Analysis *
* MOSES Model Plot (Bow View) *
* *
***************************************************************************************************************
+++ M E A N D R I F T F O R C E S F O R F L N G +++
===========================================================
Drift Name = FLNG Heading = 45.00 Computed
Force Factor = 1.0000 Radiation Factor = 1.0000 Coriolis Factor = 1.00
Process is DEFAULT: Units Are Degrees, Meters, and M-Tons Unless Specified
Mean Drift Force ( With No Force Factor ) / (Wave Amplitude)**2
Reported in the Body System
E N C O U N T E R T R A N S L A T I O N R O T A T I O N
-------------------- /-----------------------------/ /-----------------------------/
Frequency Period Surge Sway Heave Roll Pitch Yaw
0.2513 25.000 39.4 11.1 -110.1 -289.9 24251.6 1674.1
0.3142 20.000 46.8 19.2 -160.0 -731.2 34357.0 3361.8
0.3307 19.000 51.4 20.1 -171.4 -823.7 36534.9 3510.0
0.3491 18.000 56.7 21.7 -184.2 -959.9 38953.9 3833.9
0.3696 17.000 60.2 23.1 -196.4 -1093.2 41175.5 4243.9
0.3927 16.000 59.4 26.3 -210.0 -1299.0 43494.3 5224.1
0.4189 15.000 56.3 20.6 -216.3 -1302.9 44046.2 4181.8
0.4333 14.500 56.9 18.6 -220.0 -1328.3 44842.7 4248.6
0.4488 14.000 60.4 11.4 -224.2 -1350.0 45693.9 2820.6
0.4654 13.500 64.9 4.8 -228.7 -1380.5 46481.3 1449.9
0.4833 13.000 66.6 2.2 -232.4 -1410.7 47393.0 1496.2
0.5027 12.500 63.2 -3.9 -232.1 -1305.6 47554.9 910.6
0.5236 12.000 59.3 -10.2 -231.0 -1254.2 47369.2 186.5
0.5464 11.500 62.3 -21.0 -228.5 -1130.9 47033.3 -1564.0
0.5712 11.000 65.1 -28.4 -227.5 -1023.1 47381.7 -2528.3
0.5984 10.500 63.4 -38.6 -225.1 -908.6 47384.3 -4374.0
0.6283 10.000 66.1 -60.1 -213.2 -478.3 45330.0 -8590.6
0.6614 9.500 59.7 -79.6 -202.7 -99.4 43677.6 -12605.6
0.6981 9.000 52.3 -96.2 -188.3 308.5 41882.6 -15760.4
0.7392 8.500 35.3 -122.2 -171.5 809.1 39287.5 -21186.1
0.7854 8.000 20.9 -144.7 -155.2 1228.5 36199.2 -26180.4
0.8378 7.500 14.2 -174.5 -139.4 1732.2 33385.8 -32431.5
0.8976 7.000 26.3 -204.5 -140.8 2127.5 33004.7 -38637.0
0.9666 6.500 197.1 -244.3 -511.2 3141.9 110517.0 -43121.2
1.0472 6.000 44.0 -182.6 -151.9 2630.2 23842.0 -32671.0
1.1424 5.500 -2.4 -156.7 -108.1 2448.1 20236.6 -27805.7
1.2566 5.000 -51.7 -221.1 -63.6 3105.5 11858.7 -36197.1
1.3963 4.500 -1059.8 -307.5 -124.1 4603.1 15681.3 -48397.3
1.5708 4.000 -519.6 -150.7 -45.1 1934.6 5028.2 -10837.9
2.0944 3.000 -190.4 -177.5 -14.0 2425.4 361.1 -44831.5

Page 8 Licensee - PT Zee IndonesiaTangerang Sela Rev 07.10.01.11
***************************************************************************************************************
* *** MOSES *** *
* ---------------- 7 November, 2017 *
* Motion Analysis *
* MOSES Model Plot (Bow View) *
* *
***************************************************************************************************************
+++ M E A N D R I F T F O R C E S F O R F L N G +++
===========================================================
Drift Name = FLNG Heading = 90.00 Computed
Force Factor = 1.0000 Radiation Factor = 1.0000 Coriolis Factor = 1.00
Process is DEFAULT: Units Are Degrees, Meters, and M-Tons Unless Specified
Mean Drift Force ( With No Force Factor ) / (Wave Amplitude)**2
Reported in the Body System
E N C O U N T E R T R A N S L A T I O N R O T A T I O N
-------------------- /-----------------------------/ /-----------------------------/
Frequency Period Surge Sway Heave Roll Pitch Yaw
0.2513 25.000 5.2 -12.5 -122.3 183.8 26335.9 -1710.7
0.3142 20.000 5.9 -27.6 -188.2 288.7 40333.0 -3222.3
0.3307 19.000 5.8 -43.5 -199.1 396.5 42758.1 -5982.0
0.3491 18.000 5.8 -59.4 -209.2 511.6 45013.7 -8720.3
0.3696 17.000 5.6 -72.0 -218.6 576.0 47193.7 -10728.6
0.3927 16.000 5.3 -86.6 -223.1 689.7 48229.1 -13524.5
0.4189 15.000 5.1 -101.6 -222.2 831.0 48274.9 -16195.6
0.4333 14.500 4.9 -109.6 -219.3 911.1 47778.8 -17571.1
0.4488 14.000 4.6 -119.4 -214.5 1011.4 47002.1 -19059.5
0.4654 13.500 4.0 -128.5 -208.7 1106.2 45959.1 -20539.9
0.4833 13.000 3.1 -138.3 -201.5 1221.8 44695.4 -22190.7
0.5027 12.500 2.0 -147.6 -192.7 1322.3 43078.9 -23595.5
0.5236 12.000 1.0 -152.7 -190.0 1180.6 42696.4 -24176.2
0.5464 11.500 2.6 -158.5 -184.0 1101.7 41854.8 -25104.8
0.5712 11.000 2.2 -164.1 -180.0 940.9 41673.4 -26068.5
0.5984 10.500 0.2 -175.8 -168.0 1088.2 38786.8 -28748.2
0.6283 10.000 -3.8 -188.1 -156.5 1330.6 36430.1 -31625.9
0.6614 9.500 -6.0 -201.3 -145.6 1588.4 34472.1 -34959.8
0.6981 9.000 -3.9 -212.8 -129.1 1823.8 30657.9 -37960.3
0.7392 8.500 -6.8 -221.5 -124.8 1950.5 29875.4 -40205.2
0.7854 8.000 -11.5 -221.0 -121.5 1969.8 29296.8 -40517.5
0.8378 7.500 -31.9 -203.2 -171.5 1677.4 39689.8 -37821.1
0.8976 7.000 -28.1 -278.5 -158.6 3421.4 30452.3 -51986.5
0.9666 6.500 -114.0 -264.3 -140.0 3376.3 26574.9 -49213.1
1.0472 6.000 -71.3 -344.7 -220.4 5073.4 43455.9 -64998.1
1.1424 5.500 -43.5 -279.7 -51.9 3771.4 11027.7 -52706.5
1.2566 5.000 7.6 -366.3 -51.6 5083.7 11839.9 -72019.0
1.3963 4.500 -84.9 -31.0 -35.8 392.2 8438.5 -5707.6
1.5708 4.000 -467.1 -100.0 -42.9 1177.6 6221.1 -10206.5
2.0944 3.000 -39.5 -155.5 -3.9 2187.9 382.2 -30758.9

Page 10 Licensee - PT Zee IndonesiaTangerang Sela Rev 07.10.01.11
***************************************************************************************************************
* *** MOSES *** *
* ---------------- 7 November, 2017 *
* Motion Analysis *
* MOSES Model Plot (Bow View) *
* *
***************************************************************************************************************
+++ M E A N D R I F T F O R C E S F O R F L N G +++
===========================================================
Drift Name = FLNG Heading = 135.00 Computed
Force Factor = 1.0000 Radiation Factor = 1.0000 Coriolis Factor = 1.00
Process is DEFAULT: Units Are Degrees, Meters, and M-Tons Unless Specified
Mean Drift Force ( With No Force Factor ) / (Wave Amplitude)**2
Reported in the Body System
E N C O U N T E R T R A N S L A T I O N R O T A T I O N
-------------------- /-----------------------------/ /-----------------------------/
Frequency Period Surge Sway Heave Roll Pitch Yaw
0.2513 25.000 70.8 2.1 -108.5 -376.7 24153.4 157.7
0.3142 20.000 91.8 10.6 -155.0 -822.1 34235.6 2409.9
0.3307 19.000 97.7 14.2 -166.5 -954.7 36851.8 3420.2
0.3491 18.000 104.7 18.8 -180.1 -1150.5 40120.5 4855.8
0.3696 17.000 112.9 14.6 -189.2 -1203.5 41985.4 3713.3
0.3927 16.000 122.6 13.2 -199.1 -1292.4 44223.9 3266.0
0.4189 15.000 133.0 17.2 -212.7 -1544.1 47550.2 4255.6
0.4333 14.500 138.3 15.5 -217.3 -1606.3 48883.4 4040.4
0.4488 14.000 143.7 15.6 -223.8 -1734.0 50638.8 4231.4
0.4654 13.500 149.1 12.6 -227.5 -1774.9 51835.7 3818.1
0.4833 13.000 154.0 8.4 -228.7 -1746.3 52395.0 3034.5
0.5027 12.500 157.7 -0.1 -226.1 -1609.1 52293.2 1504.4
0.5236 12.000 159.6 -2.5 -228.2 -1642.2 52936.1 853.7
0.5464 11.500 159.0 -11.5 -226.3 -1543.8 52676.6 -1133.6
0.5712 11.000 160.4 -19.2 -228.0 -1545.1 53244.3 -2863.8
0.5984 10.500 170.0 -33.2 -222.3 -1307.3 51923.4 -6174.2
0.6283 10.000 136.2 -48.3 -218.1 -1187.0 50402.8 -9150.0
0.6614 9.500 136.7 -62.1 -211.6 -954.6 49214.6 -11562.9
0.6981 9.000 107.7 -91.6 -187.2 -284.0 42578.7 -17002.6
0.7392 8.500 111.1 -121.6 -166.6 375.1 37676.0 -22772.9
0.7854 8.000 84.9 -142.9 -151.2 863.4 33845.7 -25455.4
0.8378 7.500 71.8 -175.1 -138.7 1411.6 31175.6 -30766.3
0.8976 7.000 73.2 -204.8 -144.5 1914.4 31203.4 -36989.8
0.9666 6.500 133.5 -230.3 -400.8 2456.8 58010.4 -44526.1
1.0472 6.000 69.6 -170.9 -124.4 2105.3 32198.3 -36209.8
1.1424 5.500 18.5 -133.4 -116.6 1080.8 35101.3 -24966.9
1.2566 5.000 -119.7 -91.4 -129.7 -439.1 41500.7 -9672.0
1.3963 4.500 -623.2 -324.9 -97.7 4315.8 21382.2 -38570.2
1.5708 4.000 -1967.3 -50.1 -58.5 773.7 -11446.9 26242.0
2.0944 3.000 -577.9 -278.5 -14.1 3485.0 -959.6 -48532.0

Page 12 Licensee - PT Zee IndonesiaTangerang Sela Rev 07.10.01.11
***************************************************************************************************************
* *** MOSES *** *
* ---------------- 7 November, 2017 *
* Motion Analysis *
* MOSES Model Plot (Bow View) *
* *
***************************************************************************************************************
+++ M E A N D R I F T F O R C E S F O R F L N G +++
===========================================================
Drift Name = FLNG Heading = 180.00 Computed
Force Factor = 1.0000 Radiation Factor = 1.0000 Coriolis Factor = 1.00
Process is DEFAULT: Units Are Degrees, Meters, and M-Tons Unless Specified
Mean Drift Force ( With No Force Factor ) / (Wave Amplitude)**2
Reported in the Body System
E N C O U N T E R T R A N S L A T I O N R O T A T I O N
-------------------- /-----------------------------/ /-----------------------------/
Frequency Period Surge Sway Heave Roll Pitch Yaw
0.2513 25.000 68.4 -0.4 -62.5 9.9 14144.5 -1137.3
0.3142 20.000 70.1 -0.6 -80.7 11.5 17130.3 -1180.1
0.3307 19.000 68.9 -0.9 -84.3 15.0 17672.3 -1253.7
0.3491 18.000 66.8 -0.2 -87.9 6.4 18163.0 -1015.6
0.3696 17.000 63.7 -0.8 -91.1 12.9 18527.5 -1116.4
0.3927 16.000 59.6 -1.2 -94.3 17.4 18806.1 -1158.6
0.4189 15.000 55.1 -0.1 -97.3 7.2 19029.1 -761.9
0.4333 14.500 52.9 -0.6 -98.2 12.8 19027.9 -846.9
0.4488 14.000 50.6 -0.6 -98.7 14.2 18943.5 -823.0
0.4654 13.500 48.3 -0.6 -98.9 14.5 18825.4 -781.3
0.4833 13.000 46.0 -0.6 -99.1 15.8 18683.4 -761.5
0.5027 12.500 44.0 -1.2 -99.0 21.1 18523.7 -810.1
0.5236 12.000 42.3 -1.4 -98.2 24.7 18307.7 -799.6
0.5464 11.500 40.5 -1.5 -97.0 27.8 18063.5 -817.5
0.5712 11.000 36.5 -1.4 -95.2 29.1 17646.8 -757.1
0.5984 10.500 43.6 -1.6 -94.7 52.1 18085.4 -896.0
0.6283 10.000 42.5 -1.3 -92.5 48.4 17910.7 -834.5
0.6614 9.500 41.1 -1.5 -88.6 43.9 17478.3 -839.7
0.6981 9.000 35.0 -0.7 -84.7 51.4 16957.0 -512.3
0.7392 8.500 44.7 -1.9 -81.0 90.7 17186.5 -946.9
0.7854 8.000 43.8 -1.5 -73.6 82.9 16024.7 -769.2
0.8378 7.500 40.9 -1.3 -68.4 91.1 15077.8 -595.5
0.8976 7.000 29.3 -1.8 -70.6 70.6 15012.7 -551.3
0.9666 6.500 69.5 -1.0 -78.9 7.1 19289.7 178.0
1.0472 6.000 41.0 -0.7 -40.5 22.0 7858.5 306.9
1.1424 5.500 22.2 -7.3 -29.2 52.0 7589.1 -1213.1
1.2566 5.000 -7.9 -21.3 -27.1 139.8 7505.9 -4290.1
1.3963 4.500 -45.2 -13.0 -38.0 -6.3 13108.8 -603.9
1.5708 4.000 -2657.7 -27.8 -35.9 820.0 -26085.7 23445.9
2.0944 3.000 -934.3 -326.9 -7.4 4123.2 -5344.3 -62137.4

Response Amplitude Operator (RAO)
Page 20 Licensee - PT Zee IndonesiaTangerang Sela Rev 07.10.01.11
***************************************************************************************************************
* *** MOSES *** *
* ---------------- 7 November, 2017 *
* Motion Analysis *
* MOSES Model Plot (Bow View) *
* Draft = 15.5 Meters Trim Angle = 0.00 Deg. GMT = 6.3 Meters *
* Roll Gy. Radius = 21.5 Meters Pitch Gy. Radius = 124.6 Meters Yaw Gy. Radius = 125.5 Meters *
* Heading = 0.00 Deg. Forward Speed = 0.00 Knots Linearization Based on 1/ 60 *
* *
***************************************************************************************************************
+++ M O T I O N R E S P O N S E O P E R A T O R S +++
=========================================================
Results are in Body System
Of Point On Body FLNG At X = 191.3 Y = -0.0 Z = 24.4
Process is DEFAULT: Units Are Degrees, Meters, and M-Tons Unless Specified
E N C O U N T E R Surge / Sway / Heave / Roll / Pitch / Yaw /
-------------------- Wave Ampl. Wave Ampl. Wave Ampl. Wave Ampl. Wave Ampl. Wave Ampl.
Frequency Period /--------------/ /--------------/ /--------------/ /--------------/ /--------------/ /--------------/
-(Rad/Sec)- -(Sec)- Ampl. Phase Ampl. Phase Ampl. Phase Ampl. Phase Ampl. Phase Ampl. Phase
0.2513 25.00 0.728 159 0.002 90 0.777 70 0.027 86 0.335 -20 0.001 89
0.2565 24.50 0.684 161 0.002 95 0.745 71 0.032 91 0.333 -17 0.001 95
0.2618 24.00 0.645 164 0.002 101 0.711 73 0.038 95 0.332 -14 0.002 100
0.2674 23.50 0.609 167 0.001 110 0.677 75 0.047 98 0.333 -10 0.002 105
0.2732 23.00 0.576 171 0.001 141 0.642 78 0.060 100 0.336 -7 0.002 110
0.2793 22.50 0.549 175 0.001 -143 0.608 81 0.082 99 0.342 -3 0.002 116
0.2856 22.00 0.526 179 0.003 -123 0.575 85 0.120 92 0.351 1 0.002 122
0.2922 21.50 0.507 -176 0.008 -138 0.545 90 0.179 71 0.364 5 0.002 130
0.2992 21.00 0.494 -172 0.012 -168 0.519 96 0.211 37 0.382 9 0.002 134
0.3065 20.50 0.486 -168 0.012 169 0.501 103 0.172 12 0.405 12 0.003 136
0.3142 20.00 0.482 -165 0.011 159 0.493 110 0.129 1 0.435 16 0.003 139
0.3222 19.50 0.440 -160 0.010 160 0.445 116 0.100 1 0.436 21 0.003 145
0.3307 19.00 0.404 -155 0.009 163 0.402 124 0.082 4 0.444 26 0.003 152
0.3396 18.50 0.355 -150 0.009 170 0.348 131 0.069 11 0.437 32 0.003 160
0.3491 18.00 0.314 -143 0.008 177 0.300 142 0.061 18 0.439 39 0.003 168
0.3590 17.50 0.260 -138 0.008 -172 0.242 151 0.053 28 0.421 46 0.003 177
0.3696 17.00 0.214 -131 0.008 -162 0.194 168 0.049 38 0.414 54 0.003 -173
0.3808 16.50 0.160 -127 0.007 -150 0.137 -176 0.042 50 0.379 62 0.003 -162
0.3927 16.00 0.113 -119 0.007 -136 0.102 -140 0.039 63 0.359 72 0.003 -151
0.4054 15.50 0.069 -124 0.006 -119 0.067 -99 0.032 79 0.307 82 0.003 -137
0.4189 15.00 0.032 -137 0.006 -100 0.102 -48 0.030 97 0.273 97 0.003 -120
0.4333 14.50 0.031 164 0.005 -77 0.137 -15 0.025 120 0.219 114 0.003 -100
0.4488 14.00 0.052 152 0.005 -49 0.174 8 0.021 147 0.162 137 0.002 -74
0.4654 13.50 0.068 161 0.005 -17 0.203 30 0.018 -177 0.110 172 0.002 -41
0.4833 13.00 0.071 177 0.005 20 0.212 51 0.017 -136 0.089 -131 0.002 -1
0.5027 12.50 0.060 -161 0.005 58 0.192 73 0.016 -93 0.113 -80 0.002 41
0.5236 12.00 0.037 -129 0.004 99 0.140 102 0.016 -49 0.135 -47 0.002 84
0.5464 11.50 0.014 -54 0.004 145 0.083 154 0.015 -2 0.125 -16 0.002 129
0.5712 11.00 0.023 66 0.004 -155 0.072 -123 0.013 53 0.088 19 0.002 178
0.5984 10.50 0.039 126 0.003 -90 0.076 -62 0.011 123 0.046 82 0.002 -115
0.6283 10.00 0.042 -166 0.003 3 0.057 -3 0.009 -155 0.033 -165 0.002 -49
0.6614 9.50 0.028 -81 0.003 74 0.035 91 0.010 -54 0.031 -72 0.002 54
0.6981 9.00 0.022 43 0.002 -156 0.033 -135 0.009 45 0.021 19 0.002 148
0.7392 8.50 0.032 175 0.002 -57 0.024 -16 0.009 178 0.018 171 0.001 -91
0.7854 8.00 0.023 -33 0.002 90 0.021 141 0.008 -26 0.014 -36 0.001 61
0.8378 7.50 0.027 154 0.001 -50 0.015 -31 0.007 145 0.012 149 0.001 -128
0.8976 7.00 0.018 14 0.001 155 0.014 -164 0.004 16 0.006 6 0.001 106
0.9666 6.50 0.016 -49 0.000 0 0.011 94 0.005 -85 0.005 -34 0.000 0
1.0472 6.00 0.017 -77 0.001 151 0.005 71 0.005 -16 0.005 -65 0.000 0
1.1424 5.50 0.008 3 0.001 179 0.003 -157 0.006 72 0.002 -4 0.000 0
1.2566 5.00 0.009 -101 0.001 41 0.002 20 0.004 -38 0.002 -104 0.001 21
1.3963 4.50 0.001 -2 0.001 151 0.001 12 0.002 54 0.000 0 0.001 130
1.5708 4.00 0.007 -165 0.002 151 0.003 48 0.007 68 0.002 -161 0.002 97
2.0944 3.00 0.001 90 0.002 45 0.000 0 0.003 20 0.000 0 0.000 0
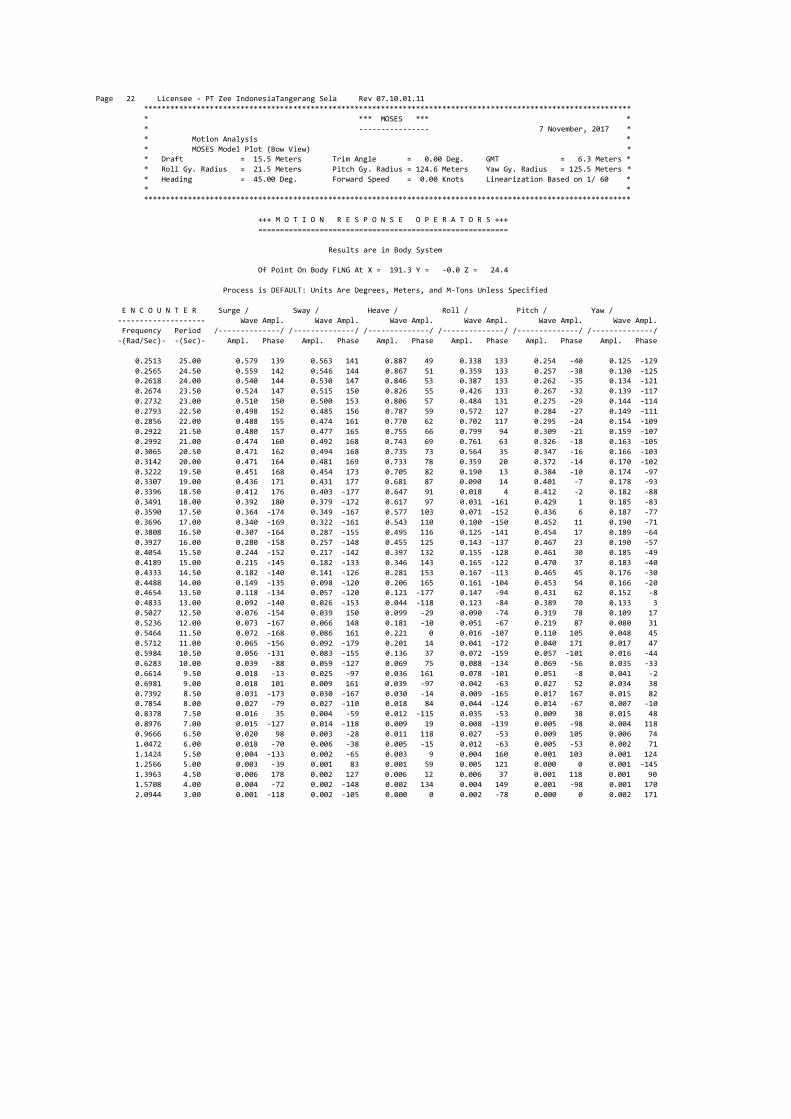
Page 22 Licensee - PT Zee IndonesiaTangerang Sela Rev 07.10.01.11
***************************************************************************************************************
* *** MOSES *** *
* ---------------- 7 November, 2017 *
* Motion Analysis *
* MOSES Model Plot (Bow View) *
* Draft = 15.5 Meters Trim Angle = 0.00 Deg. GMT = 6.3 Meters *
* Roll Gy. Radius = 21.5 Meters Pitch Gy. Radius = 124.6 Meters Yaw Gy. Radius = 125.5 Meters *
* Heading = 45.00 Deg. Forward Speed = 0.00 Knots Linearization Based on 1/ 60 *
* *
***************************************************************************************************************
+++ M O T I O N R E S P O N S E O P E R A T O R S +++
=========================================================
Results are in Body System
Of Point On Body FLNG At X = 191.3 Y = -0.0 Z = 24.4
Process is DEFAULT: Units Are Degrees, Meters, and M-Tons Unless Specified
E N C O U N T E R Surge / Sway / Heave / Roll / Pitch / Yaw /
-------------------- Wave Ampl. Wave Ampl. Wave Ampl. Wave Ampl. Wave Ampl. Wave Ampl.
Frequency Period /--------------/ /--------------/ /--------------/ /--------------/ /--------------/ /--------------/
-(Rad/Sec)- -(Sec)- Ampl. Phase Ampl. Phase Ampl. Phase Ampl. Phase Ampl. Phase Ampl. Phase
0.2513 25.00 0.579 139 0.563 141 0.887 49 0.338 133 0.254 -40 0.125 -129
0.2565 24.50 0.559 142 0.546 144 0.867 51 0.359 133 0.257 -38 0.130 -125
0.2618 24.00 0.540 144 0.530 147 0.846 53 0.387 133 0.262 -35 0.134 -121
0.2674 23.50 0.524 147 0.515 150 0.826 55 0.426 133 0.267 -32 0.139 -117
0.2732 23.00 0.510 150 0.500 153 0.806 57 0.484 131 0.275 -29 0.144 -114
0.2793 22.50 0.498 152 0.485 156 0.787 59 0.572 127 0.284 -27 0.149 -111
0.2856 22.00 0.488 155 0.474 161 0.770 62 0.702 117 0.295 -24 0.154 -109
0.2922 21.50 0.480 157 0.477 165 0.755 66 0.799 94 0.309 -21 0.159 -107
0.2992 21.00 0.474 160 0.492 168 0.743 69 0.761 63 0.326 -18 0.163 -105
0.3065 20.50 0.471 162 0.494 168 0.735 73 0.564 35 0.347 -16 0.166 -103
0.3142 20.00 0.471 164 0.481 169 0.733 78 0.359 20 0.372 -14 0.170 -102
0.3222 19.50 0.451 168 0.454 173 0.705 82 0.190 13 0.384 -10 0.174 -97
0.3307 19.00 0.436 171 0.431 177 0.681 87 0.090 14 0.401 -7 0.178 -93
0.3396 18.50 0.412 176 0.403 -177 0.647 91 0.018 4 0.412 -2 0.182 -88
0.3491 18.00 0.392 180 0.379 -172 0.617 97 0.031 -161 0.429 1 0.185 -83
0.3590 17.50 0.364 -174 0.349 -167 0.577 103 0.071 -152 0.436 6 0.187 -77
0.3696 17.00 0.340 -169 0.322 -161 0.543 110 0.100 -150 0.452 11 0.190 -71
0.3808 16.50 0.307 -164 0.287 -155 0.495 116 0.125 -141 0.454 17 0.189 -64
0.3927 16.00 0.280 -158 0.257 -148 0.455 125 0.143 -137 0.467 23 0.190 -57
0.4054 15.50 0.244 -152 0.217 -142 0.397 132 0.155 -128 0.461 30 0.185 -49
0.4189 15.00 0.215 -145 0.182 -133 0.346 143 0.165 -122 0.470 37 0.183 -40
0.4333 14.50 0.182 -140 0.141 -126 0.281 153 0.167 -113 0.465 45 0.176 -30
0.4488 14.00 0.149 -135 0.098 -120 0.206 165 0.161 -104 0.453 54 0.166 -20
0.4654 13.50 0.118 -134 0.057 -120 0.121 -177 0.147 -94 0.431 62 0.152 -8
0.4833 13.00 0.092 -140 0.026 -153 0.044 -118 0.123 -84 0.389 70 0.133 3
0.5027 12.50 0.076 -154 0.039 150 0.099 -29 0.090 -74 0.319 78 0.109 17
0.5236 12.00 0.073 -167 0.066 148 0.181 -10 0.051 -67 0.219 87 0.080 31
0.5464 11.50 0.072 -168 0.086 161 0.221 0 0.016 -107 0.110 105 0.048 45
0.5712 11.00 0.065 -156 0.092 -179 0.201 14 0.041 -172 0.040 171 0.017 47
0.5984 10.50 0.056 -131 0.083 -155 0.136 37 0.072 -159 0.057 -101 0.016 -44
0.6283 10.00 0.039 -88 0.059 -127 0.069 75 0.088 -134 0.069 -56 0.035 -33
0.6614 9.50 0.018 -13 0.025 -97 0.036 161 0.078 -101 0.051 -8 0.041 -2
0.6981 9.00 0.018 101 0.009 161 0.039 -97 0.042 -63 0.027 52 0.034 38
0.7392 8.50 0.031 -173 0.030 -167 0.030 -14 0.009 -165 0.017 167 0.015 82
0.7854 8.00 0.027 -79 0.027 -110 0.018 84 0.044 -124 0.014 -67 0.007 -10
0.8378 7.50 0.016 35 0.004 -59 0.012 -115 0.035 -53 0.009 38 0.015 48
0.8976 7.00 0.015 -127 0.014 -118 0.009 19 0.008 -139 0.005 -98 0.004 118
0.9666 6.50 0.020 98 0.003 -28 0.011 118 0.027 -53 0.009 105 0.006 74
1.0472 6.00 0.018 -70 0.006 -38 0.005 -15 0.012 -63 0.005 -53 0.002 71
1.1424 5.50 0.004 -133 0.002 -65 0.003 9 0.004 160 0.001 103 0.001 124
1.2566 5.00 0.003 -39 0.001 83 0.001 59 0.005 121 0.000 0 0.001 -145
1.3963 4.50 0.006 178 0.002 127 0.006 12 0.006 37 0.001 118 0.001 90
1.5708 4.00 0.004 -72 0.002 -148 0.002 134 0.004 149 0.001 -98 0.001 170
2.0944 3.00 0.001 -118 0.002 -105 0.000 0 0.002 -78 0.000 0 0.002 171

Page 24 Licensee - PT Zee IndonesiaTangerang Sela Rev 07.10.01.11
***************************************************************************************************************
* *** MOSES *** *
* ---------------- 7 November, 2017 *
* Motion Analysis *
* MOSES Model Plot (Bow View) *
* Draft = 15.5 Meters Trim Angle = 0.00 Deg. GMT = 6.3 Meters *
* Roll Gy. Radius = 21.5 Meters Pitch Gy. Radius = 124.6 Meters Yaw Gy. Radius = 125.5 Meters *
* Heading = 90.00 Deg. Forward Speed = 0.00 Knots Linearization Based on 1/ 60 *
* *
***************************************************************************************************************
+++ M O T I O N R E S P O N S E O P E R A T O R S +++
=========================================================
Results are in Body System
Of Point On Body FLNG At X = 191.3 Y = -0.0 Z = 24.4
Process is DEFAULT: Units Are Degrees, Meters, and M-Tons Unless Specified
E N C O U N T E R Surge / Sway / Heave / Roll / Pitch / Yaw /
-------------------- Wave Ampl. Wave Ampl. Wave Ampl. Wave Ampl. Wave Ampl. Wave Ampl.
Frequency Period /--------------/ /--------------/ /--------------/ /--------------/ /--------------/ /--------------/
-(Rad/Sec)- -(Sec)- Ampl. Phase Ampl. Phase Ampl. Phase Ampl. Phase Ampl. Phase Ampl. Phase
0.2513 25.00 0.024 179 0.882 91 1.007 0 0.615 83 0.001 0 0.001 -128
0.2565 24.50 0.023 179 0.877 91 1.011 0 0.682 81 0.001 -2 0.001 -130
0.2618 24.00 0.021 178 0.871 91 1.015 0 0.770 79 0.001 -4 0.001 -132
0.2674 23.50 0.020 177 0.863 91 1.019 0 0.880 75 0.001 -7 0.001 -133
0.2732 23.00 0.019 176 0.852 92 1.022 0 1.062 69 0.001 -9 0.002 -138
0.2793 22.50 0.017 176 0.847 93 1.026 0 1.201 58 0.001 -8 0.002 -145
0.2856 22.00 0.015 179 0.849 94 1.028 0 1.374 43 0.001 2 0.002 -158
0.2922 21.50 0.013 -174 0.864 96 1.029 0 1.494 23 0.001 17 0.003 -174
0.2992 21.00 0.013 -166 0.888 96 1.030 0 1.503 0 0.002 23 0.003 166
0.3065 20.50 0.014 -162 0.906 95 1.029 0 1.374 -22 0.003 18 0.002 148
0.3142 20.00 0.015 -162 0.906 93 1.030 0 1.172 -42 0.003 9 0.002 135
0.3222 19.50 0.015 -165 0.893 92 1.038 0 0.923 -58 0.004 0 0.002 128
0.3307 19.00 0.014 -168 0.875 92 1.045 0 0.703 -67 0.004 -8 0.001 128
0.3396 18.50 0.013 -170 0.856 92 1.054 0 0.536 -71 0.004 -15 0.001 131
0.3491 18.00 0.012 -172 0.839 92 1.063 0 0.419 -74 0.005 -22 0.001 136
0.3590 17.50 0.011 -173 0.822 92 1.076 0 0.325 -75 0.005 -29 0.001 141
0.3696 17.00 0.010 -174 0.805 92 1.089 0 0.255 -75 0.005 -36 0.001 145
0.3808 16.50 0.009 -174 0.787 92 1.106 -1 0.193 -74 0.005 -42 0.001 150
0.3927 16.00 0.008 -173 0.770 93 1.126 -1 0.145 -73 0.005 -50 0.001 153
0.4054 15.50 0.007 -170 0.749 93 1.152 -2 0.099 -69 0.005 -56 0.001 156
0.4189 15.00 0.006 -164 0.730 94 1.183 -3 0.064 -62 0.005 -64 0.001 160
0.4333 14.50 0.005 -155 0.708 94 1.220 -5 0.033 -40 0.005 -69 0.001 164
0.4488 14.00 0.004 -142 0.684 95 1.263 -8 0.023 29 0.005 -73 0.001 169
0.4654 13.50 0.004 -130 0.658 96 1.310 -12 0.044 68 0.005 -74 0.001 176
0.4833 13.00 0.005 -120 0.630 98 1.354 -17 0.070 80 0.006 -75 0.001 -174
0.5027 12.50 0.005 -113 0.601 99 1.378 -25 0.095 84 0.006 -80 0.001 -165
0.5236 12.00 0.005 -105 0.570 101 1.354 -35 0.114 87 0.007 -92 0.001 -156
0.5464 11.50 0.006 -101 0.538 104 1.242 -47 0.127 91 0.006 -101 0.001 -155
0.5712 11.00 0.007 -105 0.504 106 1.035 -60 0.135 97 0.006 -95 0.001 -162
0.5984 10.50 0.006 -111 0.468 110 0.788 -69 0.144 105 0.006 -105 0.001 -164
0.6283 10.00 0.005 -124 0.429 114 0.566 -74 0.152 112 0.005 -130 0.001 -177
0.6614 9.50 0.005 -122 0.389 119 0.399 -76 0.159 120 0.005 -142 0.001 -156
0.6981 9.00 0.005 -107 0.349 126 0.278 -74 0.165 128 0.004 -127 0.001 -162
0.7392 8.50 0.004 -102 0.308 134 0.185 -67 0.166 137 0.003 -137 0.001 -141
0.7854 8.00 0.004 -95 0.268 144 0.120 -58 0.162 148 0.003 -135 0.001 -131
0.8378 7.50 0.003 -113 0.229 156 0.078 -40 0.157 161 0.002 -174 0.001 -109
0.8976 7.00 0.004 -77 0.191 171 0.049 -36 0.147 175 0.002 -115 0.001 -120
0.9666 6.50 0.009 -74 0.149 -170 0.032 -10 0.128 -168 0.004 -79 0.001 -127
1.0472 6.00 0.006 -60 0.134 -123 0.018 23 0.125 -125 0.001 -87 0.001 -50
1.1424 5.50 0.002 -88 0.091 -102 0.004 54 0.091 -100 0.000 0 0.000 0
1.2566 5.00 0.002 101 0.062 -58 0.015 94 0.070 -57 0.001 73 0.000 0
1.3963 4.50 0.002 -174 0.010 70 0.001 124 0.005 -38 0.001 163 0.001 95
1.5708 4.00 0.002 -148 0.025 111 0.005 -12 0.030 107 0.001 -150 0.001 120
2.0944 3.00 0.000 0 0.007 106 0.000 0 0.008 107 0.000 0 0.000 0

Page 26 Licensee - PT Zee IndonesiaTangerang Sela Rev 07.10.01.11
***************************************************************************************************************
* *** MOSES *** *
* ---------------- 7 November, 2017 *
* Motion Analysis *
* MOSES Model Plot (Bow View) *
* Draft = 15.5 Meters Trim Angle = 0.00 Deg. GMT = 6.3 Meters *
* Roll Gy. Radius = 21.5 Meters Pitch Gy. Radius = 124.6 Meters Yaw Gy. Radius = 125.5 Meters *
* Heading = 135.00 Deg. Forward Speed = 0.00 Knots Linearization Based on 1/ 60 *
* *
***************************************************************************************************************
+++ M O T I O N R E S P O N S E O P E R A T O R S +++
=========================================================
Results are in Body System
Of Point On Body FLNG At X = 191.3 Y = -0.0 Z = 24.4
Process is DEFAULT: Units Are Degrees, Meters, and M-Tons Unless Specified
E N C O U N T E R Surge / Sway / Heave / Roll / Pitch / Yaw /
-------------------- Wave Ampl. Wave Ampl. Wave Ampl. Wave Ampl. Wave Ampl. Wave Ampl.
Frequency Period /--------------/ /--------------/ /--------------/ /--------------/ /--------------/ /--------------/
-(Rad/Sec)- -(Sec)- Ampl. Phase Ampl. Phase Ampl. Phase Ampl. Phase Ampl. Phase Ampl. Phase
0.2513 25.00 0.588 -139 0.563 41 0.884 -49 0.336 29 0.259 40 0.126 -50
0.2565 24.50 0.575 -141 0.543 38 0.872 -51 0.353 27 0.266 38 0.131 -55
0.2618 24.00 0.563 -143 0.524 35 0.860 -53 0.376 24 0.274 36 0.136 -59
0.2674 23.50 0.552 -146 0.508 33 0.846 -55 0.409 20 0.284 33 0.141 -62
0.2732 23.00 0.542 -148 0.492 30 0.832 -57 0.459 15 0.294 31 0.146 -65
0.2793 22.50 0.532 -151 0.477 27 0.817 -60 0.535 6 0.306 28 0.151 -68
0.2856 22.00 0.522 -154 0.466 26 0.801 -63 0.641 -10 0.319 25 0.155 -71
0.2922 21.50 0.515 -157 0.468 25 0.783 -66 0.732 -40 0.334 22 0.159 -73
0.2992 21.00 0.508 -160 0.485 22 0.765 -69 0.690 -80 0.352 18 0.164 -75
0.3065 20.50 0.501 -163 0.490 17 0.745 -73 0.505 -120 0.371 15 0.168 -76
0.3142 20.00 0.494 -167 0.479 13 0.725 -77 0.324 -150 0.393 11 0.172 -78
0.3222 19.50 0.476 -172 0.450 8 0.698 -80 0.159 -167 0.409 6 0.176 -83
0.3307 19.00 0.457 -176 0.427 4 0.670 -84 0.069 164 0.427 1 0.181 -87
0.3396 18.50 0.434 178 0.398 0 0.639 -89 0.029 72 0.443 -3 0.184 -92
0.3491 18.00 0.412 172 0.375 -5 0.605 -93 0.062 17 0.461 -9 0.188 -97
0.3590 17.50 0.383 166 0.343 -10 0.568 -98 0.102 6 0.473 -16 0.189 -103
0.3696 17.00 0.353 159 0.317 -17 0.527 -104 0.135 1 0.486 -23 0.192 -109
0.3808 16.50 0.318 151 0.280 -23 0.482 -109 0.158 -9 0.494 -31 0.191 -116
0.3927 16.00 0.285 143 0.251 -31 0.433 -116 0.179 -17 0.502 -39 0.192 -123
0.4054 15.50 0.247 134 0.208 -39 0.379 -122 0.188 -29 0.502 -48 0.186 -131
0.4189 15.00 0.212 124 0.174 -49 0.316 -131 0.203 -37 0.503 -59 0.185 -140
0.4333 14.50 0.175 112 0.133 -61 0.247 -138 0.205 -49 0.496 -70 0.177 -150
0.4488 14.00 0.140 95 0.089 -76 0.168 -144 0.201 -62 0.483 -83 0.166 -161
0.4654 13.50 0.106 72 0.046 -99 0.088 -136 0.187 -77 0.458 -99 0.151 -173
0.4833 13.00 0.078 37 0.017 178 0.076 -75 0.162 -94 0.412 -118 0.132 171
0.5027 12.50 0.066 -13 0.041 95 0.161 -66 0.126 -113 0.333 -140 0.108 154
0.5236 12.00 0.070 -63 0.069 67 0.240 -85 0.081 -137 0.219 -165 0.078 134
0.5464 11.50 0.074 -99 0.088 44 0.268 -112 0.034 -173 0.096 179 0.046 109
0.5712 11.00 0.069 -125 0.093 21 0.233 -142 0.022 47 0.044 -128 0.014 62
0.5984 10.50 0.061 -145 0.083 -4 0.152 -168 0.058 -5 0.083 -118 0.018 -81
0.6283 10.00 0.050 -158 0.058 -32 0.069 179 0.084 -39 0.095 -139 0.036 -124
0.6614 9.50 0.030 -161 0.022 -64 0.045 -145 0.085 -71 0.069 -161 0.042 -159
0.6981 9.00 0.019 -133 0.012 90 0.060 -139 0.056 -108 0.032 -175 0.033 162
0.7392 8.50 0.031 -117 0.033 41 0.043 -156 0.008 -137 0.020 -132 0.013 114
0.7854 8.00 0.030 -129 0.027 -8 0.018 -159 0.039 -23 0.024 -129 0.009 -98
0.8378 7.50 0.016 -159 0.000 0 0.019 -117 0.044 -81 0.013 -163 0.015 -166
0.8976 7.00 0.017 -88 0.016 41 0.014 -153 0.003 -84 0.010 -92 0.003 108
0.9666 6.50 0.005 -104 0.001 -29 0.005 -66 0.035 -67 0.001 -74 0.007 -142
1.0472 6.00 0.021 -151 0.007 28 0.006 -133 0.013 -31 0.009 -145 0.003 -71
1.1424 5.50 0.004 -72 0.004 26 0.004 -171 0.007 -143 0.003 -111 0.001 -50
1.2566 5.00 0.010 -116 0.002 97 0.004 -8 0.010 12 0.003 -105 0.001 85
1.3963 4.50 0.010 -1 0.001 -103 0.005 173 0.003 -155 0.002 -18 0.002 -87
1.5708 4.00 0.007 -142 0.003 -170 0.004 53 0.006 61 0.002 -157 0.002 103
2.0944 3.00 0.001 -89 0.004 174 0.000 0 0.004 159 0.000 0 0.001 -76

Page 28 Licensee - PT Zee IndonesiaTangerang Sela Rev 07.10.01.11
***************************************************************************************************************
* *** MOSES *** *
* ---------------- 7 November, 2017 *
* Motion Analysis *
* MOSES Model Plot (Bow View) *
* Draft = 15.5 Meters Trim Angle = 0.00 Deg. GMT = 6.3 Meters *
* Roll Gy. Radius = 21.5 Meters Pitch Gy. Radius = 124.6 Meters Yaw Gy. Radius = 125.5 Meters *
* Heading = 180.00 Deg. Forward Speed = 0.00 Knots Linearization Based on 1/ 60 *
* *
***************************************************************************************************************
+++ M O T I O N R E S P O N S E O P E R A T O R S +++
=========================================================
Results are in Body System
Of Point On Body FLNG At X = 191.3 Y = -0.0 Z = 24.4
Process is DEFAULT: Units Are Degrees, Meters, and M-Tons Unless Specified
E N C O U N T E R Surge / Sway / Heave / Roll / Pitch / Yaw /
-------------------- Wave Ampl. Wave Ampl. Wave Ampl. Wave Ampl. Wave Ampl. Wave Ampl.
Frequency Period /--------------/ /--------------/ /--------------/ /--------------/ /--------------/ /--------------/
-(Rad/Sec)- -(Sec)- Ampl. Phase Ampl. Phase Ampl. Phase Ampl. Phase Ampl. Phase Ampl. Phase
0.2513 25.00 0.742 -158 0.002 -100 0.768 -70 0.027 -103 0.343 20 0.001 -101
0.2565 24.50 0.711 -160 0.002 -107 0.744 -72 0.032 -111 0.347 17 0.001 -109
0.2618 24.00 0.681 -163 0.002 -112 0.719 -75 0.039 -118 0.352 14 0.002 -116
0.2674 23.50 0.652 -166 0.001 -112 0.692 -77 0.048 -127 0.358 11 0.002 -122
0.2732 23.00 0.626 -170 0.001 -85 0.664 -80 0.063 -137 0.366 7 0.002 -127
0.2793 22.50 0.602 -174 0.001 -25 0.634 -83 0.087 -149 0.376 3 0.002 -132
0.2856 22.00 0.579 -178 0.004 -20 0.603 -86 0.128 -166 0.387 0 0.002 -136
0.2922 21.50 0.558 177 0.008 -46 0.570 -91 0.184 162 0.401 -5 0.002 -138
0.2992 21.00 0.539 172 0.012 -87 0.536 -96 0.205 118 0.418 -10 0.002 -145
0.3065 20.50 0.523 167 0.012 -123 0.502 -101 0.163 79 0.439 -15 0.003 -155
0.3142 20.00 0.507 161 0.010 -144 0.468 -108 0.118 56 0.463 -21 0.003 -163
0.3222 19.50 0.466 155 0.009 -160 0.423 -112 0.090 39 0.468 -27 0.003 -174
0.3307 19.00 0.425 148 0.008 -174 0.375 -118 0.073 25 0.475 -35 0.003 175
0.3396 18.50 0.376 141 0.008 172 0.325 -121 0.060 11 0.473 -42 0.003 163
0.3491 18.00 0.328 132 0.007 160 0.271 -126 0.052 -1 0.471 -50 0.003 151
0.3590 17.50 0.271 124 0.007 147 0.221 -128 0.044 -14 0.457 -59 0.003 136
0.3696 17.00 0.217 113 0.006 133 0.164 -130 0.039 -28 0.442 -69 0.003 122
0.3808 16.50 0.159 105 0.006 119 0.124 -122 0.033 -43 0.410 -78 0.002 105
0.3927 16.00 0.104 90 0.005 103 0.087 -102 0.029 -58 0.378 -89 0.002 88
0.4054 15.50 0.053 81 0.004 87 0.100 -79 0.024 -75 0.330 -99 0.002 69
0.4189 15.00 0.011 1 0.004 69 0.132 -63 0.020 -94 0.277 -111 0.002 47
0.4333 14.50 0.038 -102 0.003 47 0.175 -66 0.016 -114 0.216 -120 0.001 23
0.4488 14.00 0.068 -124 0.002 21 0.213 -75 0.012 -138 0.153 -124 0.001 -5
0.4654 13.50 0.087 -141 0.002 -12 0.235 -88 0.008 -165 0.105 -114 0.001 -40
0.4833 13.00 0.092 -159 0.001 -66 0.233 -105 0.004 156 0.111 -90 0.000 0
0.5027 12.50 0.080 -178 0.001 -150 0.199 -122 0.002 79 0.157 -92 0.000 0
0.5236 12.00 0.052 169 0.001 141 0.141 -132 0.003 -13 0.184 -113 0.001 127
0.5464 11.50 0.028 -172 0.001 92 0.108 -122 0.004 -58 0.162 -139 0.001 76
0.5712 11.00 0.033 -133 0.001 48 0.128 -122 0.004 -101 0.104 -161 0.001 18
0.5984 10.50 0.049 -134 0.001 -15 0.124 -141 0.004 -153 0.055 -158 0.001 -51
0.6283 10.00 0.057 -147 0.001 -55 0.079 -161 0.002 153 0.058 -138 0.000 0
0.6614 9.50 0.043 -161 0.001 117 0.049 -152 0.003 7 0.054 -153 0.001 91
0.6981 9.00 0.028 -152 0.000 0 0.057 -148 0.003 -89 0.029 -167 0.000 0
0.7392 8.50 0.040 -148 0.000 0 0.036 -166 0.003 155 0.029 -146 0.000 0
0.7854 8.00 0.026 -161 0.001 54 0.029 -152 0.003 -34 0.022 -164 0.001 26
0.8378 7.50 0.028 -154 0.000 0 0.022 -168 0.002 146 0.017 -152 0.000 0
0.8976 7.00 0.014 -156 0.000 0 0.019 -155 0.002 -96 0.008 -169 0.000 0
0.9666 6.50 0.018 -160 0.000 0 0.013 -169 0.005 -33 0.011 -170 0.001 3
1.0472 6.00 0.018 -156 0.000 0 0.009 -167 0.002 -30 0.009 -164 0.000 0
1.1424 5.50 0.007 174 0.000 0 0.007 -158 0.003 -131 0.004 175 0.000 0
1.2566 5.00 0.010 -165 0.000 0 0.002 -161 0.003 -31 0.004 -166 0.000 0
1.3963 4.50 0.001 -172 0.001 -51 0.004 -174 0.002 -155 0.001 177 0.001 -71
1.5708 4.00 0.011 -124 0.002 -173 0.004 106 0.008 102 0.003 -132 0.002 131
2.0944 3.00 0.001 -70 0.002 165 0.000 0 0.004 140 0.001 -101 0.000 0

APPENDIX C
Wind Area Calculation
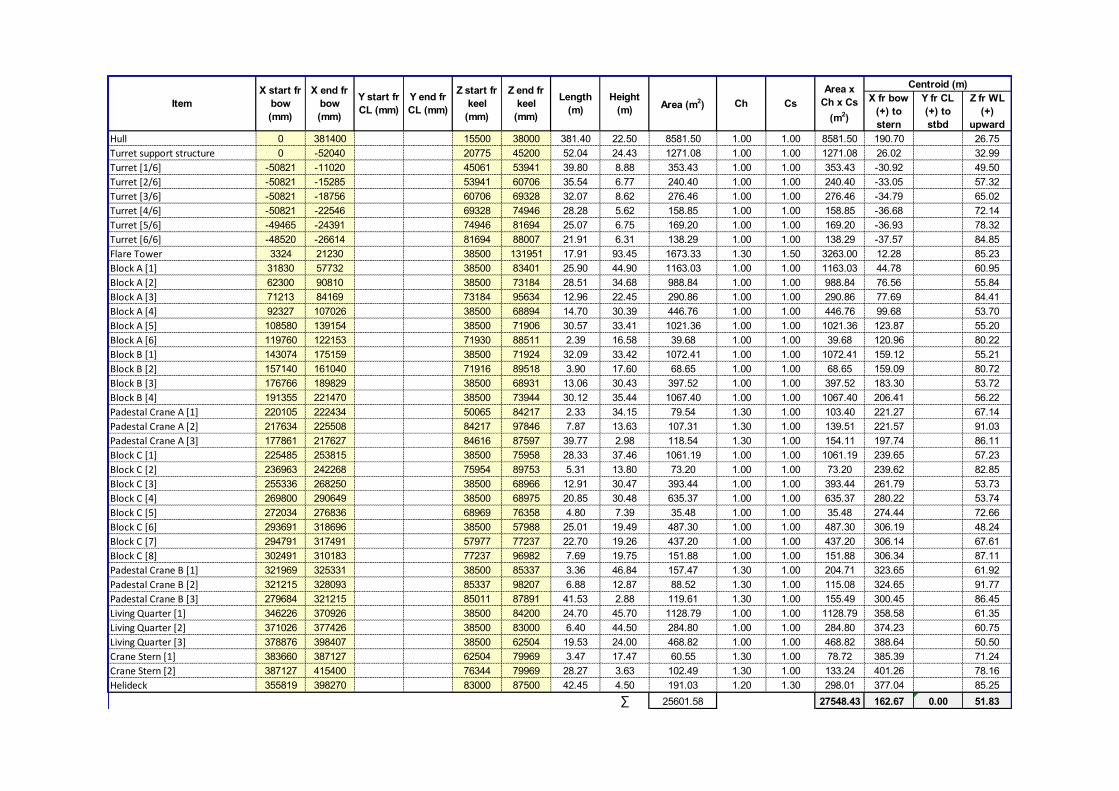
X fr bow
(+) to
stern
Y fr CL
(+) to
stbd
Z fr WL
(+)
upward
Hull 0 381400 15500 38000 381.40 22.50 8581.50 1.00 1.00 8581.50 190.70 26.75
Turret support structure 0 -52040 20775 45200 52.04 24.43 1271.08 1.00 1.00 1271.08 26.02 32.99
Turret [1/6] -50821 -11020 45061 53941 39.80 8.88 353.43 1.00 1.00 353.43 -30.92 49.50
Turret [2/6] -50821 -15285 53941 60706 35.54 6.77 240.40 1.00 1.00 240.40 -33.05 57.32
Turret [3/6] -50821 -18756 60706 69328 32.07 8.62 276.46 1.00 1.00 276.46 -34.79 65.02
Turret [4/6] -50821 -22546 69328 74946 28.28 5.62 158.85 1.00 1.00 158.85 -36.68 72.14
Turret [5/6] -49465 -24391 74946 81694 25.07 6.75 169.20 1.00 1.00 169.20 -36.93 78.32
Turret [6/6] -48520 -26614 81694 88007 21.91 6.31 138.29 1.00 1.00 138.29 -37.57 84.85
Flare Tower 3324 21230 38500 131951 17.91 93.45 1673.33 1.30 1.50 3263.00 12.28 85.23
Block A [1] 31830 57732 38500 83401 25.90 44.90 1163.03 1.00 1.00 1163.03 44.78 60.95
Block A [2] 62300 90810 38500 73184 28.51 34.68 988.84 1.00 1.00 988.84 76.56 55.84
Block A [3] 71213 84169 73184 95634 12.96 22.45 290.86 1.00 1.00 290.86 77.69 84.41
Block A [4] 92327 107026 38500 68894 14.70 30.39 446.76 1.00 1.00 446.76 99.68 53.70
Block A [5] 108580 139154 38500 71906 30.57 33.41 1021.36 1.00 1.00 1021.36 123.87 55.20
Block A [6] 119760 122153 71930 88511 2.39 16.58 39.68 1.00 1.00 39.68 120.96 80.22
Block B [1] 143074 175159 38500 71924 32.09 33.42 1072.41 1.00 1.00 1072.41 159.12 55.21
Block B [2] 157140 161040 71916 89518 3.90 17.60 68.65 1.00 1.00 68.65 159.09 80.72
Block B [3] 176766 189829 38500 68931 13.06 30.43 397.52 1.00 1.00 397.52 183.30 53.72
Block B [4] 191355 221470 38500 73944 30.12 35.44 1067.40 1.00 1.00 1067.40 206.41 56.22
Padestal Crane A [1] 220105 222434 50065 84217 2.33 34.15 79.54 1.30 1.00 103.40 221.27 67.14
Padestal Crane A [2] 217634 225508 84217 97846 7.87 13.63 107.31 1.30 1.00 139.51 221.57 91.03
Padestal Crane A [3] 177861 217627 84616 87597 39.77 2.98 118.54 1.30 1.00 154.11 197.74 86.11
Block C [1] 225485 253815 38500 75958 28.33 37.46 1061.19 1.00 1.00 1061.19 239.65 57.23
Block C [2] 236963 242268 75954 89753 5.31 13.80 73.20 1.00 1.00 73.20 239.62 82.85
Block C [3] 255336 268250 38500 68966 12.91 30.47 393.44 1.00 1.00 393.44 261.79 53.73
Block C [4] 269800 290649 38500 68975 20.85 30.48 635.37 1.00 1.00 635.37 280.22 53.74
Block C [5] 272034 276836 68969 76358 4.80 7.39 35.48 1.00 1.00 35.48 274.44 72.66
Block C [6] 293691 318696 38500 57988 25.01 19.49 487.30 1.00 1.00 487.30 306.19 48.24
Block C [7] 294791 317491 57977 77237 22.70 19.26 437.20 1.00 1.00 437.20 306.14 67.61
Block C [8] 302491 310183 77237 96982 7.69 19.75 151.88 1.00 1.00 151.88 306.34 87.11
Padestal Crane B [1] 321969 325331 38500 85337 3.36 46.84 157.47 1.30 1.00 204.71 323.65 61.92
Padestal Crane B [2] 321215 328093 85337 98207 6.88 12.87 88.52 1.30 1.00 115.08 324.65 91.77
Padestal Crane B [3] 279684 321215 85011 87891 41.53 2.88 119.61 1.30 1.00 155.49 300.45 86.45
Living Quarter [1] 346226 370926 38500 84200 24.70 45.70 1128.79 1.00 1.00 1128.79 358.58 61.35
Living Quarter [2] 371026 377426 38500 83000 6.40 44.50 284.80 1.00 1.00 284.80 374.23 60.75
Living Quarter [3] 378876 398407 38500 62504 19.53 24.00 468.82 1.00 1.00 468.82 388.64 50.50
Crane Stern [1] 383660 387127 62504 79969 3.47 17.47 60.55 1.30 1.00 78.72 385.39 71.24
Crane Stern [2] 387127 415400 76344 79969 28.27 3.63 102.49 1.30 1.00 133.24 401.26 78.16
Helideck 355819 398270 83000 87500 42.45 4.50 191.03 1.20 1.30 298.01 377.04 85.25
∑ 25601.58 27548.43 162.67 0.00 51.83
Area x
Ch x Cs
(m2)
Centroid (m)Z end fr
keel
(mm)
Length
(m)
Height
(m)Area (m
2) Ch CsItem
X start fr
bow
(mm)
X end fr
bow
(mm)
Y start fr
CL (mm)
Y end fr
CL (mm)
Z start fr
keel
(mm)
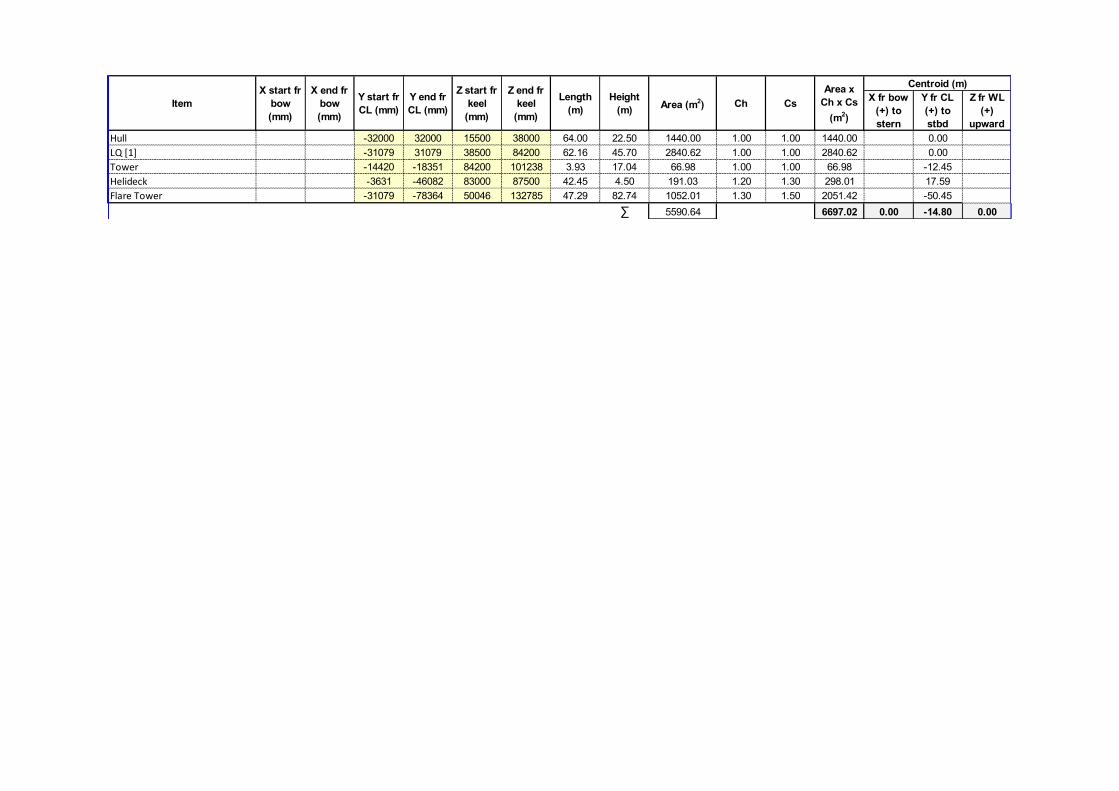
X fr bow
(+) to
stern
Y fr CL
(+) to
stbd
Z fr WL
(+)
upward
Hull -32000 32000 15500 38000 64.00 22.50 1440.00 1.00 1.00 1440.00 0.00
LQ [1] -31079 31079 38500 84200 62.16 45.70 2840.62 1.00 1.00 2840.62 0.00
Tower -14420 -18351 84200 101238 3.93 17.04 66.98 1.00 1.00 66.98 -12.45
Helideck -3631 -46082 83000 87500 42.45 4.50 191.03 1.20 1.30 298.01 17.59
Flare Tower -31079 -78364 50046 132785 47.29 82.74 1052.01 1.30 1.50 2051.42 -50.45
∑ 5590.64 6697.02 0.00 -14.80 0.00
Height
(m)Area (m
2) Ch Cs
Area x
Ch x Cs
(m2)
Centroid (m)
Item
X start fr
bow
(mm)
X end fr
bow
(mm)
Y start fr
CL (mm)
Y end fr
CL (mm)
Z start fr
keel
(mm)
Z end fr
keel
(mm)
Length
(m)

APPENDIX D
Fatigue Load Case

Load Case Fatigue Analysis
Load Case
Environmental
Direction
(deg)
Hs
(m)
Tp
(sec)
Wind speed
(m/s)
Current
speed
(m/s)
1 0 0.15 3.05 4.29 0.68
2 45 0.15 3.05 4.29 0.68
3 90 0.15 3.05 4.29 0.68
4 135 0.15 3.05 4.29 0.68
5 180 0.15 3.05 4.29 0.68
6 225 0.15 3.05 4.29 0.68
7 270 0.15 3.05 4.29 0.68
8 315 0.15 3.05 4.29 0.68
9 0 0.225 3.35 6.06 0.68
10 45 0.225 3.35 6.06 0.68
11 90 0.225 3.35 6.06 0.68
12 135 0.225 3.35 6.06 0.68
13 180 0.225 3.35 6.06 0.68
14 225 0.225 3.35 6.06 0.68
15 270 0.225 3.35 6.06 0.68
16 315 0.225 3.35 6.06 0.68
17 0 0.375 3.73 7.42 0.68
18 45 0.375 3.73 7.42 0.68
19 90 0.375 3.73 7.42 0.68
20 135 0.375 3.73 7.42 0.68
21 180 0.375 3.73 7.42 0.68
22 225 0.375 3.73 7.42 0.68
23 270 0.375 3.73 7.42 0.68
24 315 0.375 3.73 7.42 0.68
25 0 0.525 3.93 8.57 0.68
26 45 0.525 3.93 8.57 0.68
27 90 0.525 3.93 8.57 0.68
28 135 0.525 3.93 8.57 0.68
29 180 0.525 3.93 8.57 0.68
30 225 0.525 3.93 8.57 0.68
31 270 0.525 3.93 8.57 0.68
32 315 0.525 3.93 8.57 0.68
33 0 0.675 4.24 9.58 0.68
34 45 0.675 4.24 9.58 0.68
35 90 0.675 4.24 9.58 0.68
36 135 0.675 4.24 9.58 0.68
37 180 0.675 4.24 9.58 0.68
38 225 0.675 4.24 9.58 0.68
39 270 0.675 4.24 9.58 0.68
40 315 0.675 4.24 9.58 0.68
41 0 0.825 4.58 10.5 0.68
42 45 0.825 4.58 10.5 0.68
43 90 0.825 4.58 10.5 0.68
44 135 0.825 4.58 10.5 0.68
45 180 0.825 4.58 10.5 0.68
46 225 0.825 4.58 10.5 0.68

Load Case
Environmental
Direction
(deg)
Hs
(m)
Tp
(sec)
Wind speed
(m/s)
Current
speed
(m/s)
47 270 0.825 4.58 10.5 0.68
48 315 0.825 4.58 10.5 0.68
49 0 0.975 4.77 11.34 0.68
50 45 0.975 4.77 11.34 0.68
51 90 0.975 4.77 11.34 0.68
52 135 0.975 4.77 11.34 0.68
53 180 0.975 4.77 11.34 0.68
54 225 0.975 4.77 11.34 0.68
55 270 0.975 4.77 11.34 0.68
56 315 0.975 4.77 11.34 0.68
57 45 1.125 4.9 12.12 0.68
58 90 1.125 4.9 12.12 0.68
59 135 1.125 4.9 12.12 0.68
60 180 1.125 4.9 12.12 0.68
61 270 1.125 4.9 12.12 0.68
62 45 1.275 5.38 12.86 0.68
63 90 1.275 5.38 12.86 0.68
64 135 1.275 5.38 12.86 0.68
65 180 1.275 5.38 12.86 0.68
66 90 1.425 5.56 13.55 0.68
67 135 1.425 5.56 13.55 0.68
68 180 1.425 5.56 13.55 0.68
69 0 1.575 6.05 14.22 0.68
70 45 1.575 6.05 14.22 0.68
71 90 1.575 6.05 14.22 0.68
72 135 1.575 6.05 14.22 0.68
73 180 1.575 6.05 14.22 0.68
74 315 1.575 6.05 14.22 0.68
75 90 1.725 6.35 14.85 0.68
76 135 1.725 6.35 14.85 0.68
77 180 1.725 6.35 14.85 0.68
78 135 0.15 9.67 0.0 0.0
79 135 0.225 9.74 0.0 0.0
80 135 0.375 9.5 0.0 0.0
81 135 0.15 11.64 0.0 0.0
82 135 0.225 12.02 0.0 0.0
83 135 0.375 12.22 0.0 0.0

APPENDIX E
Mooring Lines Fatigue Output

Case Study 1 – Base case
Line Number Line Section Damage Life
(year)
Arc Length
(m) FoS
Mooring Leg 1
Top chain 1.80E-04 5568.91 99.91 185.6
Steel wire 4.96E-08 20159058.10 489.95 671968.6
Bottom chain 2.18E-04 4602.76 826.41 153.4
Mooring Leg 2
Top chain 1.84E-04 5448.56 94.89 181.6
Steel wire 4.95E-08 20218888.70 546.02 673963.0
Bottom chain 2.20E-04 4547.26 830.41 151.6
Mooring Leg 3
Top chain 1.88E-04 5329.70 99.91 177.7
Steel wire 5.02E-08 19938695.70 523.99 664623.2
Bottom chain 2.23E-04 4485.81 826.41 149.5
Mooring Leg 4
Top chain 1.94E-04 5165.53 99.91 172.2
Steel wire 5.17E-08 19359285.55 513.98 645309.5
Bottom chain 2.30E-04 4344.83 826.41 144.8
Mooring Leg 5
Top chain 3.13E-04 3191.51 0.00 106.4
Steel wire 7.04E-08 14194558.87 574.06 473152.0
Bottom chain 3.35E-04 2983.33 826.41 99.4
Mooring Leg 6
Top chain 2.97E-04 3363.14 2.51 112.1
Steel wire 6.49E-08 15409427.82 588.08 513647.6
Bottom chain 3.14E-04 3182.19 826.41 106.1
Mooring Leg 7
Top chain 2.85E-04 3508.40 2.51 116.9
Steel wire 5.96E-08 16774249.90 586.08 559141.7
Bottom chain 2.94E-04 3405.18 826.41 113.5
Mooring Leg 8
Top chain 2.77E-04 3614.95 1.51 120.5
Steel wire 5.47E-08 18265933.00 578.07 608864.4
Bottom chain 2.73E-04 3663.54 826.41 122.1
Mooring Leg 9
Top chain 2.24E-04 4473.85 99.90 149.1
Steel wire 5.87E-08 17031388.29 479.93 567712.9
Bottom chain 2.74E-04 3651.18 826.40 121.7
Mooring Leg 10
Top chain 2.35E-04 4259.62 99.90 142.0
Steel wire 6.25E-08 16006118.87 558.04 533537.3
Bottom chain 2.86E-04 3491.00 826.40 116.4
Mooring Leg 11
Top chain 2.44E-04 4092.07 92.87 136.4
Steel wire 6.61E-08 15136901.28 578.06 504563.4
Bottom chain 2.99E-04 3345.88 826.40 111.5
Mooring Leg 12
Top chain 2.54E-04 3942.10 88.86 131.4
Steel wire 7.00E-08 14290144.69 642.15 476338.2
Bottom chain 3.13E-04 3199.55 826.40 106.7

Case Study 2 – Pretension 14% MBL
Line Number Line Section Damage
(yearly)
Life
(year)
Arc Length
(m) FoS
Mooring Leg 1
Top chain 1.52E-04 6570.94 123.38 219.0
Steel wire 5.28E-08 18949385.38 791.80 631646.2
Bottom chain 2.50E-04 4003.90 849.88 133.5
Mooring Leg 2
Top chain 1.55E-04 6452.13 123.38 215.1
Steel wire 6.65E-08 15037482.11 747.74 501249.4
Bottom chain 2.89E-04 3464.87 849.88 115.5
Mooring Leg 3
Top chain 1.68E-04 5965.56 123.38 198.9
Steel wire 6.33E-08 15795221.26 771.77 526507.4
Bottom chain 2.89E-04 3461.85 851.88 115.4
Mooring Leg 4
Top chain 1.83E-04 5465.11 123.38 182.2
Steel wire 6.01E-08 16640917.94 797.81 554697.3
Bottom chain 2.74E-04 3655.58 849.88 121.9
Mooring Leg 5
Top chain 2.76E-04 3617.10 123.38 120.6
Steel wire 1.26E-07 7926318.06 759.76 264210.6
Bottom chain 5.12E-04 1951.59 851.88 65.1
Mooring Leg 6
Top chain 2.57E-04 3885.64 123.38 129.5
Steel wire 1.21E-07 8289676.15 753.75 276322.5
Bottom chain 5.05E-04 1979.49 849.88 66.0
Mooring Leg 7
Top chain 2.31E-04 4327.12 123.38 144.2
Steel wire 1.11E-07 8986105.56 797.81 299536.9
Bottom chain 4.74E-04 2111.27 849.88 70.4
Mooring Leg 8
Top chain 2.11E-04 4735.53 123.38 157.9
Steel wire 1.04E-07 9637811.18 751.75 321260.4
Bottom chain 4.18E-04 2391.58 857.88 79.7
Mooring Leg 9
Top chain 1.41E-04 7071.50 123.37 235.7
Steel wire 1.01E-07 9860200.00 817.83 328673.3
Bottom chain 4.34E-04 2302.52 849.87 76.8
Mooring Leg 10
Top chain 1.47E-04 6789.47 123.37 226.3
Steel wire 1.17E-07 8514528.28 781.78 283817.6
Bottom chain 4.99E-04 2002.97 857.87 66.8
Mooring Leg 11
Top chain 1.56E-04 6418.64 123.37 214.0
Steel wire 1.34E-07 7438901.06 817.83 247963.4
Bottom chain 5.51E-04 1814.20 849.87 60.5
Mooring Leg 12
Top chain 1.65E-04 6052.15 123.37 201.7
Steel wire 1.17E-07 8564612.36 797.80 285487.1
Bottom chain 4.87E-04 2052.71 857.87 68.4
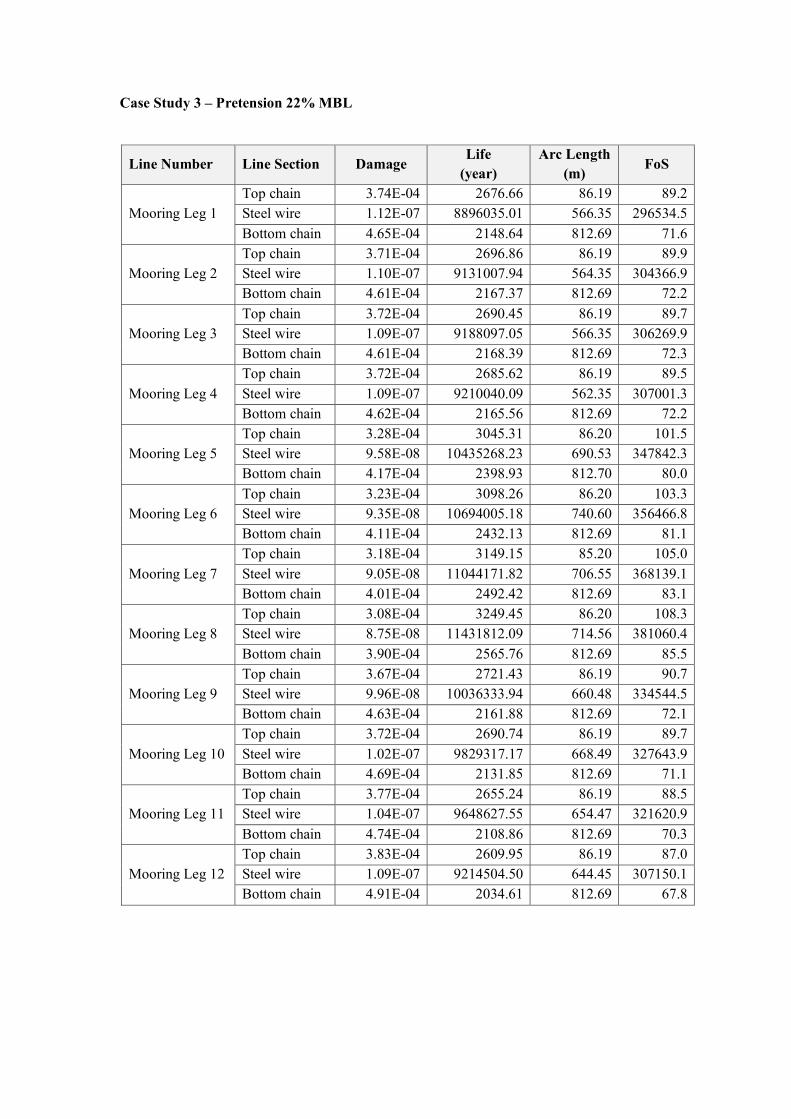
Case Study 3 – Pretension 22% MBL
Line Number Line Section Damage Life
(year)
Arc Length
(m) FoS
Mooring Leg 1
Top chain 3.74E-04 2676.66 86.19 89.2
Steel wire 1.12E-07 8896035.01 566.35 296534.5
Bottom chain 4.65E-04 2148.64 812.69 71.6
Mooring Leg 2
Top chain 3.71E-04 2696.86 86.19 89.9
Steel wire 1.10E-07 9131007.94 564.35 304366.9
Bottom chain 4.61E-04 2167.37 812.69 72.2
Mooring Leg 3
Top chain 3.72E-04 2690.45 86.19 89.7
Steel wire 1.09E-07 9188097.05 566.35 306269.9
Bottom chain 4.61E-04 2168.39 812.69 72.3
Mooring Leg 4
Top chain 3.72E-04 2685.62 86.19 89.5
Steel wire 1.09E-07 9210040.09 562.35 307001.3
Bottom chain 4.62E-04 2165.56 812.69 72.2
Mooring Leg 5
Top chain 3.28E-04 3045.31 86.20 101.5
Steel wire 9.58E-08 10435268.23 690.53 347842.3
Bottom chain 4.17E-04 2398.93 812.70 80.0
Mooring Leg 6
Top chain 3.23E-04 3098.26 86.20 103.3
Steel wire 9.35E-08 10694005.18 740.60 356466.8
Bottom chain 4.11E-04 2432.13 812.69 81.1
Mooring Leg 7
Top chain 3.18E-04 3149.15 85.20 105.0
Steel wire 9.05E-08 11044171.82 706.55 368139.1
Bottom chain 4.01E-04 2492.42 812.69 83.1
Mooring Leg 8
Top chain 3.08E-04 3249.45 86.20 108.3
Steel wire 8.75E-08 11431812.09 714.56 381060.4
Bottom chain 3.90E-04 2565.76 812.69 85.5
Mooring Leg 9
Top chain 3.67E-04 2721.43 86.19 90.7
Steel wire 9.96E-08 10036333.94 660.48 334544.5
Bottom chain 4.63E-04 2161.88 812.69 72.1
Mooring Leg 10
Top chain 3.72E-04 2690.74 86.19 89.7
Steel wire 1.02E-07 9829317.17 668.49 327643.9
Bottom chain 4.69E-04 2131.85 812.69 71.1
Mooring Leg 11
Top chain 3.77E-04 2655.24 86.19 88.5
Steel wire 1.04E-07 9648627.55 654.47 321620.9
Bottom chain 4.74E-04 2108.86 812.69 70.3
Mooring Leg 12
Top chain 3.83E-04 2609.95 86.19 87.0
Steel wire 1.09E-07 9214504.50 644.45 307150.1
Bottom chain 4.91E-04 2034.61 812.69 67.8

Case Study 4 – 50% Water depth
Line Number Line Section Damage Life
(year)
Arc Length
(m) FoS
Mooring Leg 1
Top chain 1.24E-04 8076.27 49.57 269.2
Steel wire 2.75E-08 36384904.57 411.57 1212830.2
Bottom chain 1.61E-04 6192.97 423.51 206.4
Mooring Leg 2
Top chain 1.27E-04 7891.85 49.57 263.1
Steel wire 2.78E-08 35967700.25 411.57 1198923.3
Bottom chain 1.65E-04 6043.51 429.47 201.5
Mooring Leg 3
Top chain 1.31E-04 7652.05 49.57 255.1
Steel wire 2.91E-08 34308920.98 411.57 1143630.7
Bottom chain 1.71E-04 5848.63 427.48 195.0
Mooring Leg 4
Top chain 1.37E-04 7290.54 49.57 243.0
Steel wire 3.05E-08 32777279.90 411.57 1092576.0
Bottom chain 1.78E-04 5629.67 427.48 187.7
Mooring Leg 5
Top chain 2.30E-04 4346.67 49.57 144.9
Steel wire 5.38E-08 18579150.07 411.57 619305.0
Bottom chain 2.97E-04 3363.62 425.50 112.1
Mooring Leg 6
Top chain 2.16E-04 4634.32 49.57 154.5
Steel wire 4.99E-08 20057592.38 411.57 668586.4
Bottom chain 2.82E-04 3548.75 435.44 118.3
Mooring Leg 7
Top chain 2.01E-04 4963.20 49.57 165.4
Steel wire 4.59E-08 21799010.13 411.57 726633.7
Bottom chain 2.63E-04 3805.78 429.48 126.9
Mooring Leg 8
Top chain 1.88E-04 5328.41 49.57 177.6
Steel wire 4.22E-08 23673351.67 411.57 789111.7
Bottom chain 2.43E-04 4112.95 445.39 137.1
Mooring Leg 9
Top chain 1.55E-04 6441.18 49.56 214.7
Steel wire 3.36E-08 29799553.14 411.56 993318.4
Bottom chain 2.02E-04 4951.70 423.50 165.1
Mooring Leg 10
Top chain 1.62E-04 6165.48 49.56 205.5
Steel wire 3.59E-08 27868754.46 411.56 928958.5
Bottom chain 2.12E-04 4717.90 423.50 157.3
Mooring Leg 11
Top chain 1.68E-04 5936.91 49.56 197.9
Steel wire 3.84E-08 26058401.97 411.56 868613.4
Bottom chain 2.22E-04 4498.68 427.48 150.0
Mooring Leg 12
Top chain 1.77E-04 5646.12 49.56 188.2
Steel wire 4.07E-08 24599516.90 411.56 819983.9
Bottom chain 2.32E-04 4308.91 433.45 143.6

Case Study 5 – 150% Water depth
Line Number Line Section Damage Life
(year)
Arc Length
(m) FoS
Mooring Leg 1
Top chain 2.82E-04 3546.96 149.50 118.2
Steel wire 9.15E-08 10928799.61 652.77 364293.3
Bottom chain 2.79E-04 3584.64 1238.50 119.5
Mooring Leg 2
Top chain 2.88E-04 3471.86 149.50 115.7
Steel wire 9.35E-08 10697667.21 686.75 356588.9
Bottom chain 2.87E-04 3478.59 1238.50 116.0
Mooring Leg 3
Top chain 2.94E-04 3395.59 149.50 113.2
Steel wire 9.50E-08 10527798.06 696.75 350926.6
Bottom chain 2.95E-04 3394.51 1238.50 113.2
Mooring Leg 4
Top chain 3.01E-04 3321.02 149.50 110.7
Steel wire 9.78E-08 10222304.71 714.74 340743.5
Bottom chain 3.04E-04 3291.71 1238.50 109.7
Mooring Leg 5
Top chain 5.22E-04 1915.24 149.50 63.8
Steel wire 1.91E-07 5240470.10 762.72 174682.3
Bottom chain 4.71E-04 2125.28 1238.50 70.8
Mooring Leg 6
Top chain 5.03E-04 1986.83 149.50 66.2
Steel wire 1.81E-07 5526597.55 766.72 184219.9
Bottom chain 4.44E-04 2253.59 1238.50 75.1
Mooring Leg 7
Top chain 4.80E-04 2083.43 149.50 69.4
Steel wire 1.71E-07 5846339.22 774.71 194878.0
Bottom chain 4.18E-04 2392.37 1238.50 79.7
Mooring Leg 8
Top chain 4.57E-04 2186.82 147.50 72.9
Steel wire 1.62E-07 6185277.66 740.73 206175.9
Bottom chain 3.93E-04 2545.70 1238.50 84.9
Mooring Leg 9
Top chain 5.05E-04 1980.01 148.50 66.0
Steel wire 1.74E-07 5736059.11 724.74 191202.0
Bottom chain 3.08E-04 3246.48 1238.50 108.2
Mooring Leg 10
Top chain 5.22E-04 1916.33 148.50 63.9
Steel wire 1.82E-07 5484188.03 726.73 182806.3
Bottom chain 3.22E-04 3101.20 1238.50 103.4
Mooring Leg 11
Top chain 5.36E-04 1865.78 149.50 62.2
Steel wire 1.89E-07 5294315.35 716.74 176477.2
Bottom chain 3.36E-04 2976.00 1238.50 99.2
Mooring Leg 12
Top chain 5.43E-04 1842.65 149.50 61.4
Steel wire 1.93E-07 5172113.55 696.75 172403.8
Bottom chain 3.42E-04 2924.94 1238.50 97.5

Case Study 6 – Wave load component: 1st order wave load
Line Number Line Section Damage Life
(year)
Arc Length
(m) FoS
Mooring Leg 1
Top chain 1.75E-04 5720.11 99.91 190.7
Steel wire 2.94E-08 34062700.03 582.07 1135423.3
Bottom chain 2.15E-04 4647.23 828.41 154.9
Mooring Leg 2
Top chain 1.49E-04 6719.86 84.85 224.0
Steel wire 2.06E-08 48528391.53 283.66 1617613.1
Bottom chain 1.76E-04 5676.91 826.41 189.2
Mooring Leg 3
Top chain 1.25E-04 8000.66 99.91 266.7
Steel wire 1.44E-08 69243101.40 107.42 2308103.4
Bottom chain 1.41E-04 7105.19 826.41 236.8
Mooring Leg 4
Top chain 9.83E-05 10168.88 99.91 339.0
Steel wire 9.69E-09 103243302.23 283.66 3441443.4
Bottom chain 1.12E-04 8953.66 826.41 298.5
Mooring Leg 5
Top chain 8.24E-04 1212.99 1.51 40.4
Steel wire 2.65E-07 3767728.61 728.28 125591.0
Bottom chain 8.43E-04 1186.71 828.41 39.6
Mooring Leg 6
Top chain 8.19E-04 1220.97 4.52 40.7
Steel wire 2.65E-07 3767943.46 770.34 125598.1
Bottom chain 8.40E-04 1190.46 828.41 39.7
Mooring Leg 7
Top chain 8.08E-04 1238.19 1.51 41.3
Steel wire 2.61E-07 3829691.86 728.28 127656.4
Bottom chain 8.27E-04 1208.99 830.41 40.3
Mooring Leg 8
Top chain 7.89E-04 1267.08 0.00 42.2
Steel wire 2.54E-07 3940812.13 754.31 131360.4
Bottom chain 8.10E-04 1234.95 826.41 41.2
Mooring Leg 9
Top chain 1.05E-04 9485.91 99.90 316.2
Steel wire 1.23E-08 81403095.13 377.79 2713436.5
Bottom chain 1.18E-04 8469.56 826.40 282.3
Mooring Leg 10
Top chain 1.35E-04 7398.02 99.90 246.6
Steel wire 1.82E-08 54894828.45 351.75 1829827.6
Bottom chain 1.52E-04 6580.94 826.40 219.4
Mooring Leg 11
Top chain 1.65E-04 6076.64 97.89 202.6
Steel wire 2.53E-08 39458274.14 165.49 1315275.8
Bottom chain 1.89E-04 5281.89 826.40 176.1
Mooring Leg 12
Top chain 1.93E-04 5176.09 76.81 172.5
Steel wire 3.50E-08 28568877.58 610.11 952295.9
Bottom chain 2.31E-04 4320.59 826.40 144.0

Case Study 7 – Wave load component: 2nd order wave load
Line Number Line Section Damage Life
(year)
Arc Length
(m) FoS
Mooring Leg 1
Top chain 1.64E-04 6102.26 55.73 203.4
Steel wire 4.08E-08 24535373.75 526.00 817845.8
Bottom chain 1.97E-04 5080.02 826.41 169.3
Mooring Leg 2
Top chain 1.70E-04 5899.64 91.87 196.7
Steel wire 4.15E-08 24120479.75 449.89 804016.0
Bottom chain 2.00E-04 4994.68 826.41 166.5
Mooring Leg 3
Top chain 1.74E-04 5743.22 99.91 191.4
Steel wire 4.28E-08 23341574.25 495.95 778052.5
Bottom chain 2.05E-04 4882.45 826.41 162.7
Mooring Leg 4
Top chain 1.80E-04 5563.28 99.91 185.4
Steel wire 4.46E-08 22422778.92 431.87 747426.0
Bottom chain 2.12E-04 4723.87 826.41 157.5
Mooring Leg 5
Top chain 3.09E-04 3235.27 6.53 107.8
Steel wire 7.58E-08 13194109.17 203.55 439803.6
Bottom chain 3.48E-04 2872.47 828.41 95.7
Mooring Leg 6
Top chain 2.94E-04 3404.45 8.53 113.5
Steel wire 7.03E-08 14227870.01 201.55 474262.3
Bottom chain 3.28E-04 3046.42 826.41 101.5
Mooring Leg 7
Top chain 2.77E-04 3610.55 2.51 120.4
Steel wire 6.50E-08 15376281.21 193.54 512542.7
Bottom chain 3.07E-04 3255.23 826.41 108.5
Mooring Leg 8
Top chain 2.62E-04 3812.55 5.52 127.1
Steel wire 6.01E-08 16634085.29 181.52 554469.5
Bottom chain 2.87E-04 3488.08 826.41 116.3
Mooring Leg 9
Top chain 1.94E-04 5156.67 97.89 171.9
Steel wire 4.70E-08 21291372.73 493.95 709712.4
Bottom chain 2.29E-04 4366.42 826.40 145.5
Mooring Leg 10
Top chain 1.97E-04 5070.75 99.90 169.0
Steel wire 4.94E-08 20248422.73 552.03 674947.4
Bottom chain 2.39E-04 4180.10 826.40 139.3
Mooring Leg 11
Top chain 2.07E-04 4835.04 99.90 161.2
Steel wire 5.21E-08 19205149.62 517.98 640171.7
Bottom chain 2.49E-04 4018.81 826.40 134.0
Mooring Leg 12
Top chain 2.16E-04 4631.48 91.87 154.4
Steel wire 5.46E-08 18318024.21 594.08 610600.8
Bottom chain 2.58E-04 3876.22 826.40 129.2

APPENDIX F
General Arrangement


AUTHOR BIOGRAPHY
Norman Mahdar Sabana, born on 23rd March 1989 in
Madiun, East Java. Author received the bachelor degree
in Ocean Engineering from Sepuluh Nopember
Institute of Technology (ITS) Surabaya in 2012. In the
same year, along with eight other students, author
received RINA – PT PAL Student Award for
outstanding performance during the course at the
Faculty of Marine Technology, ITS Surabaya. After
graduation, author spent two years as marine engineer at PT. ZEE Engineering.
Author has been involved in several projects related to offshore pipeline design and
marine operation during his service there. In 2016, author continues his study in
magister program of Design of Ocean Structures Engineering, Ocean Engineering
Department, ITS Surabaya. Author currently serves as marine warranty surveyor
(MWS) and offshore engineer at DNV GL Indonesia. Author can be reached
through email [email protected]