Embed Size (px)
Citation preview
Proceedings of the 7th International Conference on Mechanics and Materials in Design
Albufeira/Portugal 11-15 June 2017. Editors J.F. Silva Gomes and S.A. Meguid.
Publ. INEGI/FEUP (2017)
-423-
PAPER REF: 6488
IDENTIFICATION OF POSSIBLE CAUSES OF FATIGUE FAILURE IN
RADIUS ROD PINS FOR TROLLEYBUS REAR AXLES USING
PARAMETRIC CALCULATIONS OF FATIGUE LIFE
Miloslav Kepka(*), Miloslav Kepka Jr.
Regional Technological Institute, Research Center of Faculty of Mechanical Engineering (RTI),
University of West Bohemia, Pilsen, Czech Republic (*)Email: [email protected]
ABSTRACT
Fatigue failures were frequently encountered in the pins of radius rods of driving axles of
trolleybuses in city of San Francisco. Sufficiently representative stress-time histories for the
critical cross section through this part were obtained by measurement carried out during rides
with empty as well as fully loaded vehicle. Estimates of relevant fatigue characteristics were
developed using information on used material, various surface treatments were taken into
consideration. Parametric calculations of fatigue life were therefore feasible with the aid of
the available data. The nCode software was used for all calculations. The purpose of these
calculations was to ascertain whether these in-service failures in the structural parts of the
vehicle could have been predicted (and prevented) during the design stage, and what their
main cause had been.
Keywords: fatigue life, fatigue failure, radius rod pin, service load, computational prediction
of service fatigue life, nCode software
INTRODUCTION
Radius rods ensure the appropriate geometry of axles with respect to the vehicle underframe.
Together with other parts of the axle suspension system (shock absorbers and air spring
bellows), they ensure noiseless transmission of force from the axle to the vehicle under any
dynamic conditions during the ride (starting, braking, running over irregular surface and
others). The radius rod is a weldment consisting of a tube with a head on each end. Metal-
rubber bushings are press-fitted into holes in the heads. The configurations of the metal-
rubber bushings may vary. The typical one involves overhung conical pins. Vehicles in
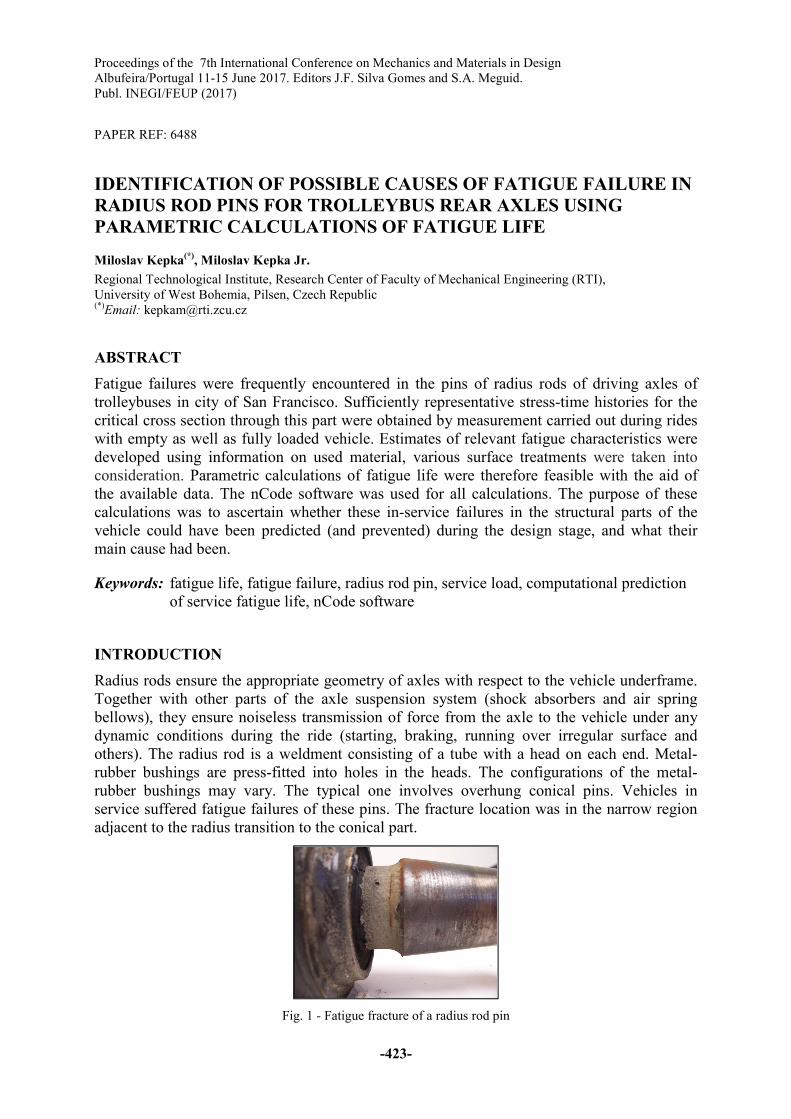
service suffered fatigue failures of these pins. The fracture location was in the narrow region
adjacent to the radius transition to the conical part.
Fig. 1 - Fatigue fracture of a radius rod pin
Topic-C: Fatigue and Fracture Mechanics
-424-
Figure 1 shows a photograph of a failed pin. After driving 70,000 miles a fatigue damage
(initiation of fatigue cracks or complete fatigue fracture) occurred at approximately 50 of the
total 612 pieces of installed and operated pins.
Strain gauge testing and fatigue life assessment of heavily stressed structural details and parts
of trolleybuses are carried out at various stages throughout the development process (Kepka,
2015). The testing locations include several hundred critical locations on the vehicle, tested
either during service load simulations on an electrohydraulic test stand or during prototype
vehicle rides on actual routes. In the present case, the measurement was conducted at a later
stage because the part in question (the pin of the radius rod of the rear axle) had not been
expected to pose any problems based on previous experience. The data gathered in actual
service included information about the part’s service life to failure. By comparing the
information from service and the computational prediction of fatigue life, one could find
whether the measurement and fatigue calculations would have been a sufficient basis for
identifying the part as a critical one if it had been subject to scrutiny early on.
LOADING CONDITIONS, MEASURED AND ANALYSED DATA
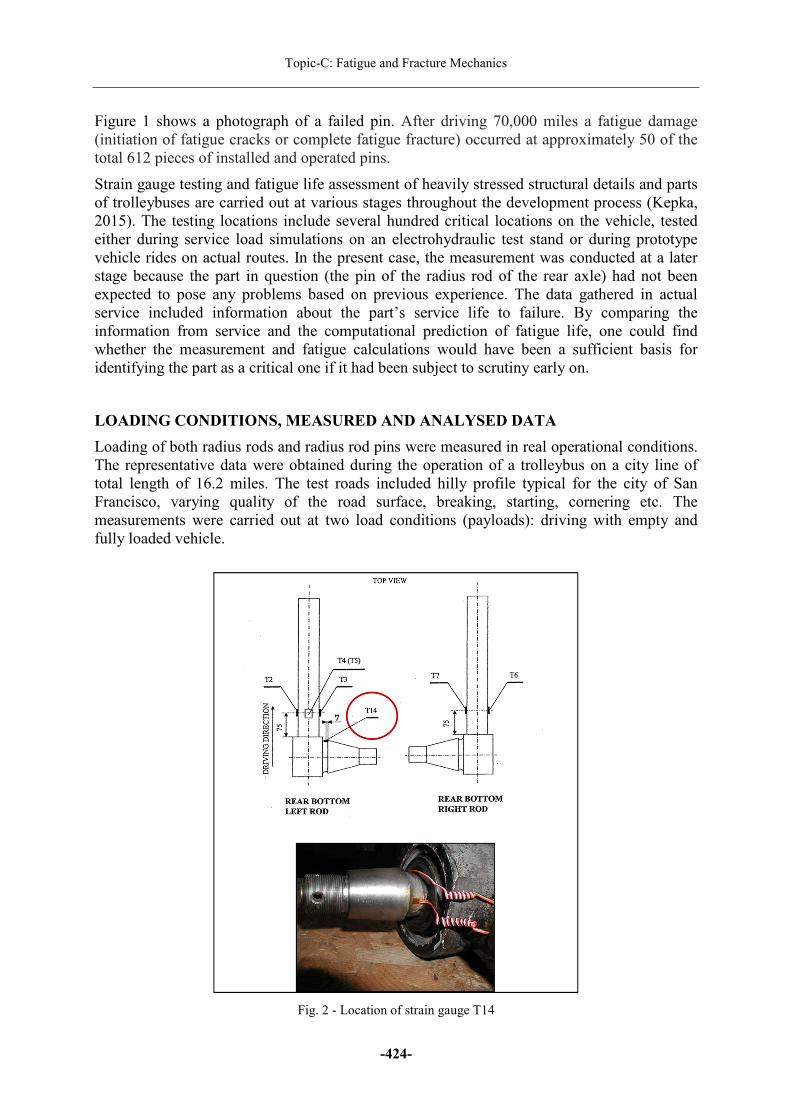
Loading of both radius rods and radius rod pins were measured in real operational conditions.
The representative data were obtained during the operation of a trolleybus on a city line of
total length of 16.2 miles. The test roads included hilly profile typical for the city of San
Francisco, varying quality of the road surface, breaking, starting, cornering etc. The
measurements were carried out at two load conditions (payloads): driving with empty and
fully loaded vehicle.
Fig. 2 - Location of strain gauge T14

Proceedings of the 7th International Conference on Mechanics and Materials in Design
-425-
Figure 2 shows installation of all strain gauges. The strain gauge T14 was installed on the
critical structural notch of the pin and therefore local deformations and stresses were
measured directly.
Figure 3 shows measured stress-time histories.
Figure 4 shows stress spectra, which were evaluated with nCode software using the rain-flow
method. The spectra are necessary for fatigue life calculation.
Empty
Loaded
Fig. 3 - Measured stress-time histories - empty vehicle and loaded vehicle - strain gauge T14

Topic-C: Fatigue and Fracture Mechanics
-426-
Empty
Loaded
Fig. 4 - Two-parameter and one-parameter stress spectra - empty vehicle and loaded vehicle
FATIGUE LIFE CURVES
Fig. 5 - Description of fatigue life curve in nCode software
Fig.5 is a copy of description of fatigue life curves used by nCode software. A durability of a
material or a component against high cycle fatigue damage is commonly characterized by an
σ-N curve, which describes a relationship between stress range ∆� and cycles to failure��.
This relationship can be described for �� ∈ �10, ��1 by the following nCode formula:

Proceedings of the 7th International Conference on Mechanics and Materials in Design
-427-
∆� = ���1 ∙ ������, (1)
where SRI1 is an intercept at 1 cycle and �1 is a slope.
The pin was made of steel CMo4 according to a Hungarian standard. Ultimate strength of this
steel ranges between 700 - 900 MPa. Any relevant information about fatigue behaviour of
CMo4 was not found in literature despite of a thorough search and therefore the fatigue curve
had to be estimated only.
Material 1
The Uniform Material Law proposed by Bäumel and Seeger in 1990 was used as the first
estimation method for determining the fatigue characteristics. The following Table 1 depicts
the values, on which UML is based for unalloyed and low-alloy steels.
Table 1 - Uniform Material Law (Bäumel, 1990)
�� = ��,�� + ��,�� =��́� �2� � + ��́�2� !
��́ 1.5 ∙ �$
� −0.087
��́ 0.59 ∙ ψ
* −0.58
�+ 0.45 ∙ �$
�+ 0.45�$� + 1.95 ∙ 10-. ∙ ψ
�+ 5 ∙ 10/
0 ´ 1.65 ∙ �$
2´ 0.15
ψ = 1for: �$� ≤ 3 ∙ 10-
ψ = 91.375 − 125 ∙ �$� : for: �$
� > 3 ∙ 10- andψ ≥ 0
Material data generated from UML for a steel with UTS = 800 MPa are shown in Table 2.
The material data are in format used by software nCode GlyphWorks for Strain-Life and
Stress-Life approach.
Table 2 - Fatigue characteristics of Material 1 (estimation according to UML)
�� = ��,�� + ��,�� =��́� �2� � + ��́�2� ! ∆� = ���1 ∙ ������
FatigueStrengthCoefficient ��́ 1200MPa StressRangeIntercept ���1 3630MPaFatigueStrengthExponent � −0.087 FatigueStrengthExponent �1 −0.1339FatigueDuctilityCoefficient ��́ 0.5303 StandardErrorofLogNf 0.1FatigueDuctilityExponent * −0.58CyclicStrengthCoefficient 0 ´ 1320MPaCyclicStrainHardeningExponent 2´ 0.15

Topic-C: Fatigue and Fracture Mechanics
-428-
Material 2
The other option to receive a relevant material data was a usage of a German equivalent steel
42CrMo4 with UTS = 1100 MPa. A material σ-N curve was statistically estimated from an
experimental data from literature (Boller, 1998) in accordance with standard ISO 12107.
Since the value of UTS of CMo4 is lower, the statistically evaluated curve was modified by
decreasing stress range intercept ���1 while fatigue strength exponent remained the same.
The estimated parameters of the fatigue life curve are presented in Table.
Table 3 - Fatigue characteristics of Material 2 (estimation according to experimental data in the literature)
∆� = ���1 ∙ ������StressRangeIntercept ���1 1584MPaFatigueStrengthExponent �1 −0.063StandardErrorofLogNf 0.1
The second fatigue strength exponent �2 (see Fig.5) was chosen conservatively �2 = �1 for
both material fatigue curves. There was not any fatigue limit considered in the fatigue damage
calculation.
The estimated fatigue life curves are graphically interpreted in Fig.6.
Fig. 6 - Estimated fatigue life curves
FATIGUE LIFE CALCULATIONS
The Palmgren-Miner rule was applied in this case study. According to this hypothesis, it is
achieved the fatigue limit state (limit damage, initiation of a macroscopic fatigue crack, final
failure) when the following condition is fulfilled:
∑ YZ[Z= 1\ , (2)
∆� = 3630(�] )-0.134
∆� = 1584(�] )-0.063
100
1000
10000
1,00E+00 1,00E+02 1,00E+04 1,00E+06 1,00E+08 1,00E+10
Stress
Range
(MPa)
Life (cycles)
Material 1
Material 2
Proceedings of the 7th International Conference on Mechanics and Materials in Design
-429-
2\ is number of cycles with stress range∆�\ and �\ is number of cycles to failure at the same
stress range ∆�\.
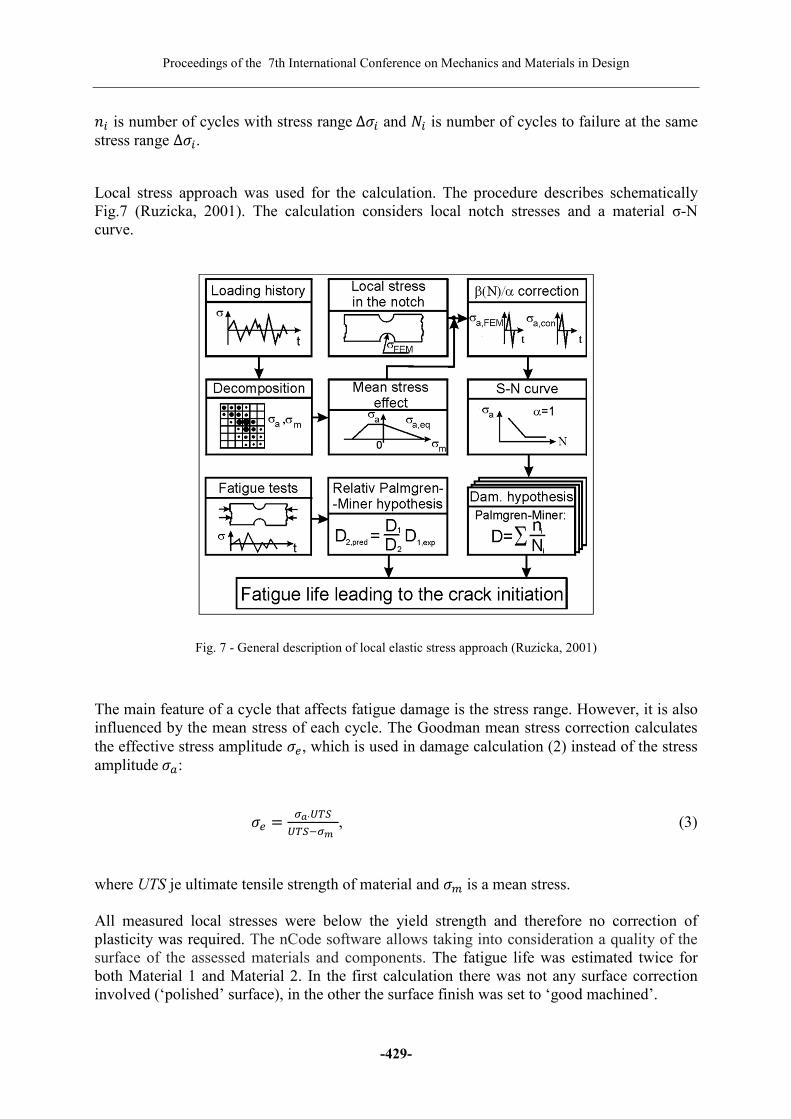
Local stress approach was used for the calculation. The procedure describes schematically
Fig.7 (Ruzicka, 2001). The calculation considers local notch stresses and a material σ-N
curve.
Fig. 7 - General description of local elastic stress approach (Ruzicka, 2001)
The main feature of a cycle that affects fatigue damage is the stress range. However, it is also
influenced by the mean stress of each cycle. The Goodman mean stress correction calculates
the effective stress amplitude ��, which is used in damage calculation (2) instead of the stress
amplitude��:
�� = ^_∙`ab`ab-^c, (3)
where UTS je ultimate tensile strength of material and �$ is a mean stress.
All measured local stresses were below the yield strength and therefore no correction of
plasticity was required. The nCode software allows taking into consideration a quality of the
surface of the assessed materials and components. The fatigue life was estimated twice for
both Material 1 and Material 2. In the first calculation there was not any surface correction
involved (‘polished’ surface), in the other the surface finish was set to ‘good machined’.

Topic-C: Fatigue and Fracture Mechanics
-430-
Tables 4 to 7 show estimated fatigue lives for various combinations of service conditions and
for defined σ-N curves (two estimated material σ-N curves with two surface finish
modifications).
Table 4 - Mean fatigue life for various combinations of service conditions, Material 1, Polished
σ-N curve, Surface Material 1, Polished
Empty (%): Loaded (%) 0: 100 20: 80 40: 60 60: 40 80: 20 100: 0
Fatigue Life (1000 miles) 407 384 362 340 318 295
Table 5 - Mean fatigue life for various combinations of service conditions, Material 1, Good Machined
σ-N curve, Surface Material 1, Good Machined
Empty (%): Loaded (%) 0: 100 20: 80 40: 60 60: 40 80: 20 100: 0
Fatigue Life (1000 miles) 140 128 117 106 95 83
Table - 6 Mean Fatigue life for various combinations of service conditions, Material 2, Polished
σ-N curve, Surface Material 2, Polished
Empty (%): Loaded (%) 0: 100 20: 80 40: 60 60: 40 80: 20 100: 0
Fatigue Life (1000 miles) 460 757 1054 1351 1647 1944
Table 7 - Mean fatigue life for various combinations of service conditions, Material 2, Good Machined
σ-N curve, Surface Material 2, Good Machined
Empty (%): Loaded (%) 0: 100 20: 80 40: 60 60: 40 80: 20 100: 0
Fatigue Life (1000 miles) 152 176 202 226 251 275
The stress spectra for empty and loaded vehicle have different shapes (Fig.4). The slopes of
fatigue life curves of materials 1 and 2 are different and the fatigue curves intersect (Fig.6). If
the fatigue curve of Material 1 used for predicting service life, than the operation with an
empty vehicle comes computationally as more damaging. When the fatigue curve of Material
2 is used, the operation with a loaded vehicle is more damaging for the critical cross section
of the investigated component.
The required service life of mechanical parts of trolleybuses was 500 000 miles driven. This
value was reached only for Material 2, polished surface conditions. Furthermore, the
predictions of service life in the tables are mean values of fatigue life, a value with only a
50% probability of survival. It was therefore decided to implement further calculations in this
case study.
SCALE FACTOR CALCULATION
The scale factor calculation can provide a usable feedback to a designer. It determines the
value by which the stress-time history has to be multiplied to achieve specified target life, in
this case 500 000 miles. Mean σ-N curves were used in the fatigue life estimation in the
previous chapter. However, to reach a suitable reliability it is necessary to work with design
σ-N curves, as we want to make a life prediction based on a particular percentage probability
of survival. The deviation from the mean (50%) life is determined in terms of the value of
standard errors. According to a respected standard (FKM-Guideline, 2012) a sufficient
certainty of survival is equal to 97.5 % which corresponds to -2 standard errors. Therefore
log�de./ = log�/f − 2 ∙ �StandardErrorofLog�] . (4)
The design fatigue life curves for Material 1 and Material 2 are shown in Fig. 8.

Proceedings of the 7th International Conference on Mechanics and Materials in Design
-431-
Fig. 8 - Design σ-N curves of Material 1 and Material 2
The scale factor was calulated in the nCode software for both design fatigue live curves and
for more realistic ‘good machine’ surface conditions. The Table 8 summarises the settings
applied for the calculations and the results.
Table 8 - Scale Factor Calculation Conditions and Results
Settings
Material Data Material 1 Material 2
Surface Finish Good Machined Good Machined
Mean Stress Correction Goodman Goodman
Standard Error of Log N 0.1 0.25
Service Conditions Loaded Empty
Target Life 500 000 miles 500 000 miles
Results
Scale Factor 0.70 0.83
The reduction of local notch stress of about 30% (Table 8, Material 1) is needed to meet the
durability target, therefore significant changes in the component geometry are required. It can
be achived by decresing nominal stress or changes in geometry (structural notch) of the
component.
RESULTS
Several partial and step-by-step related results were presented in this case study. The local
stress spectra were evaluated for the critical cross section of the considered component. The
representative stress-time histories were measured in real traffic conditions. The fatigue
characteristics of the material used for production of the component were estimated. Service
life predictions of the investigated component were made for different operating load
conditions of the vehicle.
Based on the inverse calculations of fatigue damage was so-called scale factor determined as
the recommended value of reduction of local stresses, in order to ensure the required service
life with a defined reliability.
∆� = 3111.4(�] )-0.134
∆� = 1539(�] )-0.063
100
1000
10000
1,00E+00 1,00E+02 1,00E+04 1,00E+06 1,00E+08 1,00E+10
Stress
Range
(MPa)
Life (cycles)
Material 1
Material 2

Topic-C: Fatigue and Fracture Mechanics
-432-
CONCLUSION
It can be concluded that the causes of operational failures of the assessed radius rod pins were
high stress concentrations in the critical (notched) cross section and a poor surface quality of
the component.
The presented case study showed how the nCode software can be used for parametric
calculations of fatigue life and how the design of cyclically loaded components can be
supported.
ACKNOWLEDGMENTS
The present contribution has been prepared under project LO1502 “Development of the
Regional Technological Institute” under the auspices of the National Sustainability Program
me I of the Ministry of Education of the Czech Republic aimed to support research,
experimental development and innovation.
REFERENCES
[1]-Kepka, M., Spirk, S.: Tests and computer simulations of electric buses. Proceedings
M2D2015 - 6th International Conference on Mechanics and Materials in Design, Porta
Delgada/Azores/Portugal, 26-30 July 2015
[2]-Bäumel, A., Seeger, T.: Materials data for cyclic loading. Supplement 1. Amsterdam;
New York: Elsevier, 1990. ISBN: 0444886036
[3]-Boller, Chr.: Der Einfluß von Probengröße und Oberflächenrauhigkeit auf
Lebensdauerabschätzungen bei Betrachtung der örtlichen Beanspruchungen. Heft 46.
Darmstadt: Veröffentlichungen des Instituts für Stahlbau und Werkstoffmechanik der
Technischen Hochsule Darmstadt, 1998. 292 s.
[4]-Růžička, M. - Papuga, J., New Concept of a Local Elastic Stress Approach for Fatigue
Life Calculation. In: Abstract Collection of the ICAF 2001 Conference. ICAF 2001
Conference. Toulose, 25.06.2001 - 29.06.2001. Toulouse: The French Association for
Aeronautics and Astronautics. 2001, s. 56-58.
[5]-FKM-Guideline: Analytical Strength Assessment of Components in Mechanical
Engineering. 6th. ed. 2012, ISBN 978-3-8163-0649-8