Embed Size (px)
Citation preview
3
Parameters for Evaluating an Energy-conserving Design
3.1 M E A N I N G F U L MEASURES
The key parameters in the evaluation process directly depend on the interests of the parties involved. Designers look for power to determine the size of the equipment and space, which in turn establishes the capital cost. They simply want to know if an alternative solution is feasible so that they can move on with the task of detailing. A user or manager, through an accountant, is anxious to achieve a satisfactory cash flow to pay for the utility costs. These are derived from the energy used for the operations. An investor is primarily interested in achieving a profitable return by manipulating the financing. Regulators are interested in actions that would reduce the use of certain resources, although their prime responsibility is to monitor health and safety within a community. The decision as to what are the meaningful measures for the party interests come halfway in step 12 of the integration strategy (Section 1.5.1). They affect the type of costing and priority analysis that is meaningful for each party. Most of the books on the subject take the point of view of an economist, which in the author's opinion is not appropriate in energy-conserving design. 4~'49's°
The following section defines a series of parameters that are meaningful for the designer, accountant, investor and regulator. They form the basis for the explicit functions in the analysis and for the comparison of criteria in the evaluation. The schedules in Section 1.5.2 summarize these values for each scenario as the evaluation progresses from the power demands, power distribution, energy use, capital costs, cumulative costs, through life cycle costs and benefit for resource ratios to budgeting.
41
42 Design integration for minimal energy and cost
3.2 P A R A M E T E R S FOR PROGRESSIVE EVALUATION
What are the basic meaningful measures by which an energy-conserving design can be evaluated?
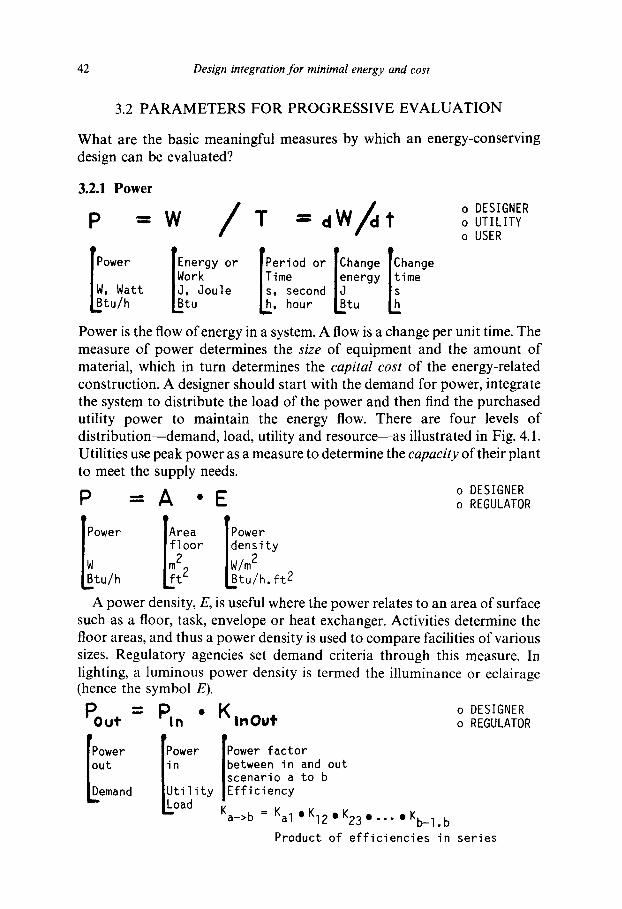
3.2.1 Power o DESIGNER o UTILITY o USER
le P°wer out
mand
Pou, : PI. " K i . o . t IP~wer IPower factor
|scenario a to b Utility [between in and out |Efficiency
Load Ka_>b = Kal • Kl2 • K23 • . . . • Kb_l. b
Product of eff iciencies in series
o DESIGNER o REGULATOR
LBtu/h hour Etu
Power is the flow of energy in a system. A flow is a change per unit time. The measure of power determines the size of equipment and the amount of material, which in turn determines the capital cost of the energy-related construction. A designer should start with the demand for power, integrate the system to distribute the load of the power and then find the purchased utility power to maintain the energy flow. There are four levels of distr ibution--demand, load, utility and resource--as illustrated in Fig. 4.1. Utilities use peak power as a measure to determine the capacity of their plant to meet the supply needs.
P - A " E o DESIGNER "" o REGULATOR [lower 'Area '[Power [floor Idensity LBtu/h ~2 |W/m2 LBtu/h, ft 2
A power density, E, is useful where the power relates to an area of surface such as a floor, task, envelope or heat exchanger. Activities determine the floor areas, and thus a power density is used to compare facilities of various sizes. Regulatory agencies set demand criteria through this measure. In lighting, a luminous power density is termed the illuminance or eclairage (hence the symbol E).
Parameters for evaluating an energy-conserving design 43
The power efficiency of an event is the ratio of the system power output to the power input. This power factor describes the distribution of power throughout a building between the demand and the resources. With a number of systems in series the combined power factor is a product of the power factors for each subsystem. The factor is a 'variable constant ' depending on the load and conditions of operation. The higher the factor, the lower the power input to satisfy the demand, or the higher the power output.
3.2.2 Time
t
L ime - v a r i a b l e from zero , second h, hour
T o ALL PARTIES
ime - per iod f o r event h day mth, month y , y e a r
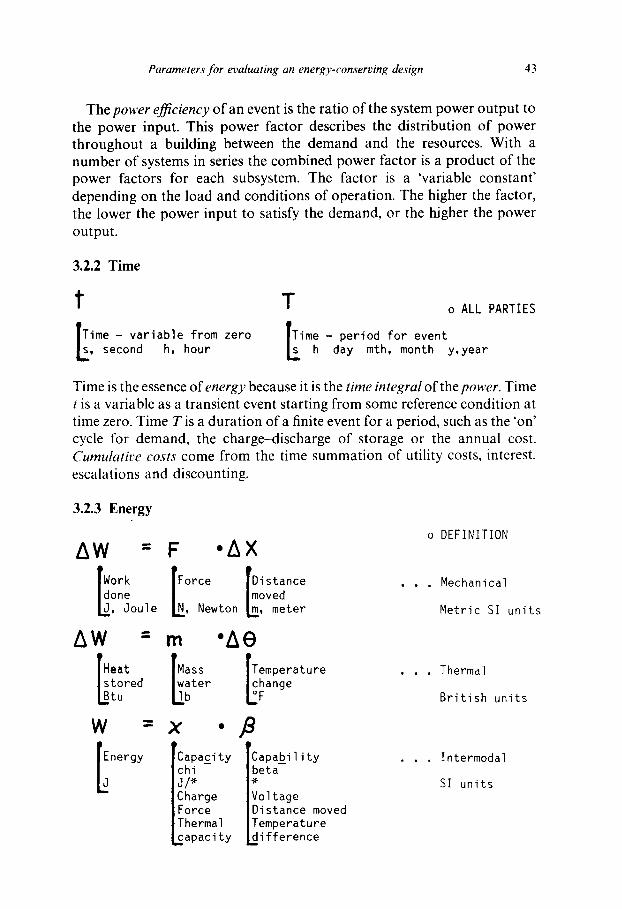
Time is the essence of energy because it is the time integral of the power. Time t is a variable as a transient event starting from some reference condition at time zero. Time T is a durat ion of a finite event for a period, such as the 'on' cycle for demand, the charge-discharge of storage or the annual cost. Cumulative costs come from the time summation of utility costs, interest, escalations and discounting.
3.2.3 Energy
AW Work done
, Jou le
A W :
Heat
stored tu
W
I nergy
= F .AX
Force rD i s tance |moved
~N, Newton ~ , meter
m
Mass water
b
x p
Capac i ty chi J/* Charge Force Thermal ~ a p a c i t y
" A e
Temperature change
F
. p C a p a b i l i t y beta
Vo l tage D is tance moved Temperature d i f f e r e n c e
n
o DEFINITION
• . . Mechanical
Me t r i c SI u n i t s
• , Thermal
B r i t i s h u n i t s
. . In termodal
Sl u n i t s
44 Design integration for minimal energy and cost
Energy is conceived as the coupling influence of one movement to another. 45 It is a system with a functional relationship and is not a physical entity. The influence causes the effect of movement in space and time within a finite volume of space. Simultaneously, there is a resistance to the movement by the internal inertial qualities of mass. The external effort to overcome this inertia is a force, F. Thus energy, W, is conceptually the work done against the inertia in moving the volume over a finite distance, x, in space, irrespective of the time taken. The volume can be sub-atomic to molecular, through rigid bodies to the astronomical, which covers all the modes of energy. This is the basis for the metric and SI units (Le Syst6me International d'Unit6s). Energy is an intermodal concept for work, which recognizes that energy can be converted from one kind to another. This is expressed by Joule's equivalent between mechanical and thermal modes, and a heat of reaction between chemical and thermal modes.
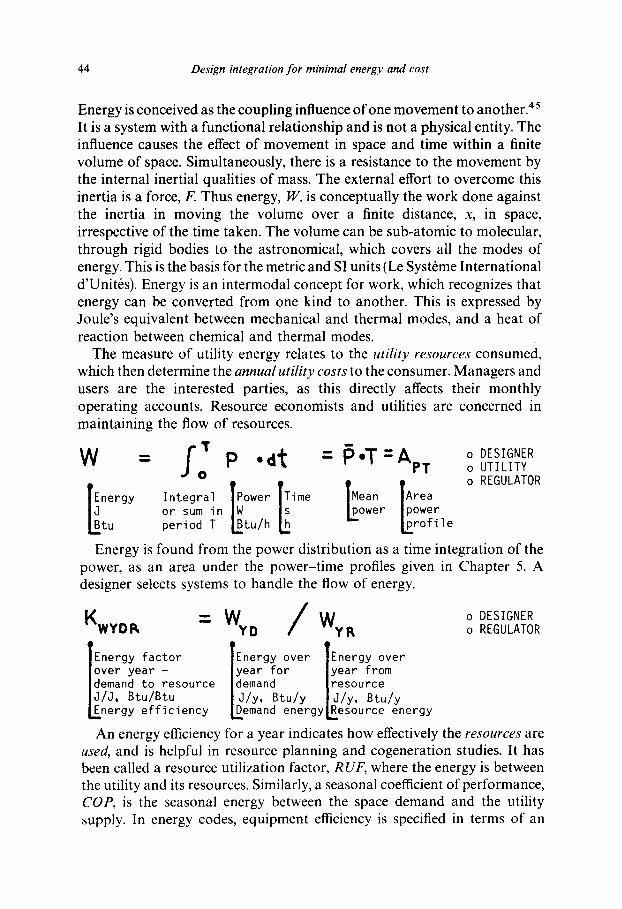
The measure of utility energy relates to the utility resources consumed, which then determine the annual utility costs to the consumer. Managers and users are the interested parties, as this directly affects their monthly operating accounts. Resource economists and utilities are concerned in maintaining the flow of resources.
w - : P 'T : ApT
[~nergy Integral IPower 'ITimel s IMean IArea or sum in Lpower |power
LBtu period T ~tu/h L~ E rOfil
o DESIGNER o UTILITY o REGULATOR
Energy is found from the power distribution as a time integration of the power, as an area under the power-time profiles given in Chapter 5. A designer selects systems to handle the flow of energy.
o DESIGNER KWYDP,, = ~NY D WyR o REGULATOR
Energy factor TEnergy over IEnergy over over year - |year for |year from demand to resource |demand |resource J/J, Btu/Btu |J /y, Btu/y |J /y , Btu/y
nergy efficiency L~emand energy~esource energy
An energy efficiency for a year indicates how effectively the resources are used, and is helpful in resource planning and cogeneration studies. It has been called a resource utilization factor, RUF, where the energy is between the utility and its resources. Similarly, a seasonal coefficient of performance, COP, is the seasonal energy between the space demand and the utility supply. In energy codes, equipment efficiency is specified in terms of an
Parameters for evaluating an energy-conserving design 45
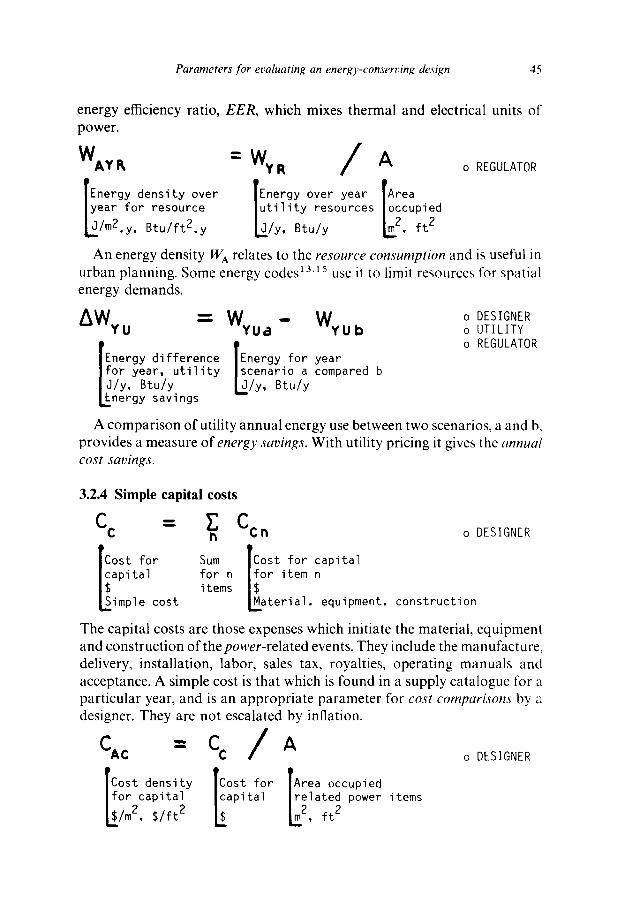
energy efficiency ratio, EER, which mixes thermal and electrical units of power.
WAy ~ : WyR / A o REGULATOR
Energy density over IEnergy over year [Area year for resource [u t i l i t y resources [occupied
/m2.y, Btu/ft2,y L~/y, Btu/y ~.2, f t 2
An energy density W A relates to the resource consumption and is useful in urban planning. Some energy codes ~3"15 use it to limit resources for spatial energy demands.
AW = Wy - W o DESIGNER YU Ud YUb o UTILITY
o REGULATOR Energy difference IEnergy for year for year, u t i l i ty lscenario a compared b J/y, Btu/y L~/y, Btu/y nergy savings
A compar ison of utility annual energy use between two scenarios, a and b, provides a measure of energy savings. With utility pricing it gives the annual cost savings.
3.2.4 Simple capital costs
C c -- Cc o DESIGNER
'ICost for tal ICost for Sum l ~°r item capi l~apital for nitems n L~imple cost tMaterial, equipment, construction
The capital costs are those expenses which initiate the material, equipment and construct ion of the power-related events. They include the manufacture, delivery, installation, labor, sales tax, royalties, operat ing manuals and acceptance. A simple cost is that which is found in a supply catalogue for a particular year, and is an appropria te parameter for cost comparisons by a designer. They are not escalated by inflation.
Cac = C c / A o DESIGNER Cost density [Cost for '[Area occupied for capital Irelated power items
L api tal
k$/m 2, $/ft 2 L 2, f t 2
46 Design integration for minimal energy and cost
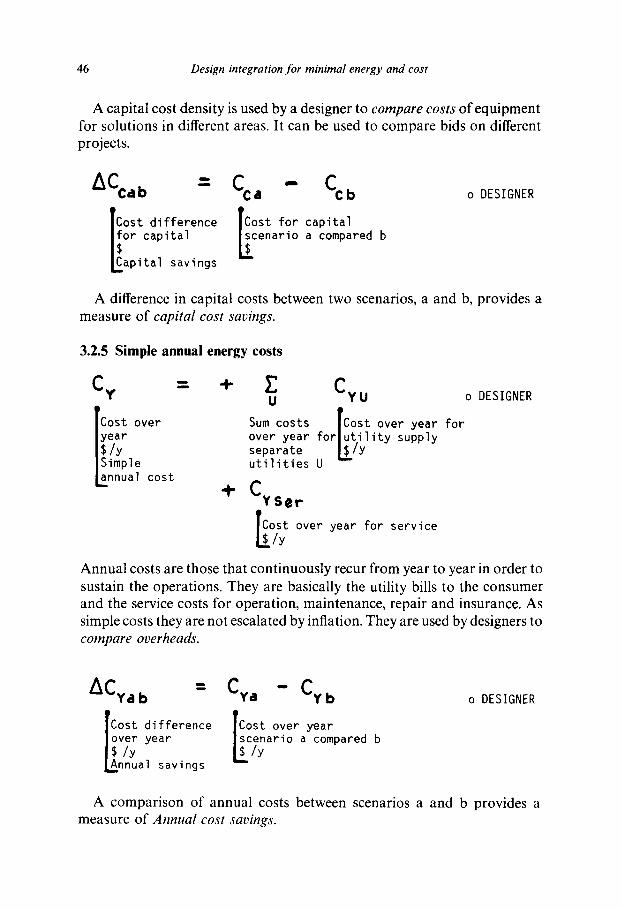
A capital cost density is used by a designer to compare costs of equipment for solutions in different areas. It can be used to compare bids on different projects.
Cost difference [Cost for capital ~or capital a compared b apital savings [~cenario
o DESIGNER
A difference in capital costs between two scenarios, a and b, provides a measure of capital cost savings.
3.2.5 Simple annual energy costs
C y -- ÷ U
Cost over Sum costs year over year $/y separate Simple ut i l i t ies nnual cost
-~ Cy ser
Cy U o DESIGNER
ICost over year for for [u t i l i ty supply u ~-Iy
Cost over year for service /y
Annual costs are those that continuously recur from year to year in order to sustain the operations. They are basically the utility bills to the consumer and the service costs for operation, maintenance, repair and insurance. As simple costs they are not escalated by inflation. They are used by designers to compare overheads.
ACyd b = Cya - Cyb
Cost difference ICost over year over year [scenario a compared b $/y ~/y nnual savings
o DESIGNER
A comparison of annual costs between scenarios a and b provides a measure of Annual cost savings.
Parameters for evaluating an energy-conserving design 47
3.2.6 Simple annual finance costs
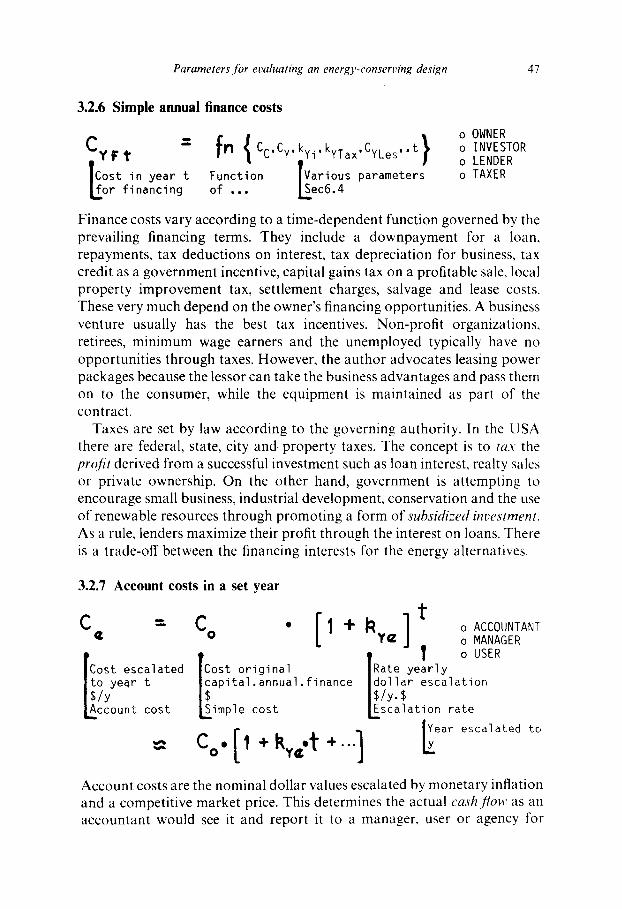
F~" r l Cc,Cy, ky i , kyTax, CyLes, • t o INVESTOR o LENDER
cost in year t Funct ion [Var ious parameters o TAXER or f inanc ing of . . . ~.ec6.4
Finance costs vary according to a t ime-dependent function governed by the prevailing financing terms. They include a downpayment for a loan, repayments, tax deductions on interest, tax depreciation for business, tax credit as a government incentive, capital gains tax on a profitable sale, local property improvement tax, settlement charges, salvage and lease costs. These very much depend on the owner's financing opportunities. A business venture usually has the best tax incentives. Non-profit organizations, retirees, minimum wage earners and the unemployed typically have no opportunities through taxes. However, the author advocates leasing power packages because the lessor can take the business advantages and pass them on to the consumer, while the equipment is maintained as part of the contract.
Taxes are set by law according to the governing authority. In the USA there are federal, state, city and. property taxes. The concept is to tax the profit derived from a successful investment such as loan interest, realty sales or private ownership. On the other hand, government is attempting to encourage small business, industrial development, conservation and the use of renewable resources through promoting a form of subsidized investment. As a rule, lenders maximize their profit through the interest on loans. There is a trade-off between the financing interests for the energy alternatives.
3.2.7 Account costs in a set year
C¢ = C O • [ 1 +
Cost escalated ICost original to year t finance $/Y [~apital.annual.
ccount cost L~imple cost
; Co.[,
t 1 o ACCOUNTANT
¥~ | o MANAGER T " I o USER IRate yearly |dollar escalation l$/Y'$ kEscalation rate
e a r e s c a l a t e d t o
Account costs are the nominal dollar values escalated by monetary inflation and a competitive market price. This determines the actual cashflow as an accountant would see it and report it to a manager, user or agency for
48 Design integration for minimal energy and cost
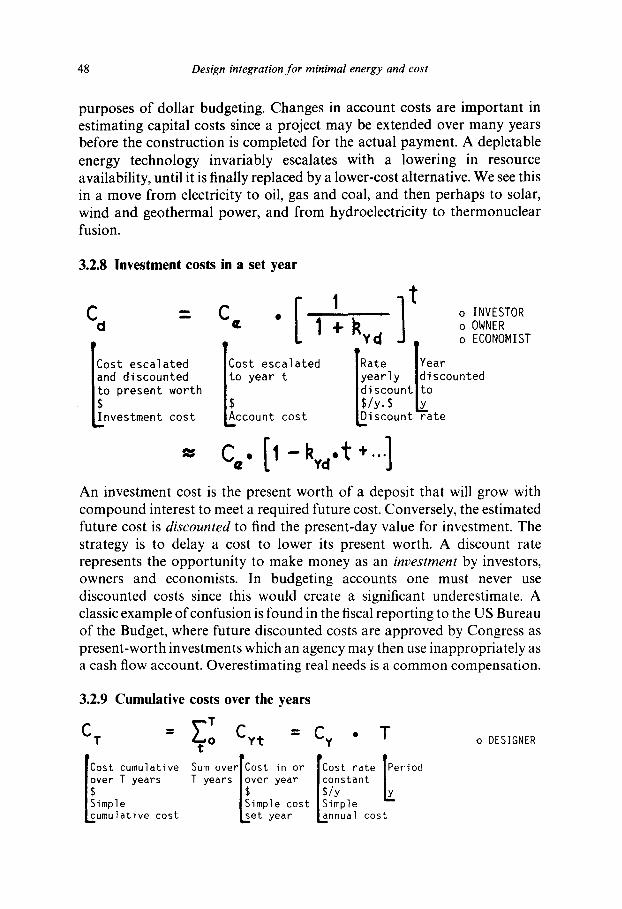
purposes of dollar budgeting. Changes in account costs are important in estimating capital costs since a project may be extended over many years before the construction is completed for the actual payment. A depletable energy technology invariably escalates with a lowering in resource availability, until it is finally replaced by a lower-cost alternative. We see this in a move from electricity to oil, gas and coal, and then perhaps to solar, wind and geothermal power, and from hydroelectricity to thermonuclear fusion.
3.2.8 Investment costs in a set year [, t , l o INVESTOR C C
- d = " " ' I + k l o 0W,ER Y(~ J T o ECONOMIST
[Cost escalated ICost escalated IRate |Year land discounted Ii 0 year t Idi |yearly ldisc°unted scountJto
|S/y.$ L [Investment cost LAccount cost LDiscount rate
= c . .
An investment cost is the present worth of a deposit that will grow with compound interest to meet a required future cost. Conversely, the estimated future cost is discounted to find the present-day value for investment. The strategy is to delay a cost to lower its present worth. A discount rate represents the opportunity to make money as an investment by investors, owners and economists. In budgeting accounts one must never use discounted costs since this would create a significant underestimate. A classic example of confusion is found in the fiscal reporting to the US Bureau of the Budget, where future discounted costs are approved by Congress as present-worth investments which an agency may then use inappropriately as a cash flow account. Overestimating real needs is a common compensation.
3.2.9 Cumulative costs over the years
CT = o CYt =
cost cumulative Sum over[Cost in or ver T years T years l~ver year
Simple |Simple cost umulative cost L~et year
Cy • T
cost rate |Period constant | $1Y ~. Simple nnual cost
o DESIGNER
Parameters for evaluating an energy-conserving design 4!)
C T c
Cost cumulative over T years
~ scalated
Account umulative cost
= Z : Cy¢ = Cy ZT[l+ky.] t ¢o
Sum over[Cost over T years |year
I ~scalated
|Account L~ost :
o ACCOUNTANT
Simple r I P e r i o d annual cost |Escalation for uniform Kate series
Cy J
CTd : Cvd " Cy o 7~- '~" d
Cost cumulative over T years escalated and ~ iscounted
Investment umulative cost
Sum over T years
o INVESTOR
' r r r Cost over Simple Period year |annual cost IDiscount escalated I for uniform Irate discounted |series $ IT Investment [ [ '1 "1"~ y : J-' - : Cv I +kv
L - hy e_ hyd
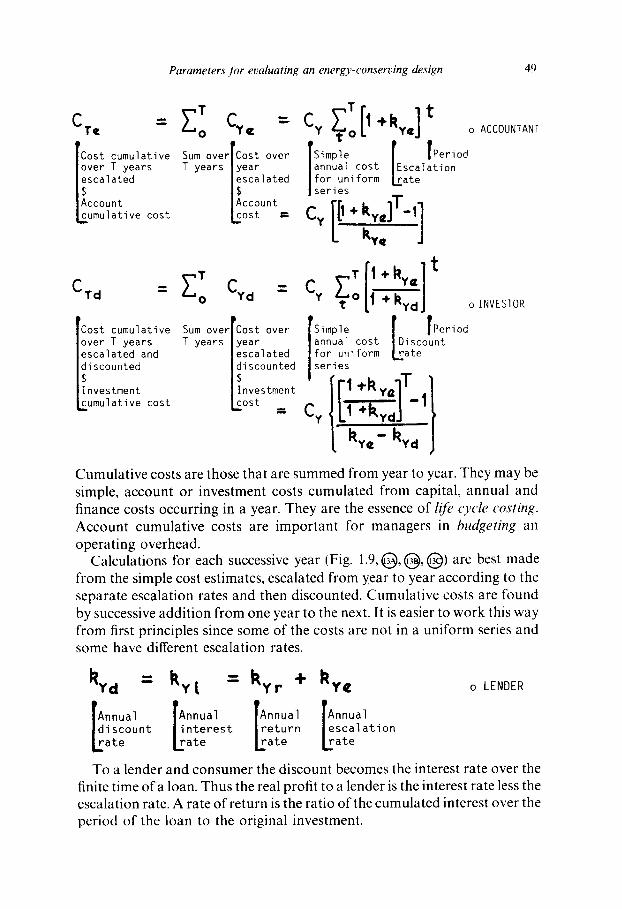
Cumulative costs are those that are summed from year to year. They may be simple, account or investment costs cumulated from capital, annual and finance costs occurring in a year. They are the essence of life cycle costing. Account cumulative costs are important for managers in budgeting an operating overhead.
Calculations for each successive year (Fig. 1 . 9 , G , ( ~ , ( ~ ) are best made from the simple cost estimates, escalated from year to year according to the separate escalation rates and then discounted. Cumulative costs are found by successive addition from one year to the next. It is easier to work this way from first principles since some of the costs are not in a uniform series and some have different escalation rates.
kyd --" kyt " kyr ÷ ky¢ o LENDER
Annual rAnnual IAnnual IAnnual discount | i n t e r e s t | r e t u r n | e s c a l a t i o n
ate [~ate L~ate ~ a t e
To a lender and consumer the discount becomes the interest rate over the finite time of a loan. Thus the real profit to a lender is the interest rate less the escalation rate. A rate of return is the ratio of the cumulated interest over the period of the loan to the original investment.
50 Design integration for minimal energy and cost
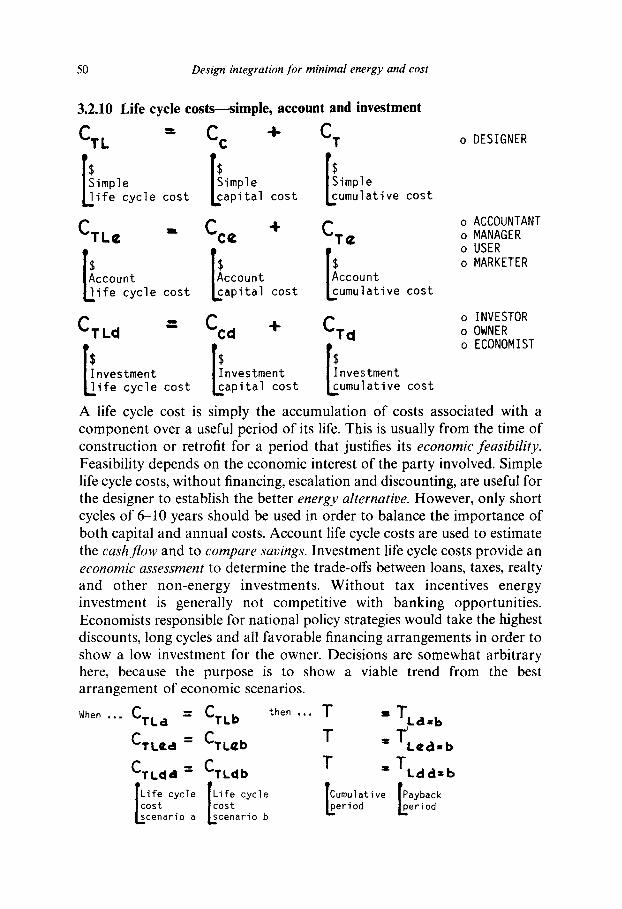
3.2.10
CTL
Life cycle costs--s imple, account and investment
= C c + C r
mple Simple Simple fe cycle cost L~apital cost ~umulative cost
CTL e - Cce + C.re $ $ [A cco n [Accoun [Accoun
Ll i fe cycle cost ~apital cost ~umulative cost
CTL d = Ccd "1" CTd $ $
r~nvestment Ilnvestment [Investment L~ife cycle cost Lcapital cost L~umulative cost
o DESIGNER
o ACCOUNTANT o MANAGER o USER o MARKETER
o INVESTOR o OWNER o ECONOMIST
here, because the purpose is to show a viable trend from the best arrangement of economic scenarios.
When . . . CTL a = CTL b t h e n . . . T = TLd=b
CTLe d : CTL~b T = TLea. b
CTLd d = CTLd b T = TLdd. b
cost Icost LPeriod ~period cenario a L~cenario b
A life cycle cost is simply the accumulation of costs associated with a component over a useful period of its life. This is usually from the time of construction or retrofit for a period that justifies its economic feasibility. Feasibility depends on the economic interest of the party involved. Simple life cycle costs, without financing, escalation and discounting, are useful for the designer to establish the better energy alternative. However, only short cycles of 6-10 years should be used in order to balance the importance of both capital and annual costs. Account life cycle costs are used to estimate the cashflow and to compare savings. Investment life cycle costs provide an economic assessment to determine the trade-offs between loans, taxes, realty and other non-energy investments. Without tax incentives energy investment is generally not competitive with banking opportunities. Economists responsible for national policy strategies would take the highest discounts, long cycles and all favorable financing arrangements in order to show a low investment for the owner. Decisions are somewhat arbitrary
Parameters for evaluating an energy-conserving design 51
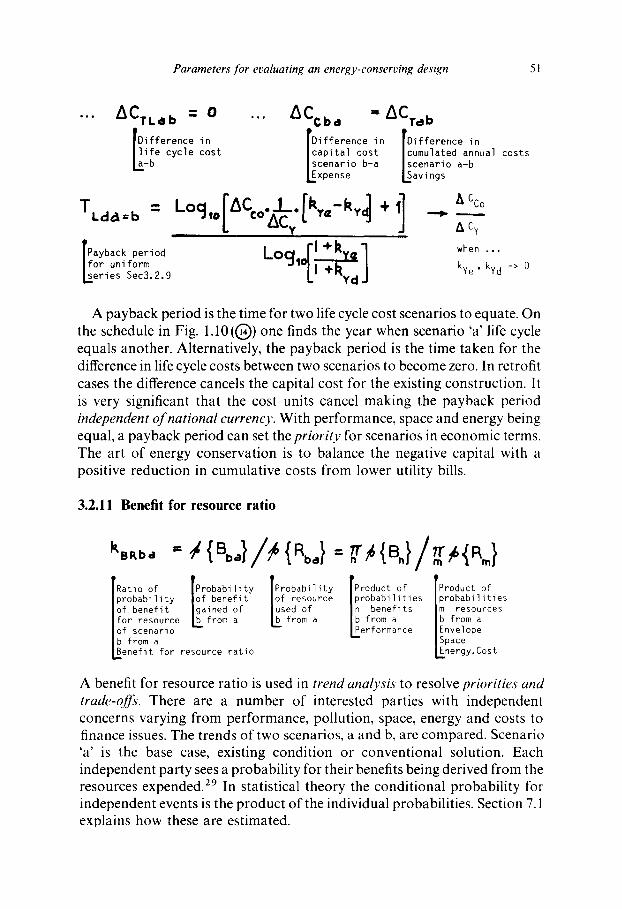
ACTLdb - 0 Difference in l i f e cycle cost
b
- r,,o<o._,_.[,,,..-,,,.<,] +,] TLaa=b - L°q,o L AC v i
rPayback period Locj,0rL . ] lfor uniform L~eries Sec3,2,9 L I +~Yd-J
ACcb d :" ACTa b Difference in rDif ference in capital cost |cumulated annual costs scenario b-a |scenario a-b
xpense ISavings
A Cco . ACy when , . ,
kye , kyd -> 0
A payback period is the time for two life cycle cost scenarios to equate. On the schedule in Fig. 1.10((~)) one finds the year when scenario 'a' life cycle equals another. Alternatively, the payback period is the time taken for the difference in life cycle costs between two scenarios to become zero. In retrofit cases the difference cancels the capital cost for the existing construction. It is very significant that the cost units cancel making the payback period independent of national currency. With performance, space and energy being equal, a payback period can set the priority for scenarios in economic terms. The art of energy conservation is to balance the negative capital with a positive reduction in cumulative costs from lower utility bills.
3.2.11 Benefit for resource ratio
k, B R b a T-
Ratio of IProbabi l i ty probabil i ty |of benefit of benefit |gained of for resource ~ _ f r o m a of scenario - - b from a
enefit for resource ratio
P r o b a b i l i t y [Product of [Product of of resource |probabi l i t ies l P r o b a b i l i t i e s used of |n benefits |m resources
from a |b from a |b from a I Performance |Envelope
|Space k~nergy. Cost
A benefit for resource ratio is used in trend analysis to resolve priorities and trade-offs. There are a number of interested parties with independent concerns varying from performance, pollution, space, energy and costs to finance issues. The trends of two scenarios, a and b, are compared. Scenario 'a' is the base case, existing condition or conventional solution. Each independent party sees a probability for their benefits being derived from the resources expended, a9 In statistical theory the conditional probability for independent events is the product of the individual probabilities. Section 7.1 explains how these are estimated.

52 Design integration for minimal energy and cost
Only the relevant benefits and resources are considered, depending on the grouping of the interested parties. The strategy is for each party to see their evaluative parameter and follow its trend in the whole process. Ratios must be considered as trends because the variance of the inputs is significant (Section 8.1). Even so, the resultant measure is objective which helps in decision making for committees. 3° A ratio of unity means that the scenarios a and b have equal priority; higher values suggest more benefits for less resources.
Budgeting over the years is expended in the order of priority for the feasible scenarios. Time-zero priority concentrates on capital availability, and decade priority on the life cycle and future benefits. A budget is scheduled (see Fig. 1.11, (~)) by listing the alternative scenarios in priority, and then expending them over time according to the allocated funds, construction opportunities and regulatory constraints.