Embed Size (px)
Citation preview
Papua New Guinea’s progress towards climate compatible development
Vanuatu, March, 2011
Not to be quoted without permission of the Office of Climate Change and Development
Wo
rkin
g D
raft -
La
st M
od
ified
2/2
5/2
01
1 2
:12
:57
PM
▪ PNG’s approach to adaptation
▪ Vulnerability analysis
La
st M
od
ified
2/2
5/2
01
1 2
:12
:57
PM
Prin
ted
2/2
4/2
01
1 1
1:2
5:3
9 A
M
1
▪ Cost efficient solutions
▪ Current implementation
Wo
rkin
g D
raft -
La
st M
od
ified
2/2
5/2
01
1 2
:12
:57
PM
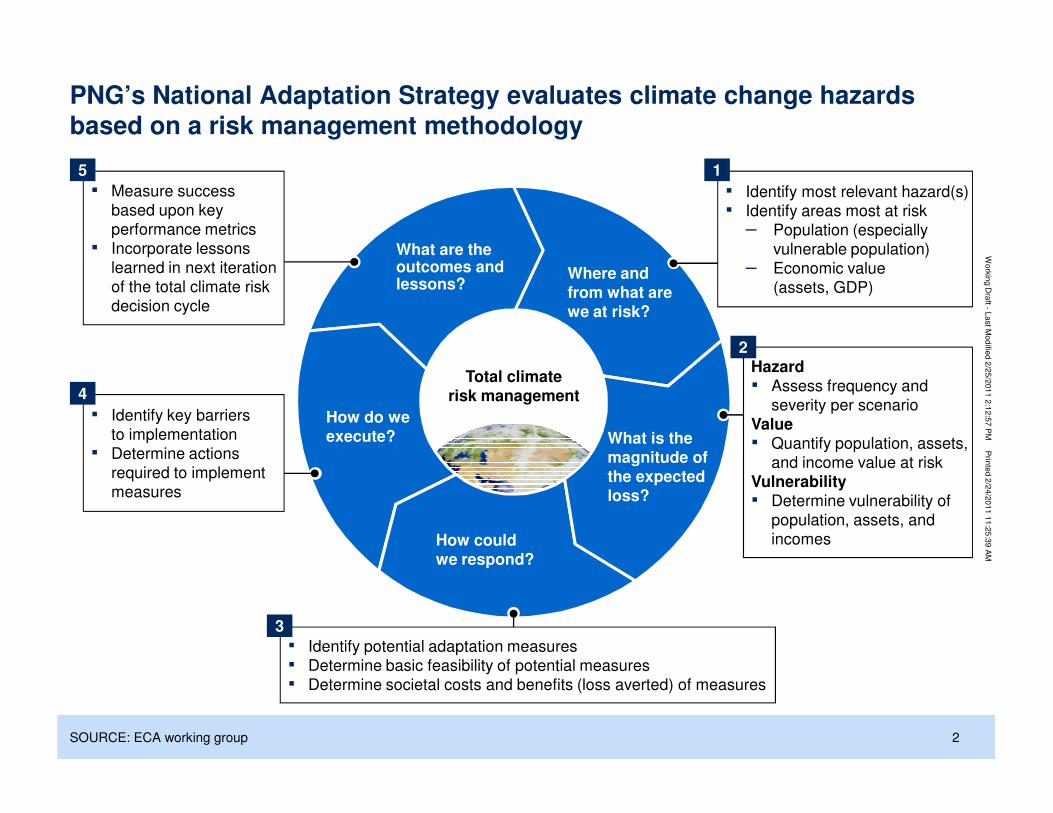
PNG’s National Adaptation Strategy evaluates climate change hazards based on a risk management methodology
Where and from what are we at risk?
What are the outcomes and lessons?
Total climate risk management
▪ Measure success
based upon key
performance metrics
▪ Incorporate lessons
learned in next iteration
of the total climate risk
decision cycle
5
Hazard▪ Assess frequency and
severity per scenario
2
▪ Identify most relevant hazard(s)
▪ Identify areas most at risk
– Population (especially
vulnerable population)
– Economic value
(assets, GDP)
1
▪ Identify key barriers
4
La
st M
od
ified
2/2
5/2
01
1 2
:12
:57
PM
Prin
ted
2/2
4/2
01
1 1
1:2
5:3
9 A
M
2SOURCE: ECA working group
What is the magnitude of the expected loss?
How could we respond?
How do we execute?
▪ Identify potential adaptation measures
▪ Determine basic feasibility of potential measures
▪ Determine societal costs and benefits (loss averted) of measures
3
severity per scenario
Value▪ Quantify population, assets,
and income value at risk
Vulnerability▪ Determine vulnerability of
population, assets, and
incomes
▪ Identify key barriers
to implementation
▪ Determine actions
required to implement
measures
Wo
rkin
g D
raft -
La
st M
od
ified
2/2
5/2
01
1 2
:12
:57
PM
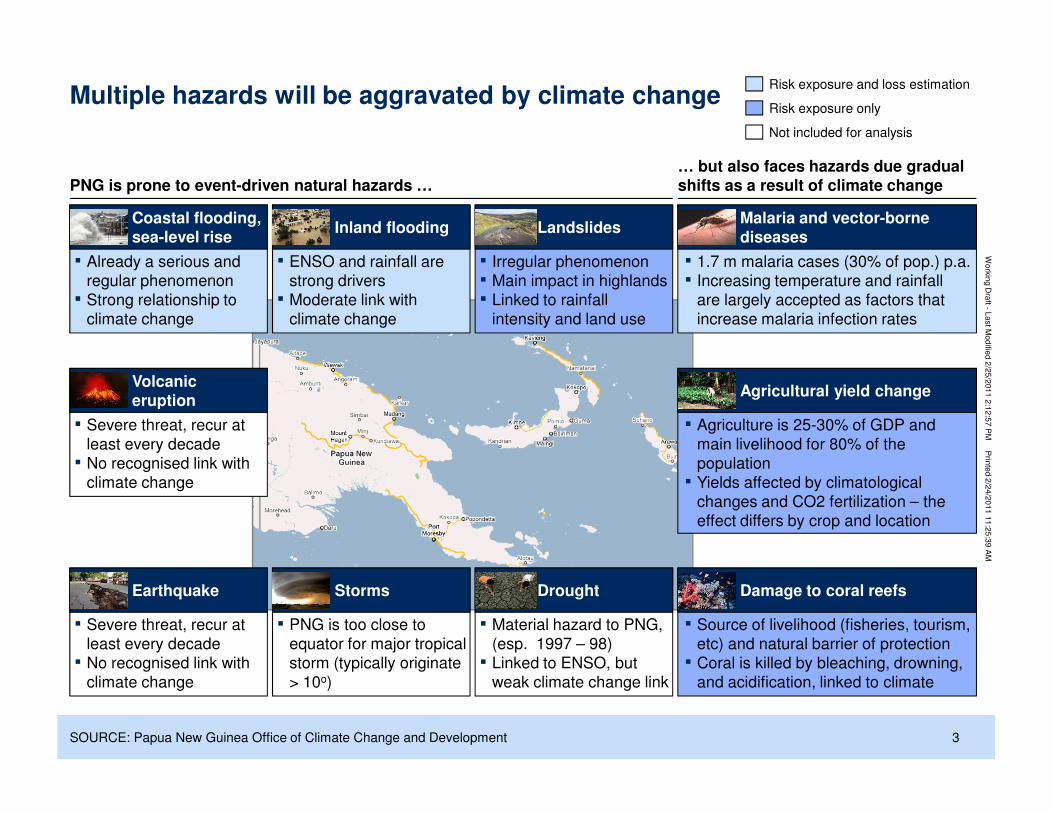
Multiple hazards will be aggravated by climate change Risk exposure only
Risk exposure and loss estimation
Not included for analysis
PNG is prone to event-driven natural hazards …… but also faces hazards due gradual shifts as a result of climate change
Inland flooding
▪ ENSO and rainfall are
strong drivers
▪ Moderate link with
climate change
Coastal flooding, sea-level rise
▪ Already a serious and
regular phenomenon
▪ Strong relationship to
climate change
Landslides
▪ Irregular phenomenon
▪ Main impact in highlands
▪ Linked to rainfall
intensity and land use
▪ 1.7 m malaria cases (30% of pop.) p.a.
▪ Increasing temperature and rainfall
are largely accepted as factors that
increase malaria infection rates
Malaria and vector-borne diseases
Agricultural yield changeVolcanic eruption
La
st M
od
ified
2/2
5/2
01
1 2
:12
:57
PM
Prin
ted
2/2
4/2
01
1 1
1:2
5:3
9 A
M
3
▪ Agriculture is 25-30% of GDP and
main livelihood for 80% of the
population
▪ Yields affected by climatological
changes and CO2 fertilization – the
effect differs by crop and location
▪ Source of livelihood (fisheries, tourism,
etc) and natural barrier of protection
▪ Coral is killed by bleaching, drowning,
and acidification, linked to climate
Damage to coral reefsStorms
▪ PNG is too close to
equator for major tropical
storm (typically originate
> 10o)
Drought
▪ Material hazard to PNG,
(esp. 1997 – 98)
▪ Linked to ENSO, but
weak climate change link
Earthquake
▪ Severe threat, recur at
least every decade
▪ No recognised link with
climate change
eruption
▪ Severe threat, recur at
least every decade
▪ No recognised link with
climate change
SOURCE: Papua New Guinea Office of Climate Change and Development
Wo
rkin
g D
raft -
La
st M
od
ified
2/2
5/2
01
1 2
:12
:57
PM
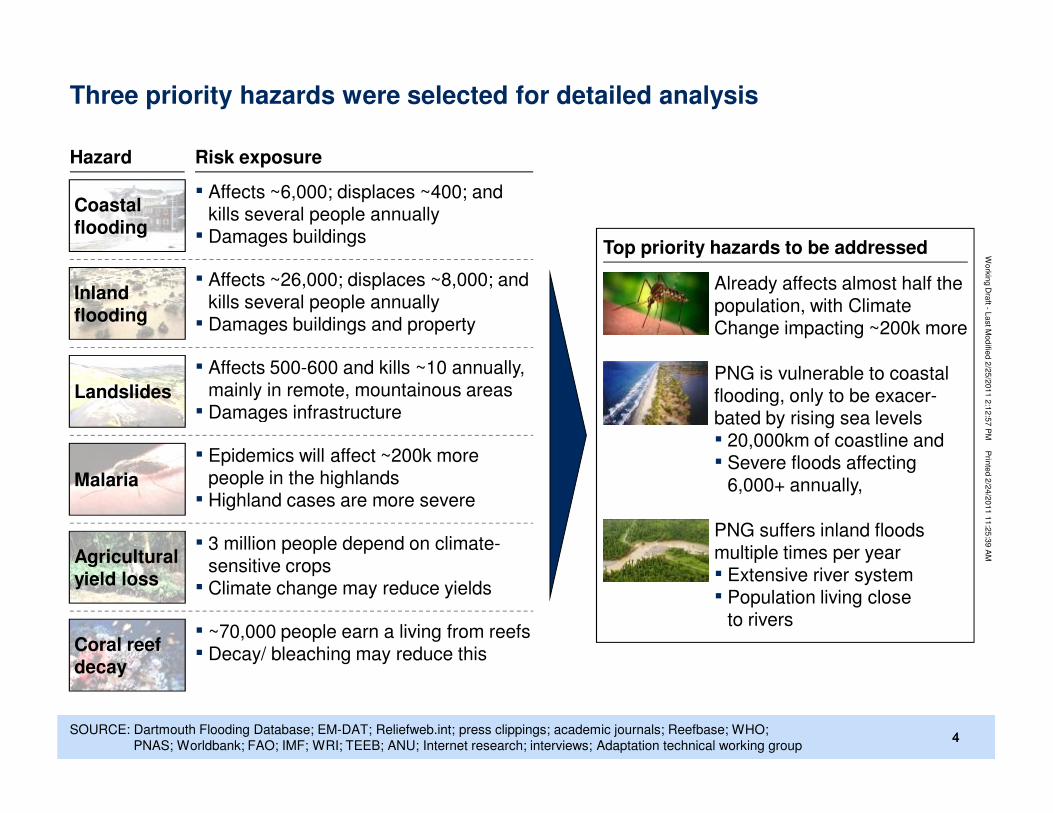
Three priority hazards were selected for detailed analysis
Hazard
Inland flooding
▪ Affects ~26,000; displaces ~8,000; and kills several people annually▪ Damages buildings and property
Risk exposure
Coastal flooding
▪ Affects ~6,000; displaces ~400; and kills several people annually▪ Damages buildings
▪ Affects 500-600 and kills ~10 annually, mainly in remote, mountainous areas▪ Damages infrastructure
Landslides
Top priority hazards to be addressed
Already affects almost half the population, with Climate Change impacting ~200k more
PNG is vulnerable to coastal flooding, only to be exacer-
La
st M
od
ified
2/2
5/2
01
1 2
:12
:57
PM
Prin
ted
2/2
4/2
01
1 1
1:2
5:3
9 A
M
4SOURCE: Dartmouth Flooding Database; EM-DAT; Reliefweb.int; press clippings; academic journals; Reefbase; WHO;
PNAS; Worldbank; FAO; IMF; WRI; TEEB; ANU; Internet research; interviews; Adaptation technical working group4
Malaria
▪ Epidemics will affect ~200k more people in the highlands▪ Highland cases are more severe
Coral reef decay
▪ ~70,000 people earn a living from reefs▪ Decay/ bleaching may reduce this
Agricultural yield loss
▪ 3 million people depend on climate-sensitive crops ▪ Climate change may reduce yields
▪ Damages infrastructure bated by rising sea levels▪ 20,000km of coastline and ▪ Severe floods affecting
6,000+ annually,
PNG suffers inland floods multiple times per year▪ Extensive river system ▪ Population living close
to rivers
Wo
rkin
g D
raft -
La
st M
od
ified
2/2
5/2
01
1 2
:12
:57
PM
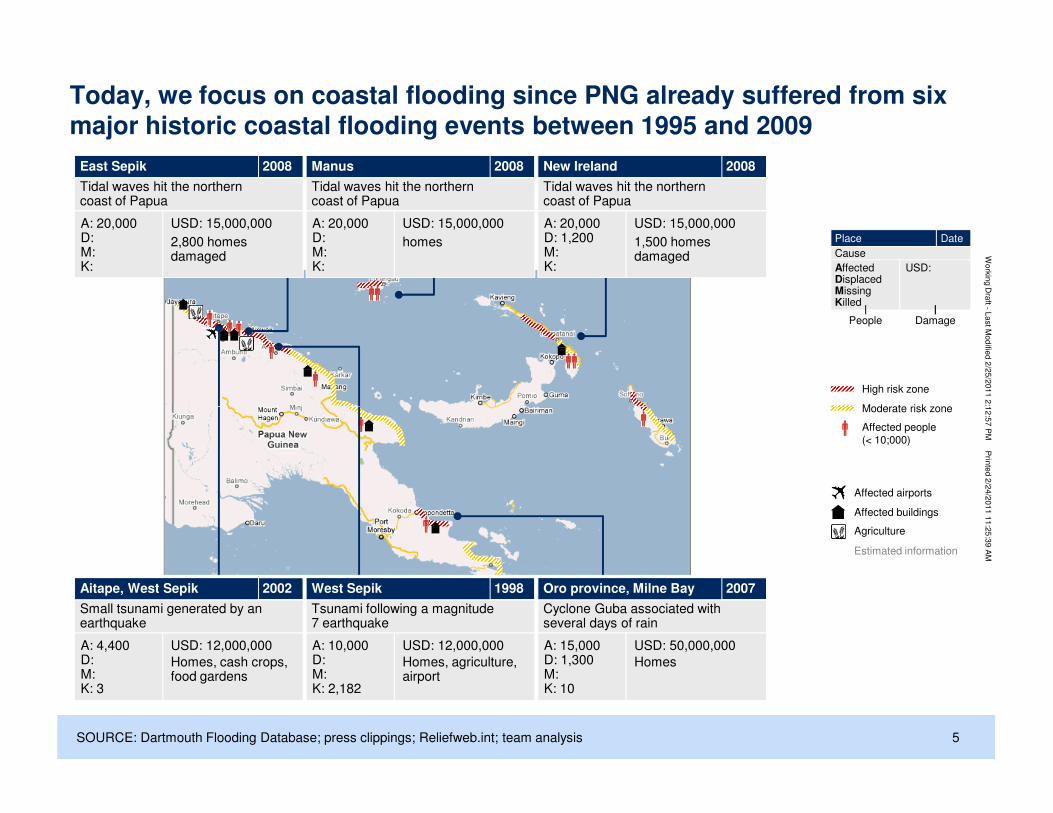
Today, we focus on coastal flooding since PNG already suffered from six major historic coastal flooding events between 1995 and 2009
High risk zone
Moderate risk zone
AffectedDisplacedMissingKilled
USD:
Cause
People Damage
Place Date
2008East Sepik
A: 20,000D:M:K:
USD: 15,000,000
Tidal waves hit the northern coast of Papua
2,800 homes damaged
2008Manus
A: 20,000D:M:K:
USD: 15,000,000
Tidal waves hit the northern coast of Papua
homes
2008New Ireland
A: 20,000D: 1,200M:K:
USD: 15,000,000
Tidal waves hit the northern coast of Papua
1,500 homes damaged
La
st M
od
ified
2/2
5/2
01
1 2
:12
:57
PM
Prin
ted
2/2
4/2
01
1 1
1:2
5:3
9 A
M
5SOURCE: Dartmouth Flooding Database; press clippings; Reliefweb.int; team analysis
Moderate risk zone
Affected people (< 10;000)
Affected airports
Affected buildings
Agriculture
Estimated information
2002Aitape, West Sepik
A: 4,400D:M:K: 3
USD: 12,000,000
Small tsunami generated by an earthquake
Homes, cash crops, food gardens
1998West Sepik
A: 10,000D:M:K: 2,182
USD: 12,000,000
Tsunami following a magnitude 7 earthquake
Homes, agriculture, airport
2007Oro province, Milne Bay
A: 15,000D: 1,300M:K: 10
USD: 50,000,000
Cyclone Guba associated with several days of rain
Homes
Wo
rkin
g D
raft -
La
st M
od
ified
2/2
5/2
01
1 2
:12
:57
PM
▪ PNG’s Approach to adaptation
▪ Vulnerability analysis
La
st M
od
ified
2/2
5/2
01
1 2
:12
:57
PM
Prin
ted
2/2
4/2
01
1 1
1:2
5:3
9 A
M
6
▪ Cost efficient solutions
▪ Current implementation
Wo
rkin
g D
raft -
La
st M
od
ified
2/2
5/2
01
1 2
:12
:57
PM
x
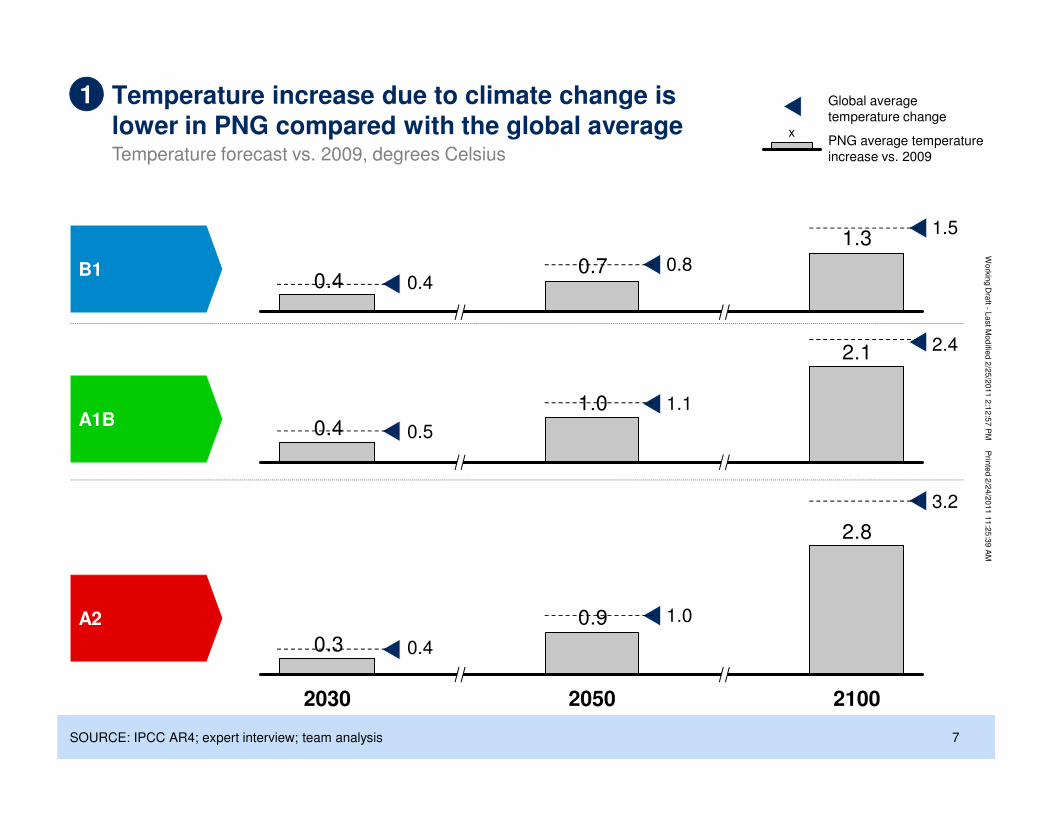
B1
Temperature increase due to climate change is lower in PNG compared with the global average
2.1
1.0
1.3
0.70.4
Temperature forecast vs. 2009, degrees Celsius
0.40.8
1.5
1.1
2.4
1 Global average
temperature change
PNG average temperature
increase vs. 2009
La
st M
od
ified
2/2
5/2
01
1 2
:12
:57
PM
Prin
ted
2/2
4/2
01
1 1
1:2
5:3
9 A
M
7
A1B
A2
SOURCE: IPCC AR4; expert interview; team analysis
2.8
0.9
0.3
2030 21002050
1.00.4 0.5
1.1
0.4
1.0
3.2
Wo
rkin
g D
raft -
La
st M
od
ified
2/2
5/2
01
1 2
:12
:57
PM
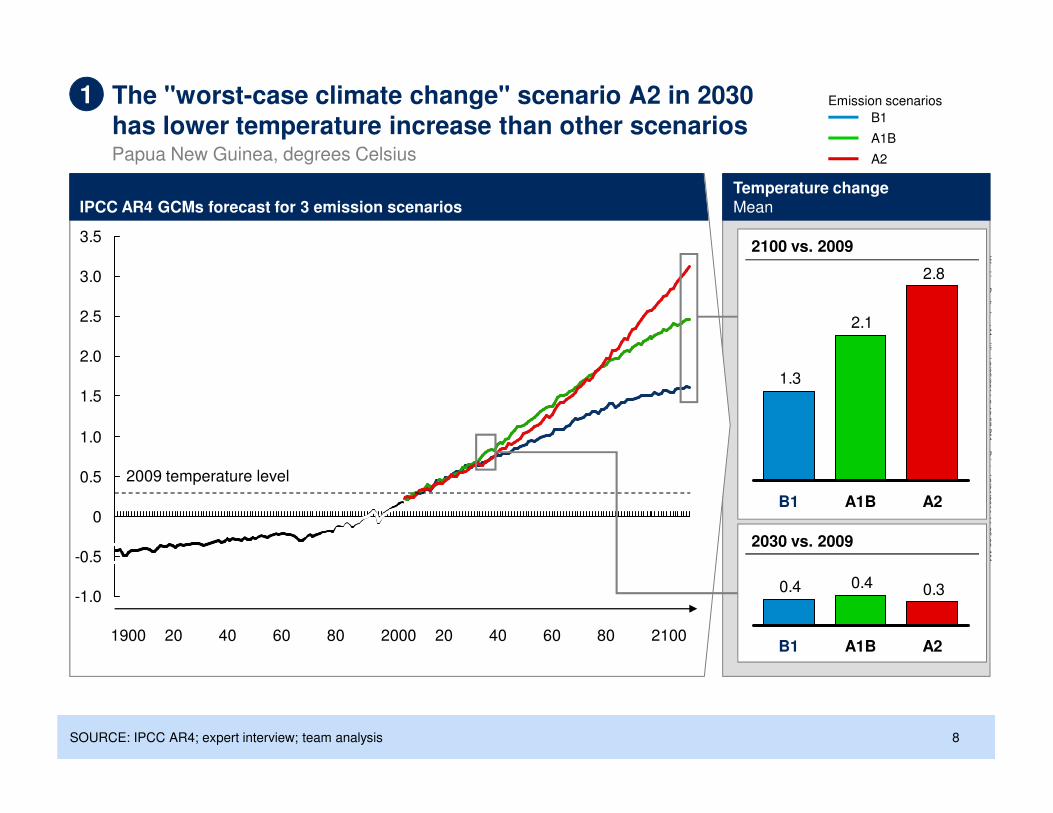
The "worst-case climate change" scenario A2 in 2030 has lower temperature increase than other scenariosPapua New Guinea, degrees Celsius
1.5
2.0
2.5
3.0
3.5
Temperature changeMean
1 Emission scenarios
B1
A1B
A2
IPCC AR4 GCMs forecast for 3 emission scenarios
2.8
2.1
1.3
2100 vs. 2009
La
st M
od
ified
2/2
5/2
01
1 2
:12
:57
PM
Prin
ted
2/2
4/2
01
1 1
1:2
5:3
9 A
M
8
1900 20 40 60 80 2000 20 40 60 80 2100
-1.0
-0.5
0
0.5
1.0
SOURCE: IPCC AR4; expert interview; team analysis
0.30.40.4
B1 A1B A2
2009 temperature level
2030 vs. 2009
A2A1BB1
Wo
rkin
g D
raft -
La
st M
od
ified
2/2
5/2
01
1 2
:12
:57
PM
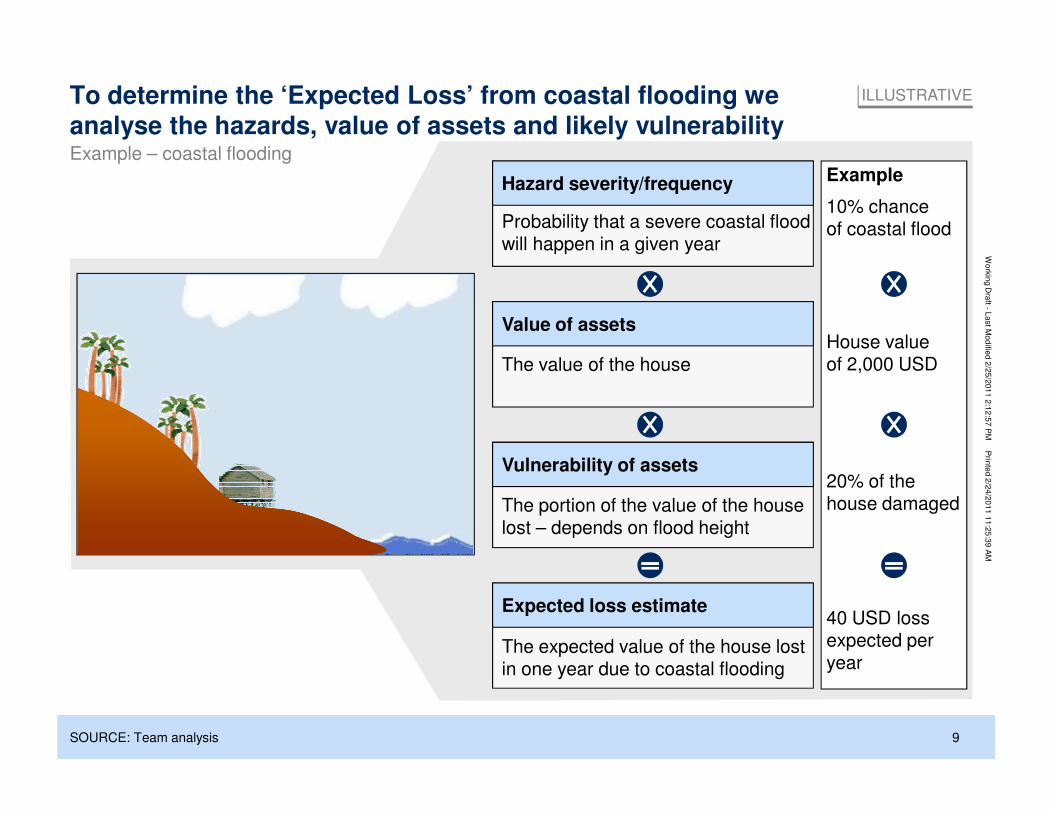
To determine the ‘Expected Loss’ from coastal flooding we analyse the hazards, value of assets and likely vulnerability
ExampleHazard severity/frequency
Probability that a severe coastal flood will happen in a given year
Value of assets
The value of the house
10% chance of coastal flood
House value of 2,000 USD
ILLUSTRATIVE
Example – coastal flooding
La
st M
od
ified
2/2
5/2
01
1 2
:12
:57
PM
Prin
ted
2/2
4/2
01
1 1
1:2
5:3
9 A
M
9
Vulnerability of assets
The portion of the value of the house lost – depends on flood height
Expected loss estimate
The expected value of the house lost in one year due to coastal flooding
20% of the house damaged
40 USD loss expected per year
SOURCE: Team analysis
Wo
rkin
g D
raft -
La
st M
od
ified
2/2
5/2
01
1 2
:12
:57
PM
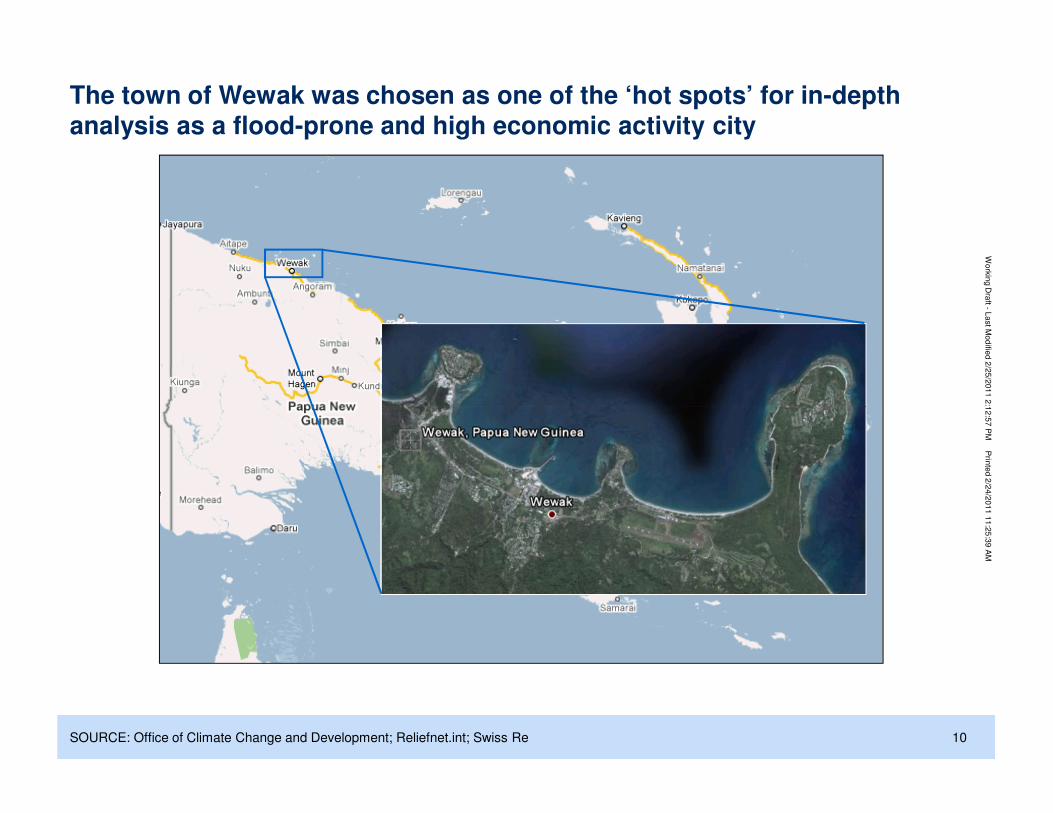
The town of Wewak was chosen as one of the ‘hot spots’ for in-depth analysis as a flood-prone and high economic activity city
La
st M
od
ified
2/2
5/2
01
1 2
:12
:57
PM
Prin
ted
2/2
4/2
01
1 1
1:2
5:3
9 A
M
10SOURCE: Office of Climate Change and Development; Reliefnet.int; Swiss Re
Wo
rkin
g D
raft -
La
st M
od
ified
2/2
5/2
01
1 2
:12
:57
PM
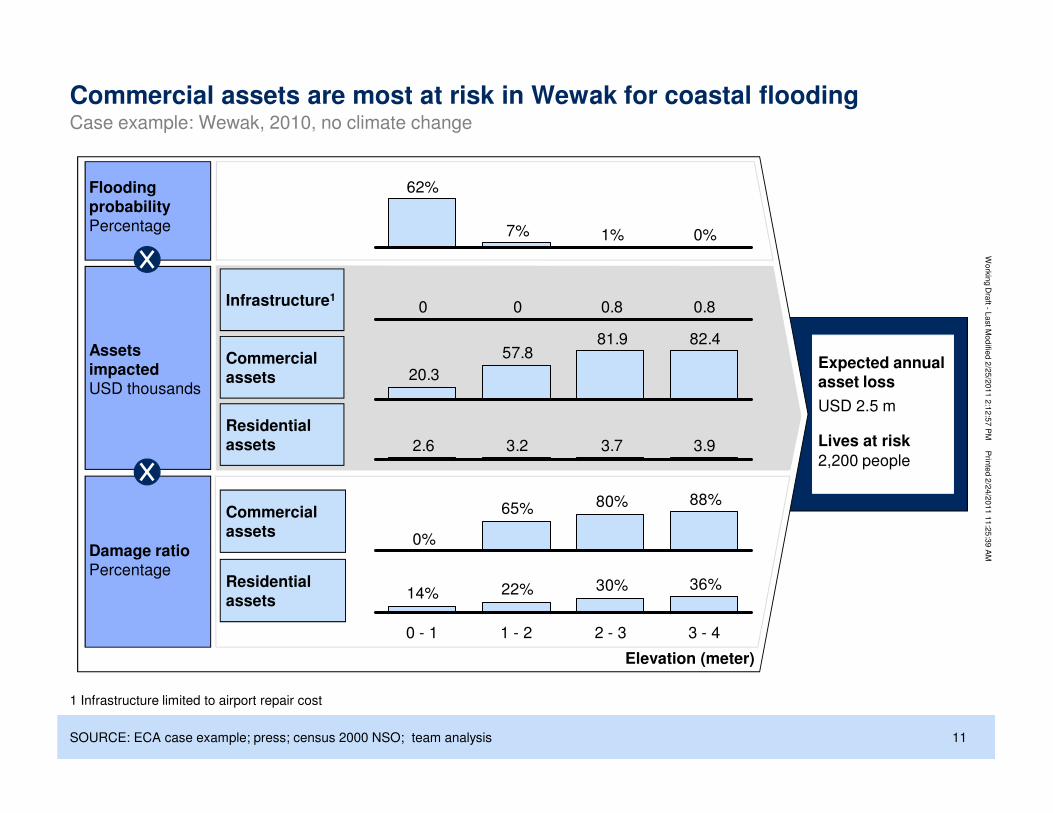
Expected annual asset loss
USD 2.5 m
Commercial assets are most at risk in Wewak for coastal flooding
Flooding probabilityPercentage
Assets impactedUSD thousands
Infrastructure1
Commercial assets
0.80.800
82.481.957.8
20.3
0%1%7%
62%
Case example: Wewak, 2010, no climate change
La
st M
od
ified
2/2
5/2
01
1 2
:12
:57
PM
Prin
ted
2/2
4/2
01
1 1
1:2
5:3
9 A
M
11
Lives at risk
USD 2.5 m
2,200 people
1 Infrastructure limited to airport repair cost
SOURCE: ECA case example; press; census 2000 NSO; team analysis
Damage ratioPercentage
36%30%22%14%
3 - 42 - 31 - 20 - 1
Residential assets
Commercial assets
Residential assets
88%80%65%
0%
Elevation (meter)
3.93.73.22.6
Wo
rkin
g D
raft -
La
st M
od
ified
2/2
5/2
01
1 2
:12
:57
PM
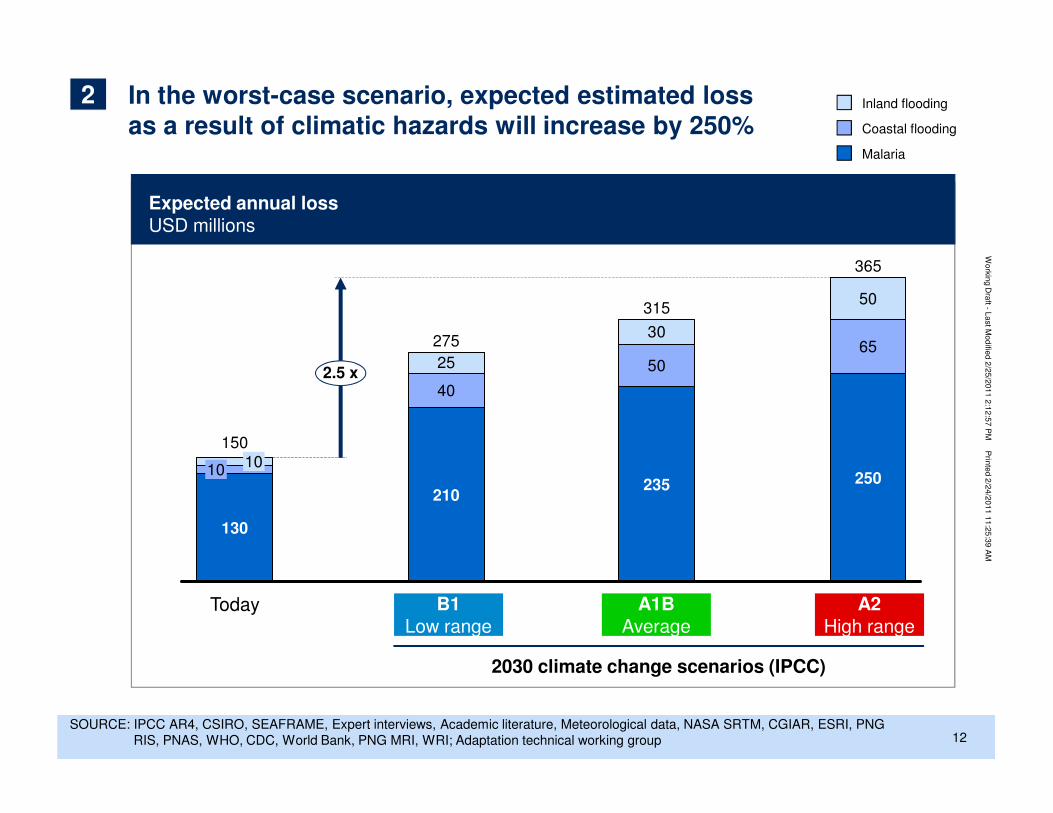
In the worst-case scenario, expected estimated loss as a result of climatic hazards will increase by 250%
Expected annual lossUSD millions
40
5065
25
30
50315
365
275
2.5 x
Malaria
Coastal flooding
Inland flooding2
La
st M
od
ified
2/2
5/2
01
1 2
:12
:57
PM
Prin
ted
2/2
4/2
01
1 1
1:2
5:3
9 A
M
12SOURCE: IPCC AR4, CSIRO, SEAFRAME, Expert interviews, Academic literature, Meteorological data, NASA SRTM, CGIAR, ESRI, PNG
RIS, PNAS, WHO, CDC, World Bank, PNG MRI, WRI; Adaptation technical working group
25010
130
210
Today
150
10235
2030 climate change scenarios (IPCC)
B1Low range
A1BAverage
A2High range
Wo
rkin
g D
raft -
La
st M
od
ified
2/2
5/2
01
1 2
:12
:57
PM
▪ PNG’s approach to adaptation
▪ Vulnerability analysis
La
st M
od
ified
2/2
5/2
01
1 2
:12
:57
PM
Prin
ted
2/2
4/2
01
1 1
1:2
5:3
9 A
M
13
▪ Cost efficient solutions
▪ Current implementation
Wo
rkin
g D
raft -
La
st M
od
ified
2/2
5/2
01
1 2
:12
:57
PM
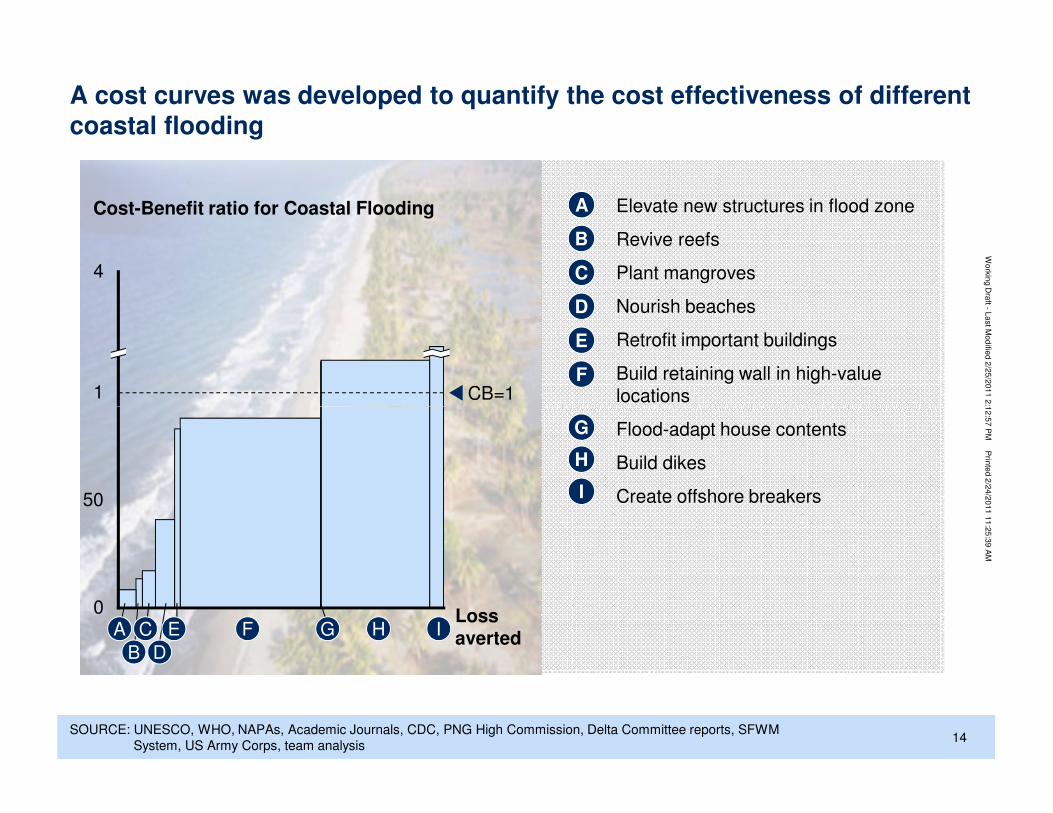
A cost curves was developed to quantify the cost effectiveness of different coastal flooding
Cost-Benefit ratio for Coastal Flooding
4
1 CB=1
A Elevate new structures in flood zone
Revive reefs
Plant mangroves
Nourish beaches
Retrofit important buildings
Build retaining wall in high-value locations
B
C
D
E
F
La
st M
od
ified
2/2
5/2
01
1 2
:12
:57
PM
Prin
ted
2/2
4/2
01
1 1
1:2
5:3
9 A
M
14
50
0
Flood-adapt house contents
Build dikes
Create offshore breakers
G
H
I
A C E
B D
F H IG
SOURCE: UNESCO, WHO, NAPAs, Academic Journals, CDC, PNG High Commission, Delta Committee reports, SFWM
System, US Army Corps, team analysis
Loss averted
Wo
rkin
g D
raft -
La
st M
od
ified
2/2
5/2
01
1 2
:12
:57
PM
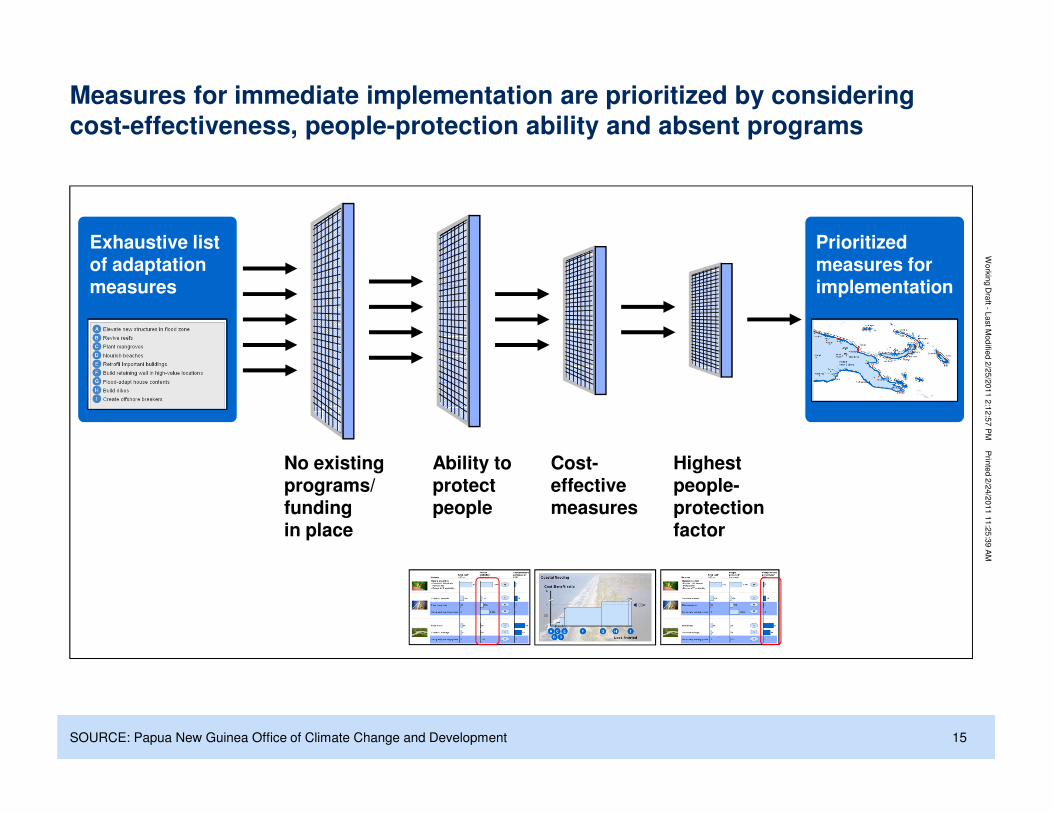
Measures for immediate implementation are prioritized by considering cost-effectiveness, people-protection ability and absent programs
Exhaustive list of adaptation measures
Prioritized measures for implementation
La
st M
od
ified
2/2
5/2
01
1 2
:12
:57
PM
Prin
ted
2/2
4/2
01
1 1
1:2
5:3
9 A
M
15
Cost-effective measures
Ability to protect people
Highest people-protection factor
No existing programs/ funding in place
SOURCE: Papua New Guinea Office of Climate Change and Development
Wo
rkin
g D
raft -
La
st M
od
ified
2/2
5/2
01
1 2
:12
:57
PM
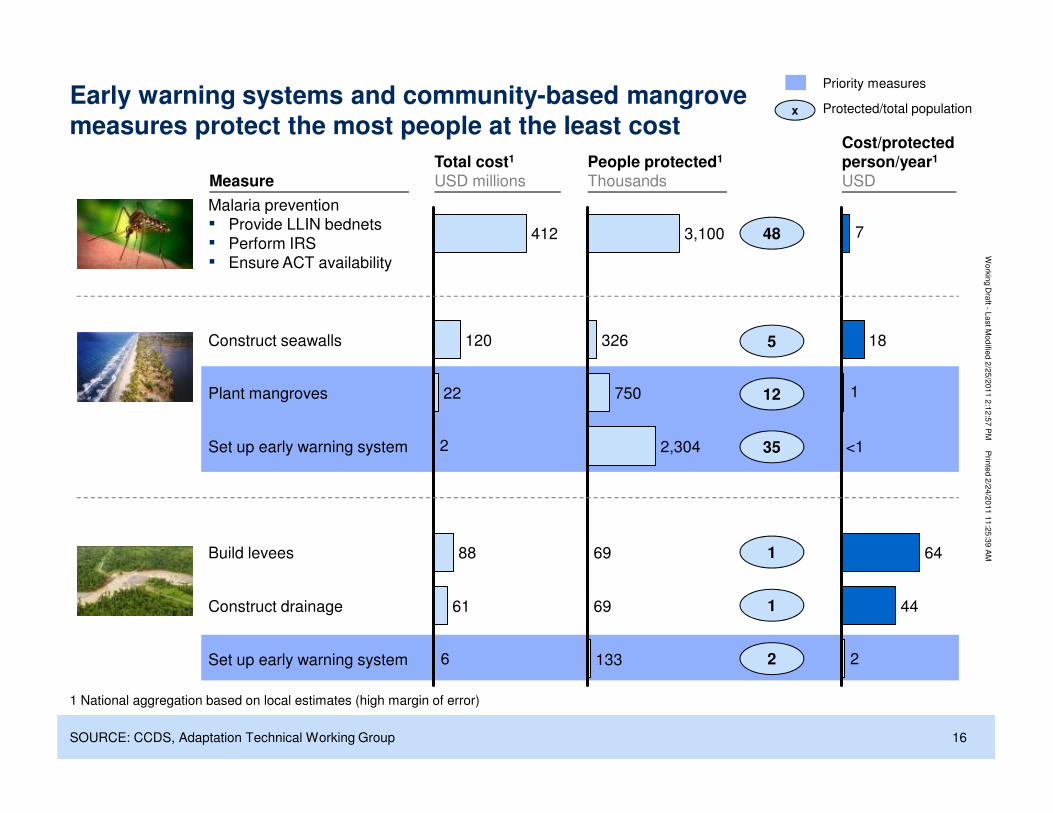
Early warning systems and community-based mangrove measures protect the most people at the least cost
Plant mangroves 22
Construct seawalls 120
Malaria prevention
▪ Provide LLIN bednets
▪ Perform IRS
▪ Ensure ACT availability
412 3,100
750
326
1
7
18
48
5
12
x Protected/total population
Priority measures
Total cost1
USD millions
People protected1
Thousands
Cost/protected person/year1
USDMeasure
La
st M
od
ified
2/2
5/2
01
1 2
:12
:57
PM
Prin
ted
2/2
4/2
01
1 1
1:2
5:3
9 A
M
16
1 National aggregation based on local estimates (high margin of error)
6
2
Set up early warning system
Construct drainage 61
Build levees 88
Set up early warning system
133
69
69
2,304
2
44
64
<135
1
1
2
SOURCE: CCDS, Adaptation Technical Working Group
Wo
rkin
g D
raft -
La
st M
od
ified
2/2
5/2
01
1 2
:12
:57
PM
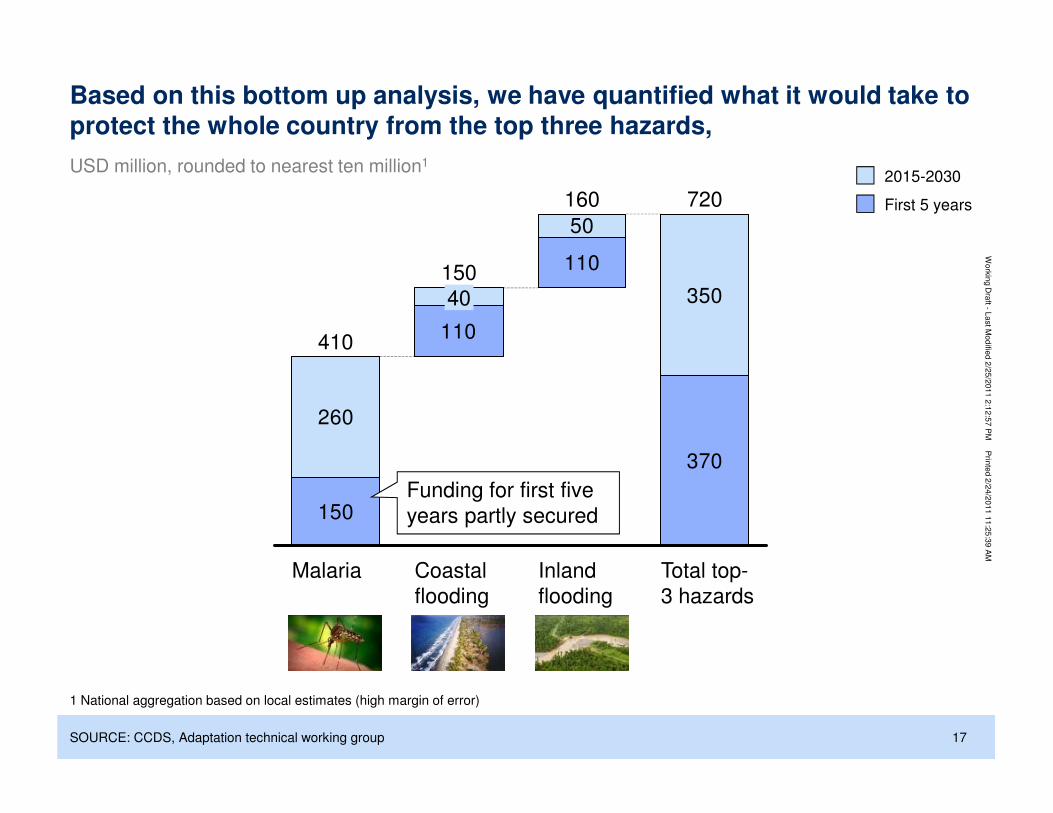
Based on this bottom up analysis, we have quantified what it would take to protect the whole country from the top three hazards,
110
110
260
50
350
720160
150
40
410
First 5 years
2015-2030USD million, rounded to nearest ten million1
La
st M
od
ified
2/2
5/2
01
1 2
:12
:57
PM
Prin
ted
2/2
4/2
01
1 1
1:2
5:3
9 A
M
17
150
370
260
Total top-
3 hazards
Inland
flooding
Coastal
flooding
Malaria
SOURCE: CCDS, Adaptation technical working group
1 National aggregation based on local estimates (high margin of error)
Funding for first five
years partly secured

Wo
rkin
g D
raft -
La
st M
od
ified
2/2
5/2
01
1 2
:12
:57
PM
▪ PNG’s approach to adaptation
▪ Vulnerability analysis
La
st M
od
ified
2/2
5/2
01
1 2
:12
:57
PM
Prin
ted
2/2
4/2
01
1 1
1:2
5:3
9 A
M
18
▪ Cost efficient solutions
▪ Current implementation
Wo
rkin
g D
raft -
La
st M
od
ified
2/2
5/2
01
1 2
:12
:57
PM
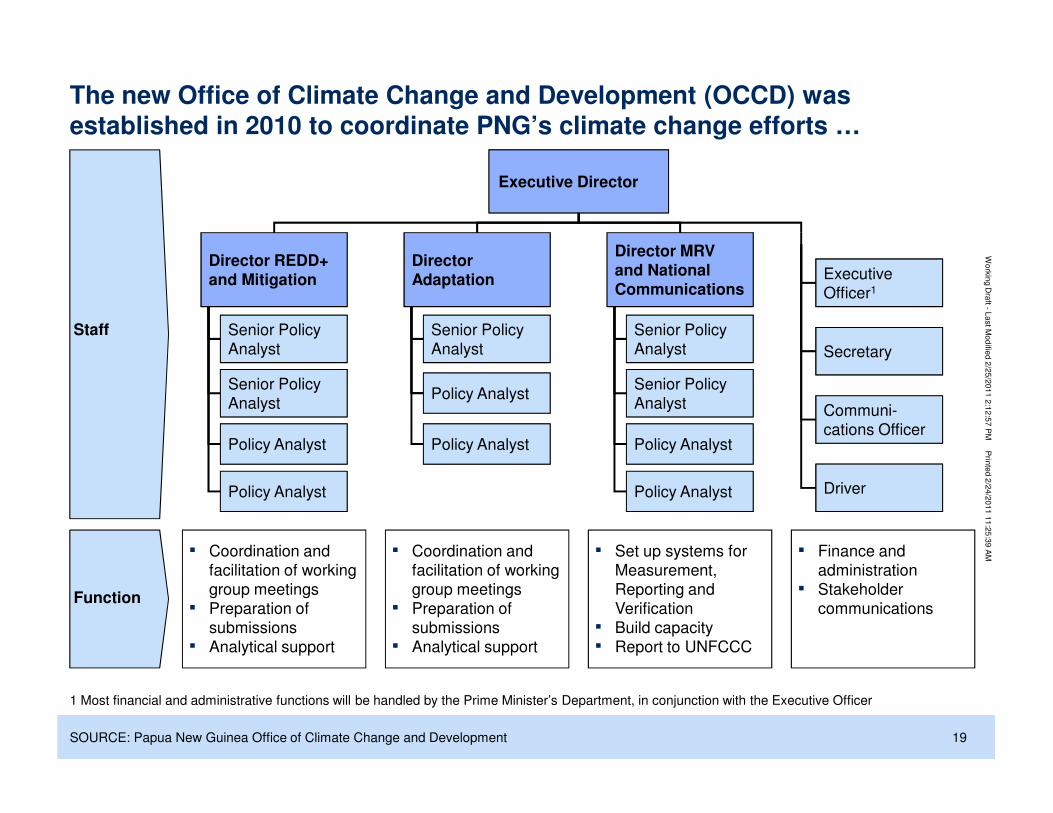
The new Office of Climate Change and Development (OCCD) was established in 2010 to coordinate PNG’s climate change efforts …
Staff
Executive Director
Director REDD+ and Mitigation
Senior Policy
Analyst
Senior Policy
Analyst
Director Adaptation
Senior Policy
Analyst
Policy Analyst
Director MRV and National Communications
Senior Policy
Analyst
Senior Policy
Analyst
Executive
Officer1
Secretary
Communi-
La
st M
od
ified
2/2
5/2
01
1 2
:12
:57
PM
Prin
ted
2/2
4/2
01
1 1
1:2
5:3
9 A
M
19
1 Most financial and administrative functions will be handled by the Prime Minister’s Department, in conjunction with the Executive Officer
Function
Analyst
Policy Analyst
Policy Analyst
Policy Analyst
Analyst
Policy Analyst
Policy Analyst
Communi-
cations Officer
Driver
▪ Coordination and
facilitation of working
group meetings
▪ Preparation of
submissions
▪ Analytical support
▪ Coordination and
facilitation of working
group meetings
▪ Preparation of
submissions
▪ Analytical support
▪ Set up systems for
Measurement,
Reporting and
Verification
▪ Build capacity
▪ Report to UNFCCC
▪ Finance and
administration
▪ Stakeholder
communications
SOURCE: Papua New Guinea Office of Climate Change and Development
Wo
rkin
g D
raft -
La
st M
od
ified
2/2
5/2
01
1 2
:12
:57
PM
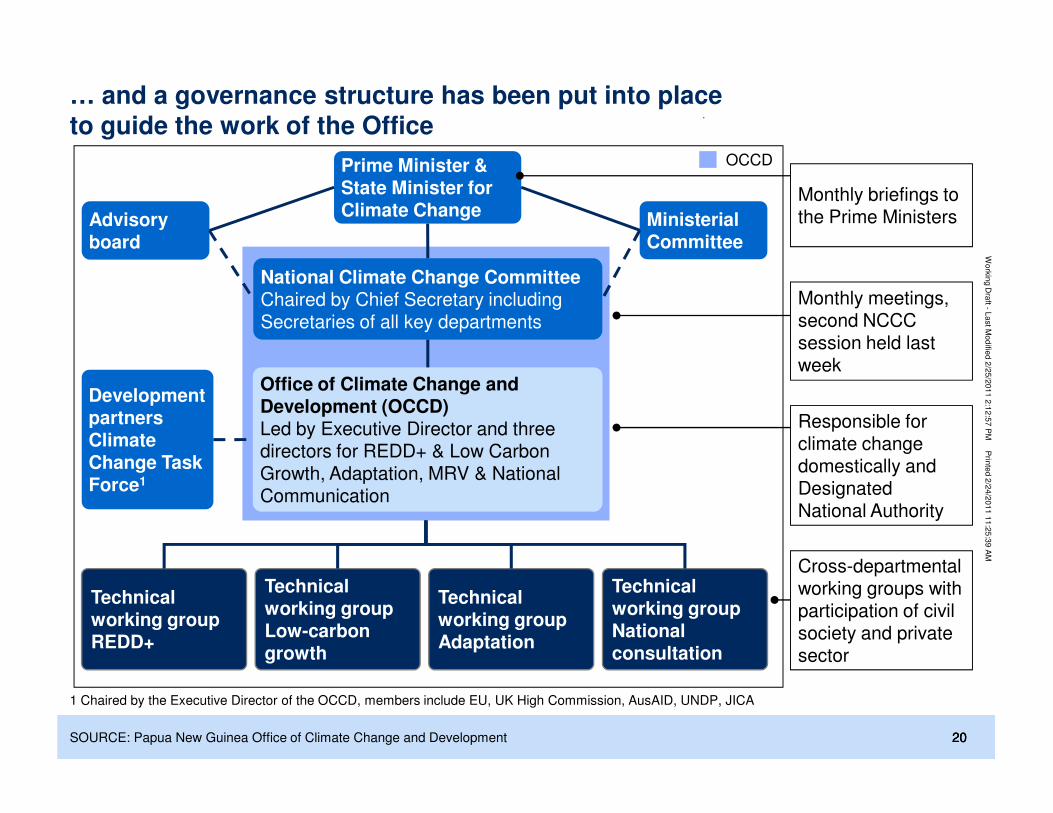
… and a governance structure has been put into place to guide the work of the Office
Advisory board
Ministerial Committee
Prime Minister & State Minister for Climate Change
National Climate Change CommitteeChaired by Chief Secretary including Secretaries of all key departments
Office of Climate Change and Development (OCCD)
OCCD
Development partners
Monthly meetings, second NCCC session held last week
Monthly briefings to the Prime Ministers
La
st M
od
ified
2/2
5/2
01
1 2
:12
:57
PM
Prin
ted
2/2
4/2
01
1 1
1:2
5:3
9 A
M
202020
Development (OCCD)Led by Executive Director and three directors for REDD+ & Low Carbon Growth, Adaptation, MRV & National Communication
Technical working group REDD+
Technical working group Adaptation
Technical working group National consultation
Technical working group Low-carbon growth
partners Climate Change Task Force1
1 Chaired by the Executive Director of the OCCD, members include EU, UK High Commission, AusAID, UNDP, JICA
Responsible for climate change domestically and Designated National Authority
Cross-departmental working groups with participation of civil society and private sector
SOURCE: Papua New Guinea Office of Climate Change and Development
Wo
rkin
g D
raft -
La
st M
od
ified
2/2
5/2
01
1 2
:12
:57
PM
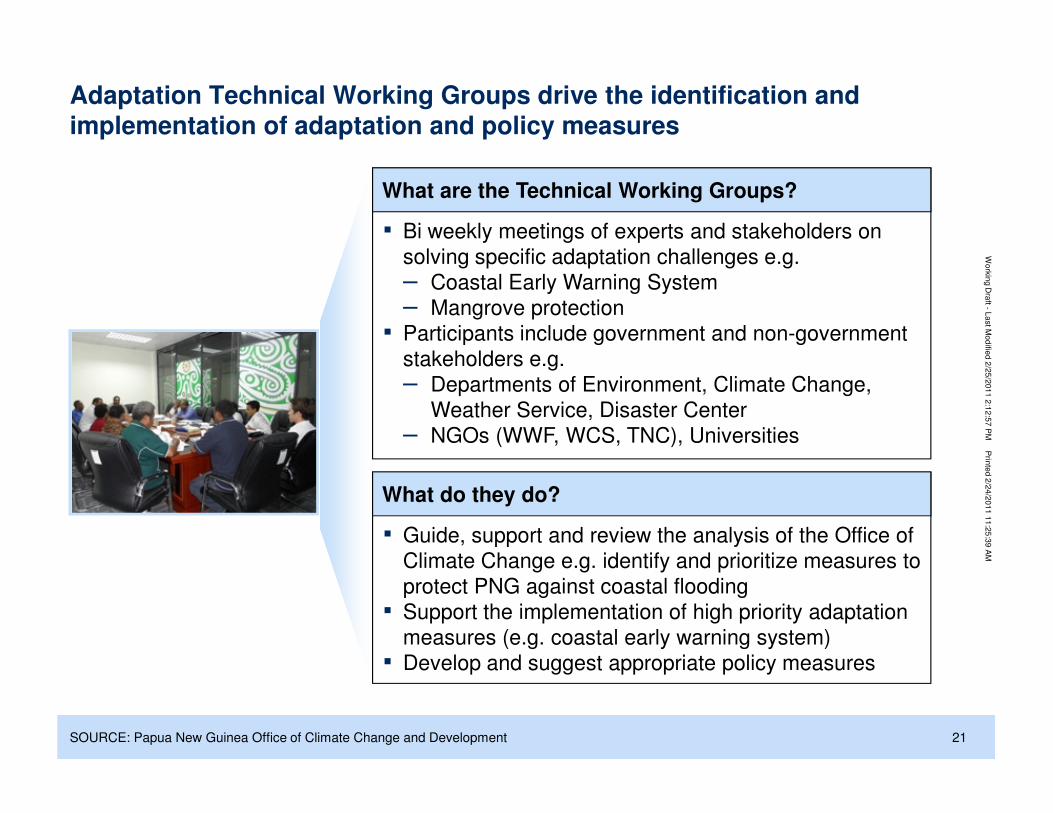
Adaptation Technical Working Groups drive the identification and implementation of adaptation and policy measures
▪ Bi weekly meetings of experts and stakeholders on
solving specific adaptation challenges e.g.
– Coastal Early Warning System
– Mangrove protection
▪ Participants include government and non-government
stakeholders e.g.
– Departments of Environment, Climate Change,
Weather Service, Disaster Center
What are the Technical Working Groups?
La
st M
od
ified
2/2
5/2
01
1 2
:12
:57
PM
Prin
ted
2/2
4/2
01
1 1
1:2
5:3
9 A
M
21
Weather Service, Disaster Center
– NGOs (WWF, WCS, TNC), Universities
▪ Guide, support and review the analysis of the Office of
Climate Change e.g. identify and prioritize measures to
protect PNG against coastal flooding
▪ Support the implementation of high priority adaptation
measures (e.g. coastal early warning system)
▪ Develop and suggest appropriate policy measures
What do they do?
SOURCE: Papua New Guinea Office of Climate Change and Development
Wo
rkin
g D
raft -
La
st M
od
ified
2/2
5/2
01
1 2
:12
:57
PM
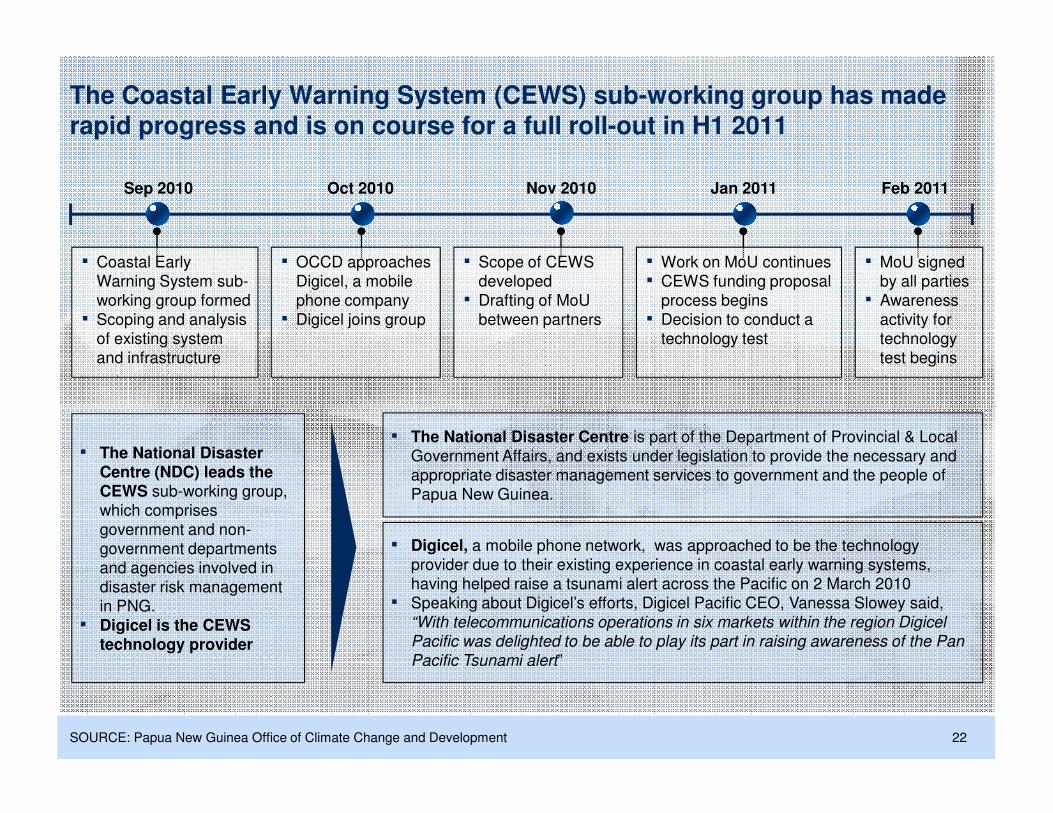
The Coastal Early Warning System (CEWS) sub-working group has made rapid progress and is on course for a full roll-out in H1 2011
Sep 2010 Oct 2010 Jan 2011 Feb 2011
▪ Scope of CEWS
developed
▪ Drafting of MoU
between partners
▪ Work on MoU continues
▪ CEWS funding proposal
process begins
▪ Decision to conduct a
technology test
▪ OCCD approaches
Digicel, a mobile
phone company
▪ Digicel joins group
▪ MoU signed
by all parties
▪ Awareness
activity for
technology
test begins
Nov 2010
▪ Coastal Early
Warning System sub-
working group formed
▪ Scoping and analysis
of existing system
and infrastructure
La
st M
od
ified
2/2
5/2
01
1 2
:12
:57
PM
Prin
ted
2/2
4/2
01
1 1
1:2
5:3
9 A
M
22
▪ The National Disaster Centre (NDC) leads the CEWS sub-working group,
which comprises
government and non-
government departments
and agencies involved in
disaster risk management
in PNG.
▪ Digicel is the CEWS technology provider
▪ Digicel, a mobile phone network, was approached to be the technology
provider due to their existing experience in coastal early warning systems,
having helped raise a tsunami alert across the Pacific on 2 March 2010
▪ Speaking about Digicel’s efforts, Digicel Pacific CEO, Vanessa Slowey said,
“With telecommunications operations in six markets within the region Digicel
Pacific was delighted to be able to play its part in raising awareness of the Pan
Pacific Tsunami alert”
▪ The National Disaster Centre is part of the Department of Provincial & Local
Government Affairs, and exists under legislation to provide the necessary and
appropriate disaster management services to government and the people of
Papua New Guinea.
SOURCE: Papua New Guinea Office of Climate Change and Development
Wo
rkin
g D
raft -
La
st M
od
ified
2/2
5/2
01
1 2
:12
:57
PM
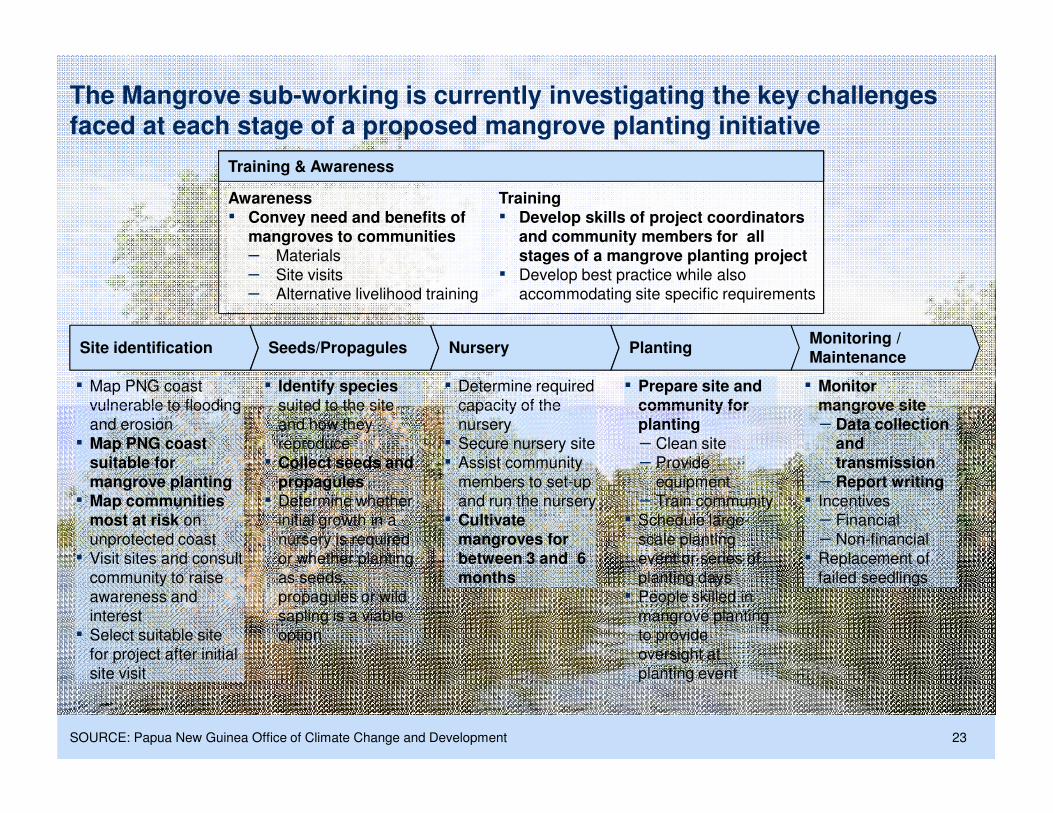
The Mangrove sub-working is currently investigating the key challenges faced at each stage of a proposed mangrove planting initiative
▪ Map PNG coast
vulnerable to flooding
▪ Identify speciessuited to the site
▪ Determine required
capacity of the
▪ Prepare site and community for
▪ Monitor mangrove site
Site identification Seeds/Propagules Nursery PlantingMonitoring / Maintenance
Training & Awareness
Awareness▪ Convey need and benefits of
mangroves to communities– Materials
– Site visits
– Alternative livelihood training
Training▪ Develop skills of project coordinators
and community members for all stages of a mangrove planting project
▪ Develop best practice while also
accommodating site specific requirements
La
st M
od
ified
2/2
5/2
01
1 2
:12
:57
PM
Prin
ted
2/2
4/2
01
1 1
1:2
5:3
9 A
M
23
vulnerable to flooding
and erosion
▪ Map PNG coast suitable for mangrove planting▪ Map communities
most at risk on
unprotected coast
▪ Visit sites and consult
community to raise
awareness and
interest
▪ Select suitable site
for project after initial
site visit
suited to the site
and how they
reproduce
▪ Collect seeds and propagules▪ Determine whether
initial growth in a
nursery is required
or whether planting
as seeds,
propagules or wild
sapling is a viable
option
capacity of the
nursery
▪ Secure nursery site
▪ Assist community
members to set-up
and run the nursery
▪ Cultivate mangroves for between 3 and 6 months
community for planting– Clean site
– Provide
equipment
– Train community
▪ Schedule large-
scale planting
event or series of
planting days
▪ People skilled in
mangrove planting
to provide
oversight at
planting event
mangrove site– Data collection
and transmission
– Report writing▪ Incentives
– Financial
– Non-financial
▪ Replacement of
failed seedlings
SOURCE: Papua New Guinea Office of Climate Change and Development