Embed Size (px)
Citation preview
JOURNAL Of
SCIENCE,
TECHNOLOGY And
ENGINEERING
ISSN 1993-7687
Papua New Guinea
Volume 1 Number 01, December 2007
Papua New Guinea Society of Scholars and Professionals
E n g i n e e r i n g , L i f e S c i e n c e s , N a t u r a l S c i e n c e s , I n f o r m a t i o n T e c h n o l o g y
Journal of Science, Technology and Engineering
Edited by the Papua New Guinea Society of Scholars and Professionals
Published by VortexPNG LTD
The JOURNAL is open to all Scholars and Profession from Papua New Guinea (PNG) and the South Pacific (SP) and is devoted to
the publication of original research, commentaries and letters concerning the sciences (life sciences, natural sciences and social
science), technology and engineering in PNG-SP
Editors
R. Itaki (University of Papua New Guinea) A. Raturi (Papua New Guinea University of Technology) A. Moutu (University of Cambridge) V. Badira (Papua New Guinea University of Technology) M. Rawali (Papua New Guinea University of Technology) I. Hanspeter (Papua New Guinea University of Technology)
Notice to contributors: Manuscripts for the journal should be sent directly to the following
Dr. Rodney Itaki
Department of International Medical Zoology
Faculty of Medicine
Kagawa University
Miki , Kita
Kagawa, 761-0793, JAPAN.
Email: [email protected] Tel: +81-87-891-2122 Fax: +81-87-891-2122
Dr. Atul Raturi
Department of Applied Physics University of Technology, Lae, Morobe Province 411 Papua New Guinea Email: [email protected] Tel: +675 4734901 Dr. Andrew Moutu University of Cambridge Department of Social Anthropology Free School Lane Cambridge CB2 3RF UNITED KINGDOM Email: [email protected] Tel: +1223 334 619 (Office) Fax: +1223 335 993
Papua New Guinea: PNG Society of Scholars and Professionals Vortex PNG Ltd P.O Box 196 Port Moresby National Capital District Full version of the journal is available on VortexPNG website (http://www.vortexpng.com)
Abbreviated key title: P.N.G.j.sci technol. eng
Copyright © The Papua New Guinea Society of Scholars and Professionals/VortexPNG LTD
To publish work done by members of the PNG-SP Academy of Science and Technology. To promote scholarly communication between members of PNG-SP Academy of Science and Technology on science and technology matters.
To provide expert commentaries on matters of science and technology concerning PNG and SP.
Dr. Atul Raturi
Department of Applied Physics University of Technology, Lae, Morobe Province 411 Papua New Guinea Email: [email protected] Tel: +675 4734901
Mr. Varigini Badira
Department of Mechanical and Environmental Informatics Graduate School of Information Science and Engineering Tokyo Institute of Technology 2-12-1 O-okayama, Meguro-ku, Tokyo 152-8552, JAPAN Email: [email protected] Tel: +81-3-5734-3486 Fax: +81-3-5734-2650
Mr. Ian Hanspeter
Department of Computing, Curtin University of Technology GPO Box U1987 Perth WA 6845 Australia Email: [email protected]
P.N.G.j.sci technol. Eng. Vol. 1, No.1, Page 3, 2007
Future trends in carbon dioxide (CO2), nitrogen oxides (NOx), sulfur
dioxide (SO2), and Energy Consumption in Papua New Guinea:
Application of Asia-Pacific Integrated Model (AIM)/Trend Model.
Varigini Badira. Applied Physics, University of Technology, Private Mail Bag, Morobe Province 411, Papua New Guinea.,
Abstract
This paper presents the future trends in emission of carbon dioxide (CO2), nitrogen oxides (NOx),
sulfur dioxide (SO2), and energy consumption in Papua New Guinea by employing AIM/Trend
model. The AIM/Trend is a energy related Green House Gas (GHG) emission predictor driven by
past time series data of annual population, GDP, yearly NOx emission, yearly SO2 emission, and
annual energy consumptions. For both NO2 and SO2, past time series data from 1990 to 2003
shows emission level increase of 55% and 38% respectively. 1995 to 2005 CO2 emission shows a
jump by a massive 72%. From 2003 to 2030 both NOx and SO2 are projected to increase by 33%.
Although the emissions from 1990 to 2003 are below the global average, it is a cause of concern
due to the nature of increase within a space of 15 years. The model also shows that Oil energy
consumption by 2030 is predicted to increase four folds relative to the 1985 levels. The total
primary energy supply is conservatively project to grow from 0.8Mtoe to 1.8Mtoe whilst demand
from 1.4Mtoe in 2002 to 3.7 Mtoe. The increase in the supply reflects a corresponding increase in
GHG emission by 3 times relative to the 2000 level. At the current trends, the AIM/trend model
suggests air pollution in PNG 40 years time is controllable. However, in terms of sustainability
development of resources, energy intensity indicates needed concerted effort. For greater
developmental sustainability, clean energy technology in industrial energy usage is recommended.
Key words: carbon dioxide (CO2), nitrogen oxides (NOx), sulfur dioxide (SO2), energy consumption, future trends.
INTRODUTION
In recent years, a key approach in Papua New Guinea (PNG) Government’s Medium-Term Development Strategy (MTDS) has been focused on converting natural resource rents into sustainable development benefits. Benefits from the resources such as oil, gas, forest, fisheries and agricultural crops, have been quite significant subsequently reflecting on the economic growth of 3.4% in 2006 to an estimated 4% 2007 (Oxford, 2006). However, widely recognized with positive developments are associated environmental impacts. In many developing countries, the risk due to environmental threats remains uncertain and of particular interest is the description of atmospheric pollutions in the future emulated by energy demands and population growth. PNG energy consumption from 1.4Mtoe in 2002 grew by 4.7% in 2005 due to increased consumptions. 5.3% of the total energy consumed from 2002 to 2005 was by the oil and mining industries (APEC, 2006). When coupling the high demand from the mining and oil industry to the demands both from an increased projected population of 9 million by 2030
(UNEP, 2004), and the subsequent project urbanisation growth increase to 20% in 2030 from 13% in 2002 (APEC, 2006), there will be undoubtedly increased atmospheric pollutants in PNG. In addition, the pressures on agricultural and industrial expansions for the creation of new jobs and improved living will also certainly serve as a catalyst to increase the rate of harmful emissions. Common air pollutants that must be considered as a measure of increasing atmospheric environmental loading due to development are nitrogen oxides (NOx) and sulfur dioxides (SO2). NOx can trigger serious respiratory problems, contribute to acid rain and global warming. The primary sources of NOx are motor vehicles, electric utilities, and other industrial, commercial, and residential sources that burn fuels. SO2 can also trigger respiratory problems. It is formed when fuel-containing sulfur, such as oil, is burned, when gasoline is extracted from oil, or metals are extracted from ore. Petroleum refineries, cement manufacturing, and metal processing facilities, as well as the transport
P.N.G.j.sci technol. Eng. Vol. 1, No.1, Page 4, 2007
sector, and some non-road diesel equipment burn high sulfur fuel and release SO2 emissions to the air in large quantities. Major natural source of SO2 and NOx also come from forest fires. For this work, the Asia Pacific Integrated Model/Trend (AIM/Trend) developed by the Japan National Institute for Environmental Studies (NIES) is used to assess the future environmental loads based on PNGs past socio-economic trends(Matuoka, 1995., Fujino, 2001). The model is an econometric model where extrapolation by regression method between economy, energy and environment is used to establish relationships for future projections. Simulations of energy supply and demand, carbon dioxide emission and air pollutants are executed within the model. Specifically, PNG emission shows air pollutants, nitrogen oxides (NOx) and sulfur dioxide (SO2), from 1990 to 2003 increased by 55% and 38% respectively. CO2 emission from 1995 to 2005 showed a jump by a substantial 72% (Geo-Portal, 2005). This paper presets the analysis of Papua New Guinea (PNG) emission using AIM/Trend model by making projections for both emission levels and energy demands that ultimately be useful for policy makers and researchers in health, industrial and energy sectors. METHODOLOGY
The methodology for projecting future trends in emission is based on the AIM/Trend, which is inline with the recommended prediction scenario of the Intergovernmental Panel on Climate Change (IPCC, 1996). For the execution of this model, time series of GDP from 1957 to 2003, NOx, SO2 from 1985 to 2003 were obtained from World research institute and
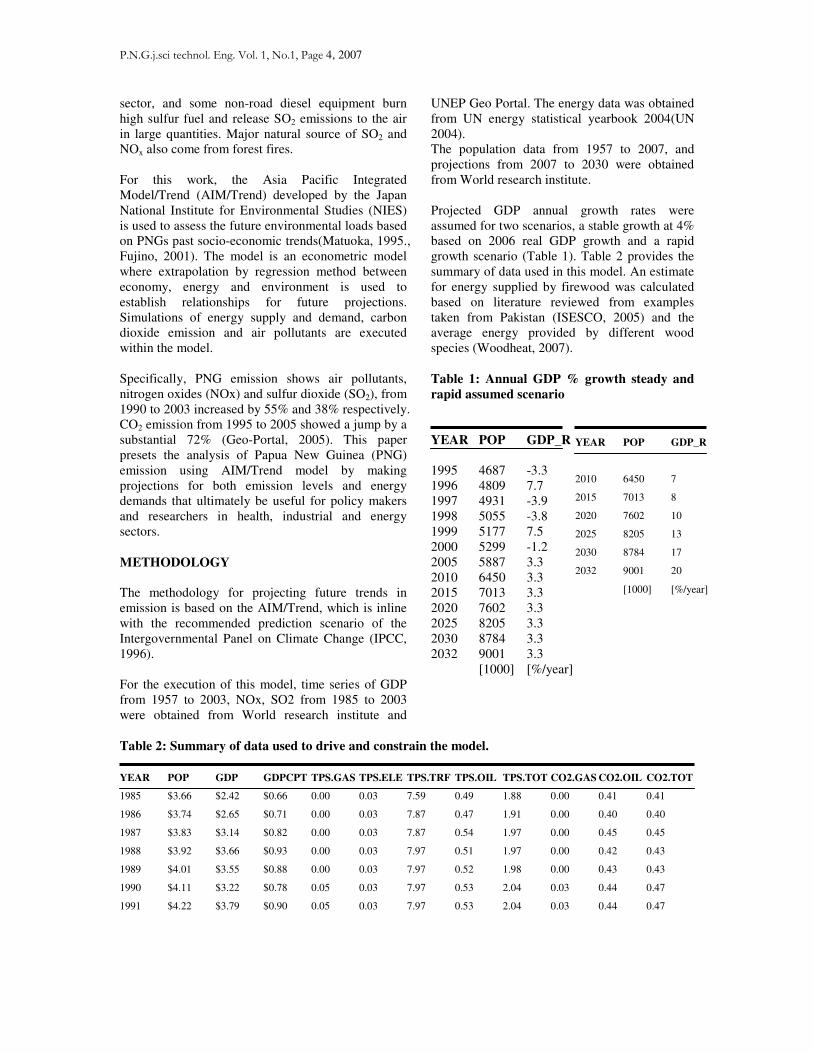
UNEP Geo Portal. The energy data was obtained from UN energy statistical yearbook 2004(UN 2004). The population data from 1957 to 2007, and projections from 2007 to 2030 were obtained from World research institute. Projected GDP annual growth rates were assumed for two scenarios, a stable growth at 4% based on 2006 real GDP growth and a rapid growth scenario (Table 1). Table 2 provides the summary of data used in this model. An estimate for energy supplied by firewood was calculated based on literature reviewed from examples taken from Pakistan (ISESCO, 2005) and the average energy provided by different wood species (Woodheat, 2007). Table 1: Annual GDP % growth steady and
rapid assumed scenario
YEAR POP GDP_R
1995 4687 -3.3 1996 4809 7.7 1997 4931 -3.9 1998 5055 -3.8 1999 5177 7.5 2000 5299 -1.2 2005 5887 3.3 2010 6450 3.3 2015 7013 3.3 2020 7602 3.3 2025 8205 3.3 2030 8784 3.3 2032 9001 3.3 [1000] [%/year]
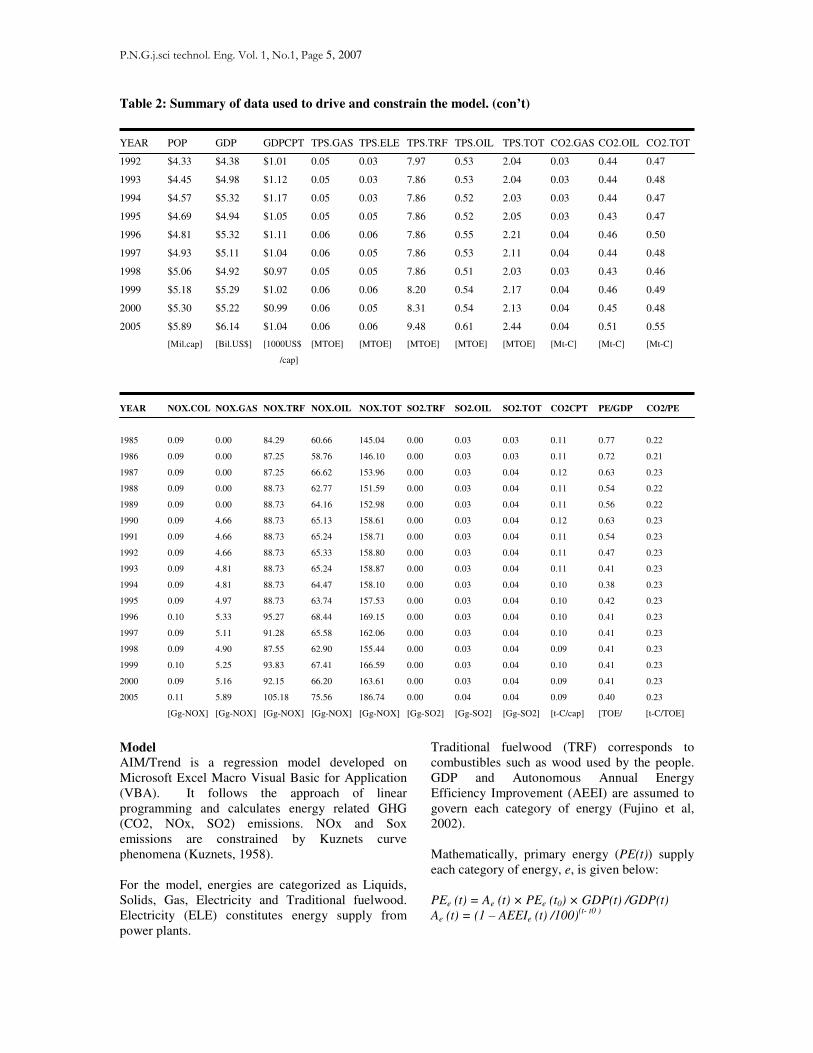
Table 2: Summary of data used to drive and constrain the model.
YEAR POP GDP GDPCPT TPS.GAS TPS.ELE TPS.TRF TPS.OIL TPS.TOT CO2.GAS CO2.OIL CO2.TOT
1985 $3.66 $2.42 $0.66 0.00 0.03 7.59 0.49 1.88 0.00 0.41 0.41
1986 $3.74 $2.65 $0.71 0.00 0.03 7.87 0.47 1.91 0.00 0.40 0.40
1987 $3.83 $3.14 $0.82 0.00 0.03 7.87 0.54 1.97 0.00 0.45 0.45
1988 $3.92 $3.66 $0.93 0.00 0.03 7.97 0.51 1.97 0.00 0.42 0.43
1989 $4.01 $3.55 $0.88 0.00 0.03 7.97 0.52 1.98 0.00 0.43 0.43
1990 $4.11 $3.22 $0.78 0.05 0.03 7.97 0.53 2.04 0.03 0.44 0.47
1991 $4.22 $3.79 $0.90 0.05 0.03 7.97 0.53 2.04 0.03 0.44 0.47
YEAR POP GDP_R
2010 6450 7
2015 7013 8
2020 7602 10
2025 8205 13
2030 8784 17
2032 9001 20
[1000] [%/year]
P.N.G.j.sci technol. Eng. Vol. 1, No.1, Page 5, 2007
Table 2: Summary of data used to drive and constrain the model. (con’t)
YEAR POP GDP GDPCPT TPS.GAS TPS.ELE TPS.TRF TPS.OIL TPS.TOT CO2.GAS CO2.OIL CO2.TOT
1992 $4.33 $4.38 $1.01 0.05 0.03 7.97 0.53 2.04 0.03 0.44 0.47
1993 $4.45 $4.98 $1.12 0.05 0.03 7.86 0.53 2.04 0.03 0.44 0.48
1994 $4.57 $5.32 $1.17 0.05 0.03 7.86 0.52 2.03 0.03 0.44 0.47
1995 $4.69 $4.94 $1.05 0.05 0.05 7.86 0.52 2.05 0.03 0.43 0.47
1996 $4.81 $5.32 $1.11 0.06 0.06 7.86 0.55 2.21 0.04 0.46 0.50
1997 $4.93 $5.11 $1.04 0.06 0.05 7.86 0.53 2.11 0.04 0.44 0.48
1998 $5.06 $4.92 $0.97 0.05 0.05 7.86 0.51 2.03 0.03 0.43 0.46
1999 $5.18 $5.29 $1.02 0.06 0.06 8.20 0.54 2.17 0.04 0.46 0.49
2000 $5.30 $5.22 $0.99 0.06 0.05 8.31 0.54 2.13 0.04 0.45 0.48
2005 $5.89 $6.14 $1.04 0.06 0.06 9.48 0.61 2.44 0.04 0.51 0.55
[Mil.cap] [Bil.US$] [1000US$ [MTOE] [MTOE] [MTOE] [MTOE] [MTOE] [Mt-C] [Mt-C] [Mt-C]
/cap]
YEAR NOX.COL NOX.GAS NOX.TRF NOX.OIL NOX.TOT SO2.TRF SO2.OIL SO2.TOT CO2CPT PE/GDP CO2/PE
1985 0.09 0.00 84.29 60.66 145.04 0.00 0.03 0.03 0.11 0.77 0.22
1986 0.09 0.00 87.25 58.76 146.10 0.00 0.03 0.03 0.11 0.72 0.21
1987 0.09 0.00 87.25 66.62 153.96 0.00 0.03 0.04 0.12 0.63 0.23
1988 0.09 0.00 88.73 62.77 151.59 0.00 0.03 0.04 0.11 0.54 0.22
1989 0.09 0.00 88.73 64.16 152.98 0.00 0.03 0.04 0.11 0.56 0.22
1990 0.09 4.66 88.73 65.13 158.61 0.00 0.03 0.04 0.12 0.63 0.23
1991 0.09 4.66 88.73 65.24 158.71 0.00 0.03 0.04 0.11 0.54 0.23
1992 0.09 4.66 88.73 65.33 158.80 0.00 0.03 0.04 0.11 0.47 0.23
1993 0.09 4.81 88.73 65.24 158.87 0.00 0.03 0.04 0.11 0.41 0.23
1994 0.09 4.81 88.73 64.47 158.10 0.00 0.03 0.04 0.10 0.38 0.23
1995 0.09 4.97 88.73 63.74 157.53 0.00 0.03 0.04 0.10 0.42 0.23
1996 0.10 5.33 95.27 68.44 169.15 0.00 0.03 0.04 0.10 0.41 0.23
1997 0.09 5.11 91.28 65.58 162.06 0.00 0.03 0.04 0.10 0.41 0.23
1998 0.09 4.90 87.55 62.90 155.44 0.00 0.03 0.04 0.09 0.41 0.23
1999 0.10 5.25 93.83 67.41 166.59 0.00 0.03 0.04 0.10 0.41 0.23
2000 0.09 5.16 92.15 66.20 163.61 0.00 0.03 0.04 0.09 0.41 0.23
2005 0.11 5.89 105.18 75.56 186.74 0.00 0.04 0.04 0.09 0.40 0.23
[Gg-NOX] [Gg-NOX] [Gg-NOX] [Gg-NOX] [Gg-NOX] [Gg-SO2] [Gg-SO2] [Gg-SO2] [t-C/cap] [TOE/ [t-C/TOE]
Model
AIM/Trend is a regression model developed on Microsoft Excel Macro Visual Basic for Application (VBA). It follows the approach of linear programming and calculates energy related GHG (CO2, NOx, SO2) emissions. NOx and Sox emissions are constrained by Kuznets curve phenomena (Kuznets, 1958). For the model, energies are categorized as Liquids, Solids, Gas, Electricity and Traditional fuelwood. Electricity (ELE) constitutes energy supply from power plants.
Traditional fuelwood (TRF) corresponds to combustibles such as wood used by the people. GDP and Autonomous Annual Energy Efficiency Improvement (AEEI) are assumed to govern each category of energy (Fujino et al, 2002). Mathematically, primary energy (PE(t)) supply each category of energy, e, is given below: PEe (t) = Ae (t) × PEe (t0) × GDP(t) /GDP(t)
Ae (t) = (1 – AEEIe (t) /100)(t- t0 )
P.N.G.j.sci technol. Eng. Vol. 1, No.1, Page 6, 2007
PEe (t): primary energy supply for energy e , time period t GDP(t) : GDP, time period t
AEEIe (t): autonomous energy efficiency improvement for energy e , time period t
e : energy, e =(OIL, COL, GAS, ELC, TRF) t : simulation time period, t0: initial time period Emission factors of NOX and SO2 are calculated for Papua New Guinea by using the latest emission data. The change in emission factors in the future is governed by GDP per capita (Kuznets, 1958) Results and Discussion
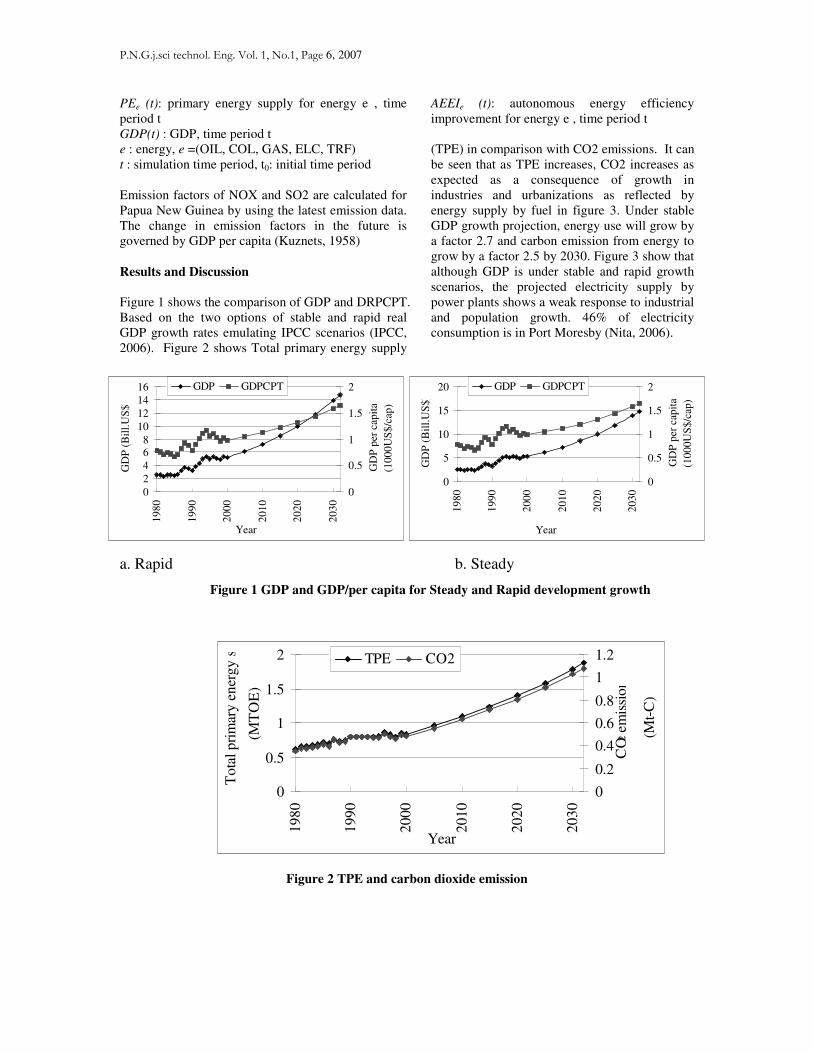
Figure 1 shows the comparison of GDP and DRPCPT. Based on the two options of stable and rapid real GDP growth rates emulating IPCC scenarios (IPCC, 2006). Figure 2 shows Total primary energy supply
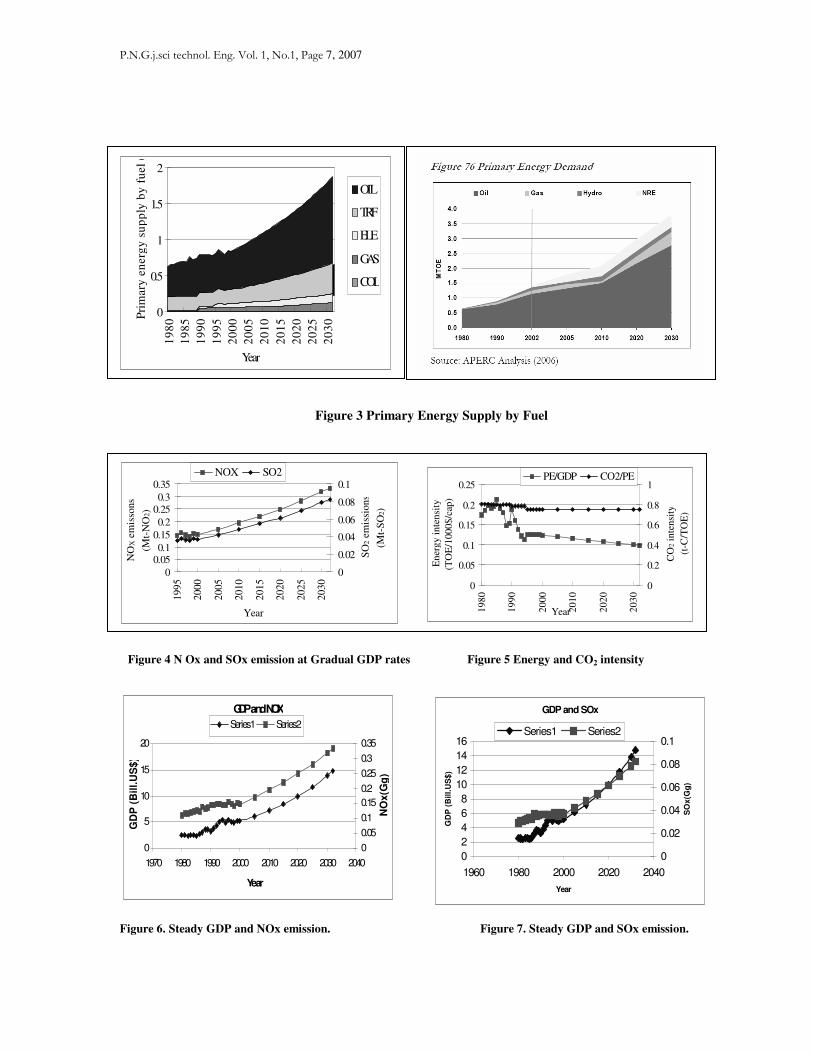
(TPE) in comparison with CO2 emissions. It can be seen that as TPE increases, CO2 increases as expected as a consequence of growth in industries and urbanizations as reflected by energy supply by fuel in figure 3. Under stable GDP growth projection, energy use will grow by a factor 2.7 and carbon emission from energy to grow by a factor 2.5 by 2030. Figure 3 show that although GDP is under stable and rapid growth scenarios, the projected electricity supply by power plants shows a weak response to industrial and population growth. 46% of electricity consumption is in Port Moresby (Nita, 2006).
a. Rapid b. Steady
Figure 1 GDP and GDP/per capita for Steady and Rapid development growth
Figure 2 TPE and carbon dioxide emission
0
2
468
10
12
1416
19
80
19
90
20
00
20
10
20
20
20
30
Year
GD
P (
Bil
l.U
S$
)
0
0.5
1
1.5
2
GD
P p
er c
apit
a
(10
00
US
$/c
ap)
GDP GDPCPT
0
5
10
15
20
19
80
19
90
20
00
20
10
20
20
20
30
Year
GD
P (
Bil
l.U
S$
)
0
0.5
1
1.5
2
GD
P p
er c
apit
a
(10
00
US
$/c
ap)
GDP GDPCPT
0
0.5
1
1.5
2
19
80
19
90
20
00
20
10
20
20
20
30
Year
To
tal
pri
mar
y e
ner
gy
su
pp
ly
(MT
OE
)
0
0.2
0.4
0.6
0.8
1
1.2
CO
2 em
issi
on
s
(M
t-C
)TPE CO2
P.N.G.j.sci technol. Eng. Vol. 1, No.1, Page 7, 2007
Figure 3 Primary Energy Supply by Fuel
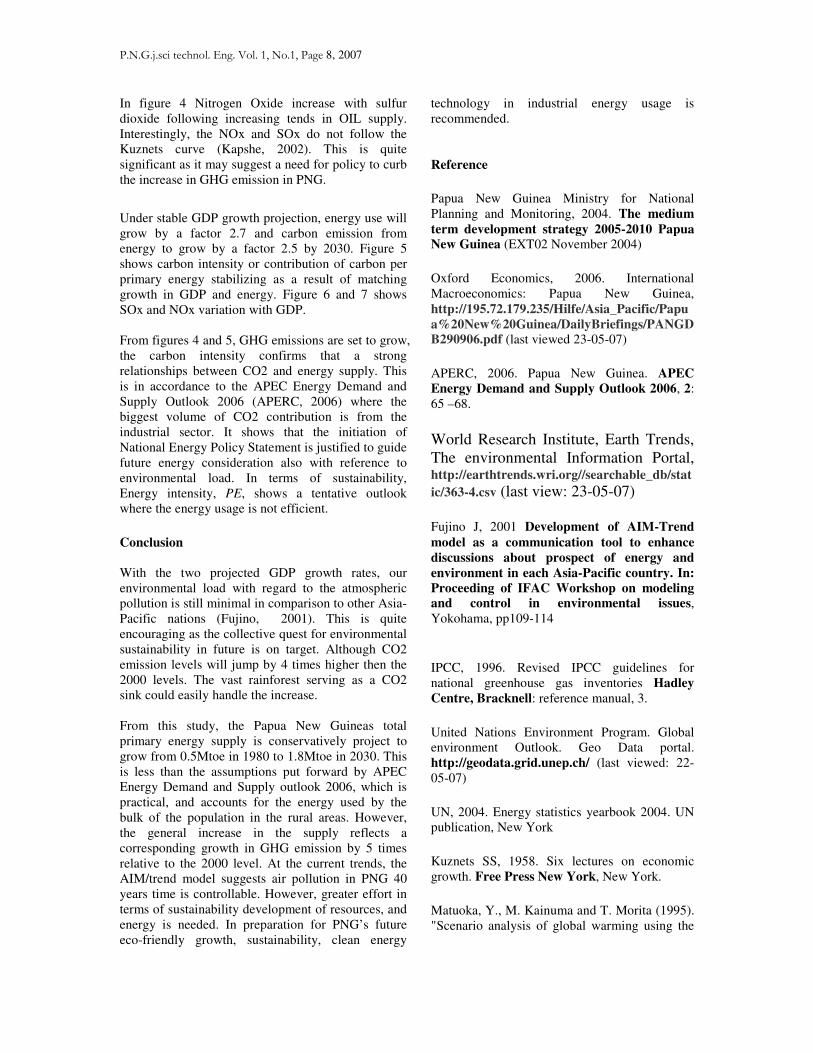
Figure 4 N Ox and SOx emission at Gradual GDP rates Figure 5 Energy and CO2 intensity
Figure 6. Steady GDP and NOx emission. Figure 7. Steady GDP and SOx emission.
GDP and NOX
0
5
10
15
20
1970 1980 1990 2000 2010 2020 2030 2040
Year
GD
P (
Bill.U
S$)
0
0.05
0.1
0.15
0.2
0.25
0.3
0.35
NO
x(G
g)
Series1 Series2
GDP and SOx
0
2
4
6
8
10
12
14
16
1960 1980 2000 2020 2040
Year
GD
P (
Bil
l.U
S$
)
0
0.02
0.04
0.06
0.08
0.1
SO
x(G
g)
Series1 Series2
0
0.050.1
0.15
0.2
0.250.3
0.35
1995
2000
2005
2010
2015
2020
2025
2030
Year
NO
X e
mis
sons
(Mt-
NO
2)
0
0.02
0.04
0.06
0.08
0.1
SO
2 e
mis
sions
(Mt-
SO
2)
NOX SO2
0
0.05
0.1
0.15
0.2
0.251
98
0
19
90
20
00
20
10
20
20
20
30
Year
En
erg
y i
nte
nsi
ty
(TO
E/1
00
0$
/cap
)
0
0.2
0.4
0.6
0.8
1
CO
2 i
nte
nsi
ty
(t-
C/T
OE
)
PE/GDP CO2/PE
0
0.5
1
1.5
21
98
0
19
85
19
90
19
95
20
00
20
05
20
10
20
15
20
20
20
25
20
30
Year
Pri
mar
y e
ner
gy
su
pp
ly b
y f
uel
(M
TO
E)
OIL
TRF
ELE
GAS
COL
P.N.G.j.sci technol. Eng. Vol. 1, No.1, Page 8, 2007
In figure 4 Nitrogen Oxide increase with sulfur dioxide following increasing tends in OIL supply. Interestingly, the NOx and SOx do not follow the Kuznets curve (Kapshe, 2002). This is quite significant as it may suggest a need for policy to curb the increase in GHG emission in PNG.
Under stable GDP growth projection, energy use will grow by a factor 2.7 and carbon emission from energy to grow by a factor 2.5 by 2030. Figure 5 shows carbon intensity or contribution of carbon per primary energy stabilizing as a result of matching growth in GDP and energy. Figure 6 and 7 shows SOx and NOx variation with GDP. From figures 4 and 5, GHG emissions are set to grow, the carbon intensity confirms that a strong relationships between CO2 and energy supply. This is in accordance to the APEC Energy Demand and Supply Outlook 2006 (APERC, 2006) where the biggest volume of CO2 contribution is from the industrial sector. It shows that the initiation of National Energy Policy Statement is justified to guide future energy consideration also with reference to environmental load. In terms of sustainability, Energy intensity, PE, shows a tentative outlook where the energy usage is not efficient. Conclusion
With the two projected GDP growth rates, our environmental load with regard to the atmospheric pollution is still minimal in comparison to other Asia-Pacific nations (Fujino, 2001). This is quite encouraging as the collective quest for environmental sustainability in future is on target. Although CO2 emission levels will jump by 4 times higher then the 2000 levels. The vast rainforest serving as a CO2 sink could easily handle the increase. From this study, the Papua New Guineas total primary energy supply is conservatively project to grow from 0.5Mtoe in 1980 to 1.8Mtoe in 2030. This is less than the assumptions put forward by APEC Energy Demand and Supply outlook 2006, which is practical, and accounts for the energy used by the bulk of the population in the rural areas. However, the general increase in the supply reflects a corresponding growth in GHG emission by 5 times relative to the 2000 level. At the current trends, the AIM/trend model suggests air pollution in PNG 40 years time is controllable. However, greater effort in terms of sustainability development of resources, and energy is needed. In preparation for PNG’s future eco-friendly growth, sustainability, clean energy
technology in industrial energy usage is recommended.
Reference
Papua New Guinea Ministry for National Planning and Monitoring, 2004. The medium
term development strategy 2005-2010 Papua
New Guinea (EXT02 November 2004)
Oxford Economics, 2006. International Macroeconomics: Papua New Guinea, http://195.72.179.235/Hilfe/Asia_Pacific/Papu
a%20New%20Guinea/DailyBriefings/PANGD
B290906.pdf (last viewed 23-05-07)
APERC, 2006. Papua New Guinea. APEC
Energy Demand and Supply Outlook 2006, 2: 65 –68.
World Research Institute, Earth Trends, The environmental Information Portal, http://earthtrends.wri.org//searchable_db/stat
ic/363-4.csv (last view: 23-05-07)
Fujino J, 2001 Development of AIM-Trend
model as a communication tool to enhance
discussions about prospect of energy and
environment in each Asia-Pacific country. In:
Proceeding of IFAC Workshop on modeling
and control in environmental issues, Yokohama, pp109-114
IPCC, 1996. Revised IPCC guidelines for national greenhouse gas inventories Hadley
Centre, Bracknell: reference manual, 3.
United Nations Environment Program. Global environment Outlook. Geo Data portal. http://geodata.grid.unep.ch/ (last viewed: 22-05-07)
UN, 2004. Energy statistics yearbook 2004. UN publication, New York
Kuznets SS, 1958. Six lectures on economic growth. Free Press New York, New York.
Matuoka, Y., M. Kainuma and T. Morita (1995). "Scenario analysis of global warming using the

P.N.G.j.sci technol. Eng. Vol. 1, No.1, Page 9, 2007
Asian Pacific Integrated Model (AIM)." Energy
Policy 23(4/5): 357-371.
Nita, A., 2006. Papua New Guinea National Assessment Report. http://www.un.org/esa/sustdev/natlinfo/nsds/pacifi
c_sids/png_nar.pdf (lastview: 23-05-07)

P.N.G.j.sci technol. Eng. Vol. 1, No.1, Page 8, 2007
P.N.G.j.sci technol. Eng. Vol. 1, No.1, Page 9, 2007
An assessment of malaria transmission and endemicity in the Western
Highlands Province, Papua New Guinea.
Ian Garbett, Jacob Kapo, Philip Kond, James Aua Lipu, Minat Lamowa, Thomas Tromba. Tinsley District Hospital, PO Box 1027, Mount Hagen 281, Western Highlands Province, Papua New
Guinea Chi-Chi Obuaya, Royal Free and University College Medical School, London
Abstract
To assess the level of endemicity of malaria through estimation of the spleen rate and average
enlarged spleen size (AES) in children in a rural community of Papua New Guinean Highlanders
95 children aged between 2 to10 in the Ruti Valley of the Western Highlands Province were
examined. The spleen rate was 92% with an AES of 2.36. The paper suggests that malaria is holo-
endemic in Ruti Valley and highlights the urgent need for interventions such as bed nets and
insecticide spraying in rural Papua New Guinea as well as improved access to medical services.
Keyword: Malaria transmission, Western Highlands, endemicity
Introduction
Nearly 1/3 of the population in Papua New Guinea (PNG) present to health centres or hospitals for treatment of malaria annually.[1] In the Western Highlands Province alone 83 000 people are treated for malaria every year. [2] A number of districts within this Province are thought to harbour endemic malaria, including the Baiyer District. [3] Here few inhabitants own mosquito nets, though the provision of bed nets to endemic regions sits at the heart of the Global Fund’s policy to control malaria nationwide over the coming years [4] and is of great importance if the Millennium Development Goals - designed by the World Health Organisation – are to be met. The Ruti Valley is located in the Baiyer District between Wara Hills and the hills of the Enga Province, close to the Lai River and the tributaries of the Jimi River. Its 954 inhabitants live at between 429 and 519 metres above sea level in isolated rural settlements. Little is currently known about the impact that malaria has had within small rural populations such as that found in the Ruti Valley. Epidemiological data is of importance in these areas as it generates baseline statistics which will help local and regional health services to evaluate the effectiveness of their interventions in the future.
Aim
To assess the level of endemicity of malaria in the Ruti Valley by estimating the prevalence of splenomegaly and the average enlarged spleen size within the population. Methods
1. 95 children aged between the ages of 2 and 10 were examined at 3 different sites over a 4 day period in the Ruti Valley. Parental consent was obtained in all cases and the following data were recorded for each individual:
• age
• sex
• clan
• presence or absence of splenomegaly
• where the spleen was palpable, the Hackett score (1-5)
Any additional data, such as previous known haemoglobin, malaria smears or drug therapy were also noted. The findings were then entered into a spreadsheet database.
P.N.G.j.sci technol. Eng. Vol. 1, No.1, Page 10, 2007
Results
Table 1. Characteristics of children aged 2-10 in spleen rate assessment
Characteristic Percentage
Gender Male female
56 42
Ethnic clan Malpalgi Kopon Epi Kurup
45 28 20 7
Spleen palpable Yes No
92 8
Error!
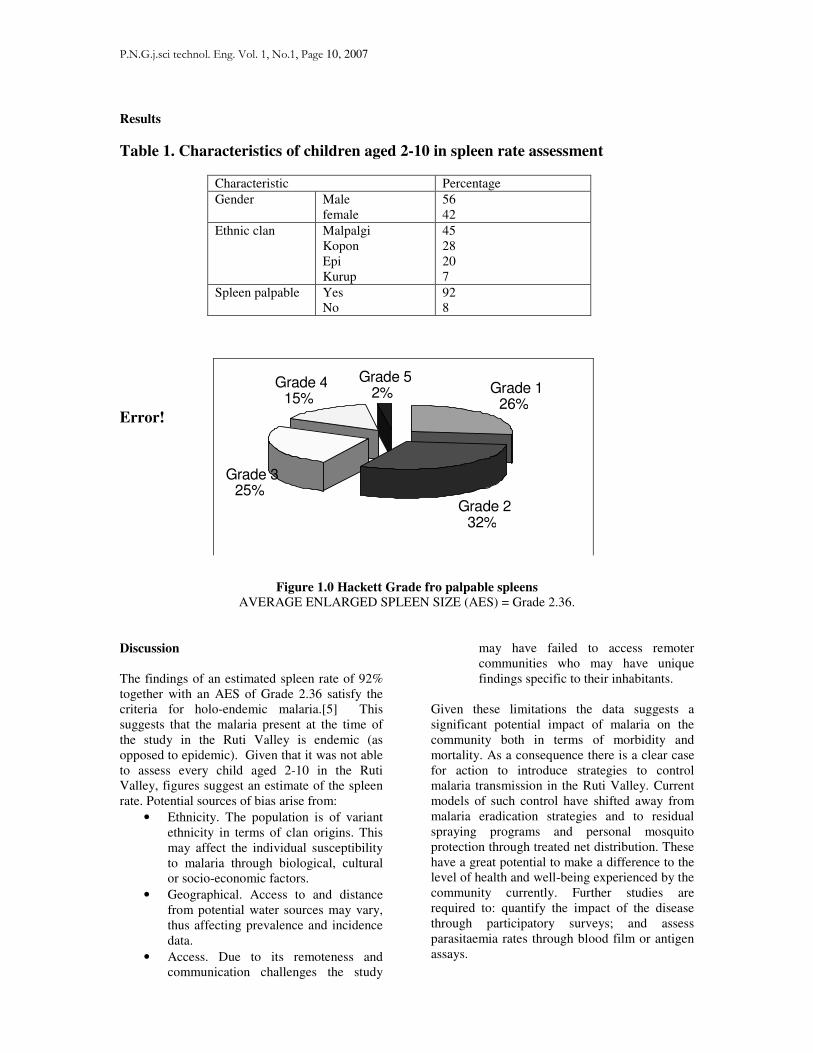
Figure 1.0 Hackett Grade fro palpable spleens
AVERAGE ENLARGED SPLEEN SIZE (AES) = Grade 2.36. Discussion
The findings of an estimated spleen rate of 92% together with an AES of Grade 2.36 satisfy the criteria for holo-endemic malaria.[5] This suggests that the malaria present at the time of the study in the Ruti Valley is endemic (as opposed to epidemic). Given that it was not able to assess every child aged 2-10 in the Ruti Valley, figures suggest an estimate of the spleen rate. Potential sources of bias arise from:
• Ethnicity. The population is of variant ethnicity in terms of clan origins. This may affect the individual susceptibility to malaria through biological, cultural or socio-economic factors.
• Geographical. Access to and distance from potential water sources may vary, thus affecting prevalence and incidence data.
• Access. Due to its remoteness and communication challenges the study
may have failed to access remoter communities who may have unique findings specific to their inhabitants.
Given these limitations the data suggests a significant potential impact of malaria on the community both in terms of morbidity and mortality. As a consequence there is a clear case for action to introduce strategies to control malaria transmission in the Ruti Valley. Current models of such control have shifted away from malaria eradication strategies and to residual spraying programs and personal mosquito protection through treated net distribution. These have a great potential to make a difference to the level of health and well-being experienced by the community currently. Further studies are required to: quantify the impact of the disease through participatory surveys; and assess parasitaemia rates through blood film or antigen assays.
Grade 1
26%
Grade 2
32%
Grade 3
25%
Grade 4
15%
Grade 5
2%
P.N.G.j.sci technol. Eng. Vol. 1, No.1, Page 11, 2007
Conclusion
This study has shown that malaria is endemic within a small rural community in Papua New Guinea. It thus highlights the need for swift interventions to control malaria in the region. Using the Ross-MacDonald equation for analysis, malaria control in Ruti could be centred on vector reduction, drug treatment and personal protection with treated bed nets. [6] The latter has formed the basis of the Global Fund’s initiative to control malaria in PNG and the need for action is pressing. This study also provides health services in the region with baseline data with which they can evaluate future interventions to control malaria. At the same time, the need for public health awareness and improved access to medical care for rural communities remains vital in helping rural communities to fight this potentially fatal yet readily treatable disease.
Recommendations
• We recommend the immediate implementation of a treated bed net distribution program in this region.
• A vector control residual spraying program should also be implemented.
• Wider access to prophylactic and therapeutic medication is urgently needed.
References
1. National Department of Health. Annual Health Sector Review. National Report. Papua New Guinea May 2004.
2. National Statistical Office. National
Census 2000. Census Unit Register Western Highlands Province. Port Moresby 2000.
3. Provincial Health Services. Annual
Report 2003. Western Highlands Province 2003
4. The Global Fund to Fight Aids,
Tuberculosis & Malaria. Papua New Guinea executive summary. http://www.theglobalfund.org/search/do
cs/3PNGM_702_0_summary (accessed 29th January 2005)
5. Najera et al. Malaria epidemics
detection and control: forecasting and control. http://www.who.int/docs/najera_epidemics/naj10htm (accessed 15th January 2005)
6. McKenzie F E, Samba E M. The role
of mathematical modeling in evidence-based malaria control. The American Journal of Tropical Medicine & Hygiene. 71, 2004; 94-96
P.N.G.j.sci technol. Eng. Vol. 1, No.1,Page 12, 2007
IT and the Web: What is in the immediate Future
for Papua New Guinea
Ian Hanspeter,
Department of Computer Science, PNG University of Technology Papua New Guinea
Abstract
Currently Papua New Guinea (PNG) is in a transitional phase in IT age. We may say that we are up there
with the rest, but the true determining factor which determines how well developed a nation is with respect
to information technology, is up-time and cost of ownership per capita. Currently those two factors are not
in our way at the moment. Monopoly of the communication industry has placed a strenuous bottle-neck on
the over-all growth of information technology and its related technologies. In this paper, it is pointed out
the need for a proper Information Technology (IT) policy as well as the need to empower proper
regulatory bodies to ensure that technology serves its primary purpose without any violation of any
fundamental morals that the country holds dear.
Keywords: ICT, Web, ITU, Information, Technology, ISP
Introduction
The web or the Internet as commonly referred to, has become the focal attention of businesses and governments alike around the world.
In the past, Government intervention has disallowed the introduction of new business ventures in the industry in PNG markets. With the nations best interest at heart, their actions have not only indirectly made communication into PNG costly but out of PNG as well. Like any simple economic growth model, the basics of infrastructure and watchdog bodies to manage these infrastructures have to be in place before growth through increased business in these particular areas can be expected.
It is a credit to organisations in PNG who have strived to provide information technology linkage with the rest of the world under current hash climates.
The discussions in this paper focus on the information technology aspects, especially the Internet. It is outlined as follows; section 2 looks at the IT infrastructure and growth in PNG. Section 3 poses challenges with respect to our fundamental development woes.
Section 4 addresses what we should do to change current situations. Section 5 concludes with suggestion for future proactive measures.
IT Infrastructure and Growth in PNG
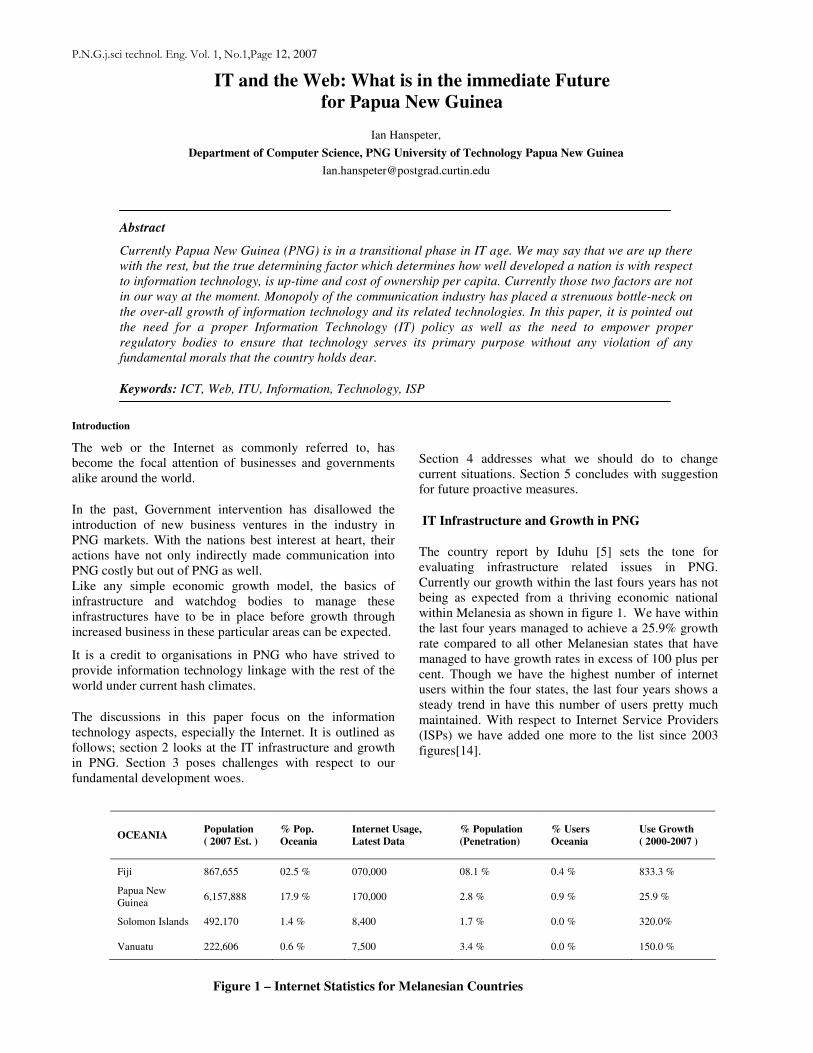
The country report by Iduhu [5] sets the tone for evaluating infrastructure related issues in PNG. Currently our growth within the last fours years has not being as expected from a thriving economic national within Melanesia as shown in figure 1. We have within the last four years managed to achieve a 25.9% growth rate compared to all other Melanesian states that have managed to have growth rates in excess of 100 plus per cent. Though we have the highest number of internet users within the four states, the last four years shows a steady trend in have this number of users pretty much maintained. With respect to Internet Service Providers (ISPs) we have added one more to the list since 2003 figures[14].
OCEANIA Population
( 2007 Est. )
% Pop.
Oceania
Internet Usage,
Latest Data
% Population
(Penetration)
% Users
Oceania
Use Growth
( 2000-2007 )
Fiji 867,655 02.5 % 070,000 08.1 % 0.4 % 833.3 %
Papua New Guinea
6,157,888 17.9 % 170,000 2.8 % 0.9 % 25.9 %
Solomon Islands 492,170 1.4 % 8,400 1.7 % 0.0 % 320.0%
Vanuatu 222,606 0.6 % 7,500 3.4 % 0.0 % 150.0 %
Figure 1 – Internet Statistics for Melanesian Countries
P.N.G.j.sci technol. Eng. Vol. 1, No.1, Page 13, 2007
13
The number of users within PNG have grown from a mere 70 000 to 170000 in the last four years, which is an increase of 200 per cent, thus showing that at least 2 out of every urban dweller has access to some internet facility in one way or another [6].
There is monopoly when it comes to internet infrastructure. Telikom through its subsidiary Pacific Mobile, being the sole regulated entity does not provide much room for options when it comes to choices of efficient, cost effective and reliability of systems. Our internet access rates are seen as above average access rates compared to most countries. Given the cheapest plan say from Daltron, for the Webtaim access 10 hours for K66, comparing that to say our nearest neighbour Australia, using Optus broadband access for $39.95 a month, with unlimited hours and a maximum of 2000 megabyte download restriction. This ways down to 2 cents per megabyte if going by data size, and if by time would be roughly around 6 cents an hour of access.
Another case for example Fiji, using Connect Fiji, you have a broadband deal. Taking the cheapest Broadband option, you have $39.50 per month for a 128/64kbps ADSL line with 1.5 GB Data Cap, and unlimited hours. This would equate to $0.06 Fijian Dollars per hour of access in a month, and if we were to measure by data download costs then it would be, $0.03 Fijian Dollars per megabyte of download. Compare this to PNG’s of roughly K6.6 per hours from Daltron using dialup and broadband from Datec at K495 a month with unlimited time and 200 megabyte download restriction, which comes to K2.76 per megabyte of download fees or K0.73 per hour of access over a month. These costs indicated that we are generally accessing Internet at a rate that is roughly 900 per cent higher than the two countries mentioned in the cases above.
So far we can safely assume that we have suffered stagnancy in growth in the Information Technology sector, more precisely in the Internet area.
We ask ourselves why so? There are signs of improvement and progress, but it does not equate to a general growth figure. IT policy has been noted to be the stumbling block. In addition the Government’s lack of emphasis on IT as an integral part of service delivery and operations hinders the embracing of this technology widespread. Though as noted from [4], PNG being in its nearing stage of developing and adopting a national ICT policy, it simply is not near enough. Information Technology is changing every day at a phenomenal rate. We need these guidelines and principles to ensure everyday use of this
technology is in accordance with our constitutional rights and interests.
In additional to the need of such policies to guide Information technology, we also need to have appropriate bodies in place to keep up the pace with the rest of the world. With technology trends, come attitude changes, attitudes and behaviours towards technology determine most common laws, affecting the use and the implications through its usage on subsequent technologies and users alike. Such an institution will oversee that the attitudes are changing for the best, and that amendments to common laws where necessary are done to cater for such beneficial changes.
Furthermore, that we must maintain our national goals, interests, privacy and security of information in all formulation of policies.
Fundamental Development Issues
PNG is a third world nation. Like any other third world nation, we inherit development issues such as education, health and economic development just to name a few. But on the other hand we are a developing nation which has made leaps and bounds within the last three decades of being an independent state.
All Information Technology discussions should focus around our positive future expectations. We have to be arrogant and prude but at the same time not be ignorant and shy away with fear of lack of knowledge, while people dictate terms and conditions to us. The following should know their roles and how they can each contribute to development of our IT industry and level within the country.
• Government
Having our constitution and people at heart is the foremost thing to consider when making decisions for our future. As noted by [15], we start with stating the constitution as the basis for the National Information and Communications Policy.
ICT Policy is paramount for those in power to set the wheels of the technology revolution in PNG rolling. Set up necessary regulatory bodies, having inputs and discussions from all participants in IT. Open doors to all, of course
P.N.G.j.sci technol. Eng. Vol. 1, No.1, Page 14, 2007
14
with the constraint of those meeting stringent criteria’s stipulated in the Policy document. Discussions of IT Policies have being touched in the past, [1],[2],[3],[4],[5],[6], [10], [12] and [15]. Bringing these back into discussion, and have adequately motivated and knowledgeable people leading this will eventually allow for a well formulated ICT policy.
Information technology would also pave the way for the Government to practise what has being preach over and over again. It will allow the Government to lead from the front through e-Government implementations. Internet publications and Intranet Policy updates allow all public servants to have access to standards and policies which go a long way reducing the centralisation of data as well as delivering the right information to the public, e.g. the Treasury Department’s website [11] allowing people to have access to Government budget information also the Department of Personnel Management’s website has excellent information on government policies and procedures.
Hundred and seventy thousand people having access to the net and if each disseminates this information from their exploits to say at least six people, that would make one fifth penetration of the population through this medium. Internet, through information technology, provides a very efficient way of information dissemination that has to be seriously developed to address our diversity in culture and geography.
• Appropriate Statutory Institutions
We attend conferences and forums all over the world to attain information to come to conclusions we already know. Why not institute a forum locally i.e. like the Waigani Seminar and invite professionals and key players in the industry to come up with something concrete and beneficiary to all.
More powers too, have to given to such bodies to enable them to facilitate appropriate policing of the Information Technology highway.
• Academics and Academic Institutions
Information technology is a thriving industry around the world, as most businesses become more electronic, heavy dependency is placed on the demand for professionals.
Human resource planning and graduate streamlining is essential for survival in the long run of this industry. Though we have graduates pouring out each year from tertiary institutions and other business colleges, majority of the current focus of graduate training has been for national needs, thus our future opinion that the country will not be able to sustain in the long run the large number of graduates from this field. Why not re-focus our training needs. Think tanks should re-think the current direction of programs and courses, to cater for both our emerging IT industry in parallel with meeting the global demand. We all know that our human resources are the most expensive resource we could ever export.
Centres of excellence and globally accepted industrial courses should be emphasised in conjunction with undergraduate programs to allow graduates to not only acquire scientific knowledge but also technical knowledge, technical knowledge that would be internationally marketable, allowing broader range of careers choices for these graduates.
Academics should be playing a guidance role in policy-making and information policing rather than regurgitators of textbook. Research for academics should not only be in cutting edge technology or trying to catch on the information technology matrix, but it should be focused around enhancing technology for our usage and benefit. Redeveloping systems to facilitate the local farmer to allow them to better manage their livelihood and refine their crop production for instance. Those are directions and focus our academics should be striving for. Technology we should know, but applying these technology principles for our purposes allows engineering.
• Industries
Industries should look at maximising population penetration, reaching out to all through affordable technology. Industry experts should also play a proactive role in policy making to improve mechanisms of malfunction in current systems.
P.N.G.j.sci technol. Eng. Vol. 1, No.1, Page 15, 2007
15
The Governments policies of Community Services Obligations (CSO) as stipulated in Telikom conditions of sale have to seen by the industries as something their can all adopt, a goal which should be seen as part of the company’s social obligations rather than an obstacle in their profit maximising function. Bridging the digital divide should be a role which all industries players should inherit by default and be willing to participate meaningfully in.
• Students
All students deserve a better knowledge pool than what all institutions offer currently [12]. The need for more funding to improve library infrastructure and information access by institutions should be posed by all, to responsible authorities.
We are currently seeing the realisation of this in a few tertiary institutions in the country. The boycott of classes from Vudal reveals the underlying desire of students to feel capable theoretically and practically. Knowledge is power. We have preached that motto for decades. But have we done anything to ensure that we empower our young appropriately.
Computers and its peripheral technologies provide a resource that can be utilised to provide enormous knowledge pool either through local implementations or access to the Internet for a broader source.
Students should accept IT as a tool in achieving their dreams and aspirations. Not only through its providence of information for other fields but also through the field itself. All over the world, there is a shortage in supply of technical people in computing fields. Take the challenge and look outside the box for your future career.
There is a lot more to the Internet than just downloading a few mp3 songs or searching Google. Grip the technology and it will be your ticket to your dreams and ambitions.
Aligning our Policies and Goals.
The basic notion of democratic nation has to be upheld in any national policy regarding information technology.
In today’s age of neo-terrorism and cyber crime, any IT policy has to consider these issues. Appropriate levels of powers should be bestowed upon appropriate bodies to cater for proper policing for such ill use of information technology.
All policies should be aligned perfectly if not close to perfection with our national gaols. As is the word policy implies, it is a plan of action to guide decisions and actions [17]. We should reflect upon our own gaols as a nation and derive policies which will enable us to achieve these gaols.
Issues that should be considered in developing a policy are;
o Information Security and Privacy
o E-Governments – How Information Technology can be and should be used and viewed by the Government of the day.
o E-Commerce – Guidelines and procedures under whereby electronic commerce can be facilitated.
o Community Services – Information Technology will and should play a major role in delivering services to the population at large, this should focus on the government gaols of archiving delivery of services through technology and expectations.
o Health
o Education
o Research Development
o Human Resource
Prior to addressing the issues above a legal framework for implementation purposes has to be set up. Setting up control watchdogs with enough power to police Information Technology for the country is another thing that has to be done.
A centralised technical policy for all government authorities could be defined for all government institutions, but there has to flexibility and leniency as well in technical issues. All have different needs and uses of technology. One policy cannot fit all, but one policy could act as a framework for all to work with. It would not be in the interest of progress and development is all IT technical functionality is restricted to one document and one institution.
P.N.G.j.sci technol. Eng. Vol. 1, No.1, Page 16, 2007
16
Conclusion
Technology is changing everyday and so are the policies that govern them. This paper has highlighted some issues, but not all. There is a lot more to it than what has been discussed here. Take all discussions as a challenge and add more if necessary as without constructive criticisms there would be no progress.
We as a nation, have a bright future ahead of us. We have to be willing to accept change and allow changes in the right places to make a better life for the nation as a whole. Technology is a tool that will enable us to achieve our national goals and benefit the population. It has its disadvantages as well, like all things in life. These discussions have been focused around the positive sides of the technology. More analysis could be done on what the technology would mean for government institutions and mechanics of services. How policies relating to this technology would affect the life of an ordinary citizen. How policies would cater for proper delivery of goods and services to the grassroots. How we can control and curb any ill use of these technological mechanisms. How policy would facilitate the improvement of general livelihood for all. These are questions that need answering for an integral solution to the whole notion of progressing with technology for the future.
References
[1]. Ruby Vaa, “Papua New Guinea: ICT use in Education”, UNESCO Meta-survey on use of Technologies in Education, 2006
[2]. Stuart Mathison, “Connecting Island Communities” The Foundation for Development Corporation, Australia, October, 2005.
[3]. Eun-Ju Kim, “Promoting Low Cost Access to the Unconnected”, IT Forum for Asia and Pacific, ITU, 2003
[4]. Arnold Lakamanga, “SOPAC: Conference Observation Report”, PACINET Conference – Apia, Samoa August 23rd – 31st, 2006.
[5]. Henao Iduhu, “Country Report in Papua New Guinea”, Pacific Island Forum Secretariat Sub-Regional Conference on ICT, Suva, Fiji, December 6th – 9th 2004.
[6]. Willie Lahari, “The Challenges of measuring Community Access to Information and Communication Technology (ICT) in Papua New Guinea”, Global Workshop on Community Access to ICT, Mexico, 16th , 19th, November, 2004.
[7]. Internet World Statistics - http://www.internetworldstats.com/stats6.htm#oceania
[8]. CIA World Fact Book on PNG - https://www.cia.gov/library/publications/the-world-factbook/geos/pp.html
[9]. PANGTEL – www.pangtel.gov.pg
[10]. PNG Department of Personnel Management - http://www.dpm.gov.pg/
[11]. PNG Department of Treasury - http://www.treasury.gov.pg/
[12]. D E K Wijasuriya., “PNG Developing the National Information Infrastructure” Waigani Seminar, August, 1997.
[13]. Tiare Internet Service - http://www.pacificmobile.com.pg/tiare/isp.html
[14]. ITU – www.ITU.int
[15]. Henao Iduhu, “Implementation Strategies of the National Information and Communication Policy”, Waigani Seminar, August, 1997
[16]. Andrew Trloar, “Information Management at the age of the Internet”, Waigani Seminar, August, 1997.
[17]. Wikipedia - http://en.wikipedia.org/wiki/Policy

P.N.G.j.sci technol. Eng. Vol. 1, No.1, Page 17, 2007
17
P.N.G.j.sci technol. Eng. Vol. 1, No.1, Page 18, 2007
18
Teaching microbiology practical class in a problem-based learning
curriculum at the University of Papua New Guinea: a tutor’s experience.
Itaki L. Rodney, Department of Pathology, School of Medicine and Health Sciences, University of Papua New Guinea.
Abstract
Problem based learning is now being implemented in many medical schools around the world. UPNG adopted the problem based model of teaching medical students in 1999. This paper describes the authors experience in teaching microbiology practical classes at UPNG.
Keywords Problem based learning, microbiology, UPNG, practical class.
Background
What is problem-based learning?
Problem based learning (PBL) can be broadly defined as a method of teaching that focuses on self-directed learning. It is both a curriculum and a process. The curriculum consists of carefully selected problems that are used as triggers to learn about a subject. The process of PBL demands the learner to think critically, acquire knowledge that is critical to the problem, develop strategies of self-directed learning and team participation skills. The PBL process simulates systemic approaches used to solve problems in life and career. History of problem-based learning.
The PBL model was developed and first implemented by the Faculty of Medicine at McMaster University in Canada. Soon after, three other medical schools followed – the University of Limburg at Maastricht in the Netherlands, the University of New Castle in Australia, and the University of New Mexico in the United States (Camp 2007). Since then, PBL has been adopted by most medical schools in the world in various adaptations. Problem based learning is also being adopted in other fields such as law, engineering, business, architecture, forestry, police science, social works (Camp 2007) and many others. History of problem based-learning at the
University of Papua New Guinea.
In the 1950s, Papua New Guineans were sent to the Fiji School of Medicine to be trained as doctors. In 1962 the Papua Medical College (PMC) was established to train all health professionals. Then in 1965 with the establishment of University of Papua New Guinea (UPNG), PMC became the Faculty of
Medicine. In 1998, a curriculum review committee initially raised the need for a curriculum reform in undergraduate medical education at UPNG as part of a general restructuring process (Isi et al. 2004). After examining world trends in medical education, the committee concluded at a PBL model was the most appropriate one that should be introduced. In 1997, a team from the Faculty of Medicine, including the author, made a fact finding mission to University of Newcastle in Australia under an AusAid sponsorship. Following this trip, a medical education consultant was engaged to oversee the implementation of PBL at UPNG. Initially the second and third year medical students were taught in the PBL curriculum beginning in 1999 and fully integrated PBL curriculum was taught right across all undergraduate year of study in 2001. The last lot of students to be taught in the traditional model did their final year in 2001. Curriculum reform was achieved at the Faculty of Medicine in a remarkable short-run phase – introducing a completely new curriculum to all undergraduates in three years (Isi et al. 2004). The transition to PBL model also brought criticism from senior doctors, academics, and the general public and was even debated in parliament (Sims 2003). Therefore to quell any existing negative perceptions about the quality and standard of the new curriculum, the World Federation of Medical Education (WFME) was invited to accredit the UPNG MBBS PBL based curriculum. The report, completed by a three member team from WFME in 2004 was a very positive one.
P.N.G.j.sci technol. Eng. Vol. 1, No.1, Page 19, 2007
19
The author was the student representative to the PBL curriculum review committee that made the trip to New Castle University. In his capacity as the student representative president, he facilitated communication between staff and students so that students were well informed of the restructure process (in press). He later joined UPNG as an academic staff and was employed as a tutor in medical microbiology and pathology between 2003 and 2005. This paper will describe his experience in teaching microbiology practical classes in the PBL based curriculum at the School of Medicine and Health Sciences (SMHS) at UPNG. Microbiology practical classes at the School of
Medicine and Health Sciences.
The division of microbiology is part of the Department of Pathology. The author was a tutor working under the direct supervision of a senior lecturer in medical microbiology. The pathology department had three technical staff, one of whom was the senior technician. The technicians assisted the tutor or the lecturers in preparing for practical classes, practical exams as well as research. The microbiology tutor was also a pathology registrar at the Port Moresby General Hospital (PMGH), which is the university teaching hospital. Preparing for the practicals
The microbiology laboratory did not normally keep microbiological agents. Therefore, most, if not all of the agents used in the practical classes were from clinical specimens obtained at PMGH. A week prior to the practical, the tutor with the assistance of one of the technicians prepared pure colonies from clinical
specimens. These were then kept in the laboratory refrigerator at four degree Celsius. Twenty four hours before the practical class, the colonies were processed and incubated at 37 degree Celsius to obtain a fresh colony. The fresh colonies were used in the practical classes. Conducting the practicals
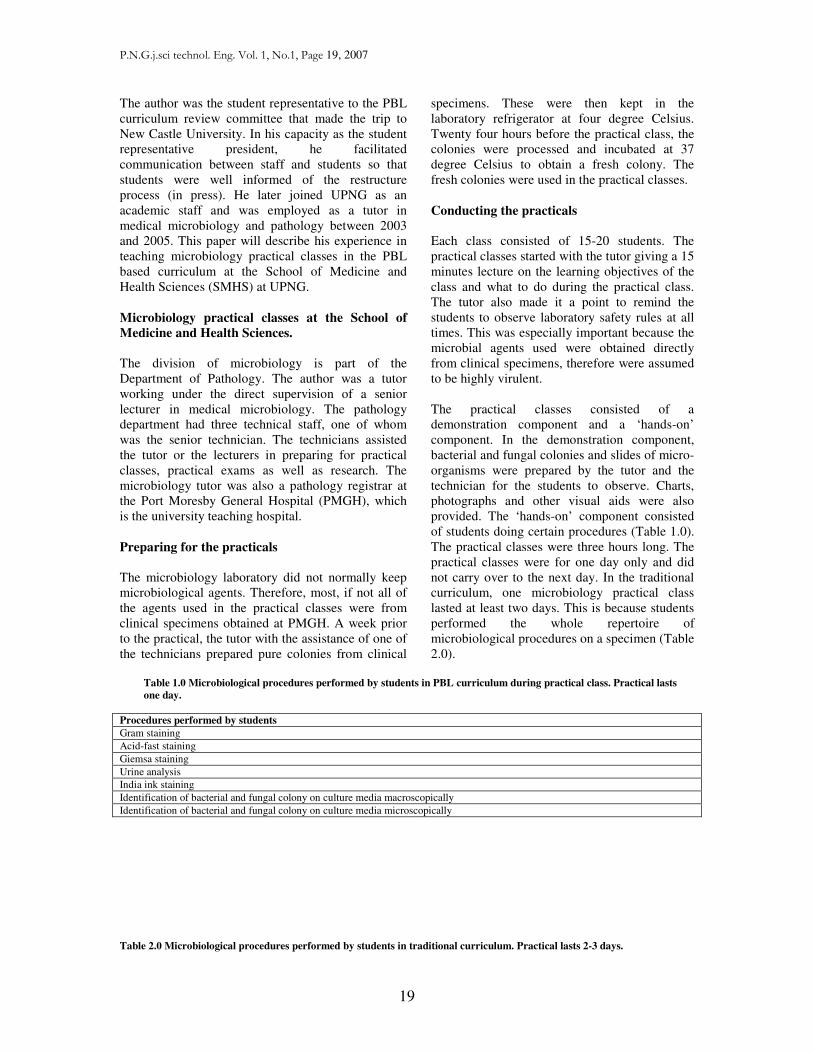
Each class consisted of 15-20 students. The practical classes started with the tutor giving a 15 minutes lecture on the learning objectives of the class and what to do during the practical class. The tutor also made it a point to remind the students to observe laboratory safety rules at all times. This was especially important because the microbial agents used were obtained directly from clinical specimens, therefore were assumed to be highly virulent. The practical classes consisted of a demonstration component and a ‘hands-on’ component. In the demonstration component, bacterial and fungal colonies and slides of micro-organisms were prepared by the tutor and the technician for the students to observe. Charts, photographs and other visual aids were also provided. The ‘hands-on’ component consisted of students doing certain procedures (Table 1.0). The practical classes were three hours long. The practical classes were for one day only and did not carry over to the next day. In the traditional curriculum, one microbiology practical class lasted at least two days. This is because students performed the whole repertoire of microbiological procedures on a specimen (Table 2.0).
Table 1.0 Microbiological procedures performed by students in PBL curriculum during practical class. Practical lasts
one day.
Procedures performed by students
Gram staining
Acid-fast staining
Giemsa staining
Urine analysis
India ink staining
Identification of bacterial and fungal colony on culture media macroscopically
Identification of bacterial and fungal colony on culture media microscopically
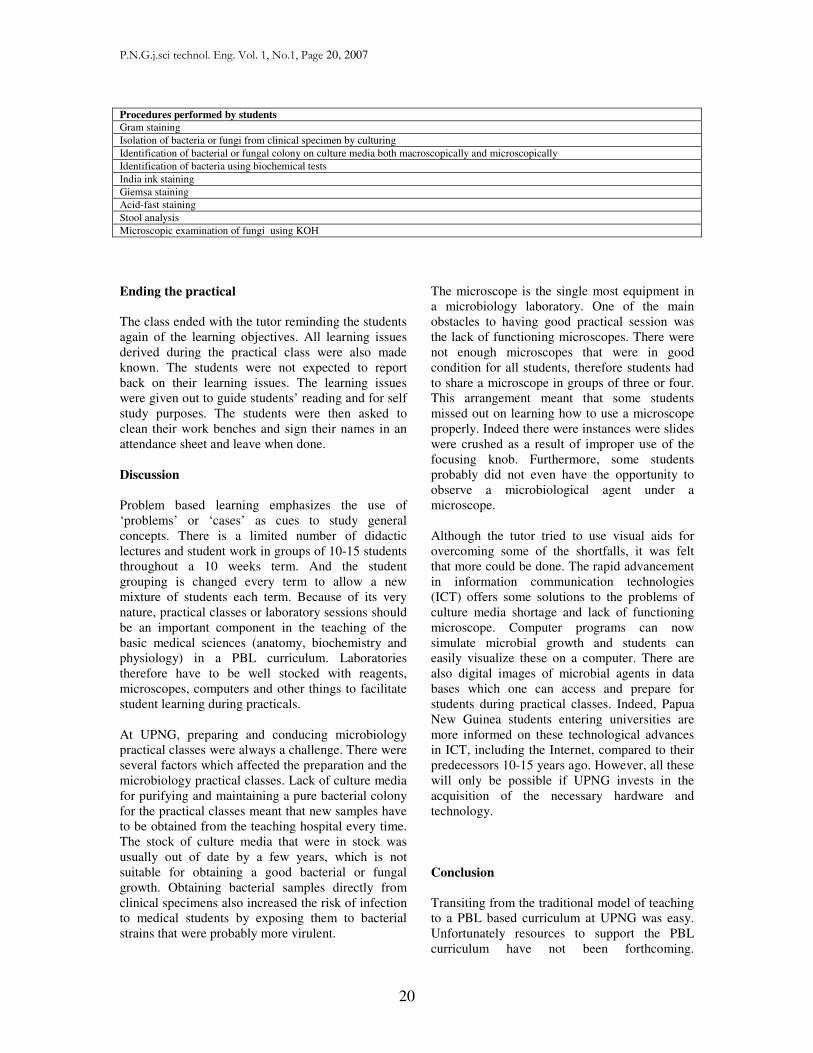
Table 2.0 Microbiological procedures performed by students in traditional curriculum. Practical lasts 2-3 days.
P.N.G.j.sci technol. Eng. Vol. 1, No.1, Page 20, 2007
20
Procedures performed by students
Gram staining
Isolation of bacteria or fungi from clinical specimen by culturing
Identification of bacterial or fungal colony on culture media both macroscopically and microscopically
Identification of bacteria using biochemical tests
India ink staining
Giemsa staining
Acid-fast staining
Stool analysis
Microscopic examination of fungi using KOH
Ending the practical The class ended with the tutor reminding the students again of the learning objectives. All learning issues derived during the practical class were also made known. The students were not expected to report back on their learning issues. The learning issues were given out to guide students’ reading and for self study purposes. The students were then asked to clean their work benches and sign their names in an attendance sheet and leave when done. Discussion
Problem based learning emphasizes the use of ‘problems’ or ‘cases’ as cues to study general concepts. There is a limited number of didactic lectures and student work in groups of 10-15 students throughout a 10 weeks term. And the student grouping is changed every term to allow a new mixture of students each term. Because of its very nature, practical classes or laboratory sessions should be an important component in the teaching of the basic medical sciences (anatomy, biochemistry and physiology) in a PBL curriculum. Laboratories therefore have to be well stocked with reagents, microscopes, computers and other things to facilitate student learning during practicals. At UPNG, preparing and conducing microbiology practical classes were always a challenge. There were several factors which affected the preparation and the microbiology practical classes. Lack of culture media for purifying and maintaining a pure bacterial colony for the practical classes meant that new samples have to be obtained from the teaching hospital every time. The stock of culture media that were in stock was usually out of date by a few years, which is not suitable for obtaining a good bacterial or fungal growth. Obtaining bacterial samples directly from clinical specimens also increased the risk of infection to medical students by exposing them to bacterial strains that were probably more virulent.
The microscope is the single most equipment in a microbiology laboratory. One of the main obstacles to having good practical session was the lack of functioning microscopes. There were not enough microscopes that were in good condition for all students, therefore students had to share a microscope in groups of three or four. This arrangement meant that some students missed out on learning how to use a microscope properly. Indeed there were instances were slides were crushed as a result of improper use of the focusing knob. Furthermore, some students probably did not even have the opportunity to observe a microbiological agent under a microscope. Although the tutor tried to use visual aids for overcoming some of the shortfalls, it was felt that more could be done. The rapid advancement in information communication technologies (ICT) offers some solutions to the problems of culture media shortage and lack of functioning microscope. Computer programs can now simulate microbial growth and students can easily visualize these on a computer. There are also digital images of microbial agents in data bases which one can access and prepare for students during practical classes. Indeed, Papua New Guinea students entering universities are more informed on these technological advances in ICT, including the Internet, compared to their predecessors 10-15 years ago. However, all these will only be possible if UPNG invests in the acquisition of the necessary hardware and technology. Conclusion
Transiting from the traditional model of teaching to a PBL based curriculum at UPNG was easy. Unfortunately resources to support the PBL curriculum have not been forthcoming.
P.N.G.j.sci technol. Eng. Vol. 1, No.1, Page 21, 2007
21
Microbiology practical classes at the SMHS have suffered as a result of these changes. References
1. Duke, T. Tefuarani, N. Baravilala, W. 2004,
‘Getting the most out of health education in Papua New Guinea Report from the 40th Annual Papua New Guinea Medical Symposium’, Medical Journal of Australia, 181:11/12, 606-607.
2. Gwendie Camp. 2007, Problem-based learning: a paradigm shift or a passing fad, The University of Texas Medical Branch, http://www.utmb.edumeo/f0000003.htm (last viewed 7th April 2007).
3. Kevau, IH. Vince, JD. McPherson, JV. 2004,
‘Tailoring medical education in Papua New Guinea to the needs of the country’, Medical
Journal of Australia, Australia, 181:11/12, 608-610.
4. Sims, P. 2003, ‘Medical Education – front
page news in Papua New Guinea’, British
Journal of General Practise, 53:817

P.N.G.j.sci technol. Eng. Vol. 1, No.1, Page 22, 2007
22
P.N.G.j.sci technol. Eng. Vol. 1, No.1, Page 23, 2007
23
A survey to assess current knowledge of malaria transmission,
presentation and management amongst Papua New Guinean
Highlanders.
Ian Garbett, Jacob Kapo, Philip Kond, James Aua Lipu, Minat Lamowa, Thomas Tromba.
Tinsley District Hospital, PO Box 1027, Mount Hagen 281, Western Highlands Province, Papua New Guinea.
Chi-Chi Obuaya, Royal Free and University College Medical School, London, UK.
Abstract
To assess local perceptions about malaria in a rural community in the Highlands of Papua New
Guinea, 152 adults resident in the Ruti Valley, Mul/Baiyer District, Western Highlands Province
were interviewed at 3 different sites over 4 days in parallel with a malarial endemicity study. Most
participants identified the potential mortality of the disease, use of anti-malarial medication and
its peak times of transmission with rainfall variation. Significant proportions were unaware of
how malaria was transmitted and its prevention with mosquito nets. There were unexpected beliefs
about the role played by food in disease transmission and control. Rural communities that were
surveyed generally have an adequate knowledge of malaria control. Potential for the introduction
of participatory strategies has been revealed, given the communities current understanding, to
enhance the implementation of planned mosquito net provision strategies and their sustainability
in this and other malaria endemic areas in the future.
Keywords: Malaria transmission, Mul/Baiyer, anti-malarial medication
Introduction
Malaria remains one of the leading causes of morbidity and mortality in Papua New Guinea (PNG), the largest developing country in the Pacific.[1] According to national statistics, 27% of the population presented to health centres or hospitals for treatment of malaria during 2003.[2] Approximately 83 000 people living in the Western Highlands Province of the country (population 450 000) were treated for malaria during the same year.[3] Malaria is said to be endemic within a number of districts in this Province, including the Baiyer District,[4] and many others nationwide. The Global Fund to Fight AIDS, Tuberculosis & Malaria aims to halve malaria mortality and morbidity in PNG by 2010 by implementing full coverage of insecticide treated bed nets in all regions with endemic malaria; 80% of the population are thought to be at risk. [5] To this end it has committed US$20 million over the next five years [1], and reflects the focus on Malaria control as a key
objective of the World Health Organisation’s Millennium Development Goals. 80% of the population of PNG live in rural areas, many of which can only be reached by foot. One such community exists in the Ruti Valley, which lies in the Baiyer District between Wara Hills and the hills of the Enga Province. Its 954 inhabitants [3] live at between 429 and 519 metres above sea level, close to the Lai River and the tributaries of the Jimi River.
Aims
1. To evaluate local perceptions of malaria in the Ruti Valley by means of a survey.
2. To identify areas where misconceptions about malaria exist.
3. To make recommendations for strategies to improve knowledge which will impact the successful use of planned future preventative strategies.
P.N.G.j.sci technol. Eng. Vol. 1, No.1, Page 24, 2007
24
Methods
A survey was devised and then conducted in local dialects at 3 different sites over a 4 day period in the Ruti Valley. 152 residents aged over 16 years were interviewed and the findings were entered into a
spreadsheet database. Verbal consent was obtained from all participants. A short drama was then performed to teach those in attendance more about malaria and to promote the use of mosquito nets.
Results
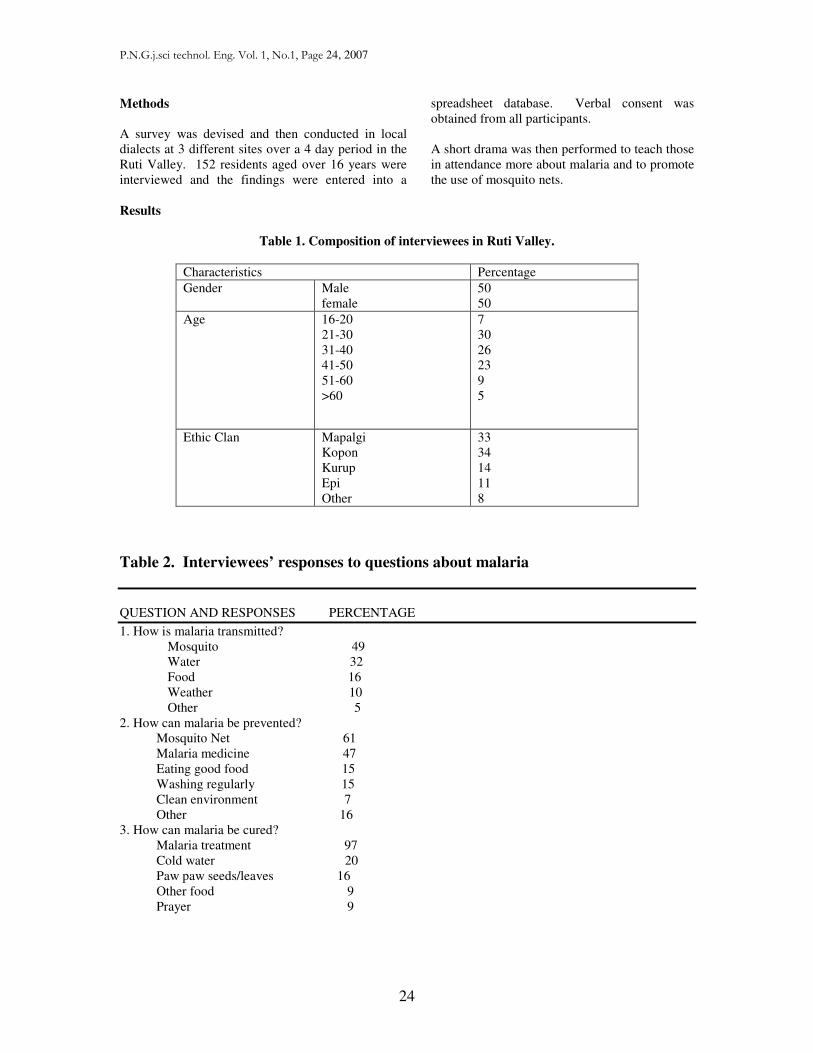
Table 1. Composition of interviewees in Ruti Valley.
Characteristics Percentage
Gender Male female
50 50
Age 16-20 21-30 31-40 41-50 51-60 >60
7 30 26 23 9 5
Ethic Clan Mapalgi Kopon Kurup Epi Other
33 34 14 11 8
Table 2. Interviewees’ responses to questions about malaria
QUESTION AND RESPONSES PERCENTAGE
1. How is malaria transmitted? Mosquito 49 Water 32 Food 16 Weather 10 Other 5
2. How can malaria be prevented? Mosquito Net 61 Malaria medicine 47 Eating good food 15 Washing regularly 15 Clean environment 7 Other 16 3. How can malaria be cured? Malaria treatment 97 Cold water 20 Paw paw seeds/leaves 16 Other food 9 Prayer 9
P.N.G.j.sci technol. Eng. Vol. 1, No.1, Page 25, 2007
25
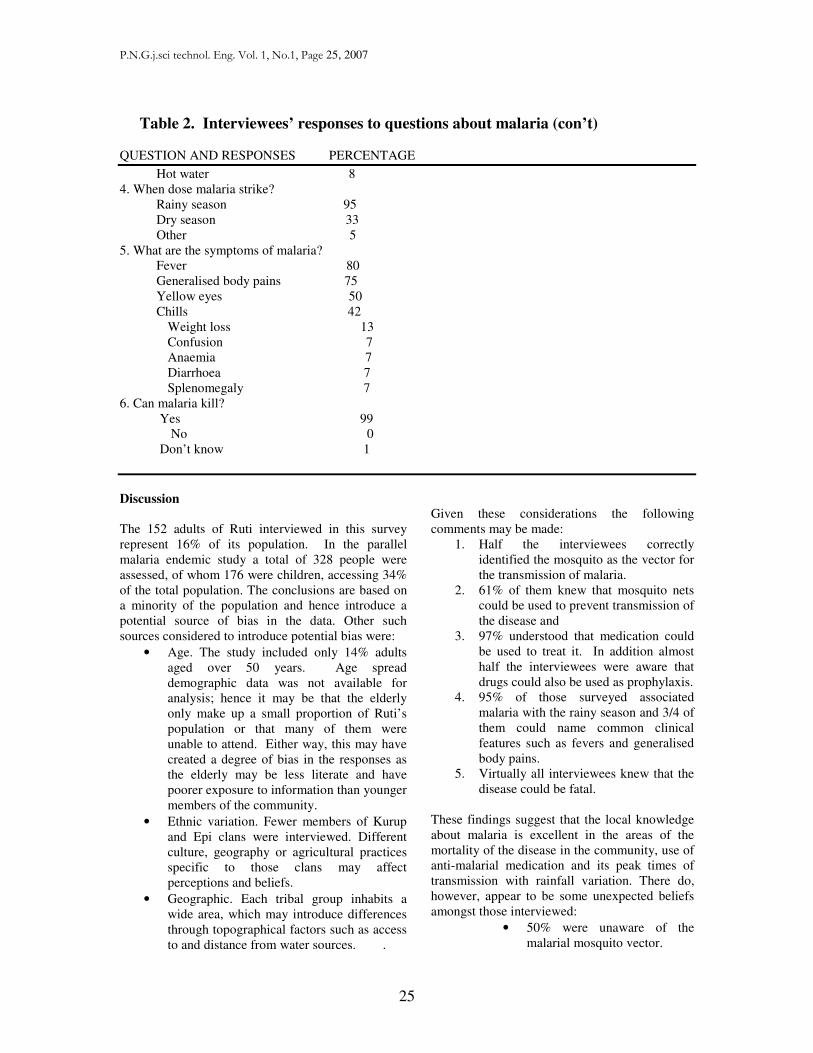
Table 2. Interviewees’ responses to questions about malaria (con’t) QUESTION AND RESPONSES PERCENTAGE
Hot water 8 4. When dose malaria strike? Rainy season 95 Dry season 33 Other 5 5. What are the symptoms of malaria? Fever 80 Generalised body pains 75 Yellow eyes 50 Chills 42
Weight loss 13 Confusion 7 Anaemia 7 Diarrhoea 7 Splenomegaly 7
6. Can malaria kill? Yes 99
No 0 Don’t know 1
Discussion The 152 adults of Ruti interviewed in this survey represent 16% of its population. In the parallel malaria endemic study a total of 328 people were assessed, of whom 176 were children, accessing 34% of the total population. The conclusions are based on a minority of the population and hence introduce a potential source of bias in the data. Other such sources considered to introduce potential bias were:
• Age. The study included only 14% adults aged over 50 years. Age spread demographic data was not available for analysis; hence it may be that the elderly only make up a small proportion of Ruti’s population or that many of them were unable to attend. Either way, this may have created a degree of bias in the responses as the elderly may be less literate and have poorer exposure to information than younger members of the community.
• Ethnic variation. Fewer members of Kurup and Epi clans were interviewed. Different culture, geography or agricultural practices specific to those clans may affect perceptions and beliefs.
• Geographic. Each tribal group inhabits a wide area, which may introduce differences through topographical factors such as access to and distance from water sources. .
Given these considerations the following comments may be made:
1. Half the interviewees correctly identified the mosquito as the vector for the transmission of malaria.
2. 61% of them knew that mosquito nets could be used to prevent transmission of the disease and
3. 97% understood that medication could be used to treat it. In addition almost half the interviewees were aware that drugs could also be used as prophylaxis.
4. 95% of those surveyed associated malaria with the rainy season and 3/4 of them could name common clinical features such as fevers and generalised body pains.
5. Virtually all interviewees knew that the disease could be fatal.
These findings suggest that the local knowledge about malaria is excellent in the areas of the mortality of the disease in the community, use of anti-malarial medication and its peak times of transmission with rainfall variation. There do, however, appear to be some unexpected beliefs amongst those interviewed:
• 50% were unaware of the malarial mosquito vector.
P.N.G.j.sci technol. Eng. Vol. 1, No.1, Page 26, 2007
26
• 39% were unaware of the use of mosquito nets in prevention.
• 1/6th of those interviewed associated food with transmission of malaria.
• 17% thought that eating good food could prevent people catching malaria.
• 16% of them also thought that eating paw paw seeds or leaves could treat malaria.
• 1/3 of the interviewees associated malaria with the dry season.
These responses form a useful foundation for further exploration of the source(s) of these concepts to develop malaria preventative strategies. The use of participatory tools has the potential to enable community members to see for themselves new insights in malaria control and, in so doing, generate a sustainable context. It may be the case, for instance, that some foods are recommended as a form of treatment for malaria by influential figures within the community and may be effective natural protective agents. The study shows the way forward for further involvement both by health care workers and within the community through the involvement of local establishments such as schools and churches. Following the completion of the survey, the authors used the results to carry out community awareness events in the Ruti Valley to further educate the Highlanders about the transmission, clinical features, prevention and treatment of malaria. At the same time these events served to introduce the community to mosquito nets ahead of the proposed Global Fund initiative. Thus the survey acted as a tool to help meet the health education needs of this particular community. Such measures have the potential to make future interventions more sustainable and could be replicated in other rural settings around PNG. This study has identified a number of strategies that could be employed to further educate the Highlanders about malaria, including: community-led health approaches; group based models; and schemes which employ participatory tools. These should aim to include the community at all stages of the planning and implementation processes, with the end goal of empowering the people and making sustainable changes to their lives. This study has also highlighted the need for thorough appraisal in the initial stages of this cycle to assess the needs of rural communities and aid the implementation of such strategies.
Conclusion
This survey has shown that a rural population of Papua New Guinean Highlanders has a good understanding of malarial mortality, presentation and treatment. The study reveals great potential for targeted participatory-based work to facilitate forthcoming strategies aimed at introducing mosquito nets and residual spraying into the communities where malaria is endemic. Through these means the strategies designed will be in the context of sustainability and enrol all members of the community in their implementation, thus improving the likelihood of successfully reducing malarial mortality and morbidity.
References
[1] World Health Organisation. Country Health Information Profile – Papua New Guinea. http://www.wpro.who/int/chips/chip04/pdf/png.pdf (accessed 1st February 2005)
[2] National Department of Health. Annual Health Sector Review. National Report. Papua New Guinea May 2004. [3] National Statistical Office. National Census 2000. Census Unit Register Western Highlands Province. Port Moresby 2000. [4] Provincial Health Services. Annual Report 2003. Western Highlands Province 2003 [5] The Global Fund to Fight Aids, Tuberculosis & Malaria. Papua New Guinea executive summary.http://www.theglobalfund.org/search/docs/3PNGM_702_0_summary (accessed 29th January 2005

P.N.G.j.sci technol. Eng. Vol. 1, No.1, Page 27, 2007
27
P.N.G.j.sci technol. Eng. Vol. 1, No.1, Page 28, 2007
28
Use of absolute ethanol and 1% polidocanol for the treatment of vascular malformations at the Graduate School of
Medicine, Hokkaido University
William Mol, Satoru Sasaki, Hiroshi Furukawa, Yuhei Yamamoto
Hokkaido University Graduate School of Medicine, Department of Plastic and Reconstructive Surgery, Sapporo, Japan
Kita-15, Nishi-7, Kita-ku, Sapporo, Hokkaido, 060-8638, Japan, Tel: 81-11-706-6978, Fax: 81-11-706-7827 or E-mail: yu-
ABSTRACTS
In the past the treatment for vascular malformation used to be mainly surgery. However,
surgery poses the problems of bleeding and poor aesthetic outcomes. Sclerotherapy is an old
therapeutic method that has been re-visited and popularized recently. Percutaneous and
transcatheteric sclerotherapy are 2 methods of sclerotherapy that are employed. This paper
presents assessment of patients undergoing only percutaneous sclerotherapy for vascular
malformations at the Graduate School of Medicine, Hokkaido University.The sclerosants used
were absolute ethanol and 1 % polidocanol. Comparison between 2 sclerosants and among
the different types of vascular malformations was performed. The major outcome category for
each lesion types were; arteriovenous malformation, 35 % good, venous malformation 47 %
good, macrocystic lymphatic malformation, 88 % excellent, microcystic lymphatic
malformation 64 % good and capillary malformation 67 % fair. The rate of major
complications was 1.7%. It was established that Absolute Ethanol is more effective than 1 %
polidocanol. However, it is associated with more local complications compared with 1 %
polidocanol. The outcome for low flow, single cavity lesions are much better than for high
flow lesions and multi-cystic lesions. This paper recommends that polidocanol is useful for
small, low flow, superficial lesions while absolute ethanol is useful for large and deep lesions
as well as both low and high flow lesions.
Key words: hemangioma, vascular malformation, percutaneous, transcatheteric,
sclerotherapy, absolute ethanol, 1% polidocanol.
Introduction
Sclerotherapy is the injection of an irritant into an
abnormal vessel to cause endothelial cell death
followed by scaring leading to obliteration of that
vessel. The percutaneous technique is done through
piercing the skin to directly reach the foci of the
lesion and the transcatheteric technique is done
through an intravascular micro-catheter inserted
from a main trunk of the vessel and manipulated up
to were the lesion is located under digital subtraction
angiography (DSA) guide.
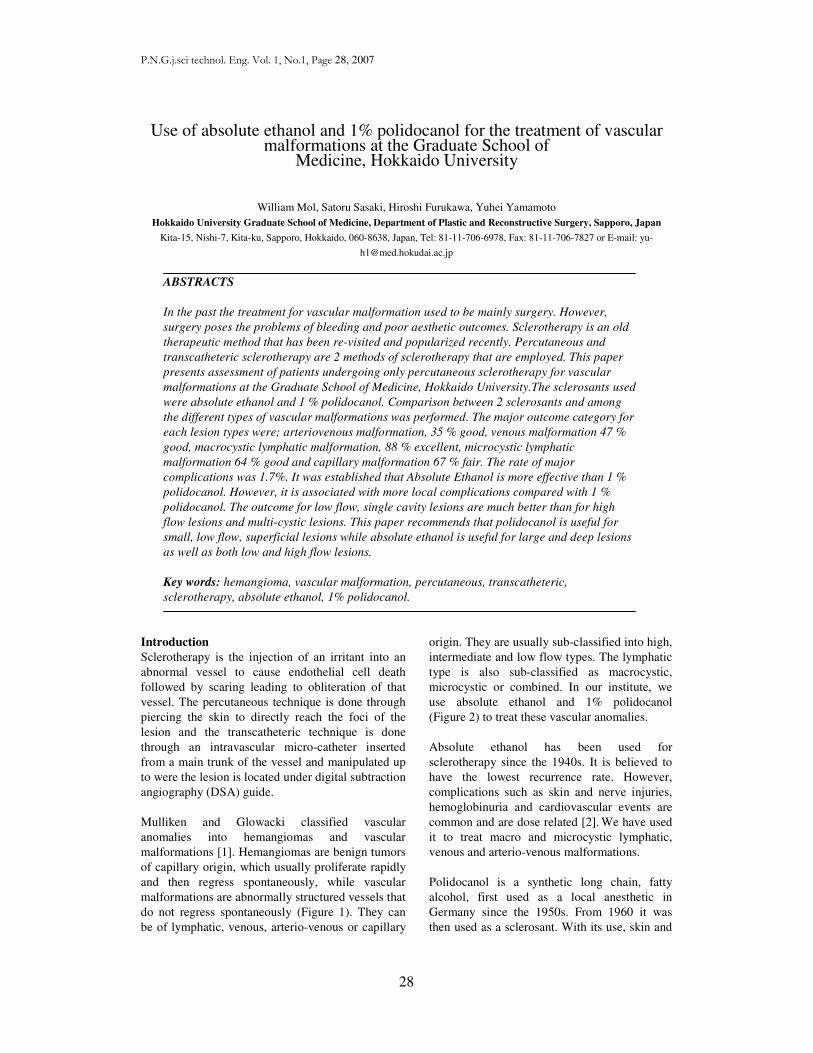
Mulliken and Glowacki classified vascular
anomalies into hemangiomas and vascular
malformations [1]. Hemangiomas are benign tumors
of capillary origin, which usually proliferate rapidly
and then regress spontaneously, while vascular
malformations are abnormally structured vessels that
do not regress spontaneously (Figure 1). They can
be of lymphatic, venous, arterio-venous or capillary
origin. They are usually sub-classified into high,
intermediate and low flow types. The lymphatic
type is also sub-classified as macrocystic,
microcystic or combined. In our institute, we
use absolute ethanol and 1% polidocanol
(Figure 2) to treat these vascular anomalies.
Absolute ethanol has been used for
sclerotherapy since the 1940s. It is believed to
have the lowest recurrence rate. However,
complications such as skin and nerve injuries,
hemoglobinuria and cardiovascular events are
common and are dose related [2]. We have used
it to treat macro and microcystic lymphatic,
venous and arterio-venous malformations.
Polidocanol is a synthetic long chain, fatty
alcohol, first used as a local anesthetic in
Germany since the 1950s. From 1960 it was
then used as a sclerosant. With its use, skin and
P.N.G.j.sci technol. Eng. Vol. 1, No.1, Page 29, 2007
29
nerve injuries are rare. However, clinically, from our
experience, it is not as effective as absolute ethanol.
We have used it to treat small and superficial venous
and venous-capillary malformations. Few cases of
reversible cardiac arrest have been reported with its
use and are also dose related [3].
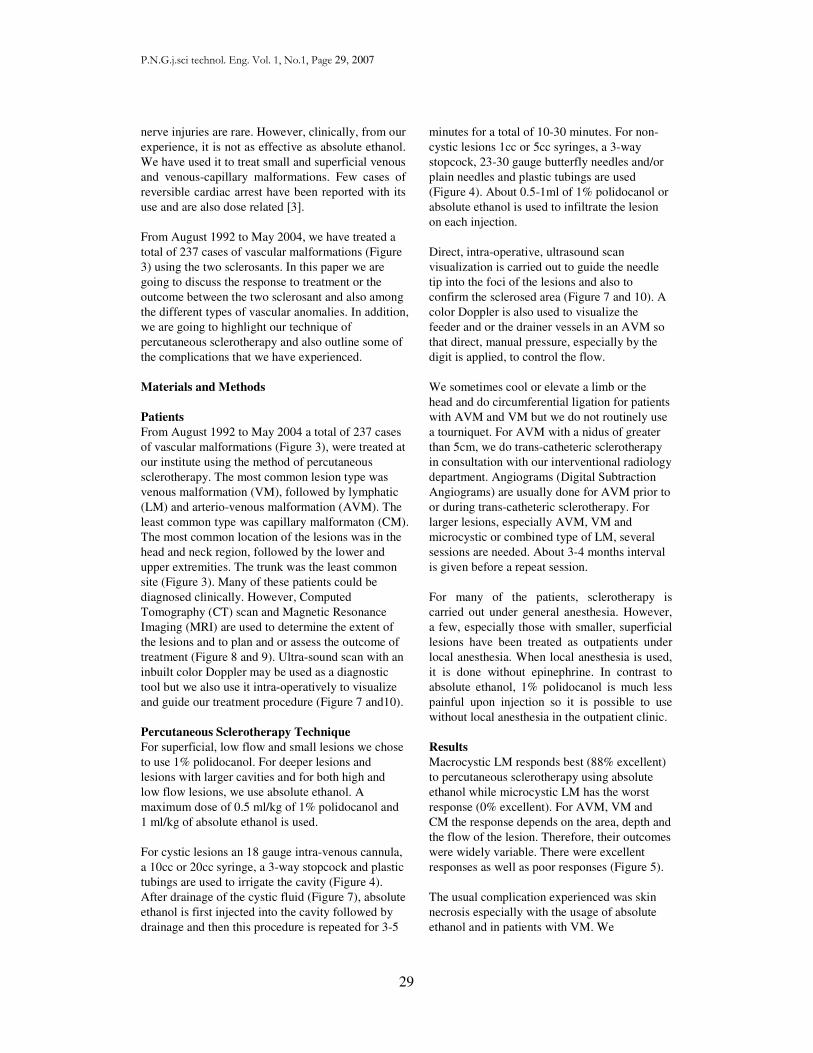
From August 1992 to May 2004, we have treated a
total of 237 cases of vascular malformations (Figure
3) using the two sclerosants. In this paper we are
going to discuss the response to treatment or the
outcome between the two sclerosant and also among
the different types of vascular anomalies. In addition,
we are going to highlight our technique of
percutaneous sclerotherapy and also outline some of
the complications that we have experienced.
Materials and Methods
Patients
From August 1992 to May 2004 a total of 237 cases
of vascular malformations (Figure 3), were treated at
our institute using the method of percutaneous
sclerotherapy. The most common lesion type was
venous malformation (VM), followed by lymphatic
(LM) and arterio-venous malformation (AVM). The
least common type was capillary malformaton (CM).
The most common location of the lesions was in the
head and neck region, followed by the lower and
upper extremities. The trunk was the least common
site (Figure 3). Many of these patients could be
diagnosed clinically. However, Computed
Tomography (CT) scan and Magnetic Resonance
Imaging (MRI) are used to determine the extent of
the lesions and to plan and or assess the outcome of
treatment (Figure 8 and 9). Ultra-sound scan with an
inbuilt color Doppler may be used as a diagnostic
tool but we also use it intra-operatively to visualize
and guide our treatment procedure (Figure 7 and10).
Percutaneous Sclerotherapy Technique
For superficial, low flow and small lesions we chose
to use 1% polidocanol. For deeper lesions and
lesions with larger cavities and for both high and
low flow lesions, we use absolute ethanol. A
maximum dose of 0.5 ml/kg of 1% polidocanol and
1 ml/kg of absolute ethanol is used.
For cystic lesions an 18 gauge intra-venous cannula,
a 10cc or 20cc syringe, a 3-way stopcock and plastic
tubings are used to irrigate the cavity (Figure 4).
After drainage of the cystic fluid (Figure 7), absolute
ethanol is first injected into the cavity followed by
drainage and then this procedure is repeated for 3-5
minutes for a total of 10-30 minutes. For non-
cystic lesions 1cc or 5cc syringes, a 3-way
stopcock, 23-30 gauge butterfly needles and/or
plain needles and plastic tubings are used
(Figure 4). About 0.5-1ml of 1% polidocanol or
absolute ethanol is used to infiltrate the lesion
on each injection.
Direct, intra-operative, ultrasound scan
visualization is carried out to guide the needle
tip into the foci of the lesions and also to
confirm the sclerosed area (Figure 7 and 10). A
color Doppler is also used to visualize the
feeder and or the drainer vessels in an AVM so
that direct, manual pressure, especially by the
digit is applied, to control the flow.
We sometimes cool or elevate a limb or the
head and do circumferential ligation for patients
with AVM and VM but we do not routinely use
a tourniquet. For AVM with a nidus of greater
than 5cm, we do trans-catheteric sclerotherapy
in consultation with our interventional radiology
department. Angiograms (Digital Subtraction
Angiograms) are usually done for AVM prior to
or during trans-catheteric sclerotherapy. For
larger lesions, especially AVM, VM and
microcystic or combined type of LM, several
sessions are needed. About 3-4 months interval
is given before a repeat session.
For many of the patients, sclerotherapy is
carried out under general anesthesia. However,
a few, especially those with smaller, superficial
lesions have been treated as outpatients under
local anesthesia. When local anesthesia is used,
it is done without epinephrine. In contrast to
absolute ethanol, 1% polidocanol is much less
painful upon injection so it is possible to use
without local anesthesia in the outpatient clinic.
Results
Macrocystic LM responds best (88% excellent)
to percutaneous sclerotherapy using absolute
ethanol while microcystic LM has the worst
response (0% excellent). For AVM, VM and
CM the response depends on the area, depth and
the flow of the lesion. Therefore, their outcomes
were widely variable. There were excellent
responses as well as poor responses (Figure 5).
The usual complication experienced was skin
necrosis especially with the usage of absolute
ethanol and in patients with VM. We
P.N.G.j.sci technol. Eng. Vol. 1, No.1, Page 30, 2007
30
experienced only two cases of cardiovascular shock
out of 35 cases of microcystic LM with the usage of
1% polidocanol. However, they were promptly
managed and recovered uneventfully. Overall,
complications are common with the usage of
absolute ethanol and in patients with VM (Figure 6).
The rate of major complications (pulmonary
embolism, acute tubular necrosis, large skin necrosis,
requiring operation twice, prolonged anesthesia etc.)
was 1.3% in VM and 0.4% in AVM thus, giving a
total of 1.7% between both sclerosants. The
complication rate was calculated from a larger series
of patients than the 237 cases that was analyzed
initially.
Discussion
Sclerotherapy is a form of minimally invasive,
effective and safe method to treat vascular
malformations. Economically, it is a cost effective
method. The hospital stay is short and there is good
aesthetic outcome, compared to surgical excisions.
However, surgical excision and reconstruction is
sometimes required for those few, large, non-
responsive lesions.
With superficial and low flow lesions, 1%
polidocanol is recommended and with deep and high
flow lesions, absolute ethanol is recommended.
Sometimes for very superficial CM, a pulse dye
laser is indicated (Figure 11). Care and experience is
needed to minimize the few expected complications.
Conclusion
In our series, we have achieved a good overall
outcome so we would like to recommend the use of
absolute ethanol and 1% polidocanol in
percutaneous sclerotherapy for the treatment of
vascular malformations.
William Mol, MBBS, Satoru Sasaki, MD, PHD,
Hiroshi Furukawa MD, Yuhei Yamamoto MD, PHD
have indicated no significant interest with
commercial supporters.
References
[1] Mulliken JB, Glowacki J. Hemangiomas and
vascular malformations in infants and
children: a classification based on endothelial
characteristics. Plast Reconstr Surg
1982;69:412-22.
[2] Mason KP, Michna E, Juraskowski D, et al.
Serum ethanol levels in children and
adults after ethanol embolization or
sclerotherapy for vascular anomalies. Radiology
2000;217 :127-32.
[3] Marrocco-Trischitta M, Guerrini P, Abeni D,
et al. Reversible cardiac arrest after polidocanol
sclerotherapy of peripheral venous
malformation. Dermatol Sur
2002;28:153-5.
P.N.G.j.sci technol. Eng. Vol. 1, No.1,Page 31, 2007
LIST OF FIGURES
Figure 1. A summary of the modern classification system for vascular anomalies by
Mulliken and Glowacki.
Figure 2. The number of cases and the type of vascular malformations and their locations.
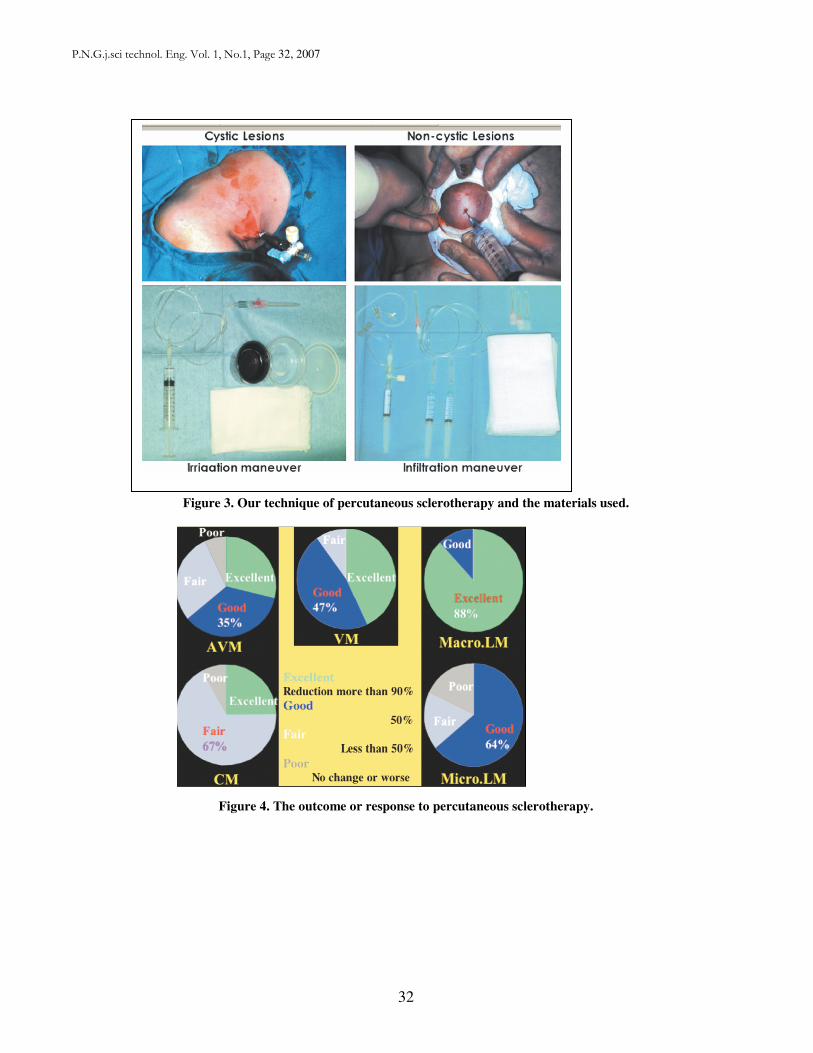
P.N.G.j.sci technol. Eng. Vol. 1, No.1, Page 32, 2007
32
Figure 3. Our technique of percutaneous sclerotherapy and the materials used.
Figure 4. The outcome or response to percutaneous sclerotherapy.
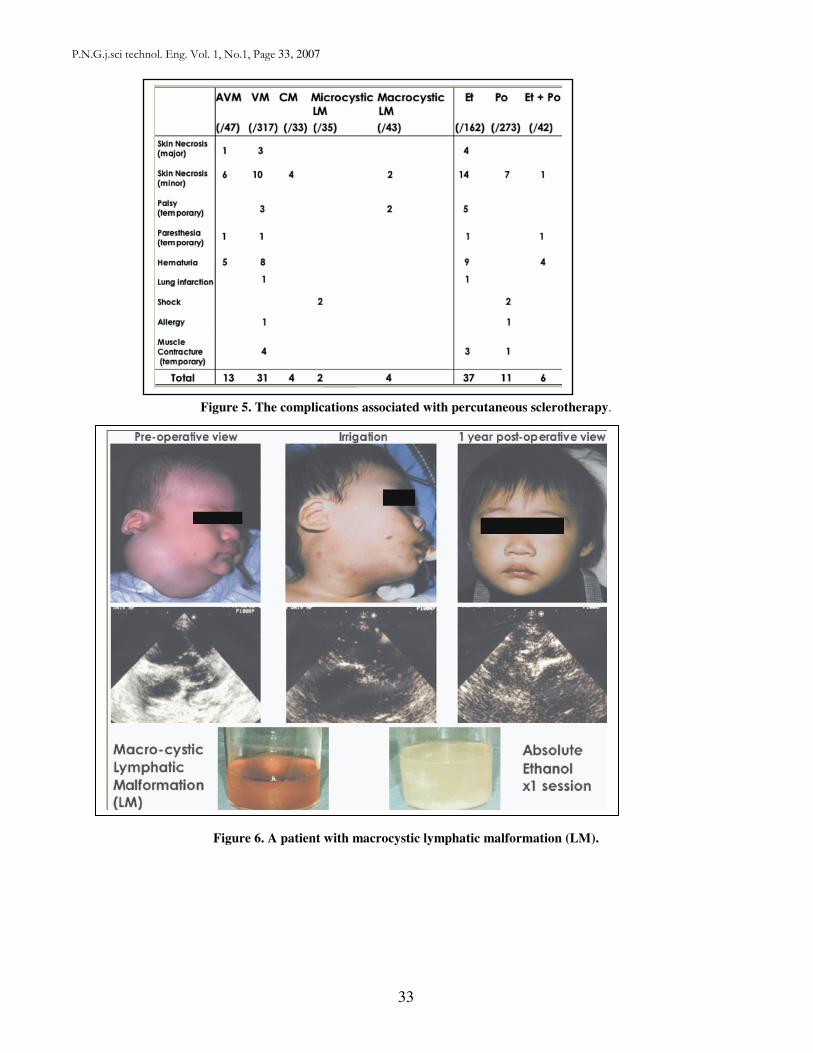
P.N.G.j.sci technol. Eng. Vol. 1, No.1, Page 33, 2007
33
Figure 5. The complications associated with percutaneous sclerotherapy.
Figure 6. A patient with macrocystic lymphatic malformation (LM).
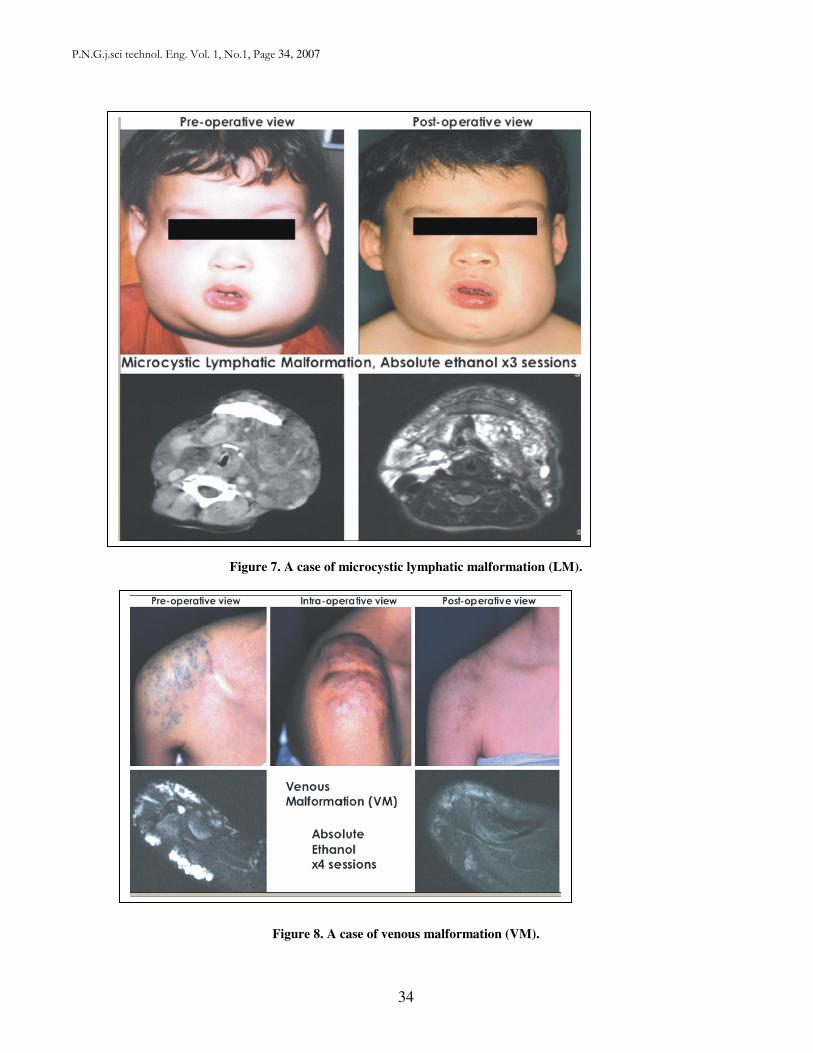
P.N.G.j.sci technol. Eng. Vol. 1, No.1, Page 34, 2007
34
Figure 7. A case of microcystic lymphatic malformation (LM).
Figure 8. A case of venous malformation (VM).
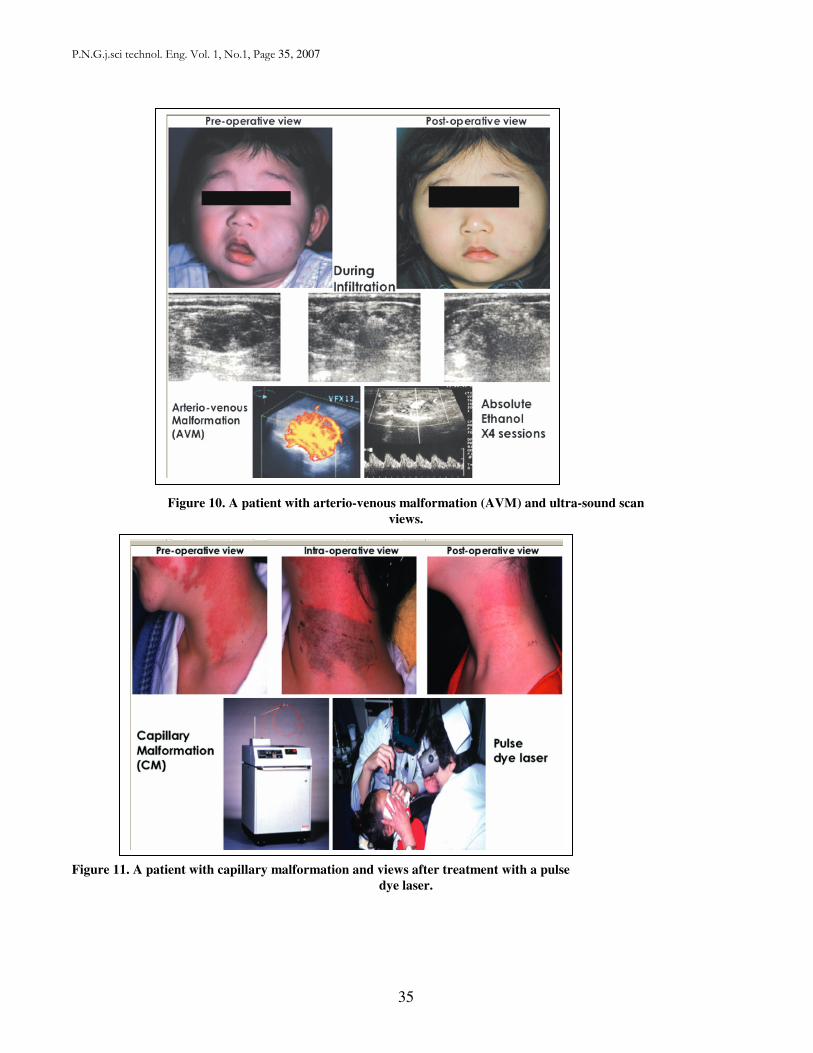
P.N.G.j.sci technol. Eng. Vol. 1, No.1, Page 35, 2007
35
Figure 10. A patient with arterio-venous malformation (AVM) and ultra-sound scan
views.
Figure 11. A patient with capillary malformation and views after treatment with a pulse
dye laser.

P.N.G.j.sci technol. Eng. Vol. 1, No.1, Page 36, 2007
36
P.N.G.j.sci technol. Eng. Vol. 1, No.1, Page 37, 2007
37
INFORMATION FOR CONTRIBUTORS
Papua New Guinea JOURNAL OF SCIENCE, TECHNOLOGY AND ENGINEERING.
ISSN: 1993-7687
Publisher: VotexPNG LTD
Edited by: Papua New Guinea Society of Scholars and Professionals.
Scope: Papua New Guinea JOURNAL of SCIENCE, TECHNOLOGY And ENGINEERING is published quarterly by VortexPNG LTD
and is dedicated to publishing original research, commentaries and letters concerning life sciences, natural sciences, technology and
engineering in PNG and the South Pacific.
The journal covers these broad sections:
Life sciences: Clinical Medicine, Basic Medical Sciences – Anatomy, Physiology, Biochemistry, Pathology (which includes Immunology,
Microbiology, Clinical Chemistry and Hematology). Natural sciences: Agriculture, Fisheries, Forestry Environmental Sciences,
Oceanography, Geo-Sciences, Biology, Ecology and Chemistry. Information Technology, Engineering.
Criteria for publication:
Manuscripts have to be, as much as possible, in relevance to PNG and the SP. However, other manuscripts will be accepted based on its
potential application to PNG and the SP.
PNG JSTC is published quarterly. Authors have to submit articles 2 months before an issue is made available (e.g. for publishing in the
first quarter, articles have to be submitted before end of February). Later submissions will be published in the following issue. If
circumstances permit, special volumes will be prepared.
Submission of manuscripts: Manuscripts must be of original research, commentaries or letters and must be submitted as attachment files
via email direct to the editors.
Manuscripts Formats.
Manuscript must be typed using Times New Roman or Arial Fonts. The main Title must be font size of 14pts. The rest of the manuscript
must be typed with a standard font size of 12pts and single-spaced paragraphing. Abstract must have a maximum of 350 words with at
least six key words appearing below the abstract, before the Introduction.
Tables must appear at the end of the reference page and appropriately referenced with in the manuscripts. Figures must be emailed as
separate attachments. It is essential that a list of figure numbers and appropriate captions must be provided at the end of the manuscript.
The figure list must be clearly titled as Figure Captions.
Citation: journals should be cited in the text should be the same way as in traditional journals (i.e. author, year). Books cited in text also in
the same way. If a website is cited in text, the full URL must be given in the reference section.
Referencing: Same as in traditional journals i.e. journals – authors, article title, journal title, year; vol:issue: pp. Books – author(of book or
chapter), chapter title, In book title, vol: edition, editor, publisher, year, pp.
P.N.G.j.sci technol. Eng. Vol. 1, No.1, Page 38, 2007
38
References should be listed in the following style:
Singh P, Bengtsson L. 2004. Hydrological sensitivity of a large Himalayan basin to climate change. Hydrological Processes 18: 2363-
2385..
Hillel D. 1980. In Applications of Soil Physics. Academic Press: New York; 385.
Holster H. 1978. Mathematical modelling of tidal flats: a few remarks. In Mathematical Modelling of Estuarine Physics, Sundermann J, Holz KP (eds). Springer- Verlag: Berlin; 173-177.
If a website is referenced the title of the website plus the full URL should be given with the last date viewed in brackets. E.g PNG Society
for Scholars and Professionals, www.vortexpng.com (last viewed 03-03-07).
Indexing and archiving: issues will be available on www.vortexpng.com and made into CDs for distribution.
Copyright: by submitting an article to PNGJSTE the authors declare that PNGJSTE will hold copyright to all articles published by the
journal.
Abbreviated key title: P.N.G.j.sci technol. eng
Copyright © The Papua New Guinea Society of Scholars and Professionals/VortexPNG LTD
To publish work done by members of the PNG-SP Academy of Science and Technology. To promote scholarly communication between members of PNG-SP Academy of Science and Technology on science and technology matters.
To provide expert commentaries on matters of science and technology concerning PNG and SP.

P.N.G.j.sci technol. Eng. Vol. 1, No.1, Page 39, 2007
39