Embed Size (px)
Citation preview

J. agric. Engng Res. (2001) 78 (4), 347}358doi:10.1006/jaer.2000.0660, available online at http://www.idealibrary.com onPA*Precision Agriculture
Agricultural Sprays in Cross-#ow and Drift
M. Farooq1; R. Balachandar1; D. Wulfsohn2; T. M. Wolf 3
1College of Engineering, University of Saskatchewan, Saskatoon, SK, Canada S7N 5A9; e-mail of corresponding author: [email protected] of Mechanical Engineering, Aalborg University, Pontoppidanstrode 101, DK-9220 Aalborg East, Denmark; e-mail: [email protected]
3Agriculture and Agri-Food Canada, 107 Science Place, Saskatoon, SK, Canada S7N 0X2: e-mail: [email protected]
(Received 15 January 2000; accepted in revised form 19 October 2000; published online 12 February 2001)
The droplet size and velocity characteristics of an agricultural spray were studied in a wind tunnel in thepresence of a non-uniform cross-#ow. The spray was generated at three nozzle-operating pressures. The dropletsize and velocity was measured in both the cross-#ow direction and the vertical direction using a phase Dopplerparticle analyser.
From the size}velocity measurements, it was found that many droplets immediately behind the spray sheetwere found to be travelling in a direction opposite to the cross-#ow. Further away from the nozzle, some smalldroplets had a velocity directed upwards. A size}velocity correlation factor was adopted to discuss the potentialdrift of the droplets. For the lower pressure, at a distance of 100 mm below the nozzle exit, the droplets are proneto drift at all downstream locations. At the higher pressure, the droplets are prone to drift beyond a distanceratio (x/z) of two. Here, x is the distance in the cross-#ow direction and z is the vertical distance below the nozzleexit. The behaviour of droplets of two particular size classes (&38 and 70 lm) were also investigated and foundthat the smaller droplets were subjected to an increased cross-#ow e!ect.
( 2001 Silsoe Research Institute
1. Introduction
The continuous evolution of crop protection tech-niques has resulted in today's extended use of agrochemi-cals. The vast majority of crop protection agents used inCanada are foliar applied liquid sprays (Wolf, 1997).These chemicals need to be applied in the most e$cientand e!ective manner. A large number of the new chemi-cals are considered to be environmentally friendly. How-ever, the increased use of non-selective or highly activeproducts nonetheless heightens the risk of damage tonon-target crops and to the ecosystem. Drift of agro-chemicals is considered as one of the major contributorsto harmful use of chemicals. Spray drift is a function ofmeteorological conditions such as wind speed, temper-ature and relative humidity and of application parame-ters such as spray quality, nozzle height and operatingpressure. For an e$cient and e!ective application, a suit-able combination of application parameters is desiredfor a set of meteorological conditions. New and promis-ing low-drift spray technologies have recently been
0021-8634/01/040347#12 $35.00/0 34
developed, but there is not yet a formal system for evalu-ating and implementing these innovations.
Spray drift prevention is a particularly important con-cern for Canadian regulatory agencies. All new registra-tions in Canada are subject to bu!er zones adjacent tosensitive non-target areas such as bodies of water orshelterbelts, commensurate with their toxicity. Producerswho need to manage pests in the bu!er zones are lookingfor pragmatic, environmentally acceptable alternatives.Low-drift nozzles are one of the possible solutions.Although these nozzles are proven e!ective at reducingdrift, the body of research is small and little is knownabout the relative e!ectiveness of various sprays undera range of operating conditions.
1.1. Sprays in cross--ow
As part of the e!ort to enhance the e!ectivenessof chemical application, studies have been conductedto understand the behaviour of spray droplets in the
7 ( 2001 Silsoe Research Institute

348 M. FAROOQ E¹ A¸ .
Notation
di
diameter of droplet i, lmD
10mean diameter of all droplets, lm
D30
volume mean diameter of all droplets,lm
N total number of droplets sampledP1, P
2, P
3spray operating pressure, kPa
; cross-#ow air velocity< mean velocity of all droplets, m s~1<dx
mean horizontal velocity of a particulardroplet size, m s~1
<i
mean velocity of droplet i, m s~1<x
mean horizontal velocity of all dropletsm s~1
<z
mean vertical velocity of all droplets,m s~1
<z(axial)
mean vertical velocity of droplets alongnozzle axis, m s~1
x distance along the X-axis, mmz distance along the Z-axis, mm
oh
droplet size}horizontal velocity cor-relation coe$cient
ov
droplet size}vertical velocity correla-tion coe$cient
pd
diameter standard deviationpv
velocity standard deviation
presence of wind over the crop canopy. Goering et al.(1972) and Marchant (1977) analysed the forces ona single droplet in a spray and developed equations topredict the trajectory of a droplet of known size andvelocity injected into uniform wind. However Goeringet al. (1972) showed substantial decrease in drag anddeceleration due to air currents induced by the movingdroplets. It has been reported that the velocity of dropletsin a group will increase due to their mutual interactions,and the larger the swarm of droplets, the faster it willmove (Happel & Brenner, 1965; Thompson & Ley, 1983;Longmire & Eaton, 1992).
Several analytical studies have been carried out usingapproaches such as random-walk models (Hall, 1975;Reid, 1979; Ley, 1982; Thompson & Ley, 1982; Walklate,1992; Miller & Had"eld, 1989; Reichard et al., 1992). Inall these studies, droplet movement was simulated inisolation without considering the wind velocity variationwith height above the crop canopy and mutual interac-tion of the droplets.
Ghosh and Hunt (1998) theoretically analysed the inter-action of crosswind and spray comprising of droplets andair movement induced by these droplets. They used vari-ous ratios of crosswind speed to the induced air speed.This interaction and the distances by which the dropletsare de#ected were found to depend largely on the windspeed ratio. Also, quite di!erent patterns of air#ow anddroplet dispersion occurred at di!erent distances fromthe nozzle depending upon the wind speed ratios.
1.2. Jets in cross--ow
A number of studies have been conducted to study thebehaviour of jets in cross-#ow. Moussa et al. (1977)studied the general characteristics of a round jet in cross-#ow and explained the development of the wake down-
stream of the jet as well as the process of air entrainment.They found that close to the nozzle, the freestream uponreaching the jet de#ects around the boundary andaccelerates to twice the free-stream velocity. Sykes et al.(1986) numerically studied the #ow of a round turbulentjet emitted normal to a freestream and found the initialjet as acting like a solid cylinder around which the frees-tream separates. They also showed a deceleration of #owon the upstream with acceleration around and a reverse#ow region downstream of the jet. The vertical velocitystudy shows a signi"cant upward velocity in the lee of thejet indicating wake convergence. This is the entrainmentmechanism which brings the ambient #uid into the jet.Kelso et al. (1996) studied the round jets in cross-#owusing #ow visualization and #ying hot-wire measure-ments and found similar structure as of Sykes et al.(1986). Coelho and Hunt (1989) studied the near "eld ofa strong jet in cross-#ow using a three-dimensionalvortex sheet model and showed that the main transversevorticity is distorted by the generation of additional axialvorticity due to a pressure gradient induced by the exter-nal #ow. They also showed the convection of both com-ponents of vorticity from the upwind side of the jet to itsdownwind side.
Little is understood as to what happens to dropletsinside a spray when a group of droplets is released ata location of higher wind velocity in a variable velocitypro"le. In this study, the size and velocity characteristicsof droplets in a spray released from an agricultural nozzlein the shear layer of a non-uniform cross-#ow were exper-imentally investigated with reference to their driftability.
2. Experimental equipment and procedure
The present experiments were conducted using a singlenozzle in a wind tunnel facility. A simple schematic of the

Fig. 1. Coordinate system: U, crosswind velocity; Vx, droplet
velocity in X direction; Vz, droplet velocity in Z direction; z,
distance along Z-axis
Fig. 3. Upstream wind proxle
AGRICULTURAL SPRAYS 349
#ow along with the established coordinate system isshown in Fig. 1. The wind tunnel is a newly designedfacility intended to study the characteristics of sprays anddroplet-laden jets (Fig. 2). As discussed in detail byFarooq (1995) and Farooq et al. (1996), the wind tunnel isan open-circuit type and has a 4 m long test section. Thecross-section of the wind tunnel increases from 0)91 m by0)91 m at the entrance to 1 m by 1 m at the exit with theslope of 0)53 to help reduce the e!ect of the wind tunnelwall boundary layer. The sidewalls of the test section aresee-through that facilitate visual observation and alsoprovide optical access to the non-intrusive laser-basedinstrumentation. Wind speeds from 0 to 10 m s~1 can begenerated with the help of a variable speed suction fan.The variable resistance #ow straighteners on both ends ofthe test section helped to minimize turbulence and tosimulate the wind speed pro"le over a crop canopy.A laser Doppler anemometer (Dantec, Inc.), described byBalachandar et al. (1998) was used to measure the windspeed pro"le in the test section. Using smoke for seedingthe cross-#ow, wind velocity measurements were taken0)3 m upstream of the nozzle location. The nominalcross-#ow wind pro"le, in the absence of a nozzle, isshown in Fig. 3. This pro"le was chosen to generatea high shear #ow.
Fig. 2. Schematic of wind tunnel facility
A commercially available 803 medium spray agricul-tural #at fan nozzle (#ow rate of 0)09 l s~1 at a pressure of275 kPa) having an oblong ori"ce with equivalent diame-ter of 1)1 mm was used in this study. In the study, threenozzle operating pressures (P
1"150, P
2"275 and
P3"400 kPa) were used while the cross-#ow wind
pro"le was kept constant. The nozzle outlet, dischargingvertically downward was located 0)5 m above the windtunnel #oor.
The size and velocity of the droplets in the spray weremeasured using an Aerometrics (Sunnyvale, CA) phaseDoppler particle analyser (PDPA). First described byBachalo and Houser (1984) the PDPA has been discussedin detail by Wolf et al. (1995). The PDPA was installed ona frame separate from the wind tunnel to avoid thetransmission of vibration of the tunnel to the PDPA.Transmitter and receiver could be moved independentlyalong the Z-axis while the frame could be moved alongthe X-axis (cross-#ow direction). The mounting frame forthe transmitter was built so that the transmitter could bepositioned in such a way that droplet velocity and sizecould be measured along both the X- and Z-axis.
The optical con"guration of the PDPA consisted ofa 160 mm collimating lens and a 1016-mm transmissionlens. The photomultiplier tube voltage for the experi-ments was set at 310 V, which was varied slightly tomaximize con"rmation rate of the system. Diameterrange for the measurements was selected as 15)8 to552 lm and velocity range from !2)6 to 20 m s~1 witha velocity o!set of 5 m s~1. Due to the large variation ofdroplet number densities between the measurement loca-tions and to avoid excessive acquisition time at locationsof low densities such as edges of the spray, sampling wasset to terminate after 20 000 validated samples or the datatime of 5 min.
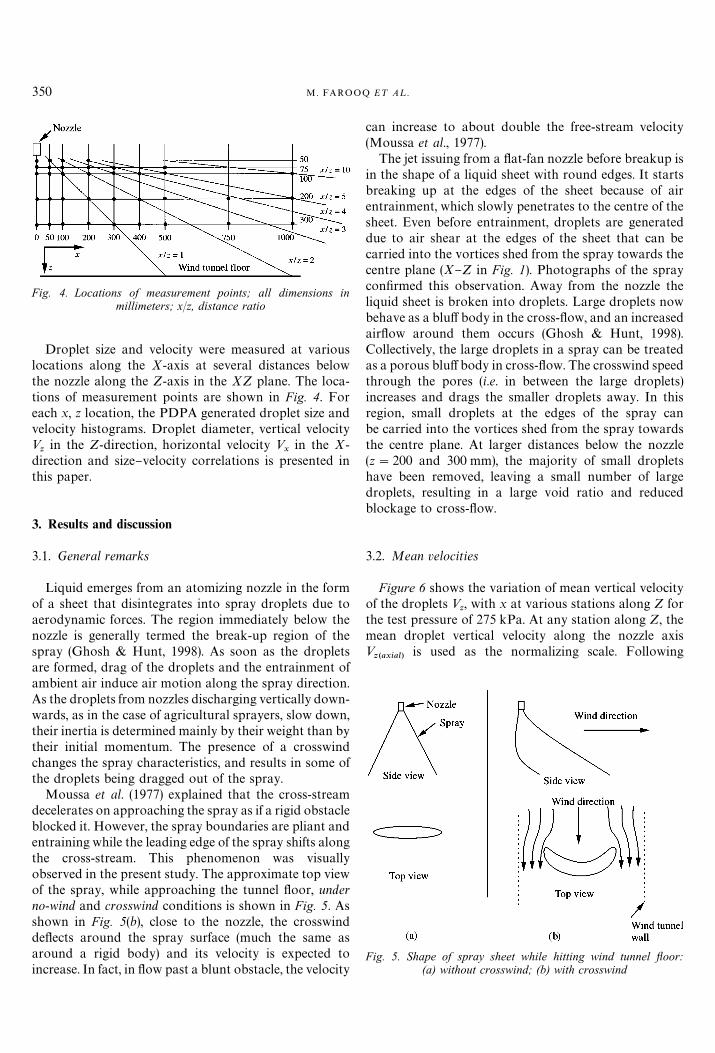
Fig. 4. Locations of measurement points; all dimensions inmillimeters; x/z, distance ratio
Fig. 5. Shape of spray sheet while hitting wind tunnel yoor:(a) without crosswind; (b) with crosswind
350 M. FAROOQ E¹ A¸ .
Droplet size and velocity were measured at variouslocations along the X-axis at several distances belowthe nozzle along the Z-axis in the XZ plane. The loca-tions of measurement points are shown in Fig. 4. Foreach x, z location, the PDPA generated droplet size andvelocity histograms. Droplet diameter, vertical velocity<z
in the Z-direction, horizontal velocity <x
in the X-direction and size}velocity correlations is presented inthis paper.
3. Results and discussion
3.1. General remarks
Liquid emerges from an atomizing nozzle in the formof a sheet that disintegrates into spray droplets due toaerodynamic forces. The region immediately below thenozzle is generally termed the break-up region of thespray (Ghosh & Hunt, 1998). As soon as the dropletsare formed, drag of the droplets and the entrainment ofambient air induce air motion along the spray direction.As the droplets from nozzles discharging vertically down-wards, as in the case of agricultural sprayers, slow down,their inertia is determined mainly by their weight than bytheir initial momentum. The presence of a crosswindchanges the spray characteristics, and results in some ofthe droplets being dragged out of the spray.
Moussa et al. (1977) explained that the cross-streamdecelerates on approaching the spray as if a rigid obstacleblocked it. However, the spray boundaries are pliant andentraining while the leading edge of the spray shifts alongthe cross-stream. This phenomenon was visuallyobserved in the present study. The approximate top viewof the spray, while approaching the tunnel #oor, underno-wind and crosswind conditions is shown in Fig. 5. Asshown in Fig. 5(b), close to the nozzle, the crosswindde#ects around the spray surface (much the same asaround a rigid body) and its velocity is expected toincrease. In fact, in #ow past a blunt obstacle, the velocity
can increase to about double the free-stream velocity(Moussa et al., 1977).
The jet issuing from a #at-fan nozzle before breakup isin the shape of a liquid sheet with round edges. It startsbreaking up at the edges of the sheet because of airentrainment, which slowly penetrates to the centre of thesheet. Even before entrainment, droplets are generateddue to air shear at the edges of the sheet that can becarried into the vortices shed from the spray towards thecentre plane (X}Z in Fig. 1). Photographs of the spraycon"rmed this observation. Away from the nozzle theliquid sheet is broken into droplets. Large droplets nowbehave as a blu! body in the cross-#ow, and an increasedair#ow around them occurs (Ghosh & Hunt, 1998).Collectively, the large droplets in a spray can be treatedas a porous blu! body in cross-#ow. The crosswind speedthrough the pores (i.e. in between the large droplets)increases and drags the smaller droplets away. In thisregion, small droplets at the edges of the spray canbe carried into the vortices shed from the spray towardsthe centre plane. At larger distances below the nozzle(z"200 and 300 mm), the majority of small dropletshave been removed, leaving a small number of largedroplets, resulting in a large void ratio and reducedblockage to cross-#ow.
3.2. Mean velocities
Figure 6 shows the variation of mean vertical velocityof the droplets <
z, with x at various stations along Z for
the test pressure of 275 kPa. At any station along Z, themean droplet vertical velocity along the nozzle axis<z(axial)
is used as the normalizing scale. Following

Fig. 6. Vertical velocity ratio (Vz/V
z(axial)) versus distance ratio (x/z) at various stations along the Z-axis at 275 kPa pressure;
, z"38 mm; , z"50 mm; , z"75 mm; , z"100 mm; , z"200 mm; , z"300 mm
AGRICULTURAL SPRAYS 351
Balachandar et al. (1998), the distance below the nozzlealong Z is used as the normalizing length scale. It isevident from this "gure that the data collapse fairly toa single curve except for the data at z of 38 mm. Thisindicates the attainment of a &similarity' pro"le that couldbe useful in modelling. Such similarity pro"les have beennoted in other droplet-laden jet studies. For clarity, thedata in the range 0(<
z/<
z(axial))0)16 has been re-plot-
ted as an inset to the "gure. As in Fig. 7, the mean dropletvertical velocity at the nozzle axis increased with z up toa z of 75 mm and then decreased. A similar increase indroplet velocity has been observed in earlier studies on
Fig. 7. Variation of vertical droplet velocity along the nozzle axis(Z-axis)
droplet-laden jets (Longmire & Eaton, 1992). Figure 8shows the variation in vertical velocity for operatingpressures of 150 and 400 kPa for z of 75 and 300 mm,respectively. The data for other Z stations are not shownhere for brevity. At z of 75 mm, the velocity data at lowerpressures nearly collapse to a single line beyond an x/zratio of 1)5 while at z of 300 mm, the data indicate verylittle variation. Using half-width, the location wheremean velocity is reduced to one-half of the maximumvelocity, one notes that at z of 300 mm, the relativespread of the spray is higher at the lower pressure(150 kPa). One would be tempted to conclude thatfurther away from the nozzle the spray is prone to moredrift at lower pressures.
Figure 9 shows the variation with x of the relativemean droplet horizontal velocity with respect toapproaching free-stream velocity at various stationsalong the Z-axis. As in Fig. 9 at the 38 mm axial station,the droplet horizontal velocities increased from thenozzle axis up to an x/z ratio of 1)5 and then decreasedwith a tendency to level o! to the free-stream velocity.Close inspection of the data indicated at this section thatat the nozzle axis (x"0), all the large and small dropletshad low velocities. At the next two x values along thestream-wise direction, only droplets below 100 lm hav-ing a high velocity were present. At other locations alongthe z"38 mm station, the droplets were also found to besmall but their velocity was lower than the velocity of thedroplets at x/z ratio of 1)5. At other axial stations(38 mm(z)300 mm), the velocities increased from thenozzle axis to a local maximum and levelled o! to the
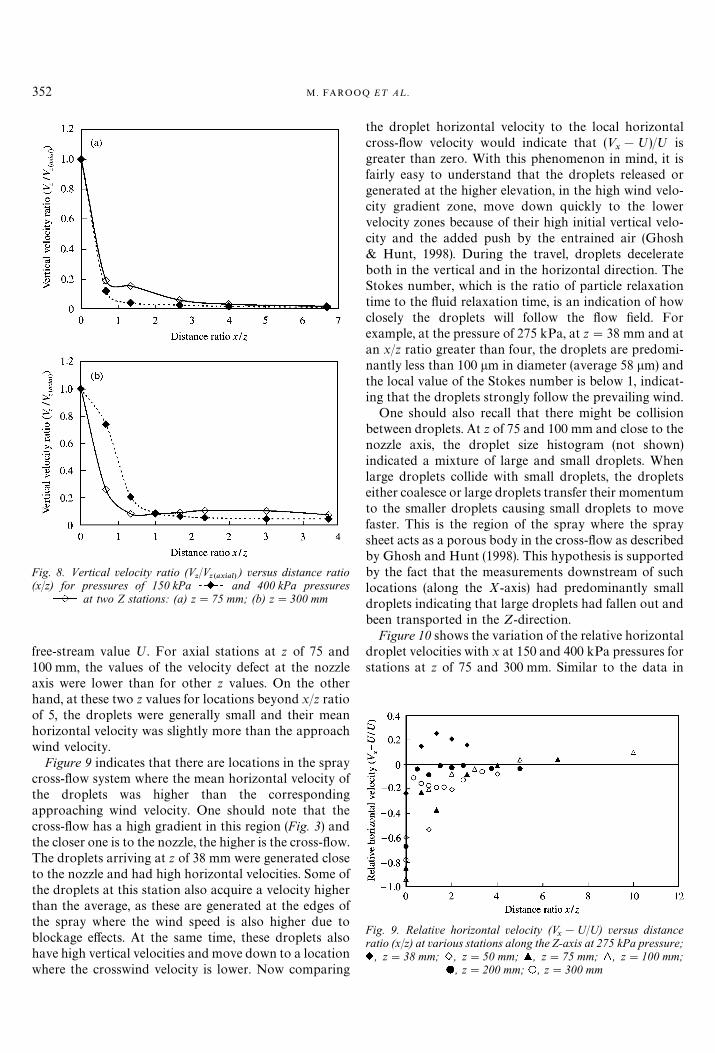
Fig. 8. Vertical velocity ratio (Vz/V
z(axial)) versus distance ratio
(x/z) for pressures of 150 kPa and 400 kPa pressuresat two Z stations: (a) z"75 mm; (b) z"300 mm
Fig. 9. Relative horizontal velocity (Vx!U/U) versus distance
ratio (x/z) at various stations along the Z-axis at 275 kPa pressure;, z"38 mm; , z"50 mm; , z"75 mm; , z"100 mm;
, z"200 mm; , z"300 mm
352 M. FAROOQ E¹ A¸ .
free-stream value ;. For axial stations at z of 75 and100 mm, the values of the velocity defect at the nozzleaxis were lower than for other z values. On the otherhand, at these two z values for locations beyond x/z ratioof 5, the droplets were generally small and their meanhorizontal velocity was slightly more than the approachwind velocity.
Figure 9 indicates that there are locations in the spraycross-#ow system where the mean horizontal velocity ofthe droplets was higher than the correspondingapproaching wind velocity. One should note that thecross-#ow has a high gradient in this region (Fig. 3) andthe closer one is to the nozzle, the higher is the cross-#ow.The droplets arriving at z of 38 mm were generated closeto the nozzle and had high horizontal velocities. Some ofthe droplets at this station also acquire a velocity higherthan the average, as these are generated at the edges ofthe spray where the wind speed is also higher due toblockage e!ects. At the same time, these droplets alsohave high vertical velocities and move down to a locationwhere the crosswind velocity is lower. Now comparing
the droplet horizontal velocity to the local horizontalcross-#ow velocity would indicate that (<
x!;)/; is
greater than zero. With this phenomenon in mind, it isfairly easy to understand that the droplets released orgenerated at the higher elevation, in the high wind velo-city gradient zone, move down quickly to the lowervelocity zones because of their high initial vertical velo-city and the added push by the entrained air (Ghosh& Hunt, 1998). During the travel, droplets decelerateboth in the vertical and in the horizontal direction. TheStokes number, which is the ratio of particle relaxationtime to the #uid relaxation time, is an indication of howclosely the droplets will follow the #ow "eld. Forexample, at the pressure of 275 kPa, at z"38 mm and atan x/z ratio greater than four, the droplets are predomi-nantly less than 100 lm in diameter (average 58 lm) andthe local value of the Stokes number is below 1, indicat-ing that the droplets strongly follow the prevailing wind.
One should also recall that there might be collisionbetween droplets. At z of 75 and 100 mm and close to thenozzle axis, the droplet size histogram (not shown)indicated a mixture of large and small droplets. Whenlarge droplets collide with small droplets, the dropletseither coalesce or large droplets transfer their momentumto the smaller droplets causing small droplets to movefaster. This is the region of the spray where the spraysheet acts as a porous body in the cross-#ow as describedby Ghosh and Hunt (1998). This hypothesis is supportedby the fact that the measurements downstream of suchlocations (along the X-axis) had predominantly smalldroplets indicating that large droplets had fallen out andbeen transported in the Z-direction.
Figure 10 shows the variation of the relative horizontaldroplet velocities with x at 150 and 400 kPa pressures forstations at z of 75 and 300 mm. Similar to the data in

Fig. 10. Relative horizontal velocity (Vx}U/U) versus distance
ratio (x/z) for pressures of 150 kPa and 400 kPa pressureat two Z stations: (a) z"75 mm; (b) z"300 mm
Fig. 11. Mean diameter along X-axis at various locations Z at275 kPa pressure; , z"38 mm; , z"50 mm; , z"75 mm;
, z"100 mm; , z"200 mm; , z"300 mm; , z"100 mm(horizontal measurement)
AGRICULTURAL SPRAYS 353
Fig. 9, the velocity was low along the nozzle axis. At z of75 mm, when the pressure was 150 kPa, the velocityincreased from the nozzle axis to location correspondingto x/z ratio of 0)6 and then decreased to level o! to ;. Asdiscussed in case of 275 kPa pressure, some of the drop-lets generated at the higher elevations will have arrived atthis location also and have a droplet velocity greater thanthe prevailing crosswind velocity. At pressure of 400 kPa,the velocity increased from a low value at the axis to levelo! to the wind velocity at x/z ratio of 2)6. At z of 300 mm,for 400 kPa pressure the velocity increased from thenozzle axis to level o! to wind speed at x/z ratio of 1)6 butinterestingly, for 150 kPa, the velocity remained belowthe freestream velocity. For z'50 mm, Figs 9 and 10indicate that the rate of change of the horizontal velocitywas very large and the droplets approached cross-#owvelocity in a very short distance.
At all locations along the nozzle axis, the velocityhistogram indicated that some of the droplets had nega-tive velocities. At the nozzle axis, at z of 75 and 100 mm,a big proportion of the droplets, small and large hadnegative horizontal velocities. Majority of the otherdroplets had very low positive velocities. The negativevelocity in the wake region was due to backward #ow of
some of the droplets downwind of the spray sheet. Thespray sheet also shielded the droplets in the wake regionfrom the e!ect of cross-#ow, thus limiting the horizontalvelocities to lower values.
3.3. Size}velocity correlation
Figure 11 shows the variation of droplet meandiameters D
10with x at various Z stations for the operat-
ing pressure of 275 kPa. The data shown in Fig. 11 wereacquired while measuring the vertical velocities. The valueof D
10increased with increasing distance below the
nozzle and decreased with the increasing distance down-wind of the nozzle. For validation purposes, the "gurealso shows the variation of D
10with x at z of 100 mm
obtained while measuring the horizontal velocities,which agrees well with the data obtained from verticalvelocity measurements at z of 100 mm. It can be notedthat at z of 50, 75 and 100 mm, there is a slight increase inthe mean droplet diameter with increasing distancebeyond x of 100 mm. The same trend was found forpressures of 150 and 400 kPa. It can also be seen that themean diameters tend to be the same towards the jetperiphery for all stations along Z.
Miller (1993) has de"ned spray drift as that proportionof the output from a sprayer that is de#ected by action ofwind. For this study, droplets are considered as havingdrifted if they do not deposit on a target surface withinthe prescribed distance from the nozzle. It is widelybelieved that small droplets are more prone to driftcompared to larger droplets. Rather, a small dropletmoving with low velocity has lower probability of driftthan a large droplet with large velocity in the cross-#owdirection. The magnitudes as well as the direction of
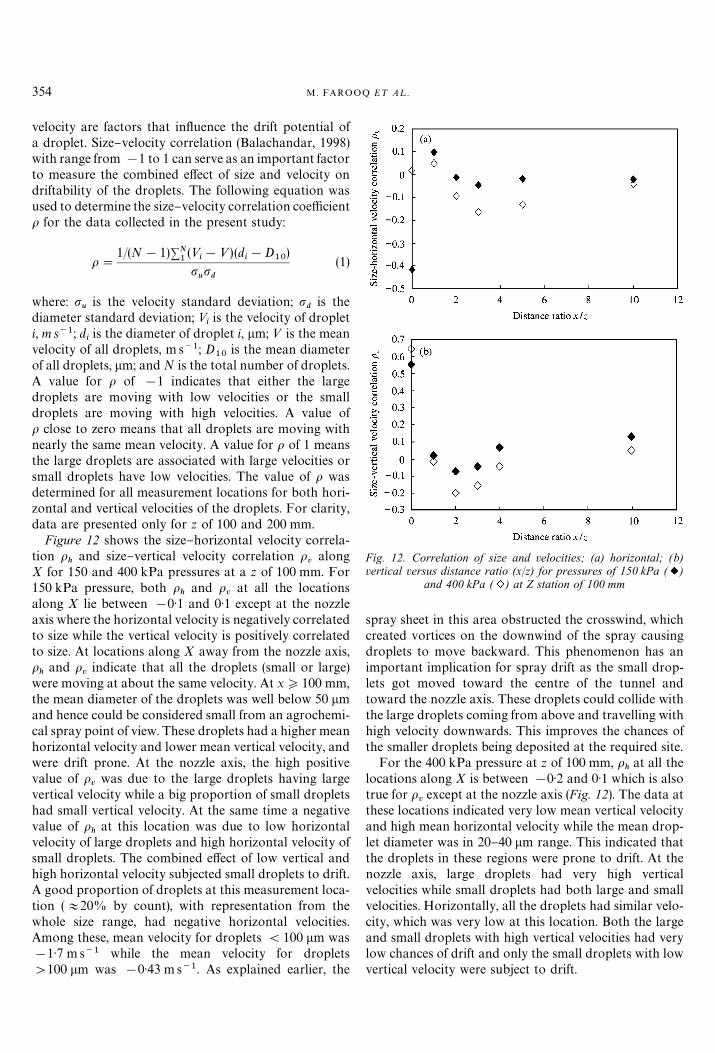
Fig. 12. Correlation of size and velocities; (a) horizontal; (b)vertical versus distance ratio (x/z) for pressures of 150 kPa ( )
and 400 kPa ( ) at Z station of 100 mm
354 M. FAROOQ E¹ A¸ .
velocity are factors that in#uence the drift potential ofa droplet. Size}velocity correlation (Balachandar, 1998)with range from !1 to 1 can serve as an important factorto measure the combined e!ect of size and velocity ondriftability of the droplets. The following equation wasused to determine the size}velocity correlation coe$ciento for the data collected in the present study:
o"1/(N!1)+N
1(<
i!<)(d
i!D
10)
pupd
(1)
where: pu
is the velocity standard deviation; pd
is thediameter standard deviation; <
iis the velocity of droplet
i, m s~1; diis the diameter of droplet i, lm; < is the mean
velocity of all droplets, m s~1; D10
is the mean diameterof all droplets, lm; and N is the total number of droplets.A value for o of !1 indicates that either the largedroplets are moving with low velocities or the smalldroplets are moving with high velocities. A value ofo close to zero means that all droplets are moving withnearly the same mean velocity. A value for o of 1 meansthe large droplets are associated with large velocities orsmall droplets have low velocities. The value of o wasdetermined for all measurement locations for both hori-zontal and vertical velocities of the droplets. For clarity,data are presented only for z of 100 and 200 mm.
Figure 12 shows the size}horizontal velocity correla-tion o
hand size}vertical velocity correlation o
valong
X for 150 and 400 kPa pressures at a z of 100 mm. For150 kPa pressure, both o
hand o
vat all the locations
along X lie between !0)1 and 0)1 except at the nozzleaxis where the horizontal velocity is negatively correlatedto size while the vertical velocity is positively correlatedto size. At locations along X away from the nozzle axis,oh
and ov
indicate that all the droplets (small or large)were moving at about the same velocity. At x*100 mm,the mean diameter of the droplets was well below 50 lmand hence could be considered small from an agrochemi-cal spray point of view. These droplets had a higher meanhorizontal velocity and lower mean vertical velocity, andwere drift prone. At the nozzle axis, the high positivevalue of o
vwas due to the large droplets having large
vertical velocity while a big proportion of small dropletshad small vertical velocity. At the same time a negativevalue of o
hat this location was due to low horizontal
velocity of large droplets and high horizontal velocity ofsmall droplets. The combined e!ect of low vertical andhigh horizontal velocity subjected small droplets to drift.A good proportion of droplets at this measurement loca-tion (+20% by count), with representation from thewhole size range, had negative horizontal velocities.Among these, mean velocity for droplets (100 lm was!1)7 ms~1 while the mean velocity for droplets'100 lm was !0)43 ms~1. As explained earlier, the
spray sheet in this area obstructed the crosswind, whichcreated vortices on the downwind of the spray causingdroplets to move backward. This phenomenon has animportant implication for spray drift as the small drop-lets got moved toward the centre of the tunnel andtoward the nozzle axis. These droplets could collide withthe large droplets coming from above and travelling withhigh velocity downwards. This improves the chances ofthe smaller droplets being deposited at the required site.
For the 400 kPa pressure at z of 100 mm, ohat all the
locations along X is between !0)2 and 0)1 which is alsotrue for o
vexcept at the nozzle axis (Fig. 12). The data at
these locations indicated very low mean vertical velocityand high mean horizontal velocity while the mean drop-let diameter was in 20}40 lm range. This indicated thatthe droplets in these regions were prone to drift. At thenozzle axis, large droplets had very high verticalvelocities while small droplets had both large and smallvelocities. Horizontally, all the droplets had similar velo-city, which was very low at this location. Both the largeand small droplets with high vertical velocities had verylow chances of drift and only the small droplets with lowvertical velocity were subject to drift.
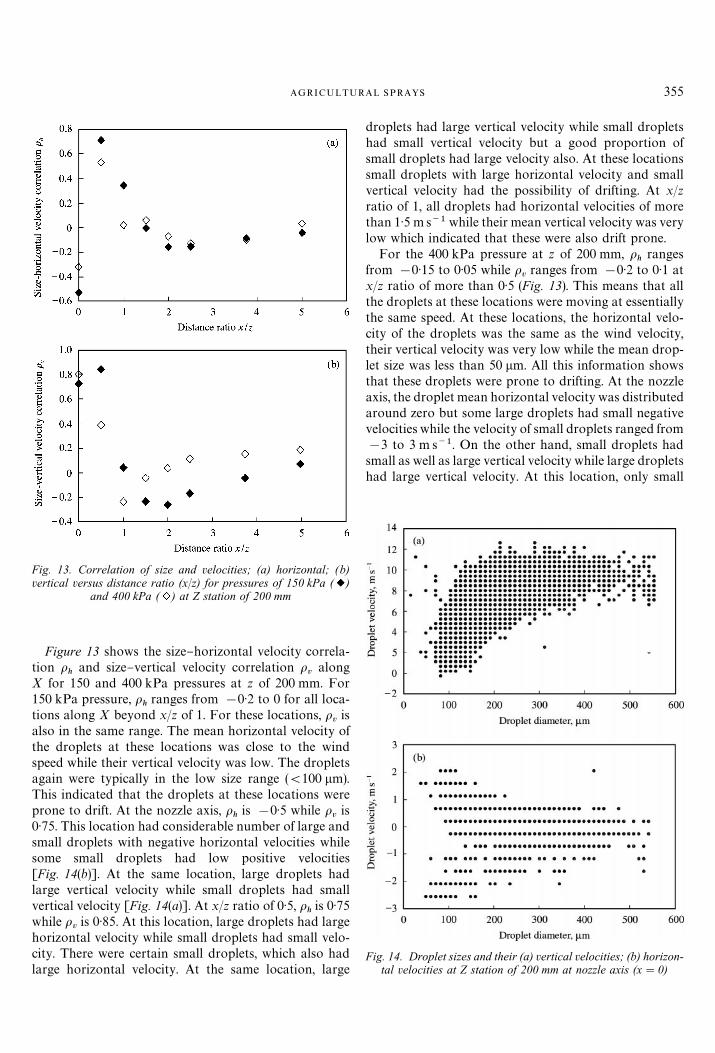
Fig. 13. Correlation of size and velocities; (a) horizontal; (b)vertical versus distance ratio (x/z) for pressures of 150 kPa ( )
and 400 kPa ( ) at Z station of 200 mm
Fig. 14. Droplet sizes and their (a) vertical velocities; (b) horizon-tal velocities at Z station of 200 mm at nozzle axis (x"0)
AGRICULTURAL SPRAYS 355
Figure 13 shows the size}horizontal velocity correla-tion o
hand size}vertical velocity correlation o
valong
X for 150 and 400 kPa pressures at z of 200 mm. For150 kPa pressure, o
hranges from !0)2 to 0 for all loca-
tions along X beyond x/z of 1. For these locations, ovis
also in the same range. The mean horizontal velocity ofthe droplets at these locations was close to the windspeed while their vertical velocity was low. The dropletsagain were typically in the low size range ((100 lm).This indicated that the droplets at these locations wereprone to drift. At the nozzle axis, o
his !0)5 while o
vis
0)75. This location had considerable number of large andsmall droplets with negative horizontal velocities whilesome small droplets had low positive velocities[Fig. 14(b)]. At the same location, large droplets hadlarge vertical velocity while small droplets had smallvertical velocity [Fig. 14(a)]. At x/z ratio of 0)5, o
his 0)75
while ovis 0)85. At this location, large droplets had large
horizontal velocity while small droplets had small velo-city. There were certain small droplets, which also hadlarge horizontal velocity. At the same location, large
droplets had large vertical velocity while small dropletshad small vertical velocity but a good proportion ofsmall droplets had large velocity also. At these locationssmall droplets with large horizontal velocity and smallvertical velocity had the possibility of drifting. At x/zratio of 1, all droplets had horizontal velocities of morethan 1)5 ms~1 while their mean vertical velocity was verylow which indicated that these were also drift prone.
For the 400 kPa pressure at z of 200 mm, oh
rangesfrom !0)15 to 0)05 while o
vranges from !0)2 to 0)1 at
x/z ratio of more than 0)5 (Fig. 13). This means that allthe droplets at these locations were moving at essentiallythe same speed. At these locations, the horizontal velo-city of the droplets was the same as the wind velocity,their vertical velocity was very low while the mean drop-let size was less than 50 lm. All this information showsthat these droplets were prone to drifting. At the nozzleaxis, the droplet mean horizontal velocity was distributedaround zero but some large droplets had small negativevelocities while the velocity of small droplets ranged from!3 to 3 m s~1. On the other hand, small droplets hadsmall as well as large vertical velocity while large dropletshad large vertical velocity. At this location, only small

356 M. FAROOQ E¹ A¸ .
droplets with large horizontal and small vertical vel-ocities were subjected to drift. At x/z ratio of 0)5, all thedroplets had horizontal velocity higher than 1 m s~1 butlarge droplets had larger velocity compared to smallerdroplets. At this location small droplets had small verti-cal velocity while large droplets had large velocity. Thisshows that all the droplets were prone to drift, small dueto their low vertical velocity while the large due to theirhigh horizontal velocity.
E!orts were also made to understand the behaviour ofdroplets of a speci"c size with increasing distance fromthe nozzle. Such data are of immense use in validation ofmodels to predict spray drift. The variation in meanvertical velocity for 38 and 70)5 lm droplets along X atvarious stations along Z (Fig. 15) shows that at stationscloser to the nozzle (z(200 mm), there was a fairly largevariation in vertical velocity. The mean velocity of the38 lm droplets was larger along the nozzle axis thatdecreased with increasing distance along X, and tendedto a constant value. This is consistent with the meanvertical velocity of all the droplets considered as a whole.
Fig. 15. Vertical velocity of (a) 38 lm droplet; (b) 70)5 lm drop-let along X-axis at various stations along the Z-axis at 275 kPapressure: , z"38 mm; , z"50 mm; , z"75 mm;
, z"100 mm; , z"200 mm; , z"300 mm
Fig. 16: Relative droplet horizontal velocity (Vdx
/U) for (a) 38 lmdroplet; (b) 70)5 mm droplet along X-axis at various stations alongthe Z-axis at 275 kPa pressure; , z"38 mm; , z"50 mm;
, z"75 mm; , z"100 mm; , z"200 mm; , z"300 mm
With increasing distance along Z, the 38 lm dropletshad more or less the same mean vertical velocity atlocations along X. These droplets also had negativevertical velocity (travelling upwards) at large Z values.Closer to the nozzle, vertical velocity of the 70)5 lmdroplets was very high (+10 m s~1) that reached a con-stant value with increasing distance along X. Near thenozzle, the smaller droplet (38 lm) travelled at a lowervelocity compared to the larger droplet (70)5 lm). Unlikethe 38 lm droplet, the larger droplet did not have nega-tive velocity.
Variation of the horizontal droplet velocity alongX for the two droplet sizes of 38 and 70)5 lm (Fig. 16)shows that, near the nozzle, both the droplets quicklyrelaxed to the cross-#ow velocity. However, with increas-ing distance along Z (z'200 mm), the droplet velocityincreased to the cross-#ow velocity rather slowly. At thelast Z station, the 70)5 lm droplet attained the cross-#owvelocity at 1)0 m from the nozzle axis. Both the dropletsizes, at z of 38 mm, and away from the nozzle axis hada velocity higher than the wind. Similarly, the droplets at

AGRICULTURAL SPRAYS 357
z of 75 and 100 mm at x greater than 500 mm hadvelocity higher than the wind which was consistent withthe mean horizontal velocity computed for all thedroplets. Overall, as expected, the data indicated thatsmaller droplets were subjected to an increased cross-#ow e!ect.
4. Conclusions
The size}velocity characteristics of sprays generatedby a commonly used agricultural nozzle were studied inthe presence of a non-uniform crosswind pro"le. Thespray sheet acts as an obstruction to the air#ow thatcreates vortices on the downwind side of the sheet caus-ing some droplets to move in the direction opposite tothat of the oncoming cross wind. This is particularly trueof small droplets that move toward the centre of thetunnel and toward the nozzle axis. These droplets cancollide with the large droplets coming from above andtravelling with high velocity downwards. The sheet alsoshields the droplets in the wake region from the e!ect ofcross-#ow wind and thus limits the horizontal velocity ofmany droplets to a lower value. These phenomenaimprove the chances of the smaller droplets being depo-sited on targets. In the region below 75 mm from thenozzle exit, small droplets with low vertical velocity areseparated from the large droplets with high vertical velo-city. The droplets released or generated at higher elev-ations, in the high crosswind velocity-gradient zonemoved down quickly to the lower velocity zones becauseof their high initial vertical velocity and the added pushby the entrained air. During the travel, droplets deceler-ate both in the vertical and in the horizontal directions.Near the nozzle, smaller droplets travel slower than lar-ger droplets. However, away from the nozzle, the smallerdroplets have negative vertical velocities indicating thatthe droplets are travelling upwards.
The normalized mean vertical velocities nearly collaps-ed on to a single curve and attained a similarity pro"lethat is useful in modelling. The mean droplet horizontalvelocity at all stations along Z-axis levelled o! to thefree-stream velocity beyond stream-wise distance x toaxial distance z ratio of 0)4 while at a few measurementlocations, the droplet velocities were higher than thefree-stream velocities.
Size}velocity correlation values are useful indicatorsof drift potential. At a z of 100 mm and at a pressure of150 kPa, droplets at all locations along X, except at thenozzle axis, are drift prone while at a pressure of 400 kPathe droplets beyond x/z ratio of two are prone to drifting.At z of 200 mm and at 150 kPa pressure, droplets at alllocations along X beyond x/z ratio of 1)0 are prone todrifting while at 400 kPa pressure, droplets at all loca-
tions along X beyond x/z ratio of 0)5 are prone todrifting.
References
Bachalo W D; Houser M J (1984). Phase/doppler sprayanalyzer for simultaneous measurements of drop sizeand velocity distributions. Optical Engineering, 23, 583}590
Balachandar R (1998). A note on the characteristics ofdroplet-laden jets. Journal of Fluid Engineering, 120, 403}406
Balachandar R; Mulpuru S R; Ungurian M H (1998). A note onparticle size measurement in two-phase #ows. Journal ofFluids Engineering, Transactions of the American Society ofMechanical Engineering, 120, 390}397
Coelho S L V; Hunt J C R (1989). The dynamics of the near "eldof strong jets in cross-#ows. Journal of Fluid Mechanics, 200,95}120
Farooq M (1995). Development of an instrumented wind tunnelfor spray drift studies. MSc Thesis, Department of Agricul-tural and Bioresource Engineering, University of Sas-katchewan, Saskatoon, Saskatchewan, Canada
Farooq M; Wulfsohn D; Ford R J (1996). Wind tunnel for spraydrift studies. Canadian Agricultural Engineering, 38(4),283}289
Ghosh S; Hunt J C R (1998). Spray jets in a cross-#ow. Journalof Fluid Mechanics, 365, 109}136
Goering C E; Bode L E; Gebhardt M R (1972). Mathematicalmodeling of spray droplet deceleration and evaporation.Transactions of the American Society of Agricultural Engin-eering, 15, 220}225
Hall C D (1975). The simulation of particle motion in theatmosphere by a numerical random-walk model. QuarterlyJournal of Royal Meteorological Society, 101, 235}244
Happel J; Brenner H (1965). Low Reynold's Number Hydro-dynamics. Prentice-Hall Inc., Englewood Cli!s, NJ
Kelso R M; Lim T T; Perry A E (1996). An experimental studyof round jets in cross-#ow. Journal of Fluid Mechanics, 306,111}144
Ley A J (1982). A random walk simulation of two-dimensionalturbulent di!usion in the neutral surface layer. AtmosphericEnvironment, 16, 2799}2808
Longmire E K; Eaton J K (1992). Structure of particle-ladenround jet. Journal of Fluid Mechanics, 236, 217}257
Marchant J A (1977). Calculation of spray droplet trajectory ina moving air stream. Journal of Agricultural EngineeringResearch, 22, 93}96
Miller P C H (1993). Spray drift and its measurement. In:Application Technology for Crop Protection (MatthewsG A; Hislop E C, eds), pp 101}122. CAB International,Wallingford, UK
Miller P C H; Had5eld D J (1989). A simulation model of thespray drift from hydraulic nozzles. Journal of AgriculturalEngineering Research, 42, 135}147
Moussa Z M; Trischka J W; Eskinazi S (1977). The near "eld inthe mixing of a round jet with a cross-stream. Journal ofFluid Mechanics, 80(1), 49}80
Reichard D L; Dhu H; Fox R D; Brazee R D (1992). Computersimulation of variables that in#uence spray drift. Transac-tions of the ASAE, 35, 1401}1407
Reid J D (1979). Markov chain simulations of vertical disper-sion in the neutral surface layer for surface and elevatedreleases. Boundary Layer Meteorology, 16, 3}22

358 M. FAROOQ E¹ A¸ .
Sykes R I; Lewellen W S; Parker S F (1986). On the vorticitydynamics of a turbulent jets in a cross-#ow. Journal of FluidMechanics, 168, 393}435
Thompson N; Ley A J (1983). Estimating spray drift usinga random-walk model of evaporating drops. Journal of Agri-cultural Engineering Research, 28, 419}435
Walklate P J (1992). A simulation study of pesticide drift froman air-assisted orchard sprayer. Journal of Agricultural En-gineering Research, 51, 263}283
Wolf T M (1997). An introduction to spray application techno-logy. Agricultural Canada's Electronic Information Service(ACEIS) &http:/aceis.agr.ca/'
Wolf T M; Stumborg M; Caldwell B C; Grover R (1995).A chamber for scanning spray from agricultural nozzlesusing an Aerometrics phase/doppler particle analyzer.Canadian Agricultural Engineering, 37(4), 305}310