Embed Size (px)
Citation preview
Voice Conversion Application (VOCAL)
Liliana, Resmana Lim, Elizabeth KwanInformatics Department, Industrial Technology Faculty
Petra Christian UniversitySurabaya, Indonesia
[email protected], [email protected]
Abstract—Recently, a lot of works has been done in speech technology. Text-to-Speech and Automatic Speech Recognition have been the priorities in research efforts to improve the human-machine interaction. The ways to improve naturalness in human-machine interaction is becoming an inportant matter of concern. Voice conversion can be served as a useful tools to provide new insights related to personification of speech enabled systems. In this research, there are two main parameters are considered vocal tract structure and pitch. For conversion process speech is resolved in two components, excitation component and filtered component using Linear Predictive Coding (LPC). Ptich is determined by autocorrelation. After obtained the acoustic components from source speaker and target speaker, then the acoustic components will be mapped one-to-one to replaced the the acoustic feature from source speaker to target speaker. At least, signal is modified by resynthesis so the resulted speech would perceive as if spoken by target speaker.
Keywords-Speech Processing, Audio Signal Processing, Voice Conversion, Linear Predictive Coding, Autocorrelation, PSOLA.
I. INTRODUCTION The last few years there has been a rapid development in
speech technology. The study was conducted to improve the quality of human-computer interaction. These studies have proven bringing benefits to the wider community, such as technology, Text-To-Speech (TTS), which continues to be refined, speech-to-text, for the speech recognition. Currently, speech recognition and TTS is top priority research in the field of speech technology that aimed at improving human-computer interaction.
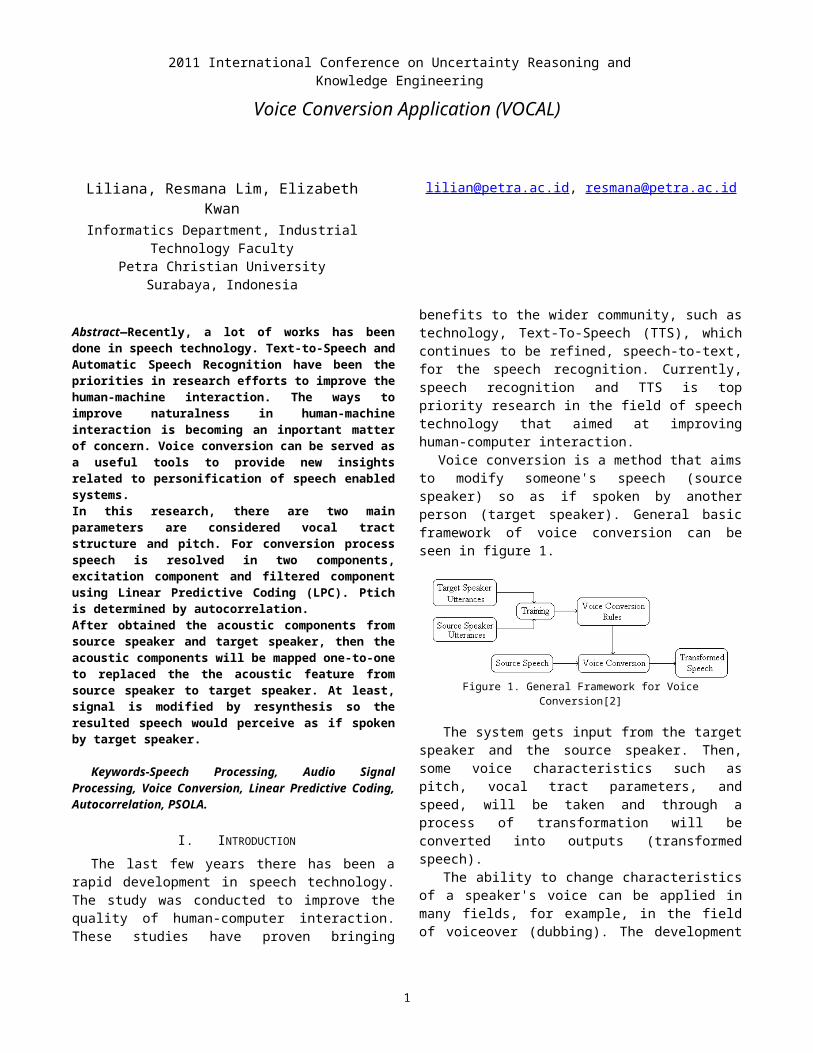
Voice conversion is a method that aims to modify someone's speech (source speaker) so as if spoken by another person (target speaker). General basic framework of voice conversion can be seen in figure 1.
Figure 1. General Framework for Voice Conversion[2]
The system gets input from the target speaker and the source speaker. Then, some voice characteristics such as pitch, vocal tract parameters, and speed, will be taken and through a process of transformation will be converted into outputs (transformed speech).
The ability to change characteristics of a speaker's voice can be applied in many fields, for example, in the field of voiceover (dubbing). The development of voice conversion technology is also expected to assist the development of security and forensic applications that use speech signal for the identification and authentication procedures. In this study, the approach with DSP (Digital Signal Processing) is possible because each person has a unique vocal quality due to the structure of vocal tract and pitch range owned. Vocal tract and pitch is called static speech parameters, the parameters in which the speaker has limited control[1].
II. VOICE CONVERSION
There are many methods that can be used in voice conversion. This raises the difficulty to obtain the optimal method for all possible combinations of characteristics and speakers[2]. Methods to represent the specific characteristics of the speakers and to map the characteristics of the source and target are described below.
A. Digitization of SoundDigital sound has a limited range, not continuous.
Digital representation involves sampling. It means measuring the quantity. Sampling is done on the time basis. Sampling rate means the number of sample taken at a distinct time. The sample taking based on the amplitude or voltage dimension referred to quantization.
Resampling is a process to change the sampling rate of the signal which aims to improve the efficiency of various signal processing operations. To improve the precision of the resampling method is sine interpolation[3], [4]. Because of the limitation of the depth interpolation, the sum will be multiplied by Hanning window. Hanning window can be calculated using (1)
1
2011 International Conference on Uncertainty Reasoning and Knowledge Engineering
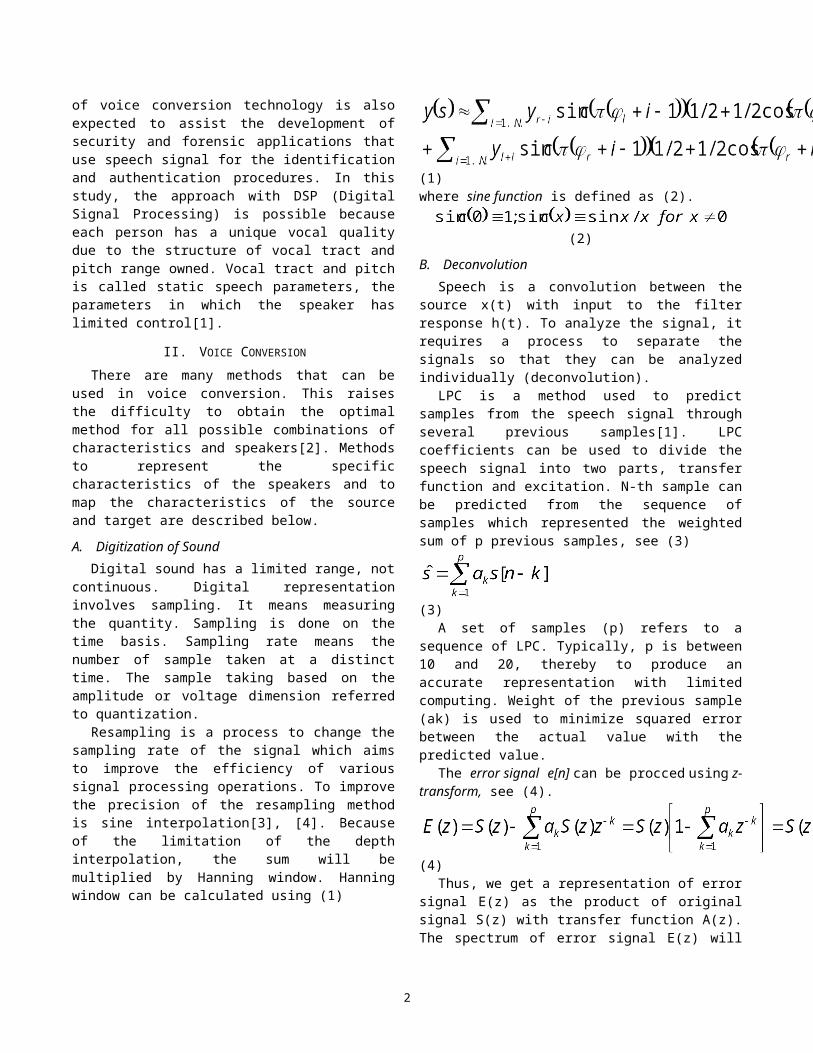
(1)where sine function is defined as (2).
(2)
B. DeconvolutionSpeech is a convolution between the source x(t) with
input to the filter response h(t). To analyze the signal, it requires a process to separate the signals so that they can be analyzed individually (deconvolution).
LPC is a method used to predict samples from the speech signal through several previous samples[1]. LPC coefficients can be used to divide the speech signal into two parts, transfer function and excitation. N-th sample can be predicted from the sequence of samples which represented the weighted sum of p previous samples, see (3)
(3)A set of samples (p) refers to a sequence of LPC.
Typically, p is between 10 and 20, thereby to produce an accurate representation with limited computing. Weight of the previous sample (ak) is used to minimize squared error between the actual value with the predicted value.
The error signal e[n] can be procced using z-transform, see (4).
(4)Thus, we get a representation of error signal E(z) as the
product of original signal S(z) with transfer function A(z). The spectrum of error signal E(z) will have a different structure depended on whether the sound sources including voiced or unvoiced.
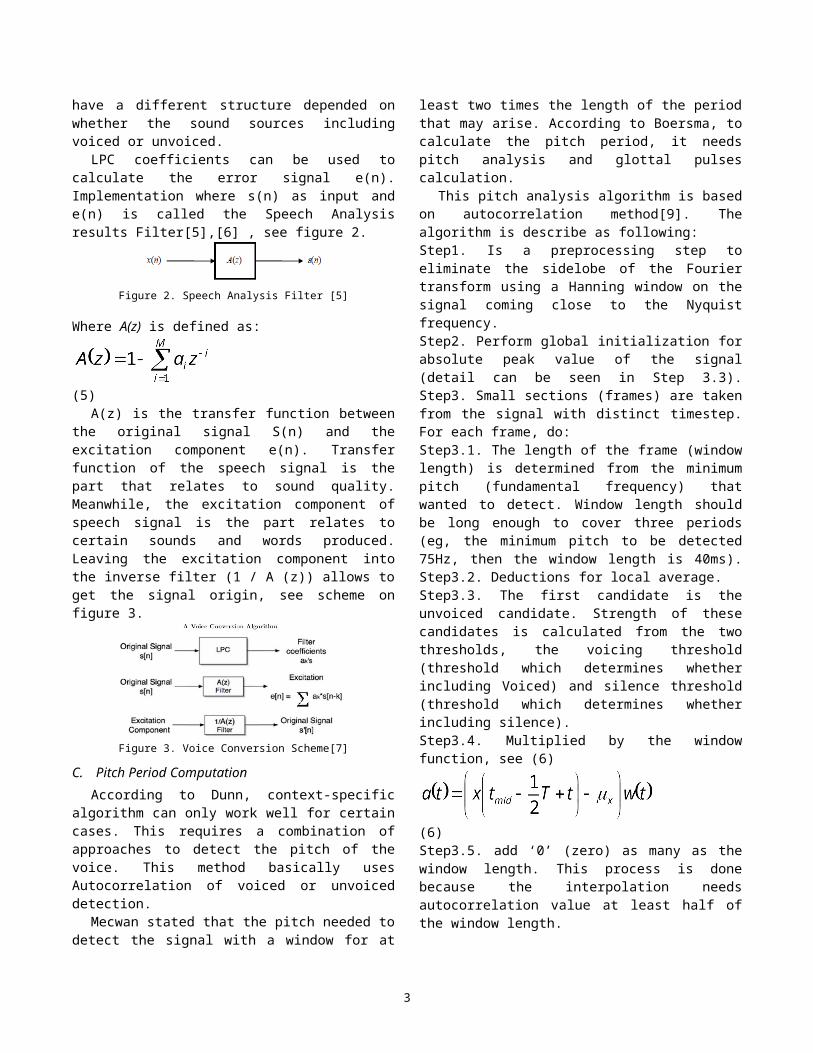
LPC coefficients can be used to calculate the error signal e(n). Implementation where s(n) as input and e(n) is called the Speech Analysis results Filter[5],[6] , see figure 2.
Figure 2. Speech Analysis Filter [5]
Where A(z) is defined as:
(5)A(z) is the transfer function between the original signal
S(n) and the excitation component e(n). Transfer function of the speech signal is the part that relates to sound quality.
Meanwhile, the excitation component of speech signal is the part relates to certain sounds and words produced. Leaving the excitation component into the inverse filter (1 / A (z)) allows to get the signal origin, see scheme on figure 3.
Figure 3. Voice Conversion Scheme[7]
C. Pitch Period ComputationAccording to Dunn, context-specific algorithm can only
work well for certain cases. This requires a combination of approaches to detect the pitch of the voice. This method basically uses Autocorrelation of voiced or unvoiced detection.
Mecwan stated that the pitch needed to detect the signal with a window for at least two times the length of the period that may arise. According to Boersma, to calculate the pitch period, it needs pitch analysis and glottal pulses calculation.
This pitch analysis algorithm is based on autocorrelation method[9]. The algorithm is describe as following:Step1. Is a preprocessing step to eliminate the sidelobe of the Fourier transform using a Hanning window on the signal coming close to the Nyquist frequency.Step2. Perform global initialization for absolute peak value of the signal (detail can be seen in Step 3.3).Step3. Small sections (frames) are taken from the signal with distinct timestep. For each frame, do:Step3.1. The length of the frame (window length) is determined from the minimum pitch (fundamental frequency) that wanted to detect. Window length should be long enough to cover three periods (eg, the minimum pitch to be detected 75Hz, then the window length is 40ms).Step3.2. Deductions for local average.Step3.3. The first candidate is the unvoiced candidate. Strength of these candidates is calculated from the two thresholds, the voicing threshold (threshold which determines whether including Voiced) and silence threshold (threshold which determines whether including silence). Step3.4. Multiplied by the window function, see (6)
(6)Step3.5. add ‘0’ (zero) as many as the window length. This process is done because the interpolation needs autocorrelation value at least half of the window length.Step3.6. add ‘0’ (zero) until the number of the sample reaches a power of two multiplications.Step3.7. do Fast Fourier Transform. Step3.8. Square the sample on frequency domain.
2
Step3.9. do Inverse Fast Fourier Transform.Step3.10. then divide by autocorrelation from computed window from step 3.5 until 3.9 as shown in (7)
(7)Step3.11. find the position and the continue maxima value from using algorithm brent[10]. Local strength for unvoiced candidate can be written as (8)
(8)And voiced candidate with highest local strength, can be calculated using (9).
(9)
OctaveCost parameters produce a better fundamental frequency. After repeating the process above, will be taken several pairs of frequency and strength (Fni, Rni), where n is the index for the frame (from 1 to number of frames) and i is the index for candidate number (from 1 to the number of candidates). The best candidate from each frame (locally best candidate) has the highest R value. Therefore, it required a step to select the global path finder. Step4. For each frame n, pn is a number from 1 to the number of frame candidates. Where { pn | 1 ≤ n ≤ number of frames} defines a path through the candidates: {(Fnpn, Rnpn)| 1 ≤ n ≤ number of frames}. With all the possible paths, cost can be defined using (10).
(10)Where transition cost function is defined as (11).
(11)The second process of pitch period computation is
glottal pulses calculation. In time domain representation, voiced sound has periodic pattern, such as voiced obstruents, sonorant consonants and all vowels will be found, as shown in figure 4[11].
Figure 4. The repeating pattern of human’s word [9]
Pattern identified repeatedly is called cycle. The duration of each cycle called the glottal pulse/pitch period length (τ in Figure 4). This step takes the pitch contour information. Number of points (or glottal pulses) is determined by the following algorithm:Step1. The first point t1 is ablsolute extremum value of the amplitude, whose value is between tmid-T0/2 and tmid+T0/2, where tmid is the midpoint of the interval, and T0 is the period in tmid, which can be obtained from the pitch contour interpolation.Step2. From the first point, search the points ti until reach left end of the interval. Points must be between ti-1 – 1.2 T0
(ti-1) dan ti-1 – 0.8 T0 (ti-1).Step3. do the same as Step 2 for the right side of ti, the search is done until it reaches the right end of the interval.Step4. Although Voiced and unvoiced decision is determined in the previous section, the points will still be eliminated if the correlation value was less than 0.3. However, points can be added at the end of the interval if its correlation value greater than 0.7.
III. PROBLEM ANALYSIS
The complexity of human language is one of the difficult problems faced in making this voice conversion application. When a man speaks, the air exhaled from the lungs and then through the mouth and nasal cavity. Air flows out through the mouth, restricted and manipulated by the tongue and lips. This manipulation process produce contraction and expansion against the airflow released, the acoustic waves called sound.
However, a set of a voice series alone can not form words and sentences. In a speech, it has useful information, such as rhythm, intonation and emphasis that indicate grammatical structure, or also an emphasis on certain words to indicate the level of interest, and others. The information can be different from one person to another. Variations in speech style are not limited to the increasing complexity of making this application, especially at the voice segmentation process.
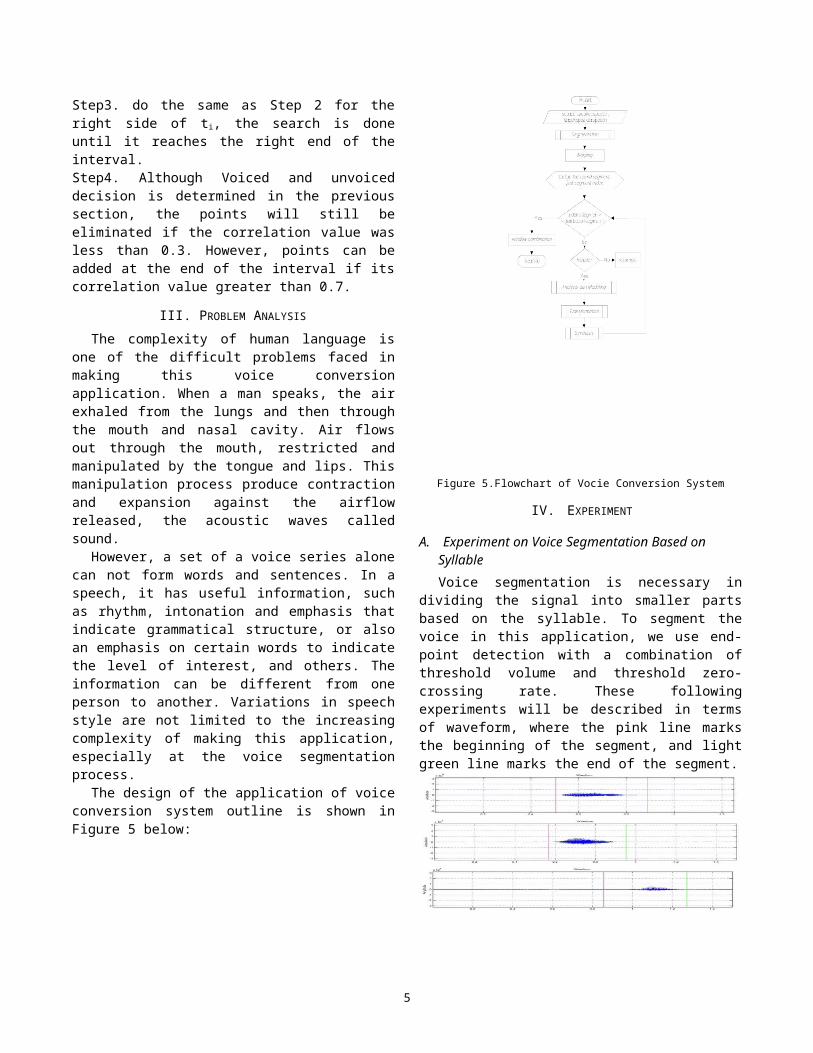
The design of the application of voice conversion system outline is shown in Figure 5 below:
3
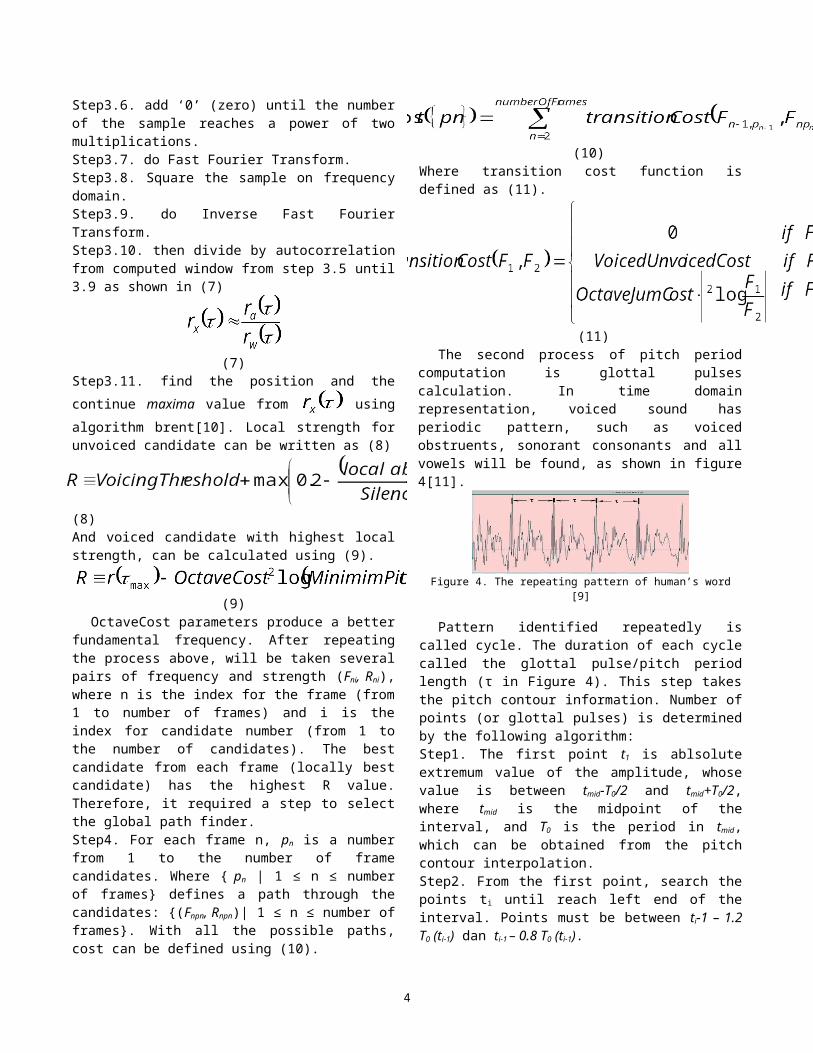
Figure 5.Flowchart of Vocie Conversion System
IV. EXPERIMENT
A. Experiment on Voice Segmentation Based on SyllableVoice segmentation is necessary in dividing the signal
into smaller parts based on the syllable. To segment the voice in this application, we use end-point detection with a combination of threshold volume and threshold zero-crossing rate. These following experiments will be described in terms of waveform, where the pink line marks the beginning of the segment, and light green line marks the end of the segment.
Figure 8. Segmentation result for word “hai” from four speakers. From above: (a) Kath (b) Liz (c) Will (d) Zefan.
The experimental result for word with one syllable of four speakers shows the successfulness of this application.
Then, we also test more complex words, “Sistem Cerdas”. The segmentation result can be seen in figure 9.
Figure 9. Segmentation result for word “Sistem Cerdas” from four speakers, from above: (a) Kath (b) Liz (c) Zefan (d) Will
Results for the pronunciation of more complex words, "Sistem Cerdas" provides different results for different speakers, the success rate of 50% for the experiment above.
B. Experiment on Pitch Similarity Between Simulated Speaker and Target SpreakerHere is a test to find out how close the pitch of the sound
produced by the application with the sound of the source speaker and target speaker.
Table 1. Comparison of Pitch Calculation
No wordSource Target Converted
Freq (Hz)Speaker Freq (Hz) Speaker Freq (Hz)
1 Good Kath 242.0417 Liz 266.9492 263.15792 Hai Kath 227.0855 Zefan 176.259 172.41383 Saya Liz 259.1069 Will 170.1389 172.41384 Hallo Zefan 162.0132 Liz 100.1817 1005 A Will 151.4423 Zefan 191.5725 188.6792
Table 2. The Percentage of Pitch Calculation
No word Target Freq (Hz)
Converted Freq (Hz)
1 Good 266,9492 263,15792 Hai 176,2590 172,41383 Saya 170,1389 172,4138
Hallo 100,1817 100,00005 A 191,5725 188,6792
Pitch of the sound produced by this application is approximate the pitch of the target speakers, although not exactly the same.
V. CONCLUTION
Based on the experiments result, we can conclude that the segmentation result is good enough to detect syllable in certain words, depend on the input which can be vary widely. Moreover, segmentation’s successfulness is depended on the length of utterance. The longer the utterance, the lower the success rate will be. The result of
4
segmentation will affect the whole process of voice conversion. A good segmentation will produce good result.
Modifying the pitch gives good results. This is proven by the average percentage, 98.67% as shown on table 2. from the result, we can learn that the conversion from woman voice to man voice has the best result among other conversion schemes. It is because women have more general and smooth voice characteristics than men.
REFERENCES
[1] Mecwan, Akash, dkk. (2009). Voice Conversion Algorithm. International Conference on Advances in Computing, Communication and Control 2009.
[2] Turk, Oytun. (2003). New Methods for Voice Conversion. M.S Thesis.[3] Boersma, Paul. (2001). Praat, a system for doing phonetics by
computer. Glot International.[4] Jyh-Shing Roger Jang. (2009). Audio signal processing and
recognition. Retrieved February 11, 2010, from http://neural.cs.nthu.edu.tw/jang/books/audioSignalProcessing/.
[5] Park, Sung-won. (2007). Chapter 7 Linear Predictive Speech Processing. Retrieved January 16, 2010, from http://www.engineer.tamuk.edu/spark/chap7.pdf.
[6] Ribeiro, C.M. dan I. M. Trancoso. (1997). Phonetic Vocoding with Speaker Adaptation. Eurospeech 1997, Rhodes, Greece.
[7] Upperman, Gina, dkk. (2008). Methods for Voice Conversion. Retrieved May 20, 2009, from http://cnx.org/content/col10252/1.2/
[8] Dunn, Bob. (2003). Speech Signal Processing and Speech Recognition. IEEE Signal Processing Society.
[9] Boersma, Paul. (1993). Accurate Short-Term Analysis of Fundamental Frequency and the Harmonic-to-Noise Ratio of Sampled Sound. Proceedings of the Institue of Phonetics Sciences 17: 97-110. University of Amsterdam.
[10] Press, William H., dkk. (1992). Numerical Recipes in C. Cambridge University Press.
[11] Eulenberg, John. (2010). Fundamental Frequency and the Glottal Pulse. Retrieved May 22, 2010, from https://www.msu.edu/course/asc/232/study_guides/F0_and_Glottal_Pulse_Period.html
5